2016 unification perception snu ipus unification...
TRANSCRIPT
Jung, Keunsik Director, IPUS & Professor
Department of Sociology, SNU
Philo KimHumanities Korea Professor, IPUS, SNU
Chang, Yong Seok Senior Researcher, IPUS, SNU
Jung, Dong-Joon Senior Researcher, IPUS, SNU
Choi, Gyubin Senior Researcher, IPUS, SNU
Kim, Byeong Jo Professor, Korea National Defense University
Song, Young Hoon Professor, Kangwon National University
Hwang, Jung-Mee Humanities Korea Research Professor
Institute of Social Science
Kangwon National University
Hwang, Chang Hyun Researcher, IPUS, SNU
Translated by:
Peter Ward Department of Sociology, SNU
ISBN 979-11-961299-2-7
Not for sale
SNU IPUS Unification Research Series 32
2016 Unification Perception Survey
SNU IP
US U
nifica
tion R
ese
arch
Serie
s 32
2016 U
nification Perception S
urvey
Jung, Keunsik | Philo Kim | Chang, Yong seok Jung, Dong-Joon | Choi, Gyubin | Kim, Byeong Jo
Song, Young Hoon | Hwang, Jung-Mee | Hwang, Chang Hyun
Translated by Peter Ward
2016Unification Perception
Survey

SNU IPUS Unification Research Series 32
Jung, Keunsik | Philo Kim | Chang, Yong seok Jung, Dong-Joon | Choi, Gyubin | Kim, Byeong Jo
Song, Young Hoon | Hwang, Jung-Mee | Hwang, Chang Hyun
Translated by Peter Ward
2016Unification Perception
Survey

Publication 2017. 8. 5.
Edtors-in-chief Jung, Keunsik (Seoul National University)
Authored by Jung, Keunsik | Philo Kim | Chang, Yong Seok
Jung, Dong-Joon | Choi, Gyubin | Kim, Byeong Jo
Song, Young Hoon | Hwang, Jung-Mee | Hwang, Chang Hyun
Translated by Peter Ward, Department of Sociology, SNU
Address The Institute for Peace and Unification Studies
Seoul National University
Munhwagwan 73-dong #209, Gwanak-ro 1
Gwanak-gu, Seoul, 08826, Republic of Korea
Phone 02) 880-4052~4
Fax 02) 874-7305
Homepage Korean: http://tongil.snu.ac.kr/
English: http://tongil.snu.ac.kr/ipus/
* Copyright ⓒ 2017 by the Institute for Peace and Unification Studies, Seoul National University.
Printed by Seoul National University Press.
국립중앙도서관 출판예정도서목록(CIP)
(2016) unification perception survey / Jung, Keunsik, Ph
ilo Kim, Chang, Yong seok, Jung, Dong-Joon, Choi, Gyubin, Kim,
Byeong Jo, Song, Young Hoon, Hwang, Jung-Mee, Hwang, Chang
Hyun ; translated by Peter Ward. -- [Seoul] : IPUS, 2017
p. ; cm. -- (SNU IPUS unification research series ; 32)
원표제: 2016 통일의식조사
Translated from Korean
ISBN 979-11-961299-2-7 93340 : Not for sale
340.911-KDC6
320.9519-DDC23 CIP2017020246
SNU IPUS Unification Research Series 32
2016 Unification Perception Survey
SNU IPUS Unification Research Series 32
2016 Unification Perception Survey

Table of Contents
Chapter 3 Perception of the Government’s North Korea Policy 94
1. Introduction 94
2. Satisfaction with the government’s North Korea policy 97
3. Perception of major issues in North Korea policy 106
4. Views on South Korea going nuclear 120
5. Sub-conclusion 126
Chapter 4 Perception of the Relationships with Foreign Nations 130
1. Introduction 130
2. The closest neighbor and the most threatening neighbor 132
3. Images of neighboring states 152
4. Expected roles of neighboring states in Korean unification 166
5. Sub-conclusion 177
Introduction 20
Section 1 Basic Analysis
Chapter 1 Perception of Unification 32
1. The need for unification and the reasons given for such a need 34
2. The how and when question of unification 39
3. Expected benefits of unification 46
4. Unification and democracy 51
5. Unified Korea: what respondents hoped for 55
6. Sub-conclusion 58
Chapter 2 Perception of North Korea 62
1. Perception of inter-Korean relations – “what is North Korea to us?” 65
2. Perception of change in North Korea and regime stability 72
3. Trust in the North Korean regime 74
4. Perception of North Korea as a threat 79
5. Closeness to North Korean society 85
6. Sub-conclusion 89

Chapter 7 Social Integration of North Korean Defectors and Receptiveness to Multiculturalism 260
1. Introduction 260
2. Sense of closeness to North Korean defectors and perspectives on policy 266
3. Social distance from North Korean defectors and perception of unification and North Korea 290
4. Receptiveness toward multiculturalism, perception of migrants and the social integration of North Korean defectors 291
5. Sub-conclusion 294
Conclusion 300
Appendix 313
Section 2 In-depth Analysis
Chapter 5 Attribution of Responsibility for Deteriorating Inter-Korean Relations 184
1. Introduction 184
2. Questions and the method used in the analysis 188
3. Countries responsible for the deteriorating inter-Korean relation: absolute assessment 190
4. Responsibility of Each Country for the Deterioration of Inter-Korean relations: relative assessmen 197
5. Opinion regarding responsibility for problems in inter-Korean relations, unification policy, North Korea policy, and foreign policy 204
6. Sub-conclusion 217
Chapter 6 Ideology, Partisanship, and Perception of Unification 222
1. Introduction 222
2. Method of analysis 226
3. Analysis and results 230
4. Sub-conclusion 255
<Table 1-1-1> Reasons given for the necessity of unification 37<Table 1-1-2> How unification is to be pursued 40<Table 1-1-3> Cross tabulation of “the need for unification” and “how unification is to be achieved” items 42<Table 1-1-4> When unification will occur 44<Table 1-1-5> South Korean democracy and unification 52<Table 1-1-6> North Korean democracy and unification 54<Table 1-1-7> Preferred form of unification 56<Table 1-2-1> South Korean popular perception of North Korea
& relevant variables (2016) 67<Table 1-2-2> Sense of difference between the two Koreas (2016) 89<Table 1-4-1> The country that feels the closest 133<Table 1-4-2> Preference rankings of neighboring countries 136<Table 1-4-3> Preference of neighboring countries by gender 136<Table 1-4-4> Preference of neighboring countries by age 138<Table 1-4-5> The state that poses the largest threat to peace on
the Korean Peninsula 144<Table 1-4-6> Perceived threat of neighboring countries by sex 147<Table 1-4-7> North Korea threat perception by age 148<Table 1-4-8> Image of the United States as a country 154<Table 1-4-9> Attitude towards the United States, the possibility of war 156<Table 1-4-10> Image of the Japan as a country 158
<Table 1-4-11> Attitude towards Japan, the possibility of war 158<Table 1-4-12> Country image of China 162<Table 1-4-13> Attitude towards China, the possibility of war
on the Korean Peninsula 163<Table 1-4-14> Russia’s image 165<Table 1-4-15> Attitude towards Russia, the possibility of war
on the Korean Peninsula 166<Table 1-4-16> Needed cooperation of neighboring country for
unification 167<Table 1-4-17> Required cooperation of the neighboring countries
for unification 169<Table 1-4-18> Team supported if United States and North Korea
play against eachother in the World Cup 171<Table 1-4-19> Importance of North and South Korea relations
and US-ROK alliance(2007-2014) 174<Table 1-4-20> Importance of North and South Korea relations
and cooperation with the United States and China 176<Table 1-4-21> Importance of North and South Korea relations
and the cooperation with the United States and China by political affiliation 177
<Table 2-5-1> North Korea’s responsibility for deteriorating inter-Korean relations 191
<Table 2-5-2> South Korea’s responsibility for deteriorating inter-Korean relations 192
<Table 2-5-3> The United States’ responsibility for deteriorating inter-Korean relations 194
List of Tables

<Table 2-5-4> China’s responsibility for deteriorating inter-Korean relations 195
<Table 2-5-5> Responsibility for the deterioration of the inter- Korean relations: North Korea vs South Korea 198
<Table 2-5-6> Responsibility for the deterioration of the inter- Korean relations: South Korea vs the United States 199
<Table 2-5-7> Comparison of responsibility for the deterioration of inter-Korean relations: South Korea vs China 200
<Table 2-5-8> Comparison of responsibility on the deterioration of inter-Korean relations: North Korea vs the United States 201
<Table 2-5-9> Comparison of responsibility on the deterioration of inter-Korean relations: North Korea vs China 202
<Table 2-5-10> Comparison of responsibility on the deterioration of inter-Korean relations: United States vs China 203
<Table 2-5-11> Necessity for unification and responsibility of the deterioration of inter-Korean relations (2016) 205
<Table 2-5-12> Responsibility for the deterioration of inter-Korean relations and reasons for unification (2016) 207
<Table 2-5-13> Perception of North Korea and the responsibility for the deterioration of inter-Korean relations (2016) 208
<Table 2-5-14> Perception of the North Korean regime and the responsibility for the deterioration of inter-Korean relations (2016) 210
<Table 2-5-15> Worsening relations between the Koreas and the reopening of the Kaesong Complex (2016) 212
<Table 2-5-16> Worsening relations between the Koreas and South Korea going nuclear (2016) 213
<Table 2-5-17> Responsibility for the deterioration of inter-Korean relations and the desired unification policy (2016) 214
<Table 2-5-18> Responsibility for the deterioration of inter-Korean relations and important foreign policies (2016) 216
<Table 2-6-1> Distribution partisan tendencies (2011 – 2016) 232<Table 2-6-2> Multinomial analysis on determinants of partisanship 234<Table 2-6-3> Likelihood-ratio test on determinants of partisanship 235<Table 2-6-4> Political party support by Chi-squared (Wald Test) 237<Table 2-6-5> Averaged responses to questions by political party
affiliation 239<Table 2-6-6> Ordered logistic regression of determinants of
perception on unification 240<Table 2-6-7> Trends in the influence of partisanship (2011 – 2016) 242<Table 2-6-8> Average assessment of the benefits of unification
by partisan group 245<Table 2-6-9> Ranking of perception decision forces for
North Korea policy 246<Table 2-6-10> Trends in partisanship as an influencer on the North
Korea policy perception variable (2011 – 2016) 248<Table 2-6-11> Average item-by-item scores for supporters of
each party 252<Table 2-6-12> Output from an ordered logistic analysis of
determinants of evaluation of government policy 252

<Table 2-6-13> Trends in the power of partisanships in relation to government performance evaluation variable (2011-2016) 253
<Table 2-7-1> Sense of closeness to immigrant groups (2016) 272<Table 2-7-2> Unification, inter-Korean relations and generation
divisions 284<Table 2-7-3> “Exposure” variables and feelings of social distance
toward North Koreans (2016) 288<Table 2-7-4> Perception of North Korea and feelings of social
distance toward North Korean defectors (2016) 289<Table 2-7-5> Perception of unification and social distance from
North Korean defectors (2016) 290<Table 2-7-6> Receptivity to multiculturalism and opinions on
accepting North Korean defectors (2016) 293<Table 2-7-7> Receptivity to multiculturalism and opinions on
unification (2016) 293
<Figure 1-1-1> The need for unification 34<Figure 1-1-2> Preference for how unification is to be achieved
by age group 42<Figure 1-1-3> Expected advantages of unification:
the individual and society 47<Figure 1-1-4> Expectations of post-unification alleviation of
social problems 50<Figure 1-2-1> South Korean perception of North Korea 66<Figure 1-2-2> Year-on-year trends by region in the perception of
North Korea as a partner 68<Figure 1-2-3> North Korea as a ‘partner’ by age group 70<Figure 1-2-4> North Korea as a ‘hostile power’ by age group 71<Figure 1-2-5> Trust in the North Korean government by region:
the possibility of dialogue and compromise 75<Figure 1-2-6> Trust in the North Korean government by ideology:
the possibility of dialogue and compromise 76<Figure 1-2-7> Trust in the North Korean government by age group:
the possibility of dialogue and compromise 77<Figure 1-2-8> Inter-Korean perceived threat of military provocation 81<Figure 1-2-9> Perceived threat of a North Korean military
provocation by region 82<Figure 1-2-10> Perception of the possibility of a North Korean
military provocation by age group 85<Figure 1-2-11> Awareness of North Korean society 86
List of Figures

<Figure 1-3-1> Percentage of respondents satisfied with the government’s North Korea policy 98
<Figure 1-3-2> Satisfaction with government North Korea policy by age group 99
<Figure 1-3-3> Support for/opposition to the view that all cooperation should cease until the nuclear issue is resolved by age group and by satisfaction with North Korea policy 101
<Figure 1-3-4> Satisfaction in the government’s North Korea policy by educational attainment of respondents 102
<Figure 1-3-5> Satisfaction in the government’s North Korea policy by region 103
<Figure 1-3-6> Satisfaction in the government’s North Korea policy by the political ideology of respondents 104
<Figure 1-3-7> Satisfaction with North Korea policy by satisfaction with the economy 106
<Figure 1-3-8> Perceived contribution of different North Korea policies to unification 107
<Figure 1-3-9> Perceived contribution of aid to the lives of the North Korean people 108
<Figure 1-3-10> Perceived urgency of different issues in achieving unification 109
<Figure 1-3-11> Perceived contribution of South-North economic cooperation to advancing reform in North Korea 110
<Figure 1-3-12> Support for the statement ‘regardless of who is in office, agreements between South and North should be honoured’ 111
<Figure 1-3-13> Support for/opposition to the continued operation/ reopening of the Kaesong Industrial Complex 112
<Figure 1-3-14> Support for/opposition to the resumption of Mount Kumgang tours 113
<Figure 1-3-15> Support for/opposition to the suspension of South- North cooperation [aid to North Korea, 2009-2015] until the nuclear issue is resolved 115
<Figure 1-3-16> Support for/opposition to sending leaflets into North Korea [the government stopping groups from sending leaflets into North Korea, 2009-2016] 116
<Figure 1-3-17> Support for/opposition to raising the issue of North Korean human rights 117
<Figure 1-3-18> Attribution of blame for worsening inter-Korean relations by country 118
<Figure 1-3-19> The first priority in North Korea policy 119<Figure 1-3-20> Support for/opposition to South Korea going nuclear 121<Figure 1-3-21> Support for/opposition to South Korea going
nuclear by party affiliation 122<Figure 1-3-22> Support for/opposition to South Korea going
nuclear by political ideology 123<Figure 1-3-23> Support for South Korea going nuclear amongst
conservatives by the nation state they express closeness toward 124
<Figure 1-3-24> Support for South Korea going nuclear by the state to which the respondent felt closest 125
<Figure 1-4-1> American preferences by political tendencies 140

<Figure 2-7-10> Opinions toward “North Korean defectors help resolve heterogeneity between South and North Korea” (2007-2016) 277
<Figure 2-7-11> The benefits of unification and attitudes to North Korean defector-related policy (2007-2016) 280
<Figure 2-7-12> Social distance toward North Korean defectors (2014-2016) 281
<Figure 2-7-13> Social distance with respect to North Korean defectors (cumulative score) time-series (2007-2016) 282
<Figure 2-7-14> Social distance with respect to North Korean defectors (cumulative scores): change by generation (2007-2016) 284
<Figure 2-7-15> Feelings of social distance toward North Korean defectors – three factors 287
<Figure 2-7-16> Changes in receptivity to multiculturalism over time 292
<Figure 1-4-2> North Korea closeness by political affiliation 141<Figure 1-4-3> Closeness towards China by political affiliation 142<Figure 1-4-4> Perceived threat from the United States by political
inclination 149<Figure 1-4-5> Perceived threat of North Korea by ideology 151<Figure 1-4-6> The perceived threat of China by ideology 152<Figure 2-7-1> Sense of closeness to North Korean defectors by age 267<Figure 2-7-2> Sense of closeness to North Korean defectors by
household income 268<Figure 2-7-3> Sense of closeness to North Korean defectors by
education 268<Figure 2-7-4> Feelings of closeness towards North Korean defectors
and migrants residing in South Korea (2016) 270<Figure 2-7-5> Sense of closeness to immigrant groups by age
and education (2016) 273<Figure 2-7-6> Opinions regarding the acceptance of North Korean
defectors (2007-2016) 275<Figure 2-7-7> Opinions toward “The government should give
more aid to North Korean defectors” (2007-2016) 276<Figure 2-7-8> Opinions toward “Gaining employment has become
more difficult due to North Korean defectors” (2007-2016) 276
<Figure 2-7-9> Opinions toward “North Korean defectors should be subject to the same competition as everyone else in a workplace” (2007-2016) 277

Introduction

20 21
Introduction2016 Unification Perception Survey
Introduction
The year 2016 marked the fourth year of Park Geun-hye’s presidency, and the fifth year since Kim Jong-un had come to power. It was also a year in which inter-Korean relations were marked by deepening conflict, the North Korean side tested nuclear weapons for the fourth time, whilst South Korea took a hard-line approach in response. After the 25th August Agreement in 2015, there had been dialogue between the two Koreas, albeit limited. Thus the year began with a North Korean News Address that did not mention the nuclear weapons program (or the dual development of the economy and nuclear weapons), and the hope that the 7th Party Congress in North Korea would presage further improvements in relations between the two sides. However, from the outset, bad omens for the inter-Korean relationship were visible, the fourth nuclear test was soon followed by long-range missile tests. A program that went in 3-4 year cycles now saw two nuclear tests in one year, leading some to argue that the nuclear and missile programs were reaching the point of technical completion. Given how it has acted up to now, it appears that North Korea will do more such tests in order to assure its status as a nuclear
power. Such moves are liable to perpetuate the continued hostility that has come to mark inter-Korean relations.
South Korea’s response to North Korean confrontations was stronger than ever before. The South Korean government restarted full-scale psychological warfare loudspeaker broadcasting into North Korea two days after the North conducted a nuclear test on 6th January. It took only four months for the broadcasting to be restarted after the meeting of high level officials from the two countries resulting in the 25th August agreement that had led it to stop. North Korea did not flinch in the face of such measures, and proceeded to test long-range missiles in February, leading the South Korean government to play the final card in its hand, that is, closing the Kaesong Industrial Complex (KIC). Having opened in 2004, the KIC had been heralded as ‘the priming water for unification’ and as ‘the precious child of North-South cooperation’. The KIC had been unique as the only bond extending between the two Koreas, and as a space for cooperation between the two sides, even after three North Korean nuclear tests, but finally stopped running in 12 years after it had opened. This measure further darkened the prospects for dialogue between the two sides.
This deterioration in relations also impacted government and civilian aid and cooperation programs. The South Korean government, given the North’s continued pursuit of nuclear and missiles development faces a threat to its survival and security. Hence, it adjudged continued exchanges with the North were no longer appropriate, hence decided to temporarily cease all kinds of aid and cooperation with the North. Even the meetings of divided families could not proceed in 2016,

22 23
Introduction2016 Unification Perception Survey
only with the exchanges of divided families through a third country occasionally taking place. The government is likely to maintain a complete shutdown on all North-South cooperation projects going forward unless and until North Korea abandons its nuclear weapons and missile tests.
To respond to North Korea’s nuclear provocations, the South Korean government decided to deploy THAAD, and this had a huge impact not only on North-South relations but also on the broader regional situation. On 13th July, South Korea and the United States jointly announced that the Terminal High Altitude Area Defence (THAAD) would be deployed to Seongju, North Gyeongsang Province. This decision was attacked by the Chinese government and media. The Chinese warned that should the deployment not be cancelled or at least delayed, it would use every means to sanction South Korea, thus leading to fears about worsening Sino-ROK relations. The decision can be understood as being made in self-defence to guarantee South Korea’s security, but as a consequence, there was also the fear that it could also further exacerbate North Korea’s provocative behaviour, and spark an arms race in Northeast Asia between the great powers. In such circumstances, there was much interest as to whether the government could bring the North Koreans back to the negotiating table on the nuclear issue, whether it could persuade the Chinese through advanced powers of diplomacy, and whether it could restore a balance in relations with both China and the United States.
The North Korean nuclear threat led to intensifying sanctions not only at home but also internationally. North Korean nuclear
provocations led the UN Security Council to impose further sanctions. On 2nd March, Resolution No. 2270 passed with the unanimous approval of all permanent members, ushering in the harshest sanctions the North had ever faced. In addition, on 17th October, the UN Security Council released a press statement that strongly condemned North Korean missile tests. The fifth nuclear test was followed by Resolution No. 2321 which made additions to No. 2270 limiting the scale of North Korean coal exports. On 19th December, the UN General Assembly referred North Korea’s human rights problem to the International Criminal Court, urging to punish those responsible for human rights abuses. Yet, even with such intensifying sanctions and pressure from the international community, North Korea seems likely to continue testing nuclear weapons, and medium and long-range missiles in pursuit of recognition as a nuclear state.
How would such pressing developments in inter-Korean relations in 2016 affect South Koreans’ views of unification? This was the tenth year in which the Unification Perception Survey had been undertaken. We hoped to reveal this year’s perceptions but also how the perceptions had changed over the last ten years. Every change came with continuities and exceptions, hence the series of events that arose in 2016 may have had a temporary impact on the South Korean people, but at the same time may represent an extension of trends over the last decade. Thus, both theoretically and practically, continued tendencies and unique features of the year were of much interest.
The Institute of Peace and Unification Studies (IPUS) at Seoul National University has undertaken the survey since 2007 with almost

24 25
Introduction2016 Unification Perception Survey
exactly the same survey items and utilizing a rigorous survey method. As a result, obtaining a comprehensive dataset, allows us understand how the perception, attitudes, and aims of the South Korean people have changed year to year. The empirical data generated can thus help create meaningful policies in rapidly changing circumstances, and also generate useful theories in understanding the patterns of popular perception as well as form social consensus. Moreover, it is hoped that researchers in related fields use the data and other materials generated from the survey to comprehensively understand the many aims, value systems and collective feelings of the individual, the community, the nation and the world.
Changes in the domestic situation with respect to the unification issue necessitated the addition of new questions, while consistency in survey items also needed to be maintained in order to accumulate data annually, and analyse changes in attitudes and perceptions of unification. For this reason, although all demands could not be satisfied, items about major issues were added. Such changes were made on the principle that they should not affect the broad survey framework.
As with prior years, the content of the 2016 Unification Perception Survey was divided into five major parts: opinions on matters of Korean unification, perception and attitude to North Korea, evaluation of North Korea policy, attitude toward North Korean defectors, and perception of relations with neighbouring states.
The first section is composed of questions designed to measure opinion on the issue of Korean unification. Questions included items
about the need for and reasons for unification, when respondents think it would be possible, how respondents evaluated and what their attitudes was toward the actual effects of a range of North Korea policies, the urgency of various inter-Korean issues, how beneficial unification would be to South Korea or the respondent, and the influence that unification on the political development of the Korean peninsula.
The second section is comprised of questions about perceptions and attitudes of North Korea. Items included questions about what North Korea is to South Korea, like on attitudes to unification, the possibility of change in North Korea, and the possibility of armed provocation from North Korea. In addition, respondents were asked about how much knowledge about and experience with North Korea they had, how they perceived differences between the two countries, and how they felt about North Korea obtaining nuclear weapons. Moreover, they were asked how stable they thought Kim Jong-un’s regime would be going forward.
The third section was designed to help ascertain how South Koreans evaluated the government’s North Korea policy and their attitudes toward these policies. First, questions about the impact that aid for the North has on improving the lives of North Korean people, and satisfaction with government North Korea policy were asked. Next, questions about reopening Kaesong, the problem of restarting Mount Kumgang tours, sending leaflets to North Korea, and the North Korean human rights issue formed the principal portion of this section.
The fourth section of the survey asked respondents about their

26 27
Introduction2016 Unification Perception Survey
perception of and attitudes toward North Korean defectors. Amidst the continued freeze in relations between North and South, the number of North Korean defectors (‘the unification that came first’ as they are called) fell after Kim Jong-un’s ascension to power in 2011 before rising again this year, with the total number of defectors exceeding 30,000 for the first time in 2016. But this increase in defectors has also led to changes in how they are perceived in South Korean society. With South Korea’s worsening socioeconomic circumstances, North Korean defectors are increasingly seen as a social expense. In such an atmosphere, the questionnaire takes a broad approach, surveying attitudes toward North Korean defectors and policy toward them. Moreover, as well as North Korean defectors, questions were also asked about how receptivity to multiculturalism.
In the fifth section, questions about perceptions of international relations, and relations with neighbouring states were asked. Specifically, the political position of the United States, Japan, China, Russia regarding the Korean peninsula, and what the respondents thought these states are to South Korea was the central focus. Moreover, the survey asked respondents what political positions these four states would take on the matters regarding peace and unification on the Korean peninsula, and how they feel about those positions and their expected roles in the process of unification. Under circumstances of limited North-South exchange, in particular, understanding what South Koreans thought of closer Sino-North Korean relations was very important.
In addition to these five areas, basic background questions such
as the gender, age, education, job, income, residence, marital status, religion and ideology of respondents were also asked, with a wide variety of cross analysis employed. This data was compiled for in-depth statistical analysis, and not used for any other purpose.
Lastly, the survey also included an array of other items, mainly related to attitudes towards South Korea society – such as changes in Korean society since liberation, the current state of South Korean politics, satisfaction with the economy, national pride, the state of South Korean democracy, the possibility of war breaking out on the Korean peninsula, the record of President Park Geun-hye, whether they perceived North Korea as a state etc.
Work for the Unification Perception Survey of 2016 took place over 22 days between 1st July and 22nd July. The survey population is all South Koreans between the ages of 19 and 74 living in the 16 municipalities and provinces of the Republic of Korea (Seoul, Busan, Daegu, Incheon, Daejeon, Gwangju, Ulsan, Gyeonggi Province, Gangwon Province, the Chungcheong Provinces, the Jeolla Provinces, the Gyeongsang Provinces, and Jeju). Sejong city, though classed administratively as a special self-governing municipality has a small population, and thus was included in South Chungcheong province for the purposes of the survey. From the 2015 survey, the maximum age of respondents was raised from 65 to 74 in order to ensure that the views of seniors in a society that is rapidly aging are more accurately reflected in matters of unification. There were a total of 1,200 valid respondents, and the survey results have a margin of error ±2.8%. Multi-stage stratified sampling was used to obtain a sample. Resident

28 29
Introduction2016 Unification Perception Survey
registration data was used from Ministry of Public Administration and Security to divide the survey sample by region, gender, and age. Following this, a randomized list of phone numbers from relevant strata was obtained. Quotas for people from the sparsely populated regions of Jeju and Gangwon were imposed to ensure the reliability of the sample, then used to obtain representative samples for other regions.
The survey itself was carried out by Gallop Korea, taking the form of a structured questionnaire in a one-on-one interview. Before interviews were performed, supervisors were trained and certified by Gallop Korea. Interviews were then given an orientation about the survey method and contents and participated in pre-interview training. Through this, they were acquainted with the contents of the survey questionnaire and expected issues. This allows for the minimization of non-sampling error and standardization of the interview process. Interviewers also received training as to how to deal with contingencies that might arise during the course of survey interviews. The researcher in charge and the survey director inspected each questionnaire in the presence of the interviewer who had submitted it. And by offering guidance to interviewers wherever errors were discovered, we sought to minimize all potential errors.
To ensure the credibility of the data collected, 30% of respondents who had completed questionnaires were randomly called and re-asked the questions to ensure that the written responses represented their actual views. Where fabrications were found, all the survey questionnaires associated with the interviewer in question were
invalidated and the survey work was redone. The Statistical Package for the Social Sciences (SPSS) version 21.0 software package was used to edit, code, and punch the raw data. The raw data from the Unification Perception Survey will be provided to the Korea Social Science Data Archive a year following survey work.

Chapter 1 Perception of Unification
Chapter 2 Perception of North Korea
Chapter 3 Perception of the Government's North Korea Policy.
Chapter 4 Perception of the Relationships with Foreign Nations
Section 1
Basic Analysis

32 33
Chapter 1 Perception of Unification2016 Unification Perception Survey
Chapter 1
Perception of Unification
This survey project, The Unification Perception Survey, only began ten years ago. Because the survey is only conducted once a year, it has limitations as a means by which to assess short-run changes in perception of the unification issue. However, the accumulation of a decade of data makes it possible to apply time-series analysis methodologies. It is thus possible to determine to some extent what has remained constant amidst changes in perception and the external environment.
Perception of the unification issue is affected by trends in inter-Korean relations and policy change. North Korea’s continued provocations and nuclear tests, as well the increasingly strict international sanctions regime that targets the North would seemingly negatively impact the perception of unification amongst South Koreans. Yet, enthusiasm and hope with respect to the unification issue have remained largely unchanged. Indeed, in spite of rising tensions, South Koreans have continued to keep in mind social ideals and values that emphasize the importance of pragmatism in inter-Korean relations and the issue of
unification, rather than extreme alternatives, namely war. The actual impact that popular opinion has on unification policy
is potentially controversial. Traditionally, the government is perceived to create the framework with which policy is made, and then pursues policy within such confines. However, if there is no popular consensus for such a policy framework, then government will be unable to implement its desired policies. The Park government’s Trust Process and the ‘Unification is a Jackpot’ slogan formed the basis for large unification education projects, but it is necessary to determine whether these projects have created broader social consensus for the Park government’s overall unification policy aims.
The present state of perception may differ from when this study was written because of changing circumstances facing South Korean society. Survey work was carried out before Park Geun-hye’s impeachment, so we will have to wait until next year to ascertain how this affects the perception of unification amongst South Korea’s public. This section analyses basic data pertaining to: (1) the need for unification and the reasons given for such a need, (2) the hoped for period in which unification will occur and the desired speed of progress toward unification, (3) collective and individual expectations with respect to unification, (4) hopes for resolution of post-unification social problems, (5) the relationship between unification and democracy, and (6) the political and social system of a unified Korea. In so doing, a brief outline of trends in perception over the previous decade will be offered.

34 35
Chapter 1 Perception of Unification2016 Unification Perception Survey
1. The need for unification and the reasons given for such a need
1) The need for unification
The perceived need for unification has risen to 53.4% of South Koreans by 2.4% compared to the results of the previous year’s survey. This is, however, the third lowest percentage after 2015 and 2008, with 19.5% responding that ‘unification is very much needed’, while 33.9% said it was ‘somewhat needed’. Since 2007, while over half the South Korean public has responded that unification is needed, the percentage who said it is ‘very much needed’ has continuously declined. Conversely, there was no significant change on 2015 in the number who responded that ‘unification is not needed’, with 24.7% responding as such.
<Figure 1-1-1> The need for unification(Unit:%)
63.8
51.555.9 59.1
53.7 57.1 54.9 55.951.0 53.4
21.123.1
23.6
20.4
25.021.6
21.5
22.524.3 22.0
15.1
25.4
20.5
20.6
21.3 21.5
23.7
21.6
24.8 24.7
0
10
20
30
40
50
60
70
2007 2008 2009 2010 2011 2012 2013 2014 2015 2016
Necessary Neutral Not Necessary
In spite of active drives to educate South Koreans about unification and other activities related to unification, there was little change in perceived need for unification when 2016 survey results are compared to 2015 results. Given that one of the major goals government unification policy and related activities is to reinforce the perceived need for unification amongst South Koreans, it is difficult to take a positive view as to the efficacy of such policies pursued by the Park government. Further, the number of South Koreans responding ‘unification is very much needed’ continues to decline, reflecting declining desire and determination to unify.
With respect to perceived need for unification, there continues to be marked differences between men and women. In 2014, 61.9% of men responded that ‘unification is very necessary’, this number dropped to 54.9% in 2015, before rising back to 61.4%. Conversely, only 49.6% of women responded the same way in 2014, this number dropped to 46.9% in 2015, and to 45% in 2016. Since the survey project began in 2007, men have always been more likely to favour unification than women.
Regional variations change from year-to-year. In 2015, 44.5% of those surveyed in the capital region said that ‘unification is needed’, but this increased to 54.5% in 2016 – a full 10% rise. In the results of 2014’s survey, it was Gangwon and Chungcheong provinces that were most supportive of the need for unification, while in 2015 it was Honam. In 2016, perhaps due to regional variations in the sample, Gangwon (74.2%) and Jeju (70.3%) scored highest, whereas Yeongnam was the least supportive (44.6%).
36 37
Chapter 1 Perception of Unification2016 Unification Perception Survey
As for age, the gap between those in their 20s and 30s, and those in their 50s and over 60 continues to widen. Compared to 2014, in 2015 and 2016, support unification amongst those in their 20s and 30s fell by 7 to 14%, while support remained steady amongst those in their 50s (65.0%) and over 60 (74.0%). At the same time, those in their 40s continue to occupy a middle ground between these two poles, with around 55% supporting unification.
With education, the more educated a respondent, the more likely they are to oppose unification and vice versa. This tendency is identical to 2015. Given the age-specific and education-specific variations in responses, it is to be expected that unless younger South Koreans anticipate that unification will have positive effects on the economy as a whole and on the jobs market in particular, prevailing attitudes are unlikely to change.
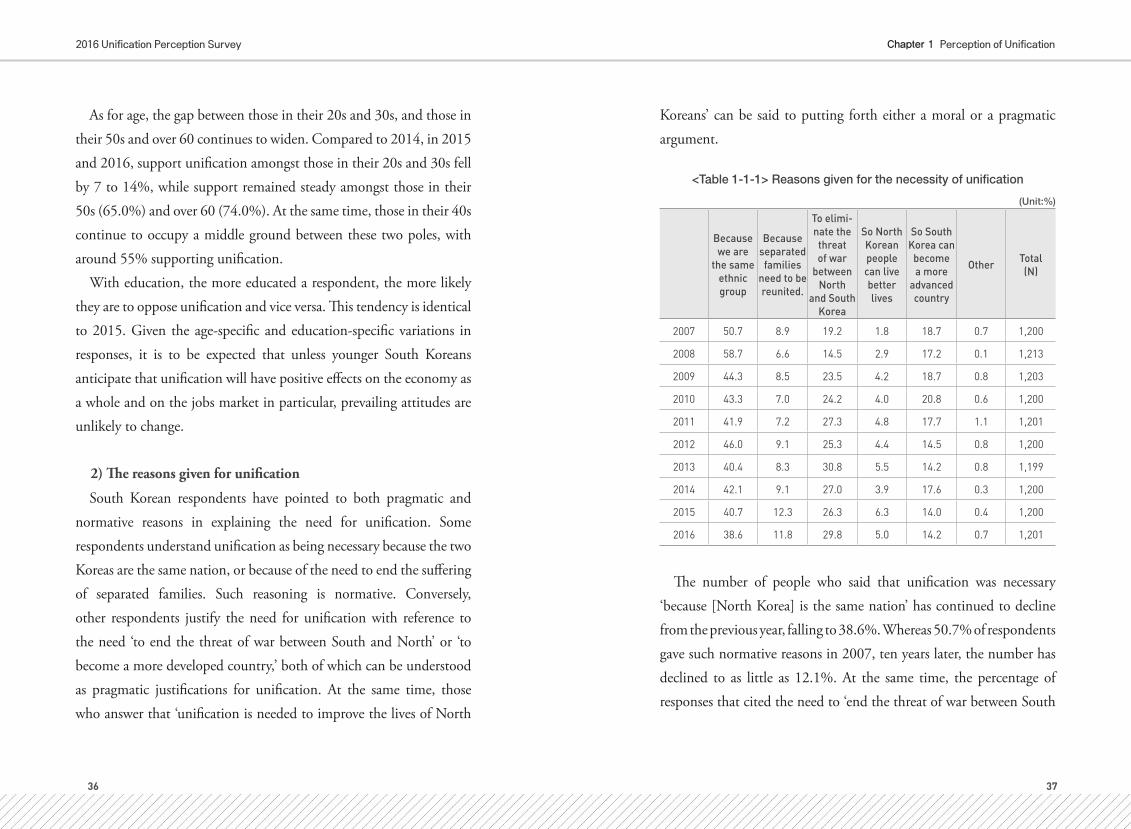
2) The reasons given for unification
South Korean respondents have pointed to both pragmatic and normative reasons in explaining the need for unification. Some respondents understand unification as being necessary because the two Koreas are the same nation, or because of the need to end the suffering of separated families. Such reasoning is normative. Conversely, other respondents justify the need for unification with reference to the need ‘to end the threat of war between South and North’ or ‘to become a more developed country,’ both of which can be understood as pragmatic justifications for unification. At the same time, those who answer that ‘unification is needed to improve the lives of North
Koreans’ can be said to putting forth either a moral or a pragmatic argument.
<Table 1-1-1> Reasons given for the necessity of unification
(Unit:%)
Because we are
the same ethnic group
Because separated families
need to be reunited.
To elimi-nate the threat of war
between North
and South Korea
So North Korean people can live better lives
So South Korea can
become a more
advanced country
Other Total(N)
2007 50.7 8.9 19.2 1.8 18.7 0.7 1,200
2008 58.7 6.6 14.5 2.9 17.2 0.1 1,213
2009 44.3 8.5 23.5 4.2 18.7 0.8 1,203
2010 43.3 7.0 24.2 4.0 20.8 0.6 1,200
2011 41.9 7.2 27.3 4.8 17.7 1.1 1,201
2012 46.0 9.1 25.3 4.4 14.5 0.8 1,200
2013 40.4 8.3 30.8 5.5 14.2 0.8 1,199
2014 42.1 9.1 27.0 3.9 17.6 0.3 1,200
2015 40.7 12.3 26.3 6.3 14.0 0.4 1,200
2016 38.6 11.8 29.8 5.0 14.2 0.7 1,201
The number of people who said that unification was necessary ‘because [North Korea] is the same nation’ has continued to decline from the previous year, falling to 38.6%. Whereas 50.7% of respondents gave such normative reasons in 2007, ten years later, the number has declined to as little as 12.1%. At the same time, the percentage of responses that cited the need to ‘end the threat of war between South

38 39
Chapter 1 Perception of Unification2016 Unification Perception Survey
and North’ rose to 29.8%. This represents a rise of 10.6% from 19.2% in 2007. Hence, as the number who point to normative reasons for unification has fallen, the number giving pragmatic reasons has risen.
Over the last ten years, the number of those responding that unification is needed to ‘end the suffering of separated families’ has risen by around 2.9%. While the number who say that it is needed for ‘North Koreans to live well’ has risen by 3.2%, and conversely, the number who say that unification is needed ‘for South Korea to become a more developed country’ has declined by 4.5%.
How can such changes be explained? Do such trends reflect a growing desire to resolve military tensions? Under the Lee Myung-bak and Park Geun-hye governments, North Korean provocations have continued, relations between South and North have soured, and sanctions have further raised tensions. It may be for this reason that South Koreans have become more anxious about the threat of war, and thus have increasingly come to believe that unification is needed in order to avoid this threat.
If so, does this represent a ‘realist view of unification’? Unification, hitherto discussed as a matter pertaining to national identity, if it is now argued to be necessary due to the threat of war, can thus be perceived as being a realistic and pragmatic choice. However, while a high number of people in their 30s and 40s offer such answers, aside from those in their 40s other age groups say that unification is necessary because of North Korea is the ‘same nation’. While the perceived threat of war has become more widespread, normative reasons still remain more important in justifying the need for unification.
From this it is clear that no longer believing in nationalist justifications for unification does not necessarily lead to South Koreans abandoning normative justifications altogether. At the same time, the last decade of data can lead one to argue that unification is a national issue, but it can also be viewed as an international issue. In other words, while South Koreans have come to believe unification to be necessary because of pragmatic concerns, the universal value of ‘peace’ has become increasingly significant for them. One can conclude from this that if such trends continue, unification policy will be indivisible from policies that aim to resolve South Korean social problems.
2. The how and when question of unification
1) How unification is to be achieved
Survey data accumulated over the last decade seemingly indicates that South Koreans support a gradual approach to unification that emphasizes stability rather than a more radical one. One every occasion, a majority of South Koreans have answered that “rather than rushing, we should wait until the conditions are right for unification”, in other words, they have revealed a preference for a gradualist approach to unification. In 2007, as many as 70.6% responded as such, and while this number declined by 16.5% to 54.1% in 2016, a majority of respondents continue to favour such an approach.

40 41
Chapter 1 Perception of Unification2016 Unification Perception Survey
<Table 1-1-2> How unification is to be pursued
(Unit:%)
It is better to unify as soon as
possible, no mat-ter the cost.
It is important to wait for the
right conditions instead of rush-ing unification
Preserving the status quo is the
best option
I am not interested in unification.
Total(N)
2007 10.6 70.6 11.8 7.0 1,200
2008 9.6 64.8 17.1 8.5 1,213
2009 8.6 68.3 15.6 7.5 1,203
2010 10.0 67.0 16.1 6.9 1,200
2011 9.7 67.0 15.2 8.2 1,201
2012 9.6 65.1 18.3 7.0 1,200
2013 11.3 61.8 18.9 8.0 1,199
2014 12.1 61.3 19.6 7.0 1,200
2015 11.8 57.5 21.8 8.9 1,200
2016 13.1 54.1 23.2 9.6 1,201
Over the previous decade, around 10% of respondents have answered that “whatever the cost, unification is best done quickly.” When the two Koreas were engaged in competition over which side had the best system, unification was usually considered to be a priority that preceded all other concerns. However, since the mid-2000s, people have become increasingly less inclined to accept unification as a priority for which all other values and concerns must be sacrificed. Conversely, the number of respondents who answer that “the status quo is best”, i.e. a preference for the coexistence of South and North Korea, has risen from 11.8% in 2007 to 23.2% in 2016. At the same time, the number of people who say they have “no interest in
unification” has varied slightly from year to year, but has hovered between 7.0% and 9.6%.
Indeed, while a majority continues to favour gradual unification, the number is falling, while there is a corresponding rise in the number of people now favouring the coexistence of South and North Korea. What does this mean? While a number of conclusions can be drawn, it is possible to argue that this results from the growing belief that unification of the two Koreas into a single political system will not be an easy task. Given this, it may also be easier to achieve popular support for the development of a practical inter-Korean policy premised upon economic integration, free and safe travel between the two. A paradigm shift that understands the possible coexistence of a variety of views and ideas with regard to unification is necessary.
By age, “we should wait until the conditions are right for unification” had the highest response rate amongst all age groups. Of those in their 20s, 44.3%, of those in their 30s, 52.4%, of those in their 40s, 57.0%, and of those over 60, 62.0% thus demonstrated a preference for a gradual approach to unification. Conversely, respective support for “the status quo is good” was 34.5%, 24.4%, 24.7%, 19.8%, and 13.2% for each of the age groups from 20s to 60s.

42 43
Chapter 1 Perception of Unification2016 Unification Perception Survey
<Figure 1-1-2> Preference for how unification is to be achieved by age group
(Unit:%)
8.8 8.3
10.7 15.9
22.1
44.3
52.457.0 54.2 62.0
34.5 24.4 24.719.8
13.212.5 14.9
7.6 10.1 2.80
10
20
30
40
50
60
70
20s 30s 40s 50s 60+
Unify as fast as possible Unify when the timing is right
Keep the status quo Not interested in unification
There is no major difference between Korean men and women in their response to this question. That said, more men responded that either unification should be done “as fast as possible” or “when the conditions are right”, while more women answered that “the status quo is good” or “not interested in unification”.
<Table 1-1-3> Cross tabulation of “the need for unification” and “how unification is to be achieved” items
(Unit:%)
As soon as possible
Wait for the right conditions
Keep the status quo
Not interested in unification
Unification is needed 12.4 37.1 3.3 0.5
Neutral 0.7 11 7.7 2.6
Unification is not needed 0 6 12 6.5
The cross tabulation of “the need for unification” and “how unification is to be achieved” items indicates that the two have a high degree of association. Where “need” is coded as a five-point scale, its Pearson’s R value is 0.641, and its Spearman Correlations value is 0.650. To summarize, those who believe that unification is necessary usually prefer a gradualist approach to it, while those who do not see a need for unification have a preference for the status quo.
Due to substantial variation each year, it is hard to discern a pattern to responses on a regional basis. . In 2016, as with 2014, a relatively high number of Honam residents favour of rapid unification (28.5%), while as was the case in 2015 (8.0%), Yeongnam residents are the least inclined to favour speedy unification in 2016 (5.0%). Residents of the capital region (55.5%) and Chungcheong (55.3%) are more supportive of gradual unification than Yeongnam residents (49.9%) and Honam residents (48.7%). At the same time, over 70% of Gangwon and Jeju residents support gradual unification.
2) When unification can be achieved
The number of respondents who believe that unification can be achieved in the near future is decreasing. Over the last ten years, some in South Korean society have argued that unification will either happen soon, or that we must be ready for it to come at any time. However, the majority of South Koreans appear to not be persuaded by such arguments. In any given year over the past decade no more than 4% of respondents have answered that ‘unification is possible within the next five years’.

44 45
Chapter 1 Perception of Unification2016 Unification Perception Survey
<Table 1-1-4> When unification will occur
(Unit:%)
Within 5 years
Within 10 years
Within 20 years
Within 30 years
30 years or more
Not possible
Total(N)
2007 3.7 23.5 30.9 14.7 13.9 13.4 1,198
2008 2.3 13.4 22.3 14.8 25.1 22.1 1,213
2009 2.7 17.0 27.7 16.3 16.5 19.8 1,202
2010 3.4 17.8 24.1 13.4 20.8 20.6 1,200
2011 2.5 16.3 26.1 14.0 19.7 21.4 1,201
2012 2.9 14.5 25.9 17.8 19.8 19.2 1,200
2013 3.7 13.3 25.3 13.7 18.3 25.8 1,200
2014 2.2 13.7 22.8 18.2 19.7 23.5 1,200
2015 3.5 17.8 25.5 13.9 19.6 19.7 1,199
2016 3.5 14.0 25.1 15.2 17.9 24.4 1,201
It is clear that the average South Korean does not see unification as possible in the short-term. The number who answered that “unification is possible in the next ten years” has declined by 10% from 23.5% in 2007 to 14.0% in 2016. Over the same period, the number who answer answers “it is not possible” has risen by 10% from 13.4% to 24.4%. In the 2016 survey, those responding “possible in the next 20 years” were in a plurality at 25.1%, but only 0.7% than those responding that “it is not possible”.
As with the need for unification discussed above, women are more pessimistic about unification. Five percent more men than women answered that unification would occur “within five years”, “within ten years”, and “within twenty years”, while the gender gap disappears in
the number who answer “within thirty years”, and more women than men answered that unification is possible “in thirty years or later” or “is not possible”.
There was almost no variation in the age of those who responded that unification was possible “within thirty years”. The gap between the generations was repeatedly evident in the survey data: the younger generation see unification as an event to occur in the distant future, while the elder generation see it as something that can be realized in the near-term. At the extreme end of the spectrum, there were no respondents in their 20s who said that “unification will happen within the next five years”, yet 6.6% of respondents in their 50s and 7.0% of respondents over 60 agreed with the statement. On the other hand, 34.3% of respondents in their 20s said that unification was not possible, while 19.2% of respondents in their 50s and 18.2% of respondents over 60 responded the same way.
These results imply that policy preparations for unification must be flexibly pursued in accordance with both short-term tactical considerations and long-term strategic considerations. In other words, even if South Koreans do have a universal image of a future, unified Korea, there has not been sufficient discussion of how such a believed future will be achieved in the current context of continued division. A unified Korea cannot instantaneously become a completely new and different place to contemporary South Korea. Hence, there is a need for the consideration of how to connect the future unified Korea to the current Korea, which requires a more practical approach of a

46 47
Chapter 1 Perception of Unification2016 Unification Perception Survey
unification process.The frequent changes in unification policy that have coincided with
changes in government may also lead to more passive or negative views of unification in both its timing and sequencing. Even if specific details can change, changes to the overall framework should be avoided too frequently. There has yet to be sufficient consultation domestically on matters of unification policy, and this means that whenever there is a change of administration, it is difficult for the new to maintain the policy framework of the old. In future, it will be necessary to create a national consensus on unification policy to ensure that elections do not disrupt the overall framework of unification policy and therefore to lesson widespread negative perception of the unification issue.
3. Expected benefits of unification
1) The Individual and Society
Unification involves bringing back together a country that has been divided for over 70 years. It thus involves both costs and benefits. If said the costs are believed to outweigh the benefits, the public is unlikely to actively pursue unification – even if unification is considered to be ultimately necessary. Conversely, if the costs are believed to be comparatively low and the benefits high, popular perception and attitudes can of course change.
A cost-benefit analysis also depends on who or what is ultimately being impacted: South Korean society at large, or the individual being
surveyed specifically. It is to be expected that that respondents would believe the benefits of unification to accrue more to society at large than to themselves specifically. This is because while the benefits of unification to the individual are unclear, the costs – for instance, tax rises – are all too easy to imagine.
<Figure 1-1-3> Expected advantages of unification: the individual and society
(Unit:%)
55.8
47.553.2 53.5 50.7 51.6 48.6
55.9 57.453.0
30.3
27.723.9
24.8
27.8 26.0
21.8
27.1
28.024.6
0
10
20
30
40
50
60
70
2007 2008 2009 2010 2011 2012 2013 2014 2015 2016
South Korean Society Individuals
In previous years, respondents have consistently indicated that they believe unification will be more beneficial to the community than to themselves. Except for the years 2008 and 2013, over the last decade over half of all respondents answered that unification would be more beneficial to society overall than to them as individuals. By contrast, in 2007, 30.3% of responded that unification would be “good for them”, but this number has since declined, with now only 24.6% of

48 49
Chapter 1 Perception of Unification2016 Unification Perception Survey
respondents giving the same answer in 2016. Compared to 2015, the overall number of positive responses – i.e. good for either individuals or society – has also fallen.
The overall average gap between the two positive responses is 26.5% over the last decade. In other words, over the last ten years, around twice as many South Koreans surveyed responded that unification would principally good for society at large, rather than for them as individuals. However, this gap was 29.4% in 2015, and 28.4% in 2016, and the gap has been steadily widening since 2012.
Of men surveyed, 56.8% responded that unification will be primarily good for South Korean society, while 49.1% of women the same. At the same time, 27.1% of men responded that it would be in their individual interests first, and 21.8% of women gave the same response. Hence, the same tendency observed above of women being approaching the unification issue in a more realistic manner is repeated here.
There is little evident variation by age: 49.2% of respondents in their 20s and 48.5% of respondents in their 30s said that unification would be primarily good for society. While for respondents in their 50s and 60s, the equivalent numbers were 53.6% and 55.1%. Conversely, of those surveyed in their 20s, only 18.7% said that unification would be good for them first, with other age groups responding similarly: 27.4% (30s), 26.8% (40s), 27.8% (50s), and 20.9% (60s). Across all age groups, the society-individual ratio for the positive response rates was around 2:1.
As for education, there was around a 5% gap between those who graduated middle school and those who did not, with 46.8% of those who hadn’t indicating that it would be good for society and only 16.3% saying it would be good for them personally. At the same time, the equivalent figures for high school graduates were 55.2% and 25.6%, while 51.8% of university graduates indicated that unification would primarily be good for society and 25.7% saying it would be good for them personally.
2) Expected positive effects on current social problems following
unification
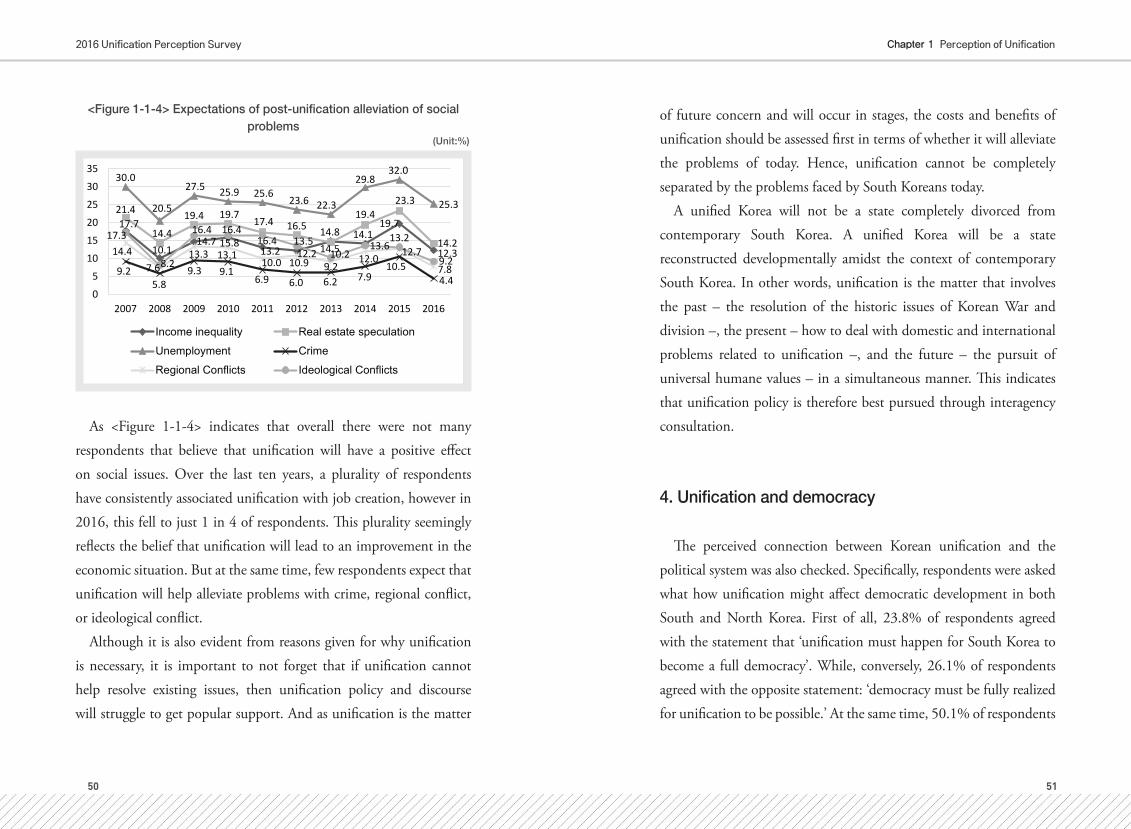
The above items may be rather abstract as they measure the expected benefits of unification in collective terms. Hence, for more detailed investigation, the following question was asked: “in the event of unification, to what degree will the following social problems be alleviated?”
50 51
Chapter 1 Perception of Unification2016 Unification Perception Survey
<Figure 1-1-4> Expectations of post-unification alleviation of social problems
(Unit:%)
17.7
10.114.7 15.8
13.2 12.2
14.8 14.119.7
12.3
21.4
14.4
19.4 19.717.4 16.5
14.5
19.423.3
14.2
30.0
20.5
27.5 25.9 25.623.6 22.3
29.832.0
25.3
9.25.8
9.3 9.16.9 6.0 6.2 7.9
10.54.4
14.47.6
13.3 13.110.0 10.9 9.2
12.0 12.77.8
17.3
8.2
16.4 16.416.4 13.5
10.213.6
13.2
9.2
0
5
10
15
20
25
30
35
2007 2008 2009 2010 2011 2012 2013 2014 2015 2016
Income inequality Real estate speculation
Unemployment Crime
Regional Conflicts Ideological Conflicts
As <Figure 1-1-4> indicates that overall there were not many respondents that believe that unification will have a positive effect on social issues. Over the last ten years, a plurality of respondents have consistently associated unification with job creation, however in 2016, this fell to just 1 in 4 of respondents. This plurality seemingly reflects the belief that unification will lead to an improvement in the economic situation. But at the same time, few respondents expect that unification will help alleviate problems with crime, regional conflict, or ideological conflict.
Although it is also evident from reasons given for why unification is necessary, it is important to not forget that if unification cannot help resolve existing issues, then unification policy and discourse will struggle to get popular support. And as unification is the matter
of future concern and will occur in stages, the costs and benefits of unification should be assessed first in terms of whether it will alleviate the problems of today. Hence, unification cannot be completely separated by the problems faced by South Koreans today.
A unified Korea will not be a state completely divorced from contemporary South Korea. A unified Korea will be a state reconstructed developmentally amidst the context of contemporary South Korea. In other words, unification is the matter that involves the past – the resolution of the historic issues of Korean War and division –, the present – how to deal with domestic and international problems related to unification –, and the future – the pursuit of universal humane values – in a simultaneous manner. This indicates that unification policy is therefore best pursued through interagency consultation.
4. Unification and democracy
The perceived connection between Korean unification and the political system was also checked. Specifically, respondents were asked what how unification might affect democratic development in both South and North Korea. First of all, 23.8% of respondents agreed with the statement that ‘unification must happen for South Korea to become a full democracy’. While, conversely, 26.1% of respondents agreed with the opposite statement: ‘democracy must be fully realized for unification to be possible.’ At the same time, 50.1% of respondents

52 53
Chapter 1 Perception of Unification2016 Unification Perception Survey
said ‘unification has no connection to democracy’.
<Table 1-1-5> South Korean democracy and unification
(Unit:%)
2007 2008 2009 2010 2011 2012 2013 2014 2015 2016
Will achieve complete
democracy only after unification.
19.9 20.0 19.3 18.1 19.7 23.6 23.6 27.0 23.0 23.8
Must become a complete de-
mocracy before unification
31.3 23.5 31.2 29.8 25.1 24.8 26.1 23.2 29.1 26.1
Unification and democracy have no correlation
48.7 56.6 49.5 51.9 55.3 51.7 50.3 49.8 48.0 50.1
Over the past decade, every year around 50% of respondents said that unification has no connection to democracy. Movements for democratization and unification in South Korean society have been closely connected throughout much of South Korean history, but the two issues have increasingly become separated. This indicates the emergence of an issues structure in which the two have become independent.
In the past, where unification was considered more important than democracy, democratic values could become distorted or even sacrificed. For those who saw democracy pushed aside in the name of unification by politicians, and for younger South Koreans who see democracy as of more importance than unification, the issues are largely no longer connected. This indicates that, if unification policies can be related to the alleviation of problems in South Korean
democracy, they will contribute to creating more social support for unification.
As to age, the older the respondent was, the more likely they were to respond that ‘unification must happen for South Korea to become a full democracy’, and the younger, the more likely they were to say ‘democracy must be fully realized for unification to be possible.’ However, the dividing line appears to be 60 years of age, with all age groups under 60 more likely to say the latter than the former. People under 30 in particular far more likely to choose the latter.
There was little difference between respondents of different ideological orientations, with 25.2% of progressives and 24.4% of conservatives stating that unification is required first. At the same time, 30.3% of centrists, 22.1% of progressives, and 21.5% of conservatives responded that full democracy was a precondition for unification.
Similar numbers of respondents have differing opinions of whether unification would promote democracy in North Korea or whether democratization in North Korea was a necessary condition for unification. 27.8% of respondents agreed with the statement ‘change within North Korea is necessary for unification’, while 28.7% of respondents stated that ‘unification could lead to unification in North Korea. While there has been a flood of media reporting about the undemocratic nature of the North Korean system, less than 30% of respondents stated that they believed unification was a means by which to democratize the North. The number of respondents saying that democracy and unification are not linked rose by a full 15.1% from 43.6% last year.

54 55
Chapter 1 Perception of Unification2016 Unification Perception Survey
<Table 1-1-6> North Korean democracy and unification
(Unit:%)
2009 2010 2011 2012 2013 2014 2015 2016
Will achieve complete
democracy only after unification
28.7 34.3 37.6 38.7 34.7 39.9 38.2 28.7
Must become a complete
democracy before unification
27.8 33.5 29.4 32.0 33.0 27.0 33.3 27.8
Unification and democracy have no correlation
43.6 32.2 33.0 29.3 32.3 33.1 28.5 43.6
Generally, the older responders were, the more likely they thought that unification was necessary for democratization in the North, and the younger they were, the more likely they were to think the reverse. Of respondents in their 20s, 38.5% agreed with the statement that ‘North Korean democracy must precede unification’, while 30.8% said that ‘unification will promote North Korean democratization’. In the other age groups, in general, more respondents were found to agree with the latter statement than the former.
Regardless of education, those surveyed generally responded that unification would precede democratization in North Korea. That said, there was a tendency amongst more educated respondents to see both North Korean democratization and unification as similarly important.
Of those who said that unification would precede North Korean democratization, 45.0% identified as conservative, 38.6% were centrists, and 38.3% were progressives. Conversely, of those who agreed with the
reverse, 27.1% were conservatives, 32.2% were centrists, and 27.4% were progressives. Compared to last year, more put unification first and less emphasized the need for North Korea to first democratize. This implies that respondents were less inclined to believe in the possibility of North Korean democratization.
5. Unified Korea: what respondents hoped for
The South Korean government has a precise blueprint for unification called the ‘One National Community Unification Plan’. The plan divides the process into multiple steps that begin with dialogue and cooperation, before preceding to unify South and North into one nation state. However, this plan contains no precise explanation as to the nature of the political and social system that such a state will have. No social consensus in this area exists at present, hence the plan allows for unification either through the absorption of North Korean society by the South, the absorption of the South by the North, or a ‘third way’.

56 57
Chapter 1 Perception of Unification2016 Unification Perception Survey
<Table 1-1-7> Preferred form of unification
(Unit:%)
2009 2010 2011 2012 2013 2014 2015 2016
South Korea's Political system 43.6 44.4 48.9 44.2 43.6 44.9 48.1 47.3
North Korea's Political System 39.1 38.8 35.6 37.7 35.4 37.9 33.5 34.5
Maintain both political systems
13.3 12.6 12.3 15.1 16.9 13.2 13.6 14.4
Either one is fine 4.0 4.2 3.2 3.0 4.1 4.1 4.8 4.0
Respondents were asked “What kind of country should a unified Korea be?” A full 47.3% of respondents said that ‘a unified Korea should have the same system as South Korea today’, this represents a plurality of respondents – and since 2009, the number of respondents who have answered as such has been between 43% and 48.9%. The second most popular response has also consistently been ‘a compromise between the South and North Korean systems’, with 34.5% of respondents saying as such this year. The number of respondents giving this answer has also hovered in the 35-40% range since 2009. Similarly, the number who favours the continued existence of the two systems has varied between 13.3% and 16.9%, with 14.4% responding as such in 2016.
Given that the fourth article of the South Korean constitution states that “The Republic of Korea shall seek national unification, and shall formulate and carry out peaceful unification policy based on the free and democratic basic order,” the fact that a full 1 in 3 respondents favour ‘a compromise between the South and North Korean systems’
and that there is a not a large difference between them and the number who say that ‘a unified Korea should have the same system as South Korea today’ might require an explanation. This cannot be interpreted as a sign that 1/3 of South Koreans reject liberal democracy. Rather, it can be interpreted as a sign of a level of popular support for improvement to South Korea’s existing political and social system to ensure that its current problems are not perpetuated.
Aside from respondents in their 30s, a plurality of those surveyed in all age groups responded that the South Korean system should be retained in case of unification. With the 30-39 age group, 41.1% responded that the South Korean system should be kept, while 40.6% said that a compromise between the South and North Korean system should be sought – these numbers are almost identical. However, a majority of respondents in their 20s (53.1%) and in their 60s (52.3%) believed that the South Korean system should be kept. Last year it was people in their 40s who were most likely to support a compromise in the event of unification, this year it was people in their 30s.
Lastly, when sorted by partisan affiliation, 50.0% of conservatives, 45.3% of centrists, and 49.5% of progressives supported maintaining the South Korean system in the event of unification. This represents a 9% rise on 2015 for progressive-leaning respondents. Conversely, 30.2% of conservatives, 36.6% of centrists, and 34.1% of progressives favoured a compromise between the South and North Korean systems. This represents a slight rise in support for such a solution amongst conservatives and centrists, and a fall amongst progressives.

58 59
Chapter 1 Perception of Unification2016 Unification Perception Survey
6. Sub-conclusion
It has been 10 years since this survey project began reporting annually on how South Koreans perceive the issue of unification. Now is as good a time as any to ask ourselves how we are to explain the characteristics of our survey results. We need to look at what unification means to South Koreans, bringing together and putting into order a combined picture of the survey results. The government and groups of experts have continued to lead discussions on unification, coming up with a number of ideas about what form unification will take. However, there is little reason to believe that such discussions have been fully followed by the South Korean people. They have their own views of unification.
According to survey results, even where South Koreans do not know exactly what unification might entail, they have a coherent orientation in their perception of the issue. They no longer see it in purely ethnocentric terms. And even where they believe it necessary, they do not always think it is because the two Koreas are the same nation. Some believe that unification is necessary to deal with the threat of war, or in order for South Korea to believe a developed country. Although you may worry that unification is now perceived in pragmatic or instrumental terms, perhaps you should not.
South Koreans see unification as being both a national and international event. But rather than believing unification to be a necessary sacrifice because the South and North are the same nation, they increasingly see unification as a necessary means by which to
bring peace to the Korean peninsula, and think there is a need to find a way to reduce the cost of combining the South and North. Though many think that unification may bring benefits to South Korean society, such a perception coexists with the fear that unification will not help them personally.
Most South Koreans do not believe that unification will help alleviate South Korean social problems. There were a relatively high number of respondents who associated unification with an improvement in employment, but this was not a significantly high number as a percentage of all respondents. Regardless of how unification happens, should it occur without a resolution of current social problems facing South Koreans, it will be accompanied by significant difficulties. Thus, short and long-term unification related strategy must be formulated in different ways to reflect such concerns.
Over the last decade, the topics that have gotten the most interest are how ideology colours perception, and differences in perception between the generations. Of late, perceptions of unification are increasingly the product of generational rather than ideological differences. And this generational divide is seemingly solidifying. However, there is a need to determine whether such a generational divide is limited purely to the unification issue. For instance, we must reflect on whether it is a lack of national historical consciousness or growing conservative tendencies amongst people in their 20s that led them to prioritize current pragmatic concerns in matters of unification.
If the perception of and attitude toward other social issues amongst people in their 20s is similarly at variance with other age groups, this

60 61
Chapter 1 Perception of Unification2016 Unification Perception Survey
will require that we evaluate their responses differently. A lack of interest or negative attitude toward the unification issue may result not from issues endogenous to popular perceptions but rather as a result of a lack of effort to resolve other existing social problems. Now is a time that requires unification policy which is directly connected to the lives of South Koreans today and the future that they want to live in.
We must also consider what effect North Korea-related policy has on perceptions of the unification issue. Unification policy and North Korea-related policy are usually separated, but they are actually not that easy to disentangle. It is undeniable that when North Korea tests nuclear weapons and sanctions are imposed, this influences both unification policy and the perception of the unification issue amongst the South Korean public. Therefore, the establishment of unification-related governance that simultaneously take into account North Korea-related policy, foreign policy and unification policy will allow for the creation of conditions by which a more positive attitude to the issue can be engendered amongst the South Korean public.
Since the 2016 survey data was collected, Park Geun-hye has been impeached amidst allegations that she used power over presidential patronage and government institutions to grant favours to her confidents. This represents a sudden, seismic change in the topography of South Korean political life, which makes it very difficult to predict the future. But, even in such circumstances, it is clear that the South Korean people will come to see former President Park’s unification policies in a different light than they would have back when the 2016
survey was undertaken. The government’s policy making apparatus had seemingly been handed over to outsiders by Park, and her government’s unification policies now are shrouded in suspicion. Hence, there is a need for analysis as to how this will impact South Korean perception and attitudes regarding unification.
2016 Unification Perception Survey
62 63
Chapter 2 Perception of North Korea
Chapter 2
Perception of North Korea
How has South Korean popular perception of the North changed into 2016? There were high hopes in the previous year (2015) that with the 70th anniversary of liberation from Japanese colonial rule and the division, it would be possible to achieve a breakthrough in inter-Korean relations. However, the freeze in relations between the two sides showed no sign of abating into 2016. The 25th August Agreement (2015) offered a reprieve from the immediate threat of a confrontation between the two sides. It was followed by meetings of the divided families in October and November 2015, but there was no further progress. At the start of 2016, the North Korean authorities undertook a fourth nuclear test on 6th January, claimed to have launched a satellite during a rocket test (7th February), and the Kaesong Industrial Zone (KIZ) on 10th February. The North Korean side responded to the closure of the KIZ by freezing KIZ-related assets on the same day and expelling South Korean personnel on 11th February. On 2nd March, the UN Security Council passed Resolution 2270, further intensifying the international sanctions regime targeting
the North. The US senate also unanimously approved H.R. 757, a set of sanctions (including financial sanctions), and this was subsequently signed by President Obama on 18th February. This was followed by Joint ROK-US Military Exercises (March-April 2016) that were publicized by the two sides in order to pressure the North. The exercises included amphibious landings, inland advances, practiced decapitation strikes on Kim Jong-un, and the deployment of strategic weaponry. In response, the Korean People’s Army Supreme command issued the following statement on 23rd February: “Our primary target is the Chongwadae [The Blue House], the center for hatching plots for confrontation with the fellow countrymen in the north, and reactionary ruling machines…The U.S. imperialist aggressor forces’ bases for invading the DPRK in the Asia-Pacific region and the U.S. mainland are its second striking target.” As if that were not enough, 13 North Korean overseas waiting staff defected on 7th April, and then Korean Worker’s Party overseas funds disappeared in June. Then came the dramatic defection of the deputy DPRK ambassador to the UK Thae Yong-ho in 17th August. Such high profile defections of core members of the regime led many to speculate that sanctions were finally working and that the elite was becoming divided. The events cited above also seemingly exercised influence over popular South Korean perception of the North.
At the same time, a number of important political events occurred inside North Korea during the year. For instance, celebrations were held for the 70th anniversary of party foundation, and in May 2016, the 7th Party Congress of the Korean Workers Party (KWP). The latter was
2016 Unification Perception Survey
64 65
Chapter 2 Perception of North Korea
the first time a party congress had been held in 36 years, and provided an institutional basis for Kim Jong-un’s rule. Kim was appointed First Secretary of National Defence Commission of the Democratic People’s Republic of Korea (DPRK), and he was then appointed head of the State Affairs Commission of the DPRK on 29th June at the 4th Meeting of the 13th Session of the Supreme People’s Assembly (SPA). The institutionalization of his rule was thus completed, 7 years after being designated successor, Kim Jong-un has achieved an institutional status comparable to Kim Il-sung and Kim Jong-il. Amidst intensifying international and South Korean sanctions, the North Korean state has sought to mobilize the North Korean people and blame the United States and South Korea for a worsening regional situation. The survey work for the 2016 Unification Perception Survey was conducted from 1st-22nd July, hence the results will not fully reflect conflicts that arose due to the decision to deploy THAAD. Other major events during the year, including reports of Thae Yong-ho’s defection (16th August), North Korea’s test of a Submarine-launched ballistic missile (SLBM) on 24th August, and the fifth nuclear test (9th September), also occurred after survey work was carried out and are thus not reflected in the results. It is important to be mindful of the period when survey results are reviewed.
1. Perception of inter-Korean relations – “what is North Korea to us?”
Survey participants were asked “What is North Korea to us?” and were given the following response options: “a partner we must cooperate with” (partner); “a place we must help” (in need of help); “a place we should compete with” (competitor); “a place we should be wary of” (a place to be wary of ); “a threat to our safety” (a hostile power). Of respondents, 43.7% said that North Korea was a partner, 21.6% said that it was a place to be wary of, 14.8% said it was a hostile power, 11.6% as in need of help, and 8.2% as a competitor.
As is clear from <Figure 1-2-1>, the number of respondents saying that North Korea is a partner rose by 8.5% from the previous year’s result of 35.2%. Conversely, the number who saw it as a hostile power fell to 14.6% having risen to 16.5% the previous year from 13.9% in 2014. The 25th August Agreement (2015), the 7th Party Congress of the KWP and the 70th anniversary of party foundation celebrations seemingly had a positive impact on popular South Korean perceptions. The 25th August Agreement concluded amidst high tensions, and the resulting meetings between divided families seemingly had a decisive effect.
In addition, such changes in public opinion can be interpreted as popular fatigue in the face of repeated crises originating from the North. Popular fatigue seemingly explains why the fourth nuclear test did not seriously impact popular opinion in the South. Of course, given that the survey period preceded other major events like the

2016 Unification Perception Survey
66 67
Chapter 2 Perception of North Korea
SLBM test announced on 24th August and the fifth nuclear test of 9th September, it remains to be seen whether such trends will persist. But it appears clear that ‘security crisis fatigue’ had a definite impact on survey results.
<Figure 1-2-1> South Korean perception of North Korea(Unit:%)
56.6 57.650.7
44.7 47.0 47.140.4
45.3
35.2
43.7
21.8 21.9
17.4 19.3 16.8 15.816.4 13.5
17.3
11.6
3.3 3.82.3 3.3 2.3
4.8 5.6 4.6 7.9 8.2
11.8 11.3
20.6 20.7 17.221.3 21.2 22.8 23.1 21.6
6.6 5.39.0 12.0 16.7
10.9
13.916.5
14.8
0
10
20
30
40
50
60
70
2007 2008 2009 2010 2011 2012 2013 2014 2015 2016
Partner For aid Competitor
Wary of Hostile Power
There were no statistically significant variations with respect to popular perception that could be accounted for by gender, occupation, or educational background. However, as <Table 1-2-1> makes clear, there exists substantial correlations between perception and the respondent’s regional background, religion, age, income level, social class, whether they live in an urban area or not, political ideology, and the party they supported. While in 2015, education was correlated with perception, was not in 2016. At the same time, the religion, regional
background, political ideology and the political party that respondents supported were correlated with specific views of North Korea.
<Table 1-2-1> South Korean popular perception of North Korea & relevant variables (2016)
(Unit:%)
Variable Perception of North Korea - Cooperative, Supporter, Cautious, Hostile Power
Area χ2=55.399 p=0.0000
Religion χ2=46.028 p=0.000
Age r=-0.077 p=0.007
Household Income χ2=31.050 p=0.013
Household Income Level χ2=45.485 p=0.000
Social Class (upper/mid/lower) χ2=36.298 p=0.014
Urbanization(City/Town/Country) χ2=29.844 p=0.0000
Political Leaning χ2=30.858 p=0.014
Political Party Support χ2=27.806 p=0.033
The region is an important factor in South Korean perception of the North. For 2016, a statistically significant variation of x2=55.399 and the p-value of p=0.0000 was found. 36.2% and 37.7% of respondents from Yeongnam and Chungcheong areas respectively said that North Korea was a ‘partner’, whereas 48.1% of respondents from the capital region and 47.9% of respondents from Honam responded the same way. At the same time, 30.7% of respondents from Yeongnam and 25.8% of respondents from Chungcheong answered that North Korea was a place to ‘be wary of ’. By contrast, 19.2% of respondents

2016 Unification Perception Survey
68 69
Chapter 2 Perception of North Korea
from Honam and 17.2% of respondents from the capital region gave the same response. As <Figure 1-2-2> makes clear: the number of Chungcheong and Honam residents who see North Korea as a potential partner declined year-on-year from 2015, while the number of residents in Yeongnam and the capital region responding similarly rose. The rise was particularly notable amongst those in the capital region responding this year: 48.1% in 2016 up from 31.9% in 2015. It appears that meetings of divided families that followed the 25th August Agreement strongly impacted popular opinion in the capital region.
<Figure 1-2-2> Year-on-year trends by region in the perception of North Korea as a partner
(Unit:%)
55.5 59.1
46.549.5 48.2
47.7
41.346.0
31.9
48.1
66.1
60.8 62.7
43.2
55.1
39.7
30.5
59.8
39.937.7
64.7 59.753.8
51.350.0
53.950.0 55.7
53.1
47.9
52.6 52.7 51.9
34.638.9
45.8
37.533.7
32.836.2
20
30
40
50
60
70
2007 2008 2009 2010 2011 2012 2013 2014 2015 2016
Capital Region Central Region
Honam Region Yeongnam Region
Variation was also observed amongst adherents of different religions. Believers in Buddhism (49.8%) and Protestantism (48.9%) were more likely to see North Korea as a partner than Catholics (37.1%) or those without a religion (40.0%). At the same time, more Buddhists (22.6%) and non-religious people (23.8%) were more likely to be ‘wary of ’ North Korea than Protestants (18.6%) and Catholics (18.6%). The number of protestants (16.0%) who considered North Korea to be in need of help was higher than adherents of other religions (Buddhists 6.6%, Catholics 12.9%) and the non-religious (11.2%). Conversely, those on lower incomes (21.8%) were more likely to express hostility toward the North than those on medium (15.8%, 15.2%) or high incomes (11.9%). At the same time, residents of large cities (48.9%) were more likely than residents of smaller cities (40.8%) or the rural areas (33.6%) to see North Korea as a partner. Eup/Myeon1 residents (32.6%) were more likely to express wariness regarding North Korea than residents of smaller cities (19.4%) or rural areas (21.1%). Compared to 2015, ideological variation was less evident; in 2015, progressives (40.6%) were more likely than centrists (35.3%) or conservatives (35.1%) to see North Korea as a partner, with conservatives (21.3%) more likely to see North Korea as a hostile power than centrists (15.7%) or progressives (13.2%). However, for 2016, conservatives (49.9%) were more likely than progressives (46.0%) or centrists (39.9%) to perceive North Korea as a partner,
1] Administrative units below the county level that have a minimum population of 20,000 and a
maximum of no more than 500,000.

2016 Unification Perception Survey
70 71
Chapter 2 Perception of North Korea
with conservatives (18.8%) nonetheless more likely to see North Korea as a hostile power than centrists (14.7%) or progressives (13.3%).
Perception of the North was also correlated with age. Responds in their 40s (47.9%), 50s (46.7%), and the over-60s (45.2%) were relatively more likely to perceive North Korea as a partner than people in their 20s (38.6%) or 30s (38.9%). As can be seen in <Figure 1-2-3>, in 2015, those in their 30s were least likely to see North Korean as a partner, but in 2016, the number for people in their 20s and 30s with such a view was almost the same. Conversely, those in the 40s, 50s and the over-60s were far more likely in 2016 than in 2015 to express such a view. It appears that the relief of the 25th August Agreement impacted all age groups aside from those in their 20s.
<Figure 1-2-3> North Korea as a ‘partner’ by age group(Unit:%)
52.6
59.0
61.6
41.9 40.7
47.8
31.6
41.536.9 38.6
54.9
60.060.8
49.952.4 48.2
44.446.7
31.6
38.9
57.6 57.7
45.2
52.8 51.146.6 47.9
39.0
47.9
41.9
53.3
45.2 42.2 41.9
42.138.4
44.646.7
20
30
40
50
60
70
2007 2008 2009 2010 2011 2012 2013 2014 2015 2016
20s 30s 40s 50s
The number of people in their 20s and 30s who see North Korea as a hostile power remains high. As can be seen in <Figure 1-2-4>, those in their 20s (17.7%) were most likely to respond that they saw North Korea as an enemy, with those in their 50s (11.8%) least likely, followed by people in their 40s (13.1%), the over-60s (15.9%) and 30s (16.7%). Wariness toward the North follows a similar trend: 20s (24.8%), 30s (24.2%), the over-60s (21.1%), 40s (19.7%), 50s (19.3%). Here again, people over 60 are the middle group bisecting the young and the middle-aged. Aside from those in their 30s, the perception of North Korea as a hostile power declined across all age groups.
<Figure 1-2-4> North Korea as a ‘hostile power’ by age group(Unit:%)
7.3 7.3 9.0
13.5
26.0
14.5
20.0
15.3
19.717.7
4.84.6
10.8 11.5
15.6
9.2
17.1
14.4
16.816.7
6.2 5.2 7.510.5 11.3
10.415.1
9.9
15.713.1
8.2
4.2
8.8
12.510.1
14.6
15.8
14.211.8
0
5
10
15
20
25
30
2007 2008 2009 2010 2011 2012 2013 2014 2015 2016
20s 30s 40s 50s

2016 Unification Perception Survey
72 73
Chapter 2 Perception of North Korea
2. Perception of change in North Korea and regime stability
How do South Koreans perceive change in the North and overall regime stability? The survey includes the following question on this subject: “how much do you think North Korea has changed over the last few years?” (North Korea Change). Respondents in the main (62.9%) gave critical responses saying that “it is not changing”, with 37.1% responding positively by saying that “it is changing”. The latter figure represents a slight drop from 38.2% of 2015, with 61.7% giving the negative response in 2015. However, such slight variation is not indicative of changing perception amongst the South Korean people.
Over the last few years, variation on the basis of age, political ideology, partisan loyalties, occupation, and social class with respect to positive responses to the North Korea change question have not been observed. At the same time, variation on the basis of education (xx2=23.892, p.0.004), religion (x2=35.740, p=0.000), income (x2=28.002, p=0.006), region (x2=47.715, p=0.000), and level of urbanization (x2=17.754, p=0.007) was discovered. With respect to education, middle school graduates (24.2%) were less likely than high school graduates (38.3%) and university graduates (39.3%) give a positive response about change in North Korea. While people with a religion (Buddhist 38.2%, Protestant 43.2%, Catholic 41.8%) had a more positive impression of change in North Korea than those without a religion (33.0%). At the same time, Catholics (17.9%) were more likely to respond that North Korea “was changing a lot” than
Buddhists (4.8%) or Protestants (9.2%). Overall, Protestants (43.2%) were most likely to say that North Korea was changing, followed by Catholics (41.8%), and Buddhists (38.2%). By region, responds from Chungcheong were, at 50.3%, the most likely in saying that North Korea was changing, with the capital region (37.7%), Honam (32.2%) and Yeongnam (33.1%) far behind. There was little variation on the basis of ideology – progressives (35.2%), centrists (37.7%) and conservatives (37.9%) having similar response patterns.
In response to the question “will the current North Korean regime remain stable going forward?” (Regime Stability), 60.0% said “it would likely be unstable”, more than six times higher than the number who responded that it would remain stable (9.7%). 30.3% responded ‘about the same’, giving a neutral response. There was no significant change in the number of respondents who saw North Korea as likely to be unstable going forward from last year, but the number predicting stability dropped from 14.4% in 2015. The neutral response, conversely, rose from 25.7% in 2015. In other words, the general outlook for the North Korean regime going forward has become more negative amongst South Koreans. On the question of regime stability, regional (x2=67.866, p=0.000), religious (x2=30.861, p=0.014), education (x2=22.274, p=0.000), and partisan (x2=31.888, p=0.000) variance was found significant. Regionally, Yeongnam (13.0%) residents were most likely to respond that North Korea would be stable going forward, followed by the capital region (9.7%) and then Honam (6.3%). Whereas it was Honam residents (72.6%) who were most likely to say that North Korea would be unstable in the future – followed by

2016 Unification Perception Survey
74 75
Chapter 2 Perception of North Korea
the capital region (61.4%), Chungcheong (55.9%) and Yeongnam (51.8%). Over the last three years, the percentage of Honam residents who see North Korea as remaining stable going forward has dropped from 15.5% in 2014, to 11.7% in 2015, and hit just 6.4% in 2016. In the capital region its corresponding percentage dropped from 17.5% in 2015 to 9.7% in 2016. Conversely, Yeongnam rose to 13.0% in 2016 from 9.9% in 2015.
3. Trust in the North Korean regime
1) The North Korean regime as a partner in dialogue and compromise
It seems that the South Korean people have different attitudes with respect to North Korea as a partner in negotiations and the ‘realities’ of the North Korean political system. Thus, the survey asked the following question: “Do you think that the North Korean government can be a partner in dialogue and compromise aimed at unification?” (Level of Trust). A full 69.5% said no, twice as many (30.5%) as those who responded yes. Yet this represented a small rise in the number answering yes from 2015 (28.7%). Generally, since 2009, the number of those responding that North Korea could be trusted as a partner has decreased – from 40.9% in 2009, rose in 2012 to 39.3%, before declining to 27.5% in 2014. In 2015, it rose to 28.7%. Nonetheless, in spite of these intermittent rises, the low number indicates a high degree of distrust in the North Korean government.
Statistically significant variation in the levels of trust toward the
North Korean government was found amongst the regions (x2=50.399, p=0.000), levels of urbanization (x2=22.352, p=0.001), household income (x2=28.774, p=0.004), ideology (x2=45.560, p=0.000) and partisan loyalties (x2=49.462, p=0.000). As can be seen in <Figure 1-2-5>, regionally, the variation is quite pronounced. The capital region had more respondents at 28.1% in 2015 that trusted the North Korean government than in 2014 (23.2%), but in 2016, the percentage again dropped to 24.8%. Honam saw no change (32.3% → 32.2%), while both Chungcheong (28.7% → 34.9%) and Yeongnam (28.2% → 37.0%) saw rises in the number of residents responding that the North Korean government could be trusted as a partner in dialogue and compromise. The latter is probably because these regions were more inclined to trust the conservative administration in Seoul as creating a policy environment conducive to productive dialogue with the North.
<Figure 1-2-5> Trust in the North Korean government by region: the possibility of dialogue and compromise
(Unit:%)
38.736.3
40.641.6
36.8
23.228.1
24.8
43.2 40.7 41.0
33.6
44.9
35.228.7
34.9
63.951.3
39.7
58.3
44.7 38.732.3
32.234.3
25.328.5 26.9
26.728.2
37.0
10
20
30
40
50
60
70
2009 2010 2011 2012 2013 2014 2015 2016
Capital Region Central Region
Honam Region Yeongnam Region

2016 Unification Perception Survey
76 77
Chapter 2 Perception of North Korea
There was a high degree of correspondence between ideology and trust in the North Korean government (x2=45.560, p=0.000). Over previous years, progressives have been most inclined to trust the North Korean government, followed by centrists, with conservatives being most likely to indicate toward distrust. As is clear from <Figure 1-2-6>, such a trend has remained uniform with the exception of 2014, when centrists indicated less trust in North Korea than conservatives, but the overall trend returned in 2015 and was maintained into 2016.
<Figure 1-2-6> Trust in the North Korean government by ideology: the possibility of dialogue and compromise
(Unit:%)
56.1
43.146.6
49.144.6
33.3 35.438.740.1
34.3 33.137.4
38.3
24.6
28.930.1
28.223.8
22.5
32.1
22.4
26.1
22.2 22.1
10
20
30
40
50
60
2009 2010 2011 2012 2013 2014 2015 2016
Progressive Centralist Conservative
Generationally, variation was not statistically significant at 0.05 level (x2=19.545, p=0.076), but a correlation was found (r=-0.065, p=0.025). As can be seen in <Figure 1-2-7>, responses were grouped generationally and assessed. Nonetheless, in 2016, age-group trends
were evident. People in their 20s (24.1%) were least likely to trust the North Korean government, followed by people in their 30s (29.6%). The responses of people over 60 (31.6%) and in their 50s (31.9%) were almost identical, while it was people in their 40s (34.1%) that were the most likely to indicate that the North Korea government could be trusted.
<Figure 1-2-7> Trust in the North Korean government by age group: the possibility of dialogue and compromise
(Unit:%)
41.8
34.3 29.835.7
34.0
24.8 23.4 24.1
42.238.5
38.6
41.840.7
28.1
30.6
29.6
43.7
38.4
41.0
43.6
37.7
27.6 27.1
34.135.6
27.9 28.1
36.2
31.6 28.7 31.9
20
25
30
35
40
45
2009 2010 2011 2012 2013 2014 2015 2016
20s 30s 40s 50s
2) Will North Korea give up its nuclear weapons?
83.8% of survey respondents indicated that they believe ‘North Korea will not give up its nuclear weapons’ – i.e. that denuclearization will be far from easy and may not be a realistic goal. North Korea under Kim Jong-un declared itself to be a nuclear state in the April 2012 revision
2016 Unification Perception Survey
78 79
Chapter 2 Perception of North Korea
to North Korea’s constitution. The March 2013 ‘Dual Development of the Economy and Nuclear Weapons line’ (Byungjin) made the development of nuclear weapons an explicit goal of the state, thus leading to further scepticism about the potential for denuclearization of North Korea. On 6th January 2016, North Korea tested nuclear weapons for the fourth time, and then, on 9th September 2016, they conducted their fifth nuclear test. Under such circumstances, it is not surprising that over the last four years a similar number (84.6% in 2013, 88.0% in 2014, 86.3% in 2015, and 83.8% in 2016) of respondents have indicated that they did not believe North Korea would give up their nuclear weapons. There was a strong correlation by region (x2=44.432, p=0.001), but a regional breakdown of the data reveals little difference, with 82.7% of residents of the capital region, 88.6% of Chungcheong, 85.3% of Honam, and 83.5% of Yeongnam residents indicating that they did not believe North Korea would give up its nuclear weapons. Interestingly, in Honam the number actually dropped by 10.1% from the 2015 figure of 93.4%. In the wake of the second nuclear test in 2009, the percentage of responds who believed North Korea would not give up its nuclear weapons jumped 12% from 71.7% to 83.7%, but after the third nuclear test, there was little change (85.9% → 84.6%), and after the fourth test, the number actually dropped (86.3% → 83.8%). Thus, nuclear tests no longer have much effect on how people respond to this question, or on South Korean perception of North Korea’s possession of nuclear weapons.
4. Perception of North Korea as a threat
1) Threat perception of North Korean nuclear weapons
A full 79.5% of respondents indicated that they either found North Korea’s nuclear weapons to be ‘very threatening’ (27.2%) or ‘quite threatening’ (52.3%). This number is similar to 2013 survey result of 79.5%, with survey work conducted the same year as the third nuclear test. In spite of the fourth nuclear test conducted in 2016, respondents were less likely than in 2014 (89.3%) or 2015 (84.0%) to indicate that they found North Korea’s nuclear program threatening. The perceived threat of North Korea’s nuclear program was greatest after the first nuclear test, but the effect of North Korean nuclear tests on popular perception in South Korea has exponentially declined in significance. Hence, with the third and fourth nuclear tests, the perceived threat did not noticeably increase. Seen in such a light, it seems likely that the fifth test will similarly have little impact on popular perception.
Threat perception of North Korea’s nuclear program varies according to region (x2=39.499, p=0.001), partisanship (x2=31.855, p=0.001), occupation (x2=35.687, p=0.002), and level of urbanization (x2=24.763, p=0.000). Regionally, Yeongnam (85.1%) and Chungcheong (84.1%) were on the relatively high side, while progressives (83.7%) also rated the threat higher than conservatives (80.3%) or centrists (77.0%). Over time, threat perception rose from 61.3% in 2009 to 74.3% in 2010, and in 2011 hit 80.7% in the wake of the sinking of the Cheonan, before peaking in 2014 at 89.4%. In 2015, it fell slightly to 84.0%, and declined further to 79.5% in 2016. Yet, in spite of this

2016 Unification Perception Survey
80 81
Chapter 2 Perception of North Korea
perceived threat, only about half (52.9%) of respondents indicated that they believed South Korea should also arm itself with nuclear weapons – down from 55.8% in 2015.
2) Potential of a North Korean military provocation
Subsequent to the fourth nuclear test, there is growing anxiety about the potential of a North Korean military provocation directed at South Korea. In 2016, 66.1% indicated that they believed there was a possibility of such a provocation, twice the number who said that there was no such possibility (33.9%). This represented a 4.4% drop on 2015. Yet again, the number of people who indicated that such a possibility existed peaked in 2014 at 74.9% before declining through 2015 (70.5%) and 2016. Detonation of North Korean mines on the DMZ, repeated North Korean threats to hit South Korean loud speakers directed at the North, continued nuclear tests and UN Sanctions might lead you to expect that possibility of military provocations had increased, yet survey data does not bear this point out. The 25th August Agreement of 2015, and the subsequent warming of relations seemingly influenced popular perception far more than repeated nuclear tests or further rounds of sanctions. It would appear that the South Korean populace has become increasingly inured to these kind of North Korean actions.
In this regard, how do they differ from North Korean perceptions of South Korea? The same question in reverse was given in another survey project undertaken by the same institute to a set of North Korean defectors who came over to South Korea within the preceding
year, “How likely do you think it is that South Korea will engage in military provocations directed at North Korea?” A majority of North Korean respondents (57.2%) said that it was possible as opposed to 42.8% saying that was not. In other words, North Koreans have a similar sense of the South as a potential military threat. As can be seen in <Figure 1-2-8>, the number of respondents who would not rule out such a possibility increased from 2015 (48.6% → 57.2%); while South Korean fear of a North Korean provocation has declined, North Korean fears of a provocation originating from the southern side have risen. This appears to be because of South-North military confrontations, ROK-US Joint exercises, and the extreme way they have been presented in North Korean propaganda. North Korea has sought to maximize tensions on the peninsula for internal regime stability and social cohesion, going so far as to declare a ‘semi-war state’.
<Figure 1-2-8> Inter-Korean perceived threat of military provocation(Unit:%)
52.2
63.6
78.3
68.966.0
74.970.5
66.1
31.438.8
61.154.6 45.9
63.7
48.6
57.2
20
30
40
50
60
70
80
90
2008 2009 2011 2012 2013 2014 2015 2016
South Korea North Korea

2016 Unification Perception Survey
82 83
Chapter 2 Perception of North Korea
There was a statistically significant relationship between such perceptions of South Koreans towards North Korean military provocation and the region (x2=71.587, p=0.000), levels of urbanization (x2=15.843, p=0.015), occupation (x2=27.205, p=0.027), education (x2=16.949, p=0.050), and ideological tendencies (x2=31.340, p=0.002). Regionally, variation was substantial. While overall, fear of a North Korean military provocation fell by 4.4%, the number actually rose in Yeongnam and Chungcheong, while falling dramatically in the capital region and Honam. As is evident from <Figure 1-2-9>, the perceived threat of a North Korean provocation rose by 6.9% in Yeongnam between 2015 and 2016 (58.1% → 65.0%) and 5.1% in Chungcheong (64.5% → 69.6%). Conversely, the perceived threat dropped by 11.4% in the capital region (76.9% → 65.5%) and 12.5% in Honam (74.6% → 62.1%).
<Figure 1-2-9> Perceived threat of a North Korean military provocation by region
(Unit:%)
62.9
46.1
68.769.3
83.9
73.4
68.4
78.9 76.9
65.5
60.2
66.2
57.6
72.0
80.8
54.3
73.7
74.6
64.5
69.6
56.3
65.164.7
73.171.6
59.1
69.376.0
74.6
62.1
55.151.2
54.658.6
71.267.9
57.7
66.0
58.1
65.0
40
50
60
70
80
90
2007 2008 2009 2010 2011 2012 2013 2014 2015 2016
Capital Region Central Region
Honam Region Yeongnam Region
There was a high degree of correlation between satisfaction with the then-current government and the perceived threat of a North Korean provocation (x2=52.310, p=0.000), and policy satisfaction was also closely correlated to the region of respondents (x2=72.876, p=0.000). Considering these statistical relationships, it is reasonable to argue that a sense of security, or rather insecurity vis-à-vis North Korea is closely correlated with support for the government. Thus, up until now, generally those regions that trust the government more have tended to be less inclined to believe that a military provocation is likely, and vice versa.2 However, this year, the opposite was observed. Respondents from Yeongnam and Chungcheong were more likely to indicate that they feared a military provocation than last year, and a far smaller number of respondents from Honam and the capital region were inclined to say so. These results can be interpreted in two ways. Perhaps people from Yeongnam and Chungcheong blame the North for the rising threat, while people from Honam and the capital are less inclined to believe that such a threat exists. Or people from Yeongnam and Chungcheong may more likely perceive the threat of a provocation from North as being real, whereas people from Honam
2] There is a tendency that under progressive governments, progressive groups are less likely
to feel threatened by North Korea expecting improvement of inter-Korea relations would bring
peace into their peninsula, while conservative groups feel the opposite as they in principle dis-
trust the government’s view of national security; conversely, under conservative governments,
the former is more likely to perceive threats as the governments take hostile attitudes toward
North Korea elevating level of tensions between the two Koreas, while the latter feel less threats
as they believe a hard line stance toward North Korea is good for their national security (2008,
2009, 2014 Unification Perception Survey, IPUS, Seoul National University).

2016 Unification Perception Survey
84 85
Chapter 2 Perception of North Korea
and the capital are more likely to believe that such a threat can be politically resolved.
Political persuasion and fear of the North Korean threat were statistically correlated to a meaningful degree, x2=31.340, p=0.002. Centrists (66.8%) were slightly more likely than progressives (66.5%) and conservatives (64.3%) to believe that a North Korean military provocation was possible. However, the difference was not large. Usually, ideology is significantly correlated with security. Progressives are inclined to believe that the hard-line policies that conservative governments pursue make the country less secure. While conservatives are more likely to believe in such policies and thus believe that North Korea would be less likely to engage in military provocations under a conservative government. The reverse is true under a progressive administration. Such differences become less significant the more overall fear there is of a provocation, and vice versa.
There was no significant relationship with age, but there does nonetheless appear to be a meaningful trend. Fear of the North Korean threat is usually highest amongst those in their 20s, but in 2016 for the first time, it was people in their 30s (69.8%) who were most likely to express such fears.3 These trends can be seen in <Figure 1-2-10> in which the 30s showed the highest level of fear in 2016 while it had been second behind the 20s until then.
3] In answers to the question “How likely do you think it is that war will break out on the Korean
peninsula?” there was a statistically significant correlation by age (0.032), sex (0.044), occupa-
tion (0.036), household income (0.005), region (0.000) and political persuasion (0.006).
<Figure 1-2-10> Perception of the possibility of a North Korean military provocation by age group
(Unit:%)
53.2
66.6 64.171.0
74.6
86.1
74.9 74.880.8
74.5
66.9
35.8
59.9
51.8
64.869.6
77.9
68.4 70.575.9
71.0 69.8
40.0
54.4 48.9
60.063.3
75.8
67.4
59.0
72.770.0
63.1
43.2
57.7
43.3
58.261.3
74.9
66.362.0 72.0
65.7
30
40
50
60
70
80
90
2005 2007 2008 2009 2010 2011 2012 2013 2014 2015 2016
20's 30's 40's 50's
5. Closeness to North Korean society
1) Awareness of North Korean society
In order to determine how knowledgeable South Koreans were about the North, six items (events and ideas) were selected to form the basis for questions. Compared to 2015, awareness about all items (except North Korean markets called Jangmadang) – Songun (military-first) politics, the Juche Idea, the Chollima Movement, the Arduous March et al. – fell significantly. As can be seen in <Figure 1-2-11>, knowledge of the concept of Songun Politics fell by 6.9% (67.6% → 60.7%), knowledge of the Juche Idea fell from 81.0% to 74.1%, knowledge of

2016 Unification Perception Survey
86 87
Chapter 2 Perception of North Korea
the Chollima Movement fell from 77.4% to 69.0%, and knowledge of the Arduous March fell from 68.0% to 64.3%. Conversely, knowledge of North Korean markets rose by 3.6% from 55.7% to 59.3%. The 2016 survey was the first to ask about the Moranbong Band, and a full 87.6% of respondents had heard of it. The drop in recognition in most of these items seems to have resulted from North Korea’s nuclear tests and UN sanctions targeting the North that led exchanges between the two Koreas to have stopped.
<Figure 1-2-11> Awareness of North Korean society(Unit:%)
46.245.5
45.5 52.158.8 58.1
58.157.7
67.6 60.7
81.778.3 78.0 81.2 83.2
78.2 77.1 77.5 81.074.1
75.0 78.273.6
77.973.8
72.4 68.9 72.077.4
69.0
45.7
44.7
53.059.7 58.3
53.6
60.068.0
64.3
38.4 37.520.6 32.3
39.1 35.8 38.447.5
55.7 59.361.2 66.261.0
66.7 64.4 60.9 62.6 60.768.2
87.6
20
30
40
50
60
70
80
90
2007 2008 2009 2010 2011 2012 2013 2014 2015 2016
North Korea’s “military first” policy Juche Idea
Chollima movement Arduous March
Market Places in North Korea Moranbong band
2) North Korea-related experience and differences between South
and North
The number of respondents indicating that they had North Korea-related experience fell in almost all areas surveyed. 2.1% (down from
3.7%) of respondents indicated that they had visited the North (as part of a tour to Mount Kumgang, Kaesong, Pyongyong etc.), 14.2% (down from 18.4%) said that they had met a North Korean defector. 21.6% (down from 23.2%) of respondents said that they had encountered North Korean broadcasts, films, novels or other media, while 0.6% (unchanged) of respondents said that they had been involved in aid-related groups or activities targeting the North. In 2008, Mount Kumgang tours were stopped, following the sinking of the Cheonan in 2010 visits to Pyongyang were restricted, and on 11th February 2016 even the Kaesong Industrial Complex was closed. Exchanges between South and North have thus rapidly diminished. Similarly, a full 2,900 North Korean defectors came to South Korea in 2009, but in 2015, the number of new defectors entering the South had fallen to 1,275. And as of late June 2016, just new 749 defectors had come to the South in 2016. It appears that this gave rise to the fact that fewer respondents indicated having met North Koreans. North Korean websites remain blocked in South Korea, thus few ready opportunities for access to North Korea media in the South exist. While North Korean programming can be accessed on Youtube, frozen relations seemingly limit interest amongst the South Korean public.
Respondents indicated that they felt a serious sense of difference between the two Koreas with respect to how elections are conducted (92.4%), social welfare provision (94.9%), language usage (81.3%), customs (77.8%), and the importance of the family (64.6%). The average over all items is 82.2% –implying that eight in ten South Koreans view the two Koreas as substantially different. The following changes were

2016 Unification Perception Survey
88 89
Chapter 2 Perception of North Korea
made on the items surveyed this year: ‘historical perspectives’ was deleted, while ‘standard of living’ was replaced with ‘social welfare’, and the ‘value system’ item was replaced with ‘the importance of the family’. Whereas a full 91.0% of respondents in 2015 said that there was a difference in the ‘value system’ between the two Koreas, only 64.4% of respondents in 2016 indicated that they saw a difference in how the people of two Koreas rated the importance of the family. This had a decisive impact in the overall inter-item average in responses to this battery of questions. Hence, the average across items dropped from 87.6% in 2015 to 82.2% in 2016, but this reflects a change in items rather than an actual change in perception.
Compared to South Koreans, North Koreans have heightened feelings of difference. Of course, it is difficult to make objective comparisons due to changes in response items described above, but it appears that North Koreans do indeed perceive greater differences between South and North than their southern counterparts. As <Table 1-2-2> indicates, even in responses to the items that were asked in the same manner (elections, language, customs etc.), North Koreans are found to have a heightened sense of difference than South Koreans. Arguably this is because they have experienced both societies, so feel many of the differences far more directly.
<Table 1-2-2> Sense of difference between the two Koreas (2016)
(Unit:%)
South Koreans North Koreans
Election procedure 92.4 94.2
Social Welfare 94.9 96.4
Understanding of History - 94.9
Use of language 81.3 93.5
Customs 77.8 89.1
Importance of family 64.6 90.6
Average 82.2 93.1
6. Sub-conclusion
Respondent’s perception of the North in the 2016 survey can thus be summed up as follows. First, more respondents were inclined to see North Korea as a partner rather than a hostile power. The number giving the former response rose from 35.2% to 43.7% (an 8.5% rise), while the number giving the latter response fell from 16.5% to 14.8% (a 1.7% drop). This arguably reflects a substantive change in perception of the North, but the number of respondents saying they saw North Korea as a partner in 2015 hit a nadir for the entire period that the survey has been undertaken. It was thus an exception, with this year’s result appearing to constitute a return to the norm. In 2016, in spite of North Korean provocations like the fourth nuclear test, the fact that more respondents were inclined to see North Korea as
2016 Unification Perception Survey
90 91
Chapter 2 Perception of North Korea
a partner indicates that the 25th August Agreement (2015) seems to have had a decisive impact, and South Koreans have become inured to crises emanating from the North Korea.
Second, distrust of the North Korean government and fear of provocations decreased. The latter dropped from 74.9% in 2014 to 70.5% in 2015, and again fell in 2016 to 66.1%. Trust in North Korea – the perception of the North as a partner in dialogue and potential compromise – also rose from 28.7% in 2015 to 30.5% in 2016. Despite louder North Korean opposition to US-ROK Joint Military exercise, and the threat of potential provocations, the surprise visit of three senior figures in the North Korean regime (October 2014), the 25th August Agreement (2015) and the subsequent meetings of separated families in October and November 2015 seem to have given relief and hope to many South Koreans. Amidst continued military tensions, there is hope that cooperation can ultimately relieve tensions and distrust between the two sides.
Third, such changes in perception have resulted in clear cleavages emerging across different generations, regions, classes, political persuasions. In 2014, fear of a military provocation encroached upon other factors, resulting in convergence with respect to views of unification. However, in 2015 and 2016, clear differences between different age groups, regions and political groupings emerged. Since those in their 50s and above 60 were further subdivided in the survey sample in 2015, interesting patterns become visible across age groups; those in their 20s and 30s elicit similar response patterns on one side, and the responses from those in their 40s and 50s are clustered on
the other side, while those over 60 are placed roughly in the middle. Respondents in their 40s (47.9%) and 50s (46.7%) were most likely to see North Korea as a partner, while respondents in their 20s (17.7%) and 30s (16.7%) were most likely to see North Korea as a threat, with those above 60 fitting between the two groups. People in their 40s (34.1%) exhibited the highest degree of trust in North Korea, while they perceived a military provocation from the North as least likely (63.1%). Conversely, it was those in their 30s who most feared a provocation.
Fourth, regional differences across nearly all items related to perception of the North were evident. Respondents in the capital region (48.1%) and Honam (47.9%) were more likely to see North Korea as a partner, while respondents from Chungcheong (37.7%) and Yeongnam (36.2%) were less likely to say so. Similarly, respondents from capital region and Honam were far less likely to say they feared a provocation from the North in 2016 than in 2015, while numbers rose amongst respondents from Chungcheong and Yeongnam. Meanwhile, respondents from Yeongnam (37.0%), Chungcheong (34.9%), and Honam (32.2%) were more likely to see North Korea as a potential partner in dialogue and compromise, while respondents from the capital province (24.8%) were less likely to do so. Yeongnam and Chungcheong have exhibited a similar tendency from 2015 to 2016, but it is shown that the capital region diverged from them in 2016.
Fifth, there was a clear variance detectable on the basis of respondent’s political ideology across a range of items including perception of the

2016 Unification Perception Survey
92 93
Chapter 2 Perception of North Korea
North, trust in the North Korean government as a potential partner, and fear of a North Korean provocation. The “Do you think North Korea is a potential partner in dialogue and compromise?” question has usually been most closely to the political ideology of the respondent. In 2014, centrists gave responses that were more similar to conservatives, but this proved to be the exception to the rule, with a previous trend of distinct, politically patterned responses returning in 2015 and 2016.
To sum up, relative fear of provocations emanating from the North declined in 2016, while more respondents indicated that they saw North Korea as a potential partner. Inter-generational, regional and ideological variations became yet more distinct. Respondents in their 40s and 50s were most inclined to see North Korea in a positive light, while respondents in their 30s and 20s formed a single group. At the same time, the capital region evinced a yet more distinct response profile over previous years, and variation by the ideology of respondents was even more evident than in previous years. The fact that the fourth nuclear test did not exert particular influence on attitudes toward the North seemingly speaks to the effect of the 25th August Agreement (2015), while the South Korean public seemingly has become tired of sanctions and pressure in the face of continued crises emanating from the North. It does not appear likely that North Korea’s continued provocations like the SLBM launches and fifth nuclear test will prevail over the South Korean public’s security fatigue. Rather, it appears more likely that differences in perception will further deepen along generational, regional and ideological lines.

94 95
Chapter 3 Perception of the Government’s North Korea Policy2016 Unification Perception Survey
Chapter 3
Perception of the Government’s North Korea Policy
1. Introduction
2016 will be remembered as a year when all South-North exchanges that had begun with the passage of the South-North Exchange and Cooperation Act of 1990 were halted – aside from tuberculosis-related aid programs. The Kaesong Industrial Complex (KIC) was the final South-North cooperation project still operational after the implementation of the 24th May Measures in 2010, thus its closure was symbolically significant.
This resulted from North Korea’s provocative behaviour at the beginning of 2016, namely, the fourth nuclear test, the launch of a satellite, further tests of medium range missiles and new missile engines, as well as the fifth nuclear test. This marked an unprecedented year in the history inter-Korean relations of aggressive and open missile and nuclear development by North Korea. The 7th Party Congress,
held 36 years after the last such event was an internal event that did not yield signs of the changes that the international community had hoped for.
The aggressive moves made by the North Korean regime have led to further strengthening of the international sanctions regime. Even North Korea’s membership of the UN has been called into question by sanctions passed by the UN Security Council.4 And together with sanctions passed by US Congress5, specific sanctions targeting the North Korean Workers Party and North Korea’s security organs,6 and the designation of entities suspected of laundering the funds of the North Korean regime7 represent an unprecedentedly tough set of measures. What’s more, growing calls worldwide for the prosecution of Kim Jong-un for human rights abuses at the International Criminal Court reflect the deepening isolation of Pyongyang.
Despite such developments, however, North Korea has explicitly confirmed that it will not change, and has refused to change its
4] United Nations Security Council. 2016. “S/RES/2321 (2016) Non-proliferation/Democrat-
ic Peoples Republic of Korea,” November 30. http://www.un.org/en/ga/search/view_doc.
asp?symbol=S/ RES/2321
5] U.S. Congress, “H.R.757 - North Korea Sanctions and Policy Enhancement Act of 2016,”
(2016.2.18). https://www.congress.gov/bill/114th-congress/house-bill/757.
6] U.S. Department of the Treasury. 2016. “Treasury Sanctions North Korean Senior Officials and
Entities Associated with Human Rights Abuses,” July 2. https://www.treasury.gov/press-center/
press-releases/Pages/jl0506.aspx.
7] Department of the Treasury, “Department of the Treasury, Financial Crimes Enforcement Net-
work Finding That the Democratic Peoples Republic of Korea Is a Jurisdiction of Primary Money
Laundering Concern,” (2016.6.2). https://www.fincen.gov/sites/default/files/federal_register_
notices/2016-08-02/2016-13038.pdf.

96 97
Chapter 3 Perception of the Government’s North Korea Policy2016 Unification Perception Survey
behaviour in ways to facilitate cooperation with the international community in general, and the United States and South Korea in particular. The North Korean government has claimed to have acquired a working hydrogen bomb in the wake of the fourth nuclear test, and to have perfected a standardized nuclear warhead after the fifth nuclear test. They have also said that they are finishing preparations for the test of an ICBM that could strike the continental United States. They proudly tell the world that they are a ‘powerful nuclear state in the East’. At the same time, they continue to expand their conventional weapons potential. The North keeps seeking to develop its military capabilities centered on its nuclear weapons, overtly asserting that it will not hesitate to deliver a first strike. In short, there are no signs of change. Of course, signs of difficulties internally have also been in evidence. The regressive and isolationist slogans that the North Korean regime makes use of (“self-strength first, self-reliance, and overcoming hardship through one’s own energy”) point to this fact. Nonetheless, North Korea has muddled through, and its economy is seemingly showing some signs of recovery. Partially thanks to favourable weather conditions, North Korea’s cereal production is estimated to have increased by 7% in 2016 from the 2015 figure.8
8] Rural Development Administration, “In spite of flood damage, North Korean cereal production
up by 7%,” RFA 21st December 2016, http://www.rda.go.kr/board/board.do?catgId=&menu_
id=pun&boardId=farmprmninfo&sea rchKey=&userJumin=&searchVal=&searchSDate=&prgId=
day_farmprmninfoEntry&portlet_kind=default&portlet_rowCnt=4&mode=view&portlet_gubun=
1&currPage=1&CONTENT2=&searchEDate=&CONTENT1=&nckUserNm=&list_kind=news&CO
NTENT3=&dataNo=100000728828&CONTENT 5=&menu_nm=%C8%AB%BA%B8%B4%BA
%BD%BA&totalSearchYn=Y#script.
Such trends cast doubt on the effectiveness of the South Korean government’s North Korea policy. Pressure and sanctions have not only failed to change North Korean behaviour, but continued tensions have led to growing fatigue with the current line amongst the South Korean public.
This chapter thus examines both how satisfied the South Korean public is with the fourth year of the North Korea policy pursued by the Park Geun-hye government and what kind of policy the South Korean people would prefer – an especially important issue in a year in which so much has happened in inter-Korean relations.
2. Satisfaction with the government’s North Korea policy
For the first time in 2016, the fourth year of the Park Geun-hye administration, less than half of respondents indicated satisfaction with the government’s North Korea policy, with only 45.1% of respondents indicated approval of the administration’s handling of the North Korea issue. This represented a 5.3% fall on 2015, and an 11.6% fall on 2013’s 57.6%. Park became President in 2013 soon after North Korea’s third nuclear test. In such difficult circumstances, after her initial North Korea policy of a “Trust Process on the Korean Peninsula” faltered, she gave a speech in which she argued that unification would be a bonanza (“Daebak” in Korean). She then pursued a ‘principled’, hard-line policy toward the North that went so far as to encourage the defection of North Koreans and their arrival in

98 99
Chapter 3 Perception of the Government’s North Korea Policy2016 Unification Perception Survey
South Korea. Nonetheless, popular approval has continued to decline.Of course, this can be seen as a popular judgement on a set of policies
that have yielded no visible successes. At the same time, approval ratings in this area are unprecedentedly high for the President’s fourth year in office when compared to either Roh Moo-hyun or Lee Myung-bak’s North Korea policy approval ratings. This seemingly reflects a popular recognition of the difficulties that Park’s administration faces in dealing with North Korea’ provocative behavior. Yet, whilst the South Korean people may believe that in principle, a resolute response is best in dealing with North Korean provocations, there appears to be little chance of a solution to the problem. Thus, the South Korean people seemingly feel increasingly burdened with and tired of rising tensions and the problems it causes. As a result, dissatisfaction has risen faster than might have been hoped or even expected.
<Figure 1-3-1> Percentage of respondents satisfied with the government’s North Korea policy
(Unit:%)
30.2 34.1 31.8
39.5 40.0 34.3
57.6 53.7
50.4 45.1
0
10
20
30
40
50
60
70
2007 2008 2009 2010 2011 2012 2013 2014 2015 2016
Satisfied
Aside from respondents in their 50s (+0.6% on 2015), respondents from all other age groups were less likely to be satisfied with the North Korea policy of the Park administration. Specifically, compared to 2015, 10.8% fewer respondents in their 30s expressed approval, 9.9% fewer respondents over 60, 5.9% fewer respondents in their 40s, and 2.0% respondents in their 20s did the same.
Amidst such declining poll numbers, it was the falling approval of those over 60 – some of Park Geun-hye’s most reliable supporters - which stood out. While this fall in approval was not the largest, given the conservative sensibilities of those over 60, their loss of confidence in a hard-line set of policies speaks to growing negative attitudes toward rising tensions and seemingly intractable issues.
<Figure 1-3-2> Satisfaction with government North Korea policy by age group
(Unit:%)
31.0
28.4 29.1
36.0 32.9 31.8
52.8 50.1
43.0 41.0 34.4
31.6
27.2
36.9 36.1
31.2
55.3 50.2
47.2
36.4
24.9
37.0
33.1 38.7 42.3
33.6
56.1
48.9 49.1
43.2
30.4
35.7 37.9
42.3 46.5 37.5
60.4 62.5
54.1 54.7
30.6
46.3
39.1
58.1
47.2 44.2
73.0
61.8 59.4
49.5
20
30
40
50
60
70
80
2007 2008 2009 2010 2011 2012 2013 2014 2015 2016
20s 30s 40s 50s 60+

100 101
Chapter 3 Perception of the Government’s North Korea Policy2016 Unification Perception Survey
The level of support for the administration’s North Korea policy indicates that there does exist some agreement with the administration’s view that cooperation with the North must be frozen as long as the North Korean nuclear issue remains unresolved. Regardless of age, those who express satisfaction with the Park administration’s policies were more likely to favour the freeze in cooperation. However, when results are examined closely, this trend is pronounced for those in their 20s and those over 60, but not for those in their forties among which the rates of responses in favour of the freeze are more or less the same whether they approve Park’s policies or not. Amongst supporters of Park’s policies in their 20s, 15.9% more respondents agreed that all cooperation should cease before the nuclear issue was resolved than their non-supporter counterparts; 13.3% of difference in the percentage of responses supportive of the freeze was found between the supporters and non-supporters in over 60. Conventionally supportive of Park Geun-hye, the growing disapproval of those over 60 indicates dissatisfaction with the closure of the Kaesong Industrial Complex. This growing disquiet with existing policies is of particular significance.
<Figure 1-3-3> Support for/opposition to the view that all cooperation should cease until the nuclear issue is resolved by age group and by
satisfaction with North Korea policy(Unit:%)
46.8 45.742.5
45.4 46.4
30.937.1
41.439.3
33.1
20
25
30
35
40
45
50
19-29 30-39 40-49 50-59 60+
Satisfied Not satisfied
In 2007 – the first year of the survey – respondents with a university education or higher were highly supportive of the Roh Moo-hyun administration’s policy of peaceful prosperity. They have also been far less supportive of policies pursued by the conservative administrations of Lee Myung-bak and Park Geun-hye, be it the Lee government’s Vision 3000 or the Park administration’s Trust Process than those with less education. In 2016, in particular, the number of university-educated respondents approving of the government’s North Korea policy fell by 8.3% to under 40%. At the same time, those with either a high school (-4.9% on 2015) or middle school (-2.5%) education also elicited less support for the government’s policy, converging around the 50% mark.

102 103
Chapter 3 Perception of the Government’s North Korea Policy2016 Unification Perception Survey
<Figure 1-3-4> Satisfaction in the government’s North Korea policy by educational attainment of respondents
(Unit:%)
28.9 34.3
40.2
46.2 45.9 39.6
59.6 59.2
53.4 50.9
28.2
37.1
35.6
41.6 44.2
36.3
62.1
54.7 54.2
49.3
32.5
31.1 26.6
36.9 35.4 31.2
51.8 51.8 46.5
38.2
20
30
40
50
60
70
2007 2008 2009 2010 2011 2012 2013 2014 2015 2016
Middle School or less High School College or more
Regionally, every part of the country aside from Jeju saw declining support for the government’s North Korea policy – with Gangwon (-12.9%) witnessing the largest fall in support. Yeongnam was the only region in which more than half of respondents (55.3%) continued to express satisfaction with the government’s policy, while only 26.6% of Honam residents were of the same opinion. These two regions represent the polar opposites of opinion on this issue in the polling data – as has been the case since Lee Myung-bak became President in 2008. At the same time, the rate of respondents in the capital region indicative of satisfaction has fallen below 50% (46.0%) for the first time since Park Geun-hye came to power.
<Figure 1-3-5> Satisfaction in the government’s North Korea policy by region(Unit:%)
26.8 30.0
31.4 38.6 43.4
32.7
56.1 52.7 51.7 46.0
28.8 31.3 22.9
37.3
17.9
36.2
61.0 54.3
45.4
35.8
43.7
17.7 19.5 18.5
24.1
20.0
35.1 37.9
28.9 26.6
31.3
49.7 41.7
51.9 48.4
43.3
68.9 61.6 58.6 55.3
41.7 33.3
25.0 22.2
42.9
22.2
37.1
52.2 50.1
37.2
15.4 14.3 15.4
30.8
15.4
38.5 46.9 49.1
39.9 43.1
0
10
20
30
40
50
60
70
2007 2008 2009 2010 2011 2012 2013 2014 2015 2016
Capital Region Central Region Honam Region
Yeongnam Region Gangwon Jeju
Politically, support for the government’s policy amongst conservative respondents dropped by as much as 11% on 2015 to 47.2%. Centrist support also declined by 3.2% to a similar 47.4%, thus centrist and conservative opinion on North Korea policy has converged. At the same time, 38.7% of progressive respondents signalled approval, a 2.9% drop on 2015. While conservatives have consistently been more supportive of both the Lee and Park administration’s North Korea policies, support has declined more steeply amongst them than amongst progressives. This reflects the fact that, while they had high hopes for a hard-line policy, believing that would force North Korea to change, circumstances characterized by growing regional instability have led to growing dissatisfaction with such a policy approach.

104 105
Chapter 3 Perception of the Government’s North Korea Policy2016 Unification Perception Survey
<Figure 1-3-6> Satisfaction in the government’s North Korea policy by the political ideology of respondents
(Unit:%)
40.9
28.0 27.1
35.4 35.9
22.9
52.4
42.9 41.6 38.7
22.0
41.5 35.3
48.7 47.2 46.6
66.9 65.5
58.2
47.2
29.2
32.8
32.2
38.1 38.8
34.9
55.4
54.0 50.6
47.4
20
30
40
50
60
70
2007 2008 2009 2010 2011 2012 2013 2014 2015 2016
Progressive Conservative Centralist
Let’s have a look at what respondents of different ideological positions thought was the best direction of North Korea policy going forward. Compared to 2015, there was a 4.2% increase in the proportion of who answered that aid to and/or cooperation with the North was necessary among conservatives who expressed more satisfaction with current North Korea policy. At the same time, of conservatives who answered that they were ‘not satisfied’, 13.3% more respondents indicated that they believed a peace treaty was necessary compared to 2015. Next, the number who stated that ‘international cooperation on the North Korean nuclear issue is important’ rose by 16.2% among those progressive who satisfied with the current North Korea policy, and 9.3% among those dissatisfied, indicating that growing numbers believe in the importance of international cooperation. Of centrists
satisfied with the current policy, the number who wanted a peace treaty rose by 8.3% compared to 2015, while 7.3% more of those not satisfied approved international cooperation on the North Korean nuclear issue than 2015. When seen in such a context, one can see that more conservatives believe stable management of the situation through international cooperation, humanitarian aid to the North, and a peace treaty, while there is a growing sense amongst progressives that the North Korean nuclear issue is in urgent need of resolution.
Relative individual satisfaction with the economic situation seems to exert significant influence over how government policy is perceived. North Korea policy seems to be no different in this regard. Since the survey first began back in 2007, those who are satisfied with the economic situation have always been more likely to express satisfaction with North Korea policy than those who are not – regardless of the government or the policies being pursued. The same was true in 2016, with 64.4% of those satisfied with the economy also being satisfied with North Korea policy, and 40.9% (down 4.3%) of those economically dissatisfied nonetheless being satisfied with North Korea policy. The gap between the two groups widened to 23.5% from 19.4% in 2015.

106 107
Chapter 3 Perception of the Government’s North Korea Policy2016 Unification Perception Survey
<Figure 1-3-7> Satisfaction with North Korea policy by satisfaction with the economy
(Unit:%)
48.8 50.9
40.1
51.9 54.8
44.0
70.1 67.1 64.6 64.4
27.1 31.6
30.2 34.0
34.8
31.3
52.8 48.2
45.2 40.9
20
30
40
50
60
70
80
2007 2008 2009 2010 2011 2012 2013 2014 2015 2016
Satisfied Not satisfied
3. Perception of major issues in North Korea policy
Since the survey began, a plurality of respondents have consistently indicated that regular summits between the two Koreas are ‘either very, or quite helpful in achieving unification’. At the same time, consistently the fewest number of respondents have said that aid to the North would be helpful. In the 2016 survey, the number of people who saw aid to the North as helpful in achieving unification fell further and quite steeply, widening the gap still more. The number of people who responded ‘all of the above’ also fell. This can be read as an expression of a sense amongst South Koreans that current North
Korean behaviour and South Korean policy makes unification difficult to achieve. South Koreas also expressed a similar response to the question of how much sanctions and pressure are effective in achieving unification, asked for the first time in the survey, with only 41.8% saying that they would be effective.
The results of the survey indicate that half of South Koreans believe that whether it be aid, sanctions or pressure, such measures alone will do little or nothing for the cause of unification. It remains the case that most believe dialogue to be the key.
<Figure 1-3-8> Perceived contribution of different North Korea policies to unification
(Unit:%)
57.4 51.8 54.1 52.3 50.7
53.4
46.3 46.9 50.3 41.9
69.7 60.0
68.2
66.8 64.8
64.3
58.7
63.3
62.2 56.7
72.5
57.5 64.3
68.7
61.7
65.3 61.8
62.2
65.4
52.5
74.7
64.5
73.4 75.3 71.4 69.8 70.8 73.4 71.4
68.7
41.8 40
50
60
70
80
2007 2008 2009 2010 2011 2012 2013 2014 2015 2016
Humanitarian aid to the North Social and cultural exchange
Economic cooperation Regular inter-Korea summits
North Korea sanctions and pressure
Since the survey began in 2007, over half of respondents have consistently said that they believe giving aid to the North would do little or nothing to advance the cause of unification. In 2016, the

108 109
Chapter 3 Perception of the Government’s North Korea Policy2016 Unification Perception Survey
number giving this response rose by 4.5% on 2015 to 57.6%. The growing number of respondents voicing such negative views seemingly is fundamentally a consequence of the lack of transparency in the distribution of aid within the North. However, continued nuclear tests and missile launches have likely also played a part.
<Figure 1-3-9> Perceived contribution of aid to the lives of the North Korean people
(Unit:%)
49.6 44.0 45.6 44.8 43.4 42.3
40.4
48.3 46.9
42.4
50.4
56.0 54.4 55.3
56.6 57.7 59.6
51.7 53.1
57.6
35
40
45
50
55
60
65
2007 2008 2009 2010 2011 2012 2013 2014 2015 2016
Beneficial Not Beneficial
Aside from the issue of divided families and the POW issue, across all North Korea policy-related items the number of respondents who believed these items were ‘very or quite urgent’ in achieving unification fell compared to 2015. As the generation who directly experienced the Korean War becomes older, the divided family and POW issues become more pressing, and this seems to explain the high rating of these items by respondents. The trend in responses for other items,
however, seemingly speaks to a general cautiousness about the issue of unification. Alleviating military tensions came out highest with 77.7% of respondents rating the issue as urgent, followed by reform and opening in the North at 76.7%, and improving North Korea’s human rights situation at 77.4%. These results reflect increasing fatigue due to tensions, as well as a perception of North Korea as being the problem, and changing North Korea as thus being important.
<Figure 1-3-10> Perceived urgency of different issues in achieving unification
(Unit:%)
66.8 61.7
72.2 69.7
67.7 68.5 67.9 66.1
70.3 70.1
78.3
69.0
80.5 78.2 79.6 79.3
74.6 76.7 77.9 76.7
71.3
83.7 83.7 83.2
77.4
81.5 78.4
80.3 77.7
79.9
72.0 73.0 75.7 75.8 74.0
70.8 70.4 72.8 72.9
76.3 76.3
82.8 80.0 79.8
79.4
81.7
77.4
60
65
70
75
80
85
2007 2008 2009 2010 2011 2012 2013 2014 2015 2016
Inter-Korea summits Opening of North Korea and reform
Relaxing of military tensions Uniting Separated families, POWs
Improvement of North Korea’s human rights
About 60% of respondents have, over the last ten years, said that South-North economic cooperation will be ‘very or quite’ helpful in reforming and opening the North. This indicates a widespread perception of inter-Korean economic cooperation as potentially helpful in advancing reform in North Korea.

110 111
Chapter 3 Perception of the Government’s North Korea Policy2016 Unification Perception Survey
While the percentage of respondents that said this in 2016 dropped by 1.8% on 2015, levels were similar in spite of the fourth nuclear test in early 2016. After the third nuclear test in 2013, 6.4% fewer respondents gave the same answer in the 2013 survey compared to 2012.
<Figure 1-3-11> Perceived contribution of South-North economic cooperation to advancing reform in North Korea
(Unit:%)
59.6
66.4 64.6 64.9
63.3
56.9
64.5
60.0 58.2
50
55
60
65
70
2008 2009 2010 2011 2012 2013 2014 2015 2016
Beneficial
In 2013, the Park Geun-hye administration released records of the Second South-North summit invalidating the agreement made during that summit. Yet, a majority of South Koreans surveyed continue to agree that ‘regardless of who is in office, agreements between South and North should be honoured’. Conversely, around 30% do not agree. The number disagreeing rose by 6.4% on 2015 to 36.7% in 2016, while the number agreeing dropped by 3.3% to 58.0%.
At the same time, in 2016, even amongst those expressing satisfaction with the Park Geun-hye administration’s North Korea policy, 67.5% said that South-North agreements should be honoured – in 2014 it was 67.4%, and in 2015 it was 67.8%. This implies that the South Korean people perceive respect for prior agreements as being a matter of principle.
<Figure 1-3-12> Support for the statement ‘regardless of who is in office, agreements between South and North should be honoured’
(Unit:%)
42.8 50.2
62.5 57.4
53.3 58.0 60.9 61.3 58.0
42.2 42.6 32.7 29.6 37.6
33.1 27.6
30.3 36.7
15.0 7.1 4.8
13.1 9.1 8.9 11.5
8.3 5.3
0
10
20
30
40
50
60
70
2008 2009 2010 2011 2012 2013 2014 2015 2016
Agree Disagree Don't know
With respect to the reopening of the Kaesong Industrial Complex (KIC), 47.0% of respondents agreed ‘strongly or somewhat’ that the KIC should be reopened, compared to 29.7% who disagreed – a 17.3% difference. From 2009 to 2015, respondents were asked whether they supported the continued operation of the KIC, however, in light its closure in February 2016, the question was changed to ‘reopening’.

112 113
Chapter 3 Perception of the Government’s North Korea Policy2016 Unification Perception Survey
Yet, roughly half of respondents continue to support the KIC, even after its closure. It is interesting to note that by age group, it was respondents in their 20s who were least likely to support reopening (40.5%), followed by those over 60 (46.7%), then those in their 40s (48.2%), and then 30s (48.9%). Thus it was respondents in their 50s (49.6%) who were most likely to support the reopening of the KIC.
<Figure 1-3-13> Support for/opposition to the continued operation/reopening of the Kaesong Industrial Complex
(Unit:%)
48.6 49.7 46.2 45.8
50.4 45.7
49.8 47.0
20.4 18.0 20.1 20.3 18.0 20.3 19.8
29.7 31.0 32.3 33.7 33.9 31.6 34.0
30.4
23.2
0
10
20
30
40
50
60
2009 2010 2011 2012 2013 2014 2015 2016
Agree Disagree Neutral
The number of respondents who support the resumption of Mount Kumgang tours has fallen since 2014, but still remains above 50%. What’s more, the public seems more inclined to support Kumgang tours than the KIC, perhaps indicative of Kumgang’s special emotional, and national symbolic significance, in spite of fears that cash transfers to the North get funnelled into nuclear weapons development programs.
In 2016, 50.4% of respondents said they supported the resumption of Mount Kumgang tours, a 4.6% decline on 2015. Still, around half of South Koreans surveyed support this position, whereas 23.6% of respondents stated they opposed resumption. Yet, while the latter represents a 9.8% rise on 2015, it is still less than half the number those who approve of restarting tours. Generally the older the respondent, the more likely they were to support the resumption of tours: 20s (47.5%), 30s (45.6%), 40s (49.4%), 50s (53.8%), over 60 (55.4%).
<Figure 1-3-14> Support for/opposition to the resumption of Mount Kumgang tours
(Unit:%)
60.2 61.3 62.5 57.4
49.7 55.0
50.4
13.1 13.5 12.3 13.4
15.5 13.8 23.6
26.8 25.2 25.2 29.2
34.8 31.3
26.1
0
10
20
30
40
50
60
70
2010 2011 2012 2013 2014 2015 2016
Agree Disagree Neutral
In 2016, for the first time respondents were asked ‘should all South-North cooperation be suspended until the North Korean nuclear issue is resolved’, to which 40.5% said yes, with 33.6% indicating that they neither agreed nor disagreed, and 25.6% saying no. From 2008 to

114 115
Chapter 3 Perception of the Government’s North Korea Policy2016 Unification Perception Survey
2015, the survey asked whether aid to the North should be suspended until the North Korea nuclear issue is resolved, thus it is difficult to make comparisons with results from previous years.
What is interesting is the number of those who do not have a definite opinion on the issue. As a result of the 24th May Measures of 2010, all South-North cooperation – except for the KIC – had already been frozen. With the fourth nuclear test, and the satellite launch that followed soon after led the South Korean government to close the KIC. As a result, the question is no longer about how and through what means should cooperation occur, but rather, whether it should or should not occur. This may also imply that the South Korean people find it difficult to choose a priority between the North Korean nuclear issue and South-North cooperation. Thus, despite 40.5% support for freezing South-North cooperation absent a resolution to the nuclear issue, public opinion can be said not fully formed on the issue. By age, there is little notable variation: 20s (37.4%), 30s (40.3%), 40s (41.9%), 50s (42.6%), over 60s (39.7%).
<Figure 1-3-15> Support for/opposition to the suspension of South-North cooperation [aid to North Korea, 2009-2015] until the nuclear
issue is resolved(Unit:%))
42.1 47.4 46.4 45.5
41.6
54.4 49.4 51.2
40.5
19.9 22.6 21.1 22.9 21.9 14.5 17.3 18.1
25.9
38.0 30.0 32.5
31.6 36.5
31.1
33.3
30.8 33.6
0
10
20
30
40
50
60
2008 2009 2010 2011 2012 2013 2014 2015 2016
Agree Disagree Neutral
In 2016, 41.7% of respondent said that ‘leaflets should not be sent to the North’, with 34.8% not having a definite opinion, and 23.5% disagreeing. From 2009 to 2015, respondents were asked whether ‘the government should stop leaflets from being sent into North Korea’, so direct comparisons are not easy. However, it appears that opposition to leaflet campaigns has decreased slightly, with more respondents not expressing an opinion or believing that such campaigns should not forcibly stopped. Just as with views on the suspension of economic cooperation, a majority position has yet to emerge. The tensions and potential confrontation that leaflet campaigns can give rise to mean that it is not easy to disentangle broader geopolitical concerns from the perceived need to get information into North Korea.
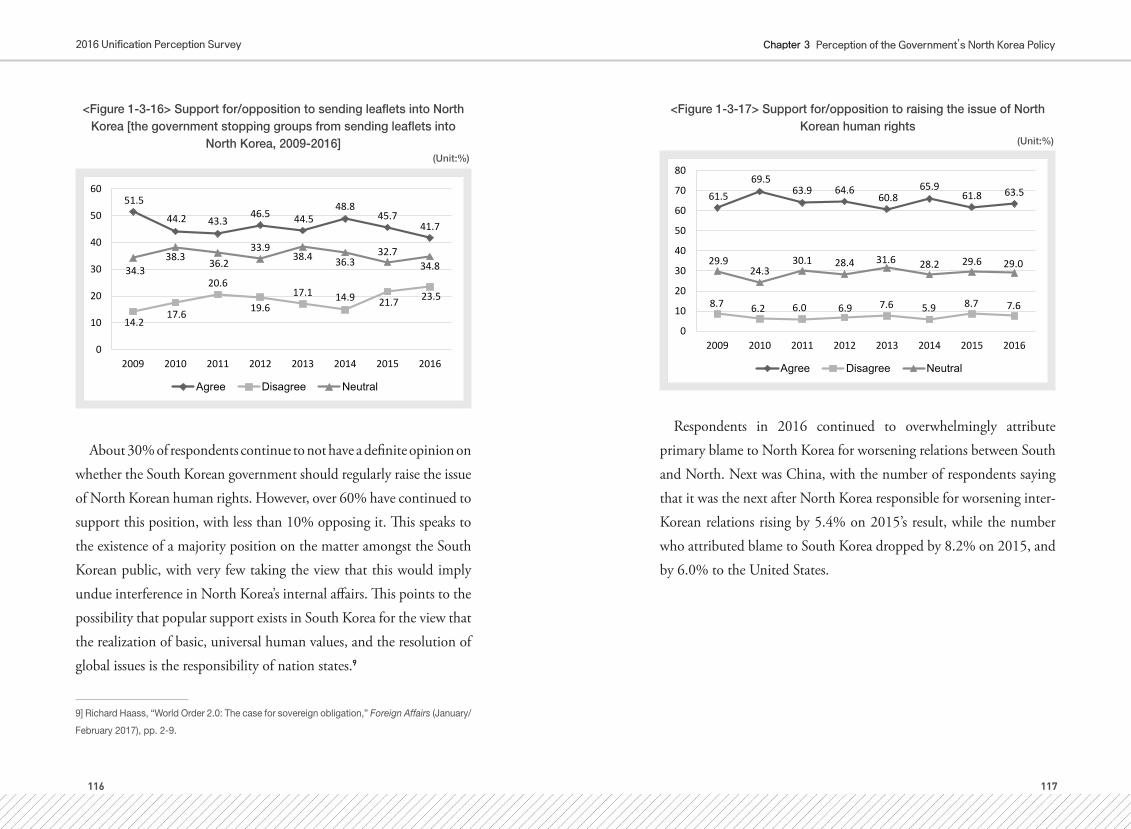
116 117
Chapter 3 Perception of the Government’s North Korea Policy2016 Unification Perception Survey
<Figure 1-3-16> Support for/opposition to sending leaflets into North Korea [the government stopping groups from sending leaflets into
North Korea, 2009-2016](Unit:%)
51.5
44.2 43.3 46.5 44.5
48.8 45.7
41.7
14.2 17.6
20.6
19.6 17.1 14.9 21.7 23.5
34.3 38.3 36.2
33.9 38.4 36.3
32.7 34.8
0
10
20
30
40
50
60
2009 2010 2011 2012 2013 2014 2015 2016
Agree Disagree Neutral
About 30% of respondents continue to not have a definite opinion on whether the South Korean government should regularly raise the issue of North Korean human rights. However, over 60% have continued to support this position, with less than 10% opposing it. This speaks to the existence of a majority position on the matter amongst the South Korean public, with very few taking the view that this would imply undue interference in North Korea’s internal affairs. This points to the possibility that popular support exists in South Korea for the view that the realization of basic, universal human values, and the resolution of global issues is the responsibility of nation states.9
9] Richard Haass, “World Order 2.0: The case for sovereign obligation,” Foreign Affairs (January/
February 2017), pp. 2-9.
<Figure 1-3-17> Support for/opposition to raising the issue of North Korean human rights
(Unit:%)
61.5 69.5
63.9 64.6 60.8
65.9 61.8 63.5
8.7 6.2 6.0 6.9 7.6 5.9 8.7 7.6
29.9 24.3
30.1 28.4 31.6 28.2 29.6 29.0
0
10
20
30
40
50
60
70
80
2009 2010 2011 2012 2013 2014 2015 2016
Agree Disagree Neutral
Respondents in 2016 continued to overwhelmingly attribute primary blame to North Korea for worsening relations between South and North. Next was China, with the number of respondents saying that it was the next after North Korea responsible for worsening inter-Korean relations rising by 5.4% on 2015’s result, while the number who attributed blame to South Korea dropped by 8.2% on 2015, and by 6.0% to the United States.

118 119
Chapter 3 Perception of the Government’s North Korea Policy2016 Unification Perception Survey
<Figure 1-3-18> Attribution of blame for worsening inter-Korean relations by country
(Unit:%)
88.1 89.6 88.9 87.3 88.8 90.9 87.5 87.7
53.4 54.2
47.7 49.8 42.0
45.8 50.9 42.7
61.3
56.5 49.6 50.9 44.3
48.5
47.1 41.1
47.4
59.4 65.5
60.6 58.3 58.3 51.2 56.6
38.4 38.5 35.2 37.2 34.3
43.2
33.0 30.0 20
30
40
50
60
70
80
90
100
2009 2010 2011 2012 2013 2014 2015 2016
North Korea South Korea United States
China Japan
Since 2013, respondents have generally favoured the policy prioritization of affecting change in North Korea that results in reforms, opening to the outside world and an improvement in the human rights situation. However, 6.3% fewer respondents said so in 2016 compared to 2015, while 5.5% more respondents said that international cooperation on the North Korea nuclear program, and 3.4% a peace treaty were the first priority. While South-North cooperation, aid, active North Korea policies, and financial preparation for unification have fallen slightly in the 2016 survey, they continue to sustain similar levels.
This may reflect a popular response amongst South Koreans to the fourth nuclear test, subsequent satellite launch, and other missile tests that resulted in yet stronger pressure from the United States and South
Korea, as well as emphasis on US-ROK military responses which led to a further rise in military tensions on the peninsula. In other words, there is a growing belief that it is necessary to first strengthen international cooperation in order to stop North Korean nuclear development, and to secure peace.
<Figure 1-3-19> The first priority in North Korea policy(Unit:%)
17.4 19.3
16.4 15.3
25.2
32.0 31.5
25.2
13.6 16.8
18.3 16.7
26.5
18.4
20.5
26.0
17.2
13.6 13.3 10
15
20
25
30
35
2013 2014 2015 2016
Inter-Korean exchange, aid to North Korea
Reform and opening of North Korea, expansion of human rights
Active unification policy, resource preparation
International cooperation to stop North Korea's nuclear program
Settlement of a peace treaty

120 121
Chapter 3 Perception of the Government’s North Korea Policy2016 Unification Perception Survey
4. Views on South Korea going nuclear
As it becomes increasingly unlikely that North Korea will give up its nuclear weapons, there are growing calls for South Korea to no longer rely exclusively on US extended deterrence but go nuclear. In the wake of the fifth nuclear test, aside from existing short and medium range missiles, the North is also openly and rapidly developing SLBMs and ICBMs. And there is also growing scepticism about the possibility of North Korea giving up nuclear weapons. This is a populist, immediate response to the problem. Some members of the (now former) ruling party have proposed such a move. But because South Korean nuclearization would come with substantial costs, there have also been calls for the redeployment of US tactical nuclear weapons to the peninsula.
So what did respondents make of the question? Since the question was first asked in 2013, over 50% of respondents have consistently indicated support for South Korea going nuclear. This speaks to the existence of a measure of popular support for South Korean nuclearization.
Whilst in 2016 3.0% fewer respondents said they supported such a move that still meant that 52.8% would endorse South Korea obtaining nuclear weapons. At the same time, the number directly indicating opposition fell by 2.3% on 2015 to 15.2% in 2016. Opposition has never exceeded 20%, but number of respondents not expressing a definite opinion rose by 5.1% in 2016.
<Figure 1-3-20> Support for/opposition to South Korea going nuclear(Unit:%)
52.3 55.3
55.8 52.8
19.8 17.6 17.5
15.2
27.8 27.2 26.8 31.9
10
20
30
40
50
60
2013 2014 2015 2016
Agree Disagree Neutral
There is little difference between men and women on the question of South Korea going nuclear – in 2016, 52.8% of both men and women supported such a move. Conversely, there was a significant difference between the age groups. Support amongst those over 60 rose by 2.3% on 2015 to 60.8% - making them the most likely age group to support South Korean nuclearization. They were followed by respondents in their 30s, of which 54.0% expressed support, then those in their 50s (52.4%), 40s (52.1%), and last, those in their 20s (44.8%). By educational attainment, those with a middle school education or less were most likely to support nuclearization (59.6%), with high school graduates (51.7%) and university graduates (52.3%) being markedly less supportive. Gangwon respondents (67.2%) were the most likely to support nuclearization, followed by those from

122 123
Chapter 3 Perception of the Government’s North Korea Policy2016 Unification Perception Survey
Honam (59.7%). Then it was those from the capital region (54.9%), Yeongnam (52.0%), Jeju (45.6%), with those from Chungcheong (35.1%) being least likely.
By income, 58.2% of those earning less than 2 million won a month supported South Korea going nuclear, while only 50.7% of those earning more than 4 million won responded the same way. These results represent a reversal of those observed in 2014 and 2015, indicating no clear trend by income. By party, those who support the Justice Party were most likely to support South Korea going nuclear at 59.6%. It was then supporters of the New Frontier Party (now called the Liberty Korea Party) at 57.0%, with 52.7% supporters of the Minjoo Party of Korea expressing support, and 48.3% of the People’s Party supporters doing the same.
<Figure 1-3-21> Support for/opposition to South Korea going nuclear by party affiliation
(Unit:%)
57.0 52.7
48.3
59.6
51.3
12.1 16.7 16.8 18.7 16.1
30.9 30.7 34.9
21.7
32.7
0
10
20
30
40
50
60
70
New FrontierParty
DemocraticParty
People's Party Justice Party No politicalaffiliation
Agree Disagree Neutral
The results by the political ideology of respondents indicate that centrists remain the least supportive, whilst progressive and conservative supports intersected passing 2015, and a uniform trend is thus not being evident. Conservative support rose by 6.0% on 2015 to 65.1%, whilst it dropped by 2.6% amongst progressives to 55.5%, and centrists were least likely to support South Korea going nuclear, with only 46.1% saying they did, a drop of 6.7% on 2015.
<Figure 1-3-22> Support for/opposition to South Korea going nuclear by political ideology
(Unit:%)
52.4
62.0
58.1 55.5 58.1
57.0
59.1
65.1
49.3 50.5
52.8 46.1
40
50
60
70
2013 2014 2015 2016
Progressive Conservative Centalist
A further examination of conservative support for nuclearization indicates that support is highest amongst those who feel closest to the United States. Support for South Korea going nuclear has continually risen amongst this group since the question was first asked in 2013. Over this period, there has been a third and fourth nuclear test, and

124 125
Chapter 3 Perception of the Government’s North Korea Policy2016 Unification Perception Survey
the North Korean side has proclaimed a policy of joint nuclear and economic development. In response, both the US provision of a nuclear umbrella and the promise of extended deterrence have been strengthened. Hence, there exists the possibility that disbelief in US assurances, rather than the threat of North Korea’s capabilities, explains growing support for South Korea going nuclear. Paradoxically, thus, it can be interpreted as that it is those who feel closest to the United States who are the most likely to express such a loss of faith in the promised protection of the United States.
<Figure 1-3-23> Support for South Korea going nuclear amongst conservatives by the nation state they express closeness toward
(Unit:%)
60.0
60.8 60.2
67.8
43.5 41.8
52.5
61.2
64.7
45.7
56.1
54.8
30
40
50
60
70
80
2013 2014 2015 2016
Unied States North Korea China
It appears that this phenomenon is not confined to conservatives. Aside from Russia – where variation has been extreme – those who feel closest to the United States are most likely to favour South Korea
going nuclear, followed by those feeling closest to China, then North Korea. Overall, this can be read as a sign that closeness and wariness can coincide, but what is most interesting is the fact that many respondents feel close to the United States yet want to go nuclear in defiance of US wishes. As with conservatives, this may indicate a lack of faith in the US nuclear umbrella and extended deterrence. It is an irony that those who feel closest to the United States seemingly have the least faith in such US assurances.
<Figure 1-3-24> Support for South Korea going nuclear by the state to which the respondent felt closest
(Unit:%)
54.5
45.8 49.4
48.7 52.4 57.0
57.8 54.6
54.0
57.8
53.5 48.2
44.3
36.4 39.6
47.4 50.0
66.3
32.6 38.8
30
35
40
45
50
55
60
65
70
2013 2014 2015 2016
North Korea United States China
Japan Russia

126 127
Chapter 3 Perception of the Government’s North Korea Policy2016 Unification Perception Survey
5. Sub-conclusion
First, it is significant that respondents over 60 and conservatives were increasingly dissatisfied with the government’s North Korea policy. The number of respondents indicating satisfaction with the Park Geun-hye administration’s policy fell below 50.0% to 45.1% in 2016, a drop from 50.4% in 2015 – a drop of 5.3%. It was among those in their 30s followed by those over 60 who saw the largest fall in support. This hints at the possibility of growing divisions amongst those over 60 in support for North Korea policy.
Such a trend is also evident in support for the freezing of all South-North cooperation prior to the resolution of the North Korean nuclear issue. Dissatisfaction with North Korea policy increased amongst those over 60, while only 33.1% of those over 60 expressed support for South-North cooperation prior to the resolution of the North Korean nuclear issue. At the same time, 46.4% of those who expressed support for Park Geun-hye’s North Korea policy also indicated that all South-North cooperation should be suspended until the nuclear issue is resolved. By age group, the spread between those who expressed satisfaction with the government’s North Korea policy and those who were dissatisfied was largest amongst those over 60 (15.9%), followed by those in their 20s (13.3%). As indicated above, this speaks to growing divisions amongst those over 60 and also those in their 20s with respect to the North Korea policy pursued by the government, and thus to growing dissatisfaction on this matter amongst those most supportive of Park Geun-hye. This is also evident amongst those respondents who self-
identified as conservative, of which 11.0% expressed satisfaction with the government’s North Korea policy compared to 2015. Whereas conservative support dropped substantially between 2015 and 2016, support amongst progressives declined by a mere 2.9% and amongst centrists by 3.2%.Thus, it appears that falling popular support for Park Geun-hye’s North Korea policy is due to growing dissatisfaction amongst those over 60 and conservatives.
Next, with respect to current issues and the direction of North Korea policy, the public is becoming more negative in its attitude toward North Korea overall and South-North cooperation in particular. 4.5% more respondents agreed with the claim that ‘aid to the North does not help its people’, while the number who responded ‘South-North economic cooperation contributes to the opening and reform of the North’ fell by 1.8% on 2015, and 4.6% fewer responded that they approved of the reopening of Mount Kumgang tours, falling to 47.0%. That said, only 40.5% of respondents favoured freezing all South-North cooperation before the North Korea nuclear issue is resolved – a fall from 51.2% in 2015, indicating a cautious approach to the issue.
At the same time, it is interesting to note that while the number of respondents attributing blame to South Korea, the United States or Japan fell, proportionally more respondents were inclined to blame China. After North Korea (around 90%), it was China that was most likely to be blamed by respondents. This indicates a growing perception amongst the South Korean public that China, which has the most potential influence over the North, is not doing enough to

128 129
Chapter 3 Perception of the Government’s North Korea Policy2016 Unification Perception Survey
stop North Korea’s nuclear development. The attribution of blame to China, combined with the application of pressure to China through the deployment of THAAD may, should it become connected with nationalist sentiments, make it difficult to resolve problems in Sino-ROK relations.
In 2016, more respondents said that resolving the nuclear issue and creating a peaceful peninsula were overwhelming priorities. Compared to 2015, 6.3% fewer respondents indicated that North Korean reform, opening and improvements in human rights were the main priority of policy. At the same time, 5.5% more respondents indicated international cooperation on stopping North Korean nuclear developments and 3.4% a peace treaty as central priorities of policy. This speaks to anxiety over excess tensions and the necessity to manage the situation.
Lastly, support for South Korea going nuclear continues to exceed 50% amongst those surveyed. This implies the existence of real support amongst certain sections of the South Korean public for such a policy. Whilst in 2016, support dropped by 3.0% to 52.8%, it still exceeded half those surveyed.
It is interesting to note that support for South Korea going nuclear was highest amongst those who indicated that the United States was the country they felt closest. What’s more, those conservatives who felt closest to the United States were found to be most inclined to support nuclearization. This demonstrates the possibility that those who feel the United States to be the most important state to South Korea either feel the most mistrust towards the US, or have a naïve belief that the
United States will be tolerant and accepting of South Korea going nuclear.

130 131
Chapter 4 Perception of the Relationships with Foreign Nations 2016 Unification Perception Survey
Chapter 4
Perception of the Relationships with Foreign Nations
1. Introduction
Creating an amicable environment for a peaceful coexistence and the unification of the Korean Peninsula is a core issue in South Korean diplomacy and security. However, tensions on the Korean peninsula have continued due to North Korea’s provocations through its nuclear weapons and missiles tests, and the sanctions that the international community has made in response. This combination means that uncertainty in the security situation on the Korean peninsula and in the East Asian region has continued to increase. It is worth noting that the international situation surrounding the Korean Peninsula over the past two decades has witnessed a change in the balance of power in East Asia between the current hegemon, the United States, and China, the rising power. In this regard, in order to prepare long-term for unification and to manage and ease tensions on the Korean Peninsula, Korea needs a more coherent national strategy. The Unification Perception Survey
has observed the changes in the international political environment surrounding the Korean Peninsula and the South Korean people’s understanding of the situation they face, in both their interactions with neighboring states and their perception of neighboring states. It is very much necessary to understand the situation in East Asia and the development of an amicable international environment as a preparatory step for unification, and to look at the perception of the major states that surround the Korean Peninsula.
The images of neighboring nations are based on the individual perceptions and experiences of those countries; however, such images are also formed in a complex manner through changes in the external environment including changes in the international order and interactions with neighboring nations. Since 2007, what has been clear from survey results regarding neighboring states is that even though there are complex elements that are a fixed part of a country’s image, fluid aspects are also present. South Koreans have generally maintained positive views of the United States, a traditional ally, but as a result of the increasing North Korean nuclear threat, strengthening of the US-ROK alliance, the United States’ involvement in Asia and rebalance to the Asia Pacific, perceptions have changed. With respect to North Korea, the Kim Jong-un regime’s reign of terror, perceived instability in the North, its intercontinental ballistic missiles (ICBM) program, and the continuation of the development of nuclear weapons are the main reasons underlying increased threat perception of North Korea. Recently, China’s rising military power, its territorial disputes with its neighbors, the North Korean nuclear issue, and the question of

132 133
Chapter 4 Perception of the Relationships with Foreign Nations 2016 Unification Perception Survey
Chinese influence, have affected the South Korean people’s views and attitudes towards China. With respect to Japan, Prime Minister Abe’s rewriting of history, together with the strengthening of the Japanese military, the Abe governments’ nationalistic policies, and amendments to the peace constitution have all exerted a negative influence on South Korean perceptions of Japan.
It is clear that as the United States, China, Japan, and Russia have historically had a large influence on inter-Korean relations and international politics that surround the Korean peninsula, it will become more important than ever going forward to resolve the vital problems of the Korean peninsula, such as the North Korean nuclear issue, or establishing a peace system. In this chapter, we will take a look at the South Korean people’s perceptions and attitudes regarding unification and neighboring nation’s images including the United States, Japan, China, and Russia. The responses to the related questions are organized by their questions, and the results are compared with accumulated research studies in order to explain the characteristics and changes of the perception of neighboring nations.
2. The closest neighbor and the most threatening neighbor
1) The country that feels the closest
The country that South Koreans felt the closest to was the United States. 73.8% replied with America when asked ‘Which country do
you feel the closest to?” According to <Table 1-4-1>, America has been the most preferred country since the survey began 10 years ago, and the gap compared to other countries is remarkably high. After the Park Geun-Hye administration came into office, closeness to the United States has exceeded 70.0% despite dropping 4.5% from 78.3% in 2016 compared to the year before. Following the United States, the country that South Koreans feel closest to is North Korea. Following 3 years declining trend, “I feel closest to North Korea’ responses had increased to 10.8% this year. It is important to note the closeness with North Korea has increased despite North Korea’s fourth nuclear test in January 2016 and resulting sanctions imposed on the North, as well as the continued horrors of the Kim Jong-Un regime, and increasing fatigue in the face of the unresolved North Korean nuclear problem. Closeness to Japan increased from 3.9% in 2015 to 5.2% in 2016 and within the same time period, the closeness to China has also marginally increased from 8.8% to 9.7%.
<Table 1-4-1> The country that feels the closest
(Unit:%)
2007 2008 2009 2010 2011 2012 2013 2014 2015 2016
USA 53.3 60.7 68.3 70.7 68.8 65.9 76.2 74.9 78.3 73.8
Japan 11.6 9.4 8.6 9.5 9.1 6.8 5.1 4.3 3.9 5.2
North Korea 24.0 20.4 16.0 14.8 16.0 20.6 11.0 8.9 8.1 10.8
China 10.2 7.8 6.1 4.2 5.3 5.8 7.3 10.3 8.8 9.7
Russia 0.9 1.7 1.0 0.8 0.8 0.9 0.5 1.0 0.9 0.4
Total(N) 1,188 1,202 1,196 1,196 1,197 1,199 1,200 1,200 1,200 1,200

134 135
Chapter 4 Perception of the Relationships with Foreign Nations 2016 Unification Perception Survey
While analyzing the closeness to neighboring states, it was noted that Japan and China’s image had changed. As set out in <Table 1-4-2>, between 2007 and 2012 it was noted that there was a set pattern with respect to the relative closeness felt to United States, North Korea, Japan, China, and Russia. However, it can be seen that the preferences between China and Japan changed for the first time in 2013, and in 2014 China was the second closest, North Korea the third, and Japan the fourth. This is to say that during the period between 2007 and 2012, China was the fourth closest nation, and in 2014 and 2015 China became the second closest. During the same period, Japan became the fourth closest in 2013 despite being consistently third in prior years.
The closeness to China was 4.2% in 2010, the lowest since the survey began, but consistently increased afterwards, to reach up to 10.3% in 2014. The image of a cooperative state, which is to be discussed later, exhibits a similar trend. After the creation of diplomatic relations between China and South Korea in 1992, Sino-ROK relations have developed continuously, and their relationship has gotten even closer following the Strategic Cooperative Partnership in May 2008. Since Xi Jinping came to power in 2012, the Park Geun-Hye administration has strived to further expand economic interdependence, human exchanges and the deepen Sino-ROK relationship overall. Economically, South Korea is China’s third largest trading partner, and China is South Korea’s largest trading partner and the second largest investment partner. Human exchanges increased from 590,000 to about 10.35 million between 1995 and 2015. Additionally, South Korea joined the AAIB (Asian Infrastructure Investment Bank, March 2015), Park
Geun-Hye participated in China’s Victory Day Parade (September 2015), and the signing of the Sino-ROK Free Trade Agreement (signed December 2015) have all helped to foster an atmosphere of cooperation between the two sides.
On the other hand, after 2012 the continuously decreasing closeness towards Japan has probably only been made worse by negative public sentiments regarding issues including history textbook problems, visits to the Yasukuni shrine, and the pursuit of the right of collective self-defense that have become a regular part of Japan-related news since Abe became Prime Minister. However in 2016, North Korea became the second most closely perceived nation, changing with taking over from China, which fell to third. It can be noted that the recent changes in China’s favorability has influenced the South Korean people’s closeness to other neighboring countries.
The South Korean people’s closeness to Russia is insignificant. With the exception of 2008, their reported levels of closeness did not exceed 1% throughout the 10 years of the survey. In 2015, the 25th anniversary of the establishment of diplomatic relations, the South Korean government reaffirmed the importance of Russo-ROK relations by choosing Russia as its main partner in the Eurasia era. In September 2008, through a summit, the two countries’ had declared a Strategic Cooperative Partnership and in 2011, Lee Myung-Bak’s administration worked towards the implementation of creating a joint railroad connecting South Korea, North Korea, and Russia. However, it remains the case that South Koreans are less interested in Russia compared to other neighboring states.
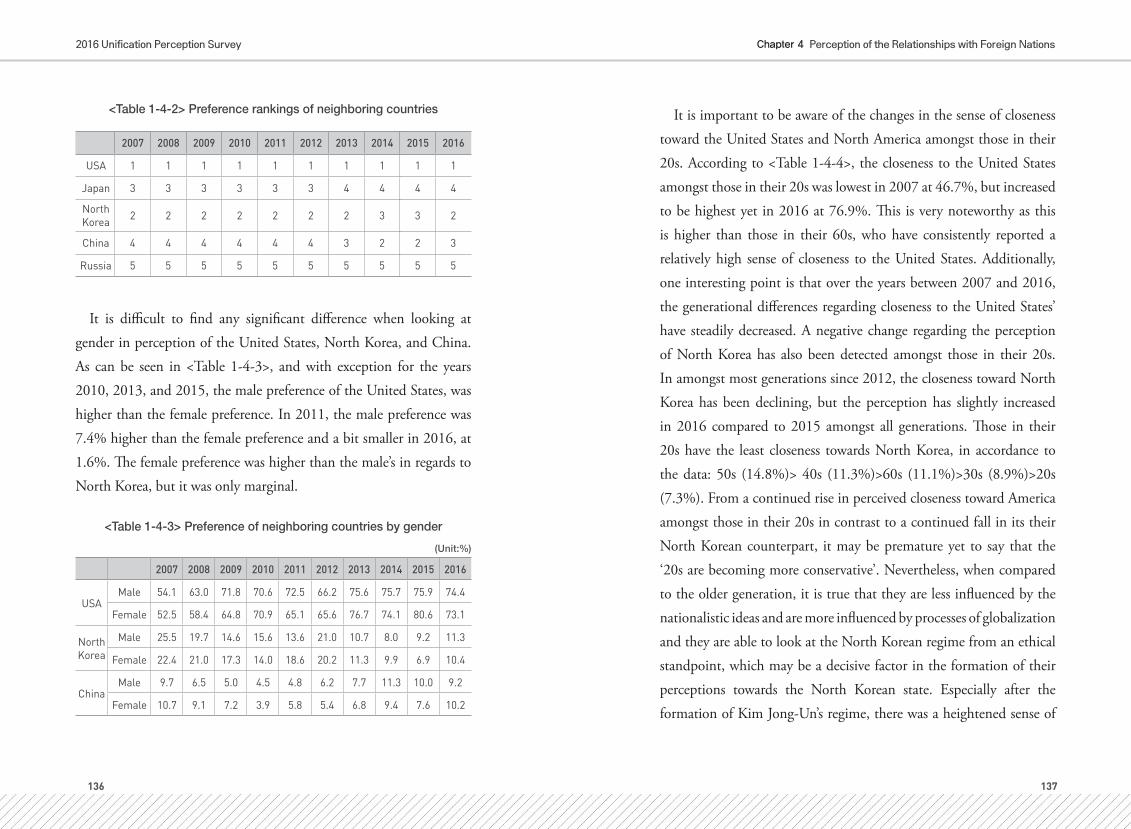
136 137
Chapter 4 Perception of the Relationships with Foreign Nations 2016 Unification Perception Survey
<Table 1-4-2> Preference rankings of neighboring countries
2007 2008 2009 2010 2011 2012 2013 2014 2015 2016
USA 1 1 1 1 1 1 1 1 1 1
Japan 3 3 3 3 3 3 4 4 4 4
North Korea 2 2 2 2 2 2 2 3 3 2
China 4 4 4 4 4 4 3 2 2 3
Russia 5 5 5 5 5 5 5 5 5 5
It is difficult to find any significant difference when looking at gender in perception of the United States, North Korea, and China. As can be seen in <Table 1-4-3>, and with exception for the years 2010, 2013, and 2015, the male preference of the United States, was higher than the female preference. In 2011, the male preference was 7.4% higher than the female preference and a bit smaller in 2016, at 1.6%. The female preference was higher than the male’s in regards to North Korea, but it was only marginal.
<Table 1-4-3> Preference of neighboring countries by gender
(Unit:%)
2007 2008 2009 2010 2011 2012 2013 2014 2015 2016
USAMale 54.1 63.0 71.8 70.6 72.5 66.2 75.6 75.7 75.9 74.4
Female 52.5 58.4 64.8 70.9 65.1 65.6 76.7 74.1 80.6 73.1
North Korea
Male 25.5 19.7 14.6 15.6 13.6 21.0 10.7 8.0 9.2 11.3
Female 22.4 21.0 17.3 14.0 18.6 20.2 11.3 9.9 6.9 10.4
ChinaMale 9.7 6.5 5.0 4.5 4.8 6.2 7.7 11.3 10.0 9.2
Female 10.7 9.1 7.2 3.9 5.8 5.4 6.8 9.4 7.6 10.2
It is important to be aware of the changes in the sense of closeness toward the United States and North America amongst those in their 20s. According to <Table 1-4-4>, the closeness to the United States amongst those in their 20s was lowest in 2007 at 46.7%, but increased to be highest yet in 2016 at 76.9%. This is very noteworthy as this is higher than those in their 60s, who have consistently reported a relatively high sense of closeness to the United States. Additionally, one interesting point is that over the years between 2007 and 2016, the generational differences regarding closeness to the United States’ have steadily decreased. A negative change regarding the perception of North Korea has also been detected amongst those in their 20s. In amongst most generations since 2012, the closeness toward North Korea has been declining, but the perception has slightly increased in 2016 compared to 2015 amongst all generations. Those in their 20s have the least closeness towards North Korea, in accordance to the data: 50s (14.8%)> 40s (11.3%)>60s (11.1%)>30s (8.9%)>20s (7.3%). From a continued rise in perceived closeness toward America amongst those in their 20s in contrast to a continued fall in its their North Korean counterpart, it may be premature yet to say that the ‘20s are becoming more conservative’. Nevertheless, when compared to the older generation, it is true that they are less influenced by the nationalistic ideas and are more influenced by processes of globalization and they are able to look at the North Korean regime from an ethical standpoint, which may be a decisive factor in the formation of their perceptions towards the North Korean state. Especially after the formation of Kim Jong-Un’s regime, there was a heightened sense of

138 139
Chapter 4 Perception of the Relationships with Foreign Nations 2016 Unification Perception Survey
national security threat, an unimproved human rights situation, the continuance of purges and a reign of terror, and fatigue over the North Korean nuclear problem, all of which would likely have a large impact on the negative perception on North Korea for those in their 20s.10 There was no significance detected with the way those in their 20s perceive China. Closeness to China was lowest in 2010, but began to increase among all generations. In 2016 those in their 60s had the second lowest perception towards China behind those in their 20s.
<Table 1-4-4> Preference of neighboring countries by age
(Unit:%)
2007 2008 2009 2010 2011 2012 2013 2014 2015 2016
United States
19-29 46.7 57.7 60.5 62.9 62.6 64.6 80.8 77.0 82.5 76.9
30-39 47.4 53.7 67.9 64.7 68.1 61.0 74.5 72.6 76.6 72.2
40-49 52.3 57.8 66.2 73.6 66.4 61.6 69.8 73.8 75.6 74.6
50-59 64.2 72.3 78.1 83.9 73.0 72.8 78.5 74.6 75.5 70.2
60+ 76.5 78.8 82.6 80.2 85.4 78.9 82.0 80.2 82.5 75.8
10] Lee Nae-young, “Changing perception of North Korea and unification amongst South Ko-
reans, 2005-2015,” in Lee Nae-young, Yun In-jin eds. South Korean Identity: Change and Con-
tinuity, 2005-2015, (Seoul: East Asia Institute, 2016), p. 214. The East Asia Institute (EAI) got
similar results from the ‘Identity of South Koreans’ survey conducted by the EAI and Joongang
Ilbo. Those in their 20s and 30s were more likely than other groups to see North Korea as either
‘another country’ or ‘an enemy.’
2007 2008 2009 2010 2011 2012 2013 2014 2015 2016
North Korea
19-29 21.7 14.0 18.6 17.2 15.2 22.4 8.8 8.1 3.5 7.3
30-39 25.0 26.7 17.3 17.9 15.6 22.3 10.2 8.5 7.1 8.9
40-49 30.1 26.5 17.4 12.9 20.2 23.8 16.1 11.1 9.1 11.3
50-59 20.7 13.6 10.4 9.8 14.8 15.3 9.6 9.1 12.3 14.8
China
19-29 10.7 6.8 8.0 5.0 4.3 5.1 4.4 8.1 8.8 8.9
30-39 12.7 10.0 4.5 3.8 4.2 7.1 6.5 10.7 10.5 11.8
40-49 8.9 7.3 7.9 4.0 6.8 5.5 8.5 8.5 9.5 9.1
50-59 9.8 7.5 4.2 4.1 7.0 5.4 8.5 13.4 7.5 10.4
60+ 4.7 6.3 3.5 3.5 1.1 6.3 9.0 10.9 7.8 8.1
Below we discuss ideology relates to closeness towards America, North Korea, and China. As can be seen in <Table 1-4-1>, the respondents with progressive tendencies felt less close to the United States compared conservative and centrist respondents. There is a noticeable trend in the difference between progressives and conservatives throughout the years, as the data shows: 16.9% in 2007, 13.1% in 2011, 6.0% in 2016. Since the Park Geun-Hye government took power, closeness to America has generally risen regardless of the ideology of respondents. Closeness towards America amongst conservatives has dropped 14.5% from 82.6% in 2015 to 68.1% in 2016. This will need to be looked at more going forward.

140 141
Chapter 4 Perception of the Relationships with Foreign Nations 2016 Unification Perception Survey
<Figure 1-4-1> American preferences by political tendencies(Unit:%)
42.9
57.163.4 65.4 63.7 62.5
72.6 70.674.5 74.1
55.2
61.2
70.273.0 67.8
65.0
75.377.6 77.9 76.1
59.862.9 69.4
74.2 76.871.8
81.2
74.5
82.6
68.1
30
40
50
60
70
80
90
2007 2008 2009 2010 2011 2012 2013 2014 2015 2016
Progressive Centrist Conservative
With the exception of 2016, closeness to North Korea amongst progressive respondents as can be seen in <Figure 1-4-2>, is higher than with conservatives and centrists. It is important to note that closeness towards North Korea has dropped without regard to political affiliation after 2013, when North Korea carried out their third nuclear test (February 2013), the closure of the Kaesong Industrial Complex (April 2013), Chang Song-taek was executed, and North Korea’s consistent provocations and reign of terror within the country.11 Additionally, when political affiliation is accounted for, the gap in closeness generally decreases and in 2015 the gap converges
11] Park Myoung-kyu, 2013 Unification Perception Survey (Seoul: Institute for Peace and Unifi-
cation Studies, 2013), p. 139.
within 10%. In 2016 those identifying as progressive have the lowest closeness in their responses towards North Korea at 9.8%.
<Figure 1-4-2> North Korea closeness by political affiliation(Unit:%)
32.0
24.4
20.118.2
20.724.7
15.211.6
9.6
9.8
19.8 18.4
14.513.5
14.6
19.1
10.7
7.78.1
10.0
23.520.3
14.7
12.3 13.5
18.9
7.5
8.5
6.6
13.9
0
5
10
15
20
25
30
35
2007 2008 2009 2010 2011 2012 2013 2014 2015 2016
Progressive Centrist Conservative
There was no unique trend that stood out with respect to China. It is necessary to consider the fact that responses were low when the United States and North Korea are excluded. Nevertheless, as shown in <Figure 1-4-3>, with the exception of 2015, the progressive and conservative respondents’ closeness towards China after 2010 consistently increased, and centrist respondents, in comparison to progressives and conservatives, relatively did not exhibit noticeable trends.

142 143
Chapter 4 Perception of the Relationships with Foreign Nations 2016 Unification Perception Survey
<Figure 1-4-3> Closeness towards China by political affiliation(Unit:%)
11.9
5.65.0
6.3
5.1
5.56.8
12.9
10.612.4
11.1 9.0
6.9
2.4
6.3 6.88.4
7.8
8.8
7.67.1
7.6
5.6
4.63.5
4.35.5
12.3
7.4
11.3
0
2
4
6
8
10
12
14
2007 2008 2009 2010 2011 2012 2013 2014 2015 2016
Progressive Centrist Conservative
2) The Country that poses the largest threat to peace to the
Korean Peninsula
If feelings of closeness to a state reflect a preference for that state, then threat perception reflects an evaluation of a state’s potential impact on the security and survival oneself and one’s community. That said, as noted above, changes in perceived closeness do not necessarily lead to changes in threat perception. In other words, one can feel to or think that a state is close whilst also considering it a potential threat. The Unification Perception Survey includes the following question to determine the threat perception of respondents vis-à-vis South Korea’s neighbors: “Among the following states which state do you think poses the greatest threat to the security of the Korean peninsula?” Obviously,
this is a single answer question, so a rise in the threat perception of one state will necessarily lead to a commensurate fall in the threat perception of other states.
South Koreans were found to view North Korea as the largest threat to peace on the Korean peninsula. As seen in <Table 1-4-5>, the percentage of respondents who singled North Korea out as the major threat on the peninsula rose 11.9%p from 54.8% in 2015 to 66.7%p in 2016. This is the highest reported number since the survey began, and represents a doubling on the results of 2008 – the year when the lowest result was recorded. The last decade’s trends reflect the transformation, closeness and deterioration in inter-Korean relations. When cooperation and dialogue reached a highpoint at the end of the Roh Moo-hyun administration in 2007, only 36.1% of respondents said they considered North Korea to be a threat. But this number rose in 2009 to 52.9% in a year when the second nuclear test was conducted, and rose yet further in 2010 to 55.6% with the sinking of the Cheonan and the attack on Yeonpyeongdo. By 2013, with the third nuclear test, 56.9% of respondents said that North Korea was the principal threat to peace on the Korean peninsula. The DMZ mine provocation of August 2015, the fourth nuclear test of January 2016, and North Korean testing of long-range missiles (the so-called ‘Kwangmyongsong satellite’) all seemingly further aggravated a sense of threat, and a sense of North Korea as being a hostile power.
By contrast, in general South Koreans have an extremely low level of threat perception with respect to the United States. In other words, the majority of South Koreans do not America as a threat to peace
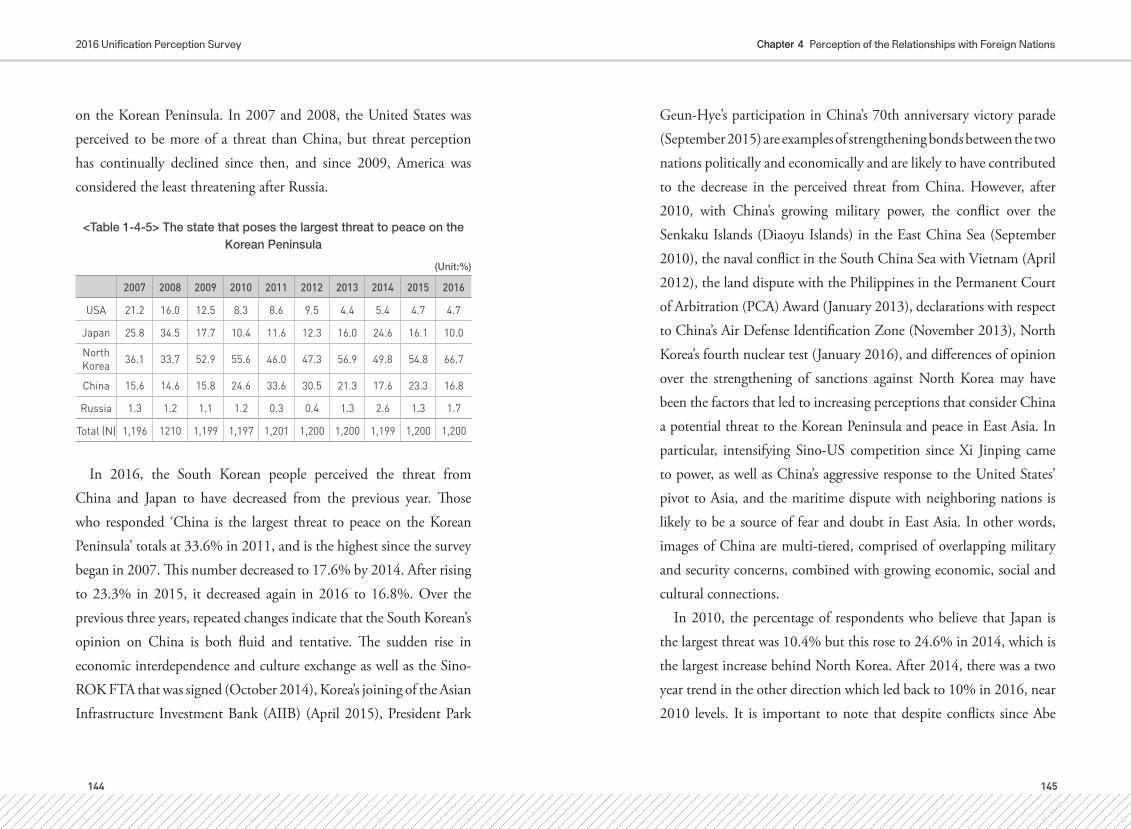
144 145
Chapter 4 Perception of the Relationships with Foreign Nations 2016 Unification Perception Survey
on the Korean Peninsula. In 2007 and 2008, the United States was perceived to be more of a threat than China, but threat perception has continually declined since then, and since 2009, America was considered the least threatening after Russia.
<Table 1-4-5> The state that poses the largest threat to peace on the Korean Peninsula
(Unit:%)
2007 2008 2009 2010 2011 2012 2013 2014 2015 2016
USA 21.2 16.0 12.5 8.3 8.6 9.5 4.4 5.4 4.7 4.7
Japan 25.8 34.5 17.7 10.4 11.6 12.3 16.0 24.6 16.1 10.0
North Korea 36.1 33.7 52.9 55.6 46.0 47.3 56.9 49.8 54.8 66.7
China 15.6 14.6 15.8 24.6 33.6 30.5 21.3 17.6 23.3 16.8
Russia 1.3 1.2 1.1 1.2 0.3 0.4 1.3 2.6 1.3 1.7
Total (N) 1,196 1210 1,199 1,197 1,201 1,200 1,200 1,199 1,200 1,200
In 2016, the South Korean people perceived the threat from China and Japan to have decreased from the previous year. Those who responded ‘China is the largest threat to peace on the Korean Peninsula’ totals at 33.6% in 2011, and is the highest since the survey began in 2007. This number decreased to 17.6% by 2014. After rising to 23.3% in 2015, it decreased again in 2016 to 16.8%. Over the previous three years, repeated changes indicate that the South Korean’s opinion on China is both fluid and tentative. The sudden rise in economic interdependence and culture exchange as well as the Sino-ROK FTA that was signed (October 2014), Korea’s joining of the Asian Infrastructure Investment Bank (AIIB) (April 2015), President Park
Geun-Hye’s participation in China’s 70th anniversary victory parade (September 2015) are examples of strengthening bonds between the two nations politically and economically and are likely to have contributed to the decrease in the perceived threat from China. However, after 2010, with China’s growing military power, the conflict over the Senkaku Islands (Diaoyu Islands) in the East China Sea (September 2010), the naval conflict in the South China Sea with Vietnam (April 2012), the land dispute with the Philippines in the Permanent Court of Arbitration (PCA) Award (January 2013), declarations with respect to China’s Air Defense Identification Zone (November 2013), North Korea’s fourth nuclear test (January 2016), and differences of opinion over the strengthening of sanctions against North Korea may have been the factors that led to increasing perceptions that consider China a potential threat to the Korean Peninsula and peace in East Asia. In particular, intensifying Sino-US competition since Xi Jinping came to power, as well as China’s aggressive response to the United States’ pivot to Asia, and the maritime dispute with neighboring nations is likely to be a source of fear and doubt in East Asia. In other words, images of China are multi-tiered, comprised of overlapping military and security concerns, combined with growing economic, social and cultural connections.
In 2010, the percentage of respondents who believe that Japan is the largest threat was 10.4% but this rose to 24.6% in 2014, which is the largest increase behind North Korea. After 2014, there was a two year trend in the other direction which led back to 10% in 2016, near 2010 levels. It is important to note that despite conflicts since Abe

146 147
Chapter 4 Perception of the Relationships with Foreign Nations 2016 Unification Perception Survey
came into office including the Dokdo (the Liancourt Rocks) dispute, controversy over Japanese school history textbooks, and the comfort women issue, there was a decreasing trend in the South Korean general threat perception with respect to Japan after 2014. The number of respondents in 2016 who replied “Japan is the largest threat to peace on the Korean Peninsula“ totaled 10%, and this was the lowest rate recorded in the last 10 years.
Prime Minister Abe Cabinet’s rewriting of history and issues regarding past apologies and territorial disputes have become factors of conflict, and particularly after Abe’s second premiership began in 2013, continued attempts to amend their constitution, the recognition of the collective self-defense rights (remilitarization) and state normalization were key factors in its conflicts with neighboring nations including South Korea and China. In fact, with the Park Geun-Hye administration, issues regarding war time comfort women, territorial claims over the Dokdo, the distortion of history, led to a considerable deterioration in ROK-Japanese relations. Nevertheless, as the South Korean’s threat perception with respect to Japan has decreased in the past 2 years, and despite the differences between the two nations’ views of history, and the changing policy line of Abe government, Japan has again become a partner to peacefully coexist with, and arguably there is a view among the South Korean people that the two nations can cooperate as partners in handling the North Korea threat in particular. Additionally, with the strengthening of the US-Japanese alliance, with increasing North Korea nuclear threat, and with rising China, it can be assumed that Japan is not considered a
direct threat to peace on the Korean peninsula.As previously seen in the neighboring states’ degree of closeness
chart, there was no significant difference when comparing South Korean closeness towards the United States, North Korea, and China by sex. As shown in <Table 1-4-6>, both men and women have very similar perceptions of North Korea, but men seem to generally perceive China to be more of a threat than women. In regard to the United States, the perceived threat starting from 2007 has decreased amongst both men and women, and in the past 3 years, there has been very little change, fluctuating 1.1% to 2.6% a year.
<Table 1-4-6> Perceived threat of neighboring countries by sex
(Unit:%)
2007 2008 2009 2010 2011 2012 2013 2014 2015 2016
USAMale 20.5 13.9 11.6 9.0 7.9 9.3 3.7 4.6 5.8 3.9
Female 21.8 18.0 13.4 7.6 9.3 9.7 5.2 6.1 3.5 5.6
North Korea
Male 33.9 34.2 54.6 53.8 46.5 47.0 59.6 48.9 53.9 66.0
Female 38.3 33.3 51.2 57.5 45.4 47.6 54.2 50.8 55.6 67.4
ChinaMale 16.1 14.6 17.7 26.6 35.2 32.8 22.0 19.3 23.4 19.6
Female 15.0 14.7 13.9 22.5 31.9 28.1 20.6 15.8 23.2 14.0
By age, however, an important trend becomes apparent <Table 1-4-7>. The order in which North Korea is perceived as a threat by the average of each generation is as follows: 60s, 20s, 30s, 50s, and then 40s. It is noticeable that those in their 20s who showed the second lowest level of perceived threat after those in their 40s in 2007 were in 2016 among the group which is most likely to see North Korea as a threat

148 149
Chapter 4 Perception of the Relationships with Foreign Nations 2016 Unification Perception Survey
along with those in their 60s.12 Additionally, even though there is a difference in the perceived threat from North Korea by age, the difference is gradually shrinking. In this regard, regardless of age, there is a generally shared belief that North Korea is the largest threat to peace on the Korean Peninsula.
<Table 1-4-7> North Korea threat perception by age
(Unit:%)
2007 2008 2009 2010 2011 2012 2013 2014 2015 2016
19-29 32.9 32.8 51.7 50.7 52.3 44.7 59.2 54.4 57.5 68.8
30-39 34.6 31.8 50.0 51.9 43.0 40.8 58.5 48.1 52.5 65.9
40-49 32.8 34.0 51.8 57.6 35.5 45.6 49.8 43.4 57.5 63.9
50-59 43.5 37.1 58.5 61.7 52.0 51.7 59.6 51.1 53.0 64.3
60+ 48.2 33.8 58.6 66.3 56.2 67.4 61.0 58.8 52.9 72.0
The relative perceived threat of the United States, North Korea and China by the ideology of the respondent is discussed below. According to <Figure 1-4-4>, respondents who consider themselves as progressive, view the United States to be more of a threat than other respondents. At the same time, respondents who consider themselves to be conservative view the United States to be less of a threat than other respondents. In 2012 and 2013 in particular, the difference by political ideology narrowed, and with differences hovering between 3%
12] In answer to the question “Is North Korea one of us/our neighbor or another country/the en-
emy” posed in “South Koreans and their Neighbors 2016” Survey of May 3, 2016 done by Asan
Institute for Policy Studies, 51% of those in their 20s and 51.3% of those over 60 answered the
‘the enemy’. This was the highest amongst all age cohorts.
and 6% without much of a change. Since the Obama administration came into office, the overall preference for the president himself has increased and there is no specific factor that points to an increased 13perceived threat. The progressive respondents in 2007 indicated the highest perceived threat from the United States at 27.7%, but the perceived threat then dropped to the lowest in 2016 at 3.9% for conservatives and also matched by progressives. This indicates a change over the past 10 years for self-identified progressive South Koreans in regards to the perceived threat from the United States.
<Figure 1-4-4> Perceived threat from the United States by political inclination
(Unit:%)
27.7
21.518.4
12.1 11.7 11.9
6.1 6.9
3.9
19.6
14.6
11.1
7.4 8.19.6
4.0 5.15.9 5.5
17.5
13.5
9.7
4.2 5.9 6.43.6 4.4 3.1
3.9
0
5
10
15
20
25
30
2007 2008 2009 2010 2011 2012 2013 2014 2015 2016
Progressive Centrist Conservative
13] According to the survey conducted by Asan Institute for Policy Studies (“Conditions for
great power: South Korean’s perception of the United States, 2015 April), the preference for
President Obama was found highest among the leaders of big nations including China, Japan,
North Korea and Russia.

150 151
Chapter 4 Perception of the Relationships with Foreign Nations 2016 Unification Perception Survey
Threat perception of North Korea amongst different ideological groups indicates that conservatives are more likely to perceive North Korea as a threat than progressives. (Excluding 2008 and 2015), in periods where North Korean aggression has been evident, especially nuclear tests and military provocations, the perceived threat from North Korea continues to rise, and at the same time, ideological differences have declined. In 2009, when the second nuclear test occurred, the difference in the perceived threat by political inclinations was 4.4%, and the difference in 2013, when the third nuclear test occurred, was 11.3%. With the fourth and fifth nuclear tests in 2016, the perceived threat of North Korea from progressives and conservatives was more likely to be equal, and the difference between these groups and moderates was 3.9%. Since the survey began asking about the perceived threat of North Korea, 2016 registered the highest results. This was a year in which the military-security crisis and nuclear programs impacted threat perception regardless of the professed political inclinations of South Korean respondents.
<Figure 1-4-5> Perceived threat of North Korea by ideology(Unit:%)
26.7
35.2
49.7 50.5
37.242.1
52.046.8
53.5
38.633.2
54.158.9
45.947.9
56.0
50.7 52.6
68.6
40.4
33.5
53.9 56.956.2
52.3
63.3
51.3
59.9 64.7
20
30
40
50
60
70
2007 2008 2009 2010 2011 2012 2013 2014 2015 2016
Progressive Centrist Conservative
The perceived threat from China by ideology can be seen to repeatedly diverge and converge again. In accordance to <Figure 1-4-6>, in 2007 the progressives and conservative’s perceived threat was respectively 15.2% and 15.6%, with a difference of only 0.4%, but in 2010 with the sinking of the Cheonan, 24% of progressives’ perceived China to be a threat, and the conservatives’ perceived threat of China had increased to 31.2%, with a difference of 7.2% between the two parties. In 2013, the difference between the conservatives and the progressives had decreased again to 3.1% and in 2015, had increased to 5.9%, then shrank again in 2016 to 2.9%. In 2011, progressives’ perceived threat of China had for the first time overtaken the conservatives, and this trend had continued until 2015. However in 2016, this was reversed once again. This means that the South Korean people’s perceived threat
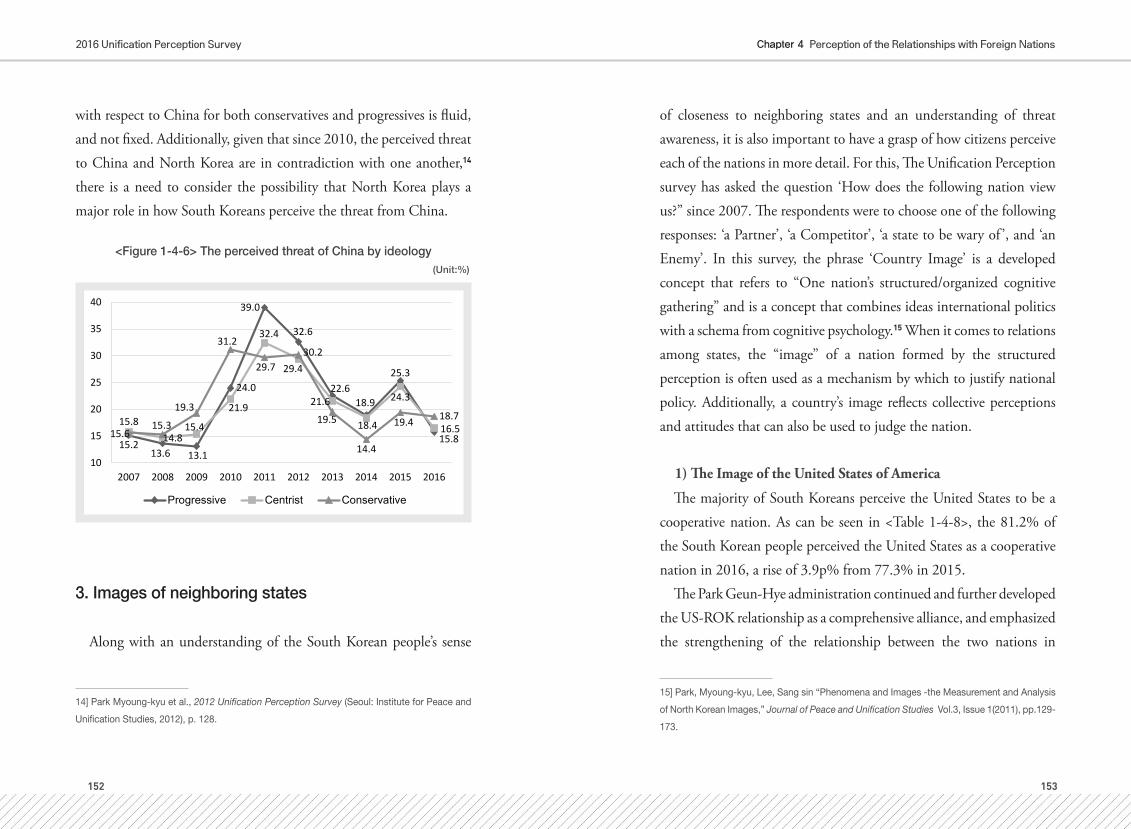
152 153
Chapter 4 Perception of the Relationships with Foreign Nations 2016 Unification Perception Survey
with respect to China for both conservatives and progressives is fluid, and not fixed. Additionally, given that since 2010, the perceived threat to China and North Korea are in contradiction with one another,14 there is a need to consider the possibility that North Korea plays a major role in how South Koreans perceive the threat from China.
<Figure 1-4-6> The perceived threat of China by ideology(Unit:%)
15.213.6 13.1
24.0
39.0
32.6
22.618.9
25.3
15.815.814.8
15.4
21.9
32.4
29.4
21.6
18.4
24.3
16.515.615.3
19.3
31.2
29.730.2
19.5
14.4
19.4 18.7
10
15
20
25
30
35
40
2007 2008 2009 2010 2011 2012 2013 2014 2015 2016
Progressive Centrist Conservative
3. Images of neighboring states
Along with an understanding of the South Korean people’s sense
14] Park Myoung-kyu et al., 2012 Unification Perception Survey (Seoul: Institute for Peace and
Unification Studies, 2012), p. 128.
of closeness to neighboring states and an understanding of threat awareness, it is also important to have a grasp of how citizens perceive each of the nations in more detail. For this, The Unification Perception survey has asked the question ‘How does the following nation view us?” since 2007. The respondents were to choose one of the following responses: ‘a Partner’, ‘a Competitor’, ‘a state to be wary of ’, and ‘an Enemy’. In this survey, the phrase ‘Country Image’ is a developed concept that refers to “One nation’s structured/organized cognitive gathering” and is a concept that combines ideas international politics with a schema from cognitive psychology.15 When it comes to relations among states, the “image” of a nation formed by the structured perception is often used as a mechanism by which to justify national policy. Additionally, a country’s image reflects collective perceptions and attitudes that can also be used to judge the nation.
1) The Image of the United States of America
The majority of South Koreans perceive the United States to be a cooperative nation. As can be seen in <Table 1-4-8>, the 81.2% of the South Korean people perceived the United States as a cooperative nation in 2016, a rise of 3.9p% from 77.3% in 2015.
The Park Geun-Hye administration continued and further developed the US-ROK relationship as a comprehensive alliance, and emphasized the strengthening of the relationship between the two nations in
15] Park, Myoung-kyu, Lee, Sang sin “Phenomena and Images -the Measurement and Analysis
of North Korean Images,” Journal of Peace and Unification Studies Vol.3, Issue 1(2011), pp.129-
173.

154 155
Chapter 4 Perception of the Relationships with Foreign Nations 2016 Unification Perception Survey
response to the increasing threat posed by North Korea’s fourth and fifth nuclear test, short, medium, and long range ballistic missile tests and submarine missile launches. The number of respondents who said that the United States was ‘cooperative’, being the highest ever, reflects the perception of North Korea’s threat given continued provocations, and through this it can be concluded that the South Korean government’s stance and efforts in these regards have also helped create a consensus among the general public. It is clear that even when compared with the time of the Lee Myung-Bak administration, during the period of the Park Geun-Hye administration the view of a cooperative United States has become yet stronger. Overall, the South Korean people view the United States to be fairly unchanging and in very extremely positive terms. This shows that the perception of the United States as a traditional ally of South Korea, a friend, and a partner is inherent in South Koreans.
<Table 1-4-8> Image of the United States as a country
(Unit:%)
2007 2008 2009 2010 2011 2012 2013 2014 2015 2016
Cooperative 53.2 70.2 73.6 76.4 75.0 77.3 79.9 81.0 77.3 81.2
Competitor 22.0 13.0 13.7 14.6 14.2 11.0 11.8 11.7 15.3 11.9
Cautious 22.0 14.8 11.7 8.2 9.7 10.9 7.8 6.8 6.9 6.6
Hostile Power 2.9 2.0 0.9 0.8 1.1 0.8 0.6 0.5 0.5 0.3
Total(N) 1,198 1,213 1,203 1,200 1,201 1,200 1,200 1,200 1,199 1,200
We also asked respondents about how they believe neighboring
states would respond to the outbreak of war on the Korean peninsula in relation to the image of neighboring countries. We did this in order to understand how neighboring countries will respond with a focus on military security rather than general attitudes toward and perceptions of given states. The results in <Table 1-4-9> show, when looking at the connection between the perception towards the United States and how the United States will react to a war on the Korean peninsula, how respondents answered the following questions: Would the United States would consider its own interests first when war breaks out on the Korean peninsula, and would the United States support South Korea or North Korea in the event of war?
74.1% of the respondents claimed that the United States would support South Korea in the event of an outbreak of war on the Korean peninsula, 22.1% claimed that the United States would ‘Consider its own interests’, 2.4% believed ‘the United States would support North Korea’, and 1.4% believed that ‘the United States would stay neutral’. Considering the geopolitical importance of the Korean peninsula, and the continuation of the US-ROK alliance, it is extremely unlikely that the United States would not intervene in the event of an outbreak of war. In other words, most South Koreans believe that the United States would help South Korea, or at least, not want any other neighboring state to seek to determine what happens on the Korean peninsula for the sake of its interests.16 In 2010, those who responded
16] Park Myoung-kyu et al., 2014 Unification Perception Survey (Seoul: Institute for Peace and
Unification Studies, 2014), p. 186.

156 157
Chapter 4 Perception of the Relationships with Foreign Nations 2016 Unification Perception Survey
that “The United States would help South Korea” hit 70% for the first time, and this has since changed little, hovering between 70%-75%. Additionally, throughout the survey period compared to other neighboring countries, the United States is overwhelmingly on top.
<Table 1-4-9> Attitude towards the United States, the possibility of war
(Unit:%)
2007 2008 2009 2010 2011 2012 2013 2014 2015 2016
Help South Korea 50.6 57.4 65.1 74.7 72.4 72.8 75.2 74.0 70.5 74.1
Help North Korea 1.3 1.4 0.7 0.7 1.6 1.8 1.6 1.8 4.9 2.4
Look After their own interest
45.5 37.4 32.3 23.0 24.1 23.8 20.9 22.6 22.6 22.1
Stay Neutral 2.6 3.8 2.0 1.7 1.9 1.6 2.3 1.6 2.0 1.4
Total(N) 1,200 1,213 1,203 1,200 1,201 1,200 1,200 1,200 1,200 1,200
2) Image of Japan
The South Korean people perceive Japan to be less “cooperative” and more as a “competitor” or a country to be “cautious” of. Japan shares many values with South Korea as an ally of the United States and is also another democracy and market economy in East Asia, but recently the country image of Japan amongst South Koreans has been influenced by a worsening ROK-Japanese relations. Growing negativity has certainly not had a positive impact on how Japan is perceived by South Koreans. In 2016, 16.4% of the respondents stated they thought Japan was ‘cooperative’ whilst 41.0% judged Japan as being a ‘Competitor’. In
other words, it can be argued that Japan seems more as a ‘Competitor’ and less as a ‘Cooperative’ nation. Compared to the United States, China, and Russia, Japan had the lowest ‘Cooperative’ image and was most likely to be considered an ‘Enemy’. It can be deduced that a lot of the negative perception towards Japan within the minds of South Korean people reflects past conflicts between the nations. Nonetheless, over past two years, the perception of Japan as ‘Cooperative’ has risen whilst its image as a ‘Competitor’ and ‘Enemy’ has declined. Early in the Park Geun-Hye administration, conflicts regarding history that included the comfort women issue, and claims to the (Dokdo) were considered to be damaging and it has been argued that these tensions will continue to have an effect in the non-political sphere. The ROK-Japanese summit of November 2015, and the settlement that resulted from the comfort women negotiations in the same year, as well as the summits in March and September of 2016 showed that there was a possibility for improvements in bilateral relations between the two countries. Even though it was not reflected in the Unification Perception Survey this year, the controversy surrounding the recent signing of the General Security of Military Information Agreement (GSOMIA) between Japan and South Korea (November 2016) shows that negative views of cooperation in national defense between South Korea and Japan persist. We will have to continue to keep an eye on how South Koreans feel towards Japan taking into account future developments with the historical issues between the two nations, and problems with military issues.

158 159
Chapter 4 Perception of the Relationships with Foreign Nations 2016 Unification Perception Survey
<Table 1-4-10> Image of the Japan as a country
(Unit:%)
2007 2008 2009 2010 2011 2012 2013 2014 2015 2016
Cooperative 14.6 16.7 19.5 14.3 13.8 16.9 11.8 11.4 12.3 16.4
Competitor 46.6 35.6 49.4 50.9 40.8 35.3 41.4 27.0 35.3 41.0
Cautious 30.3 31.0 26.2 28.0 34.6 35.8 35.3 44.0 40.6 33.9
Hostile Power 8.5 16.7 4.9 6.8 10.7 12.0 11.4 17.5 11.9 8.8
Total(N) 1,196 1,211 1,203 1,200 1,201 1,200 1,200 1,199 1,200 1,200
The majority of respondents had the opinion that ‘If war were to break out on the Korean peninsula, the Japan would look after its own interests’. As can be seen in chart <1-4-11>, in the event of an outbreak of war on the Korean peninsula, respondents saying ‘Japan would help South Korea’ totaled 8.5% in 2016, and this has fallen consistently since 2009. ‘Japan would look after its own interests’ totaled 74.5% in 2016, the highest among all other surveyed neighboring countries, after increasing from 71.6% in 2015. ‘Japan would help South Korea’ respondents in 2009 totaled at 24.6%, but this has consistently stayed under 10% since 2014.
<Table 1-4-11> Attitude towards Japan, the possibility of war
(Unit:%)
2007 2008 2009 2010 2011 2012 2013 2014 2015 2016
Help South Korea 16.2 14.7 24.6 17.1 15.3 11.6 11.3 7.8 7.7 8.5
Help North Korea 3.3 4.3 3.7 2.3 3.2 5.0 2.9 7.5 9.2 6.1
2007 2008 2009 2010 2011 2012 2013 2014 2015 2016
Look After their own interest
72.7 69.4 66.0 71.6 74.3 75.4 75.1 74.9 71.6 74.5
Stay Neutral 7.9 11.6 5.7 9.1 7.2 8.0 10.7 9.8 11.5 10.9
Total(N) 1,200 1,211 1,201 1,200 1,201 1,199 1,200 1,199 1,201 1,200
3) Image of China
With the rise of China, China’s influence has not been limited only to South Korea’s national politics, economics and culture. Their influence on the Korean peninsula as a whole and more broadly in East Asia continues to grow as well. Since Xi Jinping came to power, the Asia Infrastructure Investment Bank (AIIB) and ‘One Belt, One Road’ strategy have been key elements in China’s bid to actively promote the construction of a regional economy that is centered on its own interests. What’s more, during the Sino-US summit in 2013 China proposed its ‘New Great Power Relations’ and has been actively seeking to build a Chinese-centered order as an emergent global power.17 The image and attitude that South Koreans have towards China as well as the status of China has been changing for a long time. It is evident from the Unification Perception Survey that South Koreans perceive China differently from United States and Japan. The issue of how ‘South
17] Kim Hyun-wook, “The Obama Administration’s East Asia policy and South Korea’s re-
sponse,” Multilateral International Cooperation and South Korean Diplomacy, 2014 The Korean
Association of international Studies -Jeju Peace Institute Joint Conference (30th October 2014),
p. 42.

160 161
Chapter 4 Perception of the Relationships with Foreign Nations 2016 Unification Perception Survey
Koreans perceive China’ needs to be judged carefully as it may be an important indicator both for the Korean peninsula and for perception of neighboring countries.
It is clear from <Table 1-4-12> that a plurality (39.4%) viewed China as having a ‘Competitor’ image, 30% viewed China as ‘Cooperative’, and 27.6% viewed China as a state that South Korea needs to be ‘Cautious’ of. Only 2.9% of the respondents viewed China as an ‘enemy’. Through this, it can be seen that China’s ‘Cooperative’, ‘Competitor’ and ‘Cautious’ image is complex and multi-faceted. In fact, the pattern of South Korean perception surrounding China was relatively fixed until 2011; China was seen largely as a ‘Competitor’ and a state to be ‘Cautious of ’, having a ‘Cooperative’ image only at about 20% of the respondents.
However since 2012, perception of China as cooperative has consistently risen and as a result, the perception of it as either ‘competitor or a state to be ‘cautious’ of has fallen. In 2016, perception of China as ‘Cooperative’ fell 3.9p% from 33.9% in 2015 to 30.0% and the ‘Cautious’ image had increased 3.4p% from 24.2% to 27.6%. Feelings of closeness had increased and the perceived threat had decreased, this trend is expected to continue going forward. It is possible that during the last 1-2 years the North Korea nuclear issue had been reflected in the ‘Cooperative’ image decreasing (34.0% in 2014, 33.9% in 2015, 30% in 2016) and the increase in the ‘Cautious’ response (24.2% in 2015, 27.6% in 2016). The percentage of respondents answering that “China plays a large role in the worsening relationship between South Korea and North Korea” increased from
51.2% in 2015 to 56.6% in 2016. It can be inferred that there are structural forces behind the reason why the South Korean perception of China being ‘Cooperative’ did not increase more. That is, given the external growth and development in the Sino-ROK economic, cultural and inter-personal relations, they lack a sense of mutual trust in the issues of North Korea’s nuclear program and unification.
This has much to do with China’s strategy of expanding what it perceives as its core interests on the Korean peninsula: North Korea in the sphere of political security, and South Korea as a partner in economic development.18 This implies that, although Sino-ROK relations had further developed through the ‘Comprehensive Cooperative Partnership’ (2003) and the ‘Strategic Cooperative Partnership’ (2008), the relationship between the two countries needs to be reinforced and diversified. To this end, it is very important to promote trust and cooperation in the areas of diplomacy and security including North Korean issues. In the short-term, China not only needs to participate in sanctions against North Korea and to be persuaded to actively cooperate, but will also need to understand South Korea’s view of unification at a fundamental level.
18] Park Jong-chul, “South Korea’s vision of unification and tasks in Sino-Korean cooperation,”
Directions and Tasks in Sino-South Korean Relations aimed at Korean Unification and collec-
tive prosperity in Northeast Asia, Institute for Peace and Unification Studies at Seoul National
University-Center for Korean Peninsula Research at Peking University Korean Peninsula Issues
Forum (27th November 2015).
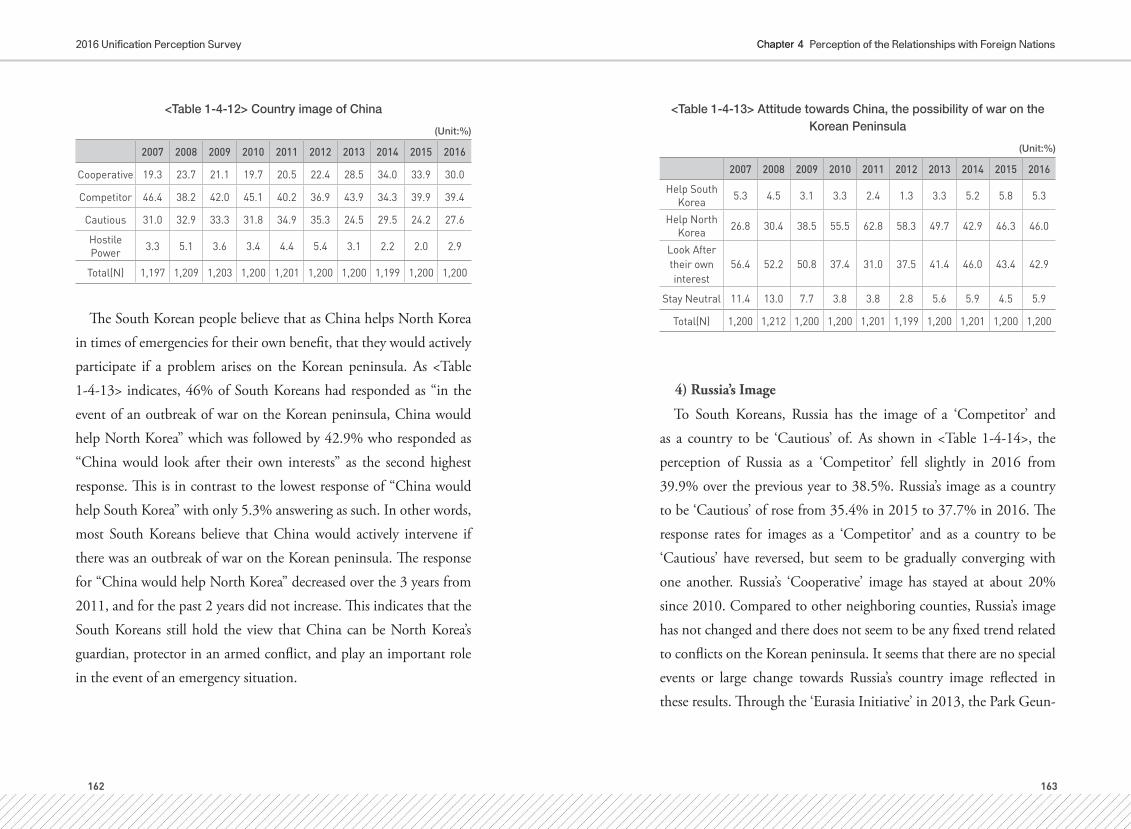
162 163
Chapter 4 Perception of the Relationships with Foreign Nations 2016 Unification Perception Survey
<Table 1-4-12> Country image of China
(Unit:%)
2007 2008 2009 2010 2011 2012 2013 2014 2015 2016
Cooperative 19.3 23.7 21.1 19.7 20.5 22.4 28.5 34.0 33.9 30.0
Competitor 46.4 38.2 42.0 45.1 40.2 36.9 43.9 34.3 39.9 39.4
Cautious 31.0 32.9 33.3 31.8 34.9 35.3 24.5 29.5 24.2 27.6
Hostile Power 3.3 5.1 3.6 3.4 4.4 5.4 3.1 2.2 2.0 2.9
Total(N) 1,197 1,209 1,203 1,200 1,201 1,200 1,200 1,199 1,200 1,200
The South Korean people believe that as China helps North Korea in times of emergencies for their own benefit, that they would actively participate if a problem arises on the Korean peninsula. As <Table 1-4-13> indicates, 46% of South Koreans had responded as “in the event of an outbreak of war on the Korean peninsula, China would help North Korea” which was followed by 42.9% who responded as “China would look after their own interests” as the second highest response. This is in contrast to the lowest response of “China would help South Korea” with only 5.3% answering as such. In other words, most South Koreans believe that China would actively intervene if there was an outbreak of war on the Korean peninsula. The response for “China would help North Korea” decreased over the 3 years from 2011, and for the past 2 years did not increase. This indicates that the South Koreans still hold the view that China can be North Korea’s guardian, protector in an armed conflict, and play an important role in the event of an emergency situation.
<Table 1-4-13> Attitude towards China, the possibility of war on the Korean Peninsula
(Unit:%)
2007 2008 2009 2010 2011 2012 2013 2014 2015 2016
Help South Korea 5.3 4.5 3.1 3.3 2.4 1.3 3.3 5.2 5.8 5.3
Help North Korea 26.8 30.4 38.5 55.5 62.8 58.3 49.7 42.9 46.3 46.0
Look After their own interest
56.4 52.2 50.8 37.4 31.0 37.5 41.4 46.0 43.4 42.9
Stay Neutral 11.4 13.0 7.7 3.8 3.8 2.8 5.6 5.9 4.5 5.9
Total(N) 1,200 1,212 1,200 1,200 1,201 1,199 1,200 1,201 1,200 1,200
4) Russia’s Image
To South Koreans, Russia has the image of a ‘Competitor’ and as a country to be ‘Cautious’ of. As shown in <Table 1-4-14>, the perception of Russia as a ‘Competitor’ fell slightly in 2016 from 39.9% over the previous year to 38.5%. Russia’s image as a country to be ‘Cautious’ of rose from 35.4% in 2015 to 37.7% in 2016. The response rates for images as a ‘Competitor’ and as a country to be ‘Cautious’ have reversed, but seem to be gradually converging with one another. Russia’s ‘Cooperative’ image has stayed at about 20% since 2010. Compared to other neighboring counties, Russia’s image has not changed and there does not seem to be any fixed trend related to conflicts on the Korean peninsula. It seems that there are no special events or large change towards Russia’s country image reflected in these results. Through the ‘Eurasia Initiative’ in 2013, the Park Geun-

164 165
Chapter 4 Perception of the Relationships with Foreign Nations 2016 Unification Perception Survey
Hye administration had sought to work with Europe and Asia in order to facilitate reform and opening in North Korea, with the ultimate aim of establishing peace on the Korean peninsula.19 South Korea’s strategy was connected with Xi Jinping’s ‘One Belt One Road’ and Putin’s second term’s New East Asian Policy of the same year. As Russia supplies natural gas and coal energy resources to the Far East which influences both South and North Korea, there is a decent possibility going forward of Russia further developing gas pipes and a railroad connecting the three countries: South Korea, North Korea, and Russia.20 This means that going forward, and depending on changes in the political environment, Russia’s image could be subject to significant change. Even though South Korea and Russia do not have the same interests in regards to military defense, Russia still has a lot of room to exert an influence on the Korean peninsula and is seeking to expand its role in the Asia-Pacific region including major Northeast Asian nations such as China and Japan. Going forward in this regard, the progress of Russia’s economic cooperation and the results thereof can open up a lot of different possibilities to have repercussions in the North-South Korea and Sino-North Korean relationships.
19] “Eurasia Initiative,” Ministry of Foreign Affairs, 23rd July 2015; http://www.mofa.go.kr/im-
age/ main/0707_eurasia.pdf.; http://www.mofa.go.kr/image/ main/0707_eurasia.pdf.
20] Shin Beom-shik, “Development and cooperation in the North Korean-Sino-Russian bor-
derlands and the regional politics of Northeast Asia,” Yoon Young-kwan et al. North Korea in a
networked world (Seoul: Neoulpumplus, 2015) p. 311.
<Table 1-4-14> Russia’s image
(Unit:%)
2007 2008 2009 2010 2011 2012 2013 2014 2015 2016
Cooperative 22.8 28.8 28.1 21.7 24.7 24.0 22.8 22.6 21.3 20.2
Competitor 40.3 35.2 39.8 40.6 39.3 32.9 38.5 30.2 39.9 38.5
Cautious 32.1 31.9 29.8 33.5 33.1 38.1 34.8 43.3 35.4 37.7
Hostile Power 4.7 4.1 2.3 4.3 2.8 5.0 4.0 4.0 3.4 3.6
Total(N) 1,195 1,209 1,203 1,200 1,201 1,200 1,200 1,200 1,199 1,200
There is no marked trend when asked the attitudes of South Korean citizens regarding how Russia would react to an outbreak of war on the Korean peninsula. As can be seen in <Table 1-4-15> 14.6% of the respondents had stated that “Russia would support North Korea” in 2016, a decrease of 9.2p% from 23.8% in 2015, but the response that “Russia would support South Korea” also increased 3.8%. The highest response by a large margin was that “Russia would look after its own interests” with 64.4% responding as such, the second highest among the neighboring nations, following Japan. Additionally, compared to the United States, China, and Japan, the response that “Russia would keep neutral” has the highest number of responses. The response ‘Help North Korea’ was lower than China, and ‘Look after their own interests’ dominated the responses, and ‘Stay neutral’ responses were, compared to other countries, the highest. These mean that perception of Russian in regards to the Korean peninsula may be subject to considerable change in the future. In particular, potential benefits Russia obtains from unification largely overlap with development in

166 167
Chapter 4 Perception of the Relationships with Foreign Nations 2016 Unification Perception Survey
Russia’s Far East and Siberia. Since Russia does not want to be excluded from the process of unification, and Russia is worried about China’s excessive influence in Northeast Asia and North Korea, in the event of an emergency Russia would likely act just like China and actively intervene in matters on the Korean peninsula.
<Table 1-4-15> Attitude towards Russia, the possibility of war on the Korean Peninsula
(Unit:%)
2007 2008 2009 2010 2011 2012 2013 2014 2015 2016
Help South Korea 3.7 6.0 4.3 5.8 4.2 3.7 3.8 3.3 3.3 3.8
Help North Korea 19.0 20.9 22.5 19.2 15.4 11.8 12.4 14.5 23.8 14.6
Look After their own interest
59.1 54.7 57.7 59.5 61.7 68.1 67.4 68.5 59.2 64.4
Stay Neutral 18.2 18.4 15.5 15.6 18.8 16.3 16.4 13.7 13.8 17.2
Total(N) 1,199 1,211 1,200 1,200 1,200 1,199 1,200 1,201 1,200 1,200
4. Expected roles of neighboring states in Korean unification
It is clear that unification is an endeavor that should be dominated by South and North Korea, but when taking into account the national interests and close ties between neighboring countries, especially the United States, China, Japan, and Russia, mediating the conflicting interests of relevant states to induce cooperation among them is
extremely important. Unification should bring a fundamental change to the status quo, which will yield varying costs and benefits for each state. In this regard, in order to improve inter-Korean relations and achieve unification, it is necessary to understand the interests of the neighboring countries, and resolve any potential worries in order to create a favorable environment for unification. The first of which is to understand how the public perceives the roles of the different neighboring countries during the unification process.
The Unification Perception survey asked “How necessary is the support and cooperation of neighboring countries during the process of unification between North and South Korea?” The results are as shown below in <Table 1-4-16>.
<Table 1-4-16> Needed cooperation of neighboring country for unification
(Unit:%)
2008 2009 2010 2011 2012 2013 2014 2015 2016
United States
Required 42.0 45.2 51.5 48.2 45.5 45.8 47.5 44.7 44.6
Desired 48.9 47.7 42.8 43.7 44.8 46.1 45.7 45.9 47.1
Not Desired 7.1 5.2 4.7 5.7 6.8 6.6 5.5 8.1 7.1
Not Needed 2.1 1.8 1.0 2.3 3.0 1.5 1.3 1.3 1.3
Japan
Required 18.5 20.4 19.2 19.7 16.8 14.0 13.7 13.1 12.1
Desired 52.4 58.9 57.4 52.0 51.2 51.8 51.7 47.3 46.3
Not Desired 22.9 16.2 19.8 22.8 25.1 27.8 26.7 31.3 33.7
Not Needed 6.2 4.5 3.7 5.4 6.9 6.4 8.0 8.3 7.9
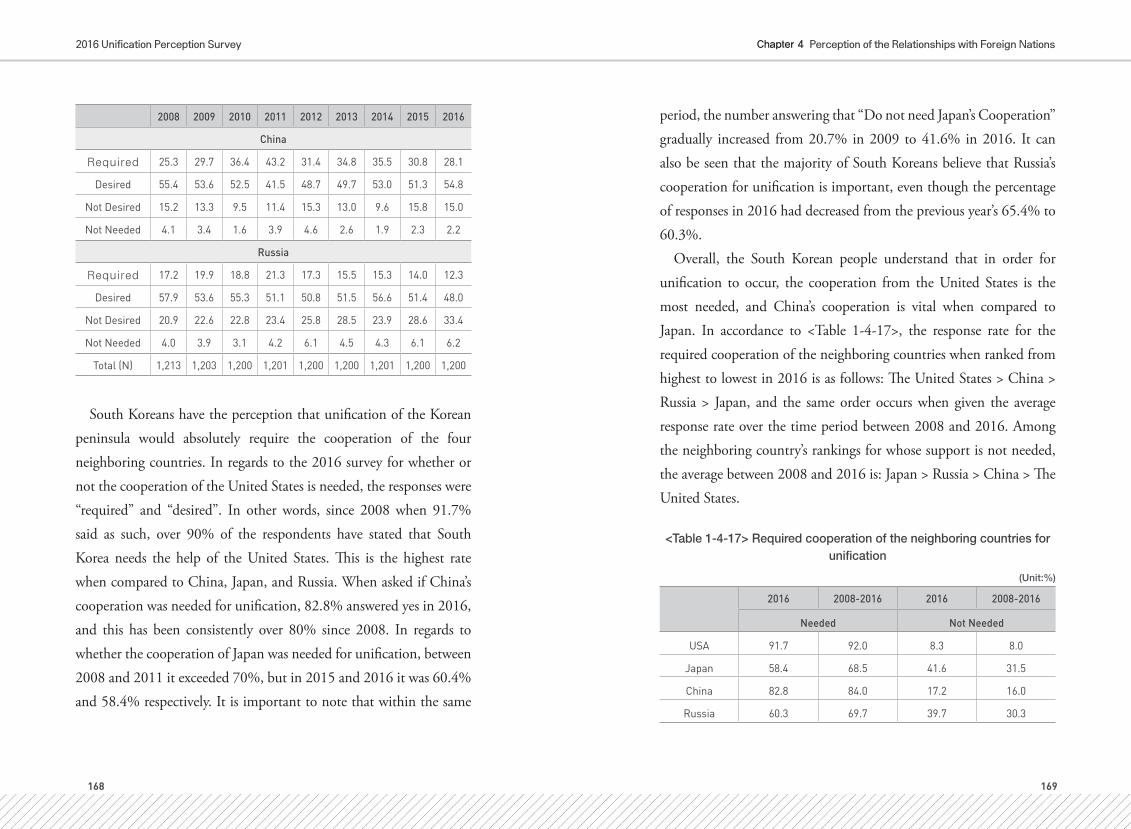
168 169
Chapter 4 Perception of the Relationships with Foreign Nations 2016 Unification Perception Survey
2008 2009 2010 2011 2012 2013 2014 2015 2016
China
Required 25.3 29.7 36.4 43.2 31.4 34.8 35.5 30.8 28.1
Desired 55.4 53.6 52.5 41.5 48.7 49.7 53.0 51.3 54.8
Not Desired 15.2 13.3 9.5 11.4 15.3 13.0 9.6 15.8 15.0
Not Needed 4.1 3.4 1.6 3.9 4.6 2.6 1.9 2.3 2.2
Russia
Required 17.2 19.9 18.8 21.3 17.3 15.5 15.3 14.0 12.3
Desired 57.9 53.6 55.3 51.1 50.8 51.5 56.6 51.4 48.0
Not Desired 20.9 22.6 22.8 23.4 25.8 28.5 23.9 28.6 33.4
Not Needed 4.0 3.9 3.1 4.2 6.1 4.5 4.3 6.1 6.2
Total (N) 1,213 1,203 1,200 1,201 1,200 1,200 1,201 1,200 1,200
South Koreans have the perception that unification of the Korean peninsula would absolutely require the cooperation of the four neighboring countries. In regards to the 2016 survey for whether or not the cooperation of the United States is needed, the responses were “required” and “desired”. In other words, since 2008 when 91.7% said as such, over 90% of the respondents have stated that South Korea needs the help of the United States. This is the highest rate when compared to China, Japan, and Russia. When asked if China’s cooperation was needed for unification, 82.8% answered yes in 2016, and this has been consistently over 80% since 2008. In regards to whether the cooperation of Japan was needed for unification, between 2008 and 2011 it exceeded 70%, but in 2015 and 2016 it was 60.4% and 58.4% respectively. It is important to note that within the same
period, the number answering that “Do not need Japan’s Cooperation” gradually increased from 20.7% in 2009 to 41.6% in 2016. It can also be seen that the majority of South Koreans believe that Russia’s cooperation for unification is important, even though the percentage of responses in 2016 had decreased from the previous year’s 65.4% to 60.3%.
Overall, the South Korean people understand that in order for unification to occur, the cooperation from the United States is the most needed, and China’s cooperation is vital when compared to Japan. In accordance to <Table 1-4-17>, the response rate for the required cooperation of the neighboring countries when ranked from highest to lowest in 2016 is as follows: The United States > China > Russia > Japan, and the same order occurs when given the average response rate over the time period between 2008 and 2016. Among the neighboring country’s rankings for whose support is not needed, the average between 2008 and 2016 is: Japan > Russia > China > The United States.
<Table 1-4-17> Required cooperation of the neighboring countries for unification
(Unit:%)
2016 2008-2016 2016 2008-2016
Needed Not Needed
USA 91.7 92.0 8.3 8.0
Japan 58.4 68.5 41.6 31.5
China 82.8 84.0 17.2 16.0
Russia 60.3 69.7 39.7 30.3

170 171
Chapter 4 Perception of the Relationships with Foreign Nations 2016 Unification Perception Survey
It was assumed for the purposes of this survey that South Korean popular attitudes formed the basis for their perception of neighboring countries with respect to unification. The Unification Perception Survey had asked the question “If the United States and North Korea played against each other during the World Cup, who would you root for?” The question was asked in order to examine the differences in the values of the inter-Korean relation and the North Korea-US relationship, as the United States has the highest closeness among the surrounding countries with South Korea in survey results, and is expected to play the most important role in peace on the Korean peninsula, while North Korea is the largest threat to peace on the Korean peninsula.
As can be seen in <Table 1-4-18> 46.9% said they would “cheer for North Korea” in 2016, the lowest since the beginning of the survey since 2007, and the first time the response had dropped below 50%. The response that “I wouldn’t cheer for either team” was 20.2%, almost identical to 2015’s response of 20.1%. Even though it is simply a hypothetical sports match, it is clear that plurality of people “would cheer for North Korea”. This confirmed that the perceptions that South Koreans have of North Korea are both complex and dualistic.
Even though perception of the United States and North Korea are polar opposites in regards to their perceived threat to peace, many South Koreans would still cheer for North Korea. Even though ethnic sentiments may explain some of this, there is a change which is observable in the data. The number of people responding “I would cheer for North Korea” has consistently decreased in recent years.
This means that the decrease in feelings of closeness towards North Korea and the increase in North Korea’s perceived threat are probably not unrelated. When viewed by age groups, an interesting point is observable in regards to those in their 20s who had the lowest rate of response for “cheering for North Korea” (responses by age were 60s+: 51.8% > 40s: 50.6% > 50s: 49.9% > 30s: 44.4% > 20s: 35.9%) and they also had the highest rate for “not cheering for either team.” (responses by age were 60s: 16.2% < 40s: 17% < 50s: 17.2% < 30s: 23.3% < 20s: 28.9%). When asked whether those in their 20s would cheer for the United States, 19.3%, was the second highest, following respondents in the 60s of 19.8%. Therefore it can be inferred that the judgments of those in their 20s are less based on national identity than other generations.
<Table 1-4-18> Team supported if United States and North Korea play against eachother in the World Cup
(Unit:%)
2007 2008 2009 2010 2011 2012 2013 2014 2015 2016
North Korean Team 81.0 76.6 68.0 70.4 61.7 66.2 56.7 60.4 52.0 46.9
USA Team 4.0 7.0 8.4 8.6 12.9 11.3 13.4 11.5 12.5 16.6
Cheer for both Teams 6.1 6.4 9.8 9.9 10.9 9.8 11.2 11.7 15.4 16.2
Cheer for neither team 8.9 10.0 13.6 11.0 14.3 12.8 18.7 16.4 20.1 20.2
Other 0.0 0.0 0.1 0.1 0.2 0.0 0.0 0.0 0.0 0.1
Total (N) 1,197 1,212 1,198 1,196 1,201 1,200 1,199 1,199 1,200 1,200

172 173
Chapter 4 Perception of the Relationships with Foreign Nations 2016 Unification Perception Survey
Despite there being wide array of issues related to cooperation to be dealt with the realms inter-Korean relations and nearby states, since the rise of China, balancing and reconciling the concerns of the US-ROK and Sino-ROK relationships has come to be seen as a pressing and difficult issue. US-ROK relations remain at the center of South Korean diplomacy and security. However, during the period in which the South Korean government has actively worked towards improving relations with North Korea, cooperative efforts between North and South Korea were not fully aligned with cooperation between South Korea and the United States. There was a marked difference in proposed solutions and perceptions in regards to North Korea’s nuclear program between the ROK and the United States. In circumstances where there was no clear resolution or change to North Korea’s nuclear issue, relations between South Korea and the United States deteriorated due to differing approaches to the issue. Within South Korean society, as a result of the supposedly contradictory aims of ‘Improving inter-Korean relations’ and ‘cooperation between South Korea and the United States’, socio-political conflict rose to prominence, and this not only weakened the momentum for the government’s North Korea policy, but served as one of the main reasons for social conflicts.
In addition to the above, the rise of China in the 2000s created a new set of dynamics in Asia. Since its reform and opening, China has continued to grow rapidly and become a major economic powerhouse. What’s more, it has gained substantial influence in the international community since the 1990’s. In the mid-2000’s, China’s influence rose high enough to become part of the ‘G2’, joining the United States
and now widely perceived as a global power. China’s rise and increase in influence has changed the geopolitics of the Korean peninsula. Since Xi Jinping’s rise to power, the push for a “New Model of Great Power Relations”, based on the mutual understanding of China and the United States has made the Sino-ROK relationship another axis that is critical to the national interests of the Korean peninsula along with US-ROK relationship. This means that South Korea is now facing the task of how to resolve the issues on the peninsula within the context of Sino-US hegemonic competition.21 South Korea should pursue harmony rather than preferring either relations with the United States or China, but this can lead to difficult and awkward, and yet still unavoidable choices having to be made – not choosing is still a choice sometimes. The most recent instance of this is THAAD. Additionally, as to the matters for which South Korea disagrees with the United States or China, there will be situations in which South Korea will need to preemptively lead with respect to the problem of inter-Korean relations. In such a context, in order to understand the political perceptions and preferences of South Koreans, we asked the question: “Which cooperation is the most important? The Cooperation between North and South Korea, cooperation between South Korea and the United States, or cooperation with South Korea and China?” As can be seen in <Table 1-4-19>, up until 2014 the Unification Perception survey focused on the ‘North and South Korea
21] Chun Chaesung, Northeast Asia and the Korean Peninsula in the midst of Sino-American
Competition, (Seoul: Neoulpumplus, 2015), see the introduction.

174 175
Chapter 4 Perception of the Relationships with Foreign Nations 2016 Unification Perception Survey
relations’ and ‘Cooperation between the ROK and US, but starting in 2015 it included ‘South Korea and China Cooperation’ in the item to consider China’s influence with the rise of China.
<Table 1-4-19> Importance of North and South Korea relations and US-ROK alliance(2007-2014)
(Unit:%)
2007 2008 2009 2010 2011 2012 2013 2014
Relations between North
and South Korea38.3 29.8 39.1 38.1 39.2 35.9 33.8 31.0
Cooperation with USA 17.6 20.2 19.0 19.2 20.8 19.4 20.2 23.9
Both are Important 44.1 50.0 41.9 42.8 40.0 44.7 46.0 45.1
Total (N) 1,196 1,206 1,200 1,195 1,200 1,200 1,200 1,194
As can be seen in <Table 1-4-20>, when asked “In regards to the unification of South and North Korea, among the options of ‘cooperation of North and South Korea’, ‘cooperation of South Korea and the United States’, and ‘cooperation of South Korea and China’, which do you think is the most important?”, the highest response rate in 2015 was for “All are important” at 36.0%, which dropped to 32.0% in 2016. In 2016, the highest response was for ‘Cooperation between North and South Korea’ being the most important at 34.9%, followed by ‘Cooperation between South Korea and the United States’ at 26.1%. The lowest response rate in 2015 was for ‘Cooperation of South Korea and China’ at 7.0%. These results show that South Koreans see “North-South Relations”, “Cooperation between South
Korea and the United States”, and “Cooperation between South Korea and China” as what we should take a side out of them rather than something we should consider simultaneously.22 The result that no single country was decisively at the forefront of the South Koreans’ minds as their main partner in cooperation also implies that their political orientation for choice or balance in this matter was not clear. What’s more, South Koreans perceived the inter-Korean relationship as more important than the cooperation with the United States meaning that there exists the potential for conflict between those who would prioritize inter-Korean cooperation and those who would prioritize US-ROK conflict. Even though the 2016 response for “the cooperation between South Korea and China” is very low, depending on the situation ahead, this may become an important factor in the relationship between the two Koreas and the cooperation between South Korea and the United States.
22] Lee Jung-nam and Ha Do-hyung, “Changes in South Korean perception of the United States
and China amidst deepening Sino-American competition,” in Lee Nae-young, Yun In-jin eds.
South Korean Identity: Change and Continuity, 2005-2015, (Seoul: East Asia Institute, 2016), p.
250. Although the questions and survey methods differ, the East Asian Institute’s 2015 ‘Identity
of South Koreans Survey’ indicates that South Koreans believe Korea should seek a balanced
relation with both sides rather than strengthening ties with one over the other.

176 177
Chapter 4 Perception of the Relationships with Foreign Nations 2016 Unification Perception Survey
<Table 1-4-20> Importance of North and South Korea relations and cooperation with the United States and China
(Unit:%)
2015 2016
Cooperation Between North and South Korea 32.8 34.9
Cooperation Between South Korea and USA 24.6 26.1
Cooperation Between South Korea and China 6.6 7.0
All Are Important 36.0 32.0
Total (N) 1,200 1,200
When we compared response to the importance of North Korea and South Korea Relations and the cooperation with the United States and China by ideology, we were able to verify the following. As can be seen in <Table 1-4-21>, the progressive respondents compared to other political ideologies, think that the relationship between South Korea and North Korea to be the most important. The responses by ideology for “The relationship between South Korea and North Korea is the most important” were progressives (41.1%) > centrists (33%) > conservatives (32.3%). The responses for “The cooperation between South Korea and the United States” were centrists (27.3%) > conservatives (24.9%) > progressives (24.5%). As the difference between the conservatives and the progressives were only 0.4%, it can be argued that both the conservatives and the progressives attached similar levels of importance to cooperation between South Korea and the United States.
<Table 1-4-21> Importance of North and South Korea relations and the cooperation with the United States and China by political affiliation
(Unit:%)
Cooperation Between North
and South Korea
Cooperation Between South Korea and USA
Cooperation with South Korea and
China
All Are Important
Progressives 41.1 24.5 6.1 28.3
Centrists 33.0 27.3 7.2 32.5
Conservatives 32.3 24.9 7.8 35.0
Total(N) 419 312 84 385
5. Sub-conclusion
The following can be observed about responses regarding neighboring countries in the 2016 Unification Perception Survey. First, closeness to the United States continues to remain strong, and on the other hand, the perceived threat of North Korea continues to rise. Despite the closeness towards the United States decreasing slightly, sentiment regarding cooperation with the United States is shared by nearly everyone regardless of age. South Koreans increasingly perceived North Korea as a threat. This is presumed to reflect the heightened tensions on the Korean Peninsula stemming from repeated nuclear and missile tests, and the deterioration of public opinion. Not only do South Koreans collectively perceive an increase in threat of North Korea and a worsening view on the North Korean regime, with no regards to ideology and age, but there is also a need for considering

178 179
Chapter 4 Perception of the Relationships with Foreign Nations 2016 Unification Perception Survey
reconciliation and cooperation between South and North Korea and unification.
Second, it is evident that there is a positive perception of the United States, and a sense of distance and vigilance towards North Korea amongst South Koreans in their 20s. In accordance with 2016 survey results, those in their 20s have the highest degree of closeness with the United States, and the lowest levels of closeness with respect to North Korea. A favorable view of the United States is likely to continue to rise among the younger generations as long as no events occur that exerts a negative influence on such a friendly view of the United States and there is no significant increase in closeness towards China. However, such positive views could change depending on what the Trump administration pursues in the region going forward. When considering South Korean’s overall perceived threat of North Korea as a result of North Korea’s provocations, and the instability of Kim Jong-Un’s administration, there is no expected significant shift in the attitudes or policies toward the North Korea. Instead, North Korea’s nuclear and missile launches continue to impede the creation of a secure environment, and the perceptions and attitudes of those in their 20s may harden. As those in their 20s have a realistic perspective on the security of the Korean peninsula, a new approach and methodology will be needed to deal with their negative perceptions towards the unification issue.
Third, whilst South Koreans believe that the unification process will require the cooperation of all four neighboring countries, the United States, Japan, China, and Russia, there are differences in the degree of
importance attached to each. South Koreans have the belief that the support from the United States is the most important, and China’s support is more necessary than Japan’s. As a means by which to achieve unification, South Koreans tend to perceive relationships with those foreign countries as a matter of choice of whom to cooperate with more. South Koreans think that the support of China is important, but that of the United States is key to unification of the Korean peninsula. However, when compared to ‘cooperation between South Korea and North Korea’ and ‘cooperation between South Korea and the United States’, the relationship with China drops further down the list of priorities. Nevertheless, this may change due to China’s rising influence, change in Sino-ROK relations, and China’s intervention in the North Korean-related matters. As such, it is important to note trends in South Korean’s popular perception are still not set in stone.
The international environment surrounding the Korean peninsula since the end of the Cold War has been in transition. Should Sino-US competition come to dominate regional relations, establishing relations with the neighboring countries and creating a regional consensus for a peaceful unification would be an extremely difficult and complicated endeavor. For the development of inter-Korean relations and unification, the pursuit of harmony and balance between South Korea – the United States and South Korea – China relationships is essential, but many elements of mutual friction and conflict exist. Economic conflicts between China, who is rising to become a powerful nation, and the current hegemon, the United States, the durability and belligerence of the Kim Jong-Un regime,

180 181
Chapter 4 Perception of the Relationships with Foreign Nations 2016 Unification Perception Survey
and the Trump administration’s policies towards Asia are the main valuables that will affect the situation on the Korean peninsula. While deepening cooperation between South Korea and the United States, it is critical to establish a diplomatic relation with China that would lead it to support the goal of unification.
Looking at the results of the last decade of the Unification Perception survey, in accordance with changes in the international environment, ups and downs of the inter-Korean relations, and multilateral diplomatic efforts, the attitudes and perceptions of South Koreans towards the neighboring countries have constantly been changing. Attitudes and perceptions of the people may not be directly affecting foreign policy decisions making at the government level. In that the results of government policies towards North Korea and unification diplomacy do affect the perceptions of citizens, and citizens can demand change which in turn can affect government strategy, however, we must remain sensitive to popular perception going forward.

Section 2
In-depth Analysis
Chapter 5 Attribution of Responsibility for
Deteriorating Inter-Korean Relations
Chapter 6 Ideology, Partisanship, and
Perception of Unification
Chapter 7 Social Integration of North Korean
Defectors and Receptiveness to
Multiculturalism

Chapter 5 Attribution of Responsibility for Deteriorating Inter-Korean Relations2016 Unification Perception Survey
184 185
Chapter 5
Attribution of Responsibility forDeteriorating Inter-Korean Relations
1. Introduction
September 9th is North Korea’s Foundation Day. On September 9th
2016, at 9:30 AM (North Korea Time – 9:00AM) North Korea had
their 5th nuclear test. A few hours later, North Korea announced that
they had succeeded in reaching a new level of nuclear weaponization
that allows them to attach a nuclear weapon to a missile. The South
Korean president, Park Geun-Hye, was in an ASEAN summit
meeting in Laos at the time and canceled the rest of her schedule to
return to South Korea. The South Korean government then strongly
condemned the test, and claimed that the nuclear test, the second one
that year, was not something that could be overlooked.
One of the effects of the nuclear test held on North Korea’s Foundation
Day, is how it apparently indicated that North Korea prioritizes the
preparation of war with South Korea more than improving inter-
Korean relations or reaching a peaceful unification. Additionally, the
South Korean government warned that such a reckless provocation
from North Korea would lead down a path of self-destruction that
would leave North Korea in diplomatic isolation. The South Korean
President also emphasized the need for the country to be in a state
of emergency. In the fall of 2016, the relationship between the two
Koreas was thus as bad as any time since the Korean War.
Looking back, the deterioration of the relationship between the
two Koreas arguably has been underway since the Kim Dae-Jung and
the Roh Moo-Hyun administrations. Continued nuclear and missile
tests, the development of weapons of mass destruction that has not
stopped, the Cheonan incident, attack on Yeonpyeongdo, and the
laying of GOP series mines, are not the only military provocations by
North Korea that hurts the relationship between the two countries,
but behind the scenes North Korea is also constantly carry out acts of
cyber terrorism. Thus, in cooperation with the UN, South Korea has
imposed sanctions on North Korea, and gradually invoked stronger
sanctions in accordance with North Korea’s provocations. As a result,
since 2008, inter-Korean summits, economic exchanges, humanitarian
aid, and reunions of separated families that had symbolized an
improving relationship have stopped.
So why are the South and North relations getting worse? South

Chapter 5 Attribution of Responsibility for Deteriorating Inter-Korean Relations2016 Unification Perception Survey
186 187
Korea and the United States assert that North Korea’s military
provocations are to blame, while on the other hand, North Korea
claims that military actions by the ROK and US are the root cause,
and that South Korea and the United States’ hostile policies only make
the situation still worse. Additionally, South Korea and the United
States interpret China’s sanctions against North Korea as being half-
hearted and that China also bears some responsibility for the worsening
inter-Korean relations. As China expresses concerns regarding North
Korea’s military provocations, they also claim that South Korea and the
United States have played a role in worsening inter-Korean relations.
These differing assertions about who is responsible for worsening
inter-Korean relations have led to debates over the way South Korea
should respond to North Korea’s military provocations.
There are not only competing claims between the countries
concerned about who bears responsibility for the worsening inter-
Korean relations; there are also competing claims within South
Korea itself. The debates and controversies surrounding THAAD
(the Terminal High Altitude Area Defense) epitomize this. Not only
do North Korea, the United States, and China have opposing views
regarding its deployment, but within South Korea there are conflicting
arguments as well.
In order to develop an appropriate North Korea policy, the South
Korean government needs to establish and enforce polices that are
based on accurate analysis. Establishing a policy would be very easy if
it is in line with the views of the citizens of South Korea, but enforcing
a policy that is contrary to popular opinion would be extremely
difficult. On one hand, if the government misinterprets the popular
will, or enacts a policy on the basis of incorrect information, the
government would need to convince the public to support said policy.
This chapter and the Unification Perception Survey in general
have two goals. In this chapter, we have concentrated on analyzing
questions that relate to who bears responsibility for worsening inter-
Korean relations. The first goal was to survey how much responsibility
the South Korean public believes each country holds, and to analyze
the responses. This is because having an accurate understanding of
popular perception on matters related to inter-Korean relations
will make it possible to create more appropriate North Korea and
unification policies. The second goal is to examine whether or not
perceptions of deteriorating inter-Korean relations are related to the
differing opinions on unification, policies towards North Korea, and
neighboring countries.
This will necessitate the consideration of the differences of
opinions that exist between different political groups on the issue of
deteriorating inter-Korean relations, and what’s more, the potential
for the same political groups also differing on the unification and
North Korea-related policy. A convergence of opinions is of course

Chapter 5 Attribution of Responsibility for Deteriorating Inter-Korean Relations2016 Unification Perception Survey
188 189
the most preferable basis for policy, but even if this is not possible,
a set of policies that is compatible with different groups from across
the political spectrum will be necessary in order to draw up a set of
unification-related and North Korea-related policies which have the
approval of a majority of South Koreans.23
2. Questions and the method used in the analysis
The questions that we used in our surveys and the process through
which we analyzed them are detailed as follows. Through Seoul
National University’s Institute for Peace and Unification Studies’
annual ‘Unification Perception Survey’, we asked the following
question starting in 2009: “To what degree do you think that each
of the following countries is responsible for the deteriorating inter-
Korean relations?” The respondents had the following possible
responses for North Korea, South Korea, the United States, and Japan:
“A lot”, “Some”, “Neutral”, “Very little”, “None”.
We excluded Japan, and analyzed how much responsibility was
attributed to the remaining four countries (North Korea, South Korea,
the United States, and China) for the deterioration of inter-Korean
23] It is the personal belief of the author that there is no optimal, unitary policy solution to
the problem of Korean unification. In order for unification and North-South integration to be
achieved, even where the South Korean public is not in complete agreement, it is important that
they have “the will to unify”
relations. We rescaled the item into a three-scale one with “A lot”,
“Some”, and “Not much” by merging the three responses, “Neutral”,
“Very little”, and “None” into “Not much.” We had excluded Japan
as we judged Japan to have very little impact on the deterioration of
inter-Korean relations. Additionally, the reason why we used a three-
scale item was that it would not be informative to distinguish different
levels of responsibility when the respondent does not perceive the
country asked to hold that much of responsibility.
In our analysis of the various countries’ role in deteriorating inter-
Korean relations, we employed both an absolute and relative concept.
An absolute assessment requires the determination how much
responsibility is attributed to each relevant country with respect to
deteriorating inter-Korean relations. We then compare results with
those of previous years to see how they changed.
Relative evaluation juxtaposes two countries to see which country
has played a larger role, and then analyze the results afterwards. For
instance, with North Korea and South Korea, we would be able to
discover the perceived degree of North Korea’s involvement, compared
with that of South Korea, and determine which country, if any, is held
to be more responsible.
Through these two types of analysis, we determined whether
there is a correlation between the perceived responsibility in the
deterioration of inter-Korean relations with other unification policies

Chapter 5 Attribution of Responsibility for Deteriorating Inter-Korean Relations2016 Unification Perception Survey
190 191
and foreign policies involving North Korea and other neighboring
countries.24 In order to understand the people’s preferred policy,
we analyze the ‘Responsibility of South Korea vs North Korea” and
the “Responsibility of the United States and China” as independent
variables.25 Additionally, for this battery of responses we only analyze
the 2016 survey results. This is because the current popular perception
on the matter appears to be much more important than in previous
years in making national policies going forward.
3. Countries responsible for the deteriorating
inter-Korean relation: absolute assessment
<Table 2-5-1> shows the degree to which North Korea is responsible
for the deterioration of the inter-Korean relations. The calculated
responses are as follows: ‘A lot’ – 50-65%, ‘Some’ – 25-35%, ‘Not
much’ – 10%. The response that North Korea does not hold much
responsibility was calculated to be around 10%, and is the most
consistent of the survey. Despite 10% of the South Korean people who
24] Reasons include the need for unification, the need to denuclearize the North, the need for a
good North Korea policy, opinions regarding the reopening of the Kaesong Industrial Zone and
North-South cooperation, South Korea going nuclear, cooperation between the ROK and the
United States, and the ROK and China.
25] Whilst there are many potential states where comparison might be possible, we believe that
North Korea, South Korea, the United States, China, and South Korea are of most interest in
considering the attribution of blame in deteriorating inter-Korean relations.
claim that North Korea does not play a large role in the deterioration
of inter-Korean relations, there is a widespread view that North Korea
is responsible, at least to some degree.
<Table 2-5-1> North Korea’s responsibility for deteriorating inter-Korean relations
(Unit:%)
2009 2010 2011 2012 2013 2014 2015 2016
A lot 57.9 62.6 63.2 56.0 63.5 64.5 50.8 49.8
Some 30.3 27.0 25.8 31.3 25.3 26.3 36.3 37.3
Not a lot 11.9 10.4 11.1 12.7 11.2 9.3 12.8 12.9
Total 100.0 100.0 100.0 100.0 100.0 100.0 100.0 100.0
The remaining 90% of the South Korean people believe that North
Korea’s responsibility is either “A lot” or “Some”. The change of
perceived degree of responsibility that the North Korean side has from
‘A lot’ and ‘Some’ over the years reflects changes in the relationship
between North and South Korea. Between 2015 and 2016, the ‘A
lot’ response decreased and ‘Some’ increased. What would the reason
be for the decrease in North Korea’s perceived responsibility despite
North Korea’s continued nuclear tests and missile launches? This might
be because, while South Korean people become inured to Kim Jong-
Un’s continued provocations to put strain on inter-Korean relations,
the various policies made in response do not appear to have had any
positive effect. In other words, North Korea’s apparent responsibility
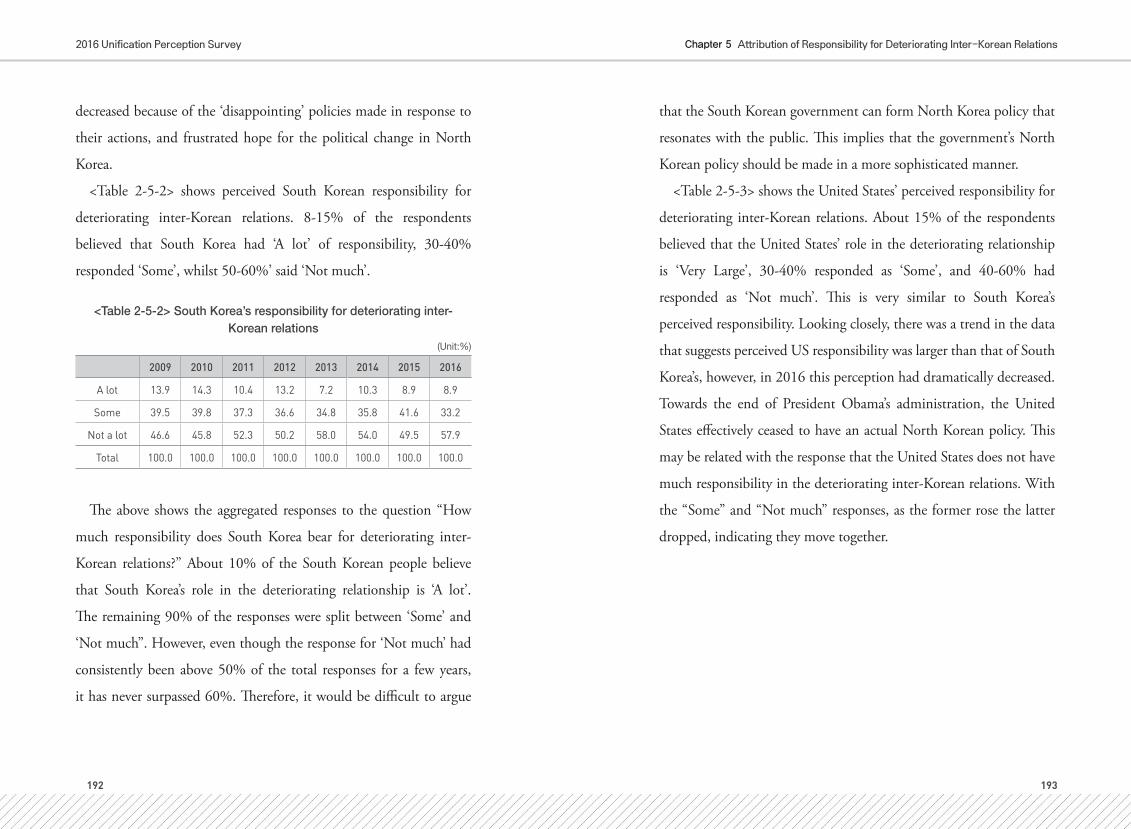
Chapter 5 Attribution of Responsibility for Deteriorating Inter-Korean Relations2016 Unification Perception Survey
192 193
decreased because of the ‘disappointing’ policies made in response to
their actions, and frustrated hope for the political change in North
Korea.
<Table 2-5-2> shows perceived South Korean responsibility for
deteriorating inter-Korean relations. 8-15% of the respondents
believed that South Korea had ‘A lot’ of responsibility, 30-40%
responded ‘Some’, whilst 50-60%’ said ‘Not much’.
<Table 2-5-2> South Korea’s responsibility for deteriorating inter-Korean relations
(Unit:%)
2009 2010 2011 2012 2013 2014 2015 2016
A lot 13.9 14.3 10.4 13.2 7.2 10.3 8.9 8.9
Some 39.5 39.8 37.3 36.6 34.8 35.8 41.6 33.2
Not a lot 46.6 45.8 52.3 50.2 58.0 54.0 49.5 57.9
Total 100.0 100.0 100.0 100.0 100.0 100.0 100.0 100.0
The above shows the aggregated responses to the question “How
much responsibility does South Korea bear for deteriorating inter-
Korean relations?” About 10% of the South Korean people believe
that South Korea’s role in the deteriorating relationship is ‘A lot’.
The remaining 90% of the responses were split between ‘Some’ and
‘Not much”. However, even though the response for ‘Not much’ had
consistently been above 50% of the total responses for a few years,
it has never surpassed 60%. Therefore, it would be difficult to argue
that the South Korean government can form North Korea policy that
resonates with the public. This implies that the government’s North
Korean policy should be made in a more sophisticated manner.
<Table 2-5-3> shows the United States’ perceived responsibility for
deteriorating inter-Korean relations. About 15% of the respondents
believed that the United States’ role in the deteriorating relationship
is ‘Very Large’, 30-40% responded as ‘Some’, and 40-60% had
responded as ‘Not much’. This is very similar to South Korea’s
perceived responsibility. Looking closely, there was a trend in the data
that suggests perceived US responsibility was larger than that of South
Korea’s, however, in 2016 this perception had dramatically decreased.
Towards the end of President Obama’s administration, the United
States effectively ceased to have an actual North Korean policy. This
may be related with the response that the United States does not have
much responsibility in the deteriorating inter-Korean relations. With
the “Some” and “Not much” responses, as the former rose the latter
dropped, indicating they move together.

Chapter 5 Attribution of Responsibility for Deteriorating Inter-Korean Relations2016 Unification Perception Survey
194 195
<Table 2-5-3> The United States’ responsibility for deteriorating inter-Korean relations
(Unit:%)
2009 2010 2011 2012 2013 2014 2015 2016
A lot 18.4 15.8 13.9 16.2 11.8 13.2 14.5 6.4
Some 43.0 40.7 35.7 34.8 32.6 36.5 32.7 34.8
Not a lot 38.7 43.5 50.4 49.1 55.7 50.3 52.8 58.8
Total 100.0 100.0 100.0 100.0 100.0 100.0 100.0 100.0
Lastly, <Table 2-5-4> shows the perceived responsibility for
deteriorating inter-Korean relations attributed to China. 10-25%
of the respondents believed that China’s role in the deteriorating
relationship is ‘Very Large’, 35-45% responded as ‘Some’ and 35-
50% had responded as ‘Not much’. When compared to North Korea,
South Korea, and the United States, the responses towards China are
relatively interesting, as they indicate that the public opinion is not fully
formed on the matter. On one hand, the perceived responsibility that
China bears for the deteriorating inter-Korean relation is decreasing.
As the United States’ perceived responsibility has also decreased, then
it can be argued that the perceived responsibility of major powers in
the region is gradually decreasing. This suggests that the South Korean
people believe that South Korea and North Korea need to take charge
in order to improve their relations.
From <Table 2-5-1> to <Table 2-5-4>, we compared each country’s
perceived responsibility. The responses suggest that North Korea has
played the largest perceived role in the deterioration of inter-Korean
relationship, and South Korea has the least amount of responsibility to
bear, followed by the United States and China.
<Table 2-5-4> China’s responsibility for deteriorating inter-Korean relations
(Unit:%)
2009 2010 2011 2012 2013 2014 2015 2016
A lot 13.1 20.8 26.5 22.6 19.2 16.3 14.0 11.3
Some 34.3 38.6 39.1 38.0 39.2 42.6 36.4 45.6
Not a lot 52.6 40.6 34.5 39.4 41.7 41.2 49.6 43.2
Total 100.0 100.0 100.0 100.0 100.0 100.0 100.0 100.0
If we compare North and South Korea, about 50% of the South
Korean people believe that North Korea’s role in the deterioration
of inter-Korean relation is ‘Very Large’, and about 50% responded
saying that South Korea bears at least some responsibility. Thus, it can
be assumed that among the two countries, North Korea bears more
responsibility. However, as the perceived responsibility attributed to
North Korea, in the absolute assessment, did not surpass 60% of those
surveyed, it would be an overstatement to say that the majority of
people believe that North Korea is responsible for the deterioration of
the relationship between the two countries.
On one hand, about 10% of the people had responded that
North Korea’s responsibility is “Not much”, and that South Korea’s

Chapter 5 Attribution of Responsibility for Deteriorating Inter-Korean Relations2016 Unification Perception Survey
196 197
responsibility is ‘Very Large’. Even though 10% is not relatively large,
we cannot claim that there is no one who believes that South Korea
is responsible for the deterioration of inter-Korean relations. But, it is
also farfetched to claim that the public is divided on this matter on the
basis of such a small proportion of responses.
The remaining 40% believe that both South Korea and North Korea
share ‘Some’ responsibility for deteriorating inter-Korean relations.
This 40% can be said to be located between 50% of those who hold
North Korea responsible and 10% of those who hold South Korea
responsible. Depending on how this 40% is thought of, therefore, we
may see the South Korean people as united, or completely divided.
If the 40% is considered to be those who agree that North Korea
is responsible, the number of people blaming North Korea reaches
90%, giving support to the claim that the country is united in such
a view. However, if the 40% counted as those who hold South Korea
responsible, then this implies that half of the people blame South
Korea with the other half not doing so – a true national divide.
However, if this 40% takes neither side, then neither approach may
be valid. Instead, public opinion on this issue is arguably composed of
three groups: 50% who believe that North Korea is responsible, 10%
who believe that South Korea is responsible, and 40% who believe
that both share responsibility.
4. Responsibility of each country for the deterioration
of inter-Korean relations: relative assessment
In this section, we will discuss in detail the results of our analysis
about how much responsibility each of the 4 countries bears, when
compared to other nations. We will compare the results in groups of 2.
<Table 2-5-5> shows the responsibility between North Korea and
South Korea. 60-70% of the respondents believed that North Korea
is more responsible than South Korea in regards to the deterioration
of the two country’s relationship. With a firm majority of more than
60%, we can safely say that the most respondents believe that North
Korea is more responsible.
Less than 5% believe that South Korea holds more responsibility
than North Korea. This is a half of the 10% that was observed in
the absolute survey as seen in <Table 2-5-1> and <Table 2-5-2>.
Even though there are discussions of a large amount of North Korea
sympathizers, there are as few as 5% who actually agree with North
Korea’s claim that South Korea is more responsible.
However, we must point out that 30% of the respondents believe
that South Korea shares responsibility with North Korea. Most believe
that North Korea is responsible for the deterioration of the inter-
Korean relationship but South Korea also bears some responsibility
for not trying to improve the relationship between the two countries.

Chapter 5 Attribution of Responsibility for Deteriorating Inter-Korean Relations2016 Unification Perception Survey
198 199
As a result, with the exception of the aforementioned minority, the
division among the South Korean people is not about whether North
Korea or South Korea is more responsible for the poor relationship,
but between whether North Korea is solely responsible, or if both
countries have to bear some responsibility.
<Table 2-5-5> Responsibility for the deterioration of the inter-Korean relations: North Korea vs South Korea
(Unit:%)
2009 2010 2011 2012 2013 2014 2015 2016
North Korea>South Korea 60.0 64.2 66.5 61.3 70.5 69.3 59.4 61.6
North Korea=South Korea 34.4 31.6 29.3 33.5 27.1 28.2 36.3 34.9
North Korea<South Korea 5.6 4.3 4.2 5.3 2.4 2.5 4.3 3.5
Total 100.0 100.0 100.0 100.0 100.0 100.0 100.0 100.0
<Table 2-5-6> and <Table 2-5-7> shows the perceived responsibility
of South Korea compared to United States and China. <Table 2-5-6>
shows that when compared with the United States, 15-20% of the
respondents believe that South Korea holds more responsibility,
20-25% believe that the United States is responsible, and 50-60%
believe that both countries share responsibility. The majority of the
respondents believe that as both countries are allies, they both hold the
same amount of responsibility for the deterioration of inter-Korean
relations. Additionally, 40-50% of the respondents were divided
into those that believed one of the two nations is more responsible
than the other. Up until 2015, more people believed that the United
States bore more responsibility than South Korea, but in 2016, more
people believed that South Korea was more responsible. This can be
interpreted to mean that more people believe that the South Korea’s
responsibility is growing, in comparison to the United States.
<Table 2-5-6> Responsibility for the deterioration of the inter-Korean relations: South Korea vs the United States
(Unit:%)
2009 2010 2011 2012 2013 2014 2015 2016
South Korea>United States 18.6 19.7 16.4 19.8 16.9 18.5 20.0 19.3
South Korea=United States 53.1 57.0 62.7 57.3 60.4 57.0 57.3 63.5
South Korea<United States 28.3 23.3 20.9 22.9 22.7 24.5 22.8 17.3
Total 100.0 100.0 100.0 100.0 100.0 100.0 100.0 100.0
<Table 2-5-7> shows the comparison of perceived responsibility
between South Korea and China in regards to the deterioration of
inter-Korean relations. When compared to the relationship between
South Korea and United States, about 40% of the respondents believe
that South Korea and China bear similar levels of responsibility.
However, the majority of people believe that one of the two countries
is more responsible than the other. The remaining 60% is split
between the two countries. In 2009, South Korea was perceived to
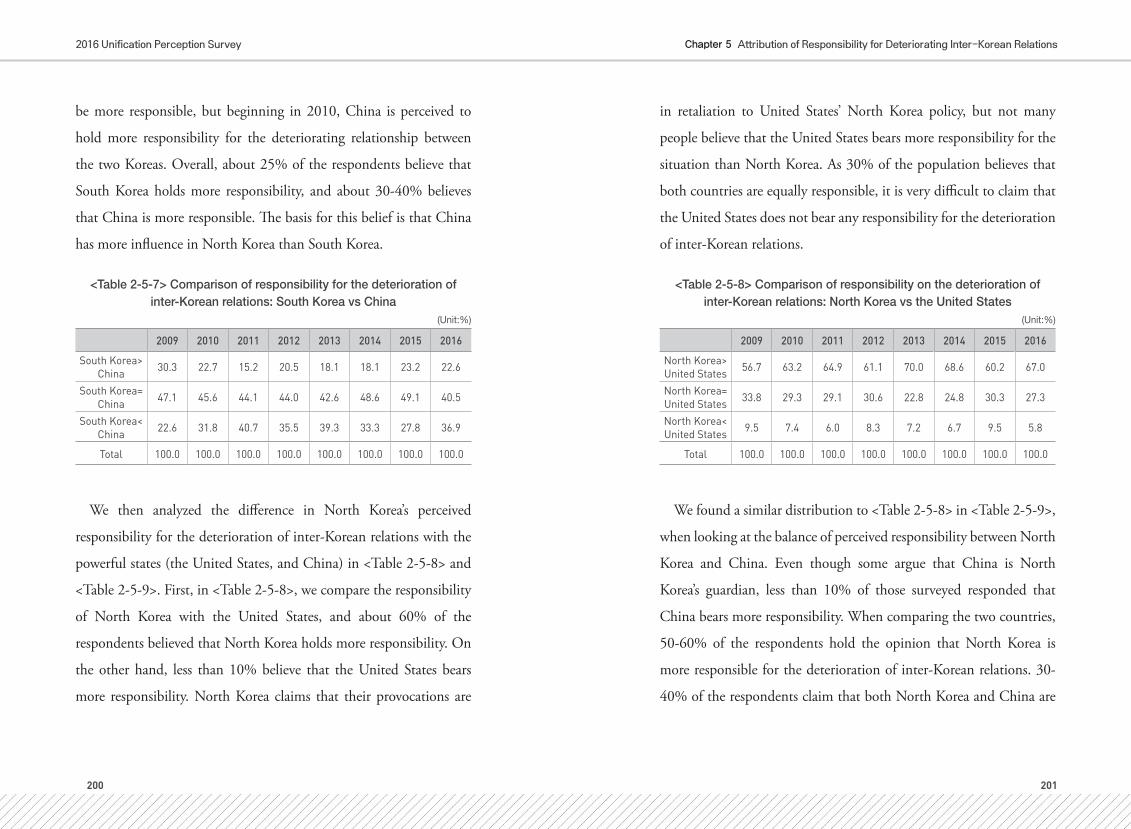
Chapter 5 Attribution of Responsibility for Deteriorating Inter-Korean Relations2016 Unification Perception Survey
200 201
be more responsible, but beginning in 2010, China is perceived to
hold more responsibility for the deteriorating relationship between
the two Koreas. Overall, about 25% of the respondents believe that
South Korea holds more responsibility, and about 30-40% believes
that China is more responsible. The basis for this belief is that China
has more influence in North Korea than South Korea.
<Table 2-5-7> Comparison of responsibility for the deterioration of inter-Korean relations: South Korea vs China
(Unit:%)
2009 2010 2011 2012 2013 2014 2015 2016
South Korea>China 30.3 22.7 15.2 20.5 18.1 18.1 23.2 22.6
South Korea=China 47.1 45.6 44.1 44.0 42.6 48.6 49.1 40.5
South Korea<China 22.6 31.8 40.7 35.5 39.3 33.3 27.8 36.9
Total 100.0 100.0 100.0 100.0 100.0 100.0 100.0 100.0
We then analyzed the difference in North Korea’s perceived
responsibility for the deterioration of inter-Korean relations with the
powerful states (the United States, and China) in <Table 2-5-8> and
<Table 2-5-9>. First, in <Table 2-5-8>, we compare the responsibility
of North Korea with the United States, and about 60% of the
respondents believed that North Korea holds more responsibility. On
the other hand, less than 10% believe that the United States bears
more responsibility. North Korea claims that their provocations are
in retaliation to United States’ North Korea policy, but not many
people believe that the United States bears more responsibility for the
situation than North Korea. As 30% of the population believes that
both countries are equally responsible, it is very difficult to claim that
the United States does not bear any responsibility for the deterioration
of inter-Korean relations.
<Table 2-5-8> Comparison of responsibility on the deterioration of inter-Korean relations: North Korea vs the United States
(Unit:%)
2009 2010 2011 2012 2013 2014 2015 2016
North Korea>United States 56.7 63.2 64.9 61.1 70.0 68.6 60.2 67.0
North Korea=United States 33.8 29.3 29.1 30.6 22.8 24.8 30.3 27.3
North Korea<United States 9.5 7.4 6.0 8.3 7.2 6.7 9.5 5.8
Total 100.0 100.0 100.0 100.0 100.0 100.0 100.0 100.0
We found a similar distribution to <Table 2-5-8> in <Table 2-5-9>,
when looking at the balance of perceived responsibility between North
Korea and China. Even though some argue that China is North
Korea’s guardian, less than 10% of those surveyed responded that
China bears more responsibility. When comparing the two countries,
50-60% of the respondents hold the opinion that North Korea is
more responsible for the deterioration of inter-Korean relations. 30-
40% of the respondents claim that both North Korea and China are

Chapter 5 Attribution of Responsibility for Deteriorating Inter-Korean Relations2016 Unification Perception Survey
202 203
mutually responsible. The opinion that both North Korea and China
are mutually responsible asserts that China did not meet expectations
in stopping North Korea from making military provocations.
<Table 2-5-9> Comparison of responsibility on the deterioration of inter-Korean relations: North Korea vs China
(Unit:%)
2009 2010 2011 2012 2013 2014 2015 2016
North Korea>China 64.7 58.0 52.4 52.3 60.8 64.0 60.8 57.6
North Korea=China 30.1 34.9 40.8 39.9 30.3 28.7 30.9 37.4
North Korea<China 5.2 7.1 6.8 7.8 8.9 7.3 8.3 5.0
Total 100.0 100.0 100.0 100.0 100.0 100.0 100.0 100.0
So, of the nations that make of the G2, does the United States or
China hold more responsibility? As shown in <Table 2-5-10>, about
60% of the respondents believe that both countries hold similar
levels of responsibility for the deterioration of inter-Korean relations.
Such opinions show that as both countries are powerful nations, they
both share responsibility for the stability of the Korean Peninsula. In
addition, when comparing the levels of both countries’ responsibility,
with the exception of 2009, China is generally perceived to bear more
responsible than the United States. Overall, about twice the amount
of respondents believe that China’s responsibility is larger than the
United States. China has a higher perceived responsibility than South
Korea, as shown in <Table 2-5-6>. China’s ability to influence North
Korea seems to play a large role in China’s perceived responsibility
when compared to other countries.
<Table 2-5-10> Comparison of responsibility on the deterioration of inter-Korean relations: United States vs China
(Unit:%)
2009 2010 2011 2012 2013 2014 2015 2016
United States>China 28.8 14.7 7.8 10.5 9.6 11.1 13.8 11.8
United States=China 59.8 63.7 61.5 66.4 63.2 67.3 68.6 59.8
United States<China 11.4 21.6 30.6 23.1 27.3 21.7 17.6 28.5
Total 100.0 100.0 100.0 100.0 100.0 100.0 100.0 100.0
The results about the relative responsibility of nations to the
deterioration of inter-Korean relations can be summed up as follows.
Just like the absolute assessment, the majority of people believe that
North Korea holds the most responsibility, and this is even more
clearly seen in relative assessments. There are only a few people who
agree with North Korea’s claims that South Korea and the United
States are responsible.
However, the majority of people hold the opinion that since issues
in relations between the two Koreas have not been resolved, South
Korea, the United States, and China all bear some responsibility. North
Korea is considered the most responsible for the deterioration of inter-
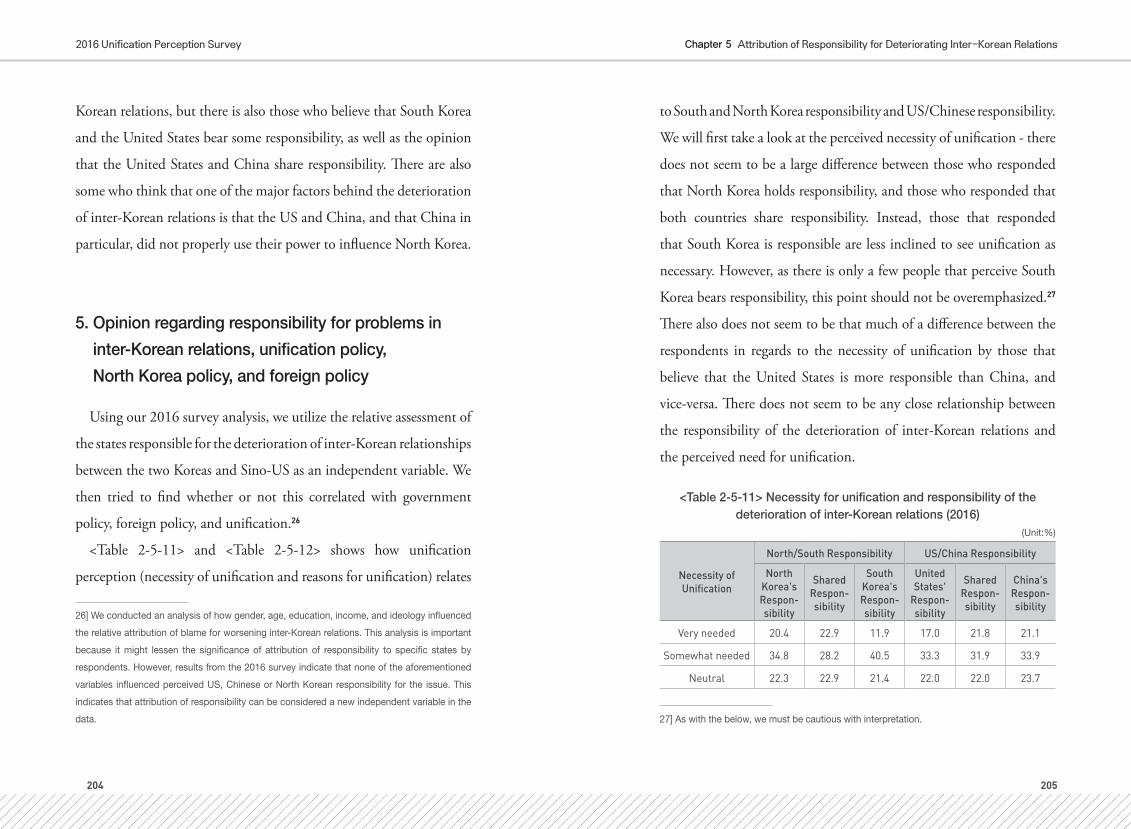
Chapter 5 Attribution of Responsibility for Deteriorating Inter-Korean Relations2016 Unification Perception Survey
204 205
Korean relations, but there is also those who believe that South Korea
and the United States bear some responsibility, as well as the opinion
that the United States and China share responsibility. There are also
some who think that one of the major factors behind the deterioration
of inter-Korean relations is that the US and China, and that China in
particular, did not properly use their power to influence North Korea.
5. Opinion regarding responsibility for problems in
inter-Korean relations, unification policy,
North Korea policy, and foreign policy
Using our 2016 survey analysis, we utilize the relative assessment of
the states responsible for the deterioration of inter-Korean relationships
between the two Koreas and Sino-US as an independent variable. We
then tried to find whether or not this correlated with government
policy, foreign policy, and unification.26
<Table 2-5-11> and <Table 2-5-12> shows how unification
perception (necessity of unification and reasons for unification) relates
26] We conducted an analysis of how gender, age, education, income, and ideology influenced
the relative attribution of blame for worsening inter-Korean relations. This analysis is important
because it might lessen the significance of attribution of responsibility to specific states by
respondents. However, results from the 2016 survey indicate that none of the aforementioned
variables influenced perceived US, Chinese or North Korean responsibility for the issue. This
indicates that attribution of responsibility can be considered a new independent variable in the
data.
to South and North Korea responsibility and US/Chinese responsibility.
We will first take a look at the perceived necessity of unification - there
does not seem to be a large difference between those who responded
that North Korea holds responsibility, and those who responded that
both countries share responsibility. Instead, those that responded
that South Korea is responsible are less inclined to see unification as
necessary. However, as there is only a few people that perceive South
Korea bears responsibility, this point should not be overemphasized.27
There also does not seem to be that much of a difference between the
respondents in regards to the necessity of unification by those that
believe that the United States is more responsible than China, and
vice-versa. There does not seem to be any close relationship between
the responsibility of the deterioration of inter-Korean relations and
the perceived need for unification.
<Table 2-5-11> Necessity for unification and responsibility of the deterioration of inter-Korean relations (2016)
(Unit:%)
Necessity of Unification
North/South Responsibility US/China Responsibility
North Korea's Respon-sibility
Shared Respon-sibility
South Korea's Respon-sibility
United States'
Respon-sibility
Shared Respon-sibility
China's Respon-sibility
Very needed 20.4 22.9 11.9 17.0 21.8 21.1
Somewhat needed 34.8 28.2 40.5 33.3 31.9 33.9
Neutral 22.3 22.9 21.4 22.0 22.0 23.7
27] As with the below, we must be cautious with interpretation.

Chapter 5 Attribution of Responsibility for Deteriorating Inter-Korean Relations2016 Unification Perception Survey
206 207
Necessity of Unification
North/South Responsibility US/China Responsibility
North Korea's Respon-sibility
Shared Respon-sibility
South Korea's Respon-sibility
United States'
Respon-sibility
Shared Respon-sibility
China's Respon-sibility
Not really needed 18.5 17.2 23.8 22.0 22.0 23.7
Not needed at all 3.9 8.8 2.4 6.4 6.3 3.8
χ2 test p< 0.01 p=n.s.
There was no strong correlation between the perceived responsibility
for deteriorating inter-Korean relations and the need for unification.
However, as shown in <Table 2-5-12>, there is a considerable
difference in opinions between those that believe North Korea is
largely responsible, those that believe that the responsibility is shared
between North Korea and South Korea, and those that believe the
United States / China are responsible. There is the most common
opinion that unification is necessary ‘because we [the Korean people]
are the same nation’, but those who attribute blame for the current
situation primarily to North Korea are equally inclined to say that
unification is necessary to ‘eliminate the threat of war’. Whereas those
that believe both countries are responsible, claim that ‘because we are
the same nation’ unification is highly necessary.
Amongst those who attribute responsibility primarily to either
China or the United States, those who hold China responsible are
most likely to associate unification with the necessity of eliminating
the threat of war. They also think that China has the largest role in
preventing war on the Korean Peninsula following South Korea and
the United States. However, the highest number of those holding both
the United States and China collectively responsible still chose the
most traditional answer for why unification is necessary, namely, ‘we
are the same nation’. Hence, regardless of whether it is the two Koreas
or the great power rivals that are to held to blame, the South Korean
people still see unification as the coming together of one nation.
<Table 2-5-12> Responsibility for the deterioration of inter-Korean relations and reasons for unification (2016)
(Unit:%)
Reason for unification
North/South Responsibility US/China Responsibility
North Korea's Respon-sibility
Shared Respon-sibility
South Korea's Respon-sibility
United States'
Respon-sibility
Shared Respon-sibility
China's Respon-sibility
Because we are the same ethnic group 37.1 43.0 33.3 34.0 42.4 34.0
Because separated families need to
be reunited.11.5 11.2 33.3 13.5 12.0 12.0
To eliminate the threat of war
between North and South Korea
33.7 22.2 19.0 26.2 25.2 38.7
So North Korean people can live
better lives4.1 6.2 2.4 8.5 5.2 2.3
So South Korea can become a more
advanced country13.0 16.5 11.9 17.0 14.6 12.0
Other 0.5 1.0 0.0 0.7 0.6 0.9
χ2 test p< 0.001 p< 0.001
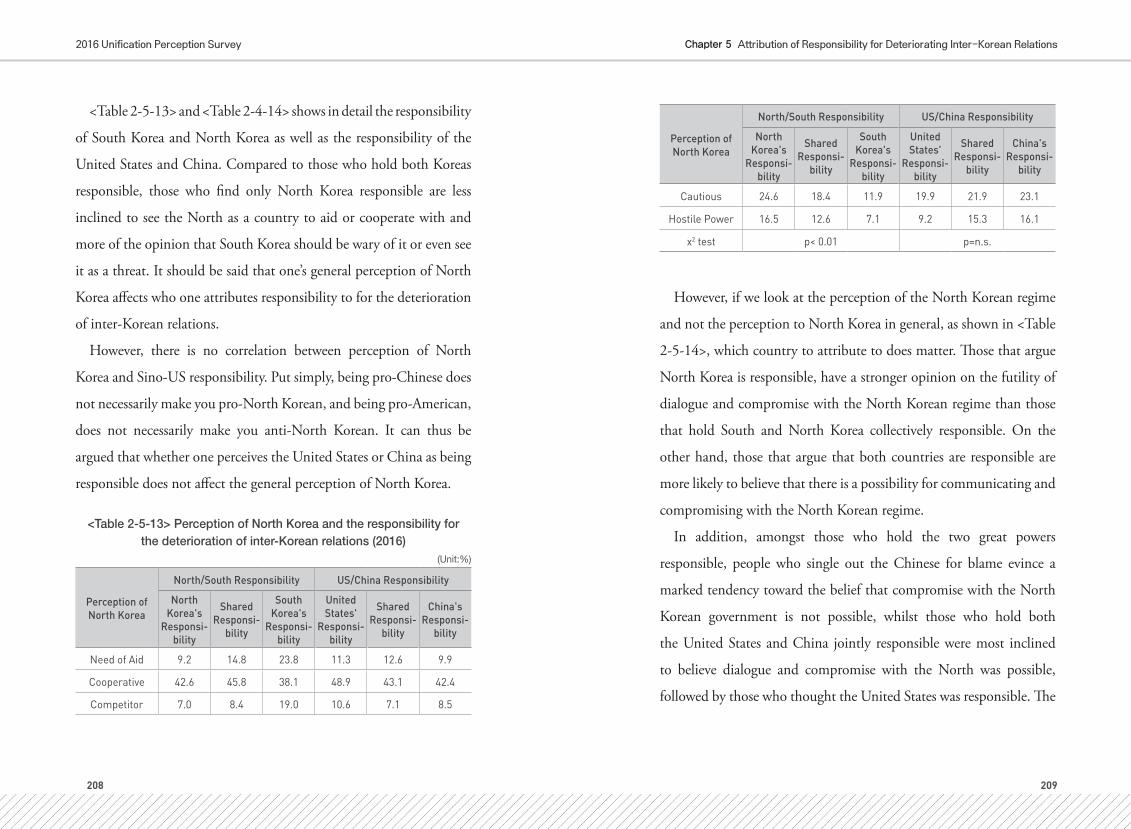
Chapter 5 Attribution of Responsibility for Deteriorating Inter-Korean Relations2016 Unification Perception Survey
208 209
<Table 2-5-13> and <Table 2-4-14> shows in detail the responsibility
of South Korea and North Korea as well as the responsibility of the
United States and China. Compared to those who hold both Koreas
responsible, those who find only North Korea responsible are less
inclined to see the North as a country to aid or cooperate with and
more of the opinion that South Korea should be wary of it or even see
it as a threat. It should be said that one’s general perception of North
Korea affects who one attributes responsibility to for the deterioration
of inter-Korean relations.
However, there is no correlation between perception of North
Korea and Sino-US responsibility. Put simply, being pro-Chinese does
not necessarily make you pro-North Korean, and being pro-American,
does not necessarily make you anti-North Korean. It can thus be
argued that whether one perceives the United States or China as being
responsible does not affect the general perception of North Korea.
<Table 2-5-13> Perception of North Korea and the responsibility for the deterioration of inter-Korean relations (2016)
(Unit:%)
Perception of North Korea
North/South Responsibility US/China Responsibility
North Korea's
Responsi-bility
Shared Responsi-
bility
South Korea's
Responsi-bility
United States'
Responsi-bility
Shared Responsi-
bility
China's Responsi-
bility
Need of Aid 9.2 14.8 23.8 11.3 12.6 9.9
Cooperative 42.6 45.8 38.1 48.9 43.1 42.4
Competitor 7.0 8.4 19.0 10.6 7.1 8.5
Perception of North Korea
North/South Responsibility US/China Responsibility
North Korea's
Responsi-bility
Shared Responsi-
bility
South Korea's
Responsi-bility
United States'
Responsi-bility
Shared Responsi-
bility
China's Responsi-
bility
Cautious 24.6 18.4 11.9 19.9 21.9 23.1
Hostile Power 16.5 12.6 7.1 9.2 15.3 16.1
χ2 test p< 0.01 p=n.s.
However, if we look at the perception of the North Korean regime
and not the perception to North Korea in general, as shown in <Table
2-5-14>, which country to attribute to does matter. Those that argue
North Korea is responsible, have a stronger opinion on the futility of
dialogue and compromise with the North Korean regime than those
that hold South and North Korea collectively responsible. On the
other hand, those that argue that both countries are responsible are
more likely to believe that there is a possibility for communicating and
compromising with the North Korean regime.
In addition, amongst those who hold the two great powers
responsible, people who single out the Chinese for blame evince a
marked tendency toward the belief that compromise with the North
Korean government is not possible, whilst those who hold both
the United States and China jointly responsible were most inclined
to believe dialogue and compromise with the North was possible,
followed by those who thought the United States was responsible. The

Chapter 5 Attribution of Responsibility for Deteriorating Inter-Korean Relations2016 Unification Perception Survey
210 211
general perception of North Korea does not affect the attribution of
blame to the United States and China, but the perception of the North
Korean regime does have an effect on the perceived responsibility of
the United States and China to the deterioration of the inter-Korean
relations.
<Table 2-5-14> Perception of the North Korean regime and the responsibility for the deterioration of inter-Korean relations (2016)
(Unit:%)
Possibility of Sumit Talks with North Korea's Regime
North/South Responsibility US/China Responsibility
North Korea's Respon-sibility
Shared Respon-sibility
South Korea's Respon-sibility
United States'
Respon-sibility
Shared Respon-sibility
China's Respon-sibility
Very Possible 2.8 4.1 14.3 5.0 4.0 2.3
Possible to Some degree 24.2 33.2 50.0 39.0 30.7 18.7
Not very possible 52.9 46.5 35.7 41.1 48.5 57.0
Not possible at all 20.0 16.2 0.0 14.9 16.7 21.9
χ2 test p< 0.001 p< 0.001
<Table 2-5-15> and <Table 2-5-16> shows varying opinions
regarding pending issues in North Korea policy (re-opening of the
Kaesong Industrial Complex, South Korean going nuclear etc.)
according to South and North Korea responsibility, and the US
and China responsibility. As shown in <Table 2-5-15>, 41.3% of
people who hold the opinion that North Korea is responsible for
the deterioration of inter-Korean relations agreed (“Strongly Agree”
and “Mostly Agree”) that the Kaesong Industrial Complex should be
reopened, while 57.8% of those who hold both Koreas responsible did
so. Hence those that believe that South and North Korea both share
responsibility more strongly agree with the reopening of the Kaesong
Complex.28
There is a difference in opinions regarding those issues among
those that think the US / China is responsible for the deterioration
of inter-Korean relations. Those that think China is responsible more
strongly agree with the reopening of the Kaesong Complex than those
that think the US is responsible. Those thinking both countries are
responsible are placed in the middle.29
<Table 2-5-16> shows the opinions of those that argue for South
/North Korean responsibility and those that argue for US / China
responsibility in respect to the idea that ‘South Korea should arm itself
with nuclear weapons’. Overall, with the exception of those that argue
that South Korea is responsible, about 50% of the respondents believe
that South Korea should go nuclear. Nuclear weapons in particular are
mentioned here, but it should be more broadly seen as an opinion that
South Korea needs to be equipped with a special means of defending
28] Given the numbers for those holding South Korea responsible are very small, caution is
advised with interpretation.
29] The reason why it was not statistically significant is that far more responses attribute blame
collectively to the US and China.

Chapter 5 Attribution of Responsibility for Deteriorating Inter-Korean Relations2016 Unification Perception Survey
212 213
itself against North Korea’s military threat.30 While a majority of
people believe South Korea needs to defend itself against North
Korea’s military threat, there appears to be a small variation in the
response depending on who is to blame for the deterioration of inter-
Korean relations. Those that believe that North and South Korea share
responsibility, those that argue the United States is responsible, and
those that believe that both the US and China share responsibility, are
increasingly opposed to South Korea acquiring nuclear weapons.
<Table 2-5-15> Worsening relations between the Koreas and the reopening of the Kaesong Complex (2016)
(Unit:%)
Reopening of Kaesong
complex
North/South Responsibility US/China Responsibility
North Korea's
Responsi-bility
Shared Responsi-
bility
South Korea's
Responsi-bility
United States'
Responsi-bility
Shared Responsi-
bility
China's Responsi-
bility
Strongly agree 10.4 22.0 14.3 20.6 16.6 7.9
Somewhat agree 30.9 35.8 38.1 38.3 32.2 31.9
Neutral 24.0 23.4 38.1 25.5 22.9 26.6
Somewhat disagree 24.5 13.6 9.5 11.3 21.1 21.9
Strongly disagree 10.3 5.3 0.0 4.3 7.3 11.7
χ2 test p< 0.001 p=n.s.
30] The THAAD deployment was not discussed in this year’s survey, however, it is believed that
results would have overlapped with support/opposition for South Korea going nuclear.
<Table 2-5-16> Worsening relations between the Koreas and South Korea going nuclear (2016)
(Unit:%)
South Korea Nuclear Weap-
onization
North/South Responsibility US/China Responsibility
North Korea's
Responsi-bility
Shared Responsi-
bility
South Korea's
Responsi-bility
United States'
Responsi-bility
Shared Responsi-
bility
China's Responsi-
bility
Strongly agree 21.7 22.4 14.3 19.9 23.2 19.3
Somewhat agree 32.1 28.6 26.2 31.9 27.5 36.8
Neutral 32.5 28.6 52.4 30.5 32.6 30.7
Somewhat disagree 9.2 15.0 7.1 12.8 12.4 7.9
Strongly disagree 4.6 5.3 0.0 5.0 4.3 5.3
χ2 test p< 0.01 p< 0.1
Lastly, <Table 2-5-17> and <Table 2-5-18> looks at those who believe
that South Korea / North Korea are responsible and those who believe
that US / China are responsible in regards to ‘Desirable Unification
Policy’ and ‘Important Foreign Policy’. As shown in <Table 2-5-17>,
those that believe North Korea is responsible strongly desire policies
that aim to stop North Korea’s development of nuclear weapons
rather than current unification-related or unification preparation
policies. This is in contrast with those that believe that South Korea
is responsible, as they have the opinion that it is more desirable to
pursue policies preparing for unification. Those that believe that both
South Korea and North Korea are responsible when compared to

Chapter 5 Attribution of Responsibility for Deteriorating Inter-Korean Relations2016 Unification Perception Survey
214 215
those that think North Korea responsible, have a stronger desire for
peaceful unification. The fact that more than 20% of those that think
North Korea is responsible and of those that think both Koreas are
responsible alike support reform and the expansion of human rights
in North Korea is also noteworthy.
Meanwhile, those that believe that China is responsible emphasize
international cooperation for the nuclear disarmament of North
Korea. Additionally, those that hold the United States responsible
generally support peaceful cooperation. The majority of those that
think both the US and China are both responsible, similarly believe in
international cooperation and support reform and the improvement
of the human rights in North Korea as a way to stop North Korea’s
nuclear development.
<Table 2-5-17> Responsibility for the deterioration of inter-Korean relations and the desired unification policy (2016)
(Unit:%)
Desirable Unification
Policy
North/South Responsibility US/China Responsibility
North Korea's
Responsi-bility
Shared Responsi-
bility
South Korea's
Responsi-bility
United States'
Responsi-bility
Shared Responsi-
bility
China's Responsi-
bility
inter-Korea cooperation,
Aid North Korea14.7 17.4 11.9 14.9 16.2 14.6
Reform and opening North
Korea, Expansion of human rights
25.7 23.4 21.4 25.5 24.0 26.0
Desirable Unification
Policy
North/South Responsibility US/China Responsibility
North Korea's
Responsi-bility
Shared Responsi-
bility
South Korea's
Responsi-bility
United States'
Responsi-bility
Shared Responsi-
bility
China's Responsi-
bility
Active unification policy, prepare for unification
13.7 20.0 45.2 22.0 17.7 13.5
International co-operation to stop
North Korea's nuclear program
30.7 18.9 11.9 15.6 24.5 33.0
Peaceful Cooperation 15.2 20.3 9.5 22.0 17.6 12.9
χ2 test p< 0.001 p< 0.1
<Table 2-5-18> shows the results of an analysis of which foreign
policies people think are important. Those that believe that both South
Korea and North Korea are responsible mostly prefer cooperation
between the two countries. However, it is important to note that those
who think that North Korea is responsible believe that cooperation
between all four states is important, not just between South Korea and
the United States. Even though there are a lot of people who believe
that North Korea is responsible for the deterioration of inter-Korean
relations, resolving the tensions between both countries requires the
cooperation of South and North Korea, the United States, and China.
Additionally, very few people believe that cooperation between South
Korea and China is the most important. This implies that cooperation
between South Korea and China, though its importance should

Chapter 5 Attribution of Responsibility for Deteriorating Inter-Korean Relations2016 Unification Perception Survey
216 217
be emphasized, is generally believed to be pursued on the basis of
cooperation between the two Koreas as well as between South Korean
and the US.
Additionally, there is not much of any difference among US/China
responsibility. All three groups believe that inter-Korean cooperation,
South Korea-United States cooperation, and cooperation between
South Korea and China is important. Even those that believe that
China is responsible do not emphasize cooperation between South
Korea and China alone, but also believe that cooperation between all
countries is needed.
<Table 2-5-18> Responsibility for the deterioration of inter-Korean relations and important foreign policies (2016)
(Unit:%)
ImportantForegin Policy
North/South Responsibility US/China Responsibility
inter-Korea
Coopera-tion
Shared Responsi-
bility
South Korea's
Responsi-bility
United States'
Responsi-bility
Shared Responsi-
bility
China's Responsi-
bility
inter-Korea cooperation 33.7 40.1 26.2 37.6 37.7 30.7
ROK-US cooperation 25.6 22.7 47.6 26.2 25.2 25.1
Sino-ROK cooperation 7.2 6.7 2.4 8.5 6.3 7.3
All are important 33.6 30.5 23.8 27.7 30.8 36.8
χ2 test p< 0.05 p=n.s.
6. Sub-conclusion: implications for government
policies
It will be difficult to achieve peaceful unification of South and
North Korea if the relationship between both countries continues to
worsen. Inter-Korean relations need to improve for unification occur
along peaceful lines. In reality however, relations between South Korea
and North Korea have been volatile; they improve sometimes, but
deteriorate other times. It is unfortunate that, recently, inter-Korean
relations have only continued to deteriorate.
What should be done to improve the relationship between the
two Koreas? We gave some thought to the idea that states deemed
responsible for the deterioration of inter-Korean relations might need
to change the policies they pursue. However, each country seems to
believe that they bear less responsibility for the deterioration of the
inter-Korean relations than other relevant states. Thus, it is not easy
for a country to change its existing policies. Normally, governments
consider popular opinion on matters of present government policy,
as well as the assessments of experts and academics. Of course, this is
limited to societies where democracy has taken root. In South Korea
for instance, public opinion plays an important role in government
policies and decisions. As such, experts and policy makers often refer
to the public opinion when drafting or implementing government

Chapter 5 Attribution of Responsibility for Deteriorating Inter-Korean Relations2016 Unification Perception Survey
218 219
policy.
This applies to government policies towards both North Korea and
unification as well. Many unification and North Korea policy discourses
have used the results of survey about the people’s perceptions towards
unification as a basis for subsequent action. But, the discussion of the
analysis of such perceptions has been limited. Much policy has relied
on selective use of limited amounts of data that allegedly reflect certain
segments of popular opinion. Hence, here, we have sought to analyze
the general public’s thoughts on responsibility for worsening inter-
Korean relations, and provide reference data to help in the formulation
of future South Korean policy towards North Korea and unification.
Based on the analysis results presented herein, some implications
for South Korean policy towards unification and North Korea are
evident. First, the majority of South Korean citizens believe that North
Korea is to blame for the deterioration of inter-Korean relations. In
this, the government policy of sanctioning North Korea might be
an appropriate response to the North Korean military provocations.
However, given the large numbers who believe that both Koreas
share responsibility for the deterioration of their relationship, despite
not forming a majority of respondents, it is necessary to search to
make those sanctions on North Korea flexible. In principle, when
formulating and implementing North Korea policy, it is important to
separate out the North Korean people from the North Korean regime.
Secondly, the North Korean regime claims that South Korea and
the United States are responsible for the deterioration of inter-Korean
relations, but there are very few people who are sympathetic to such
assertions. This means that North Korea’s claims simply have very little
influence on South Korean citizens. In this, we can safely assume that
North Korea’s anti-South Korean government and anti-US rhetoric is
has little impact on South Korean popular opinion, and that North
Korea’s claims are based on scant evidence and are not worthy of
excessive response.
Thirdly, in regards to ROK-US and Sino-US joint responsibility
the majority believe that the countries share responsibility for the
deterioration of inter-Korean relations. In taking countermeasures
against North Korea, it is necessary to strengthen bilateral ROK-US
and Sino-US cooperation. As for Sino-US cooperation, the South
Korean government cannot take the lead. Nonetheless, the South
Korean government must further stress to the United States how
much Sino-US cooperation is necessary so far as the South Korean
public are concerned with respect to North Korea policy.
Fourthly, South Korean people believe that China holds some
responsibility for the deterioration of inter-Korean relations.
Therefore, there is the widespread belief that South Korea and China
need to cooperate on North Korea policy. However, as South Koreans
perceive China to respect North Korea more than South Korea, Korea-

Chapter 5 Attribution of Responsibility for Deteriorating Inter-Korean Relations2016 Unification Perception Survey
220 221
China cooperation is not thought to be easy. In effect, the opinion
that emphasizes cooperation with China should be taken as that of
promoting a cooperative relationship with China while maintaining
relationships with North Korean and the United States, rather than
focusing solely on it. Despite discussions of strengthening cooperation
with China alongside an effective North Korea policy, cooperation with
China on one-to-one basis is not seen as important as strengthening
inter-Korean relations or US-ROK relations. Therefore, although it
might be right for the South Korean government to slowly introduce
the discussion of unification and North Korea policy with China, it
does not appear necessary to rush given the low expectations towards
China amongst the South Korean public with regard to North Korea
policy.
Fifthly, thus far, differences in gender, education, region, age, and
political affiliation have been found to be correlated significantly in
survey results with respect to unification and North Korea policy.
However, there was no visible correlation in these basic background
variables with respect to the attribution of blame regarding deterioration
in inter-Korean relations. This suggests that it might not be effective to
come up with unification and North Korea policies that are designed
to particular groups of those backgrounds to get the citizens involved
in the process of unification and make them more unification-friendly.
There is a need to form appropriate unification and North Korea
policies having considered the variation in the relative attribution
of blame. For instance, when it comes to those who blame North
Korea for issues affecting inter-Korean relations, the government may
consider publicizing policies focused on international cooperation and
military preparations to deal with the military threat of Pyongyang.
Whereas, for those who believe that both Koreas share responsibility,
the government should emphasize that they are seeking to have an
appropriate level of inter-Korean exchanges and policies to reform and
open North Korea. This way, could be made active stakeholders in
inter-Korean relations and the unification process.

Chapter 6 Ideology, Partisanship, and Perception of Unification 2016 Unification Perception Survey
222 223
Chapter 6
Ideology, Partisanship, and Perception of Unification*
1. Introduction
Unification is a major issue in South Korean politics due to South
Korea’s unique status as a divided country. Thus, understanding South
Korean popular perception of the issue31 is required to understand the
unique political topography of South Korean society. It is in particular
very important to analyse how attitudes towards unification and
North Korea policies differ across partisan groups in understanding
* This chapter is a revised version of content that originally appeared in Jung Dong-Joon, “South
Korean citizens’ attitudes toward unification after the 2016 National Assembly Election: ideo-
logical polarization or partisan bias?,” Korean Political Science Review Vol. 50, No. 5 (2016).
31] Perception of unification is defined as the political attitude of the public that “includes not
only ideology, concepts and sentiments with respect to unification, but also determination and
desire for unification.” (Jeong Eun-mi, “The changes of attitude toward reunification between
North and South Koreans: focusing on analysis of the surveys, 2011-2013,” Journal of Peace
and Unification Studies, Vol. 5 No. 2 (2013), p. 75)
the competitive party structure of South Korean politics, and further,
political impacts it may exert on party elites’ campaign strategies and
their policy programs. When seen through the prism of partisanship,
the year 2016 is yet more important with respect to the unification
issue. It was a frantic year, beginning with North Korea’s fourth nuclear
test, followed in March with additional sanctions being imposed by
the UN Security Council, then in July the decision to deploy THAAD
being taken. Not stopping here, in August, North Korea tested
SLBMs, and in September held its fifth nuclear test. What’s more, the
20th South Korean National Assembly Elections held in April resulted
in a change in the party in the majority, with interest in partisanship
never being higher, doubly so with the rise of Ahn Cheol-soo’s People’s
Party that surpassed expectations.
What kind of effect have North Korea’s provocations, changes in
North-South relations and seismic shifts in the composition of the
National Assembly had on popular attitudes toward unification and
North Korea-related policy? More precisely, in 2016 have differences
in perception widened amongst groups with different partisanship?
The problem of partisan polarization is one of the widely-discussed
topics across the world nowadays.32
32] Cas Mudde. 2007. Populist Radical Right Parties in Europe. Cambridge, UK: Cambridge
University Press; Lawrence Ezrow, Margit Tavits, and Jonathan Homola. 2014. “Voter Polar-
ization, Strength of Partisanship, and Support for Extremist Parties.” Journal of Politics 76(2):
535-547; Kang Won-taek, “Formation of political cleavage in South Korea: application of the
Lipset-Rokkan Model,” Korea and World Politics, Vol. 27 No. 3 (2011), pp.99-129.

Chapter 6 Ideology, Partisanship, and Perception of Unification 2016 Unification Perception Survey
224 225
Whilst partisan polarization at the elite level within the legislature
has been observed in many countries including South Korea,33
views of popular polarization differ from scholar to scholar.34 Thus,
analysing whether polarization is a popular phenomenon in light of
the unification issue, one with particular significance in South Korean
politics, could yield useful and important implications for the study of
polarization of Korean politics.
Second, should such polarization exist at the citizen level, does it
reflect actual ideological divergence among the citizens or their partisan
bias? Partisanship/party identification is defined in the Western
33] Tom Davis, Martin Frost, and Richard Cohen, 2014. The Partisan Divide: Congress in Crisis.
Campbell, Ca: Premiere; Shanto Iyengar, Gaurav Sood, and Yphtach Lelkes. 2012. “Affect, not
ideology: a social identity perspective on polarization.” Public Opinion Quarterly 76(3): 405-
431; David Jones. 2010. “Partisan polarization and congressional accountability in house
elections.” American Journal of Political Science 54(2): 323-337; Ka Sangjoon, “Is South
Korea’s National Assembly polarizing?” Journal of Legislative Studies Vol. 9 No. 2 (2014), pp.
247-272; Ka Sangjoon, “Policy attitude of legislators and polarization of the National Assembly,”
OUGHTOPIA Vol. 30 No. 1 (2016), pp. 327-354; Kang Won-taek, “Ideological tendencies in
the 19th National Assembly and policy attitudes,” Journal of Legislative Studies Vol. 18 No. 2
(2012), pp. 5-38.
34] Joseph Bafumi and Robert Y. Shapiro. 2009. “A New Partisan Voter.” Journal of Politics
71(1): 1-24; Leonie Huddy, Lilliana Mason, and Lene Aaroe. 2015. “Expressive Partisanship:
Campaign Involvement, Political Emotion, and Partisan Identity.” American Political Science
Review 109(1): 1-17; Lilliana Mason. 2015. “I Disrespectfully Agree”: The Differential Effects of
Partisan Sorting On Social and Issue Polarization.” American Journal of Political Science 59(1):
128-145; Kim Sung-youn, “Polarization, partisan bias, and democracy - evidence from the 2012
Korean presidential election panel data, Journal of Democracy and Human Rights Vol. 15 No.
3 (2015), pp. 459-491; Lee Nae-yeong, “Main source of ideological conflict in Korea: public
polarization or elite polarization?,” Journal of the Korean Association of Party Studies Vol. 10
No. 2 (2011), pp. 251-287.
European and American context with its long history of political
parties by Campbell and his colleagues as “long-term, emotional and
psychological preference for a particular party”.35 In nature, thus,
partisanship has a close connection to ideology, but they are not the
same construct. Partisanship can emerge as a result of various factors
including influences from the social groups one is a part of, how one is
socialized by one’s parents, and so on, irrespective of one’s ideological
position. In South Korea, in particular, the place of one’s birth has
played a large role in determining whether you support a conservative
or progressive party; Honam voters favour progressive parties, while
Yeongnam favour conservative parties. Where factors external to
ideology exercise more influence on partisanship, the connection
between ideology and partisanship weakens. In other words, there
could exist progressive supporters of the major conservative party in
South Korea (the New Frontier Party), and conservative supporters
of the major liberal party in South Korea (the Korea Minjoo Party).36
Separating the concepts of ideological polarization and partisan bias
is also an important matter in the normative aspect of democracy.
Citizens’ having different ideological tendencies depending on the
issue is desirable in the sense that political parties can adapt their
35] Angus Campbell, Philip Converse, Warren Miller, and Donald Stokes. 1960. The American
Voter. University of Michigan. Survey Research Center, New York: Wiley.
36] In this year’s survey, 18.0% of New Frontier Party supporters identified as progressives,
while 16.0% of Korea Minjoo Party supporters identified as conservatives.

Chapter 6 Ideology, Partisanship, and Perception of Unification 2016 Unification Perception Survey
226 227
election strategy and policies based on the preferences of the people.
However, if one perceives and evaluates in line with their identified
party, not in relation to their actual ideological positions, political
parties will pursue a partisan strategy to satisfy their own supporters,
and not react in a sensitive manner to political positions on each issue.
This can become a problem in light of a representative democracy that
the representatives are to represent their people’s true preferences.
Lastly, as a result of the 20th National Assembly election in 2016,
where can the supporters of the third established party (The People’s
Party) be placed in terms of the positions regarding unification and
North Korea policy compare to the existing two major parties? In
that the People’s Party’s political success reflected the scepticism of
voters for the pre-existing mainstream parties, in what direction the
party will go might pave a new way for South Korean party politics.
Particularly, given the close connections between the two mainstream
parties and certain social cleavages, it is important to know what social
groups are more likely to support the People’s Party voters and what
political views they take.
2. Method of analysis
Even though the main focus of this chapter will be on the 2016
survey results, we also compare this year’s survey results with those of
previous years, between 2011 and 2015, to get a comparative sense of
how different the former was different from the latter. As the goal of
this analysis is to understand political views of partisans in comparison
to non-partisans, we included both supporters of various parties and
non-partisan voters into a sample.37
We will proceed with the analysis in the fashion as described below.
First, as a preliminary analysis, we will take a look at the demographic
and political characteristics that would affect the formation of
partisanship for each party. Through this, we will be able to see
which factors are most decisive in the formation of different party
attachments, analyse how different social groups each party relies on,
and therefore, predict what political views those partisan groups would
take in terms of the unification issue. After the preliminary analysis,
we will analyse differences across different partisan groups in regards
to the perceptions of many unification-related issues. We break up the
analysis of the perceptions into three large categories.
The first is the awareness of unification. This includes questions
such as, “How strongly do you believe that unification is needed?”
“When do you predict unification will occur?” and “How beneficial
will unification be to South Korean society?” Secondly, we will proceed
to perception of North Korea policy. With North Korea policy, we
37] For the sake of convenience, small parties (that were not supported by 5% or more of
respondents were excluded from analysis. This meant that for 13 respondents were excluded
from the sample for 2016, 12 for 2015, 37 for 2014, 24 for 2013, 32 for 2012, and 109 for 2011.

Chapter 6 Ideology, Partisanship, and Perception of Unification 2016 Unification Perception Survey
228 229
included two batteries of questions: how much one finds each of the
North Korea policies effective in achieving unification and whether
one approves or disapproves of such a policy. In terms of the efficacy of
North Korea policy, such questions as how the respondents perceive aid
to North Korea, culture exchanges between North and South Korea,
economic cooperation, regular talks between the two countries, the
issue regarding North Korean sanctions the UN had made in March
of this year, and how much such pressure will help to bring about
unification, were included. A discussion of approval/disapproval of
government policy includes questions regarding to the reopening of
the Kaesong Industrial Zone (KIZ) and the Mount Kumgang Tourist
Zone. Lastly, the questions on government evaluation included the
respondent’s assessment of North Korea policy, the current condition
of the economy,38 and the role of the incumbent president. After
analysing these sets of items, we will attempt to draw tentative answers
to the three questions raised in the previous section.
We used multi-nomial logit and ordered logit regressions because
of the nature of the dependent variables in the analysis. As each of the
above listed questions served as a dependent variable, the values of all
38] One could argue that the evaluation of the current status of the economy does not directly
speak to that of the incumbent government. However, given that the economy is one of such
issues that can easily be observed and evaluated by people and has served as one of the most
important determinants of vote choice, it may not be too problematic to link the evaluation of
the economy to that of the government.
variables were re-coded to allow for an intuitive interpretation.39 As an
independent variable that might affect one’s perception of unification,
first, we utilized support for particular political parties as an indicator
of partisanship. The questionnaire asked the respondents to choose
which political party they support between the New Frontier Party,
Democratic Party, and the People’s Party. Their answers were coded in
a binary fashion (1: Support, 0: Do not support). Thus, those who do
not affiliate themselves with any political party became a comparison
group. The concept of partisanship is so complicated and subtle that
its meanings cannot be well captured by the use of any single survey
item.40 As seen in the recent finding that identifying oneself as an
independent is merely a sort of self-expression from a desire to be
looked politically sophisticated rather than a true revelation of her
political orientation,41 it is difficult to read one’s actual partisanship
with a single question. Nevertheless, we were left with no option but
to use only one question to operationalize political affiliation in our
analysis as currently no other complements exist within the survey.
What’s more, asking about which party one supports is often used in
39] ‘No Response’ was treated as missing.
40] John Garry. 2007. “Making ‘Party Identification’ More Versatile: Operationalising the Con-
cept for the Multiparty Setting.” Electoral Studies 26(2): 346-358; David Sanders. 2003. “Party
Identification, Economic Perceptions, and Voting In British General Elections, 1974-97.” Elec-
toral Studies 22(2): 239-263.
41] John R. Petrocik. 2009. “Measuring Party Support: Leaners Are Not Independents.” Elec-
toral Studies 28(4): 562-572.

Chapter 6 Ideology, Partisanship, and Perception of Unification 2016 Unification Perception Survey
230 231
other studies when seeking to determine partisanship.
As a measure of ideology, we used a 5-point scale which asked
respondents to place their ideological position between 1 (very
progressive) and 5 (very conservative).42 This unidimensional measure
of self-placement of ideological position has also been criticized
because the concept of political left-right is ambiguous in itself and
can be measured with different criteria across individuals on the basis
of one’s subjective judgment.43 However, we were unable to create a
measure of ideology that encompasses a wide range of issue positions
due to a lack of available data. A set of demographic variables such as
age, gender, education, income, rural/urban residence and birthplace
were included as controls.
42] The average partisan score by party in the 2016 survey was as follows: New Frontier Party
3.23, Democratic Party 2.66, and People’s Party 2.67, with non-partisans averaging 3.04.
43] Andre Freire and Ana Belchior. 2013. “Ideological Representation in Portugal: MPs’-Electors’
Linkages in Terms of Left-Right Placement and Substantive Meaning.” Journal of Legislative
Studies 19(1): 1-21; Han Jeong Hun, “Korean voters’ ideological propensities: a case study of
the effect of ideology on voters’ perception of unification in Korea,” Journal of the Korean Politi-
cal Science Association Vol. 50 Issue 4 (2016), pp. 105-126.
3. Analysis and results
1) Partisan Distribution and Determinants.
First, to see the respondents’ political affiliation, we begin with a simple
descriptive analysis. As shown in <Table 2-6-1>, 54.5% of respondents
express support for a particular political party, the highest recorded
during the time in which this question was asked (2011 – 2016). The
results were the same as the previous year with the New Frontier Party
having the highest number of supporters (26.4%), followed by the
Democratic Party (17.2%), and the People’s Party (9.8%).
During the 2016 election, the People’s Party brought change to
the two party system. As there was not much of a difference in the
aggregate number of supporters of the New Frontier Party or the
Democratic Party from the previous year, but a large decrease in the
number of independents, we thus can infer that the People’s Party
consists of people who were previously independents, at least to some
degree. Yet, we must not forget that making an inference of individual
relationships from their aggregated measures can expose us to the
ecological fallacy.44 Determining the composition of the People’s
party supporters, and their previous party affiliation is important for
analyzing their political behaviors and attitudes. We will discuss this
point again later towards the end of this chapter.
44] William S. Robinson. 1950. “Ecological Correlation and the Behavior of Individuals,” Ameri-
can Sociological Review 15: 351-357.

Chapter 6 Ideology, Partisanship, and Perception of Unification 2016 Unification Perception Survey
232 233
<Table 2-6-1> Distribution partisan tendencies (2011 – 2016)(Unit:N,%)
Year Non-partisan
New Frontier Party
Democratic Party
Peoples Party Other Total
2016 546 (45.5)
317 (26.4)
206 (17.2)
118 (9.8)
13 (1.1)
1,200 (100.0)
2015 708 (59.0)
316 (26.3)
164 (13.7)
n/an/a
12 (1.0)
1,200 (100.0)
2014 597 (49.8)
324 (27.0)
242 (20.2)
n/an/a
37 (3.1)
1,200 (100.0)
2013 649 (54.1)
349 (29.1)
178 (14.8)
n/an/a
24 (2.0)
1,200 (100.0)
2012 623 (52.1)
301 (25.2)
240 (20.1)
n/an/a
32 (2.7)
1,196 (100.0)
2011 617(51.4)
291(24.2)
184(15.3)
n/an/a
109(9.1)
1,201(100.0)
* Percentages in brackets
Next, to see the determinants of the formation of partisanship,
we conducted a multi-nomial logit analysis taking non-partisans as a
comparison group to which each of the partisan groups is compared.
A multi-nomial logit model is used when the dependent variable is
a categorical nominal variable, and analyzes how the independent
variables affect the choice between a set of pairs of groups. Existing
research indicates that factors that influence South Korean partisanship
include age,45 income,46 education level,47 rural/urban residence, place
45] Hur Suk Jae, “Life-cycle, generation, and party identification analyzing pooled cross-
sectional data 1986~2012,” Journal of the Korean Association of Party Studies Vol. 13 Issue 1
(2014), pp. 65-93.
46] Lee Yongma, “The formation of the class cleavage structure in South Korea: focusing on the
presidential elections since 2002,” Journal of the Korean Political Science Association Vol. 48
Issue 4 (2014), pp. 249-270.
47] Choi Jun Young, “A functionalist model of party loyalty: the Korean case,” OUGHTOPIA Vol.
30 Issue 1 (2016), pp. 299-325.
of birth (particularly Yeongnam and Honam regions),48 and whether
the respondent is progressive or conservative.49
In the results shown in <Table 2-6-2>, in comparison to other
demographic factors, age, ideology, and area of birth (Yeongnam
and Honam) were found more significant. Being born in Honam
in particular was shown to be highly correlated with strong partisan
feelings regardless of which party the respondent was affiliated with.
Given the statistical model used is non-linear, in addition to coefficients,
we also provided odds ratio in parenthesis showing the odds of having
a particular partisanship relative to having no partisanship for a one
unit change in each of the independent variables holding all other
variables constant. The odds ratio for Honam residence indicate
that those in the region are 2.75 times more likely to support the
Democratic Party than non-partisans, 2.64 times more likely to
support the Peoples Party, whilst the chances of them supporting
the New Frontier Party fell by 86%. Ideology failed to significantly
distinguish between the New Frontier Party and non-partisans, but
had a strong effect on holding partisanship for the other two parties.
We discovered that those living in urban areas are more likely to form
48] Choi Jun Young, “The 17th presidential election and regional fissures,” Journal of 21st Cen-
tury Political Science Vol. 18 Issue 3 (2008), pp. 47-66.
49] Han Jeong Hun, “The ideological tendencies of the South Korean voter: party platforms,
party leadership and the Influence of political activists,” eds. Park Chan-wook and Kang Won-
taek, Analysis of the 2012 National Assembly Elections (Seoul: Nanam, 2012).
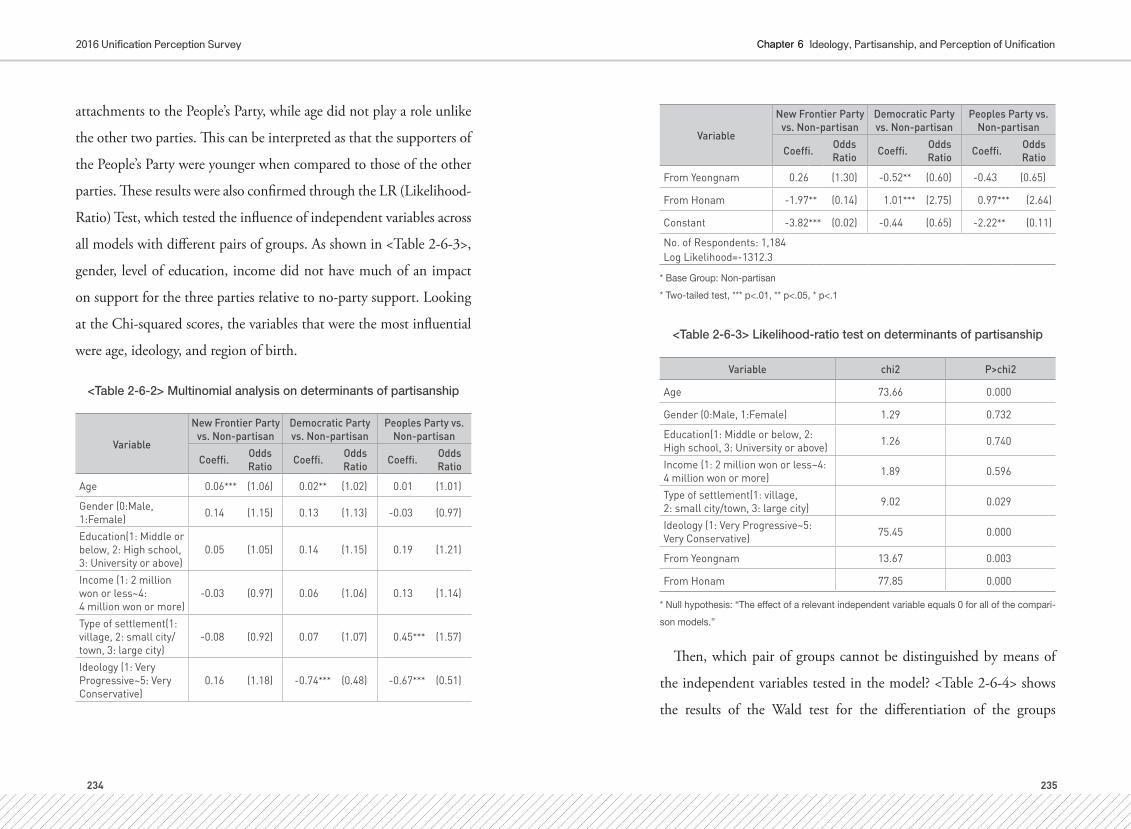
Chapter 6 Ideology, Partisanship, and Perception of Unification 2016 Unification Perception Survey
234 235
attachments to the People’s Party, while age did not play a role unlike
the other two parties. This can be interpreted as that the supporters of
the People’s Party were younger when compared to those of the other
parties. These results were also confirmed through the LR (Likelihood-
Ratio) Test, which tested the influence of independent variables across
all models with different pairs of groups. As shown in <Table 2-6-3>,
gender, level of education, income did not have much of an impact
on support for the three parties relative to no-party support. Looking
at the Chi-squared scores, the variables that were the most influential
were age, ideology, and region of birth.
<Table 2-6-2> Multinomial analysis on determinants of partisanship
Variable
New Frontier Party vs. Non-partisan
Democratic Party vs. Non-partisan
Peoples Party vs. Non-partisan
Coeffi. Odds Ratio Coeffi. Odds
Ratio Coeffi. Odds Ratio
Age 0.06*** (1.06) 0.02** (1.02) 0.01 (1.01)
Gender (0:Male, 1:Female) 0.14 (1.15) 0.13 (1.13) -0.03 (0.97)
Education(1: Middle or below, 2: High school, 3: University or above)
0.05 (1.05) 0.14 (1.15) 0.19 (1.21)
Income (1: 2 million won or less~4: 4 million won or more)
-0.03 (0.97) 0.06 (1.06) 0.13 (1.14)
Type of settlement(1: village, 2: small city/town, 3: large city)
-0.08 (0.92) 0.07 (1.07) 0.45*** (1.57)
Ideology (1: Very Progressive~5: Very Conservative)
0.16 (1.18) -0.74*** (0.48) -0.67*** (0.51)
Variable
New Frontier Party vs. Non-partisan
Democratic Party vs. Non-partisan
Peoples Party vs. Non-partisan
Coeffi. Odds Ratio Coeffi. Odds
Ratio Coeffi. Odds Ratio
From Yeongnam 0.26 (1.30) -0.52** (0.60) -0.43 (0.65)
From Honam -1.97** (0.14) 1.01*** (2.75) 0.97*** (2.64)
Constant -3.82*** (0.02) -0.44 (0.65) -2.22** (0.11)
No. of Respondents: 1,184Log Likelihood=-1312.3
* Base Group: Non-partisan
* Two-tailed test, *** p<.01, ** p<.05, * p<.1
<Table 2-6-3> Likelihood-ratio test on determinants of partisanship
Variable chi2 P>chi2
Age 73.66 0.000
Gender (0:Male, 1:Female) 1.29 0.732
Education(1: Middle or below, 2: High school, 3: University or above) 1.26 0.740
Income (1: 2 million won or less~4: 4 million won or more) 1.89 0.596
Type of settlement(1: village, 2: small city/town, 3: large city) 9.02 0.029
Ideology (1: Very Progressive~5: Very Conservative) 75.45 0.000
From Yeongnam 13.67 0.003
From Honam 77.85 0.000
* Null hypothesis: “The effect of a relevant independent variable equals 0 for all of the compari-
son models.”
Then, which pair of groups cannot be distinguished by means of
the independent variables tested in the model? <Table 2-6-4> shows
the results of the Wald test for the differentiation of the groups
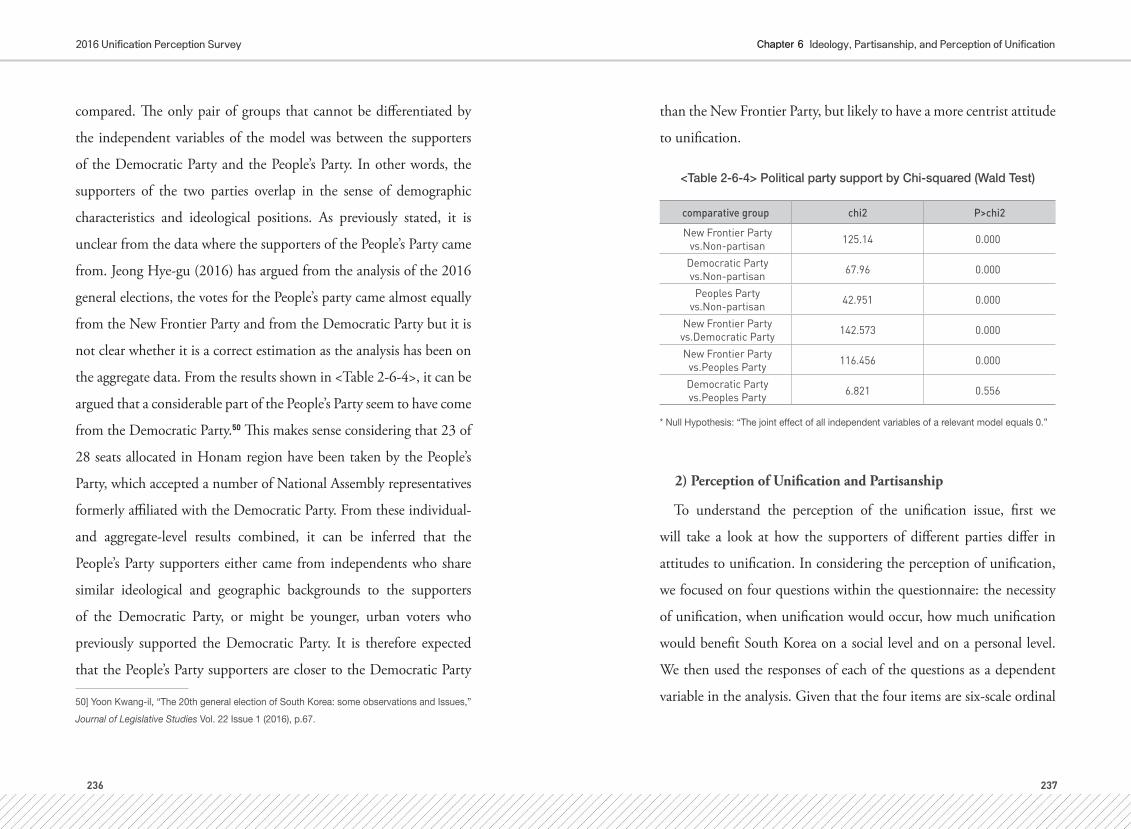
Chapter 6 Ideology, Partisanship, and Perception of Unification 2016 Unification Perception Survey
236 237
compared. The only pair of groups that cannot be differentiated by
the independent variables of the model was between the supporters
of the Democratic Party and the People’s Party. In other words, the
supporters of the two parties overlap in the sense of demographic
characteristics and ideological positions. As previously stated, it is
unclear from the data where the supporters of the People’s Party came
from. Jeong Hye-gu (2016) has argued from the analysis of the 2016
general elections, the votes for the People’s party came almost equally
from the New Frontier Party and from the Democratic Party but it is
not clear whether it is a correct estimation as the analysis has been on
the aggregate data. From the results shown in <Table 2-6-4>, it can be
argued that a considerable part of the People’s Party seem to have come
from the Democratic Party.50 This makes sense considering that 23 of
28 seats allocated in Honam region have been taken by the People’s
Party, which accepted a number of National Assembly representatives
formerly affiliated with the Democratic Party. From these individual-
and aggregate-level results combined, it can be inferred that the
People’s Party supporters either came from independents who share
similar ideological and geographic backgrounds to the supporters
of the Democratic Party, or might be younger, urban voters who
previously supported the Democratic Party. It is therefore expected
that the People’s Party supporters are closer to the Democratic Party
50] Yoon Kwang-il, “The 20th general election of South Korea: some observations and Issues,”
Journal of Legislative Studies Vol. 22 Issue 1 (2016), p.67.
than the New Frontier Party, but likely to have a more centrist attitude
to unification.
<Table 2-6-4> Political party support by Chi-squared (Wald Test)
comparative group chi2 P>chi2
New Frontier Partyvs.Non-partisan 125.14 0.000
Democratic Partyvs.Non-partisan 67.96 0.000
Peoples Partyvs.Non-partisan 42.951 0.000
New Frontier Partyvs.Democratic Party 142.573 0.000
New Frontier Partyvs.Peoples Party 116.456 0.000
Democratic Partyvs.Peoples Party 6.821 0.556
* Null Hypothesis: “The joint effect of all independent variables of a relevant model equals 0.”
2) Perception of Unification and Partisanship
To understand the perception of the unification issue, first we
will take a look at how the supporters of different parties differ in
attitudes to unification. In considering the perception of unification,
we focused on four questions within the questionnaire: the necessity
of unification, when unification would occur, how much unification
would benefit South Korea on a social level and on a personal level.
We then used the responses of each of the questions as a dependent
variable in the analysis. Given that the four items are six-scale ordinal

Chapter 6 Ideology, Partisanship, and Perception of Unification 2016 Unification Perception Survey
238 239
variables, we employed ordered logistic regressions. <Table 2-6-5>
below shows average responses of each of the perception items by
partisanship and <Table 2-6-6> presents the results of the regression
of all independent variables including partisanship and ideology.
Looking at the partisanship variables in <Table 2-6-6>, more
supporters of the Democratic Party and the People’s Party than non-
partisan respondents were inclined to answer that unification was
necessary, whereas there was no such a clear effect in the responses from
supporters of the New Frontier Party. Even looking at the odds ratio,
supporters of the Democratic Party and the Peoples Party had around
40% higher probabilities of feeling more necessity on unification than
non-partisans. We summarized the regression results of ideological
and partisan variables using the same model for previous years in
<Table 2-6-7> in order to view temporal trends. Overall, the results of
the 2016 data appear consistent with pre-existing data from previous
years (2011 – 2015). With the exception of the Democratic Party, in
relation to the expected time-frame of unification happening, there
is no clear difference in the responses between the two major parties,
and the results made little difference to previous years. For the two
questions of how beneficial unification would be for South Korean
society and individuals? the Democratic Party supporters were found
more likely to perceive that it would be much more beneficial. For the
two questions, in comparison to non-partisans, the Democratic Party
supporters respectively had a 91.0% and 69.0% higher probability
of having greater belief that unification would be beneficial. The
People’s Party supporters also recognized unification as beneficial for
individuals (51.0%) showing a similar impact to that of partisanship
with the Democratic Party.
<Table 2-6-5> Averaged responses to questions by political party affiliation
Political Party
Necessity of Unification
(1: Not needed at all~5:Very much
needed)
When unification should happen(1: Within 5 years ~6: Not possible)
Benefits of unification to South Korea
(1: No benefit at all~4: Highly beneficial)
Benefits of unification to
the respondent(1: No benefit at
all~4: Highly beneficial)
New Frontier Party 3.62 3.85 2.55 2.06
Democratic Party 3.56 3.94 2.76 2.21
Peoples Party 3.53 3.84 2.58 2.20
Non-partisan 3.29 4.16 2.46 2.01
Overall Average 3.45 4.01 2.55 2.08

Chapter 6 Ideology, Partisanship, and Perception of Unification 2016 Unification Perception Survey
240 241
<Table 2-6-6> Ordered logistic regression of determinants of perception on unification
Variable
Necessity of Unification
(1: Not needed at all~5:Very much
needed)
When unification should happen(1: Within 5 years ~6: Not possible)
Benefits of unification to South Korea
(1: No benefit at all~4: Highly beneficial)
Benefits of unification to
the respondent(1: No benefit at
all~4: Highly beneficial)
Coeffi.Odds Ratio
Coeffi.Odds Ratio
Coeffi.Odds Ratio
Coeffi.Odds Ratio
Age 0.05*** (1.05) -0.03*** (0.97) 0.01** (1.01) 0.01 (1.01)
Woman -0.45*** (0.64) 0.41*** (1.50) -0.32*** (0.72) -0.22* (0.80)
Education 0.31*** (1.37) -0.25** (0.78) 0.22** (1.25) 0.23** (1.26)
Income -0.13** (0.88) -0.02 (0.98) 0 (1.00) -0.02 (0.98)
Living in city -0.04 (0.97) -0.04 (0.96) 0.13 (1.14) 0.13 (1.14)
Conservative -0.05 (0.95) -0.01 (0.99) 0.02 (1.02) 0.01 (1.01)
Support New Fron-tier Party
0.09 (1.10) -0.06 (0.94) 0.14 (1.15) 0.14 (1.15)
Support Democratic
Party0.34** (1.40) -0.2 (0.82) 0.65*** (1.91) 0.52*** (1.69)
Support Peoples
Party 0.34* (1.40) -0.31* (0.73) 0.25 (1.28) 0.41** (1.51)
No. of Re-spondents 1184 1184 1184 1184
Log-Likeli-hood -1697.1 -1950.4 -1383.3 -1260.7
* Two-tailed test, *** p<.01, ** p<.05, * p<.1, The estimates for the cut points of the latent variable
corresponding to each of the values of the depend variables are not reported.
Considered overall results from 2016, partisan tendencies in the
perception of unification had increased compared to the previous
years. This trend is especially visible when comparing the effect of
ideology with that of partisanship. Until 2015, as shown in <Table
2-6-7>, ideological tendencies appeared to be a stronger determinant
than partisanship variables out of the four perception-related questions
on unification; ideological tendencies used as the independent variable
were closely correlated with those unification perceptions , whereas
partisanship variables exhibited no such significant correlations. This
demonstrates the fact that it was ideology rather than partisanship
which had been a key determinant of views of the unification issue
until 2015. However, in 2016, the ideological variable lost its statistical
significance in all four questions, whereas at least one of the partisan
variables was found significantly correlated with the perceptions.
Through this, we can conclude that when compared to the previous
years, perceptions towards unification in 2016 became more aligned
along partisan lines. Of course, one could argue that this is because
partisanship generally was stronger right after the April 2016 General
Elections. However, given the importance of ideology over partisanship
in 2012 when both presidential and general assembly elections were
held, such arguments appear potentially problematic. Rather, we were
able to say that the growing trend toward partisan polarization among
citizens in regards with unification had begun last year. Whether such
a partisan tendency of this year will be a temporary phenomenon
or the beginning of bigger trends of partisan polarization should be
investigated in the coming years.

Chapter 6 Ideology, Partisanship, and Perception of Unification 2016 Unification Perception Survey
242 243
<Table 2-6-7> Trends in the influence of partisanship (2011 – 2016)
Year
Dependent Variable
(Perception of Unification)
Independent Variable
IdeologySupporters of New Frontier
Party
Supporters of Democratic
Party
Supporters of Peoples Party
2016
Necessity of Unification -0.05 0.09 0.34** 0.34*
When to unify -0.01 -0.06 -0.2 -0.31*
Benefits ofunification (South Korea)
0.02 0.14 0.65*** 0.25
Benefits of unification (Individual)
0.01 0.14 0.52*** 0.41**
2015
Necessity of Unification -0.21*** -0.01 0.19
n/a
When to unify 0.14** -0.13 -0.23
Benefits of unification (South Korea)
-0.12 0.06 0.25
Benefits of unification (Individual)
-0.13* 0.17 0.03
2014
Necessity of Unification -0.11 0.17 0.34**
n/a
When to unify 0.12* 0.02 -0.08
Benefits of unification (South Korea)
-0.02 0.02 0.2
Benefits of unification (Individual)
-0.08 0.06 -0.08
Year
Dependent Variable
(Perception of Unification)
Independent Variable
IdeologySupporters of New Frontier
Party
Supporters of Democratic
Party
Supporters of Peoples Party
2013
Necessity of Unification -0.23*** -0.12 0.37**
n/a
When to unify 0.24*** 0.12 -0.11
Benefits of unification (South Korea)
-0.14* 0.04 0.47***
Benefits of unification (Individual)
-0.22*** -0.02 0.23
2012
Necessity of Unification -0.37*** 0.02 0.35**
n/a
When to unify 0.17** -0.07 -0.4***
Benefits of unification (South Korea)
-0.35*** -0.12 0.17
Benefits of unification (Individual)
-0.32*** -0.03 0.14
2011
Necessity of Unification -0.08 -0.31** 0.32**
n/a
When to unify 0.14 -0.15 -0.3*
Benefits of unification (South Korea)
0.02 -0.04 0.47***
Benefits of unification (Individual)
-0.13* -0.01 0.54***

Chapter 6 Ideology, Partisanship, and Perception of Unification 2016 Unification Perception Survey
244 245
3) North Korea Policy and Partisanship
When analyzing the perception of North Korea policy, we first
analyze the questions regarding how effective each of the policies would
be for achieving unification. For the analysis, we used the following
7 topics: ‘Aid to North Korea’, ‘Cultural Exchange’, ‘Economic
Cooperation’, ‘Inter-Korea Summits’, ‘Effectiveness of North Korea
Sanctions’, and the ‘approval/disapproval of the resuming operations
at the Kaesong Industrial Zone’ and ‘tours to Mount Kumgang’.
First, <Table 2-6-8> shows the perceptions of North Korea policy by
the mean score for each political party, and overall, supporters of the
Democratic Party feel that the effectiveness of North Korea policy
will be higher than the supporters of other parties. The regression
analysis results in <Table 2-6-9> show a similar trend; supporters of
the Democratic Party compared to non-partisans, believe that aid to
North Korea, Culture Exchanges, Economic Cooperation, and Inter-
Korea Summits would be effective for unification. This stands in stark
contrast to the New Frontier Party whose supporters’ views were no
different than non-partisans in any of the topics. The difference in
these two political parties is well recognized in the reported odds ratio
as well. Despite not being as high as the Democratic Party, supporters
of the People’s Party also showed a positive attitude towards Cultural
Exchanges and Aid to North Korea, especially compared to the New
Frontier Party. With respect to North Korea Sanctions, however, no
clear differences across partisan lines were detected. As seen in <Table
2-6-8>, the average scores for all partisan groups for the question of
Effectiveness of North Korea Sanctions were below the median point
of 2.5, suggesting that no partisan groups feel much efficacy about
the policy. As to the approval/disapproval questions of the reopening
of the Kaesong Industrial Zone and tourism to Mount Kumgang,
overall, the Democratic Party supporters were found more likely to
have favourable views than non-partisans, while no other groups were.
<Table 2-6-8> Average assessment of the benefits of unification by partisan group
Political Party
Aid to North Korea
(1: No help at all~4: Very
helpful)
Social and cultural
exchanges(1: No help
at all~4: Very helpful)
Economic Coopera-
tion(1: No help
at all~4: Very helpful)
Regular North-South
Summits(1: No help
at all~4: Very helpful)
Sanctions and
pressure targeting the North
(1: No help at all~4:
Very helpful)
Reopen-ing the
Kaesong Industrial Complex
(1: Strongly oppose~5: Strongly Approve)
Restart-ing Mount Kumgang
tours(1: Strongly oppose~5: Strongly Approve)
New Fron-tier Party 2.36 2.62 2.55 2.82 2.40 3.14 3.31
Democratic Party 2.58 2.78 2.75 2.94 2.29 3.51 3.55
Peoples Party 2.56 2.76 2.49 2.82 2.28 3.23 3.42
Non-partisan 2.22 2.50 2.47 2.73 2.34 3.22 3.31
Overall Average 2.35 2.61 2.54 2.80 2.34 3.25 3.36

Chapter 6 Ideology, Partisanship, and Perception of Unification 2016 Unification Perception Survey
246 247
<Table 2-6-9> Ranking of perception decision forces for North Korea policy
Variable
Aid to North Korea(1: No help at all~
4: Very helpful)
Social and cultural exchanges
(1: No help at all~4: Very helpful)
Economic Coop-eration
(1: No help at all~4: Very helpful)
Regular North-South Summits(1: No help at all~
4: Very helpful)
Coeffi.Odds Ratio
Coeffi.Odds Ratio
Coeffi.Odds Ratio
Coeffi.Odds Ratio
Age 0.02*** (1.02) 0.01** (1.01) 0.01** (1.01) 0.02*** (1.02)
Female -0.11 (0.89) -0.05 (0.95) 0.00 (1.00) -0.22* (0.81)
Education -0.09 (0.91) 0.02 (1.02) -0.02 (0.98) 0.04 (1.04)
Income 0.13** (1.14) 0.10* (1.10) 0.12** (1.13) 0.01 (1.01)
Urban resident 0.04 (1.04) -0.01 (0.99) 0.13 (1.14) 0.00 (1.00)
Conservative Ideology -0.19*** (0.83) -0.04 (0.96) -0.14** (0.87) -0.14** (0.87)
Support New Frontier Party 0.20 (1.22) 0.19 (1.20) 0.08 (1.08) 0.14 (1.15)
Support Demo-cratic Party 0.72*** (2.05) 0.55*** (1.74) 0.55*** (1.74) 0.41** (1.50)
Support Peoples Party 0.69*** (2.00) 0.50*** (1.65) -0.04 (0.96) 0.18 (1.19)
No. of Respon-dents 1184 1184 1184 1184
Log-Likelihood -1423.4 -1465.1 -1455.7 -1402.2
Variable
Sanctions and pressure tar-geting the North(1: No help at all~
4: Very helpful)
Reopening the Kaesong Industrial
Complex(1: Strongly
oppose~5: Strongly Approve)
Restarting Mount Kumgang tours
(1: Strongly oppose~5: Strongly
Approve)
Coeffi.Odds Ratio
Coeffi.Odds Ratio
Coeffi.Odds Ratio
Age 0.00 (1.00) 0.01** (1.01) 0.01** (1.01)
Female 0.14 (1.15) 0.01 (1.01) 0.07 (1.08)
Education 0.03 (1.03) 0.08 (1.09) 0.04 (1.04)
Income -0.04 (0.96) 0.06 (1.06) 0.08 (1.08)
Urban resident 0.01 (1.01) 0.08 (1.08) 0.08 (1.08)
Variable
Aid to North Korea(1: No help at all~
4: Very helpful)
Social and cultural exchanges
(1: No help at all~4: Very helpful)
Economic Coop-eration
(1: No help at all~4: Very helpful)
Regular North-South Summits(1: No help at all~
4: Very helpful)
Coeffi.Odds Ratio
Coeffi.Odds Ratio
Coeffi.Odds Ratio
Coeffi.Odds Ratio
Conservative Ideology 0.06 (1.06) -0.09 (0.92) -0.05 (0.95)
Support New Frontier Party 0.11 (1.12) -0.18 (0.84) -0.09 (0.92)
Support Demo-cratic Party -0.11 (0.90) 0.39*** (1.48) 0.32** (1.38)
Support Peoples Party -0.07 (0.93) -0.06 (0.94) 0.14 (1.15)
No. of Respon-dents 1184 1184 1184
Log-Likelihood -1423.2 -1784.5 -1767.1
* Two-tailed test, *** p<.01, ** p<.05, * p<.1, The estimates for the cut points of the latent variable corresponding to each of the values of the depend variables are not reported.
Looking at the time-series pattern of partisan views on North Korea
policy in <Table 2-6-10>, strong partisan attitudes have been observed
among Democratic Party supporters since 2011.51 When compared
to the New Frontier Party, supporters of the Democratic Party
appear to perceive North Korea Policy as being far more meaningful
and important. Just like previous Unification Perception items, the
ideological variable’s influence has decreased in 2016 as well, showing
that the strength of partisanship is beginning to grow relative to
ideological viewpoints. This might reflect ongoing polarization among
51] The question about the effectiveness of sanctions targeting the North was added in 2016,
hence analysis for prior years does not include results from this item. Further, the ‘reopening’ of
Kaesong Industrial Complex (KIC) was substituted for ‘keeping it open’ from prior years items.

Chapter 6 Ideology, Partisanship, and Perception of Unification 2016 Unification Perception Survey
248 249
the citizen attitudes not only regarding the unification issues but also
regarding the North Korean policy.
<Table 2-6-10> Trends in partisanship as an influencer on the North Korea policy perception variable (2011 – 2016)
Year
Dependent Variable(Perception of North
Korea policy)
Independent Variable
Ideology
Support-ers of New
Frontier Party
Supporters of Demo-
cratic Party
Supporters of Peoples
Party
2016
Utility of aid to North Korea -0.19*** 0.20 0.72*** 0.69***
Utility of social and cultural exchange -0.04 0.19 0.55*** 0.50***
Utility of economic cooperation -0.14** 0.08 0.55*** -0.04
Utility of North-South summits -0.14* 0.14 0.41* 0.18
Utility of sanctions 0.06 0.11 -0.11 -0.07
Approval of reopening Kaesong -0.09 -0.18 0.39*** -0.06
Approval of restarting tours to Kumgang Mountain
-0.05 -0.09 0.32** 0.14
2015
Utility of aid to North Korea -0.23*** 0.19 0.47***
n/a
Utility of social and cultural exchange -0.18** 0.09 0.40**
Utility of economic cooperation -0.36*** -0.09 0.31*
Utility of North-South summits -0.20*** -0.03 0.32*
Approval of keeping Kaesong open -0.18** 0.11 0.41**
Approval of restarting tours to Kumgang Mountain
-0.28*** 0.22 0.31*
Year
Dependent Variable(Perception of North
Korea policy)
Independent Variable
Ideology
Support-ers of New
Frontier Party
Supporters of Demo-
cratic Party
Supporters of Peoples
Party
2014
Utility of aid to North Korea 0.08 -0.04 0.37*
n/a
Utility of social and cultural exchange -0.09 -0.22 0.21
Utility of economic cooperation -0.02 -0.23* 0.04
Utility of North-South summits 0.06 -0.28** 0.20
Approval of keeping Kaesong open -0.19*** -0.10 0.00
Approval of restarting tours to Kumgang Mountain
-0.21*** -0.03 0.18
2013
Utility of aid to North Korea -0.22*** -0.10 1.11***
n/a
Utility of social and cultural exchange -0.16** -0.18 0.35**
Utility of economic cooperation -0.26*** 0.05 0.58***
Utility of North-South summits -0.22*** 0.02 0.33**
Approval of keeping Kaesong open -0.32*** 0.27** 0.13
Approval of restarting tours to Kumgang Mountain
-0.14** -0.04 0.61***

Chapter 6 Ideology, Partisanship, and Perception of Unification 2016 Unification Perception Survey
250 251
Year
Dependent Variable(Perception of North
Korea policy)
Independent Variable
Ideology
Support-ers of New
Frontier Party
Supporters of Demo-
cratic Party
Supporters of Peoples
Party
2012
Utility of aid to North Korea -0.26*** -0.07 0.68***
n/a
Utility of social and cultural exchange -0.33*** 0.04 0.52***
Utility of economic cooperation -0.36*** 0.06 0.63***
Utility of North-South summits -0.22*** -0.15 0.68***
Approval of keeping Kaesong open -0.31*** -0.18 0.65***
Approval of restarting tours to Kumgang Mountain
-0.32*** 0.02 0.48***
2011
Utility of aid to North Korea -0.21*** -0.22 0.52***
n/a
Utility of social and cultural exchange -0.22*** -0.16 0.01
Utility of economic cooperation -0.24*** -0.13 0.20
Utility of North-South summits -0.20*** -0.10 0.31*
Approval of keeping Kaesong open -0.27*** -0.25* 0.66***
Approval of restarting tours to Kumgang Mountain
-0.33*** -0.09 0.66***
4) Government Evaluation and Partisanship
Lastly, the influence of ideology and partisanship on voters’
evaluation of the government’s North Korea policy, the present
economic situation, and the overall record of the President was
analysed using the same method. The results shown in <Table 2-6-
11> and <Table 2-6-12> indicate that unlike the previous items, the
partisan tendencies of New Frontier Party supporters are stronger than
those of the Democratic Party or the Peoples Party. In other words,
the more a respondent is a supporter of the New Frontier Party, the
more positive their evaluation of government policy. The results of
the regression analysis presented in <Table 2-6-12> indicate that New
Frontier Party supporters were 2.09 times more likely to positively
appraise the government’s North Korea policy than non-partisan
respondents. Conversely, supporters of other political parties were not
found to be statistically significant. New Frontier Party supporters
were more likely to positively evaluate the current economic situation
as well than non-partisan respondents, while such a partisan effect
was not found with the supporters of the Democratic Party. With this
economic item, Peoples Party supporters exhibited a similar positive
tendency as their New Frontier Party counterparts. Lastly, both New
Frontier Party and Democratic Party supporters were highly partisan in
their opinions with respect to the record of President Park Geun-hye.
Here too, New Frontier Party supporters exhibited a strong partisan
tendency, being 7.32 times more likely to evaluate the President’s
record in the job positively than non-partisans. Conversely, supporters
of the Democratic Party were 43.0% less likely to do the same.

Chapter 6 Ideology, Partisanship, and Perception of Unification 2016 Unification Perception Survey
252 253
<Table 2-6-11> Average item-by-item scores for supporters of each party
Political Party
Government's North Korea policy
(1: Very Dissatisfied~4: Very Satisfied)
Current Economic Situation
(1: Very Dissatisfied~4: Very Satisfied)
President's record(1: Very Dissatisfied~
4: Very Satisfied)
New Frontier Party 2.65 2.09 2.87
Democratic Party 2.28 1.92 1.92
Peoples Party 2.42 2.06 2.15
Non-partisan 2.35 1.95 2.14
Overall Average 2.42 1.99 2.30
<Table 2-6-12> Output from an ordered logistic analysis of determinants of evaluation of government policy
Variable
Government's North Korea policy
Current Economic Situation President's record
Coeffi. Odds Ratio Coeffi. Odds Ratio Coeffi. Odds Ratio
Age 0.01 (1.01) 0.00 (1.00) 0.01*** (1.01)
Female -0.04 (0.96) 0.13 (1.14) 0.24** (1.28)
Education -0.10 (0.91) 0.10 (1.10) -0.13 (0.87)
Income -0.03 (0.97) -0.03 (0.97) -0.04 (0.96)
Urban resident 0.03 (1.03) 0.10 (1.10) -0.03 (0.97)
Conservative Ideology
-0.01 (0.99) -0.05 (0.95) 0.18** (1.20)
New Frontier Party 0.74*** (2.09) 0.43*** (1.54) 1.99*** (7.32)
Democratic Party -0.18 (0.84) -0.12 (0.88) -0.56*** (0.57)
Peoples Party 0.16 (1.18) 0.34* (1.41) 0.12 (1.13)
No. of Respondents 1184 1184 1184
Log-Likelihood -1229.1 -1132.0 -1184.3
* Two-tailed test, *** p<.01, ** p<.05, * p<.1, The estimates for the cut points of the latent variable corresponding to each of the values of the depend variables are not reported.
Partisan inclinations from the supporters of the New Frontier Party
in their evaluation of government performance are not only found in
2016. As shown in <Table 2-6-13>, in the survey results of the previous
years since 2011, the supporters of the New Frontier Party expressed
more support for the incumbent government than the Democratic
Party. With exception of the item on the president’s approval, ideology
exerted no significant effects. If we consider that ideology had played a
significant role in previous years (2012 – 2014) in explaining attitudes
towards the government’s North Korean policy, it is clear that, turning
to 2016, the explanatory power of partisanship has strengthened with
respect to government evaluations as well.
<Table 2-6-13> Trends in the power of partisanships in relation to government performance evaluation variable (2011-2016)
YearDependent Variable
(Evaluation of government)
Independent Variable
Ideology
Support-ers of New
Frontier Party
Supporters of Demo-
cratic Party
Supporters of Peoples
Party
2016
Satisfaction with government North Korea policy
-0.01 0.74*** -0.18 0.16
Satisfaction with current economic situation
-0.05 0.43*** -0.12 0.34*
Satisfaction with President's Record 0.18*** 1.99*** -0.56*** 0.12

Chapter 6 Ideology, Partisanship, and Perception of Unification 2016 Unification Perception Survey
254 255
YearDependent Variable
(Evaluation of government)
Independent Variable
Ideology
Support-ers of New
Frontier Party
Supporters of Demo-
cratic Party
Supporters of Peoples
Party
2015
Satisfaction with government North Korea policy
0.10 0.55*** -0.24
n/aSatisfaction with current economic situation
0.04 0.17 -0.01
Satisfaction with President's Record 0.14* 1.44*** -0.91***
2014
Satisfaction with government North Korea policy
0.33*** 0.73*** -0.45***
n/aSatisfaction with current economic situation
0.06 0.41*** -0.32**
Satisfaction with President's Record 0.26*** 2.11*** -1.00***
2013
Satisfaction with government North Korea policy
0.14* 0.96*** -0.39**
n/aSatisfaction with current economic situation
-0.01 0.48*** -0.37**
Satisfaction with President's Record 0.18** 1.92*** -0.86***
2012
Satisfaction with government North Korea policy
0.38*** 0.64*** -0.41***
n/aSatisfaction with current economic situation
0.17** 0.36** 0.28*
Satisfaction with President's Record 0.29*** 1.09*** -0.55***
2011
Satisfaction with government North Korea policy
-0.02 0.66*** -0.39**
n/aSatisfaction with current economic situation
-0.10 0.62*** -0.18
Satisfaction with President's Record 0.01 1.52*** -0.57***
4. Sub-conclusion
In this chapter we analysed the South Korean people’s partisan
perceptions and beliefs with respect to Unification and North Korea
policy, utilizing results from the Unification Perception Survey.
Looking at the perception of the unification issue, perception of
North Korea policy and evaluations of government performance in
matters of North Korea, there was a noticeable trend in the direction
of partisan polarization compared to previous years. This polarization
was more evidently found the product of partisanship than ideological
tendencies. First, in general, the extent to which ideology influences
the perception of North Korea policy and unification has decreased.
For perceptions towards unification, especially, ideology registered
no significant effect on any of the related items this year, whereas
it had done so for 2.6 items out of the four items in the previous
surveys. With respect to the perceptions of North Korea policy as well,
ideology had a significant effect on only three items out of seven in
2016 compared to on 5.2 in average out of six in the previous years.
As it is found that one’s assessment of the government’s North Korea
policy was not either well accounted for by ideology in 2016, overall,
it can be concluded that the extent to which ideology plays a role
in determining attitudes towards unification and North Korea has
weakened.

Chapter 6 Ideology, Partisanship, and Perception of Unification 2016 Unification Perception Survey
256 257
In contrast, the partisanship variable’s influence has become more
significant in comparison to previous years. Even after controlling for
ideology, partisan influence proved to be significant in many subjects,
implying that citizens increasingly perceive unification and North
Korea policy independent of their ideologies. Which partisan group
had stronger effects on the formation of the attitudes, however, differs
across issue areas
Overall, while the supporters of the Democratic Party showed
partisan tendencies for the perceptions of unification and North Korea
policy, those of the New Frontier Party did so for the evaluations of
government performance. In specific, the supporters of the New
Frontier Party did not show much partisanship in perceptions to
unification and North Korea policy, yet their partisan support showed
up the most in their evaluations of government’s record on North Korea
policy and the President. This suggests that, instead of evaluating the
government’s policies on an issue-by-issue basis, they were more likely
to express across-the-board support for the government’s positions.
The deepening partisan divide can be problematic from the
normative aspect of democracy. The more one’s attitudes towards
unification and North Korea policy are shaped by her partisan
orientation, rather than genuine ideological convictions, the more
difficult it becomes for her to properly evaluate actual outcomes
specific policies produce. The more citizens take partisan sides on the
unification issues, the less the government policy will be based on
rational and prudential considerations, rather, only seek to please its
own supporters. The results of the analysis conducted in this chapter,
thus, suggest that going forward, unification and North Korea policy
could be increasingly captive to the forces of deepening partisan
polarization.
Are the tendencies of partisanship in regards to unification
perception as shown in 2016 temporary? Or is this just the beginning
of a trend that will continue henceforth? We will continue to examine
the issue going forward, but it appears that the polarization will
intensify in years to come. Given the current state of inter-Korea
relations, frozen by North Korea’s 5th nuclear test and the problems
surrounding the deployment of THAAD, it appears that in the 19th
presidential election in 2017 the unification and North Korea issues
will feature prominently. Additionally, the United States’ presidential
candidates, Donald Trump and Bernie Sanders demonstrate deepening
polarization in North America, and EU’s refugee problem continues
push voters in many European countries toward partisan extremes.
In light of such international trends, it appears that polarization will
increasingly become an important political problem in South Korea
as well.
In this, the political role played by the newly emerged People’s
Party deserves special attention. How the supporters of the People’
Party perceived unification and North Korean policy as well as

Chapter 6 Ideology, Partisanship, and Perception of Unification 2016 Unification Perception Survey
258 259
the government’s handling of North Korea policy appears to fall
between theirs of the Democratic Party and the New Frontier Party,
whilst slightly leaning towards the Democratic Party. Overall, on
the topic of the perception of unification, the People’s Party leans
slightly more towards the Democratic Party on the perceived need
for Unification. The same can be said for North Korea policy, as in
general, the supporters of the People’s Party see a need for giving aid to
North Korea, and inter-Korea exchanges, which is more in-line with
Democratic Party supporters. However, the size of the correlation is
not as strong in all regards, as the Democratic Party. With respect
to the government’s record, supporters of the People’s Party are more
aligned with the supporters of the New Frontier Party, instead of the
Democratic Party. Although only economic performance items were
shown to be significant, in all three items the influence was positive,
with People’s Party supporters having a positive view of government
policy. This poses a sharp contrast to all negative effects exerted by the
partisans of the Democracy Party in terms of government evaluation.
To conclude, the supporters of the People’s Party and their perception
and evaluations fell between the New Frontier Party and Democratic
Party supporters. This seems to be closely in line with the nature of
the party’s support group as described above. In other words, their
political position towards center reflects the fact that many of the new
People’s Party supporters have been from either non-partisans or those
formerly identified with the Democratic Party with more centristic
views. The party’s centristic position can provide an alternative to South
Korea’s party politics where there has been a sharp divide between the
Democratic Party and New Frontier Party supporters along regional
affiliations. Therefore, it seems that what political choice the People’s
Party supporters make will have an important impact on the unification
issue henceforth. The New Frontier Party and the Democratic Party
should remember that the rise of the People’s Party reflects the voter’s
disappointment to the preexisting mainstream parties, and need to
strive to create a more rational and constructive set of policies going
forward to turn their minds back.

Chapter 7 Social Integration of North Korean Defectors and Receptiveness to Multiculturalism2016 Unification Perception Survey
260 261
Chapter 7
Social Integration of North Korean Defectors and Receptiveness to Multiculturalism
1. Introduction
According to the Ministry of Unification, the number of North
Korean defectors in South Korea surpassed 30,000 in 2016. As late
as the early 2000’s, North Korean defectors were numbered in the
few thousand, their number has steadily rose, presaging the advent of
the “Age of 30,000 Defectors”. Rising numbers, however, may also be
accompanied by changing attitudes and perceptions towards North
Korean defectors, and this may impact North Korea policy and views
of unification. It is for such reasons that there is a need to examine
South Korean society in light of this rapid expansion of the defector
population.
As the number of North Korean defectors living in South Korean
society continues to rise, it has become increasingly necessary to go
beyond stereotypes that take them as a homogenous group to grasp
better the diversity and dynamism that exists within the North Korean
defector community. As existing research indicates, the reasons North
Korean defectors leave North Korea are becoming more varied.
Previously, most of them left North Korea to escape economic poverty,
or to escape destitution, the so-called ‘survival defection’. However,
more arrivals now come South in search of freedom, with disdain
for their political system, and many younger North Koreans doing
so in order to find more opportunities in life, the so-called ‘migrant
defection’.52 Additionally, as the North Korean defector population
has risen, their contact with South Koreans has been increased in
many ways. This is especially true with regard to the rise in the number
of North Korean defectors appearing on TV and in the media general.
Opportunities to access information about North Korea are very
limited, thus the rising number of North Koreans appearing in the
media has not only strongly affected the way South Koreans see the
52] When asked, in 2001 the percentage of North Korean defectors who escaped because
of “economic difficulties” was 66.7%, but in 2016 it had dropped to 12.0%. The number who
responded “in search of freedom” grew from 6.9% to 34.8%, and the number who replied that
they left became of a “disdain for the political system” increased from 6.2% to 17.5%. 80.6%
of those who previously resided in North Korea had responded in 2001 that “income levels were
insufficient,” but this dropped to 44.1% during 2014-2016. (Hankook Ilbo 2016 .11.13 Internet
Version Report)

Chapter 7 Social Integration of North Korean Defectors and Receptiveness to Multiculturalism2016 Unification Perception Survey
262 263
North, but also the image of North Korean defectors living within
South Korean society. At the end of 2011 in particular, major cable
network channels competitively expanded TV shows to deal with
current events of North Korea and human stories of North Korea
North Korean defectors are in the unique position of being able to
create networks connecting North and South Korea and this allows
them to convey important information about change going on within
North Korea whilst also attesting to the brutality and backwardness
of their country.53 However whilst North Korean defectors continue
to be portrayed mainly as “lower class”, “second class”, and as “cheap
labor” in the media, new programs have also emerged that focus on
the actual everyday lives of North Koreans in South Korean society, as
well as programs that highlight success stories within the community.54
Direct exposure combined with a wide range of images of North
Koreans living in South Korea has expanded interest amongst South
53] Kim Myeong-jun and Im Jong-seop, “The emergence of North Korean defectors in the
media and changes in the flow of ‘North Korean information’ – From ‘control’ to ‘competition’,”
Social Science Research Vol. 23 Issue 2 (2015), p. 59.
54] The major generalist channels have focused mainly on the everyday lives of women with
programs like Off to Meet You Now and South Korean Men and North Korean Women to get
ratings. On the one hand, some have praised such a development as resulting in a new, more
positive and bright image of North Korean defectors. However, others have been critical of what
they see as the sexual objectification and consumption of ‘North Korean beauties’. See: Lee
Seon-min, “How can North Korean women defectors speak?: a critical analysis of television talk
show <Now, Going To Meet> (Channel A),” Media, Gender, Culture Vo. 29 Issue 2 (2014), pp.
75-115; Jang Youngeun and Park Jihoon, “Audience reading of North Korea and North Korean
refugees on TV: a case study of <Now, Going To Meet>,” Speech and Communication Vol. 27
(2015), pp. 225-254.
Koreans and may have helped to alleviate feelings of difference. That
said, however, exposure to such media could also have reinforced and
aggravated existing, privately-held prejudice and thus perpetuated a
process of ‘othering’ North Koreans in South Korean society.
Perception of North Korean defectors is not limited to the emotional
reaction or the psychological attitudes of the South Korean public. It is
also connected to the topography of discourses related to North Korea
and the unification issue, as well as the aims of policy. Some have started
to argue that the integration of North Korean defectors into South
Korean society is no longer an issue that should be discussed as being
‘a national imperative’, but rather from the view of multiculturalism.55
From the ethno-nationalist perspective, North Koreans are part of a
community of blood ties and their existence symbolizes the necessity
of unification. They are distinct from other migrants as a part of the
national community, and their social integration can be achieved by
strengthening national identity. However, such nationalist discourse
overlooks the circumstances that North Korean defectors actually face
living in South Korean society, the cultural alienation and problems
of social communication are no different from those faced by other
55] Yoon In-Jin, “National consciousness and multicultural consciousness of South Koreans
toward North Korean migrants” Overseas Koreans Research Issue 30 (2013), pp. 7-40; Lee Su-
jong, “Multi-culturalism talks to Unification,” KDI Review of the North Korean Economy October
2011 Issue, pp. 62-78; Chun Kyung Hyo, “Looking at North Korea between racial homogeneity
and multi-culturalism: othering amidst fixed history,” Social Science Research Vol. 23 Issue 1
(2015), pp. 274-299.
Chapter 7 Social Integration of North Korean Defectors and Receptiveness to Multiculturalism2016 Unification Perception Survey
264 265
migrants or social minorities. In this regard, the multi-cultural
approach, which recognizes cultural and lifestyle differences between
North and South, seeks to handle the integration of North Koreans
within the broader context of integrating a wide range of minorities
into South Korean society. The nationalist approach, founded upon
the myth of ethnic homogeneity, is focused on the necessity of such
imaginary constructs, whilst multiculturalist discourse represents
an attempt in the academy and on the part of civic organizations to
reflect on (or criticize?) the narrow abstractions of nationalist approach
through equality and cultural relativism.56
The South Korean perception and attitudes toward North Korean
defectors will not only be impacted by their rising number and their
growing presence in the media, but also changes in the South Korean
society into which they are inducted. As polarization, and class and
generational segmentation deepen, cultural conflicts and cleavages
emerge out of new divisions in South Korean society. As the hopes for
the future inherited from a period of high economic growth gradually
shrank, individual lives increasingly have been saturated with social
risks and anxieties, as well as by fears regarding ontological security.
It has been argued that the stronger perception of social risk tend to
extend negative attitudes toward minorities and out-groups.57
56] See Cheon Gyeong-ho, p. 277.
57] Hwang Jung-Mee, “Perceived threats and South Korean’s attitude toward North Korean
defectors,” Journal of Asia-Pacific Studies Vol. 23 Issue 2 (2016), pp. 311-346.
This chapter will analyze how North Korean defectors are perceived
in South Korea using data from the 2016 Unification Perception
Survey. First, we will look at attitudinal changes amongst the South
Korean public toward North Korea, the prospects for unification,
and the task of integrating North Korean defectors. In the second
section, the degree of closeness that South Koreans feel to North
Korean defectors will be compared and contrasted with other ethnic/
national groups, and attitudinal change will also be mapped through
longitudinal analysis. In the third part, we will delve further into such
attitudinal change, making use of the concept of social distance to
better understand how attitudes have change over the last decade.
In this regard, exposure to defectors, perception of North Korea and
unification are major factors influencing the level of social distance
felt by South Koreans from North Koreans. Part four looks at the
relationship between changing receptivity to multi-cultural ideas
and perception of North Korean defectors. Finally, part five ends by
summarizing the results of the aforementioned empirical analyses, and
discusses their potential implications.
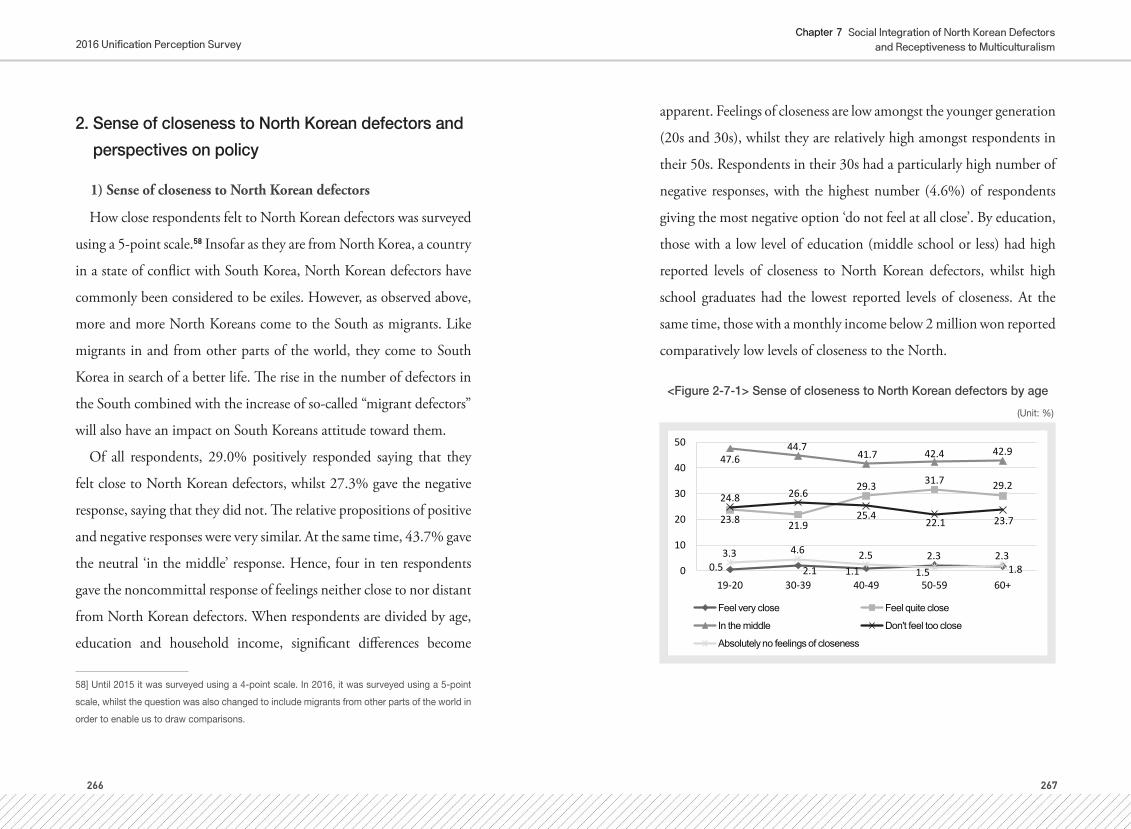
Chapter 7 Social Integration of North Korean Defectors and Receptiveness to Multiculturalism2016 Unification Perception Survey
266 267
2. Sense of closeness to North Korean defectors and
perspectives on policy
1) Sense of closeness to North Korean defectors
How close respondents felt to North Korean defectors was surveyed
using a 5-point scale.58 Insofar as they are from North Korea, a country
in a state of conflict with South Korea, North Korean defectors have
commonly been considered to be exiles. However, as observed above,
more and more North Koreans come to the South as migrants. Like
migrants in and from other parts of the world, they come to South
Korea in search of a better life. The rise in the number of defectors in
the South combined with the increase of so-called “migrant defectors”
will also have an impact on South Koreans attitude toward them.
Of all respondents, 29.0% positively responded saying that they
felt close to North Korean defectors, whilst 27.3% gave the negative
response, saying that they did not. The relative propositions of positive
and negative responses were very similar. At the same time, 43.7% gave
the neutral ‘in the middle’ response. Hence, four in ten respondents
gave the noncommittal response of feelings neither close to nor distant
from North Korean defectors. When respondents are divided by age,
education and household income, significant differences become
58] Until 2015 it was surveyed using a 4-point scale. In 2016, it was surveyed using a 5-point
scale, whilst the question was also changed to include migrants from other parts of the world in
order to enable us to draw comparisons.
apparent. Feelings of closeness are low amongst the younger generation
(20s and 30s), whilst they are relatively high amongst respondents in
their 50s. Respondents in their 30s had a particularly high number of
negative responses, with the highest number (4.6%) of respondents
giving the most negative option ‘do not feel at all close’. By education,
those with a low level of education (middle school or less) had high
reported levels of closeness to North Korean defectors, whilst high
school graduates had the lowest reported levels of closeness. At the
same time, those with a monthly income below 2 million won reported
comparatively low levels of closeness to the North.
<Figure 2-7-1> Sense of closeness to North Korean defectors by age
(Unit: %)
0.5 2.1 1.12.3
1.8
23.8 21.9
29.3 31.7 29.2
47.6 44.7
41.7 42.4 42.9
24.8 26.6
25.422.1 23.7
3.3 4.6 2.51.5
2.30
10
20
30
40
50
19-20 30-39 40-49 50-59 60+
Feel very close Feel quite close
In the middle Don't feel too close
Absolutely no feelings of closeness

Chapter 7 Social Integration of North Korean Defectors and Receptiveness to Multiculturalism2016 Unification Perception Survey
268 269
<Figure 2-7-2> Sense of closeness to North Korean defectors by household income
(Unit: %)
2.3 1.5 1.1 1.6
22.6
27.9 29.0 27.3
45.1 42.2 43.9 44.0
28.6
24.5 23.8 23.9
1.5 3.9 2.2 3.2
0
10
20
30
40
50
LESS THAN 200M WON
200 - 299M WON 300 - 399M WON 400M+ WON
Feel very close Feel quite close
In the middle Don't feel too close
Absolutely no feelings of closeness
<Figure 2-7-3> Sense of closeness to North Korean defectors by education
(Unit: %)
2.3 1.2 1.7
30.2
26.2
28.5
40.3 43.8 44.6
26.4
26.5
21.2
0.8 2.3 4.0
0
10
20
30
40
50
MIDDLE SCHOOL OR LESS HIGH SCHOOL UNIVERSITY
Feel very close Feel quite close
In the middle Don't feel too close
Absolutely no feelings of closeness
2) Feelings of closeness to North Korean defectors and migrants
residing in South Korea: Mean comparisons
The 2016 survey asked respondents about their feelings of closeness
to North Korean defectors and other migrant groups residing in the
South. Given the status of North Koreans as both political exiles and
migrants, it is certainly a highly meaningful comparison. In total,
six groups – including North Korean defectors, Chinese Koreans,
Europeans and Americans, Southeast Asians, Africans, and Arabs –
were asked about, with Europeans and Americans (30.3%) were got the
highest closeness score, followed by North Korean defectors(30.0%),
Chinese Koreans (27.1%), Southeast Asians (19.8%), Africans (7.4%),
and then Arabs (5.6%). The relatively high levels of closeness felt
toward North Korean defectors and Chinese Koreans indicates a level
of nationalist sentiment, whilst the preference for white Westerners
and distance from Africans and Arabs also speaks to racist attitudes
amongst South Koreans.
At the same time, the number of respondents who gave the negative
‘do not feel close’ response was slightly lower for North Korean
defectors (27.2%) than for Americans and Europeans (28.2%).
What’s more, the number who gave the strongly negative ‘do not feel
at all close’ was lower for North Korean defectors (2.8%) than for
Americans and Europeans (7.8%). Hence, respondents do not feel as
close to North Korean defectors as they do to people from developed

Chapter 7 Social Integration of North Korean Defectors and Receptiveness to Multiculturalism2016 Unification Perception Survey
270 271
nations, but they also do not reject them either. By contrast, negative
responses rise sharply for other groups, with 31.2% of respondents
saying they ‘do not feel close’ to Chinese Koreans, with the numbers
being higher still for Southeast Asians (38.9%), Africans (59.8%),
and Arabs (63.5%). This seemingly reflects negative attitudes toward
underdeveloped countries and the culture of the Islamic world.
<Figure 2-7-4> Feelings of closeness towards North Korean defectors and migrants residing in South Korea (2016)
(Unit: %)
1.5 2.0 1.1 2.5 0.2 0.7
27.5 25.1 18.7
27.8
5.4 6.7
43.8 41.7 41.4 41.4
31.0 32.8
24.4 24.2
28.5
20.4
39.4 35.1
2.8 7.0 10.4 7.8
24.1 24.7
0
10
20
30
40
50
North KoreanRefugee
ChineseKorean
South EastAsian
American /European
Arab African
Feel very close Feel quite close
In the middle Don't feel too close
Absolutely no feelings of closeness
In order to analyze these differences in feelings of closeness more
deeply, an average score (composed of a five-point scale) was calculated
and the gender, age and education of respondents was compared. By
score, it is North Korean defectors (3.00) who were considered closest,
followed by Americans and Europeans (2.97), Chinese Koreans (2.91),
Southeast Asians (2.72), Africans (2.24), and then Arabs (2.18).
Whilst it is clear that North Korean defectors are considered closer,
it is notable that other ethnic Koreans – i.e. Chinese Koreans – score
lower than immigrants from the West.
While there is no significant difference in closeness scores by gender,
statistically significant variation by age and education were observed.
Differences by age and education for each immigrant group are
shown in the Figures below. For Americans and Europeans, as well
as Southeast Asians such differences are not large, and attitudes are
approximately similar across age groups and by education levels. On
the other hand, with North Korean defectors and Chinese Koreans, age
differences are evident. The younger, the less the feelings of closeness,
with those in their 50s demonstrating the strongest levels of closeness.
At the same time, feelings of closeness to Africans and Arabs are more
dependent on education, with high school graduates responding with
lower levels compared to college (or higher) graduates and those who
only graduated middle school.
These results can be summarized in two ways. First of all,
respondents tend to feel closer to North Korean defectors – albeit only
slightly compared to some other migrant groups. On a percentage
basis, attitudes towards Americans and Europeans are quite positive,
however, when scaled, feelings of closeness are higher towards North
Korean defectors. The two groups exhibit similar levels of closeness in

Chapter 7 Social Integration of North Korean Defectors and Receptiveness to Multiculturalism2016 Unification Perception Survey
272 273
the data, whilst they both feel closer to South Koreans than Chinese
Koreans. Secondly, feels of closeness exhibit significant variation
by age, with respondents in their 30s reporting the lowest levels of
closeness and 20s report similar levels too. Aside from ethnic Koreans
– North Korean defectors and Chinese Koreans – reported levels of
closeness do not vary by age. In other words, with migrant groups
considered to be ethnically Korean, respondents evince a different set
of patterns by age and educational background.
<Table 2-7-1> Sense of closeness to immigrant groups (2016)
(Unit: 5 point scale average value)
ClassificationNorth
Korean Refugee
Chinese Korean
South East
Asian
American·European Arab African
GenderMale 2.99 2.91 2.70 2.99 2.18 2.25
Female 3.02 2.91 2.73 2.95 2.18 2.23
Age
19-29 2.94 2.79 2.69 3.03 2.23 2.26
30-39 2.90 2.75 2.66 2.98 2.13 2.23
40-49 3.01 2.96 2.74 2.95 2.17 2.22
50-59 3.11 3.04 2.78 2.96 2.19 2.26
60+ 3.04 2.97 2.71 2.93 2.20 2.22
F 2.464* 4.676** 0.551 0.332 0.352 0.097
Level of Educa-
tion
Middle School or Less
3.07 2.99 2.73 2.96 2.29 2.35
High School 2.97 2.96 2.74 2.94 2.14 2.14
University or More 3.03 2.83 2.69 3.00 2.21 2.33
F 0.947 3.291* 0.405 0.51 1.942 6.492**
Total 3.00 2.91 2.72 2.97 2.18 2.24
*: p< .05, **: p<.01, ***: p<.001)
<Figure 2-7-5> Sense of closeness to immigrant groups by age and education (2016)
(Unit: 5 point scale average value)
1.5
2.5
3.5
ChineseKorean Asian
19~29 30~39 40~49 50~59
North KoreanRefugee
South East American /European
Arab African
60+
Middle School or less High School University or more
3) Attitudes with respect to North Korean defector-related policy
As noted above, over 30,000 North Korean defectors have settled
down in the South. Hence, in public concerns on policies supporting
defectors have naturally increased. Opinions about how receptive
South Korea should be to North Korean defectors are becoming more
negative. In 2007, when the survey began, 52.0% of respondents
said that ‘all [North Korean defectors] who want to come should
be accepted.’ However, in 2016, this had declined to only 33.8% of
respondents. Conversely, the number answering ‘no more should be
accepted’ has risen slightly from 10.8% in 2007 to 14.8% in 2016.
What’s more, the majority (51.4%) of respondents say that they think
North Koreans should be accepted ‘selectively’.

Chapter 7 Social Integration of North Korean Defectors and Receptiveness to Multiculturalism2016 Unification Perception Survey
274 275
Hence, where in 2007, the majority favored blanket acceptance of all
defectors, now the majority favors conditional acceptance contingent
on circumstances. But what circumstances? Respondents were not
asked what kind of defectors they believe the South Korean state
should accept, but such changes in response patterns are in themselves
highly meaningful. Selective acceptance is frequently discussed in the
area of immigration policy, usually associated with the receiving state
screening arrivals to ensure that they conform with social standards
and can adapt to the culture of hosting societies. In other words, this
contains an assimilationist view of immigration.59 This can also be
seen as a retreat from the view that North Koreans are either citizens
of the Republic of Korea (as they are defined in the constitution), or
‘refugees’ who are subject to humanitarian considerations. Taken as
a whole, such attitudinal changes seemingly reflect and interact with
broader discourses on migration present in South Korean society.
Attitudes to public policies supporting North Korean defectors
are also becoming more negative. From 2012 to 2015, views were
split nearly down the middle on the issue of whether ‘the government
59] The percentage of respondents who say they think that “North Korean defectors should
compete on an equal basis within organizations” has also risen gradually (from 63.7% in 2007,
to 67.7% in 2010, to 68.0% on 2014, and 73.0% in 2016). Arguably this indicates that this
‘selective’ acceptance partially means people who are competitive within South Korea organi-
zations. This is similar to recent trends in immigration policy that emphasize the acceptance of
competitive, able individuals who can potentially contribute to social development rather than
become a social burden.
should increase support to North Korean defectors ’. But in 2016, those
disagreeing with this statement (58.7%) substantially outnumbered
those who agreed (40.3%).
It seems that more South Koreans believe that if numbers of North
Koreans rise it will become more difficult to find work, and that North
Koreans must compete as equals at work. This is essentially the same
as fears amongst South Koreans regarding immigration generally:
more immigration will create more competition for jobs, and policies
favoring or supporting immigrants and minorities should be avoided.
Growing negative attitudes toward support for North Koreans bear a
striking resemblance to the general belief that immigrants should be
kept out of South Korea.
<Figure 2-7-6> Opinions regarding the acceptance of North Korean defectors (2007-2016)
(Unit:%)
52.0
44.0
46.6
43.9
47.6
43.9 42.2 42.3 41.1 33.8 37.2
46.2
43.1
48.3
43.5
46.2 45.2 50.3 48.5 51.4
10.8 9.8 10.3 7.8 8.8 9.9 12.7 7.4
10.4 14.8
0
10
20
30
40
50
60
2007 2008 2009 2010 2011 2012 2013 2014 2015 2016
Accommodate all North Korean Refugees
Accommodate Selectively
Cannot Accoodate Any More

Chapter 7 Social Integration of North Korean Defectors and Receptiveness to Multiculturalism2016 Unification Perception Survey
276 277
<Figure 2-7-7> Opinions toward “The government should give more aid to North Korean defectors” (2007-2016)
(Unit:%)
9.8
5.1
9.4 9.8 9.8 7.5 8.9
8.3 10.2
7.6
49.3
39.4
43.9 45.9
49.8 43.4
40.7
41.9
40.4
33.7 35.1
45.3
40.8 38.5 35.1
42.3 40.9 41.4 49.5
5.8
10.2
5.9 5.8 5.2 6.8
9.5
8.0 8.0
9.2
0
10
20
30
40
50
2007 2008 2009 2010 2011 2012 2013 2014 2015 2016
Agree A lot Agree somewhat
Don't Agree Much Don't Agree At All
<Figure 2-7-8> Opinions toward “Gaining employment has become more difficult due to North Korean defectors” (2007-2016)
(Unit:%)
2.1 2.2 1.9 1.9 2.2 1.9 4.7 3.0 5.3 4.4
24.5 23.7 21.8 22.6 19.7 22.8 23.3 23.3 29.4
34.2
56.3 61.0
58.0 57.3 58.6 58.9 55.8 58.9 50.5 51.7
17.1 13.0
18.3 18.2 19.6 16.4 16.3 14.8 14.8
9.7
0
10
20
30
40
50
60
70
2007 2008 2009 2010 2011 2012 2013 2014 2015 2016
Agree A lot Agree somewhat
Don't Agree Much Don't Agree At All
<Figure 2-7-9> Opinions toward “North Korean defectors should be subject to the same competition as everyone else in a workplace”
(2007-2016)(Unit:%)
13.3 18.1
14.0 13.4 13.8 16.3 15.4 13.3 15.0 11.2
50.4 46.0
54.4
54.3 55.0 52.8
52.6
54.8
56.0 61.8
32.3 33.1 28.0 26.9 27.3 27.5 27.8 29.5
24.9 25.2
4.1 2.8 3.6 5.3 3.9 3.5 4.3 2.5 4.2 1.7 0
10
20
30
40
50
60
70
2007 2008 2009 2010 2011 2012 2013 2014 2015 2016
Agree A lot Agree somewhat
Don't Agree Much Don't Agree At All
<Figure 2-7-10> Opinions toward “North Korean defectors help resolve heterogeneity between South and North Korea” (2007-2016)
(Unit:%)
6.0
2.7
5.4 7.7 8.3 6.7 7.5 5.5 8.5 4.5
47.8
42.6
49.4 51.7 52.4 52.2
47.9 58.0 52.8
58.2
41.7
49.2
41.2 36.0
35.5 36.9 39.5
32.9
32.7 33.8
4.6
5.4
4.0 4.7 3.8 4.3 5.1 3.7 6.0 3.5 0
10
20
30
40
50
60
2007 2008 2009 2010 2011 2012 2013 2014 2015 2016
Agree A lot Agree somewhat
Don't Agree Much Don't Agree At All

Chapter 7 Social Integration of North Korean Defectors and Receptiveness to Multiculturalism2016 Unification Perception Survey
278 279
Meanwhile, the number of respondents who expect that North
Korean defectors will help resolve differences between the two Koreas
continues to rise. In 2007, 53.8% of respondents said so, by 2010 this
had risen to 58.7%, in 2014 to 61.3%, whilst in 2016 it hit 62.7%.
What do such seemingly contradictory trends mean?
These attitudes are probably connected to views of unification.
Given that support policies are directly related to the redistribution of
social resources affecting the interests of existing members of a society,
they may become a source of more tension going forward. One could
speculate that there is a connection between the perceived benefits
(social or personal) of unification and attitudes towards policies that
support North Koreans. Hence, there is a need to look at the trends
between the two through a longitudinal analysis.
As is evident from <Figure 2-7-11>, unification is far more widely
expected to be socially beneficial than personally. Such a gap in
perceptions has been relatively uniform, and the number of respondents
expecting benefits from unification, both socially and personally, fell
in 2016. At the same time, negative attitudes toward support for
defectors and fears that defectors will make the job situation in South
Korea worse are on the rise. In other words, the expected benefits of
unification are lessening in the minds of South Koreans, whilst they
become more conscious of the potential burden or threat of rising
defector numbers. On the other hand, the number of respondents
who say they expect defectors to help resolve differences between the
two Koreas continues to rise. The response trend is similar to that of
expected social benefits of unification. One can surmise that the cost
of policies or the benefits of unification fall into the realm of rational
calculation while the resolution of differences is considered a moral
issue.
Such an analysis demonstrates the dual view of support policies
for North Korean defectors among South Koreans, emphasizing
perceived racial homogeneity, but at the same time fearing about
the negative effects of rising immigration. It is clear that attitudes
have become more negative with respect to receiving North Korean
defectors, reflecting broader concerns that migrants could potentially
have a negative impact on the lives of existing members of society. It
appears that the belief that defectors should be selectively accepted has
spread due to discourse pertaining to immigration policies that seek
to select and accept migrants on the basis of their talents. However,
the belief that defectors can help in the integration of the two Koreas
into one national community after unification has also continued to
strengthen. It is such that nationalistic discourses that stress national
homogeneity and unification have also, at least in part, had an impact
on the attitudes towards North Korean defectors.

Chapter 7 Social Integration of North Korean Defectors and Receptiveness to Multiculturalism2016 Unification Perception Survey
280 281
<Figure 2-7-11> The benefits of unification and attitudes to North Korean defector-related policy (2007-2016)
(Unit:%)
55.8 47.3 53.2 53.5 50.7
51.6
49.0
55.5 57.4
53.0
30.3 27.0 23.9 24.8 27.8 26.0
21.8
26.7 27.9
24.6
53.8 45.3
54.8 59.3 60.7 58.8 55.4
63.5 61.3 62.7
26.6 25.9 23.7 24.5 21.8
24.7
27.9
26.3
34.8 38.6
59.2
44.5
53.3 55.7 59.6 50.9
49.6 50.1 50.6 41.3
20
30
40
50
60
70
2007 2008 2009 2010 2011 2012 2013 2014 2015 2016
Unification Benefits South Korea
Unification Benefits Me
Refugees Contribute to Reducing Feelings of Difference
Difficulties Finding Employment Because of Refugees
Increase Support for Refugees
The response rate of agreement: “Agree a lot” + “Agree somewhat”
3. Social distance from North Korean defectors and
perception of unification and North Korea
1) Social distance from North Korean defectors: Time-series analysis
The concept of ‘social distance’ is the most widely used in sociology
to analyze discrimination and prejudice towards out-groups with
different national or racial backgrounds. The classic measure of social
distance, the Bogardus Scale was used with modifications for the
present survey. Respondents were asked whether they were willing to
accept North Korean defectors as marriage partners (family), partners
in business, colleagues, neighbors or whether they would not – each
forming a five-point scale. The higher the score, the further the sense
of distance.
When the results from 2007 and 2016 are compared, it is clear that
social distance with respect to North Koreans has grown. Of course,
attitudinal change over the past nine years does not uniformly exhibit
such a trend, but from 2014 it is clear that feelings toward North
Korean defectors have cooled since 2014.
<Figure 2-7-12> Social distance toward North Korean defectors (2014-2016)(Unit:5 point scale*)
2.692.63
2.62
3.103.27
2.72
3.23
3.54
2.0
2.5
3.0
3.5
4.0
Colleagues Business partners Marriage partners
2007 2008 2009 2010 2011
2012 2013 2014 2015 2016
Neighbors
* The higher the score, the further the sense of distance

Chapter 7 Social Integration of North Korean Defectors and Receptiveness to Multiculturalism2016 Unification Perception Survey
282 283
The aggregate scores for each of the items (marriage partners
[family], partners in business, colleagues, neighbors) were added
together for more in-depth analysis.60 There is a trend over the period
of 2007 to 2016 (Figure 2-7-13) that from 2007 to 2011, there were
rises and falls, whilst from 2011 to 2015 there were continued falls,
but in 2016, the highest cumulative social distance score was recorded.
<Figure 2-7-13> Social distance with respect to North Korean defectors (cumulative score) time-series (2007-2016)
(Unit:point scale*)
7.63
7.95 7.86
7.65 7.81
7.72 7.60
7.52 7.51
8.18
7.0
7.5
8.0
8.5
9.0
2007 2008 2009 2010 2011 2012 2013 2014 2015 2016
* 0~16 point, the higher the score, the further the sense of distance
60] ‘Not at all reluctant’ was recoded as 0, and ‘highly reluctant’ was recoded as 4, thus creating
an aggregated scale of between 0 and 16 for respondents.
So why have feelings of social distance toward North Koreans risen
in 2016? It is difficult to explain the causes in a simple fashion, but
there is a need to look at attitudinal changes across age groups for the
analysis of the causes. As stated above, feelings of closeness toward
North Koreans exhibit significant variation between age groups, and
by extension, different generations have different perspectives on
defectors as a group. Here generation should be distinguished from
the concept of cohort. In accordance with Kim Byeong-jo’s (2015)61
typology, respondents were divided into four groups by the year of their
birth. Kim, in a manner slightly different to other South Korea-related
generational analysis divides generations according to important events
related to unification and inter-Korean relations in history. Specifically,
generations are divided up by what related incidents they would have
witnessed, namely: Inter-Korean Competition Generation (1941-
60), Democratization Unification Generation (1961-70), Post-Cold
War Unification Generation (1971-80), and Unification Preparation
Generation (1981-96). See the table below for more details.
61] Kim Byeong Jo, “Differences and segmentation in unification perspectives between gen-
erations,” Park Myung-kyu et al., 2015 Unification Perspective Survey (Seoul: Seoul National
University Institute for Unification and Peace Studies, 2015).

Chapter 7 Social Integration of North Korean Defectors and Receptiveness to Multiculturalism2016 Unification Perception Survey
284 285
<Table 2-7-2> Unification, inter-Korean relations and generation divisions
Generation Year of Birth
Current Age
Historical Experience of Unification and North Korean Relations as an Adolescent
Inter-Korean Competition Generation
1941-60 56+
Anti-communism state ideology, armed communist guerilla, 1.21 incident, 7.4 inter-Korean Communique, Revitalizing Reform's System, Vietnam War
Democratiza-tion Unification
Generation1961-70 45-55
Industrialization, Democratization, Seoul Olympics, Getting to Know North Korea
Post Cold-War Generation
1971-80 36-45
Collapse of Soviet Union, German Unifi-cation, Plan to Unify One Nation, Death of Kim Il-Sung, Arduous March, North Korean Refugees, Mt. Geumgang
Unification Preparation Generation
1996-81 20-35
Inter-Korean Summits, South-South Conflict, North Korea's Nuclear Devel-opment, Cheonan Incident, Attack on Yeongpyeongdo
* Source: Kim Byeong Jo, 2016, Page 184. Age updated to reflect respondent's age as of 2016
<Figure 2-7-14> Social distance with respect to North Korean defectors (cumulative scores): change by generation (2007-2016)
(Unit:point scale)
7.78
7.97 8.12
7.71 7.76 7.71
7.45
7.23 7.41
8.06
7.58
7.90
7.43 7.43 7.54 7.68
7.33
7.56
7.07
7.98
7.31
7.78
8.03
7.62
7.95
7.62 7.43
7.69 7.51
8.25 7.84
8.19
7.90 7.84
8.03 7.88
8.13
7.55
7.98
8.41
7.0
7.5
8.0
8.5
9.0
2007 2008 2009 2010 2011 2012 2013 2014 2015 2016
Inter-Korean Competition Generation
Democratization Unification Generation
Post Cold-War Generation
Unification Preparation Generation
Changes over time to perceived social distance (cumulative score)
toward North Korean defectors when divided by generation indicate
that there was no uniform trend between 2007 and 2014 with a certain
range of variation over the period. Overall, the Democratization
Unification Generation (1961-70) felt relatively close to North Korean
defectors, whilst the Unification Preparation Generation (1981-96)
exhibited more distance to North Korean defectors, but these numbers
have also reversed in some years during the period.
However, in 2016, feelings of social distance rose amongst all
generations, whilst the gap between the generations noticeably
narrowed compared to 2015. The Democratization Unification
Generation (1961-70), which had been comparatively been least
inclined to express feelings of social distance toward North Koreans,
expressed markedly higher levels of social distance, reporting levels
comparable to the Inter-Korean Competition Generation (1941-
60). Indeed, unlike prior years, increasing levels of social distance are
reported across all generations. Feelings of social distance amongst the
Post-Cold War Unification Generation (1971-80) and the Unification
Preparation Generation (1981-96) were much higher. It appears that
there is now growing convergence amongst the generations on the
issue. This result must be considered in future discussions of policies
related to the social integration of North Korean defectors.

Chapter 7 Social Integration of North Korean Defectors and Receptiveness to Multiculturalism2016 Unification Perception Survey
286 287
2) Mean comparison analysis: Social distance and exposure,
perception of North Korea and unification
In understanding growing feelings of social distance, we must look
separately at factors that are resulting in such differences. In existing
research, the impact of ‘exposure’ on the perception of and feelings of
distance has received attention.62 The argument is that those who have
been exposed to North Korean defectors and North Korean culture
are more understanding of and feel less social distance toward North
Korean defectors than those who have no such exposure.
Next, the ‘North Korea’ element may have an impact on people.
South Koreans do not distinguish between North Koreans and
North Korean defectors, and on TV shows or in films, see them as
representing all the features of North Korean society.63 This leads to
an argument that we should first look at how perceptions of North
Korea shapes perceptions of North Korean defectors before discussing
how North Korean defectors behave and the roles they have in South
Korean society.
A third factor that influences feelings of social distance toward
North Korean defectors are linked to attitudes regarding unification.
62] Lee Su Jung and Yang kye Min, “Difference of South Korean residents’ attitudes toward
North Korean immigrants depending on the contact level in local community: a case of Nonhy-
on-dong, Inchon,” North Korean Studies Review Vol. 17 Issue 1 (2013), pp. 395-420.
63] Oh Yeong Suk, “Cinematic representation and imaginary space of the North Korean defec-
tors,” Film Research No. 51 (2012), pp. 185-212.
This is because a positive view of North Korean defectors entails an
important role they will play in the unification process. One can
suggest the hypothesis that interest in unification and belief that it is
needed to occur soon may lead to either greater or lesser feelings of
social distance toward North Korean defectors. Hence, in this section,
mean comparisons of these three factors and whether they affect
feelings of social distance are presented below (Figure 2-7-15).
<Figure 2-7-15> Feelings of social distance toward North Korean defectors – three factors
Exposure
Attitudes towards North Korean
Defectors(Social distance)
Perceptions of North Korea
Attitudes towards unification
The exposure factor was measured through three items – had visited
and gone on tours to North Korea, had met defectors, had exposure to
North Korean culture – with differences in feelings of social distance,
then their associations were statistically calculated. With all three items,
the average for those who did not have exposure was higher than those
who did, and the results were found statistically significant. Those who
had met North Koreans had markedly lower cumulative scores on the

Chapter 7 Social Integration of North Korean Defectors and Receptiveness to Multiculturalism2016 Unification Perception Survey
288 289
social distance scale. Exposure does have positive effects on feelings of
distance. Such results accord with patterns in existing research.64 The
results are of course limited because only 171 respondents had met
North Korean defectors, but the same patterns are repeated in both
the 2015 and 2016 data.65
<Table 2-7-3> “Exposure” variables and feelings of social distance toward North Koreans (2016)
(Unit: Social Distance Aggregate Sum)
Item Response N Average Score Significance
Visit / Tour North Korea
Yes 25 8.1639t= .022
No 1176 8.1780
Meet NorthKorean Refugees
Yes 171 7.2429t= 4.243***
No 1030 8.3324
Expore to North Korean Culture
Yes 260 8.1023t= .439
No 941 8.1985
Differences in perception of North Korea itself were also tied to
meaningful differences in reported feelings of social distance toward
North Koreans. Respondents who see North Korea as ‘a country to
help’ or ‘a partner’ report comparatively lower levels of social distance.
Conversely, those who say the North is a place to be ‘cautious/wary
64] Lee Su Jung and Yang Kye Min (2013).
65] Hwang Jung-Mee, “Multicultural era, perception of North Korean defectors and social
integration,” Park Myung-kyu et al., 2015 Unification Perspective Survey, (Seoul: Seoul National
University Institute for Unification and Peace Studies, 2015), pp. 250-276.
of ’ tend to have heightened feelings of social distance. Differences in
social distance by the perceptions of North Korea were found larger
than those across the exposure groups mentioned above.
<Table 2-7-4> Perception of North Korea and feelings of social distance toward North Korean defectors (2016)
(Unit: Social Distance Aggregate Sum)
Perception of North Korea Average N Standard Deviation
State that we need to help / Recipient of Aid 7.6257 139 3.38278
State that to cooperate with / Partner 7.6408 525 3.12568
Competitor 8.5138 99 2.46813
A State we need to be weary of 9.1144 260 2.98999
Hostile power that threatens the peace 8.6382 178 3.05893
Total (F= 12.429***) 8.1777 1201 3.12778
At the same time, perception of unification also impacts attitudes
toward North Korean defectors. Those who believe unification
should happen as soon as possible also report lower levels of social
distance, whilst those who want to maintain the status quo report
comparatively high levels of social distance. In other words, the earlier
one wants unification, the less social distance one feels from North
Korean defectors.

Chapter 7 Social Integration of North Korean Defectors and Receptiveness to Multiculturalism2016 Unification Perception Survey
290 291
<Table 2-7-5> Perception of unification and social distance from North Korean defectors (2016)
(Unit: Social Distance Aggregate Sum)
Perception of North Korean Average N Standard Deviation
Need to achieve unification through any means possible
7.5441 157 3.56778
Wait for the right circumstances prior to unification
7.9236 650 2.97476
Status Quo is Best 9.0415 279 3.11014
Not interested in Unification 8.3894 115 2.96557
Total (F= 11.226***) 8.1777 1201 3.12778
The results of an ANOVA analysis of social distance toward North
Koreans reveals that exposure factors, perception of North Korea,
and perception of unification are all statistically significant factors.
Perception of North Korea is where differences become most evident.
It is also possible to argue that such a growing feeling of social distance
detected in 2016 was also the result of changes in perceptions of
North Korea and unification. The time-series and ANOVA analyses
combined, deepening conflict over North Korea’s nuclear tests, the
closure of the Kaesong Industrial Zone (KIZ), the narrowing of policy
options with the severing of channels of exchange between North
and South, and growing negative attitudes toward the prospects of
unification all arguably have had impacts on attitudes towards North
Koreans.
4. Receptiveness toward multiculturalism, perception
of migrants and the social integration of North
Korean defectors
As detailed above, perception of North Korean defectors and
related policies are not only influenced by nationalist perspectives that
emphasize ethnic homogeneity and the importance of unification, but
also by multiculturalist perspectives. In this regard, the connection
between perception of North Korean defectors and receptivity to
multiculturalism has been the object of interest for many researchers.
There are a wide range of indices that measure positive attitudinal
change to growing migrant numbers and increasing cultural and racial
diversity. This survey used two such items. The first was ‘whatever the
country [migrants come from], it is good for a variety of races, religions
and cultures to coexist’. The number of respondents supportive of this
proposition fell slightly in 2016 on 2015, and was the lowest over the
last five surveys (3.48 in a 5-point scale).66 The second item, ‘national
cohesion will be harmed by accepting many nationalities as citizens’
(recoded and reversed), shows little sign of variation over the last five
years.
Since 2000, the number of migrants living in South Korea has
66] Statistically meaningful differences over the period of 2012-16 were observed in the average
response for the cultural diversity coexistence item. (F=18.518***)

Chapter 7 Social Integration of North Korean Defectors and Receptiveness to Multiculturalism2016 Unification Perception Survey
292 293
steadily increased, and now exceeds 1.9 million.67 But receptivity to
cultural diversity does not rise uniformly with immigrant numbers,
and in 2016, reported receptivity declined. We cannot conclude data
point alone that receptivity to multiculturalism is declining, but such
trends align with the loss of support for accepting North Korean
defectors and growing feelings of social distance toward North Korean
defectors discussed above.
<Figure 2-7-16> Changes in receptivity to multiculturalism over time(Unit: 5 point scale average value)
0.5 2.1 1.12.3
1.8
23.8 21.9
29.3 31.7 29.2
47.6 44.7
41.7 42.4 42.9
24.8 26.6
25.422.1 23.7
3.3 4.6 2.51.5
2.30
10
20
30
40
50
19-20 30-39 40-49 50-59 60+
Feel very close Feel quite close
In the middle Don't feel too close
Absolutely no feelings of closeness
There is a need to determine whether declining receptivity to
multiculturalism is linked to perception of North Koreans and
67] According to data published in the Migration Foreigner Policy Statistical Monthly by the Min-
istry of Justice, as of November 2016, there were 1,999,195 foreign residents in South Korea.
(http://www.immigration.go.kr/doc_html/attach/imm/f2016//20161223272626_1_1.hwp.files/
Sections1.html).
unification. As noted above, attitudes to defectors are influenced by
attitudes towards unification and North Korea, but also linked to
general attitudes towards migrants and cultural diversity. In this regard,
an ANOVA analysis was done in order to determine whether there is a
meaningful statistical variation in the multicultural receptivity scores
of respondents (five-point scale, average) by levels of receptiveness
toward North Koreans defectors and perceptions of North Korea.
<Table 2-7-6> Receptivity to multiculturalism and opinions on accepting North Korean defectors (2016)
(Unit: 5 point scale average value)
Opinion on Accommodating North Korean Refugees
Multi-cultural Receptiveness
Support for Cultural Diversity
Support for a multi-cultural state (re)
Accommodate all North Korean Refugees 3.72 2.85
Accommodate Selectively 3.57 2.73
Cannot Accommodate Any More 3.41 2.78
Difference Test (F) 40.326*** 12.926***
<Table 2-7-7> Receptivity to multiculturalism and opinions on unification (2016)
(Unit: 5 point scale average value)
Opinion on UnificationMulti-cultural Receptiveness
Support for Cultural Diversity
Support for a multi-cultural state (re)
Need to achieve unification through any means possible 3.73 2.82
Wait for the right circumstances prior to unification 3.66 2.80

Chapter 7 Social Integration of North Korean Defectors and Receptiveness to Multiculturalism2016 Unification Perception Survey
294 295
Opinion on UnificationMulti-cultural Receptiveness
Support for Cultural Diversity
Support for a multi-cultural state (re)
Status Quo is Best 3.50 2.73
Not interested in Unification 3.35 2.72
Difference Test (F) 30.931*** 2.974*
As can be seen in <Table 2-7-6> receptivity to North Korean
defectors is connected to general receptivity to multiculturalism.
Respondents who think that all North Korean defectors should be
accepted have higher levels of receptivity to multiculturalism. What’s
more, those who want unification as soon as possible are more receptive
to multiculturalism (Table 2-7-7). Those who accept a wide range of
races and nationalities as potential citizens and respect cultural diversity
are seemingly contraposed to those who see unification and ethnic
homogeneity as important. Yet, survey data indicates that support for
multiculturalism is connected to acceptance of defectors and support
for unification.
5. Sub-conclusion
In era where there are 30,000 North Korean defectors living in
South Korea, their social integration is having a complex impact on
social discourse. Some believe that the North Korean issue is part of
the problem of unification, and is thus an issue that must be dealt
with from the point of view of nationalism. At the same time, to
resolve cultural differences and communication problems, there are
those who argue that a multicultural or migrant integration approach
is what is called for. Analysis of feelings of social closeness to and social
distance from North Korean defectors, policy support for defectors,
receptivity to multiculturalism and perceptions of North Korean
defectors indicate that neither perspective alone fully encapsulates
actual social attitudes. In perception of and attitudes toward defectors,
migrant policy discourse and multiculturalist values have had an
impact to some extent, with statistically significant results found in
analysis. What is clear is that the North Korean defector issue can no
longer be fully explained with reference to the national integration
of the two Koreas. However, a multiculturalist approach also has
limitations because perception of unification and perceived need to
resolve differences between the two countries, as well as expectations
of the potential role North Korean defectors can play in such processes
impact attitudes towards North Korean defectors. The nationalist
and multiculturalist approaches no longer represent a binary choice,
given that national integration and integration of migrants overlap,
requiring a new theoretical approach to the issue.
In the 2016 survey, social distance toward North Korean defectors
had increased compared to before, and more respondents are reluctant
to accept North Koreans into South Korean society. Such results
Chapter 7 Social Integration of North Korean Defectors and Receptiveness to Multiculturalism2016 Unification Perception Survey
296 297
indicate wariness toward accepting increasing numbers of migrants
and seemingly the influence of typical migration policy with its
emphasis on assimilating to dominant values and norms in the host
society. ‘Selective acceptance’ now seems to represent South Korean
social attitudes toward North Korean defectors and migrants. Hence,
migration policy discourse is exercising a significant and negative
impact on attitudes regarding the acceptance of North Korean
defectors. On the other hand, however, multicultural receptivity - i.e.
acceptance of cultural diversity and difference – is also associated with
receptivity toward North Korean defectors. In other words, it is to be
expected that greater tolerance toward migrants in general will lead to
greater tolerance of North Korean defectors, and should the impulse
to exclude migrants spread further this will also have a similar impact
on defectors. It is increasingly possible that attitudes towards defectors
will at least partially become imbedded within migration discourse.
Whilst these results are truly fascinating, but it should be noted that
attitudes towards North Korean defectors cannot be fully explained
through reference to multicultural and anti-multicultural discourse
alone. Indeed, in spite of growing social distance toward North
Koreans and negative attitudes toward support for North Korean
defectors, there are also growing hopes that North Koreans can help
alleviate differences between North and South. Increasing immigrant
numbers – including North Korean defectors – have led to fears
that this will a negative impact on the distribution of resources away
from existing members of society. Nevertheless, there still exist high
hopes with respect to the normative role in alleviating differences and
fostering a shared sense of homogeneity. This issue is separated from
concerns about migrant policy.
The social integration of North Koreans is an issue that overlaps
with the national issue of creating a unified state and democratic
values with respect to the integration of migrants and minorities,
as well as social justice issues related to them. Empirical analysis of
Unification Perception Survey data indicates that South Korean
popular perspectives on the North Korean defector issue overlap the
nationalist and multiculturalist perspectives. It is urgent that additional,
cumulative empirical analyses of such phenomena be done, whilst a new
theoretical understanding is also formulated. The issue of unification
must be reevaluated in a more comprehensive manner in light of the
integration of social minorities, institutionalization of related policies,
and cultivation of inclusive and integrated democratic values. This
is because the issues that surround North Korea policy, unification
policy, and the social integration of North Korean defectors are related
to the unique ‘national’ situation on the Korean peninsula, but at the
same time, also associated with socially ‘universal’ democratic issues of
cultural diversity and the acceptance and integration of national and
ethnic minorities.

Conclusion

Conclusion 2016 South Korean People’s Attitude and Perception of Unification 2016 Unification Perception Survey
300 301
Conclusion
2016 South Korean People’s Attitude and Perception of Unification
A decade of survey results on the South Korean people’s perception
of unification from 2007 to 2016 have confirmed that perception of
the unification issue may drastically change depending on political
circumstances. Even though the South Korean people’s perception
of unification seemed to be at times impacted by both domestic and
international circumstances, it had also a certain direction. It was for
such reasons that we took a look at how the South Korean’s perception
of unification has changed over the past 10 years which can be summed
up as follows.
First, it appears that the South Korean public has felt a lessening
need for unification with the passage of time. Overall, the response
‘Unification is needed’ has fluctuated above 50% every year. However,
the number of people responding that ‘Unification is not needed’ has
slowly, but steadily increased each year. Therefore, it is safe to say that
it appears that the South Korean people are slowly losing their desire
for unification. The young generation has led this change throughout
the past 10 years. As the perceived need for unification amongst those
in their 20s and 30s has consistently declined, the gap with other
generations appears to be widening. The young generation not only
has a lower desire for unification than the middle-aged, but is more
skeptical about unification than the young of ten years ago. This allows
us to predict that such trends would continue into the future.
Next, it is worth looking at the reasons respondents have given for
why unification is needed. Just 10 years ago, in 2007 and 2008, more
than 50% of the respondents chose a nationalistic response as the reason
for unification, namely “Because we [the Korean people] are the same
nation”. However, the number of people who choose this response has
steadily decreased over time. The number dropped this year to under
40% (38.6%) for the first time since this survey began. Instead, the
practical and rational response, ‘Unification is needed to eliminate the
threat of war between North and South Korea’, has steadily increased.
The division of North and South Korea has been an obstacle to the
development of South Korean society less because of a high possibility
of war than due to consequent political and economic problems such
as the spread of security fears, the worsening international situation,
and the increase of geopolitical threats. The pressing security concerns

Conclusion 2016 South Korean People’s Attitude and Perception of Unification 2016 Unification Perception Survey
302 303
between North and South Korea have become a strong justification for
the state to politically demand the people to sacrifice democracy, and
security issues have also divided people along ideological and social
lines. The economic security threat has been negatively impacting the
confidence of South Korea’s economy and served as one of the driving
forces behind a shrink in foreign investment and trade. For these
reasons, the growing number of South Koreans wants unification as a
means by which to eliminate such negative consequences of division,
and unification has increasingly become a practical concern. Given
this pragmatic view has been more pronounced among younger
respondents, it is appears plausible that such pragmatism amongst the
South Korean public will strengthen more going forward.
However, aside from this pragmatic perspective, the South Korean
people have gradually become more negative on their view of the
perceived benefits of unification. That is, just because they have come
to approach unification in a more practical sense, does not mean that
they have come to believe that unification will bring them substantial
benefits. When questioned on whether unification would solve various
problems in South Korean society, the respondents were generally
more skeptical than optimistic. Very few people over the past 10 years
responded that unification would solve various urgent problems in
South Korean society, including wealth inequality, unemployment
and crime, regional and ideological conflicts, etc. These results may
reflect the doubt that South Korean people have in regards to the
actual benefits that unification would bring to South Korean society.
Even when asked if unification would benefit South Korean society,
only around 50% had replied “yes” a not dissimilar number to those
who responded “no”. When asked if unification would provide any
personal benefits, the response was even more skeptical, as over the
past 10 years only 20-30% responded that they would personally be
beneficiaries. In other words, growing pragmatism toward the issue
of unification amongst the South Korean people speaks to a passive
attitude regarding the costs of division in the current circumstance,
rather than to a positive view seeing unification as being beneficial.
Such skepticism is similarly shown in their attitudes towards North
Korea policy. Indeed, over the last ten years the South Korean people
have become more skeptical about the efficacy of North Korea policies
including: aid to North Korea, socio-cultural exchanges, economic
cooperation, and regular inter-Korean summits. The South Korean
people’s disappointment with policy appears to be reflected in the
survey results as respondents feel North Korea policies have filed to
bring changes into North Korea. Those policies have rather worsened
inter-Korea relations, and frequently stopped without bearing fruit,
only disappointing the South Korean people. Continued setbacks and
failures to provide any solution to inter-Korean conflict have led the
South Korean people to become more pessimistic about the prospect
Conclusion 2016 South Korean People’s Attitude and Perception of Unification 2016 Unification Perception Survey
304 305
of policy proving effective.
Another way in which attitudes have changed over the past decade
is the attitude of South Koreans toward North Korean defectors.
Since 2007, there has been growing doubt amongst South Koreans
regarding the unconditional acceptance of defectors and the provision
of government support. Arguably due to high unemployment rates and
slowing economy, there are an increasing number of people who blame
North Korean defectors for difficulties in finding employment and
think that they should be given no special favor in workspace. In fact, up
until the mid-2000s, when the North Korean defector population was
still relatively low, most people were very accommodating. However,
the perceived cost to South Korean society has increased due to a sharp
rise in the number of defectors over the past 10 years when, on the top
of that, inter-Korea relations deteriorated and the economy went bad.
Therefore, overcoming such negativity and cultivating magnanimity
towards North Korean defectors amongst the South Korean people
will be an important issue in South Korean society going forward.
Lastly, a certain tendency in the South Korean people’s perception
of the international relations that surround the Korean peninsula is
observable. There has been some variance every year, but overall, the
South Korean people are feeling increasingly closer to the United
States and gradually more wary of North Korea. Especially, the feeling
of closeness with North Korea dropped in 2012 following Kim Jong-
un coming to power. The reign of terror and provocations led by the
young North Korean leader contributed to deepening negatives toward
North Korea. It also appears that the conservative governments’ pro-
American diplomacy over the past 10 years has contributed to the
increase in pro-American sentiments. On the other hand, sentiments
towards China have been found volatile in the survey results showing
the perception of the South Korean people toward China are not
fixed. Yet, the South Korean people seem to increasingly feel amicable
to China, at least to some degree, as more respondents have come to
see China a “Partner” than as a “Competitor” or as a country to be
“wary of” in recent times. In conjunction with the results of another
survey question that the perceived responsibility of China in regards to
the deterioration of inter-Korea relations is gradually increasing, it can
be inferred that South Korea needs to change their strategy for foreign
affairs and security toward the direction that does not emphasize the
role of the United States alone, but also includes cooperation with
China.
While certain trends have been noticeable in the perception of
unification amongst South Korean people over the past 10 years, the
results did move in the same direction. Some deviations from the
trends of the previous years have been observed this year or during
the recent two or three years. First, less people view North Korea as a
hostile power and less fear of armed provocations. While, as mentioned

Conclusion 2016 South Korean People’s Attitude and Perception of Unification 2016 Unification Perception Survey
306 307
above, negative attitudes toward North Korea have increase in general,
such negativity has been mitigated in this year after culminating in
the period of 2012-2013 with the succession of the Kim Jong-un.
This became particularly apparent in the questions relating the South
Korean people’s thoughts on the possibility of North Korean armed
provocations, and how much responsibility North Korea bears for the
deterioration of inter-Korean relations.
These results seem surprising given the fact that North Korea carried
out the fourth nuclear test and missile launches in 2016. But they may
indicate a growing disinterest among South Koreans in repeated threats
from North Korea and a continued stalemate situation. Additionally,
a number of domestic and international issues have resulted from this
nuclear test that actually garnered more popular attention, than the
test itself. In other words, North Korea’s continued provocative actions
have ceased to merely be South Korea’s concern and have become a
problem for the entire international community, which seems to
have helped in the reduction of fear with respect to national security.
Moreover, as North Korean provocations have become bound-up with
the THAAD deployment on the Korean peninsula, splits in domestic
public opinion and the relationship with China have become more
salient issues. It can thus be argued that the fall in the perceived
North Korea threat reflects such special domestic and international
circumstances.
This year’s survey results indicate the lowest satisfaction levels with
the government’s North Korea policy under the Park Geun-Hye
administration. In the beginning, there were high expectations for Park
to improve relations with North Korea. This was reflected in previous
North Korea policy satisfaction responses. However, the approval has
consistently dropped over the last 3 years due to deteriorating inter-
Korean relations. What’s more, approval for the government’s policies
has dropped to be under 50% for the first time during the Park Geun-
Hye administration.
Moreover, the North Korean defectors’ social distance has increased
to a significant degree in this year’s survey compared to prior years. In
other words, responses indicated a higher degree of reluctance to see
a North Korean defector as a neighbor, colleague, business partner,
or as a potential spouse when compared to previous years. These
results can be considered unusual in light of the consistent decrease in
social distance for North Korean defectors as late as the previous year.
However, such changes in perception were not only observed in the
younger generation, but have been detected in the older generation
as well. This seems to in indicate generally worsening views of North
Korean defectors. This increasing negativity can be seen as a reflection
of the deteriorating inter-Korean relations. But on another note, as
South Korea’s socio-economic conditions worsen, people become
more intolerant of minorities. Such an atmosphere appears to have

Conclusion 2016 South Korean People’s Attitude and Perception of Unification 2016 Unification Perception Survey
308 309
impacted the attitudes of South Koreans towards North Korean
defectors.
Lastly, a notable change this year relates to deepening divisions
emerging between social groups regarding attitudes to unification. Of
course, over the last decade gender, the role of residence, age, class,
ideology and partisanship in differences in perception have been
continually observed and noted. Not limited to the perception of
unification, as a society becomes more diverse both politically and
economically, perceptions naturally diverge along social cleavages.
This year however, the divide was more extreme among more various
social groups; there was a clear difference of perception with regard to
desirability of unification, perception and confidence in North Korea,
evaluations of North Korea policy, perception of international politics,
and the way North Korean defectors are perceived. These differences
have become more evident in recent two or three years when compared
to the cross-sectional convergence of opinion on matters related to
unification due to security concerns in the early days of the Kim Jong-
un regime.
It should be noted that, among the variables, partisan tendencies
played a significant role in forming attitudes towards unification and
North Korea policy. In the analysis of each political party’s support
base when controlling for other social variables, partisan influence is
found significantly stronger than in previous years. Such an increasing
impact of partisanship stands in stark contrast to a decrease in the
influence of left-right ideological position over the citizens’ attitudes.
In 2016, thus, it can be argued that the South Korean people’s
perception of unification appears to be influenced more by the party
one supports than by one’s ideological stand. These results indicate
that the divisions over how unification is seen may not be a positive
phenomenon. That said, differing perceptions and attitudes may be
understood as arising out of social segmentation, i.e. the emergence
of different social groups, and thus may be considered a natural social
phenomenon. If bias and cleavages lead to polarization, however, this
will inhibit the formation of a popular consensus, and thus make it
difficult to formulate effective policy. It remains to be seen whether
this deepening public divide is merely temporary, or if this is part of
ongoing social polarization.
In conclusion, the South Korean people’s perception of unification
has changed in various ways over the past decade. Some changes
have shown a trend during the period while some were exceptional
departed from the trend. In the 2016 survey some of the trends that
were detected include: less desire for and less perceived effectiveness
of unification, growing pragmatism around the unification issue,
increasing pessimism regarding North Korea policy and lessening
support for helping North Korean defectors, and an increase in
perceived closeness with the United States. Additionally, a decrease in

Conclusion 2016 South Korean People’s Attitude and Perception of Unification 2016 Unification Perception Survey
310 311
perceived North Korean threat, drop in satisfaction of North Korea
policy, increase in the social distance with North Korean defectors,
and a growing divide perceptions along group lines, with a notable
increase in partisanship. We anticipate a lot of political change in 2017
on the domestic and international front, with the upcoming South
Korea’s 19th Presidential election and Donald Trump’s becoming US
president, not to mention the stress that Brexit will put Europe under.
We will have to keep watching how these challenges on the domestic
front and overseas will affect, change, or leave unaffected perceptions
of the unification issue and a myriad of other related issues in South
Korean society going forward.

Appendix

Appendix2016 Unification Perception Survey
314 315
1. Basic design of the survey 1) Sample Design
Content
1) Survey Population South Korean Men and women aged 19-74
2) Sample Size 1,200 (Valid Sample)
3) Sampling Method Multi-Stage Stratified Systematic Sampling
4) Sampling error 〈*〉 ± 2.8% (95% Confidence Interval) 〈*〉 Refer to 【Appendix. Additional Materials about Sampling Error】
Region GenderAge
Sub-total Total19-29 30 40 50 60-74
SeoulMale 19 21 22 20 17 99
199Female 18 21 21 21 19 100
BusanMale 7 8 9 9 8 41
82Female 6 7 9 10 9 41
DaeguMale 6 6 7 7 5 31
63Female 5 6 8 7 6 32
IncheonMale 7 7 8 8 5 35
70Female 6 7 8 8 6 35
GwangjuMale 4 5 5 5 3 22
44Female 4 4 5 5 4 22
DaejeonMale 5 5 5 5 4 24
47Female 4 5 5 5 4 23
UlsanMale 4 4 5 5 3 21
40Female 3 4 5 4 3 19
GyeonggiMale 22 25 29 25 17 118
232Female 20 24 28 24 18 114
GangwonMale 4 4 5 6 5 24
46Female 3 4 5 5 5 22
North Chungcheong
Male 4 5 5 5 5 24 46
Female 3 4 5 5 5 22 South
ChungcheongMale 5 6 7 6 6 30
58Female 4 6 6 6 6 28
North JeollaMale 4 5 6 6 5 26
51Female 4 4 5 6 6 25
South JeollaMale 4 4 6 6 6 26
51Female 4 4 5 6 6 25
North Gyeongsang
Male 5 6 7 8 7 33 65
Female 5 5 7 7 8 32 South
GyeongsangMale 7 8 9 9 7 40
76Female 5 7 9 8 7 36
JejuMale 2 3 4 3 3 15
302 3 4 3 3 15
Total 205 237 274 263 221 1,200 1,200
1) The stratification variable was set according to region (Sejong included in South Chungcheong), gender, age (five groups)
2) Proportional allocation was applied after the sample was grouped into 20 quotas in accordance with to the charac-teristics of respondents from each region
2) Fieldwork Design
Process
Supervisor Training
Selection of interviewers
Training of interviewers
Control of interviewers
Verification Survey
Due Diligence
Interviewers are trained before survey work begins, with super-visors being trained before interviewer training begins.
Appropriate interviewers are selected from amongst Gallop Ko-rea’s specialist interview personnel.
A two hour orientation session about survey methods and con-tent also includes two practice interviews to familiarize inter-viewers with survey methods and content, ensure problems are found before survey work begins and thus minimize non-sam-pling error, and foster standardization. Training also includes a discussion of range of potential contingencies that can arise during survey work.
The supervising researcher and supervisor check submitted survey questionnaires in front of interviewers, taking a real-time approach to training interviewers in quality control in or-der to minimize interviewer error.
30% of surveys are subject to randomized checks, inspectors from the institute call respondents to check whether any re-sponses have been falsified or are inaccurate, where falsifica-tions are found, all survey work done by the interviewer are invalidated and survey work redone.
Content
1) Survey Method Face-to-Face Interview by Specialist Interviewer
2) Collection Method Structured Questionnaire
3) Survey Period 1st July 2016-22nd July 2016
〈Sample Quota〉
3) Survey Method and Survey Period

Appendix2016 Unification Perception Survey
316 317
2. Data Processing
1) Data Processing
Raw Data went through Editing, Coding, Punching and was compiled
electronically using SPSS(Statistical Package for the Social Sciences).
Editing
Errors and omissions are checked in the record
Coding/Punching
Questionnaire results are inputted
Data Cleaning
Data is checked for input errors
Data Processing
∙ Intel Core i5 PC
∙ SPSS 21.0
2) Weight
Analysis was performed on survey results once weights were applied to
survey in order to ensure that the distribution by city/province (16 total),
gender, and age (five groups) reflects that of the actual survey population
(June 2016 standard, from Residency Registration statistics provided by
Ministry of Public Administration and Security).
•i : city/province (i = 1(Seoul), 2(Busan), …, 16(Jeju))
•j : gender (j = 1(male), 2(female))
• k : age group (k = 1(19~29), 2(30s), …, 5(60~74))
•Nijk : i city/province, j gender, k age group in the survey population
•nijk : i city/province, j gender, k age group within the sample
•n : number of respondents
•N : total survey population
•Wijk : i city/province, j gender, k age group weights
•Final stratified weight Wijk is calculated as follows
3. The categorization of respondent
〈Calculation of weighting〉
구분Survey Sample Weighted Sample
Cases (#) % Cases (#) %
Total 1200 100.0 1200 100.0
GenderMale 609 50.8 607 50.6
Women 591 49.3 593 49.4
Age Groups
19 ∼ 29 205 17.1 209 17.430s 237 19.8 237 19.740s 274 22.8 275 22.950s 263 21.9 261 21.8
Over 60 221 18.4 218 18.2
Education
Middle School or less 136 11.3 129 10.8High School 585 48.8 599 49.9
College or above 477 39.8 470 39.2Don’t know/no response 2 0.2 2 0.1
Occupation
Primary 25 2.1 20 1.7Self-employed 254 21.2 260 21.7
Blue Collar 339 28.3 341 28.4White Collar 230 19.2 230 19.2Homemaker 222 18.5 222 18.5
Student/Jobless 130 10.8 127 10.6
Household Income (KRW)
<2 million 147 12.3 134 11.22-2.9 million 209 17.4 203 17.0
3-3.99 million 356 29.7 362 30.1Over 4 million 487 40.6 500 41.7
Don’t know/no response 1 0.1 1 0.1
Region
Capital Region 501 41.8 602 50.2Central Region 151 12.6 123 10.2
Honam 146 12.2 117 9.8Yeongnam 326 27.2 309 25.7Gangwon 46 3.8 35 3.0
Jeju 30 2.5 14 1.2
Size of AreaLarge City 545 45.4 550 45.8
Small City/Town 512 42.7 521 43.4Village 143 11.9 130 10.8
IdeologyProgressive 523 43.6 522 43.5
Centrist 118 9.8 116 9.7Conservative 559 46.6 561 46.8
Religion
Buddhist 257 21.4 245 20.4Protestant 237 19.8 238 19.8
Catholic 70 5.8 72 6.0None 617 51.4 625 52.1
Don’t know/no response 19 1.6 21 1.8

318 319
2016 Unification Perception Survey Appendix
Questionnaire
Dear sir/madam,
This survey is run by the Institute for Peace and Unification Studies at Seoul National Univer-sity, and aims to understand the South Korean people’s perception of unification. This survey will be carried out in July, and about 1,200 people over the age of 19 will be surveyed. Partici-pating in this survey will last roughly 20 minutes and you will be compensated for your time.
The information that you provide through this survey will help us in our understanding of the South Korean people’s perception of unification and in the enactment of North Korea policy. You may stop this survey at any time, and you will not be penalized in the event of doing so. If at any point of participating in this survey you feel any physical or mental discomfort you may stop responding to this survey.
Jung Geun-shik from Seoul National University’s Sociology Department is in charge of per-sonal information for this research. The data from this research will be shared with KOSSDA. We will do our best to ensure that all personal information including your name and other sensitive information are not revealed when the results of this survey are released.
Please mark your agreement in the appropriate box below if you have read and understood the above terms and agree to participate in the survey.
You may withdraw from participating in this survey at any time and this decision will not pe-nalize you at any time.
This questionnaire will be destroyed after being processed. Thank you for taking the time out of your busy schedule to complete this survey.
Seoul National University Institute for Peace and Unification Studies Jung Geun-shik
▣ I agree (If you agree that your personal information(excluding distinguishing informa-tion) that is included within this research document can be shared with the KOSSDA, please check the box available.)
SNUIRB No. E1606/002-002
Gallup2016-166-014
208 SAJIK-DONG CHONGRO-KU SEOUL, KOREA, 110-054 TEL(02) 3702-2100 / FAX (02)3702-2121 / E-mail info @gallup.co.kr / internetwww.gallup.co.kr
GALLUP KOREA affiliated with GALLUP INTERNATIONAL
Research Institution:
Director of the institute: Jung Geun-sik ☎ : 02-880-4052
July 2016Address: Seoul, Jongno-gu, Sajik-dong 208Gallup Korea Research InstituteChairman, Park Mu-ikManager, Jang Eun-hye (☎ 02-3702-2119)Due Diligence Manager, Jeong Seul-Gi(☎ 02-3702-2689)
▣ Region 1. Seoul 2. Busan 3. Daegu 4. Incheon 5. Gwangju 6. Daejeon 7. Ulsan 8. Gyeonggi 9. Gangwon 10. Chungbuk 11. Chungnam 12. Jeonbuk 13. Jeonnam 14. Gyeongbuk 15. Gyeongnam 16. Jeju
▣ Size of region 1. Large city 2. Small city/townv 3. Village (Eul/Myeon)
▣ Gender 1. Male 2. Female
SQ1) May we ask your age as of this year? (If you are under the age of 19, or older than the age of 75, please stop here.)
2016 Unification Perception Survey

320 321
2016 Unification Perception Survey Appendix
We will now ask about your perception of unification
Q 1) How necessary (or not necessary) do you think unification is? Please choose one of the options below:
1. Very necessary 2. Somewhat necessary3. Neutral 4. Somewhat unnecessary 5. Completely unnecessary
Q 2) (See Note Card 1) Which of the following most closely match-es your thoughts on Korean unification?
1. It is better to unify as soon as possible, no matter the cost.
2. It is important to wait for the right condi-tions instead of rushing unification
3. Preserving the status quo is the best option 4. I am not interested in unification.
Q 3) When do you think unification will be-come possible?
1. Within 5 years 2. Within 10 years3. Within 20 years 4. Within 30 years5. After 30 years or more 6. Unification is not possible
Q 4) How much do you think the following factors help (or do not help) the achieve-ment of unification?
Very helpful
Quite helpful
Not very
helpful
Not helpful at all
(A) humanitarian aid in the form of rice, fertilizer, and medical supplies
1 2 3 4
(B) academic, artistic, athletic and religious cultural inter-Korea exchange
1 2 3 4
(C) Inter-Korean economic cooperation including tourism to Kumgang Mountain and the Kaesong Complex
1 2 3 4
(D)Regular inter-Korea talks 1 2 3 4
(E)North Korea sanc-tions and pressure 1 2 3 4
Q 5) How urgent (or not urgent) do you consider the following factors regarding the achievement of unification? Please choose one of the options below:
Very urgent
Quiteurgent
Not very urgent
Not urgent
(A) Inter-Korea summits 1 2 3 4
(b) Opening of North Korea and reform
1 2 3 4
(C) Relaxing of military tensions 1 2 3 4
(D) Withdrawal of US Troops 1 2 3 4
(E) Solving the Separated families, POWs problem
1 2 3 4
(F) Improvement of North Korea’s human rights
1 2 3 4
Q 6) (See Note Card 2) Which of the following do you think is the most important reasons for why Korean unification should occur?
1. Because we are the same nation.2. Because separated families need to be re-
united.3. To eliminate the threat of war between
North and South Korea4. So North Korean people can live better lives5. So South Korea can become a more ad-
vanced country6. Other (____________________________)
The following questions are regarding expected post-unification changes
Q 7) How beneficial (or non-beneficial) do you think unification will be for South Korea?
1. Very beneficial2. Somewhat beneficial3. Not very beneficial4. Not beneficial at all
Q 8) How beneficial (or non-beneficial) do you think unification will be for yourself?
1. Very beneficial2. Somewhat beneficial3. Not very beneficial4. Not beneficial at all
Q 9) If unification were to occur, how much of an improvement (or deterioration) do you think will occur on the following soci-etal problems compared to before unifica-tion? Please choose one of the options below:
Large improve-
ment
Slight improve-
ment
No difference
Slightly worsened
Massively worsened
(A) Gap between the rich and poor
1 2 3 4 5
(B) Real Estate Speculation
1 2 3 4 5
(C) Unem-ployment 1 2 3 4 5
(D) Crime 1 2 3 4 5
(E) Regional Conflict 1 2 3 4 5
(F) Ideologi-cal Conflict 1 2 3 4 5
Q 10) (See Note Card 3) Which of the following characterizes the relationship between unification and South Korea’s democracy best to you?
1. South Korea will achieve complete democ-racy only after unification.
2. If possible, South Korea must become a complete democracy before unification
3. Unification and democracy have no correlation
Q 11) (See Note Card 4) Which of the following characterizes the relationship between unification and North Korea best to you?
1. South Korea will achieve complete democ-racy only after unification.
2. If possible, South Korea must become a complete democracy before unification
3. Unification and democracy have no correlation
Q 12) (See Note Card 5) What political system do you think a unified Korea should have?
1. Democracy2. Socialism3. Combination of democracy and socialism4. Does not matter as long as unification occurs

322 323
2016 Unification Perception Survey Appendix
The following questions are regarding your thoughts on North Korea
Q 13) (See Note Card 6) Which of the following best describes your perception of North Korea?
1. North Korea needs our help2. North Korea should cooperate and join
forces with us3. North Korea is a friendly competitor4. We should be wary of North Korea5. North Korea is an enemy that threatens our
security
Q 14) Do you think it is possible to hold summits and negotiate with the North Korean regime on the subject of unifica-tion? Please choose one of the options below:
1. Very possible 2. Somewhat possible3. Not very possible 4. Not possible at all
Q 15) How much do you think the North Ko-rean regime desires (or not desires) unifica-tion? Please choose one of the options below:
1. Strongly desires 2. Somewhat desires3. Does not desire a lot 4. Does not desire at all
Q 16) How strongly do you agree (or dis-agree) with the following statement: “The current North Korean regime will stabilize in the future.” Please choose one of the options below:
1. Strongly agree 2. Somewhat agree3. Neither 4. Somewhat disagree5. Strongly disagree
Q 17) How would you estimate the degree of change happening in North Korea in the past few years? Please choose one of the options below:
1. Great deal of change 2. Some change3. Not much change 4. Very little change
Q 18) How likely (or unlikely) do you con-sider an armed provocation by North Korea in the future to be? Please choose one of the options below:
1. Very likely 2. Somewhat likely3. Not very likely 4. Not likely at all
Q 19) How much do you know about the following topics regarding North Korea?
A great deal
A little bit
I have heard of it
I do not know
(A) North Korea’s “Military First” Policy
1 2 3 4
(B) Juche Idea 1 2 3 4
(C) Chollima Movement 1 2 3 4
(D) Arduous March 1 2 3 4
(E) Market Places in North Korea 1 2 3 4
(F) Moranbong band 1 2 3 4
Q 20) Have you had any of the following experiences regarding North Korea?
Yes No
(A) Visiting / Touring North Korea 1 2
(B) Meeting with a North Korean refugee 1 2
(C) Watching a North Korean broadcast, film or reading a North Korean novel
1 2
(D) Involvement with a North Korean organization 1 2
Q 21) In your opinion, how large is the dif-ference between North and South Korea in the following cases?
A great deal
Some what
No large
differ-ence
No differ-ence at all
(A) Election procedure 1 2 3 4
(B) Social Welfare 1 2 3 4
(C) Use of language 1 2 3 4
(D) Customs 1 2 3 4
(E) Importance of family 1 2 3 4
Q 22) How threatened (or not threatened) do you feel about North Korea’s possession of nuclear weapons?
1. Very threatened2. Somewhat threatened3. Not particularly threatened4. Not threatened at all
Q 23) How strongly do you agree (or dis-agree) with the following statement?: “North Korea will not give up their nuclear weapons.”
1. Strongly agree 2. Somewhat agree3. Somewhat disagree 4. Strongly disagree5. I don’t know
The following questions will be regarding aid towards North Korea and North Korea
policy
Q 24) (See Note Card 7) Which of the following aspects do you think should be made as a top priority amongst desirable policies towards North Korea?
1. Inter-Korea cooperative exchange and aid to North Korea
2. North Korea’s reform and opening and ex-pansion of human rights
3. Active unification policy and preparation of resources for unification
4. International cooperation to denuclearize North Korea
5. Conclusion of a peace accord
Q 25) How much do you think that aid to North Korea helps the everyday lives of North Koreans?
1. Very helpful 2. Somewhat helpful3. Not very helpful 4. Not helpful at all
Q 26) How helpful do you consider inter-Korea economic collaboration to opening up North Korea and reform?
1. Very helpful 2. Somewhat helpful3. Not very helpful 4. Not helpful at all
Q 27) How satisfied do you feel about the current government’s North Korea policy?
1. Very satisfactory2. Somewhat satisfactory3. Somewhat unsatisfactory4. Very unsatisfactory

324 325
2016 Unification Perception Survey Appendix
Q 28) How strongly do you agree with the following statement?: “Contracts and agreements between the North and South governments should be maintained re-gardless of a change in administrations.”
1. Strongly agree 2. Somewhat agree3. Somewhat disagree 4. Strongly disagree5. I don’t know
Q 29) How strongly do you agree (or dis-agree) with the following opinions?
Strongly agree
Some what agree
Neutral
Some what dis-
agree
Strongly dis-
agree
(A) The Kaesong Complex needs to be reopened
1 2 3 4 5
(B) Kumgang Mountain tour-ism needs to be resumed
1 2 3 4 5
(C) We should not coopera-tion with North Korea before the North Korean nuclear problem is solved.
1 2 3 4 5
(D) The govern-ment should prohibit the distribution of leaflets in North Korea.
1 2 3 4 5
(E) The govern-ment should continuously raise the human rights issue in North Korea
1 2 3 4 5
(F) South Korea should also have its own nuclear weapons
1 2 3 4 5
Q 30) How responsible do you consider each of the following countries in the recent deterioration of inter-Korea relations?
Very respon-
sible
Some what
respon-sible
MiddleNot very respon-
sible
Not respon-
sible at all
(A) North Korea 1 2 3 4 5
(B) South Korea 1 2 3 4 5
(C) The United States 1 2 3 4 5
(D) China 1 2 3 4 5
(E) Japan 1 2 3 4 5
The following questions are to find out your opinion on North Korean defectors
Q 31) How close or distant do you feel to migrants living in South Korea?
Very close
Some what close
Neu-tral
Some what dis-tant
Very dis-tant
(A) North Korean defector 1 2 3 4 5
(B) Chinese Korean 1 2 3 4 5
(C) South East Asian 1 2 3 4 5
(D) United States· / European 1 2 3 4 5
(E) Arab 1 2 3 4 5
(F) African 1 2 3 4 5
Q 32) How do you feel about being in the following relationships with a North Korean defector?
Very averse
Some what
averseNeutral
Not very
averse
Not averse at all
(A) Neighbors 1 2 3 4 5
(B) Work colleague 1 2 3 4 5
(C) Business partner 1 2 3 4 5
(D) Spouse 1 2 3 4 5
Q 33) (See Note Card 8) What do you think should be done with North Korean defectors who wish to enter South Korea?
1. We must accept all who wish to enter2. We must selectively accept those who wish
to enter3. We should not accept any more
Q 34) How strongly do you agree (or dis-agree) to the following opinions about North Korean defectors?
Strongly agree
Some what agree
Some what dis-
agree
Strongly dis-
agree
(A) North Korean defectors help re-solve heterogeneity between South and North Korea
1 2 3 4
(B) The government should give more aid to North Korean defectors
1 2 3 4
(C) Gaining employ-ment has become more difficult due to North Korean defectors
1 2 3 4
(D) North Korean defectors should be subject to the same competition as everyone else in a workplace
1 2 3 4
The following questions are regarding your opinion of Neighboring Countries
Q 35) (See Note Card 9) Which of the following countries do you feel the closest to? (Select only one)
1. USA 2. Japan3. North Korea 4. China5. Russia
Q 36) (See Note Card 9) Which of the following countries do you consider the greatest threat to peace on the Korean peninsula?
1. USA 2. Japan3. North Korea 4. China5. Russia
Q 37) If the United States and North Korea were to face each other in the World Cup, which team would you cheer for?
1. North Korea 2. United States3. Both teams 4. Neither team5. Other ( )
Q 38) Which of the following best describes your perception of the following countries?
Partner Com-petitor
Country to be
cautious of
Hostile power
(A) United States 1 2 3 4
(B) China 1 2 3 4
(C) Japan 1 2 3 4
(D) Russia 1 2 3 4

326 327
2016 Unification Perception Survey Appendix
Q 39) (See Note Card 10) If war broke out on the Korean peninsula, how do you expect the following four neighboring countries to react?
Will support South Korea
Will support North Korea
Will look after
their own interests
Will remain neutral
(A) United States 1 2 3 4
(B) China 1 2 3 4
(C) Japan 1 2 3 4
(D) Russia 1 2 3 4
Q 40) How strongly do you think the fol-lowing countries desire unification on the Korean peninsula?
Strongly desire
Some-what
desire
Doesn’t strongly desire
Does not desire at
all
(A) United States 1 2 3 4
(B) China 1 2 3 4
(C) Japan 1 2 3 4
(D) Russia 1 2 3 4
Q 41) How necessary (or not necessary) do you consider neighboring countries’ coop-eration in order to achieve unification?
Very neces-
sary
Some-what
neces-sary
Not very neces-
sary
Not nec-essary at all
(A) United States 1 2 3 4
(B) China 1 2 3 4
(C) Japan 1 2 3 4
(D) Russia 1 2 3 4
Q 42) In order to achieve unification on the Korean peninsula, is ‘inter-Korea’, ‘ROK-US’, or ‘Sino-ROK’ cooperation most im-portant?
1. Inter-Korea cooperation2. ROK-US cooperation3. Sino-ROK cooperation4. All are equally important
The following questions are regarding to changes in South Korean society
after liberation
Q 43) How positively or negatively do you consider the influence of the following events on Korean society?
Very posi-tive
Gener-ally
posi-tive
Gener-ally
nega-tive
Very nega-
tive
Don’t know
(A) April 19th Revolution 1 2 3 4 5
(B) May 16th Coup 1 2 3 4 5
(C) October Yushin 1 2 3 4 5
(D) Gwangju Democratization Movement
1 2 3 4 5
(E) June uprising (1987) 1 2 3 4 5
(F) Inter-Korea Summits 1 2 3 4 5
Q 44) How serious (or not serious) do you consider the following problems to be in our present-day society?
Very serious
Some-what
serious
Some-what not
serious
Not serious
at all
(A) deterioration of the environment 1 2 3 4
(B) restriction of freedom of expression 1 2 3 4
(C) income inequality 1 2 3 4
(D) unemployment rate 1 2 3 4
(E) Regional conflicts 1 2 3 4
(F) low birthrate and aging society 1 2 3 4
(G) ideological conflicts 1 2 3 4
H) corruption 1 2 3 4
The following questions are regarding the current political system, economy,
and society
Q 45) How satisfied (or unsatisfied) are you with the current economic condition in South Korea?
1. Very satisfactory2. Somewhat satisfied3. Somewhat unsatisfied4. Very unsatisfied
Q 46) How proud are you to be South Ko-rean?
1. Very proud2. Somewhat proud3. Not very proud 4. Not proud at all
Q 47) (See Note Card 11) On a scale of 1-10, how democratic do you believe the South Korean society to be? (1 = Not Democratic at all, 10 = Very Demo-cratic)
Not Democratic Middle
Very Democratic
1 2 3 4 5 6 7 8 9 10
Q 48) How likely (or unlikely) do you con-sider the possibility of a future war on the Korean peninsula?
1. Very likely 2. Somewhat likely3. Not very likely 4. Not possible
Q 49) How interested are you in politics?
1. Very interested 2. Somewhat interested3. Not very interested 4. Not interested at all
Q 50) How progressive, or conservative, do you consider yourself to be politically?
1. Very progressive2. Somewhat progressive3. Moderate4. Somewhat conservative5. Very conservative
Q 51) Which of the following political par-ties do you support?
1. New Frontier Party2. Democratic Party3. People’s Party4. Justice Party5. I do not support a particular Party
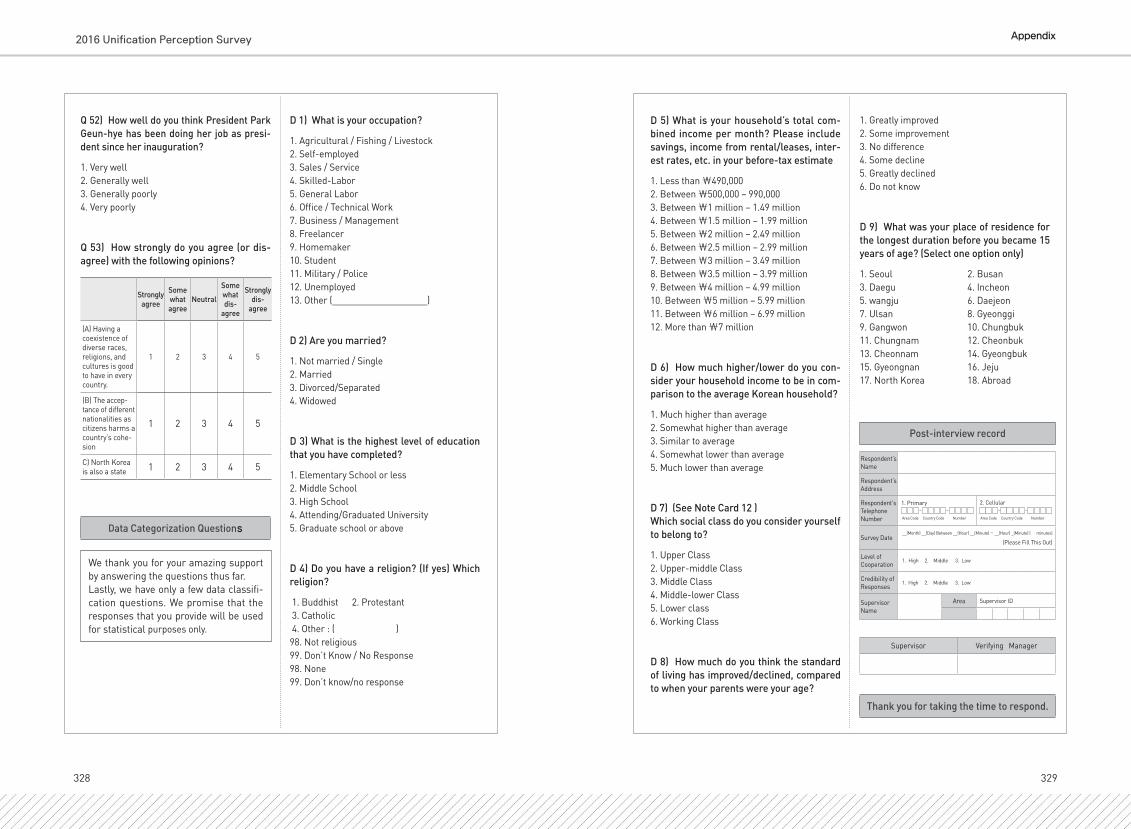
328 329
2016 Unification Perception Survey Appendix
Q 52) How well do you think President Park Geun-hye has been doing her job as presi-dent since her inauguration?
1. Very well2. Generally well3. Generally poorly 4. Very poorly
Q 53) How strongly do you agree (or dis-agree) with the following opinions?
Strongly agree
Some what agree
Neutral
Some what dis-
agree
Strongly dis-
agree
(A) Having a coexistence of diverse races, religions, and cultures is good to have in every country.
1 2 3 4 5
(B) The accep-tance of different nationalities as citizens harms a country’s cohe-sion
1 2 3 4 5
C) North Korea is also a state 1 2 3 4 5
Data Categorization Questions
We thank you for your amazing support by answering the questions thus far. Lastly, we have only a few data classifi-cation questions. We promise that the responses that you provide will be used for statistical purposes only.
D 1) What is your occupation?
1. Agricultural / Fishing / Livestock2. Self-employed3. Sales / Service4. Skilled-Labor5. General Labor6. Office / Technical Work7. Business / Management8. Freelancer9. Homemaker10. Student11. Military / Police12. Unemployed13. Other (___________________)
D 2) Are you married?
1. Not married / Single 2. Married3. Divorced/Separated 4. Widowed
D 3) What is the highest level of education that you have completed?
1. Elementary School or less2. Middle School3. High School4. Attending/Graduated University5. Graduate school or above
D 4) Do you have a religion? (If yes) Which religion?
1. Buddhist 2. Protestant 3. Catholic 4. Other : ( )98. Not religious99. Don’t Know / No Response98. None99. Don’t know/no response
D 5) What is your household’s total com-bined income per month? Please include savings, income from rental/leases, inter-est rates, etc. in your before-tax estimate
1. Less than ₩490,0002. Between ₩500,000 – 990,0003. Between ₩1 million – 1.49 million 4. Between ₩1.5 million – 1.99 million5. Between ₩2 million – 2.49 million 6. Between ₩2.5 million – 2.99 million 7. Between ₩3 million – 3.49 million8. Between ₩3.5 million – 3.99 million9. Between ₩4 million – 4.99 million 10. Between ₩5 million – 5.99 million11. Between ₩6 million – 6.99 million12. More than ₩7 million
D 6) How much higher/lower do you con-sider your household income to be in com-parison to the average Korean household?
1. Much higher than average 2. Somewhat higher than average3. Similar to average 4. Somewhat lower than average5. Much lower than average
D 7) (See Note Card 12 ) Which social class do you consider yourself to belong to?
1. Upper Class2. Upper-middle Class3. Middle Class4. Middle-lower Class5. Lower class6. Working Class
D 8) How much do you think the standard of living has improved/declined, compared to when your parents were your age?
1. Greatly improved2. Some improvement3. No difference4. Some decline5. Greatly declined6. Do not know
D 9) What was your place of residence for the longest duration before you became 15 years of age? (Select one option only)
1. Seoul 2. Busan3. Daegu 4. Incheon5. wangju 6. Daejeon7. Ulsan 8. Gyeonggi9. Gangwon 10. Chungbuk11. Chungnam 12. Cheonbuk13. Cheonnam 14. Gyeongbuk15. Gyeongnan 16. Jeju17. North Korea 18. Abroad
Post-interview record
Respondent’s Name
Respondent’s Address
Respondent's Telephone Number
1. Primary
Area Code Country Code Number
2. Cellular
Area Code Country Code Number
Survey Date __(Month) __(Day) Between __(Hour) __(Minute) ~ __(Hour) _(Minute) ( minutes)
(Please Fill This Out)
Level of Cooperation
1. High 2. Middle 3. Low
Credibility of Responses
1. High 2. Middle 3. Low
Supervisor Name
Area Supervisor ID
Supervisor Verifying Manager
Thank you for taking the time to respond.
330 PB
2016 Unification Perception Survey