20160725 asheville city poll 2016 results report final
TRANSCRIPT

REPORT COVER SHEET Prepared July 14, 2016
REPORT: Potential Bond Referendum Benchmark Study REPORT PREPARED BY: Campaign Research & Strategy, Inc. PURPOSE OF REPORT: The primary purpose of the research study was to better understand what residents identify as priorities facing the city and its government. The questionnaire was designed to look into how the voting-age population feels about potential bond referenda projects, their support for such projects and areas in which they would like to see the city make investments. The attached pages represent the results of the survey. The necessary interpretation of the survey results will be made by the researchers, Campaign & Strategy, Inc. at the July 26, 2016 City Council Meeting. INTENT: Research results will be available to inform City Council’s final decision on the scope (maximum dollar amounts) and purpose (final categories) of a bond package to potentially be introduced on the November 2016 ballot. COST OF STUDY: $8,000 FUNDING SOURCE: General Fund Fiscal Year 2015-2016

CAMPAIGN RESEARCH + STRATEGY
1528 BLANDING STREET COLUMBIA, SC 29201
803.929.0922 www.Campaigns411.com
BENCHMARK POLL – DATA FINDINGS REPORT
CITY OF
ASHEVILLE, NC
JULY 2016

CONTENTS
CAMPAIGN RESEARCH + STRATEGY www.Campaigns411.com
BACKGROUND & METHODOLOGY 3
RESULTS 6 ANALYSIS 29 Residents’ Perceptions 7 Analysis: Transportation Network Bond 30 Support of Potential Bond Issues 15 Analysis: Parks & Recreation Centers Bond 31 Tax Increase Impact on Bond Support 18 Analysis: Affordable Housing Bond 32 Statement Testing – Agree/Disagree 21 Post-Test Support of All Bond Items 25 Demographic Questions 26
QUESTIONS 33

CAMPAIGN RESEARCH + STRATEGY www.Campaigns411.com
BACKGROUND & METHODOLOGY

BACKGROUND & METHODOLOGY
CAMPAIGN RESEARCH + STRATEGY www.Campaigns411.com
In June 2016, the City of Asheville, N.C. commissioned Campaign Research + Strategy, a full-service consulting firm based in Columbia, SC to conduct quantitative research in the county on a number of items, concerns and issues. The goal of this research is to determine perceptions and attitudes of residents who live in the City of Asheville on a number of issues which include: (1) their perceptions of the challenges facing Asheville, (2) their support of or opposition to potential ballot items that would affect tax rates, and (3) their agreement levels to several statements people could make in relation to the bond measures that may be on the ballot later this year. CRS and the City of Asheville worked together to define the survey instrument and the final version of the questionnaire was approved by County staff before it was put “into the field.”

403 telephone surveys were conducted with registered voters of the City of Asheville by CRS’ in-house interviewers between the evenings of June 29th and July 1st, 2016. Interviews were conducted with respondents over land line and on mobile phones. The representative sample of the City of Asheville, NC was randomly selected with respect to voter registration records of the county and are reflective of the turnout from the November 2012 election. All survey respondents were 18 years of age and older. The margin of error for this study is 4.9% at a confidence interval of 95%. This means if the study were repeated 100 times, then the results would be within that 4.9% margin of error 95 times out of 100. The margin of error within specific demographic subsections would be higher. There may be instances when figures do not always equal 100.0 percent, due to rounding of decimals.
BACKGROUND & METHODOLOGY
CAMPAIGN RESEARCH + STRATEGY www.Campaigns411.com

CAMPAIGN RESEARCH + STRATEGY www.Campaigns411.com
RESULTS

RESIDENTS’ PERCEPTIONS
CAMPAIGN RESEARCH + STRATEGY www.Campaigns411.com
What would you say is the number one challenge here in the City of Asheville?
Response Percentage
Affordable Housing 25%
Roads / Traffic 8%
Growth / Planning 8%
Taxes / Spending 7%
Jobs 5%
Schools / Education 3%
Miscellaneous Responses 25%
No Answer / Not Sure / Don’t Know 19%

RESIDENTS’ PERCEPTIONS
CAMPAIGN RESEARCH + STRATEGY www.Campaigns411.com
What would you say is the number one challenge here in the City of Asheville?
TOP MISCELLANEOUS RESPONSES
Response Quantity
Water System 10 responses
Drugs 10 responses
Small Business, Local Preference 9 responses
Wages 8 responses
Structure of Council 8 responses
Sidewalks 5 responses
Racism 4 responses
Serving People, Accountability 4 responses

RESIDENTS’ PERCEPTIONS
CAMPAIGN RESEARCH + STRATEGY www.Campaigns411.com
How would you rate the performance of the Asheville City Council this past year?
Response Percentage
Excellent 5%
Above Average 25%
TOTAL BETTER THAN JUST AVERAGE 30%
Just Average 40%
Below Average 8%
Poor 10%
TOTAL WORSE THAN JUST AVERAGE 18%
Not Sure 10%

Would you say the property taxes (not federal, state or sales) you pay are too high, too low or just right considering the services you receive from city government?
Response Percentage
Too High 52%
Too Low 2%
Just Right 36%
Not Sure 9%
CAMPAIGN RESEARCH + STRATEGY www.Campaigns411.com
RESIDENTS’ PERCEPTIONS

RESIDENTS’ PERCEPTIONS
CAMPAIGN RESEARCH + STRATEGY www.Campaigns411.com
How would you rate the conditions of our roads and sidewalks in the City of Asheville?
Response Percentage
Excellent 1%
Above Average 12%
TOTAL BETTER THAN JUST AVERAGE 13%
Just Average 32%
Below Average 26%
Poor 25%
TOTAL WORSE THAN JUST AVERAGE 51%
Not Sure 4%
RESIDENTS’ PERCEPTIONS
CAMPAIGN RESEARCH + STRATEGY www.Campaigns411.com
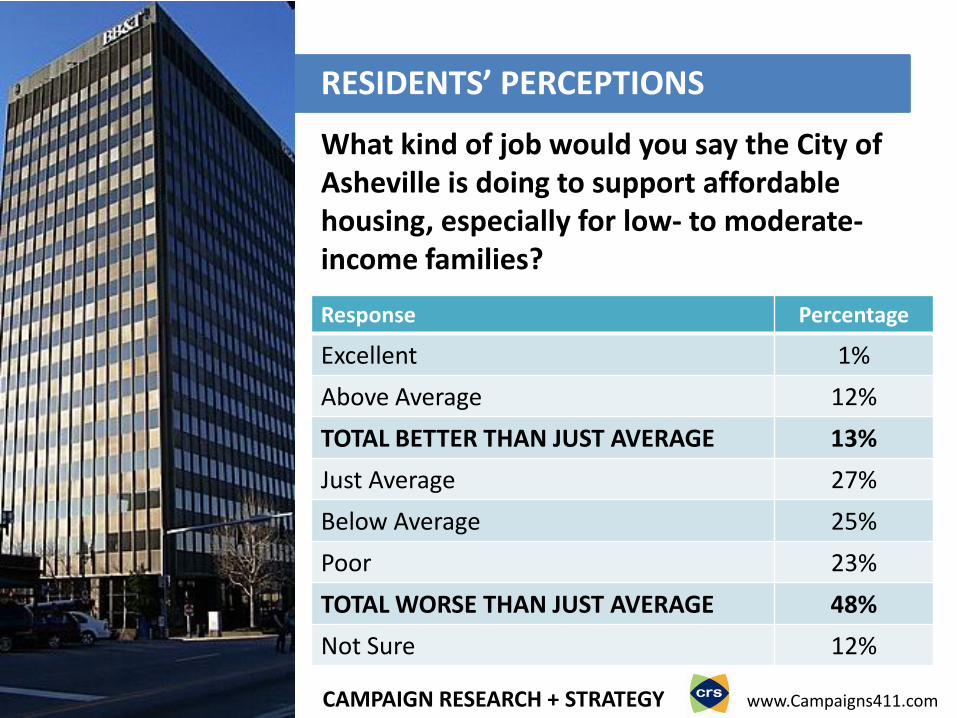
What kind of job would you say the City of Asheville is doing to support affordable housing, especially for low- to moderate-income families?
Response Percentage
Excellent 1%
Above Average 12%
TOTAL BETTER THAN JUST AVERAGE 13%
Just Average 27%
Below Average 25%
Poor 23%
TOTAL WORSE THAN JUST AVERAGE 48%
Not Sure 12%

RESIDENTS’ PERCEPTIONS
CAMPAIGN RESEARCH + STRATEGY www.Campaigns411.com
If you could add one other item for City Council to consider upgrading as part of a bond package, what would it be?
Response Percentage
Parking Downtown 11%
Train / Mass Transit / Transportation 9%
Homeless / Public Housing 8%
Jobs / Economic Development 6%
Schools / Education 5%
Arts Center / More Public Art 4%
Miscellaneous Responses 14%
No Answer / Not Sure / Don’t Know 43%

RESIDENTS’ PERCEPTIONS
CAMPAIGN RESEARCH + STRATEGY www.Campaigns411.com
If you could add one other item for City Council to consider upgrading as part of a bond package, what would it be?
TOP MISCELLANEOUS RESPONSES
Response Quantity
Police & FireFighters 7 responses
More Green Spaces, Parks 6 responses
Raise Wages 6 responses
City Hall, Council Chambers 5 responses
Bike Lanes 5 responses
Neighborhoods 4 responses
Promote / Aid Local Businesses 4 responses

Response Percentage
Strongly YES 50%
Somewhat YES 17%
TOTAL YES 67%
Somewhat NO 6%
Strongly NO 15%
TOTAL NO 21%
Not Sure/Don’t Know 12%
SUPPORT OF POTENTIAL BOND ISSUES
CAMPAIGN RESEARCH + STRATEGY www.Campaigns411.com
There could be a bond measure for $32 million which would make improvements to our transportation networks. Nearly half of this amount would be dedicated to resurfacing many roads and bikeways. The other $16 million would be used to improve and build new sidewalks, build the Swannanoa River Greenway, build bus shelters and projects aimed to improve pedestrian safety and calm traffic. If the election were held today, would you vote YES or NO on the bond measure?

Response Percentage
Strongly YES 41%
Somewhat YES 19%
TOTAL YES 60%
Somewhat NO 6%
Strongly NO 21%
TOTAL NO 27%
Not Sure/Don’t Know 13%
SUPPORT OF POTENTIAL BOND ISSUES
CAMPAIGN RESEARCH + STRATEGY www.Campaigns411.com
Another bond measure could provide $17 million that would be used to improve parks and recreation centers. Among projects are building a gymnasium and program space at the Wesley Grant Center, and upgrades to Memorial Stadium, Jake Rusher Park in south Asheville, the Montford Complex and Richmond Hill Park, as well as citywide outdoor courts and playgrounds in the city, lighting at ball fields and the purchase of additional land for recreation. If the election were held today, would you vote YES or NO on the bond measure?

Response Percentage
Strongly YES 56%
Somewhat YES 11%
TOTAL YES 67%
Somewhat NO 8%
Strongly NO 15%
TOTAL NO 23%
Not Sure/Don’t Know 9%
SUPPORT OF POTENTIAL BOND ISSUES
CAMPAIGN RESEARCH + STRATEGY www.Campaigns411.com
A third and final bond referendum could provide $25 million to address the city’s need for affordable housing. Individual projects would dedicate funds for home ownership loan programs, a trust fund to enhance rental housing, a community land trust aimed at providing permanent affordable housing options, and using City-owned land for affordable housing. If the election were held today, would you vote YES or NO on the bond measure?

Response Percentage
Much MORE LIKELY 27%
Somewhat MORE LIKELY 21%
TOTAL MORE LIKELY 48%
Somewhat LESS LIKELY 9%
Much LESS LIKELY 28%
TOTAL LESS LIKELY 37%
No Difference 5%
Not Sure 9%
CAMPAIGN RESEARCH + STRATEGY www.Campaigns411.com
Currently bond packages have not been finalized and the total for all three measures comes to $74 million. Revaluation could increase the estimate slightly, but if approved the bonds could increase property taxes by about $110 a year, or a little less than $9 a month, if you own a home valued at $275,000. After hearing this information, are you more or less likely to support the bond referenda?
TAX INCREASE IMPACT ON BOND SUPPORT

Response Percentage
Much MORE LIKELY 29%
Somewhat MORE LIKELY 19%
TOTAL MORE LIKELY 48%
Somewhat LESS LIKELY 10%
Much LESS LIKELY 25%
TOTAL LESS LIKELY 35%
No Difference 5%
Not Sure 11%
CAMPAIGN RESEARCH + STRATEGY www.Campaigns411.com
As mentioned before, bond packages have not been finalized and revaluation could increase the following estimates slightly. If the total for all three bond measures were reduced to $50 million, it could raise property taxes by about $83 a year, or a little less than $7 a month, if you own a home valued at $275,000. After hearing this information, are you more or less likely to support the bond referenda?
TAX INCREASE IMPACT ON BOND SUPPORT

Response Percentage
Much MORE LIKELY 31%
Somewhat MORE LIKELY 20%
TOTAL MORE LIKELY 51%
Somewhat LESS LIKELY 17%
Much LESS LIKELY 19%
TOTAL LESS LIKELY 36%
No Difference 5%
Not Sure 9%
CAMPAIGN RESEARCH + STRATEGY www.Campaigns411.com
If the total for the bond packages were reduced to $30 million, it could raise property taxes in the City by $55 a year, or a little more than $4.50 a month, if you own a home valued at $275,000. Again, this estimate could increase a bit based on the results of revaluation. After hearing this information, are you more or less likely to support the bond referenda?
TAX INCREASE IMPACT ON BOND SUPPORT

Response Percentage
Strongly AGREE 41%
Somewhat AGREE 22%
TOTAL AGREE 63%
Somewhat DISAGREE 7%
Strongly DISAGREE 15%
TOTAL DISAGREE 22%
Not Sure/Don’t Know 14%
CAMPAIGN RESEARCH + STRATEGY www.Campaigns411.com
The bond measures would help make the City of Asheville an even more attractive place where people from all backgrounds want to live and visit.
STATEMENT TESTING – AGREE/DISAGREE

Response Percentage
Strongly AGREE 34%
Somewhat AGREE 26%
TOTAL AGREE 60%
Somewhat DISAGREE 9%
Strongly DISAGREE 15%
TOTAL DISAGREE 24%
Not Sure/Don’t Know 15%
CAMPAIGN RESEARCH + STRATEGY www.Campaigns411.com
STATEMENT TESTING – AGREE/DISAGREE
Bond projects will actually strengthen our local economy. In addition to providing opportunities to local vendors, they will also attract global businesses, provide much-needed improvements and help create new jobs.

Response Percentage
Strongly AGREE 23%
Somewhat AGREE 15%
TOTAL AGREE 38%
Somewhat DISAGREE 17%
Strongly DISAGREE 28%
TOTAL DISAGREE 45%
Not Sure/Don’t Know 17%
CAMPAIGN RESEARCH + STRATEGY www.Campaigns411.com
STATEMENT TESTING – AGREE/DISAGREE
I will vote against the bond projects on the ballot this year, because I don’t trust the money will go where it’s been promised or supposed to go.

Response Percentage
Strongly AGREE 44%
Somewhat AGREE 17%
TOTAL AGREE 61%
Somewhat DISAGREE 9%
Strongly DISAGREE 12%
TOTAL DISAGREE 21%
Not Sure/Don’t Know 19%
CAMPAIGN RESEARCH + STRATEGY www.Campaigns411.com
STATEMENT TESTING – AGREE/DISAGREE
I will vote for the bond projects because I support the long-term vision these projects represent, because it’s not just about resurfacing our roads, providing more affordable housing and making upgrades to our parks and recreation facilities – it’s about building a better community.

Response Percentage
Strongly YES 30%
Somewhat YES 23%
TOTAL YES 53%
Somewhat NO 7%
Strongly NO 19%
TOTAL NO 26%
Not Sure/Don’t Know 20%
CAMPAIGN RESEARCH + STRATEGY www.Campaigns411.com
After thinking more about the three bond measures on the ballot this year, would you vote YES or NO on all three bond referenda?
POST-TEST SUPPORT OF ALL BOND ITEMS

DEMOGRAPHIC QUESTIONS
CAMPAIGN RESEARCH + STRATEGY www.Campaigns411.com
How long have you lived in the City of Asheville?
Response Percent Response Percent
More than 20 years 34% Less than 5 years 15%
10 to 20 years 30% Refused 6%
5 to 10 years 15%
Response Percent Response Percent
Less than $50,000 28% $100,000 to $150,000 8%
$50,000 to $75,000 19% $150,000 or more 6%
$75,000 to $100,000 18% Refused 20%
What was your total household income this past year?

CAMPAIGN RESEARCH + STRATEGY www.Campaigns411.com
Response Percent
White 81%
African American 13%
Other 6%
Race Gender
Response Percent
Male 43%
Female 57%
DEMOGRAPHIC QUESTIONS
Response Percent Response Percent
Under 35 21% 51 to 64 years old 24%
35 to 50 years old 28% Age 65 & over 27%
Age
Response Percent Response Percent
Democrat 52% Unaffiliated 32%
Republican 16% Libertarian <1%
Party Registration
CAMPAIGN RESEARCH + STRATEGY www.Campaigns411.com
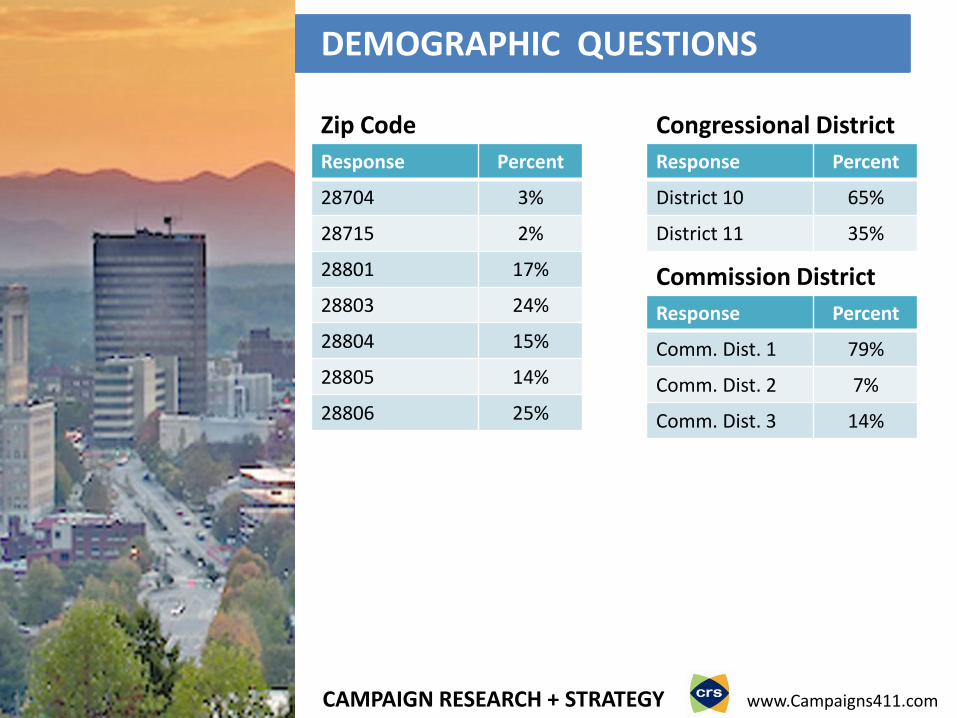
Response Percent
District 10 65%
District 11 35%
Congressional District
DEMOGRAPHIC QUESTIONS
Response Percent
28704 3%
28715 2%
28801 17%
28803 24%
28804 15%
28805 14%
28806 25%
Zip Code
Response Percent
Comm. Dist. 1 79%
Comm. Dist. 2 7%
Comm. Dist. 3 14%
Commission District
ANALYSIS CAMPAIGN RESEARCH + STRATEGY www.Campaigns411.com

ANALYSIS & RECOMMENDATIONS
CAMPAIGN RESEARCH + STRATEGY www.Campaigns411.com
Overall support for the items that make up this bond measure is very strong at 67%.
Support is highest among voters over age 50 (77%), registered Democrats (75%), in Commission District #3 (80%) and in Zip Codes 28704 (100%), 28715 (75%), 28801 (74%) and 28806 (72%).
Opposition is higher among voters ages 35-50 (25%), registered Republicans (37%), in Commission District 2 (28%), and in Zip Codes 28804 (31%) and 28805 (32%).
The Undecided rate was highest among voters under age 50 (20%).
ANALYSIS: TRANSPORTATION NETWORK BOND
Top Issues Strongly YES, 50%
Somewhat YES, 17%
Somewhat NO, 6%
Strongly NO, 15%
Undecided, 12%

ANALYSIS & RECOMMENDATIONS
CAMPAIGN RESEARCH + STRATEGY www.Campaigns411.com
Although not as high as the previous measure for roads, sidewalks, greenway, traffic calming and pedestrian safety, support for bond targeted to parks and recreation centers is still strong at 60%.
Support is highest among voters over age 50 (67%), African Americans (80%), registered Democrats (68%), and in Zip Codes 28801(71%) and 28806 (66%).
Opposition is highest among registered Republicans (48%) and Zip Codes 28804 (40%) and 28805 (36%).
Undecided responses were higher among voters under age 35 (24%).
ANALYSIS: PARKS & RECREATION CENTERS BOND
Top Issues Strongly YES, 41%
Somewhat YES, 19%
Somewhat NO, 6%
Strongly NO, 21%
Undecided, 17%

ANALYSIS & RECOMMENDATIONS
CAMPAIGN RESEARCH + STRATEGY www.Campaigns411.com
Overall support for a $25 million bond aimed to address affordable housing in Asheville, NC was strong at 67%.
Support was higher among voters age 50-64 (84%), African Americans (75%), registered Democrats (80%), and in Zip Codes 28704 (100%), 28715 (75%) and 28806 (78%).
Opposition is higher among Republicans (40%), Independents (30%), and in Zip Code 28805 (29%).
The undecided rate is highest among voters age 50 (17%), Republicans (16%), and in Zip Code 28804 (16%).
ANALYSIS: AFFORDABLE HOUSING BOND
Top Issues Strongly YES, 56%
Somewhat YES, 11%
Somewhat NO, 8%
Strongly NO, 15%
Undecided, 9%

QUESTIONS CAMPAIGN RESEARCH + STRATEGY www.Campaigns411.com