20161027 asx mt marion resource asx announcement … · using datamine studio 3 software. due to...
TRANSCRIPT

ASX RELEASE 27 October 2016
Mt Marion Mineral Resource estimate increased by 29% to 77.8Mt Mineral Resources Limited (ASX: MIN) (“MRL”), Neometals Ltd (ASX: NMT) (“Neometals”) and Ganfeng Lithium Co. Ltd (SZAE: 002460) (“Ganfeng”) are pleased to announce results of recent infill and extensional drilling at the Mt Marion Lithium Project (“Mt Marion”) carried out since July 2016. Snowden Mining Industry Consultants (“Snowden”) has reviewed results of recent drilling and provided a revised Mineral Resource estimate as at 21 October 2016 resulting in increases to Indicated and Inferred Mineral Resources now totalling 77.8Mt at 1.37% Li2O and 1.09% Fe; reported above a cut‐off grade of 0.5% Li2O. The previous Mineral Resource estimate released on 5 July 2016 was 60.5Mt at 1.36% Li2O and 1.09% Fe; reported above a cut‐off grade of 0.3% Li2O. The revised estimate represents an increase in contained Lithium content of 29.5% with a slightly increased cut‐off grade to align with pit optimisation parameters as applied by Snowden (refer to Table 1 below).
Table 1: Mt Marion Mineral Resource summary
Category (JORC, 2012) Unit 5 July 2016£ 21 October 2016¥ Change, %
Total Mt 60.5 77.8 +28.6%
Li2O, % 1.36 1.37
Fe, % 1.09 1.09
Contained Li2O kt 823 1,066 +29.5%
Category (JORC, 2012) Unit 5 July 2016£ 21 October 2016¥ Change, %
Indicated* Mt 26.4 28.9 +9.5%
Li2O, % 1.33 1.35
Fe, % 1.09 1.06
Inferred* Mt 34.1 48.9 +43.4%
Li2O, % 1.39 1.38
Fe, % 1.08 1.10 * Reporting category as per JORC, 2012 £ Li2O cut‐off grade of 0.3% ¥ Li2O cut‐off grade of 0.5%
The drill program undertaken from July 2016 through September 2016 comprised 18,915m over 105 holes bringing total drilling for the resource to 83,819m over 931 holes. The recent RC and diamond drilling focused largely on identifying lateral extensions in Area 4 and deep drilling in the previously identified sub‐vertical feeder zone of Area 2W; as well as a portion of infill drilling to improve resource classification to Indicated status (as depicted by the red drill hole collar locations in Figure 1 below). The revised Grade‐Tonnage curve is shown below in Figure 2.

Figure 1: Drill hole collar location plan (as at 23 September 2016; red points show additional holes drilled since previous estimate)
Figure 2: Mt Marion October 2016 Resource Estimate Grade-Tonnage Curve

The Mt Marion lithium mineralisation is hosted within a number of sub‐parallel, northeast to northwest trending pegmatite intrusive bodies which dip at between 10° and 30° to the west. Individual pegmatites vary in strike length from approximately 300 m to 1,500 m and average 15 m to 20 m in thickness, but vary locally from less than 2 m to up to 35 m thick within the main intrusions. To the southwest of Area 2W, large intervals of spodumene‐bearing pegmatite intersected during the 2016 drilling are interpreted to be part of a sub‐vertical, northeast striking feeder zone. The feeder zone is interpreted to be around 40 m to 80 m wide, extending approximately 400 m along strike and down to over 500 m below surface, and is currently open at depth. The pegmatites intrude the mafic and ultramafic volcanic host rocks of the surrounding greenstone belt.
The lithium occurs as 5 cm to 30 cm long grey‐white (with green tint) spodumene crystals within medium grained pegmatites comprising primarily of quartz, feldspar, spodumene and muscovite. Typically, the spodumene crystals are oriented orthogonal to the pegmatite contacts. Some zoning of the pegmatites sub‐parallel to the contacts is observed, with higher concentrations of spodumene typically occurring close to the upper contact.
The drillhole files provided by MRL were briefly checked by Snowden for errors; however, the data was largely accepted and used on an “as is” basis. Some drillholes were found to have incorrect Z coordinates for the collar and were subsequently projected to the topographic surface.
The majority of the deposits have been drilled on a nominal 40 mE by 40 mN drill spacing, with the drill sections oriented east‐west. All drilling is vertical and no downhole surveys have been collected. Drilling within the Area 1 deposit is down to 25 m to 30 m in some areas. The drill sections are oriented northeast‐southwest within Area 6, which has been drilled largely to 40 m along strike by 40 m across strike.
Samples from the 2009 to 2011 RC drilling, which accounts for approximately 22% of the drilled metres, were collected using a static cone splitter mounted below the cyclone. Samples from the 2015 to 2016 RC drilling by MRL, which accounts for approximately 76% of the drilled metres, were collected using a static cone splitter mounted below a drop‐box below the cyclone. A nominal 2 kg to 3 kg sample was collected for each metre in a pre‐numbered calico sample bag. The majority of RC drilling from 2015 to 2016 was drilled wet (with water injected during drilling) due to the presence of fibrous minerals, which were identified early in the drilling program. Cleaning of the cyclone was reportedly by compressed air at the end of each hole. Recovery from the RC drilling was not recorded by MRL due to the necessity for wet drilling. The diamond tails at Area 2W were half core sampled at 1 m intervals within the pegmatite, with the intervals adjusted to the lithological contacts.
Samples for the 2009 to 2011 drilling were forwarded to the Genalysis laboratory in Kalgoorlie for sample preparation and the pulps were then sent to the Genalysis laboratory in Perth for analysis. The Perth laboratory is NATA accredited for ISO17025. For the 2015 to 2016 drilling, all samples were submitted to the Nagrom Analytical laboratory (Nagrom) in Perth for sample preparation and analysis. Snowden understands that the Nagrom laboratory is accredited for ISO9001. The sample preparation at Genalysis and Nagrom followed very similar protocols. Sample preparation comprises drying at 105°C followed by pulverising to P80 or P85 75 µm using a chrome steel ring mill or bowl and puck style pulveriser. A subsample of approximately 200 g was collected using either a rotary sample divider (Genalysis) or scooped from the pulp and placed in numbered sample packets. The Li2O assay was determined by Genalysis in 2009 to 2011 using a four‐acid digest followed by determination of the Li2O content by AAS. Nagrom determined the Li2O content for the 2015 to 2016 samples by peroxide fusion digest with an ICP finish. For both laboratories, an additional test portion was analysed by XRF for a further 14 elements, along with the LOI determined by TGA.

For the drilling conducted after 2009, uncertified pulp standards and field duplicates were inserted into the sample batches to monitor the analytical accuracy and precision of the sampling. Given the lack of proper certification, in Snowden’s opinion, these standards are of limited value in assessing the analytical accuracy. Snowden reviewed the results against the mean and found that the results are reasonable, however Snowden cautions that given the limitations of the standard, only an indicative assessment of the analytical accuracy can be made. Snowden understands that MRL are in the process of determining appropriate control limits for the standards. Snowden reviewed the results for the field duplicates and found that the precision of the sample data is reasonable, given the coarse grain size of the pegmatite. No bias is evident in the 2009 to 2016 field duplicate data.
The sample data was coded within the pegmatite wireframes and composited to a 1 m downhole interval within the pegmatites. Variograms were generated for each estimation domain to assess the spatial continuity of the various elements and as inputs to the kriging algorithm used to interpolate grades. For Li2O grades, the variograms show a nugget effect of 20% to 40% of the total variance and a range of 125 m to 200 m in the direction of maximum continuity, which is oriented either down plunge or along strike.
Based on an analysis of the bulk density testwork completed to date, which comprises 36 measurements of 10cm pieces of core along with calculations based on 219 full core tray weights, Snowden assigned default bulk density values to the model blocks based on the lithology and oxidation state. For the pegmatite, bulk density values of 2.60 t/m3, 2.70 t/m3 and 2.72 t/m3 were applied to the oxide, transitional and fresh zones respectively.
A block model was constructed based on a parent block size of 15 mE by 15 mN by 2.5 mRL. The chosen parent block size is based on the nominal drillhole spacing along with consideration of the geometry of the mineralisation, the results of the grade continuity analysis and the open‐pit bench height. Snowden estimated Li2O, Fe, Al2O3, CaO, K2O, LOI, MgO, MnO, Na2O, P, SiO2, Ta and TiO2 grades using ordinary block kriging (parent cell estimates) using Datamine Studio 3 software. Due to the variable dip of the pegmatites, dynamic anisotropy was used to locally adjust the orientation of the search ellipse and variogram models. The initial search ellipse of 50 m along strike by 35 m down dip by 4 m across strike was defined based on the results of the variography and assessment of the data coverage. A minimum of eight and maximum of 20 composites was used for the initial search pass, with no more than four composites per drillhole. The second search pass utilised double the search ellipse radii (i.e. 100 m by 70 m by 8 m) with the same minimum and maximum number of samples. For the third search pass the search ellipse radii were tripled (i.e. 150 m by 105 m by 12 m) and the minimum number of samples reduced to two. Blocks not estimated after the third search pass were assigned the mean grade of the domain. The block grade estimates were validated both globally and locally against the input drillhole data. With the exception of poorly sampled regions, the block grade estimates show a good correlation between the patterns in the block model grades compared with the drillhole grades.
The October 2016 Mt Marion Mineral Resource estimate was classified and reported in accordance with the 2012 edition of the Australasian Code for Reporting of Exploration Results, Mineral Resources and Ore Reserves (the JORC Code).
The Mineral Resource has been classified as a combination of Indicated and Inferred Resources using the following criteria:
Indicated Resource – Area 1, 2, 2W, 4 and 6 mineralisation with good geological continuity and defined by drilling on a 40 mE by 40 mN grid or better. The Indicated Resource is limited to a vertical depth of approximately 100 m below surface.
Inferred Resource – mineralisation with poor geological continuity or which is defined by drilling on a grid greater than 40 mE by 40 mN. Area 5 is classified as Inferred in its entirety.
The Mineral Resource has been limited to pegmatite mineralisation above 0 mRL (an approximate vertical depth of 400 m below surface). Pegmatite below this level (deep portion of the Area 2W feeder zone) does not, in Snowden’s opinion, have reasonable prospects for eventual economic extraction at this stage. Snowden generated a pit optimisation which showed potential open‐pit
mining to a depth of 400 m below surface at Area 2W, with all other areas showing potential for all the mineralisation to be mined by open pit.
Extrapolation beyond the drilling is limited to approximately one drill section in most cases.
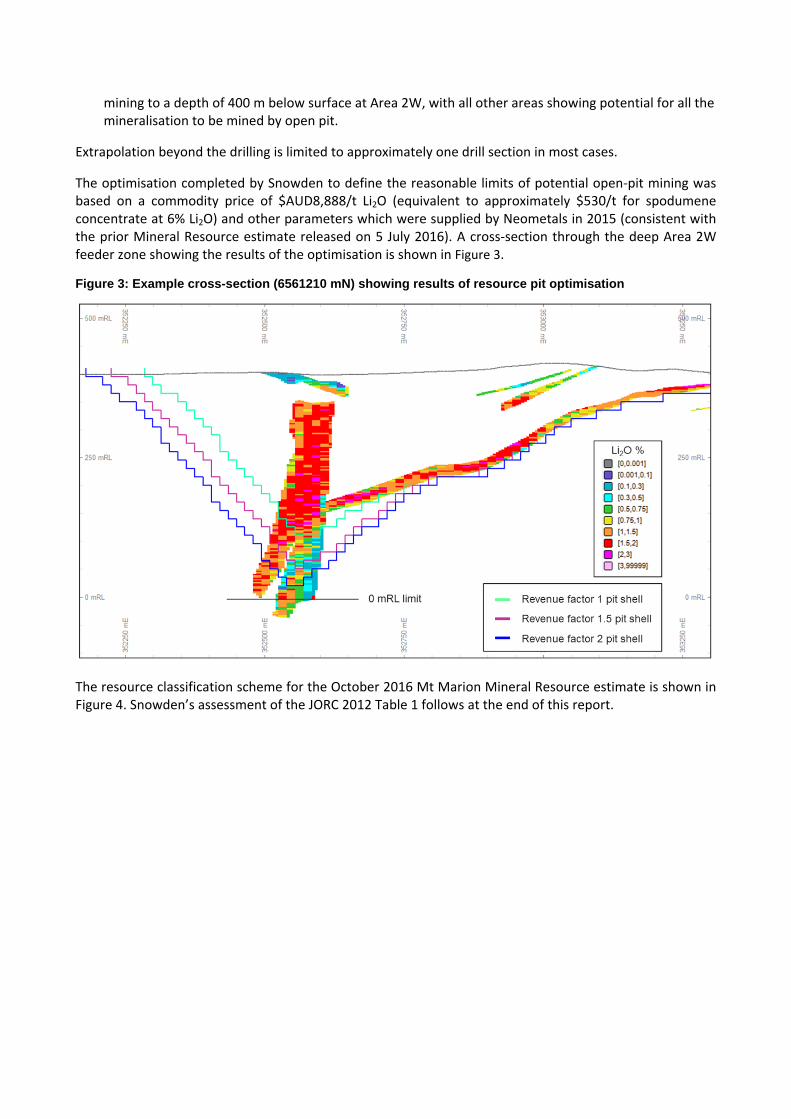
The optimisation completed by Snowden to define the reasonable limits of potential open‐pit mining was based on a commodity price of $AUD8,888/t Li2O (equivalent to approximately $530/t for spodumene concentrate at 6% Li2O) and other parameters which were supplied by Neometals in 2015 (consistent with the prior Mineral Resource estimate released on 5 July 2016). A cross‐section through the deep Area 2W feeder zone showing the results of the optimisation is shown in Figure 3.
Figure 3: Example cross-section (6561210 mN) showing results of resource pit optimisation
The resource classification scheme for the October 2016 Mt Marion Mineral Resource estimate is shown in Figure 4. Snowden’s assessment of the JORC 2012 Table 1 follows at the end of this report.
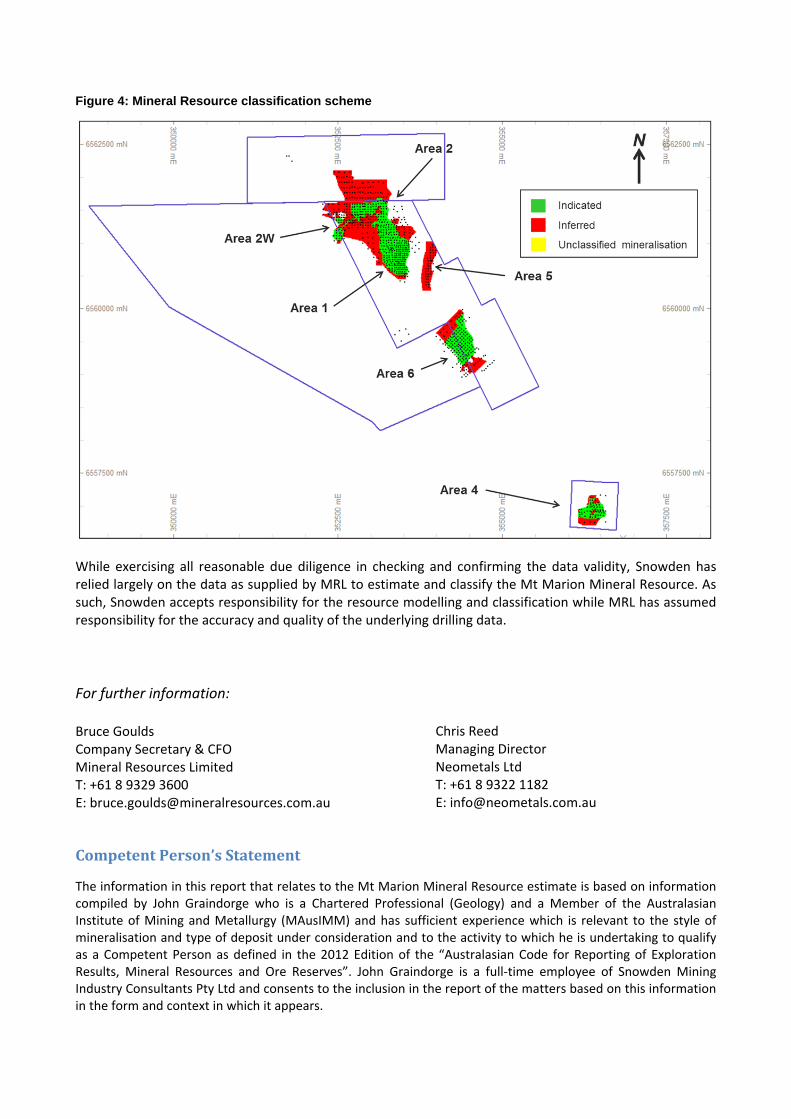
Figure 4: Mineral Resource classification scheme
While exercising all reasonable due diligence in checking and confirming the data validity, Snowden has relied largely on the data as supplied by MRL to estimate and classify the Mt Marion Mineral Resource. As such, Snowden accepts responsibility for the resource modelling and classification while MRL has assumed responsibility for the accuracy and quality of the underlying drilling data.
For further information: Bruce Goulds Company Secretary & CFO Mineral Resources Limited T: +61 8 9329 3600 E: [email protected]
CompetentPerson’sStatement
The information in this report that relates to the Mt Marion Mineral Resource estimate is based on information compiled by John Graindorge who is a Chartered Professional (Geology) and a Member of the Australasian Institute of Mining and Metallurgy (MAusIMM) and has sufficient experience which is relevant to the style of mineralisation and type of deposit under consideration and to the activity to which he is undertaking to qualify as a Competent Person as defined in the 2012 Edition of the “Australasian Code for Reporting of Exploration Results, Mineral Resources and Ore Reserves”. John Graindorge is a full‐time employee of Snowden Mining Industry Consultants Pty Ltd and consents to the inclusion in the report of the matters based on this information in the form and context in which it appears.
Chris Reed Managing Director Neometals Ltd T: +61 8 9322 1182 E: [email protected]

JORC2012TABLE1–ASSESSMENTCRITERIA
JORC(2012)Table1–Section1SamplingTechniquesandData
Item Comments
Sampling techniques
The bulk of the data used for resource estimation is based on the logging and sampling of RC drilling (approximately 97% of the data). Reverse circulation (RC) samples were collected at 1 m intervals within the logged pegmatite using a static cone splitter mounted below the cyclone. Sample bags are pre-numbered.
Drilling techniques
The vast majority (92% of drilled metres) of drilling was completed using vertical RC holes using a face sampling bit. Water injection was used for the 2015 to 2016 drilling due to the presence of fibrous minerals in the surrounding host rocks.
Some diamond core drilling (NQ, HQ3 and PQ3 diameter core) was undertaken to collect samples for metallurgical/geotechnical testwork. Additionally, diamond tails were drilled at Area 2W in the deep feeder zone.
Historical drilling completed in the 1970s accounts for less than 1% of the drilled metres, with the remainder drilled by Reed Resources Ltd (Reed) and Reed Industrial Minerals Pty Ltd (RIM) in 2009 to 2011 and Mineral Resources Limited (MRL) in 2015 to 2016.
Drill sample recovery
RC recovery was estimated for 76 RC drillholes during the 2011 drilling campaign at the Area 4 deposit by weighing the residue bags, with an average recovery of 95% (with a range of 86% up to 100% recovery).
Core recovery from the 2015 and 2016 diamond drilling averages 98%, with a standard deviation of 15% recovery.
No sample recovery was recorded for the 2015 to 2016 RC drilling due to the wet drilling conditions.
Logging Qualitative geological logging of most drillhole intervals was done with sufficient detail to meet the requirements of resource estimation.
Where logging is available all intervals were logged, however some of the pre-2015 drillholes do not have any geological logging.
Subsampling techniques and sample preparation
A nominal 1 m sample interval was used for the RC drilling and diamond core within the pegmatite intervals plus two samples either side. Outside the logged pegmatite, a 6 m composite sample was collected by scooping from each 1 m pile for RC drilling.
Diamond drillholes, where sampled, were sampled using quarter core (2009 to 2011) or half core (2016 Area 2W diamond tails) samples, cut with a diamond saw. RC samples were split using a static cone splitter with approximately 2 kg to 3 kg samples collected.
Laboratory sample preparation conducted at Genalysis in Kalgoorlie, Western Australia and Nagrom in Perth, Western Australia, follows very similar processes comprising:
Drying at 105°C
Crush to a nominal top size of 6.3 mm
Pulverising to 80% to 85% passing 75 µm
Approximate 200 g subsample collected from pulp using a rotary divider (Genalysis) or by scooping (Nagrom).
The sample sizes are considered to be reasonable to correctly represent the mineralisation based on the style of mineralisation (spodumene-bearing pegmatite), the thickness and consistency of intersections and the drilling methodology.
Quality of assay data and laboratory tests
No QAQC of historical 1970s drilling, however, this comprises less than 1% of drilled metres and is not considered material.
Pulps from 2009 to 2011 samples forwarded to Genalysis in Perth, Western Australia for analysis. Samples from the 2015 to 2016 drilling were prepared and analysed at the Nagrom laboratory in Perth, Western Australia.
Li2O determined by four-acid digest with AAS finish for 2009 to 2011 data and by peroxide fusion digest with an ICP finish for 2015 to 2016 samples. XRF analysis for Al2O3, CaO, Cr2O3, Fe, K2O, MgO, MnO, Na2O, Nb, P, SiO2, SO3, Ta and TiO2. Loss on ignition (LOI) at 1000°C measured by thermogravimetric analysis (TGA).
In-house pulp standards generated by Gannet Holdings Ltd from Mt Marion material. The standards were not certified, with the standard results assessed by RIM in 2009 to 2011 against the raw average of the round robin assays.
2009 to 2011 drilling: Quality control samples, including field duplicates and uncertified standards, were inserted in each sample batch. One uncertified standard was inserted every 20 samples along with one field duplicate sample per drillhole. A total of 230 field duplicates were collected.

Item Comments
2015 to 2016 drilling: Quality control samples, including field duplicates and uncertified standards, were inserted in each sample batch. One uncertified standard was inserted every 25 samples and one field duplicate every 20 samples. A total of 975 field duplicates were collected.
Results show that reasonable accuracy and precision was achieved during sampling, sample preparation and assaying. However, Snowden notes that the in-house standards used from 2009 to 2016 do not have a certified expected value or standard deviation and only provide an indicative assessment of the analytical accuracy.
Verification of sampling and assaying
Snowden has not conducted any independent verification of the assay data.
Procedures for all aspects of drilling, sampling and geological logging are documented by MRL.
Ten drillholes have been twinned by RC drillholes. Analysis of the twinned holes shows a reasonable comparison between the drilling techniques.
Values below the analytical detection limit were replaced with half the detection limit value. Due to the different generations of data some assay conversions from ppm to percent were made (by dividing by 10,000). Additionally, in some cases conversion from Li to Li2O and from Fe2O3 to Fe was required. No other adjustments have been made to the assay data.
Location of data points
The grid is based on the MGA94 Zone 51 grid system.
Drillhole collar locations were surveyed by a contract surveyor using RTK DGPS with a nominal accuracy of 20 mm horizontally and 30 mm vertically. 14 drillholes were found to have incorrect Z coordinates for the collar and were subsequently projected to the topographic surface.
No downhole survey information was collected. The vast majority of holes were drilled vertically. Some shallow inclined holes were drilled at the Area 5 deposit.
Given that almost all the drillholes at the Mt Marion deposit are vertical, Snowden does not consider the downhole deviation (and lack of adequate downhole surveys) to be a major risk with respect to the shallow portions of the Mt Marion resource. Below 100 m vertical depth the Mineral Resource has been classified as Inferred, partly to reflect uncertainty associated with potential drillhole deviation.
A LIDAR topographic survey based on 1 m contours, completed in 2015, of the project area was provided. The topography surface is validated by the drillhole collar surveys.
Data spacing and distribution
The drilling was completed along a set of east-west trending sections for Areas 1, 2, 2W, 4 and 5. The drill sections are oriented northeast-southwest for Area 6. The drill spacing ranges from 30 m to 40 m apart (in the along strike and down dip directions) for the majority of the deposit. The northern portions of Area 2, 2W and 6 are drilled to a nominal 80 m spacing.
The section spacing is sufficient to establish the degree of geological and grade continuity necessary to support the resource classifications that were applied.
The drilling was composited downhole using a 1 m interval within the pegmatite and 6 m within the surrounding host rocks.
Orientation of data in relation to geological structure
The vast majority of the drilling is vertical.
The location and orientation of the majority of the Mt Marion drilling is appropriate given the strike and morphology of the lithium pegmatite mineralisation. However, for the sub-vertical feeder zone at Area 2W, the vertical drilling is not considered appropriate and is reflected in the Inferred classification in this area.
Sample security
No specific measures have been taken to ensure sample security.
Once received at the laboratory, samples were compared by the laboratory to the sample dispatch documents.
Snowden does not believe that sample security poses a material risk to the integrity of the assay data used in the Mineral Resource estimate.
Audits and reviews
Snowden is not aware of any other independent reviews of the drilling, sampling and assaying protocols, or the assay database, for the Mt Marion project.

JORC(2012)Table1–Section2ReportingofExplorationResults
Item Comments
Mineral tenement and land tenure
Granted Mining Leases M15/717, M15/999 and M15/1000. Leases granted to Reed Industrial Minerals Pty Ltd (RIM), which is a joint venture between Neometals Ltd (13.8%), Mineral Resources Limited (43.1%) and Jiangxi Ganfeng Lithium Co. Ltd (43.1%).
Northern portion of project occurs on Hampton Area Location 53, which is owned by Metals X Limited. RIM has agreed to lease the lithium mining rights over a portion of Hampton Area Location 53, adjoining the Mt Marion project. The agreement allows RIM to explore and develop the lithium project within the agreed portion of Hampton Area Location 53. For details, refer to Neometals Ltd announcement dated 7 July 2015 entitled “Completion of transaction with Metals X”.
Exploration done by other parties
A total of 931 drillholes have been drilled as at 23 September 2016 totalling approximately 83,819 m in length. Initial drilling at Mt Marion was completed by Western Mining Corporation in the 1970s. Approximately 22% of the drilled metres were completed by Reed and later RIM between 2009 and 2011, with the remainder completed by MRL between 2015 and 2016.
Geology The Mt Marion lithium mineralisation is hosted within a number of sub-parallel, northeast to northwest trending pegmatite intrusive bodies which dip at between 10° and 30° to the west. Individual pegmatites vary in strike length from approximately 300 m to 1,500 m and average 15 m to 20 m in thickness, but vary locally from less than 2 m to up to 35 m thick. The pegmatites intrude the mafic volcanic host rocks of the surrounding greenstone belt.
To the southwest of Area 2W, large intervals of spodumene-bearing pegmatite intersected during the 2016 drilling are interpreted to be part of a sub-vertical, northeast striking feeder zone. The feeder zone is interpreted to be around 40 m to 80 m wide, extending approximately 400 m along strike and down to over 500 m below surface, and is currently open at depth.
The lithium occurs as 5 cm to 30 cm long grey-white spodumene crystals within medium grained pegmatites comprising primarily of quartz, feldspar, spodumene and muscovite. The spodumene crystals are broadly oriented orthogonal to the pegmatite contacts. Some zoning of the pegmatites parallel to the contacts is observed, with higher concentrations of spodumene occurring close to the upper contact.
Drillhole information
No exploration results being reported.
Data aggregation methods
No exploration results being reported.
Relationship between mineralisation widths and intercept lengths
No exploration results being reported.
Diagrams Refer to figures in main summary.
Balanced reporting No exploration results being reported.
Other substantive exploration data
No exploration results being reported.
Outcrop of spodumene-bearing pegmatite along with exposure in the open-pit, supports the interpreted pegmatite in these areas.
Further work Snowden understands that further exploration drilling is being investigated for the Area 3 target to the northwest of Area 2W at the Mt Marion project, however no drilling has yet been planned.

JORC(2012)Table1–Section3EstimationandReportingofMineralResources
Item Comments
Database integrity
MRL stores all of the Mt Marion drilling information in a DataShed database. The database is managed by Rock Solid Consultancy Pty Ltd.
Snowden undertook a basic check of the data for potential errors as a preliminary step to compiling the resource estimate. No significant flaws were identified.
Site visits Snowden Principal Consultant, John Graindorge, visited the Mt Marion project on 18 October 2016, observing the exposed pegmatite in the open-pit at Area 1 and the general site layout, along with the drilling intervals for the extensional drilling at Area 4 and the deep drilling at Area 2W. John previously visited the site on 20 July 2015 and again on 8 and 9 February 2016 to observe the reverse circulation (RC) drilling and sampling.
Geological interpretation
Snowden believes that the local geology is reasonably well understood as a result of work undertaken by RIM and MRL.
Lithium mineralisation occurs as spodumene crystals which are hosted within quartz-feldspar-muscovite pegmatites.
The spodumene-bearing pegmatites were interpreted and wireframed in section by Snowden based largely on the geological logging of pegmatite intersections, along with the geochemistry (e.g. Li2O, Fe and MgO content). The pegmatite intersections are easily identified in the drilling.
The feeder zone at Area 2W is interpreted to be sub-vertical, however the vertical orientation of the drilling (and lack of downhole surveys) means that there is significant uncertainty associated with this zone.
No changes were made to Areas 5 from the 2011 interpretation as no further drilling has been conducted in this area.
Outcrops and exposure of the pegmatite confirms the validity of the geological interpretation based on the drilling.
Alternative interpretations of the mineralisation are unlikely to significantly change the overall volume of the mineralised envelopes in terms of the reported classified resources.
Dimensions The Mt Marion lithium mineralisation is hosted within a number of sub-parallel, northeast to northwest trending pegmatite intrusive bodies which dip at between 10° and 30° to the west. Individual pegmatites vary in strike length from approximately 300 m to 1,500 m and average 15 m to 20 m in thickness, but vary locally from less than 2 m to up to 35 m thick. The pegmatites are currently defined to a depth of up to 250 m below surface, with the feeder zone extending down to a depth of 500 m below surface.
Estimation and modelling techniques
Estimation of Li2O, Fe, Al2O3, CaO, K2O, LOI, MgO, MnO, Na2O, P, SiO2, Ta, and TiO2 using ordinary block kriging with hard domain boundaries and top-cuts where required to control the impact of outlier grades. No top-cuts were applied to Li2O or Fe. Dynamic anisotropy was used to locally adjust the search ellipse and variogram orientation based on the local dip and dip direction of the geological interpretation. Grade estimation was completed using Datamine Studio 3 (Datamine) software.
Block model constructed using a parent block size of 15 mE by 15 mN by 2.5 mRL based on half the nominal drillhole spacing along with an assessment of the grade continuity. The search ellipse orientation and radius was based on the results of the grade continuity analysis, with the same search neighbourhood parameters used for all elements to maintain the metal balance and correlations between elements. An initial search of 50 m by 35 m by 4 m thick was used, with a minimum of eight and maximum of 20 samples. The number of samples per drillhole was limited to four.
Lithium mineralisation was modelled, along with the surrounding host rock domains.
Grade estimates were validated against the input drillhole composites (globally and using grade trend plots) and show a good comparison.
Snowden previously estimated the Mt Marion Mineral Resource in July 2016. The October 2016 Mineral Resource estimate is larger in terms of tonnage (77.8 Mt compared to 60.5 Mt), due to the additional pegmatite identified during the 2016 drilling along with extending the reported Mineral Resource at depth by 150 m. The Li2O grade is very similar to the previous estimate.
Moisture All tonnages have been estimated as dry tonnages.
Cut-off parameters
The mineralisation has been reported above a 0.5% Li2O cut-off grade.
The 0.5% Li2O cut-off grade was applied for the reporting based on pit optimisation carried out by Snowden. Snowden notes that the sensitivity of the Mineral Resource to the reporting cut-off grade is minimal at cut-offs below 0.5% Li2O.

Item Comments
Mining factors and assumptions
Mining of the deposit has commenced using conventional drill and blast open cut mining methods, with on-site processing (currently being commissioned) and planned road train haulage of the spodumene concentrate to Fremantle.
Metallurgical factors and assumptions
RIM indicated that the ore will be processed on site to produce spodumene concentrates.
A prefeasibility study completed by Reed in October 2012 indicates that lithium hydroxide can be produced from Mt Marion spodumene concentrates.
Environmental factors and assumptions
Mining at Mt Marion has commenced and it is assumed that no environmental factors have been identified that may impede further development at the Mt Marion site. Fibrous minerals in the surrounding mafic/ultramafic host rock have been noted by MRL and are being managed.
Bulk density Bulk density measurements were completed in 2010 at the Genalysis Laboratory on eleven 10 cm pieces of unoxidised PQ diamond drill core from the Area 1, 2 and 2W deposits, from drillholes MMD103 to MMD108. The average bulk density of the 11 samples is 2.72 t/m3, varying from 2.62 t/m3 up to 2.86 t/m3. In 2016, Nagrom completed a further 36 bulk density measurements on 10 cm pieces of fresh diamond core from four diamond drillholes from the Area 2W feeder zone.
For some of the 2016 density samples, Nagrom used multiple techniques to determine the bulk density based on the Archimedes principle – uncoated, wax-coated and cling-wrapped. A comparison of the different techniques shows that for fresh rock at Mt Marion, the uncoated measurements match very closely with the wax-coated measurements, suggesting that the porosity is negligible and wax-coating is not required. However, the cling-wrapped measurements have a significantly lower bulk density due to excess air trapped under the wrap. Snowden excluded the cling-wrapped bulk density measurements from the analysis.
A number of diamond core holes were drilled in 2015 to provide material for metallurgical testwork. No bulk density measurements were taken prior to sampling the core; however, whilst no direct density measurements were taken, full core trays were weighed and the core diameter was measured. Snowden used this data to estimate the bulk density for each tray, given the core diameter, interval length and weight (factored to remove the weight of the empty core tray). These calculated density values (219 in total) were then merged with the drillhole database and coded with the oxidation state and whether the interval was within the pegmatite interpretations. Snowden then analysed this data to derive bulk density values for each combination of rock type (i.e. pegmatite or host rock) and oxidation state. Whilst not ideal, these measurements provide a reasonable estimate of the bulk density of the Mt Marion pegmatite and show similar density to the direct measurements for the Area 2W core.
Based on the limited available bulk density data, Snowden assigned default bulk density values to the model blocks as follows:
Unit Oxidationstate Bulkdensity(t/m3)Pegmatite Oxide 2.60
Transitional 2.70 Fresh 2.72
Mafic volcanic host rocks
Oxide 2.25 Transitional 2.60
Fresh 3.00
Classification The resources have been classified based on the continuity of both the geology and the grades, along with the drillhole spacing and data quality.
The Mineral Resource has been classified as a combination of Indicated and Inferred Resources using the following criteria:
Indicated Resource – Area 1, 2, 2W, 4 and 6 mineralisation with good geological continuity and defined by drilling on a 40 mE by 40 mN grid or better. The Indicated Resource is limited to a vertical depth of approximately 100 m below surface.
Inferred Resource – mineralisation with poor geological continuity or which is defined by drilling on a grid greater than 40 mE by 40 mN. Area 5 is classified as Inferred in its entirety.
The Mineral Resource has been limited to pegmatite mineralisation above 0 mRL (an approximate vertical depth of 400 m below surface). Pegmatite below this level (deep portion of the Area 2W feeder zone) does not, in Snowden’s opinion, have reasonable prospects for eventual economic extraction at this stage. Snowden generated a pit optimisation which showed potential open-pit mining to a depth of 400 m below surface at Area 2W, with all other areas showing potential for all the mineralisation to be mined by open pit.
The Mineral Resource classification appropriately reflects the view of the Competent Person.

Item Comments
Audits and reviews
The Mineral Resource estimate has been peer reviewed as part of Snowden’s standard internal peer review process.
Snowden is not aware of any external reviews of the Mt Marion Mineral Resource estimate.
Discussion of relative accuracy/ confidence
The Mineral Resource has been validated both globally and locally against the input composite data. The Indicated portion of the Mineral Resource estimate is considered to be locally accurate at the scale of the parent block size. Close spaced drilling is required to assess the confidence of the short range grade continuity.
No production data is available for comparison with the Mineral Resource estimate at this stage due to the early stage of the mining.