2016/arp002 - the tidal turbine reef (ttr) feasibility study · reef (ttr) feasibility study...
TRANSCRIPT

2016/ARP002 - The Tidal Turbine
Reef (TTR) Feasibility Study
Level 4, 600 Murray St
West Perth WA 6005
Australia
301320-14359-MA-REP-0003
2016/ARP002 - The Tidal
Turbine Reef (TTR)
Feasibility Study
ARENA Tidal Turbine Design Report

2016/ARP002 - The Tidal Turbine
Reef (TTR) Feasibility Study
Advisian ii
Disclaimer
This report has been prepared on behalf of and for the exclusive use of ARENA, and is subject to
and issued in accordance with the agreement between ARENA and Advisian.
Advisian accepts no liability or responsibility whatsoever for it in respect of any use of or reliance
upon this report by any third party.
Copying this report without the permission of ARENA and Advisian is not permitted.
Project No: 301320-14359-MA-REP-0003 – 2016/ARP002 - The Tidal
Turbine Reef (TTR) Feasibility Study
Rev Description Author Review Approval Date
0 Issued for Use
Lee O'Neill
Bill Barker
Lee O'Neill
18-May-18

2016/ARP002 - The Tidal Turbine
Reef (TTR) Feasibility Study
Advisian iii
Table of Contents
1 Summary ..................................................................................................................................... 1
2 Introduction ............................................................................................................................... 3
2.1 Phase 1A ....................................................................................................................... 3
2.2 Phase 1B Objectives ................................................................................................. 4
2.3 Acronyms ...................................................................................................................... 6
3 Basis of Design ......................................................................................................................... 7
3.1 Location Selection..................................................................................................... 7
3.2 Location Environment ............................................................................................. 9
3.2.1 Tidal Elevation ........................................................................................................ 9
3.2.2 Estimates of Current Speed ............................................................................ 11
3.2.3 Waves ..................................................................................................................... 15
3.2.4 Sea Level ................................................................................................................ 16
3.3 Concept Description ............................................................................................. 16
3.3.1 Power Output Required ................................................................................... 16
3.3.2 TTR Offshore Structural Concept ................................................................. 17
3.3.3 Power Transmission ........................................................................................... 19
3.4 Design Parameters ................................................................................................. 19
3.4.1 Environmental Criteria and Parameters ..................................................... 19
3.4.2 Marine Growth .................................................................................................... 20
3.4.3 Corrosion Allowance ......................................................................................... 20
3.5 Seabed Properties .................................................................................................. 20
3.6 Structural Design Parameters ........................................................................... 20
4 Fabrication and Installation Methodology ................................................................. 22
4.1 Fabrication Methodology ................................................................................... 22
4.1.1 Comparison of Concrete Construction Methods ................................... 22

2016/ARP002 - The Tidal Turbine
Reef (TTR) Feasibility Study
Advisian iv
4.1.2 Proposed Construction Method ................................................................... 23
4.1.3 Steel versus Concrete Foundation Base .................................................... 26
4.1.4 Power Cables to Shore ..................................................................................... 26
4.1.5 Mooring ................................................................................................................. 26
4.2 Transportation Methodology ............................................................................ 26
4.3 Installation Methodology ................................................................................... 27
5 Operating and Maintenance Methodology .............................................................. 31
5.1 Turbine Maintenance ............................................................................................ 31
5.2 Turbine Retrieval .................................................................................................... 31
6 Electrical and Turbine Interface Design ....................................................................... 34
6.1 SIT Characteristics .................................................................................................. 35
6.2 Integration of Turbine into TTR Platform ..................................................... 36
6.3 Turbine System ....................................................................................................... 36
7 Economic Modelling ........................................................................................................... 39
7.1 Model Overview ...................................................................................................... 39
7.2 Cost Summary ......................................................................................................... 40
7.3 Annual Delivered Energy ..................................................................................... 41
7.4 Capital Expenditure ............................................................................................... 41
7.5 Operational Expenditure ..................................................................................... 42
7.6 Other Assumptions ................................................................................................ 43
7.7 Resulting LCOE, NPV and IRR ........................................................................... 44
7.8 Sensitivity Analysis ................................................................................................. 45
7.8.1 Project Curves ...................................................................................................... 45
7.8.2 Tornado Chart ..................................................................................................... 46
7.9 Key Findings ............................................................................................................. 47
8 Discussion (Opportunities) ............................................................................................... 49
8.1 Learnings ................................................................................................................... 49

2016/ARP002 - The Tidal Turbine
Reef (TTR) Feasibility Study
Advisian v
8.1.1 Fabrication ............................................................................................................ 50
8.2 Opportunities ........................................................................................................... 51
8.3 Risks ............................................................................................................................. 52
8.4 Recommended Future Work ............................................................................. 52
9 References ............................................................................................................................... 54
Table List
Table 2-1: Phase 1A financial modelling results ........................................................................................................ 4
Table 2-2: Acronyms ............................................................................................................................................................. 6
Table 3-1: Design parameters ........................................................................................................................................ 19
Table 3-2: Material parameters ..................................................................................................................................... 21
Table 4-1: TTR mooring and installation environment limitations .................................................................. 28
Table 5-1: Maintenance plan .......................................................................................................................................... 31
Table 6-1: SIT 250 datasheet .......................................................................................................................................... 36
Table 7-1: Summary of tidal turbine estimates (rounded) in Australian Dollars Q4 2017 ±30% ........ 40
Table 7-2: Annual delivered energy and capacity factor for the 8 and 16 TTR concepts ...................... 41
Table 7-3: Summary CAPEX per MW ........................................................................................................................... 42
Table 7-4: Summary of OPEX costs .............................................................................................................................. 43
Table 7-5: Resulting LCOE, NPV, IRR and required revenue .............................................................................. 44
Appendix List
Drawings Dossier

2016/ARP002 - The Tidal Turbine
Reef (TTR) Feasibility Study
Advisian 1
1 Summary
ARENA has granted $280,000 under its Advancing Renewables Program to WorleyParsons, who has
formed a partnership with EcoFin Solutions, SCHOTTEL and Civmec, to study and develop a front-
end engineering design for a tidal turbine reef (TTR) device concept. The premise of this scope was
to create a fixed (in location) tidal turbine energy device that has a reduced installation and
maintenance cost when compared to conventional designs.
The study created an initial design for a generic tidal site so its viability could be assessed in terms
of technical feasibility, project risk and key financial drivers, with the findings incorporated into a
second design cycle. The second design cycle tailored the concept for a candidate site in Australia.
The resulting TTR device comprises a reinforced concrete foundation base with four steel columns
that support a single row of eight turbines on a tractable support structure, as illustrated in
Figure 1-1. The TTR is proposed to be installed about 200 m off the coast in Pearl Pass in water
13 m deep (relative to lowest astronomical tide, or ‘LAT’), eliminating the need for subsea cabling
and minimising the complexity and requirements of aerial cabling.
Figure 1-1: TTR device structure concept

2016/ARP002 - The Tidal Turbine
Reef (TTR) Feasibility Study
Advisian 2
The preliminary work in this phase has led to a foundation base approximately 15 m wide by 54 m
long by 4 m high, which is divided into 16 internal compartments. The foundation base is to be
grouted to the seabed after installation to adequately resist the tidal current velocities. The
turbines are supported off four columns that protrude past the low tide levels. One column is taller,
which allows a power pole to be located on top which will connect to a power wire that will be fed
back onshore. A lifting mechanism will be installed to allow the turbine support structure to be
lifted above the low tide cycle to access the turbines for maintenance.
To minimise capital expenditure (CAPEX) costs, the TTR was designed to be self-floating and
self-installing to reduce the requirements of installation spreads and support vessels. The concrete
foundation base was designed to contain enough reserve buoyancy to be able to be wet-towed to
site using a single tug, and have compartments flooded to allow a controlled descent
‘sea-chesting’ installation procedure.
This concept was developed based on certain assumptions which would need to be confirmed in
the next phase of development. This TTR device concept relies on a flat surface of bedrock and
relatively shallow water depths to allow the structure to be sea-chested onto the seabed. Selecting
a site with deeper water will increase the length of the foundation base significantly, which can
potentially make this type of structure unfeasible. In addition, if the TTR requires being installed
further from the coast, it would need to use expensive subsea cabling to run power back onshore,
and may only then be feasible if developed in an array of multiple devices.
The TTR is proposed to be fabricated at Civmec in Henderson, where it will be launched into the
quay using a floating dry dock. The TTR will be towed to Broome where it will be temporarily
moored until the installation contractor tows the TTR the short distance to One Arm Point for
installation. The tow from Broome to site will be weather-dependent; the journey will only go
ahead if the tide is in a neap cycle and the three-day installation window forecast is calm. The
advantage of breaking the entire transport into two separate tows is that the initial tow to Broome
is less reliant on weather, and will not incur vessel day rate charges if the forecasted installation
environment is not suitable upon arrival at Broome.
Due to limitations on the water depth of this site, the TTR concept was restricted to a single row of
turbines. If a nearby location reveals slightly deeper water (required water depth is about 16-18 m
relative to LAT), an additional row of turbines can be added to the TTR structure with minimal
impact to the current design and therefore minimal impact to the CAPEX cost. The arrangement
would need to stagger the turbine rows with a set lower than the other, to allow the current to
pass without interference from the row in front. Preliminary investigations suggest there would be
an optimum number of turbines installed using this technique of multiple rows that can reduce the
CAPEX cost per turbine by one third.
The economic modelling of the eight-turbine device at One Arm Point shows a levelised cost of
energy (LCOE) to be $825/MWhr for an estimated annual peak current speed of 10 knots. The total
CAPEX for the device is estimated to be $8,795,000 with an annual operating expenditure (OPEX) of
$354,868.
The TTR concept is very site-specific. For locations that have the required water depth, current
speed and proximity to land, the energy production costs are still roughly an order of magnitude
higher than conventionally generated electricity, but still in the same order of magnitude of remote
diesel generated electricity.

2016/ARP002 - The Tidal Turbine
Reef (TTR) Feasibility Study
Advisian 3
2 Introduction
A partnership has been formed by WorleyParsons (engineering, procurement and construction
management), EcoFin Solutions (renewable energy consultancy and financial modelling),
SCHOTTEL Hydro (turbine designer and manufacturer) and Civmec (fabricator) to develop a front-
end engineering design (FEED) for a tidal turbine concept. The concept is called the Tidal Turbine
Reef (TTR), and the premise is to create a fixed location tidal turbine energy device that has a
reduced installation and maintenance cost when compared to conventional designs. Key features
include dry electrical connections, a self-installing offshore structure component, minimal
equipment required for turbine inspections, and live unit turbine access.
The project involves two phases, with the aim of ultimately producing a technically and
commercially optimal design.
2.1 Phase 1A
Phase 1A was completed in May 2017. In this phase of the design cycle, the initial proposed TTR
design was developed to a basic stage where preliminary financial assessment could be performed
against international benchmarks. Fundamental design documentation was started to capture
content to be fed into this Phase 1B design development. The Phase 1A concept depicted in
Figure 2-1 was shown to be economically unviable at today’s electricity prices and in moderate
tidal conditions, as shown in Figure 2-1. Ref [1]. Particular financial issues were around the
transmission costs and the size of the supporting structure.
Figure 2-1: Phase 1A TTR concept

2016/ARP002 - The Tidal Turbine
Reef (TTR) Feasibility Study
Advisian 4
Table 2-1: Phase 1A financial modelling results
Five Turbines / Six Devices
2 m/s max 3 m/s max 4 m/s max
Farm Size [MW] 2.1 2.1 2.1
Max Flow [m/s] 2
(0.84 avg)
3
(1.2 avg)
4
(1.6 avg)
Annual Energy Capture [MWh] 1691 5142 8392
Capacity Factor (average) 9% 28% 45%
CAPEX [$/MW] 15,779,049 19,018,485 23,553,697
OPEX [$/MW] 675,763 805,340 986,749
Feed in Tariff [$/MWh] 140 140 140
Grant [$] N/A N/A N/A
LCOE [$/MWh] 2337 939 710
Net Present Value [$] -40,404,347 -43,852,007 -51,043,467
Key conclusions drawn from the financial modelling were:
▪ Cost is double industry standard
▪ Annual revenue projections would be unable to cover annual OPEX
▪ Based on assumed feed in tariffs, the current design and associated costs mean the project is a
long way from being commercially viable
▪ Using a resource with a higher current than max 3 m/s does not make a substantial difference
to the LCOE, nor does adding more turbines. That being said, any resource used with lower
max current speed than 3 m/s significantly hinders the viability of the project.
2.2 Phase 1B Objectives
Phase 1B initially widened the focus of the TTR design to respond to findings from Phase 1A. The
design was modified to best fit within the CAPEX and OPEX thresholds defined in Phase 1A as well
as being tailored for a candidate site in Australia. Phase 1B ultimately narrowed the design down to
a single concept to be built and installed off One Arm Point in Western Australia, supplying
electricity to the Ardyaloon community which currently relies on diesel for power.
Key deliverables from Phase 1B are:
1. Design Report:
a. Structural Analyses
b. Material Take-Off and Equipment List
c. Transportation and Installation Plan

2016/ARP002 - The Tidal Turbine
Reef (TTR) Feasibility Study
Advisian 5
d. Drawings
e. Maintenance Plan
f. Fabrication Proposal Report
g. Calculation Dossier.
2. Project Cost Estimate
3. Economic Feasibility Modelling:
a. Environment Sensitivity Modelling
b. Cost Driver Analyses
c. Concept Comparison
d. CAPEX and OPEX Benchmarking.
They key objective of Phase 1B was to do sufficient design, engineering and costing to state
whether the concept is commercially viable, and provide enough detail so the concept can move to
the next phase of development.
2016/ARP002 - The Tidal Turbine
Reef (TTR) Feasibility Study
Advisian 6
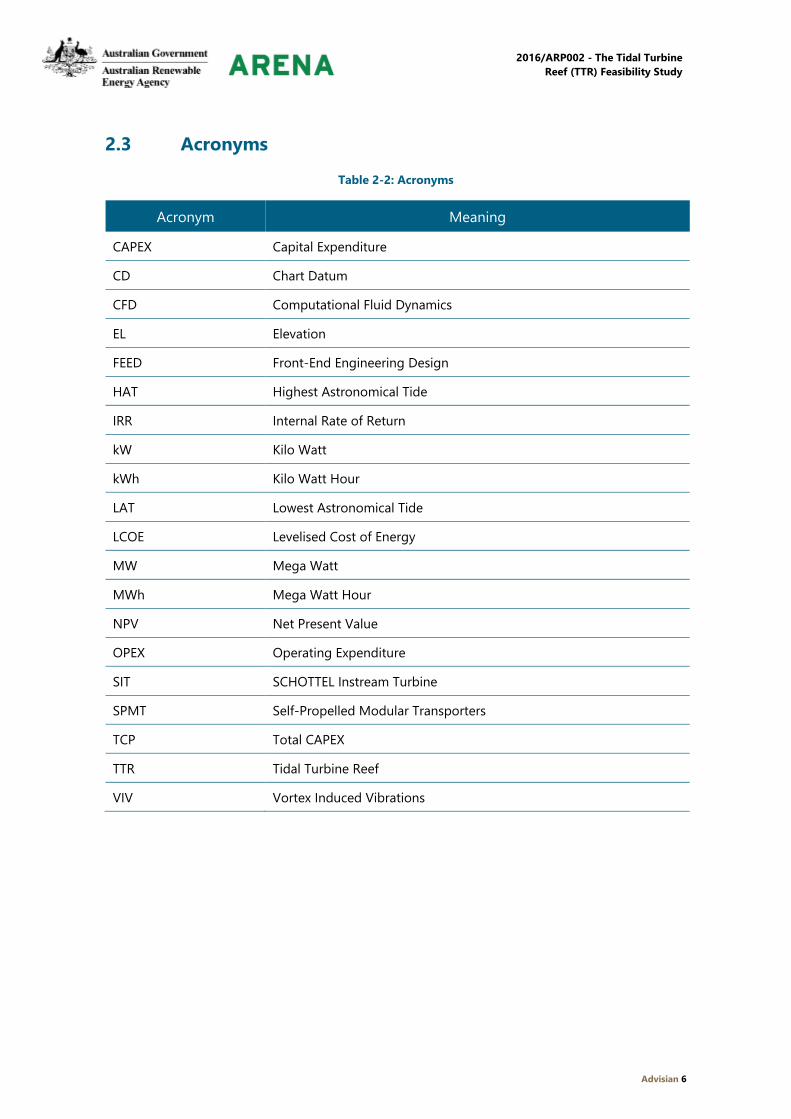
2.3 Acronyms
Table 2-2: Acronyms
Acronym Meaning
CAPEX Capital Expenditure
CD Chart Datum
CFD Computational Fluid Dynamics
EL Elevation
FEED Front-End Engineering Design
HAT Highest Astronomical Tide
IRR Internal Rate of Return
kW Kilo Watt
kWh Kilo Watt Hour
LAT Lowest Astronomical Tide
LCOE Levelised Cost of Energy
MW Mega Watt
MWh Mega Watt Hour
NPV Net Present Value
OPEX Operating Expenditure
SIT SCHOTTEL Instream Turbine
SPMT Self-Propelled Modular Transporters
TCP Total CAPEX
TTR Tidal Turbine Reef
VIV Vortex Induced Vibrations
2016/ARP002 - The Tidal Turbine
Reef (TTR) Feasibility Study
Advisian 7
3 Basis of Design
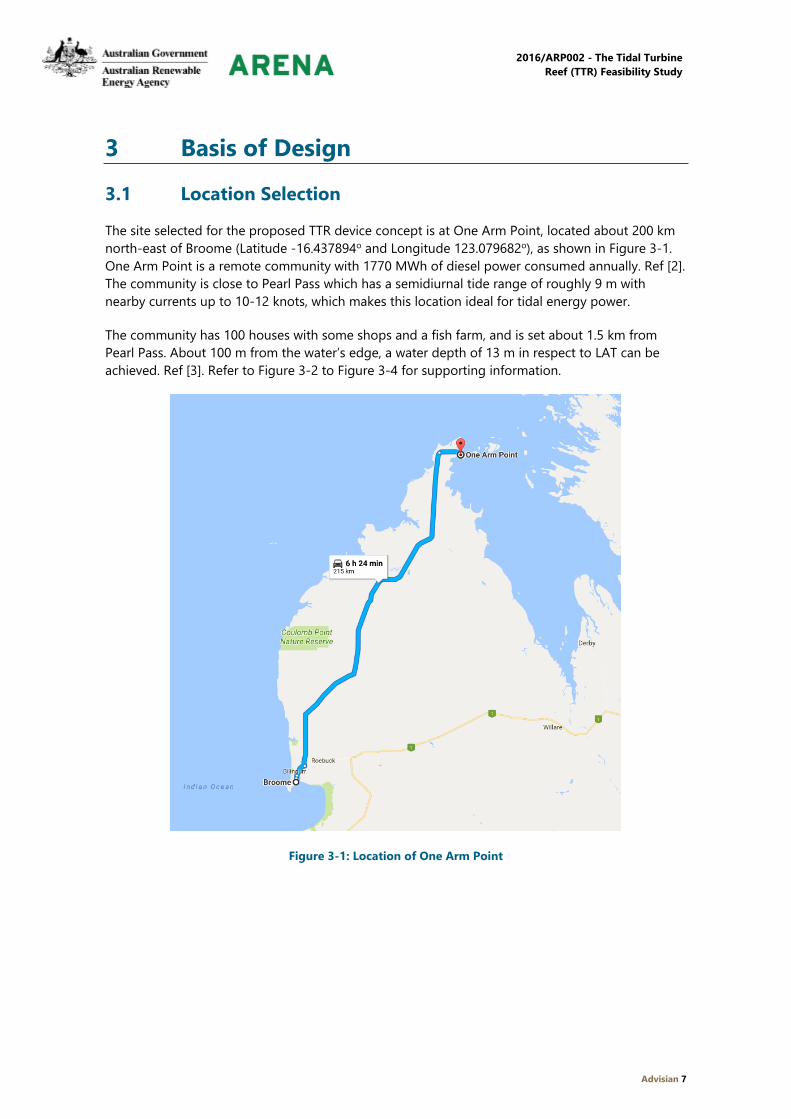
3.1 Location Selection
The site selected for the proposed TTR device concept is at One Arm Point, located about 200 km
north-east of Broome (Latitude -16.437894o and Longitude 123.079682o), as shown in Figure 3-1.
One Arm Point is a remote community with 1770 MWh of diesel power consumed annually. Ref [2].
The community is close to Pearl Pass which has a semidiurnal tide range of roughly 9 m with
nearby currents up to 10-12 knots, which makes this location ideal for tidal energy power.
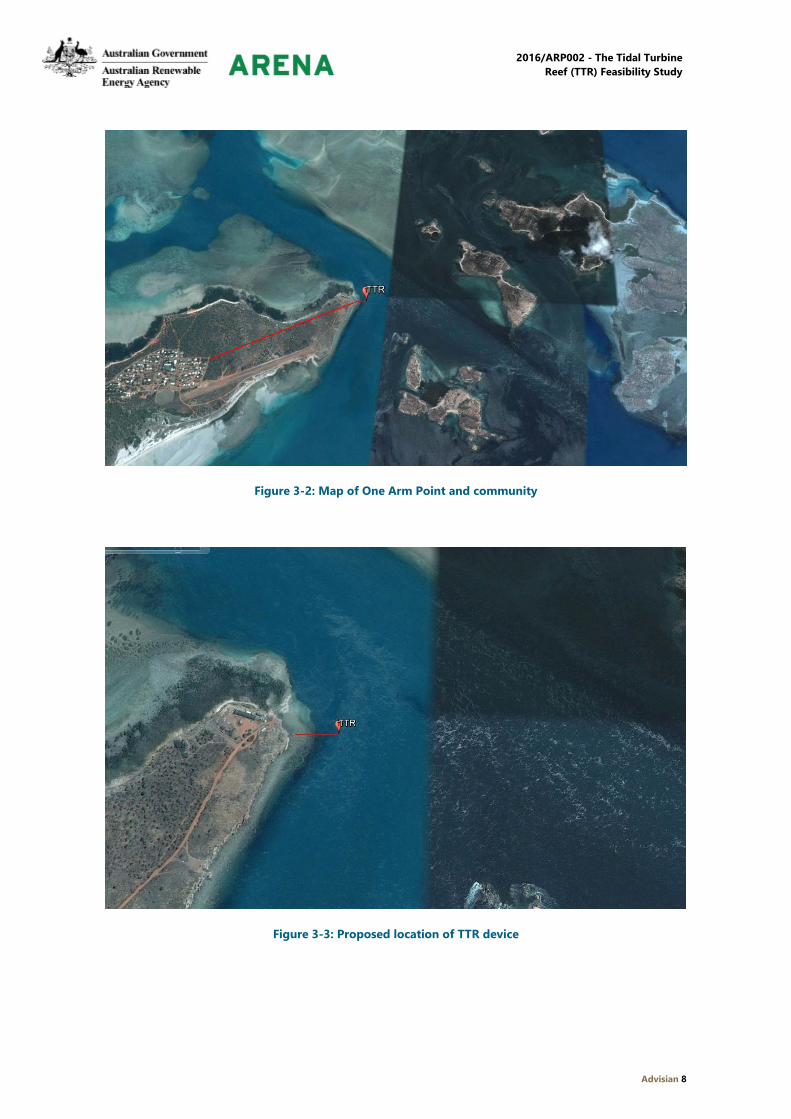
The community has 100 houses with some shops and a fish farm, and is set about 1.5 km from
Pearl Pass. About 100 m from the water’s edge, a water depth of 13 m in respect to LAT can be
achieved. Ref [3]. Refer to Figure 3-2 to Figure 3-4 for supporting information.
Figure 3-1: Location of One Arm Point
2016/ARP002 - The Tidal Turbine
Reef (TTR) Feasibility Study
Advisian 8
Figure 3-2: Map of One Arm Point and community
Figure 3-3: Proposed location of TTR device

2016/ARP002 - The Tidal Turbine
Reef (TTR) Feasibility Study
Advisian 9
Figure 3-4: Nautical chart of One Arm Point. Ref [3]
3.2 Location Environment
3.2.1 Tidal Elevation
Tidal constituents are available for Karrakatta Bay, which is just north of One Arm Point. Based on
these constituents, the following tidal predictions can be made:
▪ There is a significant variation of tidal range throughout a typical tidal cycle. Typical tides at
spring are in the range of 8-9 m, whereas typical tides at neaps are in the range of 1-3 m.
▪ The magnitude of neaps and springs varies through the year, with the largest springs and
smallest neaps being found around the equinoxes (March and September).
Time series for one month (March 2017) and the full year (2017) are shown in Figure 3-5 and
Figure 3-6 respectively.

2016/ARP002 - The Tidal Turbine
Reef (TTR) Feasibility Study
Advisian 10
Figure 3-5: Predicted tides for March at Karrakatta Bay (One Arm Point)
Figure 3-6: Predicted annual tides at Karrakatta Bay (One Arm Point)

2016/ARP002 - The Tidal Turbine
Reef (TTR) Feasibility Study
Advisian 11
3.2.2 Estimates of Current Speed
Measurements of current speed near Irvine Island (north-west of Cockatoo Island) were available
as plots, along with tidal stream harmonic analysis of the current data at several locations around
Irvine Island.
The profile and magnitude of current speeds are highly dependent on bathymetry. Bathymetry in
the area is very complex, with many bays, outcrops and inlets. This means no current data from
other locations can be applied directly to One Arm Point. However, tidal ranges and tidal cycles at
both locations will be similar due to their proximity. This means the current speed is likely to vary in
a similar way during a tidal cycle, and current speeds at neap tides will be significantly lower than
current speeds at high tides.
Based on the harmonic analysis of the current data near Irvine Island, a generic current speed time
series is generated and a scaling factor applied so the maximum current speed matches 8, 10 and
12 knots. Based on nautical charts, this is the expected maximum current in the area. No actual
current speeds indicated in charts or plots exist in Pearl Pass. Arrows on the chart south of the pass
indicate there is a jet current coming out and going into Pearl Pass, indicating strong currents.
Currents in nearby passes are strong at 10 knots, so there is a good chance it will be the same in
Pearl Pass. Ref [4,5].
The Ardyaloon website mentions that at spring tide the currents range from 12-18 knots. Ref [6].
This is very high and could be due to the pass being narrower or possibly a units mistake and
should be km/hr, making it more consistent with nearby passes.

2016/ARP002 - The Tidal Turbine
Reef (TTR) Feasibility Study
Advisian 12
Figure 3-7: Time series of one generic tidal cycle, scaled to three maximum current speeds (8, 10,
12 knots)

2016/ARP002 - The Tidal Turbine
Reef (TTR) Feasibility Study
Advisian 13
Figure 3-8: Histogram for annual current speeds based on maximum current

2016/ARP002 - The Tidal Turbine
Reef (TTR) Feasibility Study
Advisian 14
Figure 3-9: Predicted histogram of current speeds at One Arm Point
The following observations are noted on the current velocities:
▪ Variation in current speed along a tidal cycle follows the same pattern as the tidal elevation:
large at spring tide, small at neap tide
▪ While the maximum peak current speeds are expected to be strong, the current speed is less
than a third of the maximum current speed around 60% of the time
▪ At neap tide there are periods where expected peak current speed is relatively low (<1-2 m/s).
This could give a window for installation if this coincides with low wind speeds.
The current predictions are based on coarse assumptions. It is highly unlikely that current speed
time series at One Arm Point will look exactly like Figure 3-7. The magnitude could be different as
well as the profile. Ebb-flood tides could be of the same order of magnitude, but could just as well
be asymmetric (for example, flood current could be significantly stronger than ebb current).
However, two items are likely to be realistic: the pattern of spring-neap variation in the ebb and
flow, as well as the semidiurnal tides (two flood and ebb cycles per day) most of the time.

2016/ARP002 - The Tidal Turbine
Reef (TTR) Feasibility Study
Advisian 15
Installation Current Speeds
Currents for TTR installation should be based on neap tides. Operations that may take up to
24 hours should be designed for current speeds of 2 m/s, while temporary operations of 1-2 hours
could target current speeds as low as 0.5 m/s. See Figure 3-10 for current speeds over a neap tide.
Figure 3-10: Current speeds during a neap tide based on a maximum current of 10 knots
3.2.3 Waves
The bathymetry in the area is complex. To properly assess wave conditions on site, there would
need to be modelling combined with a measurement campaign to calibrate the model. Below are
some observations using high level assumptions:
▪ The Kimberley coastline is usually exposed to relatively low wave energy, except during
cyclones.
▪ The area around One Arm Point is very well protected against waves at low tide, with shoals
giving protection from all directions except south-west and south-east. From these two
directions, waves can only get in through a fairly narrow channel.
▪ With the large tidal range, the shelter shoals provide from northerly waves decreases
significantly at high tide. Higher waves are expected to occur at high tides, for relatively short
durations (in the order of hours). There is good protection from westerly and easterly waves at
all tides.
▪ One Arm Point is very protected from ocean swell, and no significant waves are usually
expected to penetrate from the ocean side.
▪ High current velocities will have a significant impact on the wave climate. Generally waves
going against currents make for steeper waves (breaking faster), whereas waves going in the
same direction as currents lower the wave height. These interactions are quite complex and
should be studied further if wave forces are a potential issue.
Expected wave heights based on high level assumptions:
Northerly direction: Offshore wave heights in cyclones can exceed 10 m. The many shoals north
of One Arm Point provide protection. Exact bathymetry of the shoals is not marked on the nautical
charts. If we assume the shoals are 3 m above chart datum (CD), the wave heights will be limited by
0
0.5
1
1.5
2
2.5
3
03-Apr-17 04-Apr-17 04-Apr-17 05-Apr-17 05-Apr-17
Sp
eed
(m
/s)

2016/ARP002 - The Tidal Turbine
Reef (TTR) Feasibility Study
Advisian 16
depth. At a certain depth, waves will break and the wave height will decrease as energy is
dissipated.
▪ Low tide: no waves will penetrate
▪ High tide: following rules of thumb (breaking wave height ≈ 0.8 x depth), at high tide (8 m CD)
water depth would be 5 m, resulting in waves of approximately 4 m.
Southerly directions:
▪ Fetch from south-west: 30 km. 30 m/s wind could generate waves with Hs=4.5 m and Tp=5.5 s
▪ Fetch from south-east: 100 km. 30 m/s wind could generate waves with Hs=7 m and Tp=8 s.
This seems unrealistic and will need further investigation.
▪ Low tide limits waves by a depth of 3 m below CD. Hs=2.3 m.
▪ High tide (8 m) limits waves by a depth of 9 m. This is larger than what could be generated in a
100 km fetch, so is unlikely to happen.
Installation seas: To establish wave conditions for installation, it is safe to assume there will be no
swell coming in from the ocean and waves at One Arm Point will be locally generated.
▪ For all directions except southerly (120-200), fetch is limited to approximately 5 km at high tide
and much less at low tide
▪ Using wind data from Broome and assuming it is representative of One Arm Point, the wind
speed is below 5 m/s 40% of the time
▪ A 5 km fetch at 5 m/s results in waves with Hs in the order of 0.2 m-0.3 m in open water and a
peak period of <2 s.
Based on the above, we can say it is likely to find waves of 0.2-0.3 m or less for 40% of the time.
For the rest of the time, waves could still be within that range, because fetches are much smaller
than 5 km for easterly and westerly directions (1 km). For this, fetch wind speeds of 10 m/s are
needed to generate 0.3 m waves.
3.2.4 Sea Level
Besides tidal elevation, the location sea level will be affected by:
▪ Storm surge: as a general rule, a Category 5 tropical cyclone can generate a barometric surge
of 0.5-1 m
▪ Sea Level Rise: guidelines indicate an expected 50-year sea level rise (2070) of around 0.4 m.
Ref [6].
3.3 Concept Description
3.3.1 Power Output Required
To power the community, the TTR device is designed to accommodate eight turbines. Each turbine
has a maximum power output of 70 kW. In the first phase of the project, it was found that for
2016/ARP002 - The Tidal Turbine
Reef (TTR) Feasibility Study
Advisian 17
currents with a maximum greater than 4 m/s, the turbines can be expected to have a capacity
factor of 0.5. Ref [1]. Eight turbines will produce an average monthly energy output of 280 kW and
an annual energy output of 2452 MW. Currently Horizon Power produces 1770 kWh of power for
the Ardyaloon community from diesel generators. Ref [2]. The eight turbines will produce
approximately 40% more energy annually than the community would need, allowing for downtime
of the turbines and inefficiency in storage systems and transmission.
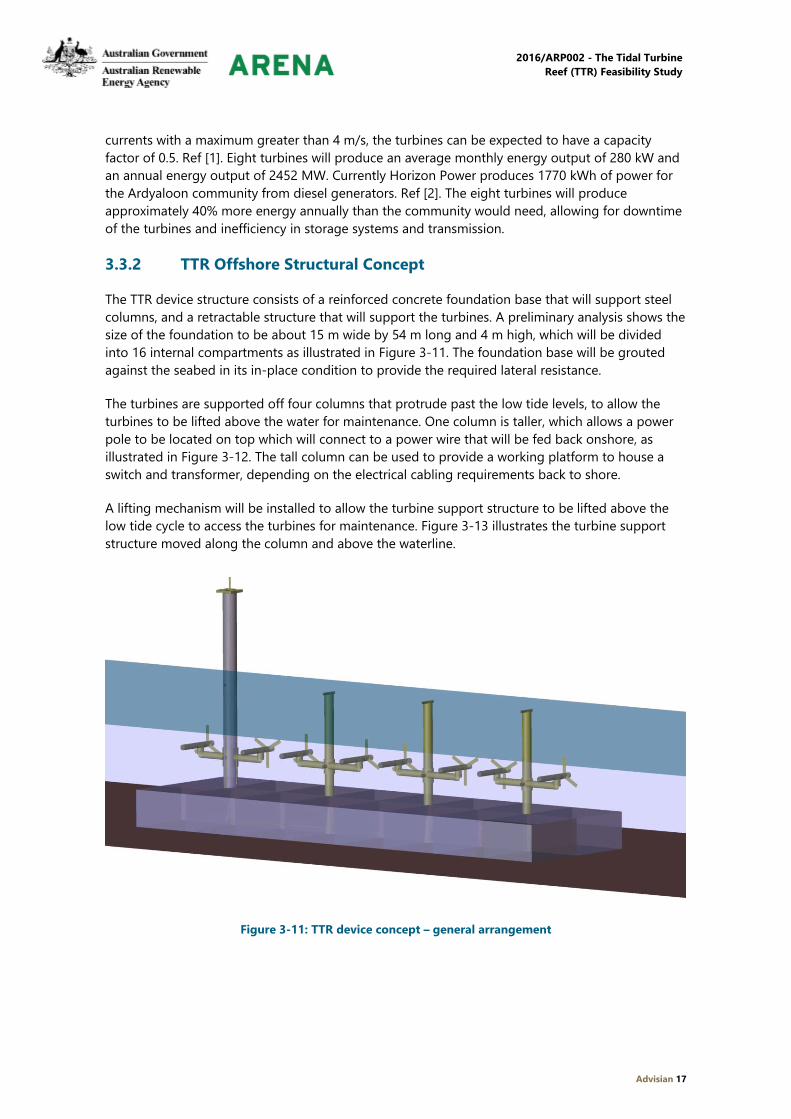
3.3.2 TTR Offshore Structural Concept
The TTR device structure consists of a reinforced concrete foundation base that will support steel
columns, and a retractable structure that will support the turbines. A preliminary analysis shows the
size of the foundation to be about 15 m wide by 54 m long and 4 m high, which will be divided
into 16 internal compartments as illustrated in Figure 3-11. The foundation base will be grouted
against the seabed in its in-place condition to provide the required lateral resistance.
The turbines are supported off four columns that protrude past the low tide levels, to allow the
turbines to be lifted above the water for maintenance. One column is taller, which allows a power
pole to be located on top which will connect to a power wire that will be fed back onshore, as
illustrated in Figure 3-12. The tall column can be used to provide a working platform to house a
switch and transformer, depending on the electrical cabling requirements back to shore.
A lifting mechanism will be installed to allow the turbine support structure to be lifted above the
low tide cycle to access the turbines for maintenance. Figure 3-13 illustrates the turbine support
structure moved along the column and above the waterline.
Figure 3-11: TTR device concept – general arrangement

2016/ARP002 - The Tidal Turbine
Reef (TTR) Feasibility Study
Advisian 18
Figure 3-12: TTR device in its in-place condition during low and high tide
Figure 3-13: Turbines lifted above the water for maintenance
(a) LAT condition (b) HAT condition
Turbine support structure lifted
above the water to allow access
for maintenance
2016/ARP002 - The Tidal Turbine
Reef (TTR) Feasibility Study
Advisian 19
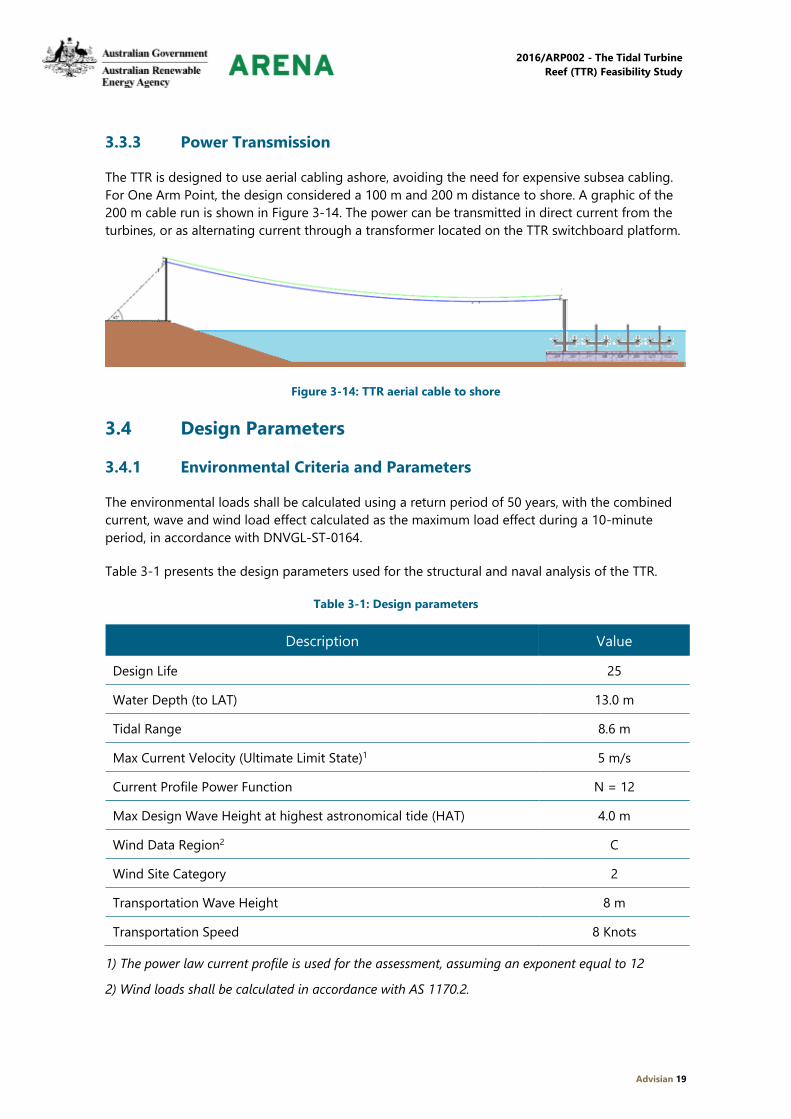
3.3.3 Power Transmission
The TTR is designed to use aerial cabling ashore, avoiding the need for expensive subsea cabling.
For One Arm Point, the design considered a 100 m and 200 m distance to shore. A graphic of the
200 m cable run is shown in Figure 3-14. The power can be transmitted in direct current from the
turbines, or as alternating current through a transformer located on the TTR switchboard platform.
Figure 3-14: TTR aerial cable to shore
3.4 Design Parameters
3.4.1 Environmental Criteria and Parameters
The environmental loads shall be calculated using a return period of 50 years, with the combined
current, wave and wind load effect calculated as the maximum load effect during a 10-minute
period, in accordance with DNVGL-ST-0164.
Table 3-1 presents the design parameters used for the structural and naval analysis of the TTR.
Table 3-1: Design parameters
Description Value
Design Life 25
Water Depth (to LAT) 13.0 m
Tidal Range 8.6 m
Max Current Velocity (Ultimate Limit State)1 5 m/s
Current Profile Power Function N = 12
Max Design Wave Height at highest astronomical tide (HAT) 4.0 m
Wind Data Region2 C
Wind Site Category 2
Transportation Wave Height 8 m
Transportation Speed 8 Knots
1) The power law current profile is used for the assessment, assuming an exponent equal to 12
2) Wind loads shall be calculated in accordance with AS 1170.2.

2016/ARP002 - The Tidal Turbine
Reef (TTR) Feasibility Study
Advisian 20
3.4.2 Marine Growth
The structural analysis shall include the effects of marine growth that can impact the
cross-sectional dimension and alter the hydrodynamic coefficients of structures that are
submerged or in the splash zone. It is assumed the columns used to support the turbines will be
periodically cleaned of all soft marine growth during maintenance. Therefore, in lieu of site-specific
marine growth data, it is assumed that a one-year marine growth profile of 50 mm with a
submerged density of 250 kg/m³ from the mudline to mean seal level shall be used for the
structural assessment.
3.4.3 Corrosion Allowance
A corrosion allowance shall be applied to structural steel members in the splash zone. In lieu of
more accurate data, a corrosion allowance of 5 mm shall be used.
The splash zone is defined between elevations EL(+) 9.0 m and EL(-) 1.0 m as estimated using the
rules in DNV-OS-C101.
More accurate corrosion allowances may be calculated in accordance with AS 4997, section 6.4.4.7,
once a design life is confirmed.
Corrosion protection would be required to meet the necessary design life. Protection can be
obtained by using anodes to provide cathodic protection in the submerged zone, and specialised
coating systems to provide protection in the splash zone. A painting system in the submerged
zone may be used and should be considered in the next phase.
3.5 Seabed Properties
For the concept development and analysis work completed in this phase, it is assumed the seabed
will mainly comprise fairly smooth rock, as the high tidal current velocity will most likely wash all
loose and light particles away. It is assumed a location will be available that will be reasonably flat
to lay the TTR device. For the stability and foundation analysis, the following properties shall be
assumed:
▪ Friction coefficient between concrete and seabed µ = 0.35
▪ Seabed bearing pressure = 250 kPa
▪ Grout shear transfer strength = 100 kPa
▪ Geotechnical reduction factor on grouted connection = 0.5.
3.6 Structural Design Parameters
The concept will be based on a structure that is fixed to the seabed as a gravity based solution, or
using a grout connection between the underside of the base and seabed rock. The structural
concept will assume the material properties as described in Table 3-2.

2016/ARP002 - The Tidal Turbine
Reef (TTR) Feasibility Study
Advisian 21
Table 3-2: Material parameters
Description Symbol Value
Concrete Density ρc 2400 kg/m³
Concrete Elastic Modulus Ec 25 GPa
Concrete Poisson Ratio νc 0.2
Concrete Characteristic Compression Strength fcr 40 MPa
Steel Density ρc 7850 kg/m³
Steel Elastic Modulus Es 200 GPa
Steel Poisson Ratio νs 0.3
Steel Yield Strength Fy 350 MPa
Grout Density ρc 1900 kg/m³
2016/ARP002 - The Tidal Turbine
Reef (TTR) Feasibility Study
Advisian 22
4 Fabrication and Installation Methodology
4.1 Fabrication Methodology
During this concept development phase, WorleyParsons and Civmec have discussed the methods
of fabricating the proposed TTR device concept. Civmec has developed a fabrication plan of the
proposed TTR device structure and explored various forms of fabrication methods for the
proposed TTR and for alternative materials. The following sections summarise Civmec’s fabrication
plan.
Appendix A contains concept drawings of the proposed TTR device structure, along with
fabrication details to illustrate the construction philosophy.
4.1.1 Comparison of Concrete Construction Methods
Each of the alternative concrete construction methods would require the base slab to be cast
in-situ. Permanent roof soffit panels with an in-situ topping would obviate the need for roof soffit
falsework.
The walls could either be precast or cast in-situ. In either case, making the compartments square in
plan would allow the formwork to be used more efficiently.
The project duration will be inversely proportional to the number of formwork panels used.
However, for this proposed scheme, the construction schedule was not considered to be a factor.
Each of these relationships is assessed further below.
The actual construction method is described in Section 4.1.2.
In-Situ Formwork Panel Cost/Reuse
For both in-situ and precast methods, there is an inverse relationship between the material costs
and the number of re-uses of formwork. The cost of the formwork material and fabrication are
inversely proportional to the number of re-uses achieved.
The labour cost of fixing and stripping the formwork will be the same, irrespective of the number
of wall forms that are used. The number of re-uses of formwork is usually determined by the
quality of finish required. In the case of the TTR support structure, neither face of the walls is visible
so this is not a relevant factor.
Amending the design to make the internal dimensions of the chambers square in plan would
maximise the potential for formwork re-use, thereby slightly reducing the construction costs.

2016/ARP002 - The Tidal Turbine
Reef (TTR) Feasibility Study
Advisian 23
In-Situ versus Precast Formwork
These relationships will vary considerably depending on the relative heights and thicknesses of the
walls being assessed.
Calculating from 1st principles for these particular walls, the in-situ formwork accounts for around
50% of the total cost, and the reinforcement and concrete each account for approximately 25%.
Pre-casting the walls face-down would not alter the quantities of either concrete or reinforcement
as, whichever construction technique is used, they need to resist the hydrostatic loads from
floating and flooding of the TTR support structure.
The area and complexity of formwork required to precast the panels face-down will minimise the
formwork cost, as there are minimal hydrostatic loads or access to be considered. The precast wall
option is approximately 75% of the cost of constructing walls in-situ.
There are additional costs in tilting-up the precast panels, propping and grouting them into the
vertical position. That cost is around 20% of the precast total.
In-Situ Formwork Panel versus Duration
For either in-situ or precast construction, the project duration will be inversely proportional to the
number of formwork panels used and directly proportional to the number of formwork re-uses.
However, for this proposed scheme, the construction schedule was not considered to be a factor.
4.1.2 Proposed Construction Method
Base Slab
The base slab will be cast in-situ on an elevated casting bed. This is to allow self-propelled modular
transporters (SPMTs) to drive under the base, raise it off the casting bed, and transport it to the
floating dock for launching/towing to site, as illustrated in Figure 4-1.
Traditional plywood formwork panels will be used around the perimeter and strutted externally.
The internal wall kicker (~150 mm high) will be hung (cantilevered) from the edge formwork.
Reinforcement steel will be supplied cut and bent, and prefabricated in sections to expedite the
construction.

2016/ARP002 - The Tidal Turbine
Reef (TTR) Feasibility Study
Advisian 24
Figure 4-1: Self-propelled modular transporters
The complete TTR support structure weighs about 2,500 tonnes (Te). Multiple SPMTs, each able to
carry ~200 Te, are hydraulically interlinked so the load is raised simultaneously.
The elevated casting bed will comprise three longitudinal upstand beams running lengthwise, with
removable soffit formwork between them. Once the TTR is ready for launching, the SPMTs will
travel underneath it – between the beams – and raise the floor hydraulically.
The SPMTs will then carry the TTR support structure to the floating dock for launching.
Wall Construction
Considering the factors discussed in Section 4.1.1 above, Civmec proposes to employ a
combination of in-situ and precast wall construction methods as shown in Figure 4-2.
Figure 4-2: Wall construction
The water-tightness of the joint between the in-situ cast base slab and perimeter walls will be
ensured by casting a proprietary water-bar in the middle of the wall, spanning across the
construction joint.

2016/ARP002 - The Tidal Turbine
Reef (TTR) Feasibility Study
Advisian 25
We have retained the even number of internal chambers to simplify the internal walls and
infill/stitch panels required.
Precast walls will be used internally. These will be propped and grouted into rebates in the slab
floor, and locked in place with the mast infill/stitch pours.
A proprietary formwork system will be used for the in-situ walls, incorporating work platforms to
place concrete. The inner form would be erected first to support the wall reinforcement, and the
outer form fixed once the reinforcement has been completed and inspected.
A 75 Te mobile crane will be used to install prefabricated reinforcement cages, formwork and
precast wall panels.
Due to the relatively small quantity of concrete per wall, either multiple walls would be cast
simultaneously to maximise pump utilisation, or the crane and kibble would be used to maintain
turnover of formwork.
Roof Slab
The roof slab will be constructed using composite precast soffit panels with an in-situ concrete
topping. The precast panels act as permanent formwork and do not need to be removed.
Masts/Steel Columns
The masts, collar slides and turbine support arms would be fabricated from stockist-supplied
tubular steel.
After fabrication and painting, the mast would be inserted into the concrete sockets in the centre
of the TTR support structure, then grouted into place.
The turbines would be fixed onto their cross-arms before the assembly is lifted onto the mast.
Commissioning
It would be better to perform these activities before launching to eliminate any issues with working
‘over water’.
Civmec would facilitate others in commissioning and testing the turbines.
Launching
Once commissioning is completed, the TTD will be transported by multiple SPMTs to the floating
dock adjacent to the prefabrication area. The main characteristics of the floating dock are:
▪ Max width 41.8 m
▪ Max length 102.3 m
▪ Max vessel draught 9.2 m
▪ Lifting capacity 12,000 t.

2016/ARP002 - The Tidal Turbine
Reef (TTR) Feasibility Study
Advisian 26
Equipment/Resources
Both the concrete and steel options would use standard techniques for the respective materials –
welding, or formwork and reinforcement.
Using an elevated bed and the SPMTs enables the prefabricated TTR support structure (steel or
concrete) to be moved to the floating dock for launching.
This eliminates the construction of temporary dry docks or having to construct in-situ.
4.1.3 Steel versus Concrete Foundation Base
In Phase 1A, the project based its design on a steel foundation. Upon review, it was shown to be
cheaper to change to concrete for fabrication, and the increased weight would benefit the in-place
load restraint condition. Through further development of the concept design, the concrete base
doubled in size from the initial estimate, and its final in-place condition relies on the bond of grout
to seabed instead of weight.
It appears that a steel base may be in the same price range as the concrete base, but there are still
engineering questions that would need to be answered and costed, such as:
▪ How after installation the steel base remains in place before the grout sets
▪ How the overturning is resisted given the lack of weight
▪ What the long-term price is for corrosion resistance.
4.1.4 Power Cables to Shore
An onshore construction campaign will be required out of Broome to run standard power poles
and conductor wire 1.5 km to the town site from the shore of the turbine farm. At the shore end of
the traditional power cable run, a large foundation, two guidewires and large steel pole will need
to be constructed to receive the offshore conductors.
4.1.5 Mooring
Before the TTR arrives onsite, four onshore anchor points for the moorings will need to set by the
offshore contractor. Assuming the area is rock, the basis is that a hand-held pneumatic rock drill
will be used to drill 600 mm deep holes to receive M36 chemical bolts. The bolts will be used to
hold down a plate with a suitably sized bollard. If the rock is not level enough, a concrete
foundation may need to be poured. The bolts can be used to resist the bollard load through shear
or by tension and friction connection of the plate.
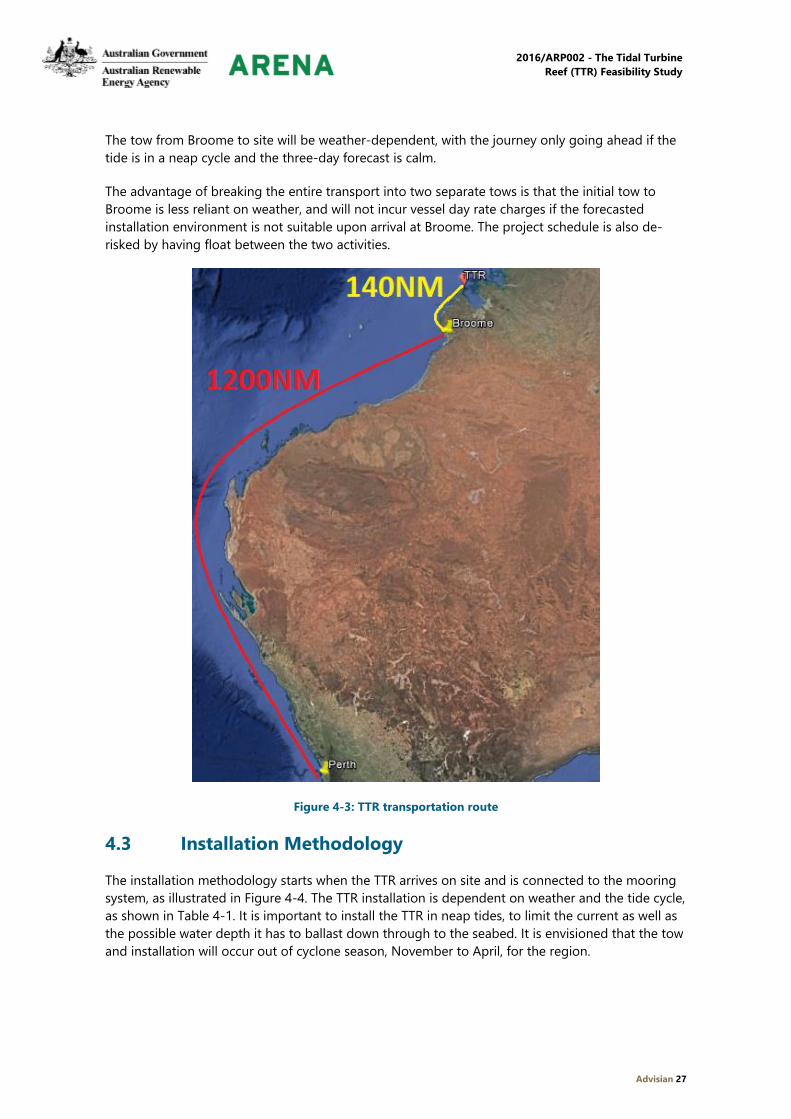
4.2 Transportation Methodology
The TTR device is designed to be towed by a single tug from the fabrication site in Perth to
Broome, where it will be temporarily moored until the installation contractor tows the TTR the
short distance to One Arm Point for installation. Refer to Figure 4-3. The tow from Perth to Broome
is expected to take ten days and requires a single tug with 2200 brake horsepower.
2016/ARP002 - The Tidal Turbine
Reef (TTR) Feasibility Study
Advisian 27
The tow from Broome to site will be weather-dependent, with the journey only going ahead if the
tide is in a neap cycle and the three-day forecast is calm.
The advantage of breaking the entire transport into two separate tows is that the initial tow to
Broome is less reliant on weather, and will not incur vessel day rate charges if the forecasted
installation environment is not suitable upon arrival at Broome. The project schedule is also de-
risked by having float between the two activities.
Figure 4-3: TTR transportation route
4.3 Installation Methodology
The installation methodology starts when the TTR arrives on site and is connected to the mooring
system, as illustrated in Figure 4-4. The TTR installation is dependent on weather and the tide cycle,
as shown in Table 4-1. It is important to install the TTR in neap tides, to limit the current as well as
the possible water depth it has to ballast down through to the seabed. It is envisioned that the tow
and installation will occur out of cyclone season, November to April, for the region.

2016/ARP002 - The Tidal Turbine
Reef (TTR) Feasibility Study
Advisian 28
Table 4-1: TTR mooring and installation environment limitations
Parameter Limit
Wave Hs=0.3 m Tp<3 s
Wind 10 m/s (3 sec gust)
Tidal Range 2 m
Mean Sea Level 15 m
Maximum Current 2 m/s
Figure 4-4: TTR installation mooring configuration
The installation mooring system is designed so the TTR can keep station while ballasting setup is
occurring and awaiting the correct tide conditions. The mooring system allows to accurately locate
the TTR using an onshore winch and the winch on the installation vessel, shown in Figure 4-4.
The TTR is installed by flooding the rear two stern tanks until initial seabed touch down occurs.
Two more tanks are then flooded in the bow until it is fully on the seabed (refer Figure 4-5). All
tanks are then flooded to ensure the TTR has enough self-weight to remain in place in a moderate
environment.

2016/ARP002 - The Tidal Turbine
Reef (TTR) Feasibility Study
Advisian 29
Figure 4-5: TTR ballast sequence
The flooding of the TTR is controlled using pneumatic valves with lines running back to the
installation vessel. The entire ballast procedure will have redundant control through multiple
valves, lines and alternative flood tank options. The installation has considered the required
stability, strength and contact energy to ensure the approach is robust.

2016/ARP002 - The Tidal Turbine
Reef (TTR) Feasibility Study
Advisian 30
Foundation Installation
The TTR will be installed with timber cribbing on the base of the structure that lines up with
longitudinal and transverse bulkheads, as illustrated in Figure 4-6. The timber cribbing will help
settle the structure on an uneven seabed. The cribbing will be de-formed and take the shape of the
seabed imperfections.
Figure 4-6: Timber cribbing and grout bags under base of TTR structure
Once the TTR is positioned on the seabed and grout lines from shore to the TTR control tower are
run, grout is initially injected into skirting bags along the parameter of the base of the TTR to
create a seal with the uneven rocky seabed. Once the grout bags are filled, the internal cavity
created is then filled with grout, creating a bond between the rocky seabed and the cement base
of the TTR. After grouting, the final electrical cables are run and the turbines engaged.
Base of foundation divided into four
chambers for grouting
Timber cribbing (pink) lines up with
longitudinal and transverse bulkheads as
shown
Grout bags (blue) to form a skirt seal after
set-down to create sealed chamber for grouting

2016/ARP002 - The Tidal Turbine
Reef (TTR) Feasibility Study
Advisian 31
5 Operating and Maintenance Methodology
5.1 Turbine Maintenance
The SCHOTTEL instream turbine (SIT) requires a six-monthly inspection and fluid top-up. The
design life of components varies between five and twenty years. Components subjected to wear
are designed for five years, whereas components like the housing are designed for 20 years. A
maintenance plan is shown in Table 5-1.
Table 5-1: Maintenance plan
Period Type of
Maintenance
Effort
Six
months
Regular
inspection at
site
Dry components:
▪ Inspection of electrical components (removing dirt and
contamination)
▪ Inspection of any critical installations of electronics (are all
screws tightened?).
Submerged components:
▪ Cleaning with steam cleaner, removal of marine growth
▪ Inspection of corrosion protection system
▪ Optical inspection of all turbines, blades, etcetera
▪ Checking of lube oil level and magnetic plugs, taking of
samples.
Five years Overhaul ▪ Workshop inspection and exchange of worn parts such as
brake disks, bearings, dynamic and static sealings, liner and
gear box
▪ New lube oil filling
▪ Test run after assembly
▪ Refurbishment of corrosion protection system.
5.2 Turbine Retrieval
The TTR was designed with the turbine support structure (as illustrated in Figure 5-1) attached
onto a sleeve that fits around the steel columns (masts), which allows the support structure to be
lifted.
The turbine support structure is lifted using chains/wire that is pre-attached to a lifting beam atop
the steel columns. Figure 5-2 shows the lifting beam and chains, and illustrates the turbine at the
operating and maintenance positions. The chains can be accessed with a small working boat that
would attach a chain block or winch system that could connect to the pre-slung chain. The concept
allows for two lifting points to control the movement of the structure without rotating and
jamming up onto the column.

2016/ARP002 - The Tidal Turbine
Reef (TTR) Feasibility Study
Advisian 32
The dry weight of the turbine support structure (includes turbines, and dry weight of the structure
and marine growth) is estimated at about 14 tonnes, with a submerged weight of about 8 tonnes
(accounts for the submerged weight of steel, and buoyancy in the tubular members and marine
growth). The lifting process is envisaged to be slow and would therefore generate minimal added
mass, due to displaced volume of water surrounding it and low velocities for increased weight due
to drag. Suitable equipment would be needed to lift the dry weight of the structure.
Figure 5-1: Turbine support structure and sleeve
Turbine support structure
Sleeve
Lifting points

2016/ARP002 - The Tidal Turbine
Reef (TTR) Feasibility Study
Advisian 33
Figure 5-2: Lifting system details
Pre-slung chain connecting
lifting beam and turbine
support structure
Turbines at the
maintenance position
Lifting beam
2016/ARP002 - The Tidal Turbine
Reef (TTR) Feasibility Study
Advisian 34
6 Electrical and Turbine Interface Design
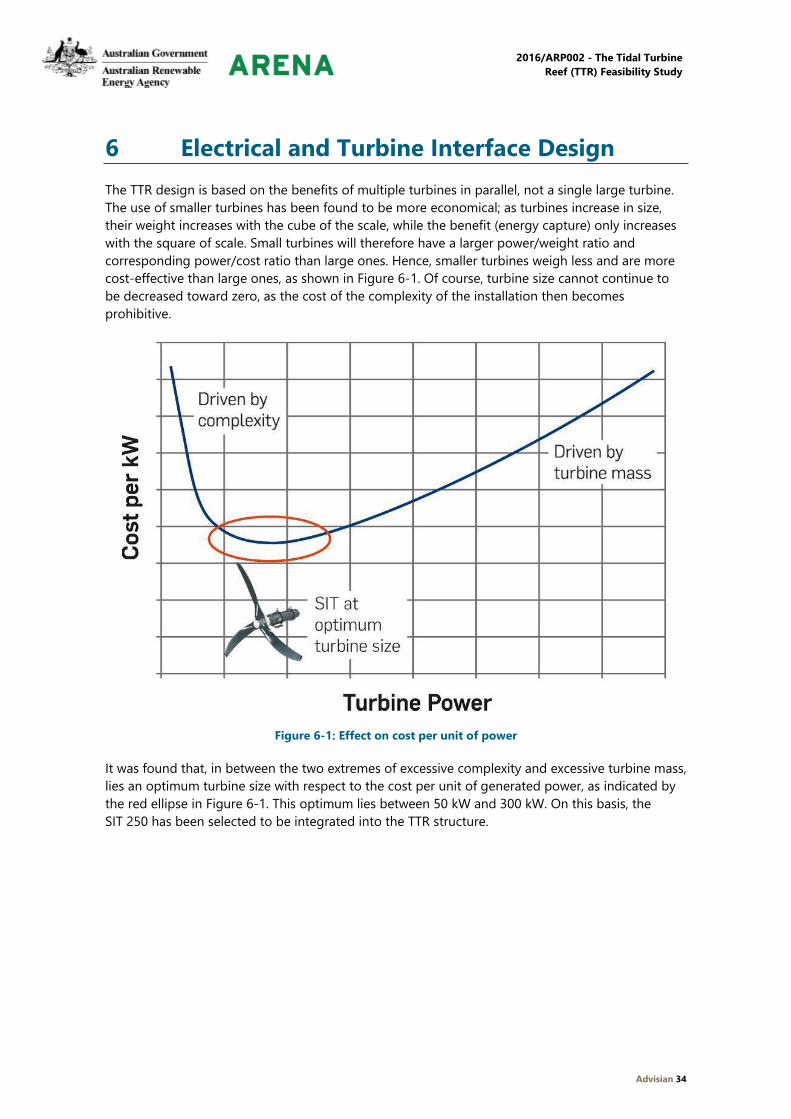
The TTR design is based on the benefits of multiple turbines in parallel, not a single large turbine.
The use of smaller turbines has been found to be more economical; as turbines increase in size,
their weight increases with the cube of the scale, while the benefit (energy capture) only increases
with the square of scale. Small turbines will therefore have a larger power/weight ratio and
corresponding power/cost ratio than large ones. Hence, smaller turbines weigh less and are more
cost-effective than large ones, as shown in Figure 6-1. Of course, turbine size cannot continue to
be decreased toward zero, as the cost of the complexity of the installation then becomes
prohibitive.
Figure 6-1: Effect on cost per unit of power
It was found that, in between the two extremes of excessive complexity and excessive turbine mass,
lies an optimum turbine size with respect to the cost per unit of generated power, as indicated by
the red ellipse in Figure 6-1. This optimum lies between 50 kW and 300 kW. On this basis, the
SIT 250 has been selected to be integrated into the TTR structure.

2016/ARP002 - The Tidal Turbine
Reef (TTR) Feasibility Study
Advisian 35
6.1 SIT Characteristics
For the TTR, an SIT 250 turbine with a 4 m diameter is proposed. The SIT is simple and robust,
without complex subsystems. It consists of a three-bladed rotor, planetary gearbox and
asynchronous generator, both cooled by the flow of ambient water (Figure 6-2).
Figure 6-2: SIT 250 4 m diameter
An SIT 250 shown in Figure 6-3 has a rated electrical power of 70 kW. The power train consists of:
▪ Three blades mounted to the hub (passive-adaptive)
▪ Slow running shaft including bearing and sealing system
▪ Two-stage planetary gearbox
▪ Induction generator
▪ Multidisc brake (hydraulically released).
Figure 6-3: STI 250 power to velocity curve
2016/ARP002 - The Tidal Turbine
Reef (TTR) Feasibility Study
Advisian 36
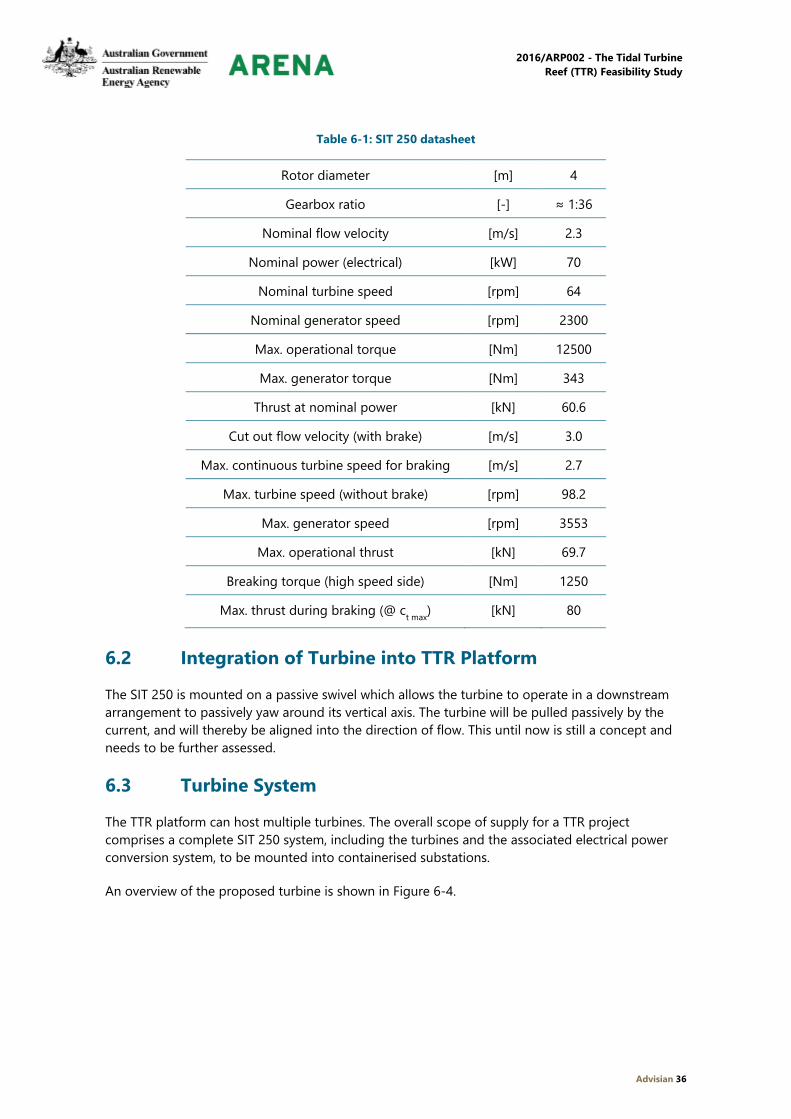
Table 6-1: SIT 250 datasheet
Rotor diameter [m] 4
Gearbox ratio [-] ≈ 1:36
Nominal flow velocity [m/s] 2.3
Nominal power (electrical) [kW] 70
Nominal turbine speed [rpm] 64
Nominal generator speed [rpm] 2300
Max. operational torque [Nm] 12500
Max. generator torque [Nm] 343
Thrust at nominal power [kN] 60.6
Cut out flow velocity (with brake) [m/s] 3.0
Max. continuous turbine speed for braking [m/s] 2.7
Max. turbine speed (without brake) [rpm] 98.2
Max. generator speed [rpm] 3553
Max. operational thrust [kN] 69.7
Breaking torque (high speed side) [Nm] 1250
Max. thrust during braking (@ ct max
) [kN] 80
6.2 Integration of Turbine into TTR Platform
The SIT 250 is mounted on a passive swivel which allows the turbine to operate in a downstream
arrangement to passively yaw around its vertical axis. The turbine will be pulled passively by the
current, and will thereby be aligned into the direction of flow. This until now is still a concept and
needs to be further assessed.
6.3 Turbine System
The TTR platform can host multiple turbines. The overall scope of supply for a TTR project
comprises a complete SIT 250 system, including the turbines and the associated electrical power
conversion system, to be mounted into containerised substations.
An overview of the proposed turbine is shown in Figure 6-4.

2016/ARP002 - The Tidal Turbine
Reef (TTR) Feasibility Study
Advisian 37
Lift
ing
eye
Ro
tor
Lip
sea
l sys
tem
Ro
tor
shaf
t b
eari
ng
2 s
tage
pla
net
ary
gear
bo
x
Gen
erat
or
Mu
ltid
isc
bra
ke
Bra
ke H
PU
Figure 6-4: Overview of the SIT 250
In reality, the thrust distribution over the rotor area is expected to be uneven. Hence, the thrust
force is considered to attack with an eccentricity regarding the rotational axis. The radius of the
thrust eccentricity circle is assumed to be one eighth of the rotor radius.
Figure 6-5 shows a single line diagram of the proposed electrical power conversion setup. As a first
estimation, the weight per SIT 250 for the entire power conversion equipment would be 232 kg
(including the transformer). Further, up to 20 turbines can be packaged into a single 20-foot
container.

2016/ARP002 - The Tidal Turbine
Reef (TTR) Feasibility Study
Advisian 38
=~
G1
=~
G2
=~
G3
=~
G4
=~
G16
=~
Grid Filter
=~
G17
=~
Grid Filter
=~
G18
=~
G19
=~
G20
=~
G32
Q1
Q3AIM 1
ALM 1
AIM 2
ALM 2
S17 S18 S19 S20 S32
Rec17 Rec32
S1 S2 S3 S4 S16
Rec1 Rec16
Q2
Q4
Auxiliaries
Auxiliaries
Step-Up Transformer
440V MV-Side
POI (Point Of Interconnection)
Figure 6-5: Single line diagram of power conversion system
2016/ARP002 - The Tidal Turbine
Reef (TTR) Feasibility Study
Advisian 39
7 Economic Modelling
An initial viability assessment was completed in Phase 1A, estimating cash flows and LCOE and
identifying key financial drivers. The LCOE analysis was based on an initial design concept and a
generic tidal site. Phase 1B has significantly advanced from Phase 1A, using a more detailed and
dynamic financial model, a revised tidal device solution, greater granularity of costs and a specific
site.
During Phase 1B, expense assumptions have been updated for the eight-turbine TTR device,
located off the coast of One Arm Point, Western Australia. An optional 16-turbine TTR device has
also been modelled for comparison. Cost associated with the 16-turbine device have been scaled
from the original single-row concept. Each scenario has been tested against three different
modelled generic resources, with a maximum current of 12 knots, 10 knots and 8 knots.
To accurately model the two scenarios, the ExceedenceFINANCE globally recognised marine
renewable energy techno-financial modelling software has been used.
This section provides a detailed overview of how the models have been developed, a comparison
to the wider tidal industry market (mainly in Europe) where suitable, and recommendations for
next steps.
7.1 Model Overview
ExceedenceFINANCE has been used to model the feasibility of the TTR. It is important to note that
the software has been reviewed and calibrated with Ernst & Young and Wave Energy Scotland.
The model has an intuitive workflow, illustrated by the flowchart in Figure 7-1. The technical
aspects of the model consist of location, resource and device selection. The financial aspects of the
model consist of CAPEX, OPEX and other financial inputs. The software then calculates the LCOE,
Internal Rate of Return (IRR) and NPV. Once outputs have been calculated, the Analysis Module can
be used to ask the all-important ‘what if’ questions by conducting a ‘goal seek’ or examining
parametric sensitivities.
The model contains a database of renewable locations together with technical information on
leading devices. The user can add to these databases by uploading their own location or device
information. The model then uses this information to calculate the amount of energy a particular
device will produce at a particular location.
The financial section allows the user to input all the costs associated with planning, installing,
commissioning, operating and decommissioning a marine renewable project.
By combining the financial information with the energy output data, the model produces a series
of cash flows for the entire duration of the project. It also calculates key financial metrics such as
NPV, LCOE, IRR and payback period. Other metrics are also available such as total power (MW),
annual energy delivered (MWh), CAPEX, OPEX, discounted payback period, equivalent annual
charge and NPV/MW.

2016/ARP002 - The Tidal Turbine
Reef (TTR) Feasibility Study
Advisian 40
Figure 7-1: Flow schematic techno-financial modelling methodology
7.2 Cost Summary
Costs have been summarised in detail and presented in Table 7-1. The total cost for the
eight-turbine TTR concept is AUD 8.8 million, which gives a cost of AUD 15.7 million per MW. In
contrast, the 16-turbine concept costs AUD 11.8 million, giving a cost of AUD 10.5 million per MW.
Table 7-1: Summary of tidal turbine estimates (rounded) in Australian Dollars Q4 2017 ±30%
Cost Type 8 Turbines 16 Turbines
Procurement 1,678,000 3,335,000
Fabrication 2,473,000 3,044,000
Transportation 309,000 309,000
Supply & Installation 730,000 730,000
Installation Onshore 229,000 229,000
Installation Offshore 173,000 173,000
Allowance 372,000 506,000
Indirect Costs 1,366,000 1,484,000
Contingency 1,466,000 1,962,000
TOTAL 8,795,000 11,771,000
Per Turbine 1,099,000 736,000
CAPEX per MW 15,682,550 10,494,396
OPEX per MW 632,790 436,625

2016/ARP002 - The Tidal Turbine
Reef (TTR) Feasibility Study
Advisian 41
With an exchange rate of 1.73 AUD = 1 GBP (17.01.2018), this means the eight- and 16-turbine
concepts cost about GBP 9.1 million and GBP 6.1 million per MW respectively. To put this in
perspective, the Meygen Phase 1A project costs about GBP 8.5 million per MW (CAPEX of GBP 51
million and 4*1.5 MW turbines). Ref [7].
7.3 Annual Delivered Energy
Once the location and power curve are selected, the annual energy production can be calculated,
including any losses in yield (e.g. availability). It is normal to include a loss of 3% in transmission via
the electrical cables, and an availability of 95%. Ref [8]. The model provides the total yield with no
losses, as well as the annual delivered energy which includes the losses. The latter is the more
important result, as it is key in determining the financial outcomes of the project. The resulting
yield and capacity factors are shown in Table 7-2.
Table 7-2: Annual delivered energy and capacity factor for the 8 and 16 TTR concepts
8 Turbines 16 Turbines
Maximum current speed 12 kn 10 kn 8 kn 12 kn 10 kn 8 kn
Transmission loss 3% 3%
Availability 95% 95%
Annual energy production (MWh) 1,397 1,326 960 2,794 2,651 1,921
Annual delivered energy (MWh) 1,287 1,222 885 2,575 2,443 1,770
Capacity factor 27.0% 25.6% 18.6% 27.0% 25.6% 18.6%
The capacity factors outlined in Table 7-2 are in line with current industry standards. The learning
rates across the sector indicate improvements as a result of operational time in ocean current
environments.
The resulting energy yields show that the best eight-turbine scenario will only cover 73% of the
required energy demand at One Arm Point. The 16-turbine scenario shows that all three resources
will cover the required energy demand, with the best resource producing 58% more than required.
The number of turbines should be chosen based on what level of energy demand is to be covered
or required. This will need to be balanced with the resulting LCOE, discussed in Section 7.7.
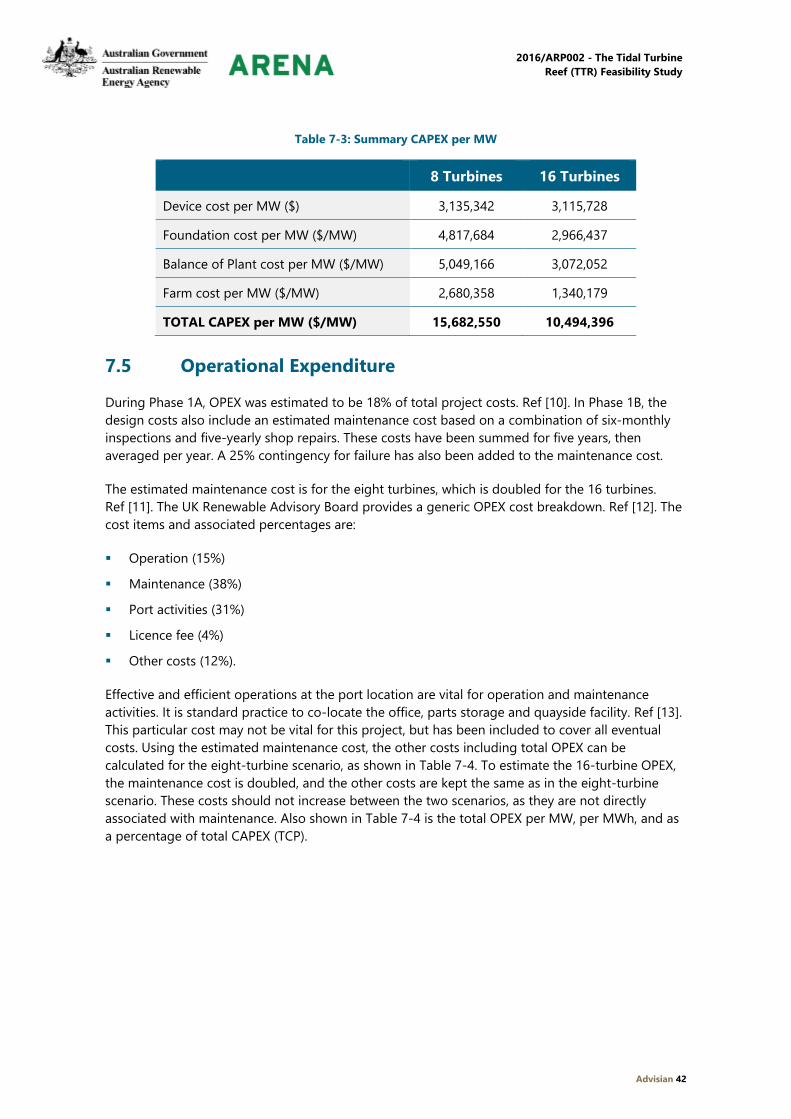
7.4 Capital Expenditure
The model calculates expense on a ‘cost per turbine’ basis, not per TTR device. The detailed costs
outlined in Section 7.2 have been manipulated to be per turbine. The costs for the eight and
16 turbines are shown in Table 7-3.
The cost per MW compares favourably with similar international projects such as the Meygen
project Phase 1A (AUD 14.7 per MW). To put this in the context of offshore wind, the median
CAPEX in 2015 was AUD 6.7 million per MW (GBP ~3.5 million per MW). Ref [9].
2016/ARP002 - The Tidal Turbine
Reef (TTR) Feasibility Study
Advisian 42
Table 7-3: Summary CAPEX per MW
8 Turbines 16 Turbines
Device cost per MW ($) 3,135,342 3,115,728
Foundation cost per MW ($/MW) 4,817,684 2,966,437
Balance of Plant cost per MW ($/MW) 5,049,166 3,072,052
Farm cost per MW ($/MW) 2,680,358 1,340,179
TOTAL CAPEX per MW ($/MW) 15,682,550 10,494,396
7.5 Operational Expenditure
During Phase 1A, OPEX was estimated to be 18% of total project costs. Ref [10]. In Phase 1B, the
design costs also include an estimated maintenance cost based on a combination of six-monthly
inspections and five-yearly shop repairs. These costs have been summed for five years, then
averaged per year. A 25% contingency for failure has also been added to the maintenance cost.
The estimated maintenance cost is for the eight turbines, which is doubled for the 16 turbines.
Ref [11]. The UK Renewable Advisory Board provides a generic OPEX cost breakdown. Ref [12]. The
cost items and associated percentages are:
▪ Operation (15%)
▪ Maintenance (38%)
▪ Port activities (31%)
▪ Licence fee (4%)
▪ Other costs (12%).
Effective and efficient operations at the port location are vital for operation and maintenance
activities. It is standard practice to co-locate the office, parts storage and quayside facility. Ref [13].
This particular cost may not be vital for this project, but has been included to cover all eventual
costs. Using the estimated maintenance cost, the other costs including total OPEX can be
calculated for the eight-turbine scenario, as shown in Table 7-4. To estimate the 16-turbine OPEX,
the maintenance cost is doubled, and the other costs are kept the same as in the eight-turbine
scenario. These costs should not increase between the two scenarios, as they are not directly
associated with maintenance. Also shown in Table 7-4 is the total OPEX per MW, per MWh, and as
a percentage of total CAPEX (TCP).

2016/ARP002 - The Tidal Turbine
Reef (TTR) Feasibility Study
Advisian 43
Table 7-4: Summary of OPEX costs
8 Turbines 16 Turbines
Maintenance 134,850 269,700
Operation 53,940 53,940
Port activities 110,009 110,009
Licence fee 13,485 13,485
Other costs 42,584 42,584
TOTAL OPEX 354,868 489,718
TOTAL OPEX per MW 632,790 436,625
TOTAL OPEX per MWh* 276; 290; 401 190; 200; 277
TOTAL OPEX as a % of TCP 4.0% 4.2%
* The three numbers refer to the resource at 12 knots, 10 knots and 8 knots respectively
The total OPEX per MW for both scenarios is in the lower half of the expected cost for an early tidal
array or first project as reported in IEA-OES, which estimates OPEX to between AUD 215,200 and
1,560,200 per MW when using the conversion rate 1 USD = 1.345 AUD (2015). Ref [14]. Wave
Energy Scotland currently suggests an OPEX between 2% and 6% of TCP, depending on the site.
Ref [15]. Both scenarios provide a good starting point at about 4% of TCP. Another way to view
OPEX is as a percentage of the lifecycle costs, which in this case puts OPEX for both scenarios at
about 30% of total project costs. This again is in line with current industry standards, which expect
OPEX for offshore wind projects to contribute between 20% and 30% of total lifecycle costs.
Ref [16].
However, the OPEX per MWh indicates there is room for some cost reduction. New offshore wind
farms to be commissioned in 2020 are estimated to have an OPEX cost of AUD 47 per MWh.
Ref [17]. The best case OPEX for the eight- and 16-turbine scenarios are six and four times more
than this. The wind energy industry however has the benefit of being more mature; the installed
capacity worldwide for offshore wind is more than 14 GW, and the industry has consistently
reduced costs through economies of scale and larger turbines. Ref [18,19].
7.6 Other Assumptions
The final inputs to the models are the discount rate, debt/equity ratio and the expected revenue.
The discount rate is set to 8%, as it would be expected to have a lower risk than wave energy,
which currently calculates LCOE using a 10% discount rate. Ref [15]. Both models also assume a
75/25 debt/equity ratio with a borrowing term of 20 years at a borrowing rate of 4%. The models
have not considered tax in the calculations, however this can be added into the model if required.
The revenue needed to achieve a positive NPV and credible IRR of 12% is found through the ‘goal
seek’ function, once the results of LCOE, NPV and IRR have been calculated.
2016/ARP002 - The Tidal Turbine
Reef (TTR) Feasibility Study
Advisian 44
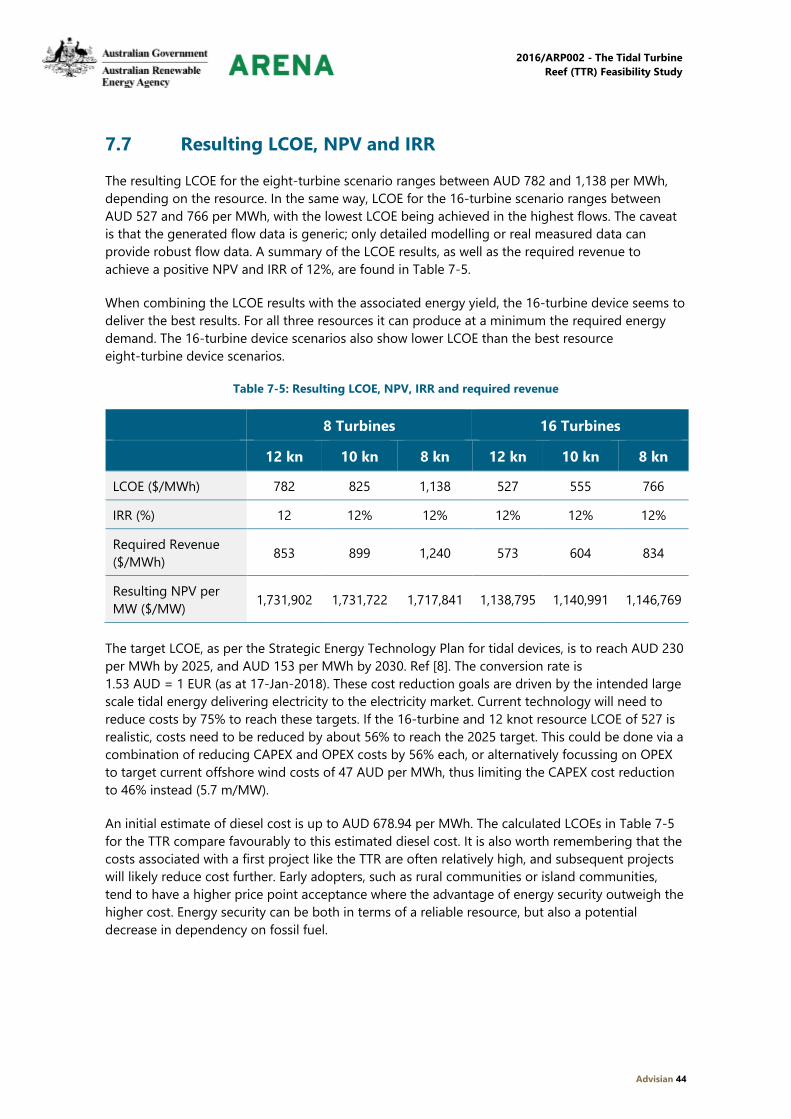
7.7 Resulting LCOE, NPV and IRR
The resulting LCOE for the eight-turbine scenario ranges between AUD 782 and 1,138 per MWh,
depending on the resource. In the same way, LCOE for the 16-turbine scenario ranges between
AUD 527 and 766 per MWh, with the lowest LCOE being achieved in the highest flows. The caveat
is that the generated flow data is generic; only detailed modelling or real measured data can
provide robust flow data. A summary of the LCOE results, as well as the required revenue to
achieve a positive NPV and IRR of 12%, are found in Table 7-5.
When combining the LCOE results with the associated energy yield, the 16-turbine device seems to
deliver the best results. For all three resources it can produce at a minimum the required energy
demand. The 16-turbine device scenarios also show lower LCOE than the best resource
eight-turbine device scenarios.
Table 7-5: Resulting LCOE, NPV, IRR and required revenue
8 Turbines 16 Turbines
12 kn 10 kn 8 kn 12 kn 10 kn 8 kn
LCOE ($/MWh) 782 825 1,138 527 555 766
IRR (%) 12 12% 12% 12% 12% 12%
Required Revenue
($/MWh) 853 899 1,240 573 604 834
Resulting NPV per
MW ($/MW) 1,731,902 1,731,722 1,717,841 1,138,795 1,140,991 1,146,769
The target LCOE, as per the Strategic Energy Technology Plan for tidal devices, is to reach AUD 230
per MWh by 2025, and AUD 153 per MWh by 2030. Ref [8]. The conversion rate is
1.53 AUD = 1 EUR (as at 17-Jan-2018). These cost reduction goals are driven by the intended large
scale tidal energy delivering electricity to the electricity market. Current technology will need to
reduce costs by 75% to reach these targets. If the 16-turbine and 12 knot resource LCOE of 527 is
realistic, costs need to be reduced by about 56% to reach the 2025 target. This could be done via a
combination of reducing CAPEX and OPEX costs by 56% each, or alternatively focussing on OPEX
to target current offshore wind costs of 47 AUD per MWh, thus limiting the CAPEX cost reduction
to 46% instead (5.7 m/MW).
An initial estimate of diesel cost is up to AUD 678.94 per MWh. The calculated LCOEs in Table 7-5
for the TTR compare favourably to this estimated diesel cost. It is also worth remembering that the
costs associated with a first project like the TTR are often relatively high, and subsequent projects
will likely reduce cost further. Early adopters, such as rural communities or island communities,
tend to have a higher price point acceptance where the advantage of energy security outweigh the
higher cost. Energy security can be both in terms of a reliable resource, but also a potential
decrease in dependency on fossil fuel.

2016/ARP002 - The Tidal Turbine
Reef (TTR) Feasibility Study
Advisian 45
7.8 Sensitivity Analysis
CAPEX and OPEX project estimates are in line with current industry norms for first projects; the
target LCOE for tidal is AUD 230 per MWh by 2025 and AUD 153 per MWh by 2030. To achieve
these targets, the current tidal technology will need to reduce costs by an average of 75%. Ref [8].
The best-case scenario (16-turbine and 12-knots) will need to reduce costs by about 55% and 70%
to reach the 2025 and 2030 targets respectively. Sensitivity has been analysed in two ways:
1. Cost projections using learning rates to a 1 GW cumulative installed capacity
2. A tornado chart detailing the key cost drivers in CAPEX and OPEX.
7.8.1 Project Curves
Learning can be expected between the first project and the nth project, where SI OCEAN uses 12%
tidal learning rates to push cost reduction curves toward a 1 GW cumulative installed capacity.
Ref [10]. The learning rate is applied for each doubling of capacity. Figure 7-2 shows the estimated
reduced cost based on the learning rate for the poorest and the best scenario, as well as the
average between the two. It also shows the 2025 and 2030 targets, as well as the current reference
LCOE as per JRC. Ref [8]. The current LCOE for tidal ranges between AUD 826 and 1,086 per MWh,
with the reference starting at AUD 949 per MWh. This reference is about 10% more than the
average LCOE for the scenarios detailed in this report. The best-case scenario shows it has the
potential to respectively reach the 2025 and 2030 targets at about 100 MW and 1 GW cumulative
deployment, by reducing the learning rate cost.
Figure 7-2: Cost project curves using learning rate 12% to a 1 GW cumulative deployment
0
200
400
600
800
1000
1200
1 2 4 8 16 32 64 125 250 500 1000
LC
OE A
UD
/MW
H
INSTALLED CAPACITY (MW)
8 turbine 8 knot Average 16 turbine 12 knot
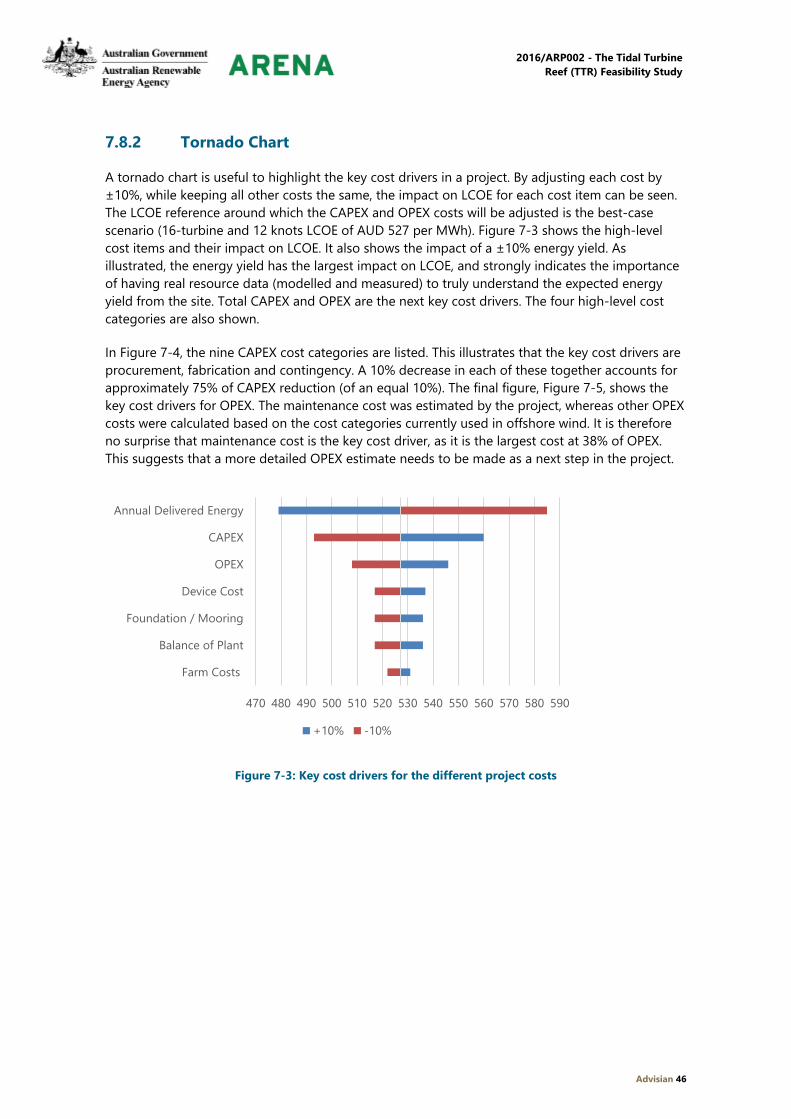
2016/ARP002 - The Tidal Turbine
Reef (TTR) Feasibility Study
Advisian 46
7.8.2 Tornado Chart
A tornado chart is useful to highlight the key cost drivers in a project. By adjusting each cost by
±10%, while keeping all other costs the same, the impact on LCOE for each cost item can be seen.
The LCOE reference around which the CAPEX and OPEX costs will be adjusted is the best-case
scenario (16-turbine and 12 knots LCOE of AUD 527 per MWh). Figure 7-3 shows the high-level
cost items and their impact on LCOE. It also shows the impact of a ±10% energy yield. As
illustrated, the energy yield has the largest impact on LCOE, and strongly indicates the importance
of having real resource data (modelled and measured) to truly understand the expected energy
yield from the site. Total CAPEX and OPEX are the next key cost drivers. The four high-level cost
categories are also shown.
In Figure 7-4, the nine CAPEX cost categories are listed. This illustrates that the key cost drivers are
procurement, fabrication and contingency. A 10% decrease in each of these together accounts for
approximately 75% of CAPEX reduction (of an equal 10%). The final figure, Figure 7-5, shows the
key cost drivers for OPEX. The maintenance cost was estimated by the project, whereas other OPEX
costs were calculated based on the cost categories currently used in offshore wind. It is therefore
no surprise that maintenance cost is the key cost driver, as it is the largest cost at 38% of OPEX.
This suggests that a more detailed OPEX estimate needs to be made as a next step in the project.
Figure 7-3: Key cost drivers for the different project costs
470 480 490 500 510 520 530 540 550 560 570 580 590
Farm Costs
Balance of Plant
Foundation / Mooring
Device Cost
OPEX
CAPEX
Annual Delivered Energy
+10% -10%

2016/ARP002 - The Tidal Turbine
Reef (TTR) Feasibility Study
Advisian 47
Figure 7-4: Key cost drivers for CAPEX divided into nine different cost categories
Figure 7-5: Key cost drivers for the OPEX cost categories
7.9 Key Findings
Based on the techno-financial analysis of the two TTR scenarios, the following key findings are
made:
1. The eight and 16 turbines have an estimated CAPEX of AUD 15.7 million and 10.5 million per
MW. This compares favourably with similar international projects such as the Meygen project
Phase 1A, which had a CAPEX cost of AUD 14.7 per MW. The median CAPEX cost for offshore
wind projects in 2015 was AUD 6.7 million per MW.
2. Current OPEX estimates are approximately 4% of total CAPEX, which is in line with what Wave
Energy Scotland is using in its OPEX estimates (between 2% to 6% depending on site).
490 500 510 520 530 540 550 560
Transport
Installation Onshore
Installation Offshore
Allowance
Supply & Install
Indirects
Contingency
Fabrication
Procurement
CAPEX
-10% +10%
505 510 515 520 525 530 535 540 545 550
Licence Fee
Other
Operation
Port Activities
Maintenance
OPEX
+10% -10%

2016/ARP002 - The Tidal Turbine
Reef (TTR) Feasibility Study
Advisian 48
3. The best case OPEX per MWh for the eight and 16 turbines are estimated at AUD 276 and 190
per MWh. Compared to offshore wind, with an average OPEX of AUD 47 per MWh, these are
six and four times higher. It should however also be noted that offshore wind has reached a
cumulative deployment of more than 14 GW.
4. The maintenance cost has been estimated within the project, with all other costs based on
OPEX breakdown (in percent) for offshore wind. Ref [11]. A next step should be to calculate a
bottom-up OPEX for the entire project to gain further confidence in the results.
5. The calculated LCOE for the eight and 16 turbines range from AUD 527 to 1,138 per MWh. The
current reference as quoted by the EU JRC is AUD 949 per MWh.
6. The European Strategic Energy Technology Plan has ambitious targets to achieve an LCOE of
AUD 230 per MWh by 2025 and AUD 153 per MWh by 2030. To achieve these targets, cost
reductions of up to 75% on current technology is required. For the best-case scenario
(16-turbine in the 12-knot resource), the costs will need to be reduced by at least 56%. It is
also expected that an improvement in the capacity factor combined with a confirmed tidal
resource will provide a good foundation for further development. It is believed the resource is
conservative. Combining this with a refined CAPEX (-30%) and a predetermined OPEX would
offer a unique opportunity for One Arm Point.
7. Cost projections show that with learning rates, the best-case scenario may reach the 2025 and
2030 targets at approximately 100 MW and 1 GW cumulative deployment respectively.
8. The best LCOE was garnered with 16 turbines in the 12-knot resource. This highlights the
importance of maximising power output and a good resource to achieve a strong LCOE.
9. Sensitivity analysis using tornado charts highlight the key drivers as energy yield, procurement,
fabrication and contingency. The key cost driver within OPEX was maintenance.
10. Even at this relative high LCOE for the electricity market, early adopters such as One Arm Point
may have a higher price point tolerance that outweighs the current cost of a tidal device.
Energy security, reliability and decreased fossil fuel dependency are but a few advantages of a
local tidal device.
11. Based on the generic tidal site, only the 16-turbine concept may produce enough power to
support the community at One Arm Point. The lowest resource shows energy yield to match
the energy demand, whereas the higher resources show energy yields of 40% to 60% more
than demand. The eight-turbine concept may only produce up to about 73% of the electricity
demand.
12. The availability of data is a significant limitation to the modelling. There is currently no data for
the chosen location. There are options for the next stage in terms of detailed numerical
modelling, but ideally physical measurement of the site would be conducted.
13. There are current plans to develop a Tidal Atlas for Australia. Once this is complete, the new
data can be used to update these techno-financial models.

2016/ARP002 - The Tidal Turbine
Reef (TTR) Feasibility Study
Advisian 49
8 Discussion (Opportunities)
8.1 Learnings
During the concept development, several key learning points were discovered. The points noted
below are based on a reinforced concrete TTR structure:
1. The foundation base length was found to be governed by the ‘sea-chesting’ installation
procedure, to ensure the TTR remains stable and the descent is controlled.
2. The designs of the floor, wall and roof thicknesses of the concrete panels are governed by the
hydrostatic pressure during the ‘sea-chesting’ installation procedure. As the weight of the
structure is relatively heavy compared to other materials, the TTR doesn’t require much
ballasting to lower to the seabed. As a result, most of the compartments within the foundation
base will be subject to the full head of hydrostatic pressure.
3. Although the length is required for ‘sea-chesting’ installation, if a shorter base is to be used
then the dimensions will be governed by damaged stability. The damaged stability can be
mitigated by increasing the height of the base, however, a higher base will increase in-place
loads.
4. Steel columns (masts) were governed by vortex induced vibrations (VIV). This is an issue for all
fixed tidal structures and becomes harder to solve as water depths increase.
5. The weight of the structure alone is not sufficient to resist the base shear caused by the large
(survival) tidal current lateral loads. As a result, a grout shear interface foundation system is
required to help resist the base shear that causes a sliding failure mode due to the more
extreme current velocities (>2 m/s). However, the overturning moment is resisted by relying on
the weight of the structure.
6. The grouting installation procedure was estimated to be effective in days, therefore the TTR
structure must remain in-place during a small tidal cycle that would be subject to smaller tidal
currents (assumed to be <2 m/s). The structure requires a certain amount of weight to remain
stable during this time under its self-weight (behaving as a gravity based structure). Therefore,
too much optimisation to reduce weight will be a disadvantage.
7. A significant portion of the lateral load was caused by the foundation base. The computational
fluid dynamics (CFD) analysis shows the load can be significantly reduced by rounding the
corners if required. Although this can be an advantage for reducing the load, it will impact the
fabrication cost.
8. This concept was developed for a water depth of 13.0 m (in respect to LAT) with a tidal cycle of
about 9 m. This concept may not be achievable in significantly deeper water, as the length of
the columns would increase and therefore increase the column diameter to avoid VIV
problems. This will then restart the design cycle, and could lead to another aspect governing
the design (i.e. overturning moment due to the increased height of the structure and load
generated from the columns, which will then demand more self-weight to keep stable in its
in-place condition).
9. Formwork for concrete is a significant contributor in the cost. The fabrication methodology
would need to investigate the impact on schedule to optimise the cost savings in re-using
formwork.

2016/ARP002 - The Tidal Turbine
Reef (TTR) Feasibility Study
Advisian 50
10. Power cable span of 200 m was found to be close to the conventional limit, without
introducing more complex taller structures or intermediate supporting structures across the
cable span.
11. The mooring loads are based on a small wave environment, but if the mooring system is stiff
or the environment is higher than assumed, loads will quickly grow to unmanageable levels.
12. The SCHOTTEL turbines considered for this project had limited customisation; they came with
either a 4 m or 6.3 m diameter rotor, meaning their power curves could not be completely
optimised to the site flow. For the slower end of the current speeds, the turbines did not
achieve maximum output; at the higher end of the current speeds, the turbines cut out,
producing no output.
8.1.1 Fabrication
The use of alternative materials to construct the foundation base was preliminarily investigated
during this phase. There are several advantages and disadvantages between a reinforced concrete
foundation base and a steel foundation base. The key learnings discovered during this phase were:
1. Preliminary screening showed reinforced concrete will be cheaper.
2. The use of steel would result in a lighter overall structure, so the issues surrounding the
sea-chesting installation method would be reduced, potentially reducing the length of the TTR
vessel. However, as pointed out above, there is a disadvantage with making the structure too
light as this would bring a challenge to the installation, particularly resisting the lateral loads
caused by a tide cycle during the installation period, which currently relies on a certain amount
of self-weight.
3. In addition to the installation period, the overturning moment is resisted by weight in the
structure, and therefore the weight in the structure would need to be built up once in place to
resist the in-place loads.
4. The de-ballasting control would be easier with a steel structure, given the reserve buoyancy
would be much larger. The reinforced concrete option doesn’t require a lot of ballast to sink
the tip of the structure to the seabed.
5. Reinforced concrete has its advantages in the marine environment compared to steel. The
durability in concrete can be controlled by providing adequate cover and limiting the stresses
in the reinforcement steel, where steel would require a significant increase in corrosion control.
This would need to be applied through specialised coatings or cathodic protection that would
significantly increase the maintenance required throughout the life of the structure.
6. Turbine integration onto a swivel is not an off-the-shelf item. Further work is required to fully
understand the functionality of a swivel and wiring.
7. It has been found that using smaller turbines is more economical; as turbines increase in size,
their weight increases with the cube of the scale while the benefit (energy capture) only
increases with the square of scale.

2016/ARP002 - The Tidal Turbine
Reef (TTR) Feasibility Study
Advisian 51
8.2 Opportunities
There are several points worth noting as key opportunities that have been discovered during this
phase:
1. The current concept is for a single row of turbines. If a slightly deeper location was used, a
second row of turbines can be added which will have a marginal impact on costs. The
installation cost will be almost negligible and the fabrication cost will be marginal, as the
increase in the foundation base will most likely be insignificant. Some parameters of the design
would need to change. For example, the diameter of the mast would need to be larger to
combat the VIV requirements. The significant aspects of a two-row system that would be
required are the additional masts and fit-out to accommodate more turbines.
Figure 8-1 shows a two-row system in water 17 m deep.
Figure 8-1: Two row system TTR device structure
2016/ARP002 - The Tidal Turbine
Reef (TTR) Feasibility Study
Advisian 52
2. As per Civmec’s improvements, the compartments can be designed square to reuse formwork
to reduce fabrication cost.
3. Further refinement of the turbine design may allow the power curve to get more out of the
high speed currents.
8.3 Risks
The key risks of this concept are as follows:
1. Assumptions made in this report are conservative.
2. The concept relies on a grouted seabed system. If a detailed investigation reveals a seabed
that is not suitable for this type of foundation resistant system, the current foundation system
will not work and would need to be revisited.
3. The installation of the TTR device is heavily dependent on good weather. It is essential that the
tidal currents during this window are minimised. The installation of this offshore structure can
be delayed until these conditions are met. Although this is a risk, with more accurate site
investigation, the tidal movements and current speeds can be highly predictable.
4. The current installation doesn’t allow for levelling the structure. It is assumed the ground
conditions would be relatively flat and the TTR device will be installed to a reasonable
tolerance.
5. This phase has not considered any environmental approvals that may be required for this
concept to go ahead. Tidal turbines in an open marine environment are not well understood in
Australia.
6. The current environment at site is difficult to work in, and all offshore operations duration and
contingency is underestimated. It is not a common task for boats and workers to be in these
conditions.
7. The turbine swivel design concept and wiring configuration requires further design
development and may prove too costly or maintenance-intensive. A variable pitch turbine may
be the answer to this risk.
8. A possible design change for future projects would be to reduce the turbine complexity even
more by taking the brake out of the system. This would however require having the ability to
stop the turbine by other means, e.g. yawing it out of the flow.
8.4 Recommended Future Work
Based on the work completed in this phase, the recommend future work includes:
1. A detailed geotechnical and site investigation/modelling is required to determine:
Seabed soil/rock properties
Bathymetry of the proposed and surrounding area
Accurate tidal range and tidal velocities, specifically in Pearl Pass
Metocean data to confirm design parameters.

2016/ARP002 - The Tidal Turbine
Reef (TTR) Feasibility Study
Advisian 53
2. The CFD suggests the current around the base can be heavily disturbed locally. The CFD model
is based on a 2D system, and future work would be needed to ensure the local disturbance of
the current velocity around the structure is not an issue.
3. A simplified VIV calculation was performed using DnV. Ref [20]. As the steel columns are
governed by VIV, a more detailed analysis would be required to confirm the simplified
assessment is valid. This would include determining more accurately the natural period of the
steel columns, the effect the flexibility of the base may have on the columns’ natural period,
and the local flow around the structure as pointed out above.
4. Further work is required into the design of the passive swivel, with a widening of the design to
consider other options to align the turbines into the current flow.
5. Traditional Owners should be consulted to ensure they are engaged and possible issues with
Native Title are foreseen and addressed.
6. An environmental impact assessment should be completed for any proposed site.

2016/ARP002 - The Tidal Turbine
Reef (TTR) Feasibility Study
Advisian 54
9 References
1. ARENA Tidal Turbine Design Report 18/04/2017, 301320-14359-MA-REP-0001
2. Horizon Power, Annual Report 2016-2017
3. Australian Hydrographic Service Chart AUS00733
4. Australia Pilot Volume I (NP13, 2005)
5. Ardyaloon community website, 1/12/2017, http://ardyaloon.org.au/
6. https://coastadapt.com.au/sea-level-rise-information-all-australian-coastal-
councils#WA_DERBY_WEST_KIMBERLEY)
7. https://www.atlantisresourcesltd.com/projects/meygen/
8. JRC, 2016. JRC Ocean Energy Status Report 2016 Edition
9. https://www.windpowermonthly.com/article/1380738/global-costs-analysis-year-offshore-
wind-costs-fell
10. SI OCEAN, 2013. Ocean Energy: Cost of Energy and Cost Reduction Opportunities
11. ARENA Tidal Turbine Milestone 2 Technical Design Report 15/02/2018,
301320-14359-MA-REP-0002
12. RAB, 2010. Value breakdown for the offshore wind sector
13. The Crown Estate, 2013. A Guide to UK Wind Operation and Maintenance
14. IEA-OES, 2015. International Levelised Cost of Energy for Ocean Energy Technologies
15. Communications with Wave Energy Scotland 2017
16. Wind Europe, 2017. The European offshore wind industry – key trends and statistics 2016
17. UK Department of Business, Energy and Industrial Strategy, 2016. Electricity Generation Costs
2016.
https://www.gov.uk/government/uploads/system/uploads/attachment_data/file/566567/BEIS_E
lectricity_Generation_Cost_Report.pdf
18. GWEC, 2018. Offshore wind power. http://gwec.net/global-figures/global-offshore/
19. Alcorn R. & Cummins V., 2017. What does it really cost? – Understanding, Comparing and
Applying Financial Metrics. EWTEC 2017, Cork, Ireland
20. DNV-RP-C205. Environmental Conditions and Environmental Loads, Recommended Practice,
October 2010
21. Noble Denton. Guidelines for Marine Transportations. 0030/ND. March 2010
22. ISO 19902 Petroleum and natural gas industries – fixed steel offshore structures, British
Standard, 2007
23. DNVGL-ST-0164. Tidal Turbines, Standard, October 2015
24. AS 4997. Guidelines for the design of maritime structures, Australian Standard, September
2005
25. DNVGL-OS-C301 Stability and watertight integrity, Offshore Standards, January 2017

2016/ARP002 - The Tidal Turbine
Reef (TTR) Feasibility Study
Advisian 55
26. Tanaka: ‘A study on the Bilge Keel, Part 4. On the Eddy-Making Resistance to the Rolling of a
Ship Hull’ Japan Soc. of Naval Arch. Col 109, 1960
27. DNV Rules for Planning and Execution of Marine Operations. January 1996
28. DNV Marine Operations 2009
29. ABS ‘Safehull – Dynamic Loading Approach’ for container carriers, Guidance Notes, April 2005.

2016/ARP002 - The Tidal Turbine
Reef (TTR) Feasibility Study
Drawings Dossier

2016/ARP002 - The Tidal Turbine
Reef (TTR) Feasibility Study
Drawing/Sketch Number Drawing/Sketch Title
ST-DSK-0001 General Arrangement
ST-DSK-0002 Concrete Details
ST-DSK-0003 Steel Column Concept Details
ST-DSK-0004 Foundation Base and Grout Pipework Details
ST-DSK-0005 Onshore Power Pole Details
ST-DSK-0006 Power Pole Foundation Details
SH-DSK-0001 SIT 250

WEIGHT (T)
2360
66
22
2
16
TOTAL 2470
X Y Z
-0.181 0 2.98
1F DRN CHK DATE REV
No. DATE DRN CHKD ENG APPR 6/12/2017 1F
Total weight includes a 5% contingency on concrete weight
and a 20% to 30% contingency on steel weight
COG [m]
GENERAL ARRANGEMENT
SKETCH No.
DESCRIPTION ST-DSK-0001
TTR DEVICE CONCEPT STUDY
WEIGHT ESTIMATE
REINFORCED CONCRETE
STEEL COLUMNS
TURBINE SUPPORT STRUCTURE
POWER PLATFORM
TURBINES
SHORT COLUMNSDIA1000x25
TURBINE SUPPORT MEMBERSDIA750
POWER PLATFORMSECTION SIZES: UB250 - UB360
TURBINES(8 TOTAL)RETRACTABLE
REINFORCED CONCRETE FOUNDATIONWALL AND FLOOR THICKNESS: 350 mmROOF THICKNESS: 300 mm
COMPARTMENTS FOR TOWING
OVERALL GENERAL ARRANGEMENT
FOUNDATION ARRANGEMENT(ROOF OMITTED FOR CLARITY)
12 m
22 m
4.0 m HIGH
TALL COLUMNDIA1300x25
MODEL ORGIN AT CENTER OF COMPARTMENTS AT BASE OF FOUNDATION
PRELIMINARYNOT FOR CONSTRUCTION
Concrete Concept 1F.xls
Rev 0 (30-Sep-14)

1F DRN CHK DATE REV
No. DATE DRN CHKD ENG APPR 6/12/2017 1FDESCRIPTION ST-DSK-0002
CONCRETE DETAILS
SKETCH No.
TTR DEVICE CONCEPT STUDY
DETAIL 1 CONCRETE TO STEEL COLUMN AND
PRECAST PANEL CONNECTION CONCEPT
SECTION A-A
LONGITUDAL BARS TOP AND BOTTOM - COVER 50mm
SHEAR LIGUTURESPER PANEL (ONLY ONE SHOWN FOR CLARIFTY)
A A
STEEL COLUMN GROUTED TO CONCRETE COLUMN
ALTERNATIVE CONCRETE COLUMN DETAIL
SECTION B-B
B
B
SHEAR LIGUTURES
DETAIL 1
PRELIMINARYNOT FOR CONSTRUCTION
Concrete Concept 1F.xls
Rev 0 (30-Sep-14)

1F DRN CHK DATE REV
No. DATE DRN CHKD ENG APPR 6/12/2017 1F
TTR DEVICE CONCEPT STUDY
STEEL COLUMN CONCEPT DETAILS
SKETCH No.
DESCRIPTION ST-DSK-0003
PLATE RINGS TO STRENGTHEN GUIDE TUBE
TUBULAR SLOTTED THROUGH RINGS AND WELDED TO GUIDE TUBE
RAIL SYSTEM TO GUIDE TURBINES FOR MAINTAINENCE
SADDLE TO SUPPORT FOR TURBINE SUPPORT MEMBERS
TRUNNIONS FOR TOW. SLOTTED THROUGH COLUMN
TRUNNION SLOTTED THROUGH AND USEDFOR VERTICAL SUPPORT OF TURBINE GUIDE TUBE
RING STIFFENERS AND TRANVERSE STIFFENERS FOR LOCAL STRENGTHENING OF COLUMN TO CONCRETE FOUNDATION
B
B
A A
SECTION A-A
SECTION B-B
PRELIMINARYNOT FOR CONSTRUCTION
Concrete Concept 1F.xls
Rev 0 (30-Sep-14)
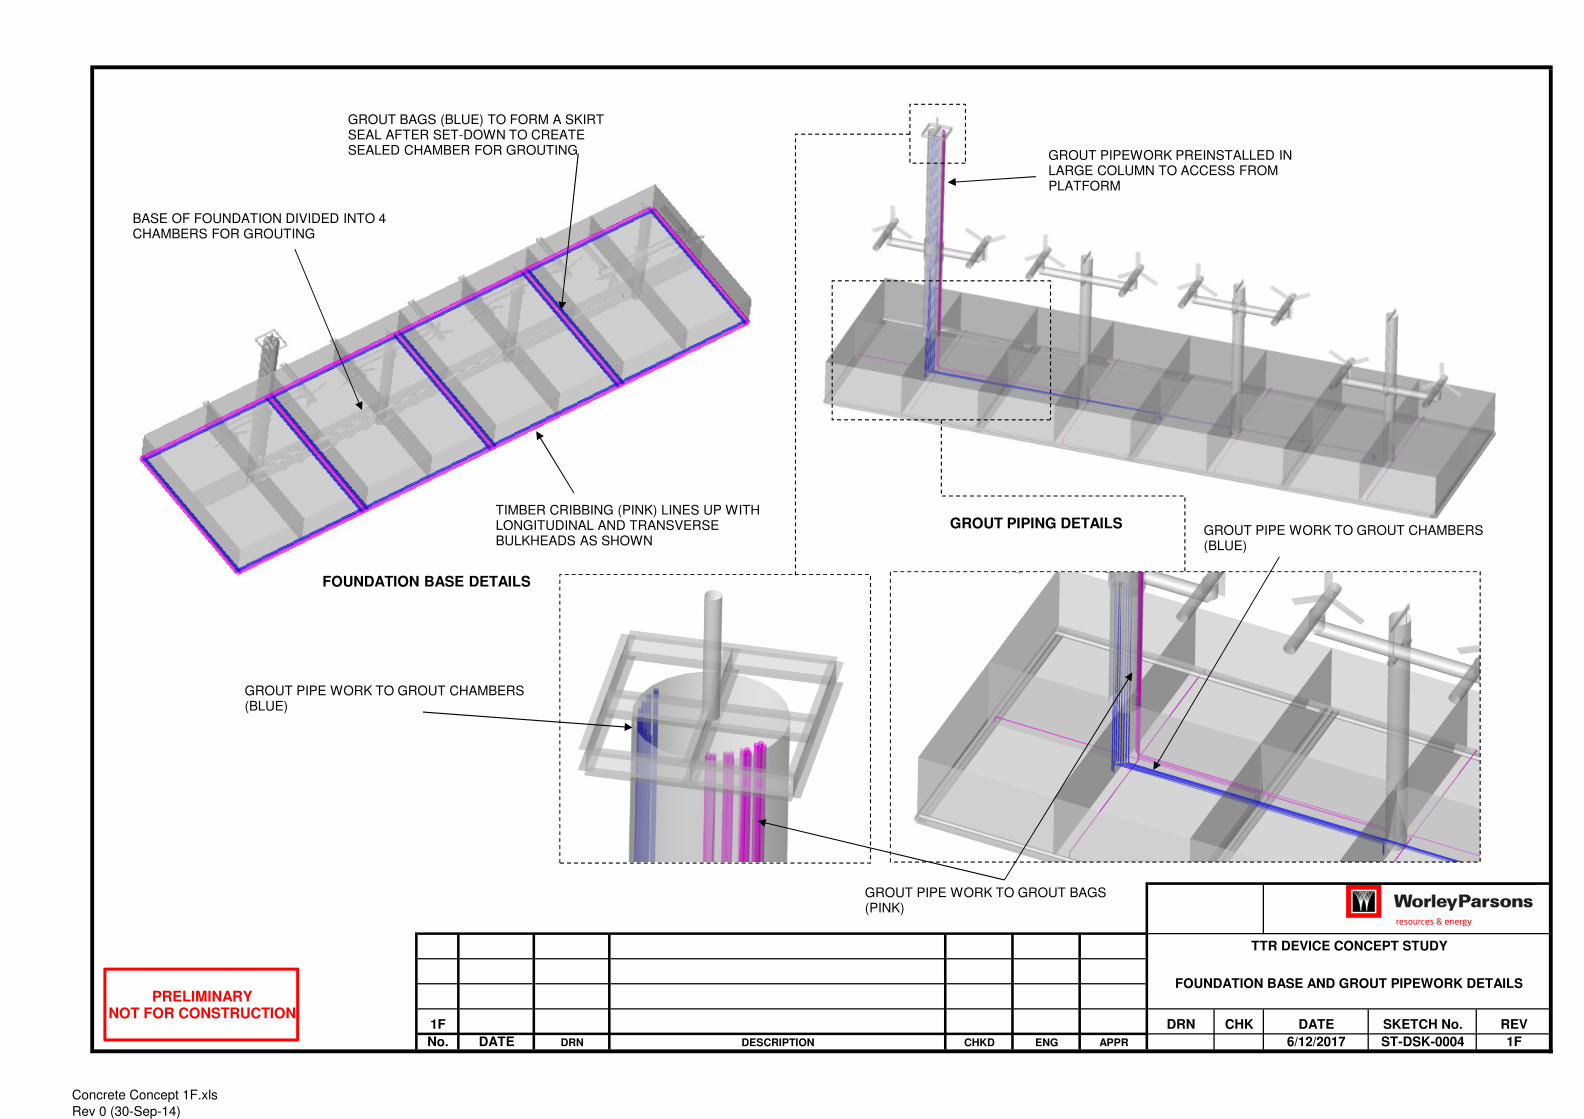
1F DRN CHK DATE REV
No. DATE DRN CHKD ENG APPR 6/12/2017 1F
SKETCH No.
DESCRIPTION ST-DSK-0004
TTR DEVICE CONCEPT STUDY
FOUNDATION BASE AND GROUT PIPEWORK DETAILS
BASE OF FOUNDATION DIVIDED INTO 4 CHAMBERS FOR GROUTING
TIMBER CRIBBING (PINK) LINES UP WITH LONGITUDINAL AND TRANSVERSE BULKHEADS AS SHOWN
GROUT BAGS (BLUE) TO FORM A SKIRT SEAL AFTER SET-DOWN TO CREATE SEALED CHAMBER FOR GROUTING
FOUNDATION BASE DETAILS
GROUT PIPING DETAILS
GROUT PIPEWORK PREINSTALLED IN LARGE COLUMN TO ACCESS FROM PLATFORM
GROUT PIPE WORK TO GROUT CHAMBERS (BLUE)
GROUT PIPE WORK TO GROUT CHAMBERS (BLUE)
GROUT PIPE WORK TO GROUT BAGS (PINK)
PRELIMINARYNOT FOR CONSTRUCTION
Concrete Concept 1F.xls
Rev 0 (30-Sep-14)

1F DRN CHK DATE REV
No. DATE DRN CHKD ENG APPR 6/12/2017 1F
TTR DEVICE CONCEPT STUDY
ONSHORE POWER POLE DETAILS
SKETCH No.
DESCRIPTION ST-DSK-0005
PRELIMINARY
NOT FOR CONSTRUCTION
Concrete Concept 1F.xls
Rev 0 (30-Sep-14)

1F DRN CHK DATE REV
No. DATE DRN CHKD ENG APPR 6/12/2017 1F
TTR DEVICE CONCEPT STUDY
POWER POLE FOUNDATION DETAILS
SKETCH No.
DESCRIPTION ST-DSK-0006
PRELIMINARY
NOT FOR CONSTRUCTION
ROCK ANCHOR DETAILS PILE CAP FOUNDATION DETAILS
STAY FOUNDATION DETAIL
Concrete Concept 1F.xls
Rev 0 (30-Sep-14)

SCHOTTEL HYDRO GmbHMainzer Strasse 99D-56322 Spay/RheinEin Unternehmen der SCHOTTEL-Gruppe
A
Tidal Turbine Reef (SIT250)
Anströmrichtungflow direction
A
M
L
K
J
H
G
F
E
D
C
B
A
16 15 14 13 12 11 10 9 8 7 6 5 4 3 2 1
16 15 14 13 12 11 10 9 8 7 6 5 4 3 2
M
L
K
J
H
G
F
E
D
C
B
1
A
CONFIDENTIALACHTUNG; CAUTION!
Zeichnung ist nicht freigegeben,
keine Gültigkeit für die Produktion!
Preliminary drawing,
not released for production!
+0.8-0.3
Index: Bl.Nr.: 1
Projektionsmethode 1DIN ISO 128-30
WerkstueckkantenDIN ISO 13715
SchutzvermerkDIN ISO 16016 beachten
Allgemeintoleranz DIN ISO 2768-mKSchweisskonstr. DIN EN ISO 13920-CFTolerierung DIN EN ISO 8015Oberflaechenangaben DIN EN ISO 1302
0
Manuelle Aenderung verboten !
Benennung:Datum Name
Zeichnungs-Nr. Format
Gewicht:
Typ:
Zust. Aenderung Datum Name
Abt.
CAD-ZEICHNUNG
NormAVGepr.Bearb.
Werkstoff:
von 1
Massstab: 1:10
Rohteil-Nr.: Modell-Nr.:
Urspr.: Ers. f.: Ers. d.:
1841.68 kg
der SCHOTTEL HYDRO GmbHDieser Entwurf ist geistiges Eigentum
Drawing NumberSH-DSK-0001