2017-2018 adopted rates - seattle
TRANSCRIPT

2017-2018 ADOPTED RATES

| 2
COST OF SERVICE
• Cost of service goal: allocate retail revenue requirement
equitably to all rate classes.
2017 Revenue RequirementCity Residential
City Small
City Medium
City Large
City High Demand
Network Medium
Network Large
Suburban Residential
Suburban Small
Suburban Medium
Suburban Large
Suburban High Demand
Streetlights

| 3
COST OF SERVICE RESULTS
AVERAGE RATE = REVENUE REQUIREMENT ($)
RETAIL SALES FORECAST (kWh)

| 4
AVERAGE RATES BY SERVICE COMPONENT
0.0
2.0
4.0
6.0
8.0
10.0
12.0
Residential Small Medium Large High
Demand
Cen
ts/k
Wh
Energy
Conservation
Distribution
Customer Cost
Utility Discount
Program
2017 AVERAGE RATES (CITY)

| 5
RATE DESIGN
• Set rates to collect revenue requirement set by
cost of service.
oDependent on retail sales forecast.
• Rate design policy and principles are unchanged
from the 2015-2016 rate review.
oRates reflect changes in costs for different service
components.
| 6
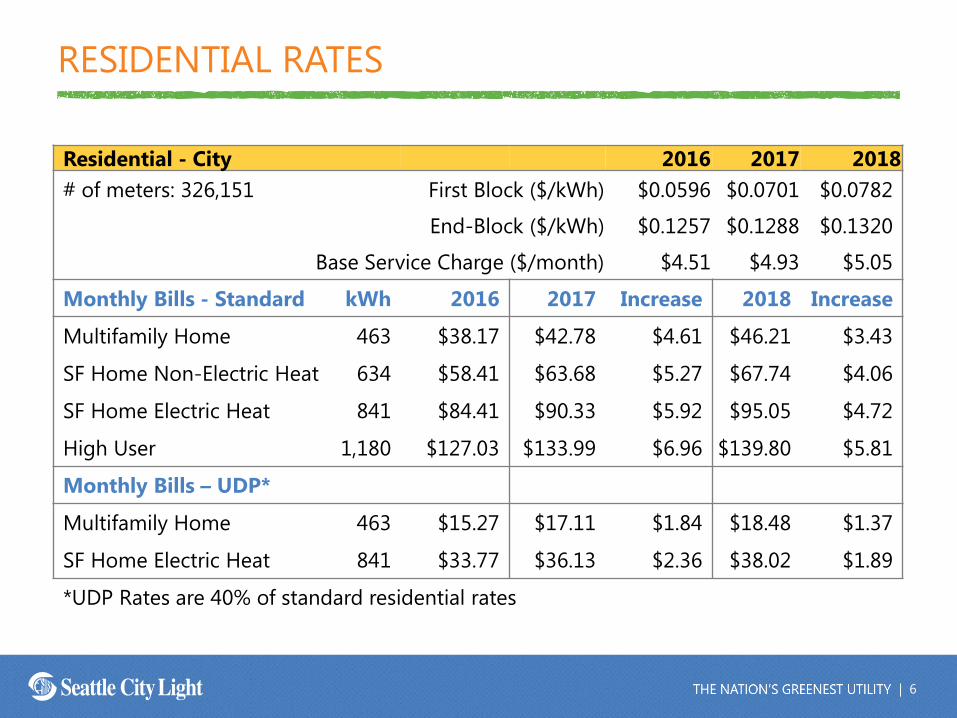
RESIDENTIAL RATES
Residential - City 2016 2017 2018
# of meters: 326,151 First Block ($/kWh) $0.0596 $0.0701 $0.0782
End-Block ($/kWh) $0.1257 $0.1288 $0.1320
Base Service Charge ($/month) $4.51 $4.93 $5.05
Monthly Bills - Standard kWh 2016 2017 Increase 2018 Increase
Multifamily Home 463 $38.17 $42.78 $4.61 $46.21 $3.43
SF Home Non-Electric Heat 634 $58.41 $63.68 $5.27 $67.74 $4.06
SF Home Electric Heat 841 $84.41 $90.33 $5.92 $95.05 $4.72
High User 1,180 $127.03 $133.99 $6.96 $139.80 $5.81
Monthly Bills – UDP*
Multifamily Home 463 $15.27 $17.11 $1.84 $18.48 $1.37
SF Home Electric Heat 841 $33.77 $36.13 $2.36 $38.02 $1.89
*UDP Rates are 40% of standard residential rates

| 7
SMALL GENERAL SERVICE RATES
Small General Service - City ( < 50 kW ) 2016 2017 2018
# of meters: 37,781 Energy ($/kWh) $0.0848 $0.0910 $0.0960
Monthly Bills kWh 2016 2017 Increase 2018 Increase
Small Office 1,195 $101 $109 $7 $115 $6
Car Wash 7,573 $642 $689 $47 $727 $38
Investment Firm 8,833 $749 $804 $55 $848 $44

| 8
MEDIUM GENERAL SERVICE & NETWORK RATES
Medium General Service - City ( >=50 kW and < 1,000 kW ) 2016 2017 2018
Number of meters: 2,225 Energy ($/kWh) $0.0675 $0.0698 $0.0740
Demand ($/kW) $2.32 $3.36 $3.44
Monthly Bills Load Factor kWh 2016 2017 Increase 2018 Increase
Office Building 20% 135,650 $10,229 $11,022 $793 $11,629 $607
Apt. Complex 34% 216,300 $15,946 $17,046 $1,101 $18,001 $955
Produce Co. 54% 50,705 $3,668 $3,894 $227 $4,116 $221
Real Estate Dev 82% 453,050 $32,082 $33,796 $1,715 $35,751 $1,955
Medium Downtown Network ( >=50 kW and < 1,000 kW ) 2016 2017 2018
Number of meters: 545 Energy ($/kWh) $0.0832 $0.0797 $0.0852
Demand ($/kW) $4.54 $7.48 $7.67
Monthly Bills Load Factor kWh 2016 2017 Increase 2018 Increase
Theater 29% 78,840 $8,028 $8,702 $675 $9,197 $495
Hotel 42% 89,220 $8,370 $8,671 $301 $9,202 $530
Shopping Ctr. 44% 285,700 $26,788 $27,741 $954 $29,439 $1,698
Office Building 66% 43,325 $4,082 $4,239 $157 $4,497 $258

| 9
LARGE GENERAL SERVICE & NETWORK RATES
Large General Service - City (>=1,000 kW and < 10,000 kW ) 2016 2017 2018
Number of meters: 81 Energy On-Peak ($/kWh) $0.0767 $0.0801 $0.0848
Energy Off-peak ($/kWh) $0.0514 $0.0533 $0.0565
Demand On-Peak ($/kW) $2.08 $3.05 $3.12
Demand Off-Peak ($/kW) $0.22 $0.27 $0.27
Monthly Bills
Load
Factor kWh 2016 2017 Increase 2018 Increase
Cement 18% 218,316 $17,369 $19,361 $1,992 $20,333 $972
Shipyard 35% 974,837 $71,272 $76,739 $5,467 $80,941 $4,202
Hospital 69% 1,569,322 $109,860 $116,899 $7,039 $123,479 $6,581
Large Downtown Network ( >=1,000 kW) 2016 2017 2018
Number of meters: 60 Energy On-Peak ($/kWh) $0.0914 $0.0875 $0.0935
Energy Off-peak ($/kWh) $0.0612 $0.0583 $0.0624
Demand On-Peak ($/kW) $4.05 $7.62 $7.81
Demand Off-Peak ($/kW) $0.22 $0.27 $0.27
Monthly Bills
Load
Factor kWh 2016 2017 Increase 2018 Increase
Event Space 20% 250,567 $24,713 $27,606 $2,893 $29,152 $1,537
Office Tower 43% 778,428 $74,042 $79,515 $5,473 $84,192 $4,677
Hotel 67% 1,093,011 $95,436 $98,869 $3,433 $104,990 $6,120

| 10
HIGH DEMAND RATES
High Demand General Service City ( >= 10,000 kW ) 2016 2017 2018
Number of meters: 7 Energy On-Peak ($/kWh) $0.0732 $0.0746 $0.0791
Energy Off-peak ($/kWh) $0.0491 $0.0497 $0.0527
Demand On-Peak ($/kW) $2.08 $3.05 $3.12
Demand Off-Peak ($/kW) $0.22 $0.27 $0.27
Monthly Bills Load Factor kWh 2016 2017 Increase 2018 Increase
Waste Treatment 45% 4,275,991 $290,424 $304,957 $14,534 $322,074 $17,117
Education 67% 24,077,474 $1,630,834 $1,700,571 $69,736 $1,797,662 $97,092
Glass Manufacturer 88% 7,462,299 $493,371 $512,697 $19,326 $542,164 $29,467

| 11
OTHER RATES
• Streetlights
o Different types of lights (HPS or LED, etc.)
o Monthly fixed charge covers capital, maintenance and energy costs
• Duct, Vault and Pole Rentals
o Annual fixed charge for capital, maintenance, space allocation for attachments
• Minimum Charges
o All non-residential customers classes have minimum bills
• Transformer Investment and Losses Credit
o Discounts for customers who supply their own transformers
• Power Factor
o Customers with power factor < 97% pay for cost of corrective distribution equipment.
• Reserved Distribution Capacity
o Capital cost of a feeder per kW for customers who request additional dedicated capacity.

| 12
SUMMARY
• Rate ordinance establishes rate increases for
2017-2018 biennium.
oCritical for ensuring sufficient revenue to support
budget and strategic plan.
oDoes not include BPA pass-through or RSA
surcharges.
• Full rate design policy study planned for 2017.

OUR VISIONTo set the standard—to deliver the best customer
service experience of any utility in the nation.
OUR MISSIONSeattle City Light is dedicated to exceeding our customers’
expectations in producing and delivering environmentally
responsible, safe, low-cost and reliable power.
OUR VALUESExcellence, Accountability, Trust and Stewardship.