2017-2018 annual business plan - teatreegully.sa.gov.au · 20172018 nnual business plan 1 this...
TRANSCRIPT

ANNUAL BUSINESSPLAN
2017-2018


CONTENTS
Introduction .......................................................................................................... 1
Key financial statistics 2011–2017 .................................................................... 4
Budget snapshot and key statistics .................................................................. 5
Key achievements delivered in 2016–2017 ..................................................... 7
Significant influences and priorities ...............................................................17
Continuing services............................................................................................19
Project priorities for the year ...........................................................................25
Measuring performance – objectives for the year .......................................33
Funding the Annual Business Plan .................................................................57
What this Annual Business Plan and budget means for rates ...................71

2017–2018 Annual Business Plan
4

2017–2018 Annual Business Plan
1
This Annual Business Plan for
2017–2018 demonstrates our
long-term commitment to ensuring
a sustainable financial future
for our City.
INTRODUCTION This year 2017–2018 promises the start of an exciting era for our City as we continue the implementation phase for a number of key initiatives.
The Modbury Precinct Revitalisation Project is creating dynamic business and population growth for the local community, with flow-on effects apparent throughout our City.
We will upgrade our main roads, gateways and public spaces in Modbury, including Reservoir Road. This spend compliments the significant investment by developers and the State Government and will continue to encourage economic development, growth and jobs in our regional precinct.
Council continues to review its services to ensure that we provide services that meet our community’s needs. In the financial year ending (FYE) 2018 we will continue to allocate funding in the areas of city beautification and park upgrades in response to feedback from our community.
Our City’s Civic Park current upgrade will be finalised with further works to the amenities, including lighting upgrades.
Promoting the wellbeing of our residents is vital, so this plan also outlines a number of programs that Council funds for the elderly, people with disabilities, families and young people, as well as sports and recreation programs for all age groups.
Our footpath program, which commenced in 2017 to meet the needs of our community and to facilitate mobility around the city will be continuing. In 2017 we completed 12 kms of the 36 kms co-funded by the State Government. In 2017-2018, approximately 18 kms will be completed.
In addition, we continue to fund many other core services such as street lighting on all of your roads, fire prevention, dog management, library, immunisation, maintaining Council-owned assets as well as health and planning services.
With a proposed $90 million operating budget for 2017–2018, we plan to spend a combined $21 million on maintaining roads, buildings, stormwater systems, footpaths and providing waste collection. The remaining $69 million will be invested in other important services and programs for the benefit of our 99,000 residents. This includes funding for roads, new footpaths, city beautification and community amenities. Council’s capital program for this year is

2017–2018 Annual Business Plan
2
$24.557 million, which is partially funded through grants and other contributions.
This year we propose a 2.7% general rate increase apart from any increases due to growth. This will mean a 3.2% rate revenue. What this means for you, the residential rate payer, is:
Approximate annual increase in rates*
Property value Per year Per week$250,000 $30 $.058$350,000 $60 $1.15$450,000 $70 $1.35* Subject to change
Council has been able to achieve a modest general rate increase despite increases in the costs of service delivery, reductions in government grant income for some services and the employee enterprise bargaining agreement.
Council will continue to cover the cost of delivering key community services and programs as well as ongoing infrastructure maintenance, despite our significant increases, including:• $600,000 increase in electricity costs, including
street lighting, which equates to almost a 1% increase in rates
• $600,000 increase in the solid waste levy, which enables us to provide waste management services to our community. This also equates to almost a 1% increase in rates
• The costs of service delivery• Reductions in government grant income.
The economic climate and community feedback directs our plan and we will maintain our focus on sustainability, moderate surpluses for future debt reduction, continuous improvement and financial consolidation.
We will also continue to achieve cost savings and efficiencies by reducing expenditure, reviewing assets and services and achieving significant procurement savings.
In 2018 we will continue with the refurbishment of our new service centre to ensure we remain operationally effective, safe and compliant. This will require an initial investment of $4 million in 2017–2018 and a further investment in future years.
Council is conscious of its debt level and has forecast to maintain the debt level within the targeted range of 25–35% of its revenue over the life of the Long Term Financial Plan (LTFP).
In 2017–2018 Council’s debt will be 32%. This is substantially lower than the high of 61% in 2012. Our surplus of $5.689 million will allow for the renewal of Council’s infrastructure with additional new works of the footpath program and the service centre in FYE 2018 and for the debt levels to be reduced once the one off investment in the depot is completed.
On the following pages we detail more information about our projects and initiatives, along with key financial statistics. We acknowledge the contributions of our Elected Members, staff and community in delivering this plan to further enhance and strengthen our local community.
2017–2018 Annual Business Plan
3
2017–2018 Annual Business Plan
4
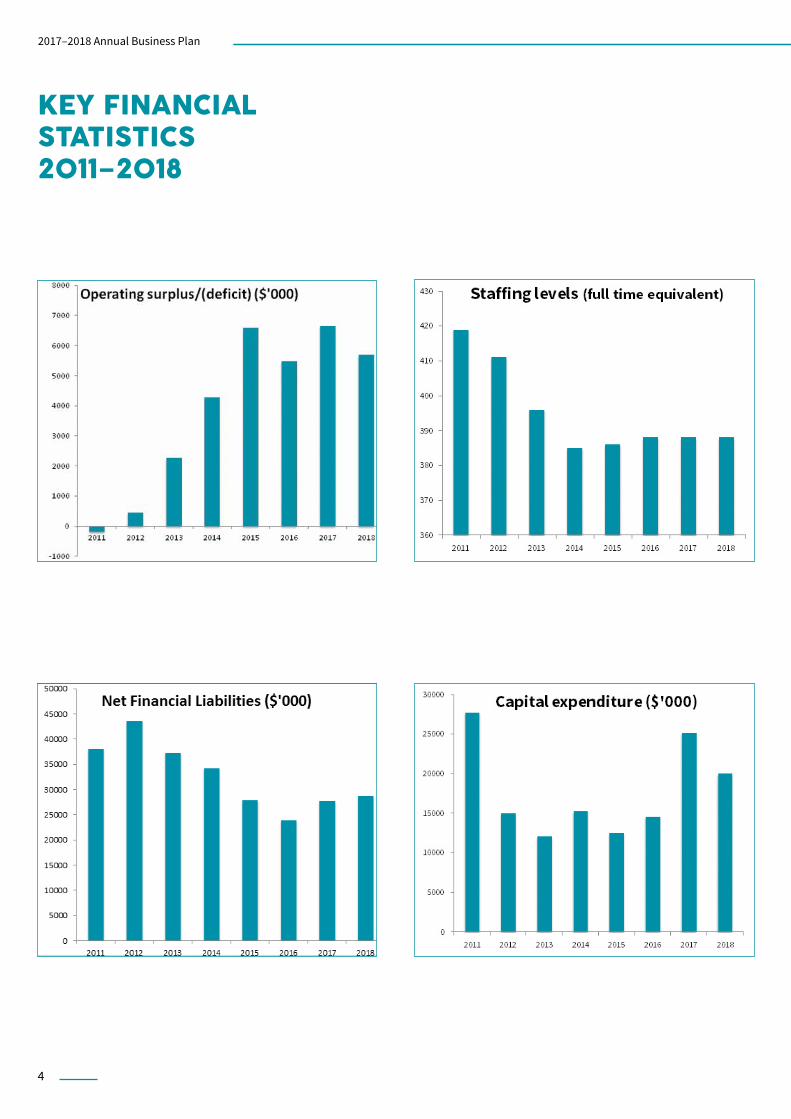
KEY FINANCIAL STATISTICS 2011–2018

5
2017–2018 Annual Business Plan
BUDGET SNAPSHOT
Operating budget Revenue sources Key areas of expenditure
Total operating revenues
$90M84% rates
$76MTotal operating expenditure
$84M7% fees and charges
$6MOperating surplus before capital amounts
$6M9% other
$8M
Waste management
$8MBuildings, roads, footpaths and stormwater
$21MParks and gardens
$10M
Library and community services
$6M
Recreation and leisure
$4M
Capital works
$25M
KEY STATISTICSCurrent population
99,118
Number of dwellings
38,887
Median age
40
Total land area
9,521 ha
Sealed roads
590 km
Kerbs and gutters
1,436 km
606 reserves – total approx.
1,305 ha
Sealed footpaths
523 km
Unsealed footpaths
92 km
Number of overseas born residents (23.9%)
22,835% undertaking voluntary work
17.4%% with tertiary qualifications
44.8%

2017–2018 Annual Business Plan
6

7
2017–2018 Annual Business Plan
KEY ACHIEVEMENTS DELIVERED IN 2016–2017
Council’s strategic directions for 2016–2017 financial yearThe new strategic plan was developed with community and stakeholder input and is available on Council’s website.
In addition to community well-being, Council has implemented a guiding document for the organisation – Organisation Plan 2020 – which aims to guide the organisation towards achieving key organisational outcomes under the following five themes:
• People and Leadership• Customer and Community
Relations• Governance• Finance and Systems• Continuous Improvement.
The chart below includes three columns that represent the three themes of the strategic plan. The additional column on the right gives an overall score. The three columns show the Strategic Plan KPIs and how they are tracking against their required delivery time frames.
One KPI in the Healthy and Safe theme, KPI SP1.3.3l “Provide systems that allow for businesses to lodge and receive health reporting from Council in an electronic format” was running behind target at the time of compiling this report due to IT technical issues. These issues have since been resolved and this project has now been completed.
Council has a new Strategic Plan 2020 as our previous Strategic Plan 2011–2015 expired at the end of the 2015–2016 financial year. The new strategic plan forms part of Council’s suite of strategic management plans that are used to guide our decision making, annual business planning and budgeting. This suite of strategic management plans includes:• Strategic Plan 2020• Asset Management Plans• Long-Term Financial Plan• Annual Business Plan (this
document)• Annual Report.
Our strategic plan is focused on promoting the wellbeing of our community; that is, to ensure we have a healthy community that enjoys a quality lifestyle.
Extensive research into individual and community wellbeing tells us that there are a number of factors that contribute wellbeing. These factors underpin the aspirations and objectives included in our strategic plan and they fall under three key themes as follows:• Healthy and Safe• Prosperous and Connected• Vibrant and Liveable.

8
2017–2018 Annual Business Plan
The following table illustrates our key strategic objectives relevant to the quarter two review and shows the progress on key programs since the Strategic Plan 2020 was adopted.
Healthy and Safe – People in our community are healthy and safe.
Strategic objective Action Business unit StatusSP 1.1.1 A community where people are safe in our public places and spaces
SP 1.1.1a Select, design and construct Disability Discrimination Act accessible bus stops and shelters in accordance with legislative requirements and standards
Civil and Water Operations
On track
SP 1.1.1e Maintain the existing road network through inspections, maintenance, reconstructions and resealing in accordance with the Asset Management Plan
Civil and Water Operations
On track
SP 1.1.1g Maintain all buildings in accordance with the Building Asset Management Plan
Building Assets and Environment
On track
SP 1.1.2 A community where people are safe during emergencies, natural disasters and during extreme climatic events, such as storms or heat waves
SP 1.1.2b Bushfire mitigation activities are tracked and measured and align with relevant regional and state strategies
Strategic Assets On track
SP 1.1.2c Maintain fire tracks in a safe and fit for purpose condition
Civil and Water Operations
On track
SP 1.1.2d Protect streets and properties from flooding by operating and maintaining the stormwater network in accordance with the Stormwater Asset Management Plan
Civil and Water Operations
On track
SP 1.1.3 A community where people have easy access to places, spaces and services that support good health
SP 1.1.3a, CEO KPI Implement a playground capital works program, including regular inspections, ensuring works carried out align with Council’s adopted budget
Civil Assets On track
SP 1.1.3e Maintenance and management of existing turf quality
Civil and Water Operations
On track

9
2017–2018 Annual Business Plan
Strategic objective Action Business unit StatusSP 1.1.3k Strategically partner and collaborate with external service providers, government, not-for-profits, service clubs, etc. to provide access to services and programs that promote community wellbeing
Community Development and Engagement
On track
SP 1.1.3l Develop systems that allow for businesses to lodge and receive health reporting from Council in an electronic format
Community Safety
Completed
SP 1.1.3m Minimise public health impacts by maintaining and operating the Community Wastewater Management System network
Civil and Water Operations
On track
Prosperous and Connected – Our local economy prospers and people have a sense of purpose and belonging.
Strategic objective Action Business unit StatusSP 2.1.2 A community that participates in meaningful community and economic activities
SP 2.1.2d Provide a range of free and low cost programs and activities to enable the community to gain new life skills and/or participate in volunteering
Community Development and Engagement
On track
SP 2.1.2e Partner with the state government through the Active Ageing program to deliver the funding objectives for eligible residents
Community Development and Engagement
On track
SP 2.1.2f Review all community centre programs and activities
Community Development and Engagement
On track
SP 2.1.3 A community with a resilient local economy
SP 2.1.3d Advocate for and facilitate for the establishment of small business within the City by meeting with small business owners or their representatives
City Strategy On track
SP 2.1.4 A community where people have the resources and capacity to achieve goals
SP 2.1.4a Provide a range of digital literacy programs to the community
Library Services, Arts and Culture
On track

2017–2018 Annual Business Plan
10
Vibrant and Liveable – Our City is a desirable and sustainable place to live.
Strategic objective Action Business unit StatusSP 3.1.1 A City that is made up of places and spaces that are appealing and easy to access
SP 3.1.1a, CEO KPI Maintain the existing footpath network, construct new footpaths and renew bike paths throughout the City in line with the Footpath Construction Strategy and Local Area Bicycle Plan
Civil Assets On track
SP 3.1.1b Implement the Modbury Precinct Activation Plan
City Strategy On track
SP 3.1.1c Maintain verges in accordance with the works program to agreed service levels
Parks On track
SP 3.1.3 A sustainable city that has a healthy natural environment and is resilient to climate change
SP 3.1.3f Implement the City of Tea Tree Gully Climate Change Action Plan, Turramurra Recreation Centre energy efficiency project and Civic Centre office lights project
Building Assets and Environment
On track
SP 3.1.3g Provide a free Enviro Care service in order to encourage the recycling of green waste
Parks On track
SP 3.1.3i Maintain tree assets within the City in accordance with the Tree Management Policy
Parks On track
SP 3.1.3j Horticultural maintenance of reserves and streetscapes across the City
Parks On track
SP 3.1.3K Provide a cleaner stormwater catchment by maintaining street cleanliness via our street sweeping program
Civil and Water Operations
On track
SP 3.1.3l Promote environment-related events and programs to the community
Building Assets and Environment
On track
11
2017–2018 Annual Business Plan
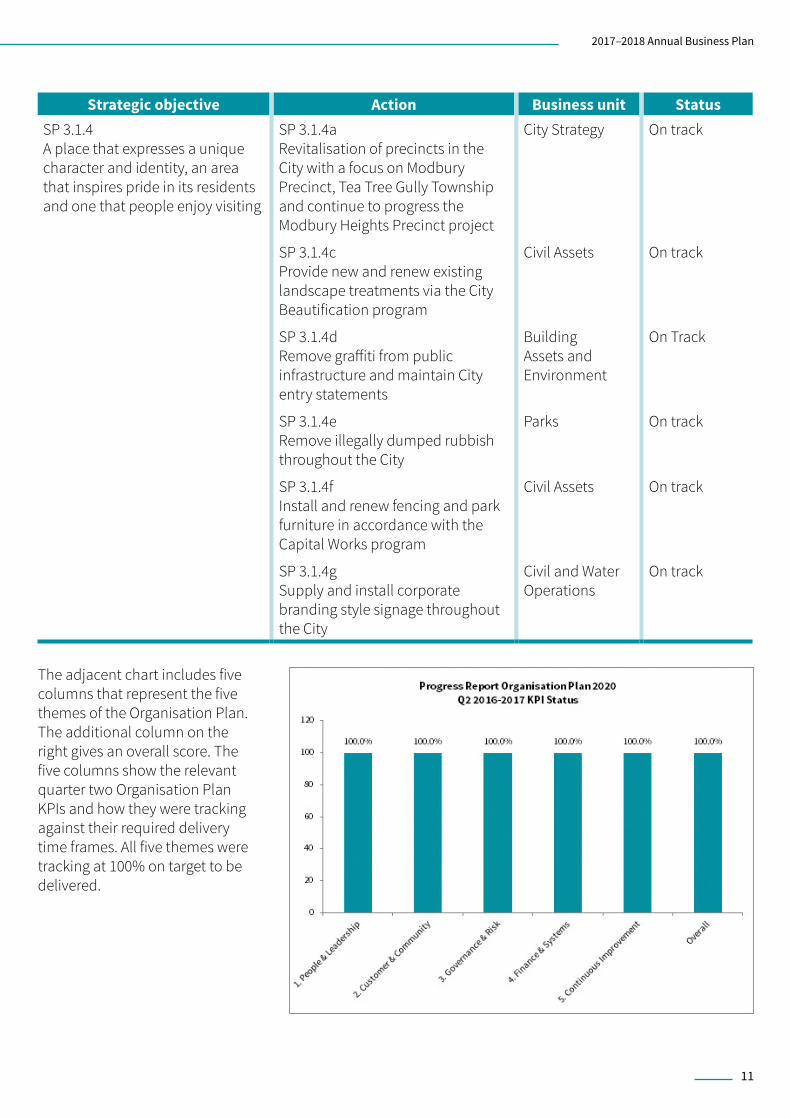
Strategic objective Action Business unit StatusSP 3.1.4 A place that expresses a unique character and identity, an area that inspires pride in its residents and one that people enjoy visiting
SP 3.1.4a Revitalisation of precincts in the City with a focus on Modbury Precinct, Tea Tree Gully Township and continue to progress the Modbury Heights Precinct project
City Strategy On track
SP 3.1.4c Provide new and renew existing landscape treatments via the City Beautification program
Civil Assets On track
SP 3.1.4d Remove graffiti from public infrastructure and maintain City entry statements
Building Assets and Environment
On Track
SP 3.1.4e Remove illegally dumped rubbish throughout the City
Parks On track
SP 3.1.4f Install and renew fencing and park furniture in accordance with the Capital Works program
Civil Assets On track
SP 3.1.4g Supply and install corporate branding style signage throughout the City
Civil and Water Operations
On track
The adjacent chart includes five columns that represent the five themes of the Organisation Plan. The additional column on the right gives an overall score. The five columns show the relevant quarter two Organisation Plan KPIs and how they were tracking against their required delivery time frames. All five themes were tracking at 100% on target to be delivered.

2017–2018 Annual Business Plan
12
People and Leadership – Our people are engaged and make a meaningful contribution to organisational success.
Strategic objective Action Business unit StatusOP 1.4.1 We foster a safety culture where we place safety and wellbeing first in everything we do
OP 1.4.1b Finalise and implement a Safety First Strategic Plan which incorporates the results of work health and safety audits.
Organisational Development
On track
OP 1.5.1 We take responsibility for giving and receiving information and sharing knowledge with others
OP 1.5.1a Evaluate and implement the agreed recommendations regarding communication channels from the Unearthed round four project
Organisational Development
On track
Customer and Community Relations – We manage our customer relationships and analyse their requirements in order to deliver increasing value.
Strategic objective Action Business unit StatusOP 2.1.1 We build customer needs into design and delivery of services
OP 2.1.1b Digital road map developed with services prioritised and top five services transferred online
Customer and Communications
On track
OP 2.1.1c Online payment systems for recreation and leisure programs are introduced to improve the customer booking experience
Recreation and Leisure Services
On track
OP 2.1.1d Develop a volunteer e-newsletter, MyVolunteer portal, Flickr account to share information on volunteering in CTTG
Community Development and Engagement
On track
OP 2.1.1e Commence implementation of Council’s preferred works depot facility solution
Strategic Assets On track
OP 2.1.1f Procurement of plant, fleet and equipment
Civil and Water Operations
On track
OP 2.1.1g Review recreation and wellbeing programs and services provided to the community and execute planning activities in accordance with policy, procedure or other agreement
Recreation and Leisure Services
On track

2017–2018 Annual Business Plan
13
Strategic objective Action Business unit StatusOP 2.1.2 We ensure all contact has a customer focus
OP 2.1.2a Purchase and implement online payment systems for development applications
City Development
On track
OP 2.1.2b Carry out communications and information preference survey to inform improvements to customer contact and communications channels
Customer and Communications
On track
OP 2.3.1 We provide information that is relevant, current and meaningful, through accessible channels
OP 2.3.1a Provide staff and Elected Members with relevant data to assist with decision making, including external trends
City Strategy On track
OP 2.3.1b Develop and implement an action plan to enhance the use of the Customer Request Management system (CRM) as a tool to lodge, track and manage customer requests
Customer and Communications
On track
Governance – We define the roles, powers and responsibilities within the organisation.
Strategic objective Action Business unit StatusOP 3.1.1 Our people are empowered to make decisions
OP 3.1.1a Maintain and improve the Asset Management Information System, including measurement, monitoring and reporting
Strategic Assets On track
OP 3.1.2 The decision-making process is transparent and based on evidence
OP 3.1.2a Regular reporting occurs on status/outcomes of Council and committee decisions
Governance and Policy
On track
OP 3.2.1 We understand that risks exist and manage them for positive outcomes
OP 3.2.1a Deliver the Internal Audit Plan and monitor outstanding high/extreme risks from internal audits
Governance and Policy
On track
OP 3.2.1c Department risk registers to be reviewed every two years, with periodic monitoring and reporting on high and extreme corporate risks
Governance and Policy
On track

2017–2018 Annual Business Plan
14
Strategic objective Action Business unit StatusOP 3.2.1d Volunteer activities are risk-assessed
Community Development and Engagement
On track
OP 3.2.1e Review and implement our Business Continuity Plan to ensure key services are delivered to the community in the event of an emergency
Governance and Policy
On track
OP 3.3.1 Our systems and processes are easy to follow and help our people with the decision making process
OP 3.3.1b Develop report writing guidelines and run associated training sessions
Governance and Policy
On track
OP 3.4.1 We work proactively to meet our legislative and governance obligations
OP 3.4.1 Produce and distribute Council and committee agendas, reports and minutes in accordance with legislative time frames
Governance and Policy
On track
OP 3.4.1d Monitor, review and report periodically on confidential Council, committee meeting items
Governance and Policy
On track
Finance and Systems – We use systems and data to show how well we are performing and as a basis for ongoing reviews and improvements.
Strategic objective Action Business unit StatusOP 4.1.1 We meet our financial commitments to the community and organisation
OP 4.1.1a Identify and apply for grants and sponsorship initiatives for the City
City Strategy On track
OP 4.2.2 We collect and analyse useful data in order to aid in decision making
OP 4.2.2a Measure and report on the organisation’s performance in delivering our key strategic objectives and actions
City Strategy On track

2017–2018 Annual Business Plan
15
Continuous Improvement – We encourage innovation and improvement to ensure we continue to deliver value.
Strategic objective Action Business unit StatusOP 5.1.1 We look for new and better ways to improve our processes
OP 5.1.1a Establish a framework within the Continuous Improvement program that allows contribution from all staff and stakeholders
Continuous Improvement
On track
OP 5.2.1 We work with and learn from others in order to improve the way we work
OP 5.2.1a Collaborate with other organisations and establish common data that will identify areas of improvement
City Strategy On track
OP 5.2.2 Improvements are focused on customer benefit
OP 5.2.2a CEO KPI Complete eight service-level reviews per annum
Continuous Improvement
On track
OP 5.2.3 We maximise benefits to staff and workplace efficiencies by using creative solutions
OP 5.2.3a Offer education sessions across the organisation that promote the benefits of continuous improvement
Continuous Improvement
On track

2017–2018 Annual Business Plan
16

2017–2018 Annual Business Plan
17
SIGNIFICANT INFLUENCES AND PRIORITIES
In preparing this Annual Business Plan (ABP) 2017–2018, we have taken into account a range of significant factors. These include:• Significant increases in the state government’s
solid waste levy, just under 1% of the rates increase
• Major impact of rising energy costs for street lighting and community buildings, just under a further 1% of the rates increase
• The Adelaide consumer price index (CPI) of 1.3% (as at December 2016) on goods and services for the previous year, and forecast CPI increases of 2% to 3% over the next 12 months
• Enterprise bargaining agreements that provide for wage and salary increases
• Our service standards policy for providing, maintaining and renewing infrastructure assets, including roads, footpaths, lighting, stormwater drainage, street trees and planting, open space and council properties
• Evolving needs for services and infrastructure to serve our residents
• Possible reduction or removal of state or federal grant funding for services that we propose to continue providing
• New or increased fees and charges imposed by other levels of government.
Over the past five years our Council has proudly worked to reduce the overall cost of service delivery to you and has worked to build a financially sustainable future for our Council.
In direct response to community feedback we have reined in spending and cut staffing numbers.
Through these core savings Council has been able to achieve the target of maintaining debt and ensuring funds are available for new works.
We are committed to ongoing reviews of our assets in order to provide optimum benefit to our community and also to ensure that we deliver quality services in the most cost-effective manner.
We are continuing to reduce costs through the following strategies by:• Continuous review, prioritisation and validation
of current services• Reviewing staffing levels• Making procurement savings.
You can find full details about our project priorities for 2017–2018 on page 25 and the following pages.

2017–2018 Annual Business Plan
18

2017–2018 Annual Business Plan
19
CONTINUING SERVICES
All councils in South Australia have core (mandatory) responsibilities defined under the Local Government Act 1999 and other relevant legislation. These include:
• Regulatory activities, including development planning and control, fire safety and structural integrity assessments of buildings
• Setting rates, preparing an annual budget, an annual business plan and developing longer-term strategic management plans
• Management of infrastructure and other assets,
including roads, footpaths, parks, public open space, street lighting and stormwater drainage
• Street cleaning and waste collection
• Environmental health services, including food and public health inspections, immunisation, animal and pest control.
The following table provides more detail about our services, including some additional services delivered in response to recognised community needs.
Services that we provideService area Service Examples/details
Our City Economic development Support existing businesses and business sectors; encourage and facilitate new opportunities such as the high-speed broadband network
Social planning Disability access and associated strategies in line with the Disability Discrimination Act 1992 (DDA); Ageing Strategy; Community Transport and Accessibility Strategy; provision of demographic and statistical information
Strategic planning Master planning; precinct planning; heritage advice
Our Community Citizenship ceremonies Regular citizenship ceremonies for approved candidates
Cultural development Reconciliation activities; performing arts; events; placemaking

2017–2018 Annual Business Plan
20
Service area Service Examples/detailsActive Ageing Services Respite and Carer Support Program;
Social Support Group and Individual Programs; Domestic Assistance; Home Modifications and Maintenance; Multicultural Programs; Aboriginal Elders Program; Community Transport
Immunisation Scheduled children’s and high school vaccinations
Awards, sponsorships and grants Community Grants Program; Australia Day Awards; Youth Sports & Cultural Sponsorship Program; Events Sponsorship Program
Youth participation planning and programs
Provision of projects and services for young people through youth development programs
Community and neighbourhood development/planning
Jubilee, Holden Hill, Surrey Downs and Greenwith community centres; community programs and activities crime prevention programs; community transport service; Volunteers Program
Community education Road and Cycle Safety Centre; dog obedience training; outdoor environmental classroom; digital literacy training
Our Council Community engagement A continuous initiative allowing residents and other stakeholders the opportunity to have a greater say in what happens in the City and to be more active in the decision-making process
Rates Setting and collection of rates; preparation of annual budgets and Long Term Financial Plan
Governance Policy development and review; Council meetings and committees, agendas, minutes, reports
Justice of the Peace Service coordinated by Council and voluntarily operated by appointed Justices of the Peace
Our Essentials By-laws, permits and access control Permits to light fires and gain access to Council reserves; enforcement of by-laws
Animal and pest control Control of rodents and European wasps; dead animal collection from public spaces

2017–2018 Annual Business Plan
21
Service area Service Examples/detailsControl of flammable growth and fire prevention
Advice to residents on fire risk management; oversee implementation of works program
Parking control Enforcement of state government parking laws and private parking agreements; school patrols
Dog control and management Dog registration; capture and management of stray dogs; investigation and management of dog attacks
Environmental health Food safety and public health inspections, including beauty and personal grooming premises; public swimming pool and spa facilities; aged care facilities, child care centres, restaurants and cafes
Effluent and stormwater drainage maintenance
Community Wastewater Management System (CWMS), water capture, treatment and reuse
Waste management and recycling Domestic kerbside collection; hard rubbish collection; Envirocare Sunday and kerbside organics collection; mobile phone recycling; litter control; maintenance and emptying of public bins
Development assessment and compliance services
Provision of planning, building and compliance-related services. These include the administration of the Development Act 1993 and Development Regulations 2008, the Development Plan, Building Code and other relevant standards
Infrastructure, roads, footpaths and shared use paths
Maintenance of bus shelters; construction and maintenance of footpaths on local streets; construction and maintenance of shared use paths; construction and maintenance of local roads; public conveniences; street sweeping and litter bins
Cemeteries Management of leasing and licensing of burial sites and memorials through third party contractor; maintenance of cemetery grounds at Hope Valley and Golden Grove
Traffic management and street signage Installation of traffic control devices, road names and traffic control signage

2017–2018 Annual Business Plan
22
Service area Service Examples/detailsCommunity halls and buildings Management of community buildings
and facilities, including construction, maintenance, leasing and hiring; graffiti removal
Open space development and maintenance
Planning, planting and maintenance of reserves, ovals, gardens, verges and streetscapes; street tree planting and maintenance; weed control
Lighting Upgrading existing lighting and installing new lighting for car parks, reserves, sports fields and courts
Our Leisure and Play Library Lending of reading and audiovisual material; internet training; local history services; children and youth programs; online resources; computing, printing and WiFi facilities
Community events and celebrations Civic Park Movies; Civic Park Carols; Civic Park Ausday; ANZAC Day; activation events
Recreational centres, sports facilities and programs
Waterworld Aquatic Centre; Burragah, Turramurra and Golden Grove Recreation Centres; sports grounds; tennis and netball courts
Arts centres, exhibition spaces and cafes
Golden Grove Arts Centre; library foyer exhibition space; Gallery 1855
Cycling and walking trails, dog parks, BMX tracks, playgrounds
Golden Fields Reserve, Bentley Dog Park, Tails Trails Dog Park; shared use paths; over 120 playgrounds
Fees apply for some services. Please refer to our fees and charges register available on our website at www.cttg.sa.gov.au for more details.

2017–2018 Annual Business Plan
23

2017–2018 Annual Business Plan
25
PROJECT PRIORITIES FOR THE YEAR
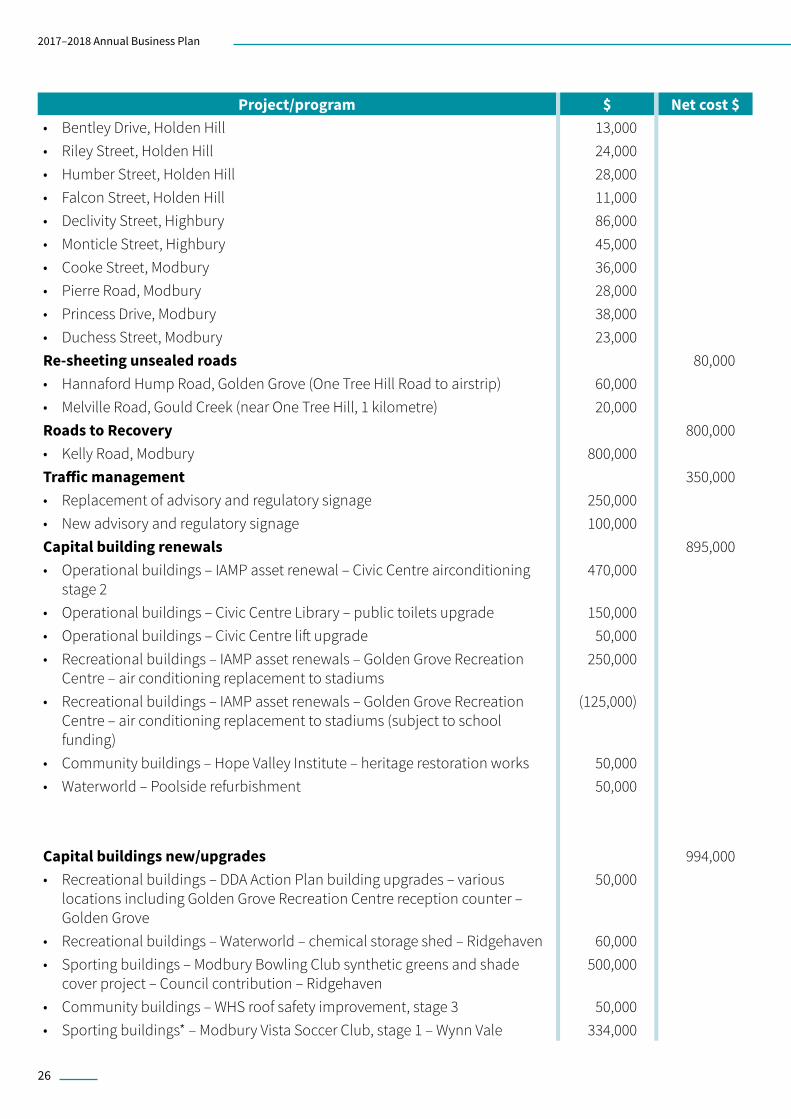
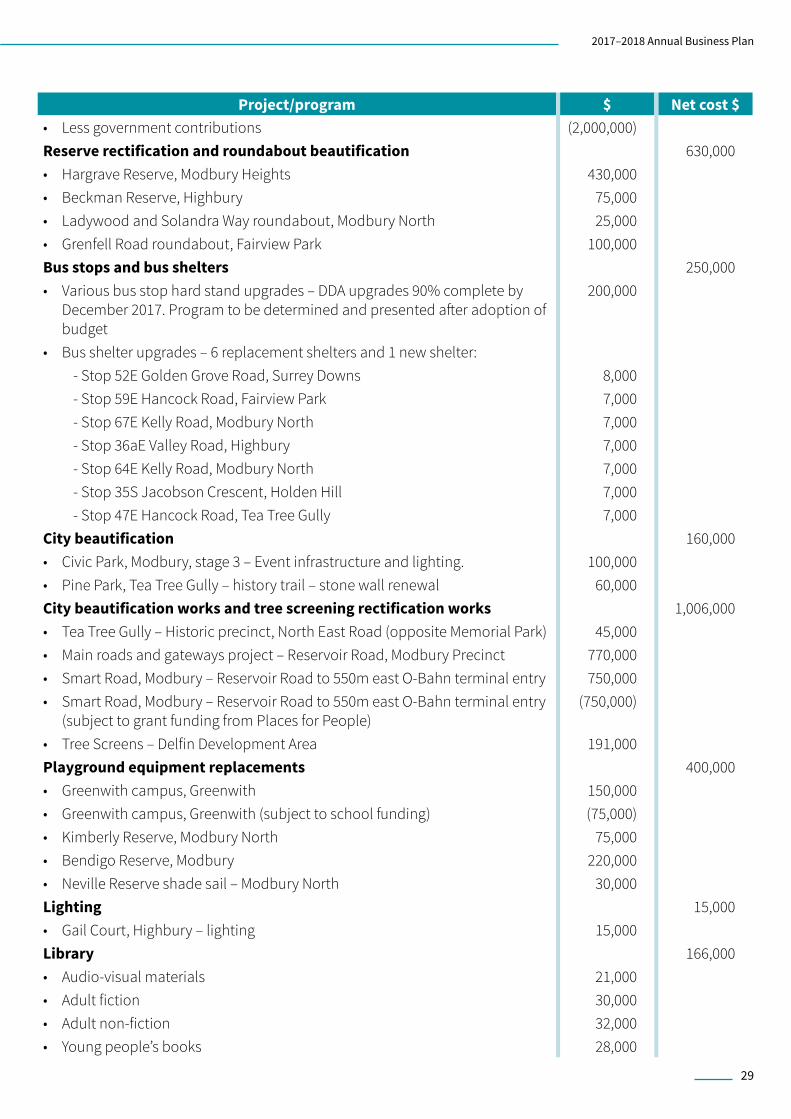
Capital works – programs and projectsNote: The figures in the following table represent Council’s contribution to these projects (net of grants, third party contributions and asset trade-ins).
Project/program $ Net cost $Road reconstruction 1,830,000• Newcombe Drive, Gilles Plains 77,000• Ballard Close, Greenwith 50,000• Dalymple Way, Greenwith 93,000• Welloch Street, Modbury 538,000• Melrose Street, Modbury Heights 340,000• Pineridge Court, Golden Grove 70,000• Elmwood Rise, Golden Grove 305,000• TBA (subject to Council resolution) 357,000Resealing/road kerbing 1,021,000• Scot Road, Dernancourt 22,000• Waninga Drive, Holden Hill 44,000• Morgala Drive, Holden Hill 41,000• Karina Crescent, Holden Hill 27,000• Karina Court, Holden Hill 3,000• Elliot Avenue, Holden Hill 37,000• Malcolm Avenue, Holden Hill 33,000• Graham Avenue, Holden Hill 32,000• The Parade, Holden Hill 66,000• Southern Terrace, Holden Hill 68,000• Brabham Avenue, Holden Hill 50,000• Cortina Avenue, Holden Hill 50,000• Alvis Crescent, Holden Hill 18,000• The Parkway, Holden Hill 24,000• The Driveway, Holden Hill 70,000• Dawe Street, Holden Hill 11,000• Mercedes Drive, Holden Hill 93,000
2017–2018 Annual Business Plan
26
Project/program $ Net cost $• Bentley Drive, Holden Hill 13,000• Riley Street, Holden Hill 24,000• Humber Street, Holden Hill 28,000• Falcon Street, Holden Hill 11,000• Declivity Street, Highbury 86,000• Monticle Street, Highbury 45,000• Cooke Street, Modbury 36,000• Pierre Road, Modbury 28,000• Princess Drive, Modbury 38,000• Duchess Street, Modbury 23,000Re-sheeting unsealed roads 80,000• Hannaford Hump Road, Golden Grove (One Tree Hill Road to airstrip) 60,000• Melville Road, Gould Creek (near One Tree Hill, 1 kilometre) 20,000Roads to Recovery 800,000• Kelly Road, Modbury 800,000Traffic management 350,000• Replacement of advisory and regulatory signage 250,000• New advisory and regulatory signage 100,000Capital building renewals 895,000• Operational buildings – IAMP asset renewal – Civic Centre airconditioning
stage 2 470,000
• Operational buildings – Civic Centre Library – public toilets upgrade 150,000• Operational buildings – Civic Centre lift upgrade 50,000• Recreational buildings – IAMP asset renewals – Golden Grove Recreation
Centre – air conditioning replacement to stadiums 250,000
• Recreational buildings – IAMP asset renewals – Golden Grove Recreation Centre – air conditioning replacement to stadiums (subject to school funding)
(125,000)
• Community buildings – Hope Valley Institute – heritage restoration works 50,000• Waterworld – Poolside refurbishment 50,000
Capital buildings new/upgrades 994,000• Recreational buildings – DDA Action Plan building upgrades – various
locations including Golden Grove Recreation Centre reception counter – Golden Grove
50,000
• Recreational buildings – Waterworld – chemical storage shed – Ridgehaven 60,000• Sporting buildings – Modbury Bowling Club synthetic greens and shade
cover project – Council contribution – Ridgehaven 500,000
• Community buildings – WHS roof safety improvement, stage 3 50,000• Sporting buildings* – Modbury Vista Soccer Club, stage 1 – Wynn Vale 334,000

2017–2018 Annual Business Plan
27
Project/program $ Net cost $Environmental projects 140,000• Waterworld, Ridgehaven – variable speed drive 120,000• Community centres LED upgrades – Surrey Downs, Wynn Vale, Holden Hill 20,000Tennis courts 120,000• Tongariro Street tennis courts upgrade (Bernacchi Reserve, Greenwith) 120,000Fencing and park furniture 207,000• Haines Road, Banksia Park 15,000• Pistachio Way, Golden Grove 3,000• Hazelnut Court, Golden Grove 3,000• Johneff Court, St Agnes 3,000• Smart Road, Modbury 1,000• Hancock Road, St Agnes (2 sites) 9,000• Avago Street, St Agnes 3,000• Atlantis Drive, Golden Grove 10,000• Shared fencing – 50% shared with ratepayer on application 70,000• Replacement of picnic tables, bbqs, park benches 15,000• New picnic tables, bbqs, park benches 15,000• Ilyarrie Reserve 60,000Drainage construction 515,000• Korong Street flood mitigation – major flooding occurring in Korong Street
and surrounds (upstream and downstream) – Hope Valley 200,000
• Oratanga Road culvert rehabilitation – rehabilitation of a large street culvert on corner of Oratanga and Golden Grove Roads – Ridgehaven
75,000
• Drainage construction Southern Terrace – flooding pits and pipelines are at or over flow capacity – Holden Hill
50,000
• Drainage construction Dale Avenue – flooding pits and pipelines are at or over flow capacity – Ridgehaven
50,000
• Drainage construction Grand Junction Road – stormwater management works and flood mitigation – Hope Valley
140,000
CWMS renewal 400,000• Grenfell Road – CWMS trunk main renewal – Fairview Park 400,000Bridge renewal 25,000• Beckman Reserve, Highbury – footbridge 50,000• Beckman Reserve, Highbury – footbridge (subject to school funding) (25,000)Irrigation replacement 131,000• Wynn Vale Oval, Wynn Vale – irrigation replacement (subject to school
funding) 140,000
• Wynn Vale Oval, Wynn Vale – irrigation replacement (subject to school funding)
(94,000)
• Hope Valley Oval, Hope Valley – bore pump 20,000• Linear Park – new installation 65,000

2017–2018 Annual Business Plan
28
Project/program $ Net cost $Service centre refurbishment 4,000,000• Fit out and divestment costs – to be determined in consultation with
architects and staff – Golden Grove 4,000,000
Plant and equipment 1,683,000• Major plant 1,075,000• Minor plant vehicles 373,000• SCADA – Gather of data real-time 150,000• Exponare – mapping upgrade 85,000Information technology 1,247,000• Implement Asset Management Information Systems (AMIS) – ongoing 150,000• Content management and collaboration – a new electronic document
record system, a new customer relationship management solution and a new online smart form solution
160,000
• IT asset management renewal – ICT hardware at end of life 149,000• Office365 – upgrade Microsoft software to the latest version 85,000• Telephone system – upgrade at end of life 133,000• Role based devices – ICT devices for staff and community 450,000• Business process and data quality improvement – enhance the customer
experience by expanding the use of smart forms and work flow for business process efficiencies
100,000
• Provide public wi-fi to compliment current WAN tender 20,000Unsealed footpaths 448,000• Doxiadis Reserve north, St Agnes – Mumford Avenue to Kokoda Trail 44,000• Doxiadis Reserve south, St Agnes – Mumford Avenue to Doxiadis Street 17,000• Mumford Reserve, St Agnes – Hancock Road to Mumford Avenue 70,000• Cobbler Creek, Greenwith – extend existing path to second bridge 27,000• Jack High Lane, Ridgehaven – through to existing path at dog park 9,000• Famechon Reserve, Modbury North – from existing path to Solandra
Crescent 50,000
• Carruthers West Reserve, Modbury North – Carruthers Drive to McIntyre Road
24,000
• Path from north end Capulet Crescent, Modbury to McIntyre Road bus stop 8,000• Path from south end Capulet Crescent, Modbury to McIntyre Road bus stop 8,000• Fairleigh Reserve, Modbury North – Ladywood Road to Rawlings Road 65,000• Jubilee Reserve, Wynn Vale – Grenfell Road to school adjacent De Castella
Avenue 76,000
• Pine Park, Tea Tree Gully – history trail. Total project cost $110,000 (only the provision of a gravel footpath is agreed on at this stage)
50,000
O-Bahn replacement footpath 200,000• Grand Junction Road to Waninga Avenue, Holden Hill 200,000New footpaths 1,000,000• New footpaths 3,000,000
2017–2018 Annual Business Plan
29
Project/program $ Net cost $• Less government contributions (2,000,000)Reserve rectification and roundabout beautification 630,000• Hargrave Reserve, Modbury Heights 430,000• Beckman Reserve, Highbury 75,000• Ladywood and Solandra Way roundabout, Modbury North 25,000• Grenfell Road roundabout, Fairview Park 100,000Bus stops and bus shelters 250,000• Various bus stop hard stand upgrades – DDA upgrades 90% complete by
December 2017. Program to be determined and presented after adoption of budget
200,000
• Bus shelter upgrades – 6 replacement shelters and 1 new shelter: - Stop 52E Golden Grove Road, Surrey Downs 8,000- Stop 59E Hancock Road, Fairview Park 7,000- Stop 67E Kelly Road, Modbury North 7,000- Stop 36aE Valley Road, Highbury 7,000- Stop 64E Kelly Road, Modbury North 7,000- Stop 35S Jacobson Crescent, Holden Hill 7,000- Stop 47E Hancock Road, Tea Tree Gully 7,000
City beautification 160,000• Civic Park, Modbury, stage 3 – Event infrastructure and lighting. 100,000• Pine Park, Tea Tree Gully – history trail – stone wall renewal 60,000City beautification works and tree screening rectification works 1,006,000• Tea Tree Gully – Historic precinct, North East Road (opposite Memorial Park) 45,000• Main roads and gateways project – Reservoir Road, Modbury Precinct 770,000• Smart Road, Modbury – Reservoir Road to 550m east O-Bahn terminal entry 750,000• Smart Road, Modbury – Reservoir Road to 550m east O-Bahn terminal entry
(subject to grant funding from Places for People) (750,000)
• Tree Screens – Delfin Development Area 191,000Playground equipment replacements 400,000• Greenwith campus, Greenwith 150,000• Greenwith campus, Greenwith (subject to school funding) (75,000)• Kimberly Reserve, Modbury North 75,000• Bendigo Reserve, Modbury 220,000• Neville Reserve shade sail – Modbury North 30,000Lighting 15,000• Gail Court, Highbury – lighting 15,000Library 166,000• Audio-visual materials 21,000• Adult fiction 30,000• Adult non-fiction 32,000• Young people’s books 28,000

2017–2018 Annual Business Plan
30
Project/program $ Net cost $• Periodicals 31,000• Materials 24,000Other 1,539,500• Golden Grove Arts Centre, Golden Grove 40,000• Projects with grant funding (to be determined) 866,000• 2020 Sporting Facility Expansion program – Modbury Sporting Complex
boundary fencing and retaining wall 150,000
• 2020 Sporting Facility Expansion program – Modbury Sporting Complex boundary fencing and retaining wall (approved grant funding)
(30,000)
• Main Roads and Gateways – Smart Road, Hatherleigh Avenue to TAFE 721,000• Main Roads and Gateways – Smart Road, Hatherleigh Avenue to TAFE
(approved grant funding) (144,000)
• Open Space Contribution works – Immanuel Reserve 82,500Car Parking 192,000• U3A upgrade of eastern section of northern car park at the Adult Education
Centre located at 22 Golden Grove Road, Modbury North 192,000
*Subject to sale of Wynn Vale Community Building

2017–2018 Annual Business Plan
31
Infrastructure Asset Management PlansCouncil has developed and adopted various infrastructure asset management plans (IAMPs) which include detailed information about assets, including actions to provide an agreed level of service in the most cost-effective manner. The plans define which services are to be provided, how they will be provided and what funds will be required to support them for the next ten years.
IAMPs are one of a number of key components of the LTFP.
Providing infrastructure services in a sustainable manner requires the matching and managing of service levels, risks, projected expenditures and financing, at least for the first few years of the asset management plan and ideally over the ten year lifespan of the LTFP.
We have adopted an asset management strategy that sets a range of strategic priorities; this will enable us to further improve our asset management practices. The overall strategy and individual IAMPs that were reviewed last year will form a robust framework to help us plan both short and long term service delivery.
At all times we seek to match the perceived service needs of the community with our ability to fund them, hence maximising community benefits within budgetary constraints.
IAMPs have been developed for managing infrastructure such as roads, footpaths, buildings, stormwater, community wastewater and the Waterworld Aquatic Centre.
For example, the Roads IAMP proposes the resurfacing of roads using Aslphaltic concrete (hotmix). It is essential to resurface roads at the optimum time in their life cycle in order to protect the underlying pavement. Accordingly, Council will need to continuously refine and adjust the Roads IAMP and the LTFP in order to best manage our roads infrastructure.
The Footpaths IAMP proposes the ongoing renewal of unsealed footpaths through reserves, while most of the sealed footpath network is in relatively good condition. Council will continue to construct footpaths and off-road cycle paths to expand pedestrian and cycling networks.
The Buildings IAMP requires inspections to be conducted of Council’s assets, especially those nearing the end of their useful life, to ascertain the required budget allocation to best manage these assets.
Council’s stormwater and community wastewater assets have long lives and it is predicted that only a small number of earthenware pipes will need replacement. However, the pipe networks are buried and although we have a general idea of their condition, we will need to continue our regular inspections and budget for unforeseen events that may require replacement works to pipes or pits.
We will also continue to achieve cost savings and efficiencies by reducing expenditure, reviewing assets and services and achieving significant procurement savings.
We will also continue to achieve cost savings and efficiencies by reducing expenditure, reviewing assets and services and achieving significant procurement savings.
Full details of Council’s IAMPs are available on our website at cttg.sa.gov.au
Service Centre Fitout
In 2018 we will continue with the refurbishment of our new service centre to ensure we remain operationally effective, safe and compliant. This will require an initial investment of $4 million in 2017–2018 and a further investment in future years.
Council is conscious of its debt level and has forecast to maintain the debt level within the targeted range of 25–35% of its revenue over the life of the LTFP.
Prior to finalisation of the Annual Business Plan, Council may consider a cost benefit analysis of staging the project over one, two, three or more years. At present, the Annual Business Plan assumes that the project will be completed over a minimum of three years, however, if there are benefits for the community, this may change. From a financial perspective, the decision to move forward the project or not will not impact the LTFP adversely over a cumulative three to four year period, but may change our financial projections in the early years, including 2017-2018.

2017–2018 Annual Business Plan
32

2017–2018 Annual Business Plan
33
MEASURING PERFORMANCE OBJECTIVES FOR THE YEAR
The following pages outline our key actions linked to the Strategic Plan and Organisation Plan for the financial year 2017–2018.
SP1 Healthy and Safe – People in our community are healthy and safe.
Aspiration
Our community is healthy and safe.
Strategic objective Desired outcomes Action MeasuresSP 1.1.1 A community where people are safe in our public places and spaces
People can safely move around our City
Select, design and construct Disability Discrimination Act (DDA) accessible bus stops and shelters in accordance with the legislative requirements and standards
Installation of bus stop hard stands and shelters that comply with Disability Discrimination Act requirements
Develop a Bus Shelter Management Plan
Asset Management Plan developed
Mandatory regulatory, advisory and directional traffic control devices in accordance with the Capital Works Program
Devices installed in accordance with Australian Standards
Install pavement marking, pedestrian signals and safety bar layouts in accordance with the Capital Works Program
Pavement markings and devices are installed in accordance with the approved works schedule

2017–2018 Annual Business Plan
34
Strategic objective Desired outcomes Action MeasuresMaintain the existing road network through inspections, maintenance, reconstructions and resealing in accordance with the Roads Transport Infrastructure and Asset Management Plan
Further details can be found in the Capital Works Program
The Capital Works Program is fully funded and works are performed in accordance with the program. Average condition of roads is maintained to relevant standards
Guard fence installation at Perseverance Road
Devices installed in accordance with Australian Standards
Buildings and facilities that are fit for purpose and meet the needs of the community
Maintain Council buildings in accordance with the Buildings Asset Management Plan
Inspections completed and rectification works scheduled
Golden Grove Recreation Centre stadium air conditioning replacement
Works completed in accordance with works program and budget
Stage two Civic Centre air conditioning end of life replacement
Stage two works completed
Replace the lighting desk to ensure continued operations at Golden Grove Arts Centre
Works completed in accordance with works program and budget
Install purpose built chemical storage shed at Waterworld as per chemical audit recommendations
Works completed in accordance with works program and budget
Waterworld poolside refurbishment
Works completed in accordance with works program and budget
Gail Court lighting upgrade Devices installed in accordance with Australian Standards
Civic Centre lift upgrade Works completed in accordance with agreed schedule with lessee

2017–2018 Annual Business Plan
35
Strategic objective Desired outcomes Action MeasuresSupport good health and community wellbeing by meeting our obligations under the Public Health Act and Local Government Act
Deliver actions and report to Council and SA Health on our performance against the Public Health Act
Actions are completed with regular reporting to both Council and SA Health
Provision of kerbside waste and recycling services for collection and processing
Maintain community satisfaction levels as identified in the community survey
Upgrade and refurbishment of Tea Tree Gully Library public toilets
Works completed in accordance with works program and budget
Upgrade existing Community Wastewater Management System (CWMS) infrastructure on Grenfell Road, Fairview Park
The provision of a working septic waste system
Minimise public health impacts by maintaining and operating the Community Wastewater Management System network
Works completed in accordance with works program and budget
Develop a Community Wastewater Management System strategy to meet future community requirements
Strategy developed
SP 1.1.2 A community where people are safe during emergences, natural disasters and during extreme climactic events such as storms or heatwaves
Plans and initiatives are in place that enable Council to effectively respond to emergency events
Review council’s emergency management arrangements in the context of new SA emergency management legislation and publications, including the impact on Council’s Emergency Management Plan and Business Continuity Plan
Emergency management review completed
Bushfire mitigation activities are tracked and measured and align with relevant regional and state strategies
Bushfire mitigation activities are completed and reported to Council
Maintain fire tracks in a safe and fit for purpose condition
Fire tracks maintained as scheduled

2017–2018 Annual Business Plan
36
Strategic objective Desired outcomes Action MeasuresProtect streets and properties from flooding by operating and maintaining the stormwater network in accordance with the Stormwater Asset Management Plan
Works completed in accordance with Capital Works Program and budget
Beckman Reserve footbridge renewal
Works completed in accordance with Capital Works program and budget
SP 1.1.3 A community where people have easy access to places, spaces and services that support good health
The community has access to an appropriate range of good quality and accessible sporting and recreation facilities and programs that will provide opportunities for individuals and groups to be creative and remain physically and mentally active
Implement a playground capital works program, including regular inspections, ensuring works carried out align with Council’s adopted budget
Further details can be found in Council’s Capital Works Program
Works completed in accordance with Capital Works Program and budget including playground equipment replacement at Greenwith Campus and Bendigo Reserve
Construct female change rooms for Modbury Vista Soccer Club at Richardson Reserve to cater for increasing female participation and to comply with Football Federation of SA regulations
Upgrade complete and complies with Football Federation of SA regulations
Assist residents to remain living independently at home and in their community
Deliver outputs required as part of the external funding agreement
Deliver a range of activities which promote overall health and wellbeing
Increase community wellbeing, “feeling part of our community” as per 2016 Council survey, from 46% to 50% enabling residents to remain active and involved in their community
Maintain and manage existing turf quality
Increased performance of identified turf areas in accordance with Capital Works Program

2017–2018 Annual Business Plan
37
Strategic objective Desired outcomes Action MeasuresDisability Discrimination Act (DDA) plan upgrades including the reception area and front counter at Golden Grove Recreation Centre
Works completed in accordance with works program and budget
Deliver the upgrade to the Modbury Bowling Club synthetic greens and shade cover project
Works completed in accordance with works program and budget
Review the Disability Discrimination Act Access Action Plan and Ageing Strategy
Reviewed documents adopted by Council
Continue to review the Open Space Strategy
Report to Council detailing options and timing
Upgrade Bernacchi Reserve tennis courts (Tongariro Street)
Works completed in accordance with works program and budget
Strategically partner and collaborate with external service providers, government bodies and non-profit organisations, service clubs and community groups to ensure access to services and programs that promote community wellbeing
Number of programs and services offered via partnership approach that offer wellbeing outcomes
O-Bahn replacement footpath
Works completed in accordance with works program and budget
Hargrave Reserve upgrade Works completed in accordance with works program and budget
Beckman Reserve and Kimberley Reserve upgrades
Works completed in accordance with works program and budget
Stage three roof safety improvements
U3A northern carpark upgrade
Works completed in accordance with works program and budget
Works completed

2017–2018 Annual Business Plan
38
SP2 Prosperous and connected – Our local economy prospers and people have a sense of purpose and belonging.
Aspiration
Our local economy prospers and people feel a sense of purpose and belonging.
Strategic objective Desired outcomes Action MeasuresSP 2.1.1 A community that has a say in decisions that affect them
The community has fair and even representation on Council with the ability to have a say in decisions that affect them
Finalise the electoral representation review in accordance with the schedule and requirements established under the Local Government Act 1999 (s12–34)
Electoral representation review is completed by the due date
Conduct the annual community survey and the ‘have your say’ promotional campaign
Increase in the relevant community survey score to 60%
Implement strategies for Community Panel recruitment focusing on the under 40 age category
Strategies developed which support an increase in the target age group
SP 2.1.2 A community that participates in meaningful community and economic activities
Through hosting events people perceive the Tea Tree Gully Council area to be inclusive, exciting, forward thinking, fun and an enjoyable place to live, generating civic pride and attracting the interest of the community and other stakeholders, including private enterprise, through sponsorship and development
Maintain and improve the current major events program in line with the Events and Activation Model
Delivery of the major events program is endorsed by Council
Delivery of four citizenship ceremonies
Citizenship ceremonies are delivered on time and within budget

2017–2018 Annual Business Plan
39
Strategic objective Desired outcomes Action MeasuresPromote the Events Sponsorship Program with a focus on positioning our City as a destination of choice for large and small scale events
Attract events to the City that activate and complement Strategic plans and/or endorsed Events and Activation Model
Individuals and the community have a sense of belonging and have opportunities to volunteer and to develop skills, including leadership skills
Provide a range of free and low-cost programs and activities to enable the community to gain a new life skill and/or participate in volunteering
The number of programs and activities; percentage of participants who feel they have gained/increased a skill; number of volunteer opportunities provided
Residents are supported to remain independent at home and in their community
Partner with the state government through the Active Ageing Program to deliver the funding objectives for eligible residents
Outputs delivered as per program
Increased connections within the community
Integrate place-making into design and construction practices with a focus on precincts
Review completed and recommendations implemented
Review all active ageing programs and develop new programs that respond to community needs
Review completed and recommendations implemented
Explore opportunities for neighbourhood development activities to promote community connections
Increase the connectedness score in Council’s community survey
SP 2.1.3 A community with a resilient local economy
Council supports investment, economic development and activity in our city
Undertake a review to determine the effectiveness of the Development Assessment Business Advisory Service offered to applicants that lodge commercial applications. Implement changes or other strategies as necessary
An effective DA Advisory Service to assist with the efficient processing of commercial development applications
Continue meetings of the Economic Development Steering Group
Economic Development Steering Group meet regularly and meet their Terms of Reference

2017–2018 Annual Business Plan
40
Strategic objective Desired outcomes Action MeasuresProvide support for small businesses and monitor and report on performance quarterly to Council
Quarterly reports submitted to Council
Case manage new investment and development opportunities in the City and in particular Modbury Precinct
New investment and development opportunities are realised
Consultation and finalisation of a review of the Centres, Light Industry and Commercial Zones Development Plan Amendment with a focus on encouraging greater economic activity
Development Plan Amendment completed and endorsed by Council for referral to the Minister
Conduct a review of Council’s Reconciliation Action Plan
Review completed and recommendations implemented
Amend the procurement quotation approach as per recommendations from the Audit/Council meeting
Procurement quotation approach addresses the Audit/Council meeting recommendations
SP 2.1.4 A community where people have the resources and capacity to achieve goals
Digital technologies and services create opportunities for the community to interact and learn
Provide a range of free and low-cost programs and activities to enable community members to participate and/or contribute to the community
Community members increase skill set, either life skills or employability, via volunteering
Deliver public access to wi-fi at suitable congregation points and recreation centres (to support online scoring)
Implement as per scheduled works and approved budget
Local community groups, organisations and individuals have access to funding and services to help achieve their projects, events, activities or initiatives
Deliver the Community Development Grants Program to support local groups and organisations
Grants are fully subscribed and taken up by the approved applicants
Supply of new/current/refreshed Library materials
Materials purchased as per the approved budget

2017–2018 Annual Business Plan
41
SP3 Vibrant and liveable – Our City is a desirable and sustainable place to live.
Aspiration
Our city is a desirable and sustainable place to live.
Strategic objective Desired outcomes Action MeasuresSP 3.1.1 A city that is made up of places and spaces that are appealing and easy to access
Our places and spaces are developed and maintained to ensure they are easy to access, fit for purpose and well patronised by the community
Maintain the existing footpath network, construct new footpaths and renew bike paths throughout the City in line with the Footpath Construction Strategy and Local Area Bicycle Plan
Further detail can be found in our Capital Works Program
Construction works completed in accordance with the adopted Capital Works Program and budget
Construct unsealed footpaths and bike routes throughout the City in line with the Footpath Construction Strategy
Construction works completed in accordance with the adopted Capital Works Program and budget
Revitalisation of the Modbury Precinct
Regular reporting to Council on the status of actions
Unsealed footpath at Jubilee Reserve Wynn Vale – Grenfell Road to school adjacent De Castella Avenue
Works completed in accordance with the Capital Works Program
Verges are maintained in accordance with the works program
Works completed in accordance with the works schedule and budget
Provision and maintenance of public lighting
Works completed in accordance with the Capital Works Program
Review of Library opening hours
Accessibility to the Library that meets the needs of the community
SP 3.1.2 A community with a diverse range of housing to suit a variety of needs, life stages and lifestyles
Investment in the economy and population diversity in Modbury Precinct increases
Continue implementation of the marketing campaign to attract investment and the target population to the Modbury Precinct
Campaign initiatives implemented

2017–2018 Annual Business Plan
42
Strategic objective Desired outcomes Action MeasuresUpgrade streetscapes in Modbury Precinct to deliver the objectives of the Modbury Precinct Activation Strategy and Landscape Style Guide
Streetscapes upgraded and new investment attracted
Main roads and gateways project on Reservoir Road
Works completed in accordance with the Capital Works Program
Clear long-term direction for growth and development for the City
Explore opportunities for the strategic development or sale of Council land
Identified opportunities presented to Council
SP 3.1.3 A sustainable city that has a healthy natural environment and is resilient to climate change
Council’s infrastructure, including parks, reserves and streetscapes are resilient to climate change whilst maintaining their functionality and appeal to the community
Amend Council’s Mulch Replacement Program to increase the aesthetics of parks while reducing water use and increasing plant health
Complete review and implement the recommendations
Implement year five of the 5-year action plan actions for the Dry Creek restoration project
Actions implemented as per the Capital Works Program
Implement the Resilient East Climate Change Adaptation Plan in collaboration with partnering councils and stakeholders (heat island mapping)
Resilient East Climate Change Adaptation Plan is implemented
Develop an integrated water management strategy to provide resilience and water supply security
Strategy is developed and endorsed by Council
Variable speed drive at Waterworld
Works completed in accordance with the Capital Works Program and maintenance schedules
Maintain and operate irrigation systems in accordance with the Irrigation Management Plan
Works completed in accordance with the Capital Works Program and maintenance schedules

2017–2018 Annual Business Plan
43
Strategic objective Desired outcomes Action MeasuresCouncil continuously looks for ways to implement environmentally sustainability initiatives
Implement the CTTG Climate Change Action Plan – LED lighting upgrades at Surrey Downs, Wynn Vale and Holden Hill
Works completed in accordance with the Capital Works Program and maintenance schedules
Greenwith Community Building lighting upgrade
Works completed in accordance with the Capital Works Program and maintenance schedules
Provide a free Envirocare service in order to encourage the recycling of green waste
Envirocare events held as per adopted schedule
All Solo trucks rebranded. Education campaign designed and implemented
Education campaign implemented
The community has access to healthy and sustainable natural environments
Review the Biodiversity Strategy and implement actions as recommended
Biodiversity Strategy provided to Council for finalisation
Maintain tree assets within the City with reference to the Tree Management Policy
Works performed in accordance with works schedules and budget
Horticultural maintenance of reserves and streetscapes across the City
Works performed in accordance with works schedules and budget
Provide a cleaner stormwater catchment by maintaining street cleanliness via our street sweeping program
Works performed in accordance with works schedules and budget
SP 3.1.4 A places that expresses a unique character and identity, an area that inspires pride in its residents and one that people enjoy visiting
A vibrant and liveable city that people are proud of
Monitor and advocate for the delivery of the Tea Tree Gully Township Precinct Plan
Delivery of actions for adopted action plans
Official events implemented as guided by the Major Events Policy associated with capital works of open spaces, playgrounds and cycleway with a budget exceeding $200,000
Official events conducted and are in accordance with the Major Events Policy

2017–2018 Annual Business Plan
44
Strategic objective Desired outcomes Action MeasuresCivic Park event infrastructure upgrade, including lighting
Works performed in accordance with work schedules and budget
Raise awareness and showcase the liveability of the City and its precincts by creating and implementing events and initiatives that appeal to an identified demographic
Delivery of activation events
City Beautification Program including, landscape treatments, reserve rectifications and round-a-bout beautification
Further details can be found in the Capital Works Program
Works completed in accordance with the Capital Works Program
Removal of graffiti from public infrastructure within specified timeframes and maintain street entrance statements
The timely removal of graffiti around the City
Removal of illegally dumped rubbish throughout the City
Rubbish removal in a timely manner
Install and renew fencing and park furniture in accordance with the Capital Works Program
Further details can be found in the Capital Works Program
Works completed in accordance with the Capital Works Program
Tree screen rectification works including Tea Tree Gully Township, Smart Road, Delfin Development Area
Works completed in accordance with the Capital Works Program
Identify upgrade and activation initiatives in the Modbury Precinct and prepare concept plans that have a whole of site approach, for delivery
Whole of site plans developed as required

2017–2018 Annual Business Plan
45
Strategic objective Desired outcomes Action MeasuresA community that is proud of its heritage while still respecting and promoting diversity
Implement Council’s Reconciliation Action Plan
Actions implemented as recommended
Hope Valley Institute heritage restoration works
Works completed in accordance with Capital Works Program and budget
Pine Park History Trail upgrade – stage one gravel footpath
Works completed in accordance with Capital Works Program and budget
Pine Park History Trail upgrade – stage one stone wall repairs
Works completed in accordance with Capital Works Program and budget
OP1 People and leadership – Our people are engaged and make a meaningful contribution to organisational success.
Aspiration
We have a positive, high-performing culture.
Organisation objective
Desired outcomes Action Measures
OP 1.1.1 Our values are role-modelled across all areas of the organisation
Our corporate leaders share our vision and purpose and are leading a positive culture that engages its employees
A strategy is in place to address the outcomes of the 2017 Culture Survey
Improved culture measured at our next culture survey
OP 1.1.2 Our behaviours align with our values
We move closer towards our preferred culture
Conduct a review and refresh of corporate values to align with the Organisation Plan, vision and purpose
Review completed
Aspiration
We have a skilled, agile and capable workforce.
Organisation objective
Desired outcomes Action Measures
OP 1.2.1 We understand our business needs and adapt accordingly
Staff are appropriately skilled to deliver critical services to the community
Implementation of year one of the 3-year plan for training all staff in the identified core competencies
Training delivered
Change management training is provided to all corporate leaders
Training delivered
2017–2018 Annual Business Plan
46
Organisation objective
Desired outcomes Action Measures
Implement technologies to suit different workforce personas and improve collaboration and learning spaces
Technologies implemented
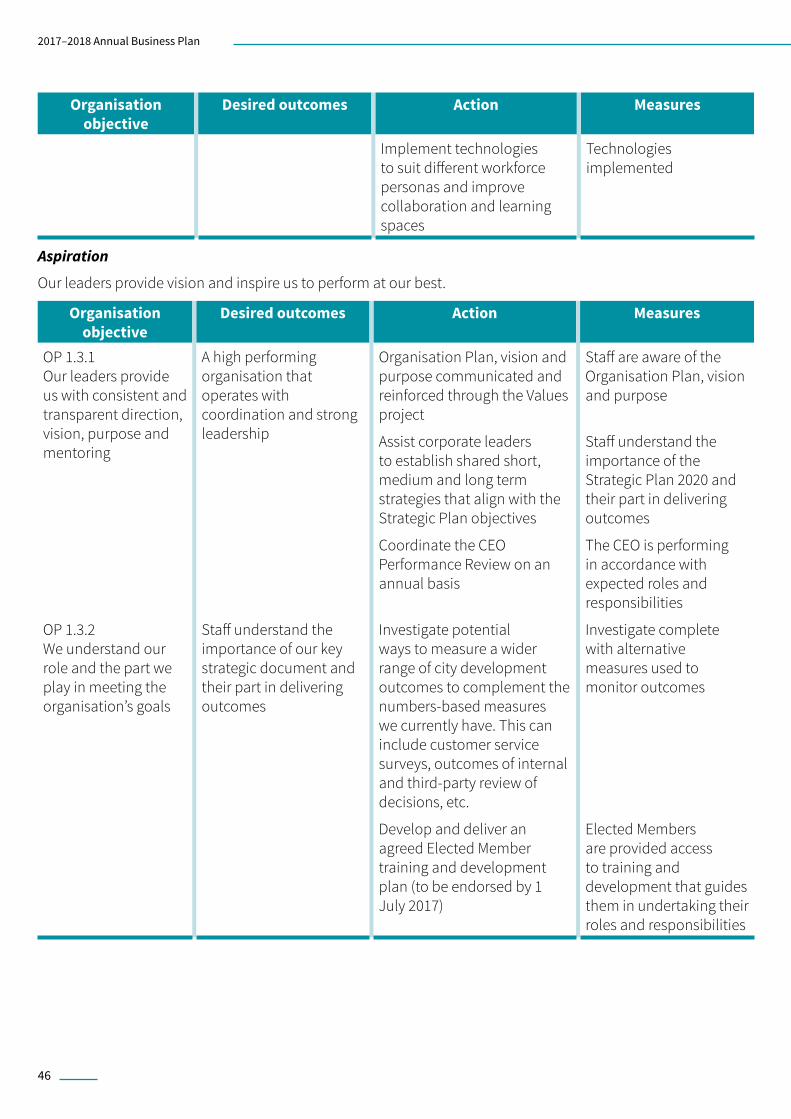
Aspiration
Our leaders provide vision and inspire us to perform at our best.
Organisation objective
Desired outcomes Action Measures
OP 1.3.1 Our leaders provide us with consistent and transparent direction, vision, purpose and mentoring
A high performing organisation that operates with coordination and strong leadership
Organisation Plan, vision and purpose communicated and reinforced through the Values project
Staff are aware of the Organisation Plan, vision and purpose
Assist corporate leaders to establish shared short, medium and long term strategies that align with the Strategic Plan objectives
Staff understand the importance of the Strategic Plan 2020 and their part in delivering outcomes
Coordinate the CEO Performance Review on an annual basis
The CEO is performing in accordance with expected roles and responsibilities
OP 1.3.2 We understand our role and the part we play in meeting the organisation’s goals
Staff understand the importance of our key strategic document and their part in delivering outcomes
Investigate potential ways to measure a wider range of city development outcomes to complement the numbers-based measures we currently have. This can include customer service surveys, outcomes of internal and third-party review of decisions, etc.
Investigate complete with alternative measures used to monitor outcomes
Develop and deliver an agreed Elected Member training and development plan (to be endorsed by 1 July 2017)
Elected Members are provided access to training and development that guides them in undertaking their roles and responsibilities
2017–2018 Annual Business Plan
47
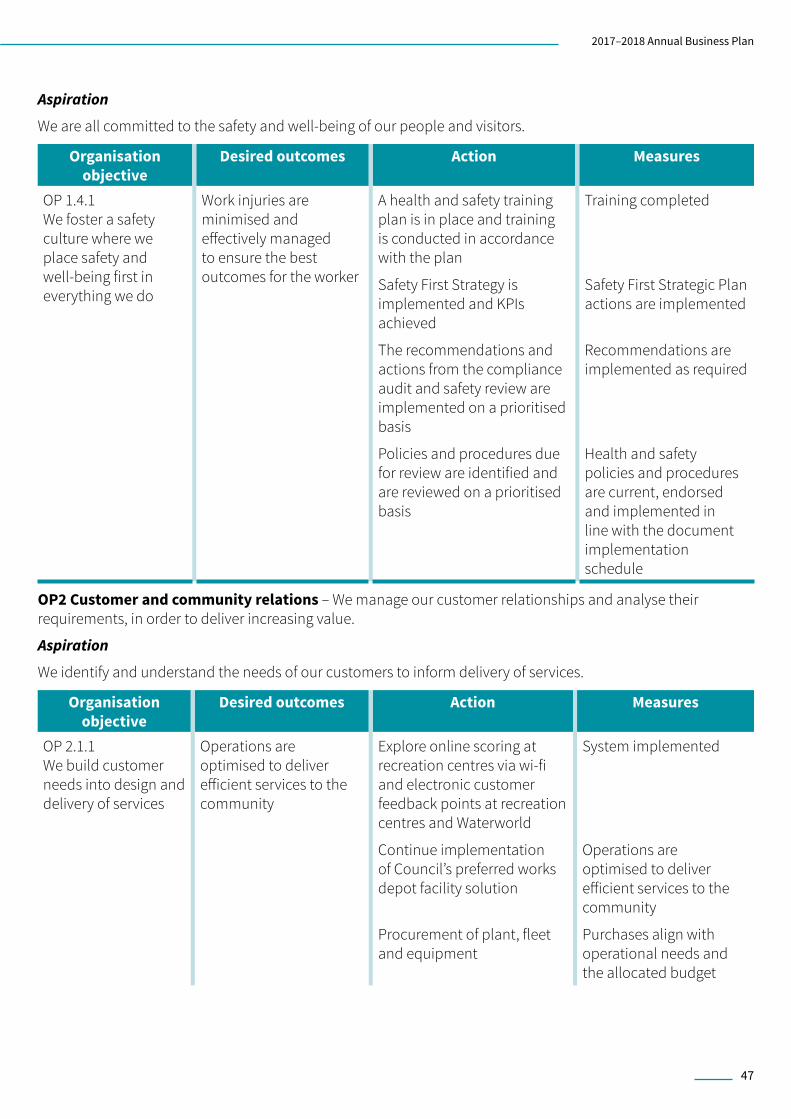
Aspiration
We are all committed to the safety and well-being of our people and visitors.
Organisation objective
Desired outcomes Action Measures
OP 1.4.1 We foster a safety culture where we place safety and well-being first in everything we do
Work injuries are minimised and effectively managed to ensure the best outcomes for the worker
A health and safety training plan is in place and training is conducted in accordance with the plan
Training completed
Safety First Strategy is implemented and KPIs achieved
Safety First Strategic Plan actions are implemented
The recommendations and actions from the compliance audit and safety review are implemented on a prioritised basis
Recommendations are implemented as required
Policies and procedures due for review are identified and are reviewed on a prioritised basis
Health and safety policies and procedures are current, endorsed and implemented in line with the document implementation schedule
OP2 Customer and community relations – We manage our customer relationships and analyse their requirements, in order to deliver increasing value.
Aspiration
We identify and understand the needs of our customers to inform delivery of services.
Organisation objective
Desired outcomes Action Measures
OP 2.1.1 We build customer needs into design and delivery of services
Operations are optimised to deliver efficient services to the community
Explore online scoring at recreation centres via wi-fi and electronic customer feedback points at recreation centres and Waterworld
System implemented
Continue implementation of Council’s preferred works depot facility solution
Operations are optimised to deliver efficient services to the community
Procurement of plant, fleet and equipment
Purchases align with operational needs and the allocated budget

2017–2018 Annual Business Plan
48
Organisation objective
Desired outcomes Action Measures
Programs, services and open spaces are provided to the community with options to improve health and well-being
Review recreation and wellbeing programs and services provided to the community and execute planning activities as per approved policy, procedure or other agreement
Programs, projects and services implemented as per policies, plans and other agreements
OP 2.1.2 We ensure all contact has a customer focus
Customers interact with Council in a variety of ways that match their preferences
Optimise phone system and leverage off digital workplace initiatives (unified communications). Develop service levels and processes for 24/7 phone service
Move ‘out of hours’ phone contact from urgent to business as usual (24/7 telephone service)
Carry out annual Customer Preference Survey to inform improvements to customer contact and communications channels. Carry out annual Customer Benchmarking Survey to understand customer satisfaction levels with the delivery of Council services
Survey completed and action plan developed
Aspiration
We establish and embed the notion of positive customer experience into all services
Organisation objective
Desired outcomes Action Measures
OP 2.2.1 We will deliver services in a way that enhances the customer experiences
We provide services that are valued by the community
Ensure that the Customer Experience Program is continued to be implemented through the Customer First Program
Positive results from the Customer Survey value for money for rates paid (>2%) and customer satisfaction (<3%)
Implement smart forms and data quality improvement for priority business processes, including the Name and Address Register
Smart forms and improvements implemented

2017–2018 Annual Business Plan
49
Aspiration
We connect with our customers and relate more closely to their perceptions and experiences.
Organisation objective
Desired outcomes Action Measures
OP 2.3.1 We provide information that is relevant, current and meaningful through accessible channels
Staff and Elected Members have relevant data and information that assists with decision making
Monitor external trends that are relevant to our business and provide commentary to inform other departments and Elected Members. Review annually how effective the process and information has been
Data and trend information presented to Council and staff
OP 2.3.2 We show understanding, compassion and courtesy in customer interactions and communications
The individual needs and motivations of volunteers are responded to whenever possible
Feedback mechanisms are used to measure volunteer experience. Measuring volunteer satisfaction levels through annual survey
Volunteer satisfaction levels are measured and monitored
OP3 Governance – We define the roles, powers and responsibilities within the organisation.
Aspiration
We make informed decisions.
Organisation objective
Desired outcomes Action Measures
OP 3.1.1 Our people are empowered to make decisions
Corporate leaders and elected members have relevant information about performance that assists with decision-making
The status of Strategic and Organisation KPIs are reported on a quarterly basis
Reports presented quarterly
OP 3.1.2 The decision-making process is transparent and based on evidence
Council is aware of the outcomes from its decision-making
Regular reporting occurs on status/outcomes of Council and committee decisions
Status/outcomes of Council and committee decisions are reported at every ordinary Council or committee meeting

2017–2018 Annual Business Plan
50
Aspiration
We take a balanced approach to risk.
Organisation objective
Desired outcomes Action Measures
OP 3.2.1 We understand that risks exist and manage them for positive outcomes
Effective risk management
Deliver the Internal Audit Plan and monitor outstanding high/extreme risks from internal audits
Delivery of the Internal Audit Plan. Monitor and report on high/extreme risks on a bi-monthly basis
Mutual Liability Scheme annual review performed and actions taken where appropriate
Achieve a score greater than the metropolitan council average (if applicable)
Department risk registers to be reviewed every two years, with periodic monitoring and reporting on high and extreme corporate risks
Department risk registers reviewed every two years
Risk assessments for all volunteer programs are up to date and reviewed on a periodic basis
All volunteer activities have been assessed with any identified risks controlled
Review (six monthly) and implement (when required) our Business Continuity Plan to ensure key services are delivered to the community in the event of an emergency
Business Continuity Plan review completed
Aspiration
We have efficient and effective processes that are easy to follow.
Organisation objective
Desired outcomes Action Measures
OP 3.3.1 Our systems and processes are easy to follow and help our people with the decision-making process
Improve quality and consistency of reports presented to Council and committees
Develop report writing guidelines and run associated training sessions
Guideline developed. Staff trained

2017–2018 Annual Business Plan
51
Aspiration
We will be legislatively compliant and have robust and responsive governance.
Organisation objective
Desired outcomes Action Measures
OP 3.4.1 We work proactively to meet our legislative and governance obligations
Transparent and best practice governance processes apply
Production and distribution of Council and committee agendas, reports and minutes in accordance with legislative timeframes
Acceptance of agendas, reports and minutes by Council and committees within legislated timeframes
Work with the state government to implement the new Planning and Design Code, including a review of policies relating to Commercial, Industry and Mineral Extraction Zones
Land use zone policies are aligned with state government priorities and community needs
Review of procedures in line with the review schedule (with every procedure updated within two years)
90% of procedures are updated every two years
Review of Council-endorsed policies in line with review schedule (with every policy reviewed within three years)
90% of policies are updated every three years
Confidential Council and committee meeting items monitored, reviewed and reported on periodically
Six monthly review of confidential items completed

2017–2018 Annual Business Plan
52
OP4 Finance and systems – We use systems and data to show how well we are performing and as a basis for ongoing reviews and improvements.
Aspiration
We are financially sustainable.
Organisation objective
Desired outcomes Action Measures
OP 4.1.1 We meet our financial commitments to the community and organisation
Less reliance on rates revenue to deliver project objectives
Identify and apply for grants to deliver initiatives in the City
Grant monies received
Council achieves financial sustainability
Deliver a robust and accurate financial planning and reporting system that incorporates a balanced budget
Expenditure is within negative 1%–2% range of Councils Quarter 3 budget
The Capital Works Program is delivered within budget
90% (by cost) of the Capital Works Program is delivered within 1% + 2% against the Quarter 3 review period
OP 4.1.2 We allocate resources based on clear priorities
Highest return and best use of Council’s resources
Ensure requests are prioritised according to risk and needs of community. Utilise contractor services to compliment the range of tasks undertaken. Ensure works meet timelines even through seasonal influences
Works are performed in accordance with relevant timelines
Aspiration
We embrace advances in technology to ensure our systems are easy to use and enable us to be effective and efficient.
Organisation objective
Desired outcomes Action Measures
OP 4.2.1 Our systems are relevant, sustainable and meet our needs
A stable, secure and supported IT environment
Various IT related hardware and software initiatives implemented in accordance with the IT Strategy
Supported IT Strategy items implemented
Deliver information technology asset management renewal to provide a platform for a digital strategy
Digital strategy developed and reported

2017–2018 Annual Business Plan
53
Organisation objective
Desired outcomes Action Measures
OP 4.2.2 We collect and analyse useful data in order to aid decision making
Elected Members and corporate leaders have the information that enables them to make decisions that offer the most benefit to the community
Measure and report on the organisation’s performance in delivering our key strategic objectives and actions
Quarterly reports delivered on strategic and organisational key performance indicators
Collect building asset condition data and update Council’s asset management system
Data collected and Council’s asset management system updated
Systems for measuring the economic value and costs associated with volunteering developed
Decision making is made using relevant data about volunteering
Measure and report on the deliverables in the Asset Management Strategy
The Asset Management Strategy deliverables are reported on a regular basis
OP5 Continuous improvement – We encourage innovation and improvement to ensure we continue to deliver value.
Aspiration
We foster a creative culture.
Organisation objective
Desired outcomes Action Measures
OP 5.1.1 We look for new and better ways to improve our processes
Increased staff engagement through participation in the Continuous Improvement Program
Performance improvement processes and tools are developed and corporate leaders understand their responsibilities
Our leaders can access effective systems and practices that support them in creating a culture of high performance
Reduce duplication of effort and achieve cost savings
Establish a corporate document hierarchy and review existing corporate documents to ensure alignment with key strategies and establish a process for ongoing review
Initial review completed with a framework established for the ongoing review of documents
Undertake a review of the dog pound services and the impact that the new Service Centre may have on the way that these services are delivered
Review completed
Continue to implement the Asset Management Information System (AMIS)
System is implemented as per the relevant actions and to budget

2017–2018 Annual Business Plan
54
Aspiration
We include continuous improvement in our daily thinking in order to grow.
Organisation objective
Desired outcomes Action Measures
OP 5.2.1 We work with and learn from others in order to improve the way we work
Access to comparative data to assist with continuous improvement
Implement Microsoft Office 365 and new telephone system to provide better tools for collaboration and communication and reduce IT infrastructure support requirements (aligned with Council Solutions)
A platform for collaborative and mobile workers based at the Civic Centre is established, and for future collaboration across Council Solutions in line with our Digital Strategy
Implement an enterprise content and collaboration solution which integrates with our electronic document records management system (HPE Content Manager)
A system is implemented that integrates with our current electronic records management system
In conjunction with Community Development, implement a volunteer dog walking program
Volunteer dog walking program implemented
Assist the Library in providing a reading to dogs program for children
Program implemented
OP 5.2.2 Improvements are focused on customer benefit
Improve the overall customer experience, internal efficiencies and staff engagement
Complete eight service reviews per annum
Service reviews completed with outcomes reported to Council
OP 5.2.3 We maximise benefits to staff and workplace efficiencies by using creative solutions
Staff are committed to continuously improving work practices
Deliver continuous improvement education sessions across the organisation that promote the benefits of continuous improvement
Increase in the number of sessions run and the number of staff attending
Implement Civic Centre wi-fi and instant messaging/presence services to facilitate greater collaboration and flexible working practices for staff
Reduce volume of email traffic and internal phone calls
Implement the Asset Management Information System (MACK Phase three)
MACK Phase three implemented. Achieve the expected 5% process efficiency gain through MACK implementation


2017–2018 Annual Business Plan
57
FUNDING THE ANNUAL BUSINESS PLAN
We are aiming for an operating surplus of $5.689 million in 2017–2018. This surplus (i.e. the difference between operating revenue and expenses for the financial year) will help us to achieve the five key principles in our Long-Term Financial Plan (LTFP); that is, maintaining debt while ensuring that the capital works program has sufficient funds for new works.
Funding the Annual Business PlanOur Financial Sustainability Policy is an important consideration in preparing this Annual Business Plan. The key components of this policy are:
Operating surplus ratio
The operating surplus ratio (OSR) is a key measure of financial sustainability. It shows the operating surplus (or deficit) as a percentage of general and other rates, excluding rate rebates and revenue from the Natural Resources Management (NRM) levy.
Funded asset and service provision costs
The full cost of providing services to our community is included in our annual budget and LTFP.
We work hard to maintain existing assets, such as playground equipment or community buildings, to maximise their value to us during their life span wherever this is cost-effective and practical. However, when we can no longer keep these assets functioning at a serviceable level, we replace or upgrade them to ensure they continue to remain useful to our community.
The asset sustainability ratio (ASR) is a measure of whether we are renewing or replacing existing non-financial assets at the same rate that our overall stock of assets is wearing out (being depreciated). This ratio is calculated by measuring capital expenditure on asset renewal or replacement relative to the recorded rate of depreciation for the same period. Our target for 2017–2018 is for the cost of renewal or replacement (after deduction of any income from the sale of old assets) to be between 90% and 110% of depreciation when averaged over a period of three years.
Debt limitation
In 2017–2018, given the additional cost of renewing our depot ($4 million), our level of debt will rise by $0.949 million, which includes $200,000 of CWMS works from 2016-2017. To offset this debt we will:
Our long-term financial
sustainability depends on us
ensuring that on average, over time,
our expenses are less than revenue,
and that we continually identify
opportunities to reduce our existing
debt.

2017–2018 Annual Business Plan
58
• Budget to deliver a modest surplus• Confine capital expenditure to $20.590 million
(excludes income from grants and sale of assets) • Fund our future capital expenditure from
depreciation and surplus and continuing to review our operations to deliver the best services in the most cost-effective manner
• Cap, and where possible, reduce our discretionary expenditure.
We believe it is appropriate to operate with a certain level of debt, particularly given the extensive portfolio of assets we hold. We have already funded significant upgrades of intergenerational assets in recent years, such as the Waterworld Aquatic Centre, Montague Road and various sporting and community club upgrades, by using a combination of variable and fixed-rate borrowings, as outlined in our Treasury Management Policy.
We also monitor carefully our net financial liabilities ratio (NFLR), which is a measure of our net financial liabilities expressed as a percentage of total operating income.
Review of assets
We review our assets regularly to make sure they are continuing to meet strategic planning objectives. If we consider that any assets are surplus to Council’s or the community’s needs, we will seek community views on selling them. Any money received is then used to fund capital or refurbishment works in line with our Land Strategy.
In purchasing new assets, we consider:• Our current operating surplus or deficit• Any additional depreciation, maintenance costs
and interest expense on borrowings• The impact of purchase on our operating surplus
or deficit• Any need to increase Council rates to fund the
purchase and/or ongoing maintenance costs• The age, life expectancy, suitability and service
potential of any asset• The discounted cash flow analysis, where
appropriate.
Funds received from any sale of Council land or buildings are to be reinvested in line with our Land Strategy.
Our LTFP includes provision of new assets in future years.
The current depot, located at 114 Tolley Road, St Agnes, has served the community through the provision of city maintenance, infrastructure management and community services since the 1970s. Since it was established, the City of Tea Tree Gully’s population has more than doubled.
The depot is a hub for key support services such as construction and maintenance of roads, footpaths, stormwater, recycled water, parks and buildings, a dog pound and an SES facility; all of these are critically important services for our residents.
The existing depot is now one of the oldest amongst similar council facilities in metropolitan Adelaide. The depot is deficient in almost all key areas of operational effectiveness, safety and compliance.
Council has purchased a site at 1100 Golden Grove Road, Golden Grove and has begun design work on a modern facility to be built at this site while still setting aside the necessary funds to keep the existing depot running.
Funding has been allocated in the draft budget for 2017–2018 to progress the design work and begin refurbishment of the site.
Council rate increase forecast
This Annual Business Plan includes a recommended increase in general rate revenue that reflects the cost of providing existing services at a defined level, as well as the costings outlined in the plans (IAMPS and LTFP).
The rate adjustment takes into account the impact of increasing costs to Council from a combination of all the following factors:• Consumer price index (CPI)• Local government price Index (LGPI)• Enterprise bargaining agreements (EBs)• Increases in depreciation, maintenance and
interest expenses associated with capital works that have been carried out over recent years.
After consultation with the community, our Elected Members will determine whether the direction and focus of this plan is appropriate and to what extent our proposed initiatives and standards of service deserve community support.

2017–2018 Annual Business Plan
59
Local government financial sustainability indicators
These are indicators that are required under the Local Government Act 1999, in order to promote greater financial sustainability and transparency in local government.
Budget FYE 2018
$,000
Original budget
FYE 2017 $,000
Current forecast FYE 2017
$,000
Actual FYE 2016
$,000
Operating surplusThe operating surplus (deficit) before capital amounts
5,689 6,242 8,298 5,523
Operating surplus ratio (OSR)Rates (general and other) less Natural Resources Management (NRM) levy This ratio expresses the operating surplus as a percentage of general and other rates, net of NRM levy
8% 9% 11% 6%
Net financial liabilities (NFL) (including land held for resale)Net financial liabilities are defined as total liabilities less financial assets (excluding equity accounted investments in council businesses) and including non-current assets held for sale
29,129 29,279 27,670 23,838
Net financial liabilities ratio (NFLR) (including land held for resale)Total operating revenue less NRM levy
32% 33% 31% 28%
Net financial liabilities (excluding land held for resale)Net financial liabilities are defined as total liabilities less financial assets (excluding equity accounted investments in council businesses) and excluding non-current assets held for sale
29,129 29,279 28,180 24,645
Net financial liabilities ratio (NFLR) (excluding land held for resale)Total operating revenue less NRM levy
32% 33% 31% 29%
Interest cover ratio Net interest expenseTotal operating revenue, less NRM levy and less investment income
1.7% 2.2% 1.5% 1.9%
Asset sustainability ratio (ASR) Net asset renewalsNet asset renewal expenditure is defined as net capital expenditure on the renewal and replacement of existing assets and excludes new capital expenditure on the acquisition of additional assets
109% 108% 109% 106%
Fiscal balanceNet lending position on net borrowing requirement in uniform presentation of finances
(949) (4,295) (3,680) 6,239

2017–2018 Annual Business Plan
60
Notes on financial indicators
1. Operating surplus
An operating surplus occurs when the operating revenue is more than the operating expenses for the period. An operating deficit occurs when revenue is less than expenses. Our projection indicates that in 2017–2018 operating revenue will exceed operating expenditure. This year we expect to deliver a modest surplus of $5.689 million, in line with the targets set out in the LTFP.
2. Operating surplus ratio (OSR)
The operating surplus ratio is the operating surplus or deficit expressed as a percentage of general and other rates, excluding rate rebates and revenues from the NRM levy. Our OSR is within the target of our Financial Sustainability Policy.
3. Net financial liabilities ratio (NFLR)
The NFLR is the net financial liability expressed as a percentage of total operating revenue excluding Water Catchment/NRM levy income.
We have a NFLR target of 0% to 50%. The target of 50% and budgeted result of 32% for 2017–2018 are within the Local Government Association’s target of 100%.
Our LTFP provides the framework to reduce our net financial liabilities over the forecast period. This reduction will, in turn, return the NFLR to a level within our target range.
Strategies that have been, and will continue to be, considered to reduce debt include a longer- term reduction in capital expenditure. Target NFLR ranges have been set within our LTFP and will be reviewed annually to make sure the targets remain appropriate.
4. Asset sustainability ratio (ASR)
This ratio indicates whether a council is renewing or replacing existing non-financial assets at the same rate that its overall stock of assets is wearing out (being depreciated). It is calculated by measuring capital expenditure on asset renewal or replacement, relative to the recorded rate of depreciation of the assets for the same period.
We have invested significantly in the renewal of our non-financial assets over the last five years, delivering capital works of $75 million. Our 2017–2018 budget includes capital renewal works of $15.360 million (excludes any grant income and sale of assets) This represents an ASR of 109%, which is within our target range as specified in the LTFP.
We have reviewed the IAMPs in the context of the LTFP and have considered strategies to help us maintain performance within the targeted range. We will also continue to review the ASR target range to ensure the set targets remain appropriate.
Budget components
Our annual budget is made up of various components:
• Income statement
• Balance sheet
• Capital budget (as outlined in Section 4: ‘Project priorities for the year’)
• Cash flow statement
• Statement of changes in equity.
These will be explained in the following pages.

2017–2018 Annual Business Plan
61
Analysis of operating budgetBudgeted Income Statement For the financial year ended 30 June 2018
Budget FYE 2018
$,000
Original budget
FYE 2017 $,000
Current forecast FYE 2017
$,000
Actual FYE 2016
$,000
Income
Rates 76,227 73,541 73,625 71,247
Statutory charges 2,887 2,466 2,605 2,884
User charges 3,734 3,767 3,454 3,967
Grants and subsidies 6,022 7,828 9,024 5,943
Investment income 130 130 130 174
Reimbursements 72 66 114 47
Other revenues 1,166 1,127 1,553 1,539
Total revenues 90,238 88,925 90,505 85,801
Expenses
Employee costs 35,661 35,361 34,024 32,728
Materials, contracts and other expenses 34,173 33,253 34,630 33,917
Finance charges 1,273 1,618 1,052 1,162
Depreciation 13,442 12,451 12,451 12,471
Total expenses 84,549 82,683 82,207 80,278
Operating surplus/(deficit) before capital 5,689 6,242 8,298 5,523
Net gain/(loss) on disposal or revaluation of assets
– – 93 (130)
Capital grants 3,243 2,345 3,357 603
Physical resources received free of charge 255 255 255 292
Net surplus/(deficit) resulting from operations
9,187 8,842 12,003 6,288

2017–2018 Annual Business Plan
62
Operating revenue
1. Rates
For 2017–2018 our total rate revenue is projected to be $76.2 million. This is an increase of $2.686 million (or 3.6%) over the previous year. This figure includes a 5% increase in the Natural Resources Management (NRM) levy.
We propose a general rate increase of 2.7% for 2017–2018. This is based on the cost of maintaining existing services and the projected costs included in IAMPs and the LTFP.
Our minimum rate will need to increase by 2.7% to $1,150 for 2017–2018.
In addition, we expect to receive up to a 0.7% increase in rates revenue due to new developments, subject to confirmation from the Valuer-General.
Council’s differential rating system was fully implemented in 2014–2015. A total of 12.31% of our general rate revenue will be derived from our commercial, industrial and vacant land use, with the remaining 87.69% of rate revenue to come from residential, primary production and other land use.
2. Statutory charges
Statutory charges are fees for regulatory services, such as permits and licences, or the regulation of an activity. They include Development Act fees, parking fines and dog registration fees.
The amount for these fees is set by the State Government. Notification of these fees is provided annually in July.
3. User charges
User charges are fees that relate mainly to the recovery of the costs of delivering some of Council’s services. These are fees charged for the use of community facilities and recreation centres.
User charges in 2017–2018 are projected to decrease by $33,000 compared with the previous year. The fees and charges review recommended increases as necessary to offset rising delivery costs associated with these services.
4. Grants and subsidies
This item includes grants and subsidies from all sources, except amounts received specifically for new or upgraded assets. Total grant revenue is budgeted to decrease by $1.806 million to
$6.022 million.
5. Investment income
Interest earned on funds invested is estimated to be $130,000 in 2017–2018. This sum will be offset against borrowings.
6. Reimbursements
Reimbursements are payments for work Council has performed as an agent for others; for example, employee services we have provided to other councils. We estimate a reimbursement revenue of $72,000 in 2017– 2018.
7. Other revenues
This is revenue not classified in items 1 to 6 above. Of the estimated $1.166 million of other revenue projected for 2017–2018, $390,000 is for estimated workers’ compensation insurance rebate and $200,000 is the estimated amount for sickness and accident reimbursements.
Operating expenses
8. Employee costs
Employee costs include all labour-related expenses, such as wages, salaries, and on- costs (allowances, leave entitlements and employer superannuation).
Employee costs are budgeted to increase by $300,000 (1.0%). This is less than our enterprise bargaining agreement, as well as employee grade increments.
Over the last five years Council has achieved economies by reducing payroll costs. This has included a significant reduction in our full-time equivalent (FTE) number of employees.
In 2017–2018 we have provided for a total 388 FTE employees in the budget. This represents no change to the number of FTEs in comparison to financial year 2016–2017.
We allocate employee costs directly related to capital projects separately within the capital budget. These represent an additional sum of $1.5 million.
9. Materials, contracts and other expenses
Materials are physical goods, such as consumables, water and energy. Contractual services are payments for external service providers, including labour, materials or subcontractors who are hired under contract.

2017–2018 Annual Business Plan
63
Other expenses are those other than the costs of employees, materials and contractual services.
We forecast the cost of materials, contractual services and other expenses to increase by $920,000 in 2017–2018.
The budget allows for a number of key known cost pressures for 2017–2018.
We have been able to absorb these cost pressures through adopting a tighter spending approach in other areas.
10. Finance charges
Finance charges are the costs of financing our activities through borrowings or financial leases. We forecast a reduction of finance charges to $1.273 million in 2017–2018.
11. Depreciation
In 2009 we moved to consumption-based depreciation (CBD) to depreciate most of our assets.
CBD is an accounting method that more accurately records the pattern of asset use than traditional straight-line depreciation. Typically, under CBD, less depreciation is calculated at the beginning of an asset’s life and more at the end.
In 2017–2018 our depreciation expense is forecast to be $13.442 million, representing an increase of $991,000.

2017–2018 Annual Business Plan
64
Net outlaysNotes to and forming part of the financial statements For the financial year ended 30 June 2018
Uniform presentation of finances
Budget FYE 2018
$,000
Original budget
FYE 2017 $,000
Current forecast FYE 2017
$,000
Actual FYE 2016
$,000
Income Operating revenues
90,238
88,925
90,505
85,801
Expenses Less operating expenses
(84,549)
(82,683)
(82,207)
(80,278)
Operating surplus/(deficit) before capital amounts
5,689
6,242
8,298
5,523
Less net outlays on existing assets
Capital expenditure on renewal and replacement of existing assets
15,360
16,737
17,886
15,170
Less depreciation, amortisation and impairment (13,442)
(12,451)
(12,451)
(12,471)
Less proceeds from sale of replaced assets (724) (1,000) (1,000) (1,950)
Total net outlays on existing assets 1,194 3,286 4,435 749
Less net outlays on new and upgraded assets/changes in assets
Capital expenditure on new and upgraded assets
9,197
10,737
11,796
1,844
Less amounts specifically for new or upgraded assets
(3,243)
(2,345)
(3,357)
(603)
Less proceeds from sale of surplus assets (510) (1,141) (896) (2,156)
Total net outlays on new and upgraded assets
5,444
7,251
7,543
(915)
Net lending/(borrowing) for financial year (949) (4,295) (3,680) 5,689

2017–2018 Annual Business Plan
65
1. Net outlays on existing assets
We will allocate $15.360 million for the renewal of existing assets. We aim to keep our level of spending in line with the IAMP forecasts.
2. Net outlays on new and upgraded assets
We will allocate $5.197 million to new and upgraded assets with a further $4 million to be set aside for the new service centre project.
We will factor the ongoing maintenance and depreciation expenses associated with capital expenditure on new and upgraded assets into our future budgets and updates of the LTFP.
Financing strategy
We have determined that borrowings will increase marginally in 2017–2018. Our borrowings are projected to increase by $949,000 in comparison to the current forecast.
Further financial information
The following pages provide information on:• Cash flow statements• Balance sheet• Statement of changes in equity.

2017–2018 Annual Business Plan
66
2017–2018 financial budget informationBudgeted cash flow statement For the financial year ended 30 June 2018
Budget FYE 2018
$,000
Original budget
FYE 2017 $,000
Current forecast FYE 2017
$,000
Actual FYE 2016
$,000
Cash flows from operating activitiesReceiptsOperating receipts 89,874 88,665 90,375 86,128
Investment receipts 130 130 130 174
PaymentsOperating payments to suppliers and employees 69,341 68,241 68,704 66,355
Finance payments 1,273 1,618 1,052 1,162
Net cash provided by (or used in) operating activities
19,390 18,936 20,749 18,785
Cash flows from investing activitiesReceiptsGrants specifically for new or upgraded assets 3,243 2,345 3,357 603
Sale of replaced assets 724 1,000 1,000 1,950
Sale of surplus assets 510 1,141 896 2,156
PaymentsExpenditure on renewal/replaced assets 15,360 16,737 17,886 15,170
Expenditure on new/upgraded assets 9,197 10,737 11,796 1,844
Net cash provided by (used in) investing activities
(20,080) (22,988) (24,429) (12,305)
Cash flows from financing activitiesReceiptsProceeds from borrowings 949 7,000 7,000 15
New borrowings required – – – –
PaymentsRepayment of borrowings – 2,705 3,320 10,228
Repayment of finance lease liabilities – – – 74
Net cash provided by (used in) financing activities
949 4,295 3,680 (10,287)
Net increase/(decrease) in cash held 259 243 – (3,807)
Cash and cash equivalents at beginning of reporting period
199 4,006 199 4,006
Cash and cash equivalents at end of reporting period
458 4,249 199 199
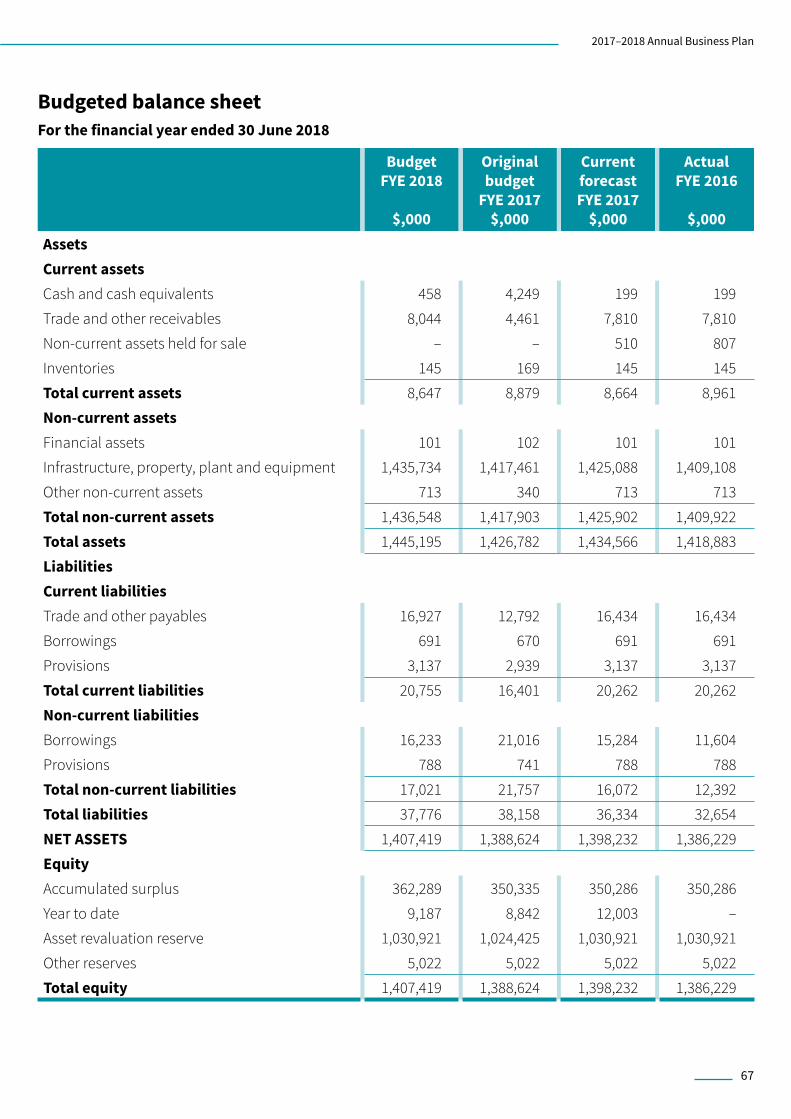
2017–2018 Annual Business Plan
67
Budgeted balance sheetFor the financial year ended 30 June 2018
Budget FYE 2018
$,000
Original budget
FYE 2017 $,000
Current forecast FYE 2017
$,000
Actual FYE 2016
$,000
AssetsCurrent assetsCash and cash equivalents 458 4,249 199 199
Trade and other receivables 8,044 4,461 7,810 7,810
Non-current assets held for sale – – 510 807
Inventories 145 169 145 145
Total current assets 8,647 8,879 8,664 8,961
Non-current assetsFinancial assets 101 102 101 101
Infrastructure, property, plant and equipment 1,435,734 1,417,461 1,425,088 1,409,108
Other non-current assets 713 340 713 713
Total non-current assets 1,436,548 1,417,903 1,425,902 1,409,922
Total assets 1,445,195 1,426,782 1,434,566 1,418,883
LiabilitiesCurrent liabilitiesTrade and other payables 16,927 12,792 16,434 16,434
Borrowings 691 670 691 691
Provisions 3,137 2,939 3,137 3,137
Total current liabilities 20,755 16,401 20,262 20,262
Non-current liabilitiesBorrowings 16,233 21,016 15,284 11,604
Provisions 788 741 788 788
Total non-current liabilities 17,021 21,757 16,072 12,392
Total liabilities 37,776 38,158 36,334 32,654
NET ASSETS 1,407,419 1,388,624 1,398,232 1,386,229
EquityAccumulated surplus 362,289 350,335 350,286 350,286
Year to date 9,187 8,842 12,003 –
Asset revaluation reserve 1,030,921 1,024,425 1,030,921 1,030,921
Other reserves 5,022 5,022 5,022 5,022
Total equity 1,407,419 1,388,624 1,398,232 1,386,229

2017–2018 Annual Business Plan
68
Budgeted statement of changes in equityFor the financial year ended 30 June 2018
Budget FYE 2018
$,000
Original budget
FYE 2017 $,000
Current forecast FYE 2017
$,000
Actual FYE 2016
$,000Accumulated surplusBalance at end of previous reporting period 362,289 350,335 350,286 343,998
Net result for year 9,187 8,842 12,003 6,288
Transfers between reserves – – – –
Balance at end of period 371,476 359,177 362,289 350,286
Asset revaluation reserveBalance at end of previous reporting period 1,030,921 1,024,425 1,030,921 1,030,921
Gain on revaluation of infrastructure, property, plant and equipment
– – – –
Balance at end of period 1,030,921 1,024,425 1,030,921 1,030,921
Other reservesBalance at end of previous reporting period 5,022 5,022 5,022 5,022
Transfers between reserves – – – –
Balance at end of period 5,022 5,022 5,022 5,022
Total equity at end June 2014 1,407,419 1,388,624 1,398,232 1,386,229


2017–2018 Annual Business Plan
70
2017–2018 Annual Business Plan
71
WHAT THIS ANNUAL BUSINESS PLAN AND BUDGET MEANS FOR RATES
How we set ratesWhen we set rates, our main point of reference is our newly adopted Strategic Plan 2020.
We also consider the current economic climate, including the outlook for inflation and unemployment, our debt reduction strategy, legislative changes, and the need to manage, maintain and improve our community’s physical infrastructure.
We carefully consider the impact of rate rises on our ratepayers and recognise the importance of striking a balance between sharing the rate burden fairly among ratepayers and factoring in changes in the valuation of residential, vacant land, commercial, and industrial properties.
It is our policy to make sure that rents and leasing payments on our properties are not prohibitive for community groups and sporting bodies, who are the lifeblood of a vibrant community. For this reason, we may also offer concessions on rates.
Rating reviewIn 2011 we undertook comprehensive rates modelling and analysis of rating strategies and the likely impact on ratepayers of alternative rating systems.
In November 2011 we decided to undertake community consultation, as required by Section 151 of the Local Government Act 1999, regarding a proposal to implement a differential rating system. The purpose was to make sure that any new approach to rates would be fair and equitable across the whole community, and that it would at the same time generate the income needed to achieve our strategic objectives and agreed service standards. After consulting with the community, we decided in
February 2012 to adopt differential general rates as from 1 July 2012.
The review we undertook confirms that our rating strategy and structure rank highly against the principles of taxation and that the new rating structure and rate revenue contribution methodology complies with and exceeds our legislative requirements. This also ensures that our contribution methodology is considered best practice.
Differential ratesHaving a differential rating strategy provides us with increased flexibility to accommodate movements in valuations that regularly occur in the market. This method allows us to raise rates at different levels to ensure that commercial and industrial sites continue to contribute appropriately to services that we provide, even though property market valuations in any category may fluctuate.
Definitions of land uses are prescribed by regulation and are categorised as follows for rating purposes:• Residential• Commercial – shops• Commercial – office• Commercial – other• Industrial – light• Industrial – other• Primary production• Vacant land• Other.
Differential rates better reflect consumption of our services but can also be tailored to support other key objectives, such as economic or capital development, or to recognise the value of a specific

2017–2018 Annual Business Plan
72
aspect of land use. The differential rating strategy addresses all of our rating objectives.
Apart from the more obvious services that benefit our whole community, such as the maintenance of over 600 parks and reserves, footpaths, road maintenance and traffic management, we provide many other community, recreational, health and environmental services.
The entire community, including our commercial and industrial ratepayers, benefit from the many services and regulatory processes that we administer.
Examples of our commitments to business and economic development can be seen in our support for the following initiatives.
National Broadband Network (NBN)
We continue to support the roll-out of high-speed broadband to properties in our City and continue to run digital literacy programs.
Small business advisory services
Council is committed to deliver small business advisory services to business owners, business intenders and entrepreneurs in our City. To enable this we are undertaking a procurement process to provide these services which will be finalised by 30 June 2017.
Economic development
Ongoing high-level lobbying of federal and state government agencies to include our Council in economic development programs.
Land use zoning and urban development
We ensure that our Development Plan and development assessment processes support business growth through a range of initiatives including:• Delivery of the Modbury Precinct Activation
Strategy to support increased residential, commercial, retail and population growth; for example in the Modbury Precinct commencing upgrades to Civic Park, Reservoir Road and new planning policies which support growth
• A review of centres, commercial and light industry zones to ensure they support existing business needs and emerging industry trends
• Introducing an advisory service for small
businesses to streamline development approval processes for local businesses starting up or expanding in our City
• Streamlining development assessment processes and providing urban design advice for development applications in the Modbury Precinct.
Tourism and events
We support tourism and attract visitors to our City through a number of initiatives including:• A program of events and event sponsorship
including community carols, outdoor cinemas, Australia Day celebrations and an ANZAC Day service attracting almost 90,000 people
• Sponsorship of high-profile events including the State Theatre production of Secret River as part of the Adelaide Festival. This production attracted many international and interstate visitors to our City.
Although some of these initiatives and services may not yet be self-evident, all ratepayers will ultimately gain from the benefits they will bring.
In relation to vacant land, we have numerous sites scattered throughout the suburbs that are vacant (i.e. unimproved). The differential rate will encourage the development of these vacant properties.
Differential rating
The differential rating methodology is an integral component of our overall rating strategy. This method assists us to achieve our rating objectives, by:• Ensuring equity in rate distribution across the
community by minimising inequitable shifts in rate responsibility
• Reducing the impact of property valuation fluctuations while raising an equitable
• Capital level of contribution from each land use sector; maintaining equity within diverse communities and between communities
• Recognising that communities where there is a greater consumption of services and resources rank more highly according to the principles of taxation.
We believe the achievement of our rating objectives, as described above, justifies our choice of the differential rating methodology.

2017–2018 Annual Business Plan
73
The table below shows the valuations and rates applied to the various land use categories and also the general revenue forecast for 2016–2017. Note: these figures do not show rebates. In 2017–2018 we estimate we will provide $1.4 million in rebates.
The majority of these rebates are mandatory, as required under the Local Government Act 1999. Further details of our rebates are included on page 81.
Land use General rate
revenue 2016–2017
$M
Valuation 2016–2017
$M
General rate
revenue 2017–2018
$M
Valuation 2017–2018
$M
General rate
revenue % income
2017–2018Commercial office 0.36 58 0.42 69 0.58%
Commercial other 2.157 351 2.193 368 3.02%
Commercial shop 5.492 895 5.616 942 7.73%
Industrial light 0.169 27 0.16 27 0.22%
Industrial other 0.583 95 0.55 91 0.76%
Other 0.631 153 0.65 162 0.89%
Primary production 0.348 84 0.34 85 0.47%
Residential 59.273 14,391 61.4 15,325 84.5%
Vacant land 1.215 148 1.3 164 1.79%
Total 70.228 16,202 72.63 17,233 100%

2017–2018 Annual Business Plan
74
Historical ratesIn 2012–2013 we declared differential rates for the first time. The following table summarises the rate in the dollar and minimum rate in comparison to previous years for each of the rating categories.
Year 2011–2012 2012–2013 2013–2014 2014–2015 2015–2016 2016–2017 2017–2018Minimum $980 $980 $1,024 $1,064 $1,092 $1,120 $1,150
Minimum rate valuation threshold
$282,750 $259,390 $257,132 $260,112 $268,300 $274,011 $289,507
Rate in $Residential $0.003466 $0.00377813 $0.00398239 $0.00409054 $0.00407001 $0.00408742 $0.00397226
Commercial office
$0.003466 $0.00453376 $0.00557535 $0.00613581 $0.00610502 $0.00613113 $0.00595839
Commercial other
$0.003466 $0.00453376 $0.00557535 $0.00613581 $0.00610502 $0.00613113 $0.00595839
Commercial shop
$0.003466 $0.00453376 $0.00557535 $0.00613581 $0.00610502 $0.00613113 $0.00595839
Industrial light
$0.003466 $0.00453376 $0.00557535 $0.00613581 $0.00610502 $0.00613113 $0.00595839
Industrial other
$0.003466 $0.00453376 $0.00557535 $0.00613581 $0.00610502 $0.00613113 $0.00595839
Other $0.003466 $0.00377813 $0.00398239 $0.00409054 $0.00407001 $0.00408742 $0.00397226
Primary production
$0.003466 $.00377813 $0.00398239 $0.00409054 $0.00814002 $0.00408742 $0.00397226
Vacant $0.003466 $0.00566720 $0.00696918 $0.00818108 $0.00814002 $0.00817484 $0.00794452

2017–2018 Annual Business Plan
75
During the same period, the increase in our community’s wealth has occurred mainly in the residential sector, driven by an increase in residential valuations. The following table shows the changes in rate revenue and valuation over the past five years.
Rate revenue and variationsYear 2011–
20122012– 2013
2013– 2014
2014– 2015
2015– 2016
2016– 2017
2017– 2018
Total valuation ($M) 16,254 15,686 15,659 15,934 16,403 16,851 17,233
% increase (decrease) in total valuation
6.3% (3.4%) (0.17%) 1.7% 2.96% 2.73% 6.4%
General rate revenue ($M)* 54.80 58.60 62.80 66.43 68.10 70.20 72.63
% increase in general rate revenue*
7.2% 6.9% 7.1% 5.8% 2.7% 2.5% 2.7%
Minimum rate $980 $980 $1,024 $1,064 $1,092 $1,120 $1,150
% increase in minimum rate 6.5% Nil 4.5% 3.9% 2.7% 2.5% 2.7%
*Prior to allocation of rebates.
Our primary source of income is Council rates, which make up 84% of our annual income.
Our forecast sources of revenue for 2017–2018 are shown in the following pie chart.
Total revenue $90 million
Fees 6rn7%
Other 8rn9%
Rates 76rn 84%

2017–2018 Annual Business Plan
76
Average residential rateOur average residential rate for 2016–2017 was $1,498. It is estimated that the average residential rate in 2017–2018 will rise to $1,535 which represents a 2.5% increase on the previous year.
Method used to value landThe South Australian Valuer-General establishes the value of land in our City for rating purposes. The basis for valuation is the capital value of the land, including all improvements such as buildings and sheds. We believe this is the fairest way of distributing the rates burden across all ratepayers for the following reason:• The equity principle of taxation requires that ratepayers of similar wealth pay similar taxes, and ratepayers of
greater wealth pay more tax than ratepayers of lesser wealth. Property value is a fair indicator of wealth.
We have adopted the valuations that the Valuer-General provided on 30 June 2017. If a ratepayer is dissatisfied with their valuation, they can object to the Valuer-General in writing, within 60 days from the date of their rates notice.
Trends in valuations and rate modellingEach year, as part of our review of rating policy, anticipated movements in valuations are obtained for each rate category. The valuation trends for 2017–2018 reflect the impact of the subdued property market and indicate that valuations will generally experience only slight movement across all property groups.
A shortage of residential properties across all valuation levels is still considered to exist and we have also seen a low level of new housing construction. Ongoing constraints on housing finance and lower levels of consumer confidence continue to affect sale values in the residential sector however, a minor upswing occurred during 2017.
Valuations are anticipated to remain fairly steady, with some areas experiencing minor increases and others minor decreases for 2017–2018. We have been advised by the Valuer-General that the average increases of approximately 2.73 per cent will apply in most areas. This information is subject to change prior to the end of the financial year.

2017–2018 Annual Business Plan
77
Council has undertaken comprehensive rate modelling to assess the likely impact within each land category based on anticipated valuation movements prior to the adoption of the final Annual Business Plan.
Advice from the Valuer-General tells us that commercial and industrial property sales have increased slightly which is mainly due to property improvements.
Vacant land valuations have seen some areas experiencing minor increases and others minor decreases for 2017–2018. An average increase of approximately 2.7 per cent is evident.
Primary production property valuation movements are uneven, with some areas experiencing minor increases and others minor decreases for 2017–2018. There has been an overall average increase of approximately 0.1 per cent across this sector.
The table below provides details for the residential valuation changes by suburb.
Suburb FYE 2017 FYE 2018No.
properties% change of
valuationNo.
properties% change of
valuationBanksia Park 1,308 2.3% 1,321 6.86%Dernancourt 1,461 2.6% 1,488 10.88%Fairview Park 1,440 2.8% 1,445 8.16%Gilles Plains 598 5.1% 599 6.46%Golden Grove 4,022 2.3% 4,028 6.90%Gould Creek 16 1.8% 15 2.05%Greenwith 3,773 4.9% 3,769 5.67%Gulfview Heights 16 1.9% 16 7.45%Highbury 2,584 2.3% 2,590 8.16%Holden Hill 1,210 4.2% 1,214 5.86%Hope Valley 2,835 3.4% 2,852 7.89%Houghton 26 1.9% 26 2.40%Modbury 2,023 2.4% 2,086 6.19%Modbury Heights 2,677 2.0% 2,687 6.19%Modbury North 2,257 2.5% 2,265 5.99%Paracombe 8 2.2% 8 1.82%Redwood Park 2,123 2.5% 2,128 3.01%Ridgehaven 1,651 2.8% 1,683 4.64%St Agnes 1,719 3.2% 1,737 6.24%Surrey Downs 1,349 1.8% 1,353 5.72%Tea Tree Gully 1,358 4.0% 1,373 6.41%Upper Hermitage 30 1.5% 31 4.44%Valley View 558 2.0% 558 2.27%Vista 406 5.1% 408 5.46%Wynn Vale 3,114 1.9% 3,130 4.89%Yatala Vale 79 4.7% 82 2.29%Total 38,611 2.7% 3,882 6.47%

2017–2018 Annual Business Plan
78
GrowthProperty valuations can increase or decrease if the land use of the property changes — for example, from residential to commercial — or if there has been any development on the property, including renovations. The change in valuation associated with these changes is referred to as ‘growth’.
In 2017–2018 the changes in valuation due to growth is estimated to amount to about $500,000 of additional rate revenue (growth income), an increase of 0.7%.
Council’s revenue-raising powersCouncil can charge rates on all land in its area except for exempt land; this includes Crown land, council-owned land and other land as prescribed in the Local Government Act 1999 (refer Section 147).
The Act allows a council to raise revenue for its provision of services and facilities through a general rate, which applies to all rateable properties, or by applying differential general rates to all classes of properties.
A council can also raise separate rates for specific areas, services or charges.
A council can raise revenue through the setting of fees and charges after considering the cost of the service provided and equity issues. We list the applicable fees and charges on our website.
The impact of ratesIn 2017-2018 our total general rate revenue (excluding growth) will rise by 2.7%.
The following table shows the impact on types of properties and the number of properties that fall within selected percentage changes.
Rate increase Residential properties
Less than zero 2,872
0–2% 8,683
2–2.27% 7,530
2.7–3% 6,534
3–4% 2,602
4–5% 4,404
5–6% 3,612
Rate increase Residential properties
6–10% 1,979
Greater than 10% 604
Total 38,820
In 2017–2018 the differential above the residential rate in the dollar for the following land uses will be:• Commercial – 50%• Industrial – 50%• Primary production – same rate as residential• Vacant land – 100%• Other – same rate as residential.
As part of the valuation process, the Valuer-General applies a land use to each assessment to identify the main use of the land. As a ratepayer you may apply to Council for a review of this assessment if you think a property has been wrongly classified in terms of its land use.
Minimum rateWe believe it is fair that all rateable properties contribute to the cost of administering our activities, creating and maintaining the infrastructure accessed by every property, and providing all of the services used by our community.
The minimum rate is charged against the whole of an allotment. This means that if you own and occupy contiguous land – that is, two or more pieces of adjoining land, even if they are separated by a road – we levy only one minimum rate.
Independent living units in a retirement village are exempt from paying the minimum rate under section 158 of the Local Government Act 1999.
We are proposing a minimum rate increase of 2.7% making this $1,150 for 2017–2018.
The following graph shows the minimum rates in some Adelaide metropolitan councils for the 2016– 2017 financial year.

2017–2018 Annual Business Plan
79
Natural Resources Management (NRM) levyWe collect a regional NRM levy on all rateable properties on behalf of the regional NRM Board. The Board uses the levy to manage and protect our state’s priority water, land, marine and biodiversity assets.
Note that we do not keep this money and we do not determine how it is spent. We collect the levy by imposing a separate rate against all our rateable properties, with the NRM Board advising us what the rate will be at the end of each financial year.
Community wastewater management system conversionsIn 2001–2002 a program was started to convert some properties from Council’s community wastewater management system (CWMS) to SA Water’s sewerage system. If you own one of these properties, in addition to paying SA Water for their services, you are legally obliged to pay a separate rate to Council for the CWMS. This rate was approved by the Minister for Local Government, and will be charged until the capital cost of the conversion is repaid. The separate rate for 2017–2018 will be $400.
Community wastewater management system service rate/chargeOur community wastewater management system (CWMS) services 4,588 properties (4,499 – 2016). For 2017–2018 we have budgeted $2.6m ($2.46m in 2016) to operate, maintain and improve this system. This figure may be subject to change based on SA Water charges which will be announced prior to the adoption of this Annual Business Plan.
This sum includes an allowance for the replacement of the physical infrastructure used to provide the service. It will be funded by a service fee for each connected property unit, and also for each unconnected property unit that uses the system. If your property is connected to the CWMS system and is next to the SA Water sewer mains (meaning you are also paying SA Water rates), this fee will be reduced.
If you are receiving the CWMS service on non- rateable land, a service charge will be levied against the land. Our rates team can provide more information about the CWMS scheme, including details of what constitutes a service charge. The charges for a connected service in FYE 2018 is $575 and in FYE 2017 was $545.

2017–2018 Annual Business Plan
80
The service charges for a unconnected charge or reduced charge in FYE 2018 is $400 and in FYE 2017 was $380.
Rate concessionsState Government concessions including the separate concession entitlements for community wastewater schemes (CWMS) until recently were funded by the State Government. These concessions were formerly available to the holders of pensioner concession cards, veterans, low-income earners, unemployed, students, and self- funded retirees. These concessions were all abolished by the State Government with effect from 30 June 2015, CWMS concessions from 1 July 2017. From 1 July 2015, the State Government elected to replace these concessions with a single “cost-of-living payment” provided directly to those entitled. This payment may be used to offset council rates. Note that not all former recipients of rates concessions will be entitled to the new payment. To check eligibility, contact the Department for Communities and Social Inclusion (DCSI) concessions hotline 1800 307 758 or at www.sa.gov.au.
Payment of ratesAnnual rates are split into four equal instalments, each of which is due on the first business day of September, December, March and June. We provide a range of payment options.
Our Chief Executive Officer also has the authority to enter into special agreements with ratepayers on the payment of rates when needed.
If you are having difficulty paying your rates, we encourage you to contact our Customer Relations team to discuss payment options. All such enquiries are kept confidential.
Postponement of ratesIf you hold a Seniors Card or are experiencing hardship paying your rates, you can apply to postpone payment. The criteria for eligibility are listed below.
Applications are assessed on a case-by-case basis and they are not dependent on the level of increase in rates payable. All applications are confidential and the information is only shared with those who need to know in order to assess the application.
Once an application is approved, the postponement takes effect from the first day of the next instalment period following the date of application; that is, the first day of September, December, March or June.
If you have a postponement agreement, you must advise us in writing within 14 days of any change to your circumstances. Such changes might include:• Change of ownership• Change of occupation• Alterations or improvements to the property• Division of land• Change in financial circumstances.
We conduct periodic audits of eligibility to confirm ongoing entitlement.
If you apply for a postponement, you must also show us that you have advised relevant interested parties of your intention. These include mortgage holders, insurance companies and beneficiaries.
The amount and the time frame for postponement is at the discretion of the Chief Executive Officer.
All applications for postponements must be from the principal ratepayer, in writing, on Council’s approved form, addressed to the Chief Executive Officer, City of Tea Tree Gully, 571 Montague Road, Modbury SA 5092, and include sufficient details to identify the relevant property and support the application. All information provided will be kept confidential.
Postponement – Seniors CardUnder Section 182A of the Local Government Act 1999, if you hold a State Government Seniors Card you can apply to postpone part of your council rates on a long-term basis. The deferred amount will still incur a monthly interest charge, and the accrued debt will become payable when your property is sold or disposed of. In this way, postponement is similar to a reverse mortgage.
As a state Seniors Card holder, you can only apply for postponement if:• The property is your main residence• No other person other than your spouse has an
interest as owner of the property• There is an appropriate level of equity in the
property.
To find out more or ask for an application form, please phone us on 8397 7444.
2017–2018 Annual Business Plan
81
Postponement – hardshipUnder Section 182 of the Local Government Act 1999, you can apply to postpone your rates if payment would cause you hardship. You will need to meet the following criteria:• We are satisfied that the hardship is proven• You agree to pay interest on the amount at the
cash advance debenture rate, calculated monthly and published by the Local Government Finance Authority for 1 July each year
• The property is your principal residence and is the only property you own
• You have owned the property and used it as your principal residence for more than five years
• You can produce your Pensioner Concession Card from Centrelink or Veterans’ Affairs or a TPI card from Veterans’ Affairs; or can show that you are a self-funded retiree with a household income of less than $30,000 a year.
Rebates of ratesRebates – mandatory, under Section 159–165 of the Act
Under Sections 159–165 of the Local Government Act 1999 we are required to grant rebates to certain properties, including those that meet the Act’s requirements for land used for religious or educational purposes, or for community uses, as specified in the Act. These rebates vary from 75% to 100%.
Rebates – discretionary, under Section 166 of the Act
Section 166 of the Local Government Act 1999 sets out the circumstances in which we can grant discretionary rebates of up to 100%.
We have the option to grant a rebate of rates or service charges; to determine the rebate amount we take into account the following factors:• The rebate is desirable for the purpose of securing
the proper development of the area• The rebate is desirable for the purpose of
assisting or supporting a business in its area• The rebate relates to common property or land
vested in a community corporation under the Community Titles Act 1996 over which the public has a free and unrestricted right of access and enjoyment.
The rebate is considered by the council to be appropriate to provide relief against what would otherwise amount to a substantial change in rates payable by a ratepayer due to:• A redistribution of the rates burden within the
community arising from a change to the basis or structure of the council’s rates; or
• A change to the basis on which land is valued for the purpose of rating, rapid changes in valuations, or anomalies in valuations.
Referring to Section 159(5) of the Act, we look at the land for which the rebate is sought and consider:• The type and number of services we provide
on the land compared with similar services we provide elsewhere in the community
• Whether a community need is met by the activities on the land
• Whether activities on the land provide assistance or relief to disadvantaged people.
We may also take into account other factors, such as:• Why the applicant needs financial assistance
through a rebate• How much rebate is sought, as a percentage and
dollar amount, and why it is appropriate• How much financial assistance is being given to
that applicant by federal or state agencies and whether it applies to that land
• Whether the applicant has applied or will apply to another council
• Whether the applicant is or will be providing a service in our area and the extent of that service
• Whether the applicant is a public sector body, a private not-for-profit body or a private for-profit body
• Whether the applicant is gaining a financial profit for the members of the body, or is engaging in trade or commerce and therefore has the ability to distribute profit to its members
• Whether there are any historical considerations that may be relevant for all or any part of the current council term
• The financial consequences for Council of granting the rebate
• The date the application is received• The availability of any community grant to the
person or body making the application

2017–2018 Annual Business Plan
82
• Whether the applicant has received a community grant.
If you or your organisation wishes to apply for a rebate for the current rating period, you must do so by 1 September 2017. We reserve the right to not consider late applications. However, if you are eligible for a mandatory rebate, this can be granted at any time during the current rating period.
If your or your organisation’s eligibility for a rebate no longer applies, we can recover rates proportionately to the end of the current financial year.
When considering applications for rates rebates, we are mindful of the contribution ratepayers make to our City, and that profitable organisations who receive government funding may still need additional help to achieve their goals. However, we need to balance the desire to support community organisations with the impact that rebates have on our revenue.
We provide a discretionary rebate of 100% for community sporting and social groups that occupy council-owned properties, including the University of the Third Age. This supports the strategic directions (set out in our Strategic Plan) to provide and maintain a high standard of recreation and leisure opportunities for all sections of the community.
If you believe that your not-for-profit organisation is impacted adversely by our rating strategy for commercial and industrial land uses, we encourage
you to apply for a discretionary rebate. We will assess each application on its own merits.
If you are a not-for-profit land owner you may apply for a discretionary rebate on your council rates by 1 September of each year. A report summarising Council’s consideration of requests for rebates will be completed, as specified under Section 166 of the Local Government Act 1999 in October of each year.
The discretionary rebate for not-for-profit organisations will only be available to organisations that are not already receiving a rebate under Section 161.
The maximum rebate granted will be capped at the difference between the residential rate and the industrial/commercial vacant land rate.
Maximum rate increase – rate cappingRate capping helps to keep rates relatively stable from year to year. It can take the form of a rebate or remission applied to residential rates.
These rebates and remissions cap (or set a maximum value for) increases in rates when property values increase, land use changes, councils changes their rate structure, or when there are anomalies in valuations.
Council is no longer provided with the data that enables us to consider increases over the rate capping of 7% for concession holders.


571 Montague Road, Modbury 5092 PO Box 571, Modbury 5092
Telephone 08 8397 7444 cttg.sa.gov.au