2017 american camper report - home - outdoor industry ... · 2017 american camper report | 4...
TRANSCRIPT
PRESENTED BY THE COLEMAN COMPANY, INC. AND THE OUTDOOR FOUNDATION
2017 American Camper Report

2 | 2017 American Camper Report presented by The Coleman Company, Inc. and The Outdoor Foundation

2017 American Camper Report | 3 presented by The Coleman Company, Inc. and The Outdoor Foundation
Introduction ........................................1
Key Findings .......................................2
Camping Participation .......................3
Profile of a Camping Trip ...................13
Buying Behavior .................................25
First-Time Campers ............................33
The Future of Camping ......................43
Crossover Participation ......................49
Method ...............................................54
TABLE OF CONTENTS

1 | 2017 American Camper Report presented by The Coleman Company, Inc. and The Outdoor Foundation
Camping is one of America’s favorite outdoor activities, attracting 40.5 million participants in 2016. Americans participated in the activity in various ways, camping in a conventional tent, enjoying the comforts of an RV, relaxing in a cabin or roughing it in a bivy. The 2017 American Camper Report profiles the more than 40 million people who used camping to connect to the natural world in their own unique ways.
A Look Back at 2016: Overall Trends
40.5 million Americans, or 13.7% of the population over age 6, camped at least once in 2016. The participation rate was up slightly from 13.6% in 2015 due to an addition of 500,000 new or returning camping participants.
Campers logged a collective 587.2 million camping days, or an average of 14.5 days per person. While the number of total days camped remained steady, the an average days dropped marginally from 14.7 in 2015.
Consistent with past reports, the majority of camping participants were Caucasian, and they skewed slightly male. Since camping is easily accessible throughout the United States, participation was spread fairly evenly across the nation. The Mountain Region, which stretches from Montana down to Arizona and New Mexico, had a somewhat higher participation rate than the other regions.
The Year Ahead: Future Opportunities
Research in The American Camper Report continued to highlight the importance of introducing Americans to the outdoors at an early age to inspire lifelong camping participation and encourage interest in the outdoors. In fact, the average age for a camper’s 1st camping trip was age 10. And, after age 15, the likelihood of being exposed to camping dramatically dropped.
Similarly, half of current adult campers participated in outdoor activities as adolescents, compared to just 38% of non-campers. The gap among campers who participated during childhood was almost as dramatic.
To help stakeholders reach campers and non-campers alike, the 2017 American Camper Report details camping participation and provides data and analysis on camping trends throughout the United States. The research in this report will help the camping industry—and the entire outdoor industry —be better equipped to engage potential campers and initiate an increase in camping participation.
introduction

2017 American Camper Report | 2 presented by The Coleman Company, Inc. and The Outdoor Foundation
Overview of Camping Participation
• 40.5 million Americans went camping at least once in 2016.
• Camping gained 500,000 participants from 2015 to 2016. The participation rate rose from 13.6% to 13.7%.
• Participants logged a total of 587.2 million camping days or 14.5 days per person.
• The Mountain Region had the highest camping participation rate at 19%.
• 88% of campers participated in multiple outdoor activities.
Profile of a Camping Trip
• Tents were the most popular type of shelter.• Of all male campers, 77%, camped in tents.
77% of female campers also camped in tents.• Cabin/yurt campers tended to be the old-
est, with an average age of 50. Tent campers were the youngest at an average age of 40.
• Camping trips were planned an average of 25 days in advance.
• 43% of camp site reservation were made the day of arrival to the camping destination.
• 71% of respondents said that they made the camping arrangements by themselves.
• Participants traveled an average of 136.8 miles from homes to their camping destinations.
• More than half of camping trips lasted 1 to 2 nights.
• 68% of camping companions were spouses or significant others.
• 74% of adult participants used a Smartphone while camping.
Buying Behavior
• Adult participants spent an average of $546.41 on camping gear in 2016.
• Almost half of participants bought a flashlight for camping, making it the most popular camping purchase.
• A majority of camping purchase decisions were made before the trips.
• Most camping purchases were replace-ments for a lost or broken item.
• 96% of campers said that their gear kept them comfortable.
1st Time Campers
• 11% of campers were new to the activity in 2016.
• At 16%, backpacking had the highest rate of new participants.
• Campers spent an average $181.61 on gear for their 1st trip.
• Flashlights and coolers were the most popular purchases for 1st time campers.
• 92% of 1st time campers said it was “likely” or “very likely” that they would participate in camping next year.
Future of Camping
• The average age for a 1st camping trip was 10.
• Half of current campers were exposed to outdoor activities as adolescents. The gap among campers who participated during childhood was almost as dramatic.
• Camping participants planned to take an average of 4.7 trips in the next year.
key findings

CAMPING

2017 American Camper Report | 4 presented by The Coleman Company, Inc. and The Outdoor Foundation
camping participation trends
Camping Participation Over Time13.7% of the US population participated in camping at least once in 2016. This is a slight increase from 13.6% the year before when camping was at the lowest participation level measured in this report.
All Americans, ages 6+
Number of Participants40.5 million Americans, ages 6
and over, participated in camping
in 2016, an increase of 500,000
participants since the year before.
Number of OutingsCamping outings remained
steady at a total of 587.2 million
from 2015 to 2016.
Average OutingsCamping participants embarked
on an average of 14.5 outings
per person last year. During the
year before, the average was 14.7
outings per person.
41.744.7 46.2
42.3
44.8
40.5 40.1 40.5 40.540.0
0%
5%
10%
15%
20%
14.9%16.4%16.0%15.1% 15.7% 14.1% 13.8% 13.9% 13.6% 13.7%
20072008
20092010
20112012
20132014
20152016

5 | 2017 American Camper Report presented by The Coleman Company, Inc. and The Outdoor Foundation
participation by type of camperAll Americans, ages 6+
Type of Participant
Number of Participants
Participation Rate Total Days
Days per Participant
Car camping 27.7 million 9% 265.3 billion 9.6
RV camping 14.7 million 5% 181.5 billion 12.3
Backpacking 10.1 million 3% 140.4 billion 13.9
All 40.5 million 14% 587.2 billion 14.5
0%
5%
10%
15%
9%
5%3%
2.72.6 14%35%
19%
13.9%
All
BackpackerRVCar
Participation Rate by Camping TypeOf those Americans who camped in 2016, most participated in car camping, which means they camped
within 1/4 of a mile of their vehicles. Although car camping was the most popular form of camping, these
participants averaged the fewest number of days at 9.6.
Note: Some people participated in several types of camping.

2017 American Camper Report | 6 presented by The Coleman Company, Inc. and The Outdoor Foundation
participation in-depth
-20
0
20
40
60
+10.5M
Total Participants
2015
New/Returning Participants
2016
Lost Participants
2016
Total Participants
2016
-10.0M
40.0M 40.5M
Churn Rate25%
The Leaky BucketThe leaky bucket illustrates how camping participation increased from 2015 to 2016. Camping attracted 10.5
million participants who tried the activity for the first time or returned after a hiatus. Meanwhile, camping
lost slightly fewer participants—10.0 million—and netted 500,000 participants. The churn rate, those
joining and departing the activity, was fairly high at 25%.
New/Returning Participants
New camping participants made
up 11.0% of total participants, or
4.7 million Americans. Returning
participants, those returning after
a hiatus, accounted for 15.0%
of participants, or 5.9 million
people.
Lost Participants10.1 million people stopped
participating in camping in 2016.
The attrition rate decreased
since 2015 when 10.0 million
people stopped participating in
camping.
Continuing ParticipantsThe majority of participants,
74.0%, continued participating in
camping from 2015 to 2016. That
equates to 30.0 million people.
All Americans, ages 6+

7 | 2017 American Camper Report presented by The Coleman Company, Inc. and The Outdoor Foundation
participant demographics
Pacific: 17%
West South Central: 11%
Middle Atlantic: 11%
East South Central: 10%
East North Central: 14%
New England: 11%Mountain: 19%West North Central: 16%
South Atlantic: 11%
highest percentage of participants
0%
10%
20%
9%
17% 18%19%
18%
Ages13-17
Ages6-12
Ages1-5
Ages1-17
None
Kids in Household
Participation in Outdoor Recreation Among Adults with Childrenamong camping participants, ages 18+
Adults with children in their
households participated in camping at
higher levels than adults without children.
17% of adults with children, ages 1 to 17,
in their households participated, while only
9% of adults without children participated.
among Americans, ages 6+
South Atlantic: 11%

2017 American Camper Report | 8 presented by The Coleman Company, Inc. and The Outdoor Foundation
Ethnicity
Hispanic
White
Asian
Black
EducationIncome
≥$25,000
≥3 YrsHigh School
High SchoolGrad
1-3 YrsCollege
CollegeGrad
Post-GradStudies
Other 1%
$25,000-$49,999
$50,000- $74,999
$75,000-$99,999
≤$100,000+
Age
13-17
18-24
25-44
6-12
100%
60%
80%
40%
0%
20%
Gender
Female
Male
45+
45%
55%
13%25%
16%
21%
25%
22%
20%
16%
29%
16%
10%
11%
34%
29%11% 5%
6%
10%
78%
Other 3%
participant demographics
Marital Status
among camping participants, ages 18+
Work Status
among camping participants, ages 18+
Married or living with a domestic partner
67%
Single25%
Divorced or separated
7%
Widowed1%
Employed57%
Student or homemaker
27%
Retired8%
Not employed 8%
among camping participants, ages 6+

9 | 2017 American Camper Report presented by The Coleman Company, Inc. and The Outdoor Foundation
All Americans, ages 6+
camping participation over time by age
0%
10%
20%
30%
20162015
20142013
20122011
20102009
Ages 45+Ages 25-44Ages 18-24Ages 13-17Ages 6-12
Participant Age Participation Ratein 2016
5-year Average Annual Growth
6-12 21% -4.2%
13-17 18% -3.7%
18-24 14% -3.7%
25-44 16% -1.4%
45+ 8% -4.2%

2017 American Camper Report | 10 presented by The Coleman Company, Inc. and The Outdoor Foundation
4-5 Times17%
6-11 Times19%
12-23 Times
13%
1-3 Times39%
52+ Times4%
24-51 Times8%
level of participation
Annual OutingsCamping participants went on a 14.5 average annual outings in 2016. A majority—75%—went on less than
one camping trip per month. 12% of participants went camping twice a month or more.
Camping Participants, ages 6+
Perceived Level of Camping Participation Camping Participants
I'm a casual participant. Camping is one of several ways I like to spend my recreational time.
45%
I'm hooked. Camping is one of my favorite things to do. 21%
I'm a fanatic. I love being outside, and camping is my favorite activity.
17%
Camping is OK, but I most often choose to do something else with my recreational time.
12%
I don't really consider myself a camping participant. I usually only participate at the urging of others.
5%

11 | 2017 American Camper Report presented by The Coleman Company, Inc. and The Outdoor Foundation
enjoyment of other activities
Participation in Outdoor Recreationages 6+
A majority of campers, 88%, participated in camping
in addition to another outdoor activity. Only 12%
participated in camping alone. 88%
12%
I participate in camping +another outdoor activity
I only participate in camping
Camping Participants
Top 10 Favorite Sports and Leisure Activities in General(not only during a camping trip)
% of Respondents, ages 18+
Card and board games 49%
Fishing 47%
Photography 47%
Outdoor cooking 46%
Hiking 45%
Traditional yard games (e.g. badminton, croquet, horseshoes) 40%
Boating 28%
Canoeing 20%
Road bicycling 17%
Kayaking 17%

2017 American Camper Report | 12 presented by The Coleman Company, Inc. and The Outdoor Foundation
Camping Participants, ages 18+
perceptions of camping
Top 20 Words Associated with Camping % of Respondents
Outdoors 89%
Campfire 89%
Fun 84%
Tent 83%
Adventure 80%
S'mores 77%
Wilderness 76%
Relaxing 76%
Family 74%
Friends 69%
Happiness 68%
Peace 67%
Escape 65%
Animals 60%
Stories 53%
Weather 53%
Cabin 45%
Social 43%
Children 42%
Recharging Self 42%

PROFILE OF A
CAMPING TRIP

2017 American Camper Report | 14 presented by The Coleman Company, Inc. and The Outdoor Foundation
Cabin17%
Tent71%
Bivy1%
RV11%
type of camping
Primary Camping StructureTents were, by far, the most popular type of camping structure. 71% of all camping participants, ages 18 and
up, chose to primarily sleep in tents.
Camping Participants, ages 18+
Gender Average Age
Bivy
RV
Cabin / Yurt
Tent77%77%
33%37%
27%24%
15%
83%
85%
71% 29%4%
Bivy
RV
Cabin / Yurt
Tent 40 years
50 years
46 years
42 years
Male Female

15 | 2017 American Camper Report presented by The Coleman Company, Inc. and The Outdoor Foundation
trip preparationCamping Participants, ages 18+
5%
10%
15%
20%
25%
30%
35%
1+ Months
2-4 Weeks
4-7 Days
1-3 Days
Day of Departu
re
7%
18%
20%
24%
31%
Time Camping Plans Confirmed before the Camping TripCamping plans were confirmed an average of 25 days in advance. Only 7% of trips were planned on the day
of departure, while 31% were planned at least one month in advance.

2017 American Camper Report | 16 presented by The Coleman Company, Inc. and The Outdoor Foundation
trip preparationCamping Participants, ages 18+
Reservations Made at a Camp Site before TripCamp site reservations tended to be more spontaneous than general trip planning. 43% of camp site
reservations were made on the day of arrival.
0% 10% 20% 30% 40% 50%
1+ Years
6+ Months
3+ Months
1+ Months
2-4 Weeks
4-7 Days
1-3 Days
Walk-in 43%
9%
7%
19%
12%
3%
1%
5%
Yes46%
No54%
Yes77%
No23%
Electrical hook-up provided? Did you use the hook-up?
17 | 2017 American Camper Report presented by The Coleman Company, Inc. and The Outdoor Foundation
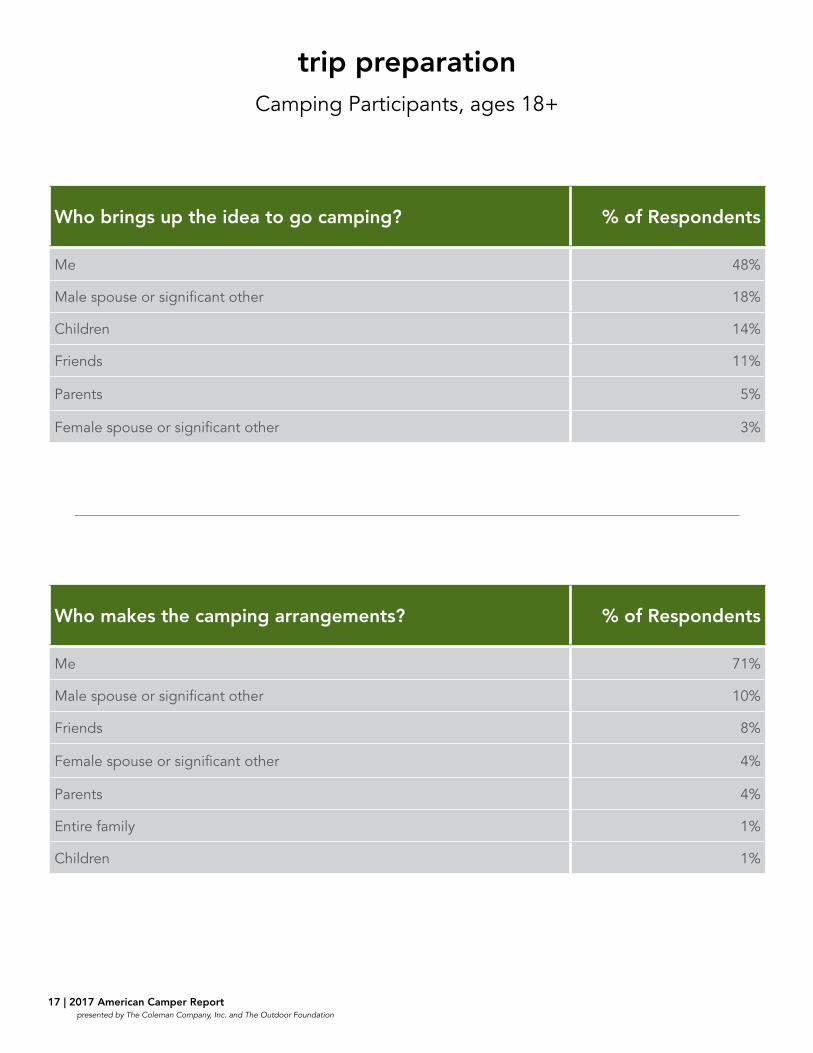
trip preparationCamping Participants, ages 18+
Who brings up the idea to go camping? % of Respondents
Me 48%
Male spouse or significant other 18%
Children 14%
Friends 11%
Parents 5%
Female spouse or significant other 3%
Who makes the camping arrangements? % of Respondents
Me 71%
Male spouse or significant other 10%
Friends 8%
Female spouse or significant other 4%
Parents 4%
Entire family 1%
Children 1%

2017 American Camper Report | 18 presented by The Coleman Company, Inc. and The Outdoor Foundation
trip preparationCamping Participants, ages 18+
Top 10 Ways Campers Chose Their Destination % of Respondents
Close to home 32%
Affordable 25%
On a driving vacation 9%
Amenities 9%
Scenery 3%
Convenient location 2%
Own property 2%
Previously visited 2%
Regular destination 2%
Event or festival 2%

19 | 2017 American Camper Report presented by The Coleman Company, Inc. and The Outdoor Foundation
Average Ideal Daytime Temperaturefor Camping
Average Ideal Nighttime Temperaturefor Camping
trip preferencesCamping Participants, ages 18+
0
1
2
3
2.7 2.72.6 2.535%
19%
13.9%
SpringWinter
Fall
Summer
Average Number of Trips per SeasonAlthough the average number of camping trips per season were fairly evenly spread out, summer and winter
were slightly more popular seasons to take trips than fall and spring.
72.5˚ 60.7˚

2017 American Camper Report | 20 presented by The Coleman Company, Inc. and The Outdoor Foundation
trip detailsCamping Participants, ages 18+
0%
10%
20%
30%
40%
37% 35%
19%
5% 4%
13.9% 13.6% 13.7%
500+ Miles
301-500 Miles
151-300 Miles
51-150 Miles
Less Than 50 Miles
Distance from HomeCamping participants traveled an average of 136.8 miles to reach their final camping destinations. 72% of
campers preferred to stay close to home, within 150 miles from home.
Type of Trip Length of Trip
3-4 Nights35%
1-2 Nights52%
5-6 Nights7%
7+ Nights5%
Backcountry13%
Drive-up72%
Group10%
Backyard6%

21 | 2017 American Camper Report presented by The Coleman Company, Inc. and The Outdoor Foundation
activities during the tripCamping Participants, ages 18+
Top 10 Favorite Activities While Camping % of Respondents
Hiking 45%
Outdoor cooking 44%
Fishing 39%
Photography 25%
Card or board games 21%
Traditional yard games (e.g. badminton, croquet, horseshoes) 16%
Canoeing 15%
Boating 14%
Kayaking 13%
Climbing 7%
Top 10 Favorite Nighttime Activities While Camping % of Respondents
Campfires 81%
Stargazing 63%
Grilling 52%
Storytelling 37%
Cooking 32%
Drinking 30%
Card or board games 28%
Reading 18%
Playing guitar or other instruments 15%
Fishing 14%

2017 American Camper Report | 22 presented by The Coleman Company, Inc. and The Outdoor Foundation
companions during the tripCamping Participants, ages 18+
Who do you go camping with? % of Respondents
Spouse or significant other 68%
Friends 65%
Immediate family 58%
Pets 37%
Kids, ages 9-14 29%
Kids, ages 2-8 26%
Extended family 22%
Kids, ages 15-17 18%
Kids, under age 2 10%
Grandkids, ages 2-8 9%
Grandkids, ages 9-14 6%
By myself 4%
Grandkids, under age 2 2%
Grandkids, ages 15-17 2%
Others 2%

23 | 2017 American Camper Report presented by The Coleman Company, Inc. and The Outdoor Foundation
technology use during the tripCamping Participants, ages 18+
Technology Used While Camping % of Respondents
Smartphone 74%
Portable USB charger 30%
iPod or other music player 22%
Tablet 19%
Fitness monitor 12%
Laptop computer 9%
Handheld GPS 9%
Watch-based GPS 2%
Speaker 1%
None 19%

2017 American Camper Report | 24 presented by The Coleman Company, Inc. and The Outdoor Foundation
technology use during the tripCamping Participants, ages 18+
Top 15 Reasons for Using Technology % of Respondents
Texting 53%
GPS location services 47%
Personal email 39%
Outdoor activity-related apps 33%
News 29%
Gaming 28%
Work email 26%
Get to know the area 6%
Music 4%
Camera 4%
Keep in touch with family 2%
In case of emergency 2%
Checking weather 2%
Watching TV or movies 1%
Talk on the phone 1%

BUYING BEHAVIOR

2017 American Camper Report | 26 presented by The Coleman Company, Inc. and The Outdoor Foundation
camping gear purchasesCamping Participants, ages 18+
Top 10 Camping Purchases in the Last Year % of Respondents
Flashlight 48%
Cooler 42%
Backpack 30%
Airbed 29%
Tent 26%
Sleeping bag 25%
Propane or liquid fuel lighting 24%
Headlamp 23%
Lantern 22%
Camp furniture 15%
0%
10%
20%
30%
$10,
001+
$5,0
01~
$10,
000
$1,0
01-$
5,00
0
$501
-$1,
000
$401
-$50
0
$201
-$40
0
$101
-$20
0
$51-
$100
$51-
$100
$21-
$50
$11-
$20
$10
or l
ess$0
Money Spent on Camping GearNearly half of adult camping participants, 47%
to be exact, spent between $51 and $200 on
camping gear in 2016.

27 | 2017 American Camper Report presented by The Coleman Company, Inc. and The Outdoor Foundation
spending more on the outdoors among participants and non-participants
Americans, ages 18+
Outdoor Goods or Services Camping Participants Non-participants
Outdoor recreation activities 14% 3%
Sport or recreational footwear 14% 5%
Sport or recreational equipment 11% 3%
Gym membership 11% 4%
Sport or recreational clothing 10% 4%
Travel to participate in sports or recreation
10% 3%
Individual sporting events 9% 2%
Golf membership or fees 8% 2%
Outdoor Goods or Services
Camping Participants Non-participants
Outdoor recreation activities 14% 3%
Sport or recreational footwear 14% 5%
Sport or recreational equipment 11% 3%
Gym memberships 11% 4%
Sport or recreational clothing 10% 4%
Travel to participate in sports or recreation
10% 3%
Individual sporting events 9% 2%
Golf memberships or fees 8% 2%
Winter sports 7% 2%
Team sports outside of school 6% 2%
Team sports at school 6% 1%
Tennis memberships or fees 5% 1%
Lessons or camps 5% 2%

2017 American Camper Report | 28 presented by The Coleman Company, Inc. and The Outdoor Foundation
spending less on the outdoors among participants and non-participants
Americans, ages 18+
Outdoor Goods or Services
Camping Participants Non-participants
Travel to participate in sports or recreation
16% 5%
Sport or recreational footwear 16% 7%
Sport or recreational clothing 15% 7%
Sport or recreational equipment 14% 5%
Outdoor recreation activities 13% 7%
Winter sports 12% 2%
Gym memberships 8% 5%
Lessons or camps 8% 2%
Individual sporting events 8% 3%
Golf memberships or fees 7% 3%
Team sports outside of school 7% 2%
Team sports at school 7% 3%
Tennis memberships or fees 4% 2%

29 | 2017 American Camper Report presented by The Coleman Company, Inc. and The Outdoor Foundation
making the purchaseCamping Participants, ages 18+
When did you decide to purchase the item? % of Respondents
Before camping 67%
At a general store 8%
On a camping trip 8%
After a camping trip 6%
While reviewing gear online 5%
While at an outdoor store 3%
While at a yard sale 1%
Received it as a gift 1%
New38%
Replacement62%
Yes96%No
4%
What kind of item? Did your item keep you comfortable?

2017 American Camper Report | 30 presented by The Coleman Company, Inc. and The Outdoor Foundation
deciding on the purchaseCamping Participants, ages 18+
How was your purchase decision made? % of Respondents
I went to a store to make my purchase without doing any online research ahead of time.
35%
I did some research about the product online. Then, I went to a store to check out the item in person and made my purchase in the store.
29%
I went to the store without an intent to purchase the item. 9%
It was an impulse purchase because of a discounted price. 8%
I did some research about the product online. Then, I went to the store to check out the item but made my purchase online.
6%
I did some research about the product online and purchased the product online without checking them out at a store.
6%
I did no research, but I saw the item at a store and then made my purchase online.
5%
The item was given to me as a gift. 1%
Other 1%

31 | 2017 American Camper Report presented by The Coleman Company, Inc. and The Outdoor Foundation
camping gear preferencesCamping Participants, ages 18+
Top 10 Most Essential Camping Items % of Respondents
Tent 61%
Sleeping bag 38%
Bug spray 24%
Cooler or fridge 23%
Firewood 22%
Toilet facilities 22%
Flashlights 22%
Fire starters or matches 20%
Airbed or mattress 13%
Camper or RV 12%
Top 10 Most Luxury Camping Items % of Respondents
Air conditioning or heating 47%
TV or electronics 44%
Electricity 41%
Wifi or GPS 37%
Camper or RV 34%
Shower and washing facilities 24%
Airbed or mattress 17%
Toilet facilities 11%
Cooler or fridge 10%
Stove 6%

2017 American Camper Report | 32 presented by The Coleman Company, Inc. and The Outdoor Foundation
frequency of replacing gearCamping Participants, ages 18+
Most Replaced Camping Items Average # of Years
Coolers 3.1
Tents 3.0
Sleeping bags 2.9
Camping chairs 2.7
Camp stoves 2.5
Canopy or shelters 2.4
Portable outdoor grills 2.4
Flashlights and headlamps 2.4
Airbeds 2.3
Battery lanterns 2.2
Fueled lanterns 1.9

1ST TIME
CAMPERS

2017 American Camper Report | 34 presented by The Coleman Company, Inc. and The Outdoor Foundation
camping for the 1st time in 2016Camping Participants, ages 6+
1st Time Participants11% of all camping participants in 2016 were new to camping. That equates to 4.7 million people.
Type of Camping % of 1st Time Participants
# of 1st Time Participants
Backpacking 16% 1.6 million
RV 8% 1.2 million
Car camping 8% 2.3 million
All 12% 5.0 million
11% of camping participants
4.7 millionpeople
Note: Some people participated in several types of camping.

35 | 2017 American Camper Report presented by The Coleman Company, Inc. and The Outdoor Foundation
age of 1st camping experience among novice and veteran campers
Age at Time of 1st Camping Experience
1st Time Campers in 2016
Continuing/Returning Campers in 2016
6-12 27% 12%
13-17 9% 8%
18-24 16% 10%
25-34 26% 15%
35-44 12% 15%
45-54 5% 15%
55-64 3% 12%
65+ 2% 13%
Camping Experience in 2016Of all 1st time camping participants, 27% were in children between the ages of 6 and 12. Interestingly, 26%
were young adults between the ages of 25 and 34. Age cohorts were more evenly spread among veteran
campers ages 25 and up.
2017 American Camper Report | 36 presented by The Coleman Company, Inc. and The Outdoor Foundation
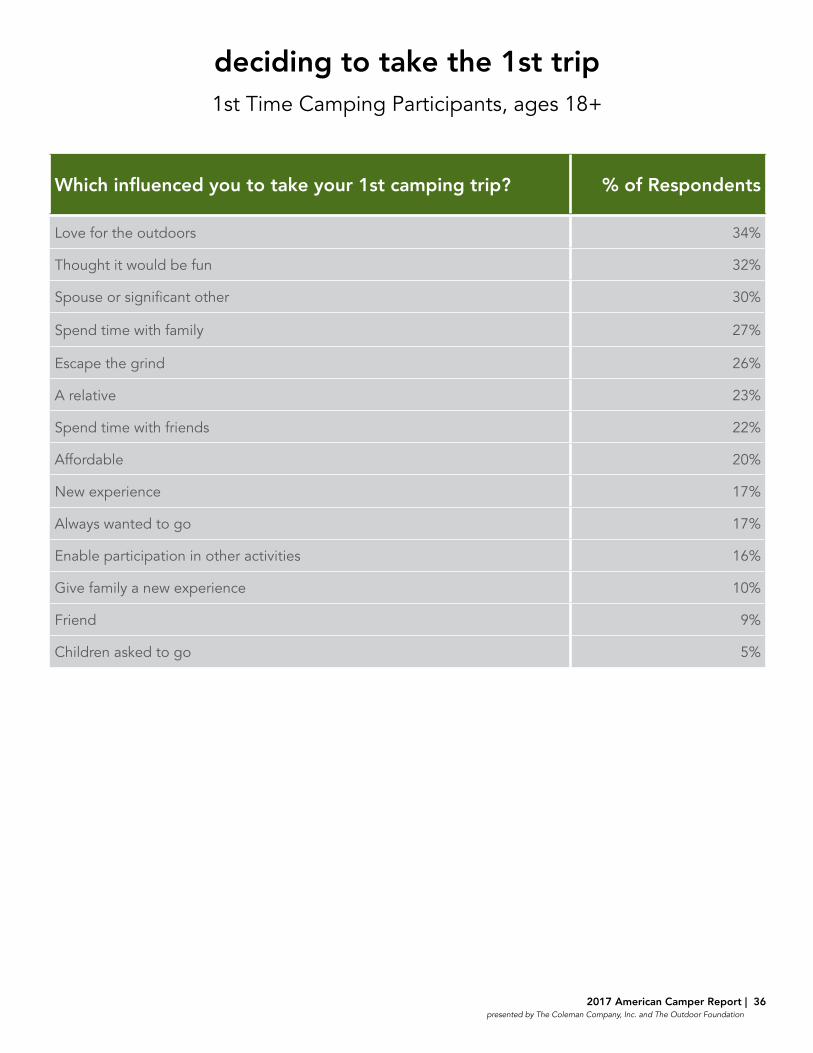
deciding to take the 1st trip1st Time Camping Participants, ages 18+
Which influenced you to take your 1st camping trip? % of Respondents
Love for the outdoors 34%
Thought it would be fun 32%
Spouse or significant other 30%
Spend time with family 27%
Escape the grind 26%
A relative 23%
Spend time with friends 22%
Affordable 20%
New experience 17%
Always wanted to go 17%
Enable participation in other activities 16%
Give family a new experience 10%
Friend 9%
Children asked to go 5%

37 | 2017 American Camper Report presented by The Coleman Company, Inc. and The Outdoor Foundation
gear preparation for the 1st trip1st Time Camping Participants, ages 18+
Top 10 Items Purchased for the 1st Trip % of Respondents
Flashlight 55%
Cooler 53%
Tent 48%
Sleeping bag 46%
Cooking utensils 38%
Portable grill 37%
Backpack 35%
Airbed 34%
Propane or liquid fuel lighting 34%
Camp stove 33%
Top 10 Items Borrowed for the 1st Trip % of Respondents
None 67%
Tent 14%
Cooler 8%
Sleeping bag 8%
Airbed 6%
Portable grill 5%
Battery lantern 5%
Camp stove 5%
Camping accessories (e.g. picnic cloth, pocket knife) 4%
Flashlight 4%

2017 American Camper Report | 38 presented by The Coleman Company, Inc. and The Outdoor Foundation
gear review after the 1st trip1st Time Camping Participants, ages 18+
Top 10 Items That Would Have Made the 1st Trip Better % of Respondents
Nothing 34%
Airbed 29%
Rain gear 15%
Bicycle 14%
Cot 11%
Camp stove 9%
Portable grill 9%
Headlamp 9%
RV 9%
Camp furniture 9%
Money Spent on Camping Gear for a 1st Trip % of Respondents
$0 22%
$10 or less 0%
$11-$20 2%
$21-$50 6%
$51-$100 14%
$101-$200 21%
$201-$400 27%
$401-$500 5%
$501-$1,000 2%
Over $1,000 1%

39 | 2017 American Camper Report presented by The Coleman Company, Inc. and The Outdoor Foundation
companions during the 1st trip1st Time Camping Participants, ages 18+
Who do you go camping with on your first trip? % of Respondents
Spouse or significant other 54%
Friends 47%
Immediate family 37%
Kids, ages 2-8 20%
Pets 16%
Kids, ages 9-14 14%
Extended family 9%
Kids, under age 2 7%
Kids, ages 15-17 6%
By myself 3%
Grandkids, ages 2-8 1%
Scouts 1%
Other groups 1%
Grandkids, under age 2 1%
Grandkids, ages 9-14 1%
Grandkids, ages 15-17 1%

2017 American Camper Report | 40 presented by The Coleman Company, Inc. and The Outdoor Foundation
perceptions among 1st time campers1st Time Camping Participants, ages 18+
Top 20 Words Associated with the 1st Trip % of Respondents
Campfire 70%
Adventure 61%
Fun 61%
Happiness 60%
Outdoors 58%
Relaxing 52%
S'mores 50%
Peace 49%
Family 46%
Escape 45%
Stories 45%
Wilderness 42%
Tent 39%
Friends 36%
Social 34%
Drinking 33%
Recharging self 32%
Animals 32%
Easy 25%
Economical 23%
41 | 2017 American Camper Report presented by The Coleman Company, Inc. and The Outdoor Foundation
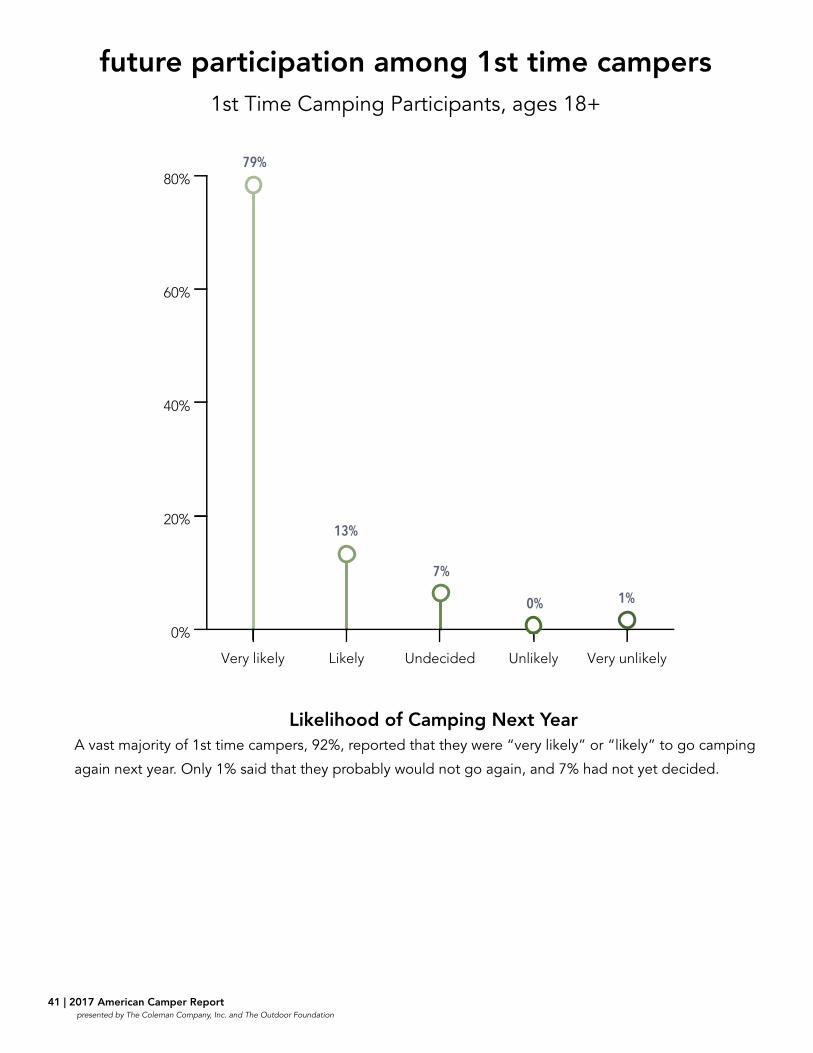
future participation among 1st time campers1st Time Camping Participants, ages 18+
0%
20%
40%
60%
80%
Very unlikelyUnlikelyUndecidedLikelyVery likely
79%
13%
7%
0% 1%
Likelihood of Camping Next YearA vast majority of 1st time campers, 92%, reported that they were “very likely” or “likely” to go camping
again next year. Only 1% said that they probably would not go again, and 7% had not yet decided.

2017 American Camper Report | 42 presented by The Coleman Company, Inc. and The Outdoor Foundation
future participation among 1st time campers1st Time Camping Participants, ages 18+
Reason for Not Camping in the Future % of Respondents
Not enough vacation 54%
Prefer a hotel 41%
Work or school commitments 36%
No one to go with 19%
Didn’t like it 12%
Want to spend vacation differently 12%
Motivation for Camping in the Future % of Respondents
More free time or vacation time 55%
Spouse or significant other wants to go again 47%
Good weather 43%
My family wants to go again 42%
Campgrounds with “luxuries” (e.g. wifi, showers) 33%
My friends want to go again 27%
Campgrounds with activities for children 22%
Better equipment 15%
Online resource for meeting other campers 15%
Marketing of camping equipment, techniques, lifestyles and destinations 12%
Resources to help figure out how to prepare for a trip 7%

FUTURE OF CAMPING

2017 American Camper Report | 44 presented by The Coleman Company, Inc. and The Outdoor Foundation
introduction to campingCamping Participants, ages 18+
0%
10%
20%
30%
65+55-64
45-5435-44
25-3422-24
19-2116-18
12-159-116-83-50-2
Age at 1st Camping ExperienceThe majority of camping participants experienced their first outing during childhood, with an average age of
10 for a 1st camping trip. After age 15, the likelihood of being exposed to camping dramatically dropped,
and by age 45, it was very unlikely that an individual would go on a 1st trip.

45 | 2017 American Camper Report presented by The Coleman Company, Inc. and The Outdoor Foundation
Camping Participants, ages 18+
youth participation in sports and recreation among current campers
Adults at age 6-12 Adults at age 13-17
ActivityOutdoor
ParticipantNon-outdoor
ParticipantOutdoor
ParticipantNon-outdoor
Participant
PE at school 69% 65% 67% 63%
Outdoor activities 44% 31% 50% 38%
Team sports 36% 31% 41% 35%
Cycling 33% 27% 34% 29%
Running or jogging 22% 18% 33% 29%
Swimming for fitness 20% 16% 22% 18%
Water sports 19% 13% 21% 16%
Winter sports 15% 11% 18% 15%
Racquet sports 7% 5% 13% 12%
Golf 6% 4% 10% 10%
Fitness or health club-based activities
5% 3% 11% 9%
None 15% 21% 15% 18%

2017 American Camper Report | 46 presented by The Coleman Company, Inc. and The Outdoor Foundation
camping barriersCamping Participants, ages 18+
Reasons for Taking Fewer Trips % of Respondents
Work or school commitments 58%
Family commitments 35%
Not enough vacation time 28%
Too expensive 16%
No one to go with 14%
Need equipment 11%
Bad weather 8%
Prefer a hotel 8%
Price of fuel 5%
No reservations 2%
Health 2%
Have young children 2%
Family issues 2%
Park closed 2%
No transport 1%
Distance 1%
Most Time-Consuming Aspect of Camping % of Respondents
Packing and unpacking 23%
Finding time 21%
Planning 20%
Setting up camping equipment 16%
Traveling 13%
Maintenance of gear 8%

47 | 2017 American Camper Report presented by The Coleman Company, Inc. and The Outdoor Foundation
past camping activityCamping Participants, ages 18+
Camping Activity Over the Last 3 Years % of Respondents
No significant change 31%
Fewer trips, and they are shorter 18%
More trips, and they are longer 15%
Same number of trips, but they are shorter 12%
More trips, but they are shorter 11%
Fewer trips, but they are longer 8%
Same number of trips, and they are longer 4%

2017 American Camper Report | 48 presented by The Coleman Company, Inc. and The Outdoor Foundation
Motivation for Taking More Trips % of Respondents
More vacation time 42%
An inexpensive option 37%
Prefer camping over staying at a hotel 35%
Weather has been good 33%
Want to stay close to hiking or biking trails 14%
Upgraded or purchased equipment 11%
Enjoy the family bonding 5%
Like getting back to nature 1%
Like the people I meet camping 1%
It’s fun 1%
future camping activityCamping Participants, ages 18+
3-5 Times34%6-10
Times14%
1-2 Times42%
10+ Times11%
Camping Trips Planned for Next YearCamping participants reported having an average of 4.7 camping trips planned for next year. 11% of adult
campers had an ambitious 10 or more trips lined up.

CROSSOVERPARTICIPATION

2017 American Camper Report | 50 presented by The Coleman Company, Inc. and The Outdoor Foundation
Activity Participants (in millions)
Participation Rate
Index vs. Total Population
Adventure Racing 3,257 8.0% 794
Aquatic Exercise 4,551 11.2% 315
Archery 4,996 12.3% 462
Badminton 3,791 9.4% 377
Barre 2,132 5.3% 468
Baseball 6,906 17.0% 342
Basketball 7,563 18.7% 247
Bicycling (BMX) 2,720 6.7% 641
Bicycling (Mountain/Non-Paved Surface) 3,827 9.4% 325
Bicycling (Road/Paved Surface) 11,301 27.9% 215
Birdwatching 4,407 10.9% 278
Boardsailing/Windsurfing 2,001 4.9% 842
Bodyweight Exercise and Bodyweight Accessory-Assisted Training 6,920 17.1% 201
Boot Camp-Style Training 2,518 6.2% 280
Bowling 13,902 34.3% 221
Boxing for Competition 1,483 3.7% 896
Boxing for Fitness 3,077 7.6% 435
Canoeing 6,036 14.9% 439
Cardio Kickboxing 3,591 8.9% 381
Cardio Tennis 1,832 4.5% 630
Cheerleading 2,105 5.2% 382
Climbing (Sport/Indoor/Boulder) 3,068 7.6% 457
Climbing (Traditional/Ice/Mountain) 2,668 6.6% 699
Cross-Training-Style Workouts 4,380 10.8% 248
camping crossover participationCamping Participants, ages 6+
Participants = number of campers who participated in that activity
Participation Rate = percentage of campers who are participates in that activity
Index vs Total Participation = compares the percentage of camping participants who participated in that activity to the percentage of the total US population who participated in that activity. For example, an index of 100 means that the percentage of camping participants participating in an activity equals the percentage of the national population who participated in that activity.

51 | 2017 American Camper Report presented by The Coleman Company, Inc. and The Outdoor Foundation
Activity Participants (in millions)
Participation Rate
Index vs. Total Population
Dance, Step and Other Choreographed Exercise to Music 6,154 15.2% 206
Elliptical Motion Trainer/Cross-Trainer 8,105 20.0% 184
Field Hockey 1,121 2.8% 542
Fishing (Fly) 3,658 9.0% 414
Fishing (Freshwater/Other) 14,544 35.9% 279
Fishing (Saltwater) 4,924 12.2% 293
Football (Flag) 3,212 7.9% 380
Football (Tackle) 2,558 6.3% 341
Football (Touch) 2,439 6.0% 314
Free Weights (Barbells) 7,108 17.5% 196
Free Weights (Dumbbells/Hand Weights) 11,770 29.0% 167
Golf (On Golf Course) 6,458 15.9% 198
Gymnastics 2,040 5.0% 277
High Impact/Intensity Training 7,658 18.9% 262
Hiking (Day) 19,528 48.2% 339
Hunting (Bow) 2,868 7.1% 474
Hunting (Handgun) 2,141 5.3% 446
Hunting (Rifle) 5,678 14.0% 385
Hunting (Shotgun) 4,058 10.0% 359
Ice Hockey 1,580 3.9% 428
Ice Skating 5,405 13.3% 383
Jet Skiing 2,579 6.4% 326
Kayaking (Recreational) 5,473 13.5% 399
Kayaking (Sea/Touring) 2,320 5.7% 543
Kayaking (White Water) 2,194 5.4% 628
Kettlebells 4,138 10.2% 282
Lacrosse 1,114 2.7% 390
Martial Arts 3,023 7.5% 385
MMA for Competition 1,011 2.5% 652
MMA for Fitness 1,602 4.0% 479
Other Combat Training 1,493 3.7% 578
Paintball 2,204 5.4% 435
Pickleball 1,494 3.7% 388
Pilates Training 3,391 8.4% 279
Racquetball 1,989 4.9% 406
Rafting 2,134 5.3% 455

2017 American Camper Report | 52 presented by The Coleman Company, Inc. and The Outdoor Foundation
Activity Participants (in millions)
Participation Rate
Index vs. Total Population
Roller Hockey 1,977 4.9% 749
Roller Skating (2x2 Wheels) 3,495 8.6% 393
Roller Skating (Inline Wheels) 2,900 7.2% 394
Rowing Machine 4,171 10.3% 282
Rugby 1,035 2.6% 488
Running/Jogging 11,981 29.6% 185
Sailing 2,578 6.4% 460
Scuba Diving 1,948 4.8% 458
Shooting (Sport Clays) 3,678 9.1% 492
Shooting (Trap/Skeet) 3,306 8.2% 526
Skateboarding 3,371 8.3% 383
Skiing (Alpine/Downhill) 3,348 8.3% 264
Skiing (Cross-Country) 2,679 6.6% 422
Skiing (Freeski/Freestyle) 2,036 5.0% 321
Snorkeling 3,434 8.5% 288
Snowboarding 3,577 8.8% 344
Snowmobiling 1,988 4.9% 435
Snowshoeing 1,541 3.8% 319
Soccer (Indoor) 2,346 5.8% 335
Soccer (Outdoor) 4,343 10.7% 266
Softball (Fast-Pitch) 1,317 3.3% 390
Softball (Slow-Pitch) 3,548 8.8% 337
Squash 1,204 3.0% 569
Stair-Climbing Machine 5,369 13.3% 260
Stand-Up Paddling 2,305 5.7% 523
Stationary Cycling (Group) 3,702 9.1% 303
Stationary Cycling (Recumbent/Upright) 8,442 20.8% 171
Stretching, Flexibility, Warm-Up, Cool-Down, and Mobility Training 8,458 20.9% 183
Surfing 2,061 5.1% 540
Swimming for Fitness 8,003 19.8% 220
Swimming on a Team 1,894 4.7% 411
Table Tennis 6,238 15.4% 275
Tai Chi 2,023 5.0% 399
Target Shooting (Handgun) 6,653 16.4% 300
Target Shooting (Rifle) 6,753 16.7% 352
Telemarking (Downhill) 1,260 3.1% 323

53 | 2017 American Camper Report presented by The Coleman Company, Inc. and The Outdoor Foundation
Activity Participants (in millions)
Participation Rate
Index vs. Total Population
Tennis 6,336 15.6% 256
Track and Field 2,222 5.5% 395
Trail Running 6,480 16.0% 552
Treadmill 11,517 28.4% 162
Triathlon (Non-Traditional/Off Road) 2,024 5.0% 868
Triathlon (Traditional/Road) 1,865 4.6% 574
Ultimate Frisbee 1,319 3.3% 263
Volleyball (Court) 2,312 5.7% 272
Volleyball (Grass) 2,112 5.2% 360
Volleyball (Sand/Beach) 2,799 6.9% 373
Wakeboarding 1,858 4.6% 467
Walking for Fitness 17,496 43.2% 119
Water Skiing 1,869 4.6% 369
Weight/Resistance Machines 7,477 18.5% 153
Wildlife Viewing 8,861 21.9% 312
Wrestling 1,388 3.4% 528
Yoga 7,507 18.5% 209

2017 American Camper Report | 54 presented by The Coleman Company, Inc. and The Outdoor Foundation
The Coleman Company, Inc. 180 N LaSalle Street; Suite 800
Chicago, IL 60601 www.coleman.com
is a registered trademark of The Coleman Company, Inc.
The Outdoor Foundation 419 7th Street NW, Suite 401
Washington, DC 20004 www.outdoorfoundation.org
is a registered trademark of The Outdoor Foundation.
© 2017, All Rights Reserved
Method During the 2016 calendar year, a total of 24,134 online interviews were carried out with a nationwide sample of individuals and households from the US Online Panel of over one million people operated by Synovate/IPSOS. A total of 11,453 individual and 12,681 household surveys were completed. The total panel is maintained to be representative of the US population for people ages six and older. Over sampling of ethnic groups took place to boost response from typically under responding groups. Data is based on Nielsen’s measure of the Hispanic population in the United States, ages 6 and up, which is 35,550,161 individuals.
The 2017 participation survey sample size of 24,134 completed interviews provides a high degree of statistical accuracy. All surveys are subject to some level of standard error — that is, the degree to which the results might differ from those obtained by a complete census of every person in the US. A sport with a participation rate of five percent has a confidence interval of plus or minus 0.31 percentage points at the 95 percent confidence level.
A weighting technique was used to balance the data to reflect the total US population ages six and above. The following variables were used: gender, age, income, household size, region, population density and panel join date. The total population figure used was 296,251,344 people ages six and older.
Youth Interviews All interviews of children under 13 were carried out following the guidelines set out in the Children’s Online Privacy Protection Act of 1998 (COPPA). No children were contacted directly. The panel is a balanced sample of households with children in each age group, but contact is always made through designated adult panelists. The adult panelist receives the survey invitation on behalf of a specified child, age six to 12, and they are asked to complete the survey together. Respondents ages 13 to 17 are contacted in a manner similar to respondents age six to 12, but they are asked to complete the survey themselves.
About the Physical Activity Council (PAC) The survey that forms the basis of the 2016 Special Report on Fishing is produced by the Physical Activity Council (PAC), which is a partnership of leading organizations in the US sports, fitness and leisure industries. While the overall aim of the survey is to establish levels of activity and identify key trends in sports, fitness and recreation participation, each partner produces detailed reports on specific areas of interest. Partners include: the Outdoor Foundation (OF); National Golf Foundation (NGF); Snowsports Industries America (SIA); Tennis Industry Association (TIA); USA Football; United States Tennis Association (USTA), International Health, Racquet and Sportsclub Association (IHRSA); and Sporting Goods Manufacturers Association (SGMA).
Notes Unless otherwise noted, the data in this report was collected during the latest 2017 participation survey, which focused on American participation in the 2016 calendar year. Please note that some information includes data that was collected during previous surveys, as some questions are not asked every year.
Disclaimer The data contained in this report is for information purposes only. While The Outdoor Foundation and The Coleman Company, Inc. have made every effort to collect and report accurate information, neither The Outdoor Foundation nor The Coleman Company, Inc. makes any representation or warranty of any kind, express or implied, about the completeness, accuracy, reliability, suitability or availability with respect to this report or the information or related graphics contained herein. Any reliance you place on such information is therefore strictly at your own risk. In no event will The Outdoor Foundation or The Coleman Company, Inc. be liable for any loss or damage, including without limitation, indirect or consequential loss or damage, or any loss or damage whatsoever arising from loss of profits arising out of, or in connection with, the use of this report. Reproduction, distribution, republication, and/or retransmission of material contained within this report is prohibited without the prior written permission of The Outdoor Foundation or The Coleman Company, Inc.

A Partnership Project of:
© 2017, All Rights Reserved