2017 annual general meeting - bt investment management · 2017 annual general meeting friday, ......
TRANSCRIPT

Annual General Meeting December 2016 | BT Investment Management 1
2017 Annual General Meeting Friday, 15 December 2017
2 2 2 2
Board of Directors
Andrew Fay Emilio Gonzalez Group CEO
James Evans Chairman
Meredith Brooks Deborah Page AM Kathryn Matthews
3 3 3 3
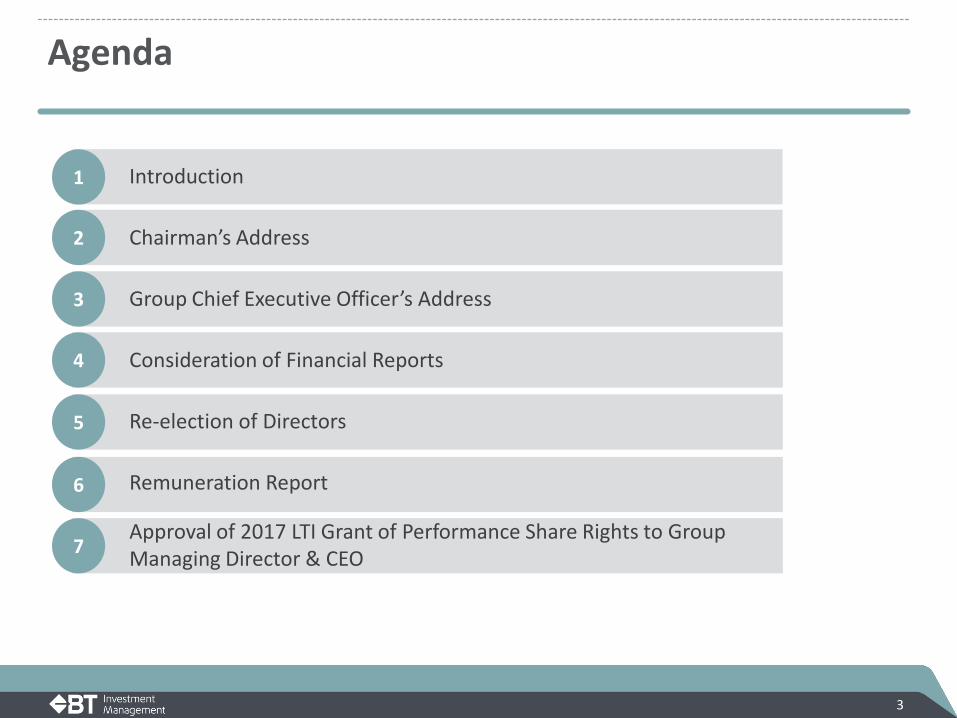
Agenda
5
6
7
1
3
4
2
Introduction
Chairman’s Address
Group Chief Executive Officer’s Address
Consideration of Financial Reports
Re-election of Directors
Remuneration Report
Approval of 2017 LTI Grant of Performance Share Rights to Group Managing Director & CEO

4 4 4 4
James Evans
Chairman’s address
5 5 5 5
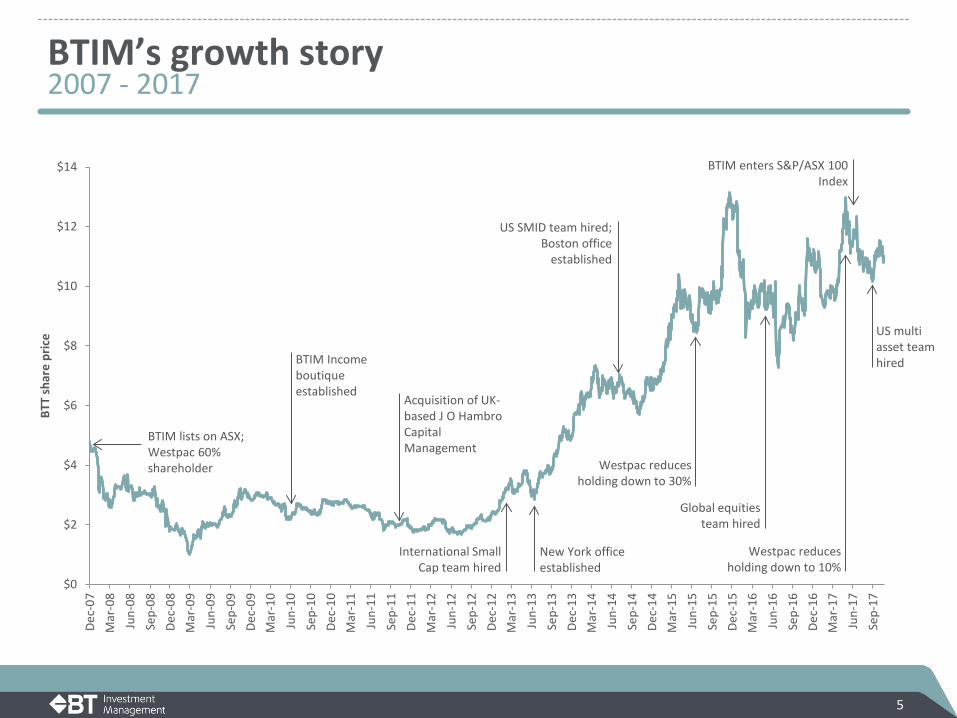
BTIM’s growth story 2007 - 2017
$0
$2
$4
$6
$8
$10
$12
$14
Dec-
07M
ar-0
8Ju
n-08
Sep-
08De
c-08
Mar
-09
Jun-
09Se
p-09
Dec-
09M
ar-1
0Ju
n-10
Sep-
10De
c-10
Mar
-11
Jun-
11Se
p-11
Dec-
11M
ar-1
2Ju
n-12
Sep-
12De
c-12
Mar
-13
Jun-
13Se
p-13
Dec-
13M
ar-1
4Ju
n-14
Sep-
14De
c-14
Mar
-15
Jun-
15Se
p-15
Dec-
15M
ar-1
6Ju
n-16
Sep-
16De
c-16
Mar
-17
Jun-
17Se
p-17
BTT
shar
e pr
ice
BTIM lists on ASX; Westpac 60% shareholder
BTIM Income boutique established
Acquisition of UK-based J O Hambro Capital Management
International Small Cap team hired
New York office established
US SMID team hired; Boston office
established
Westpac reduces holding down to 30%
BTIM enters S&P/ASX 100 Index
Westpac reduces holding down to 10%
Global equities team hired
US multi asset team hired

6 6 6 6
The impact of the GFC
FY08 FY11 % growth
Cash NPAT $40.0m $30.5m2 -24%
Cash EPS 25.0cps 18.7cps -25%
Dividends 8.9cps 16.0cps +80%
FUM $41.9bn1 $32.7bn -22%
Employees 1371 127 -7%
2008 - 2011
1. As at 30 Sep 2007 2. Normalised for JOHCM acquisition costs
7 7 7 7
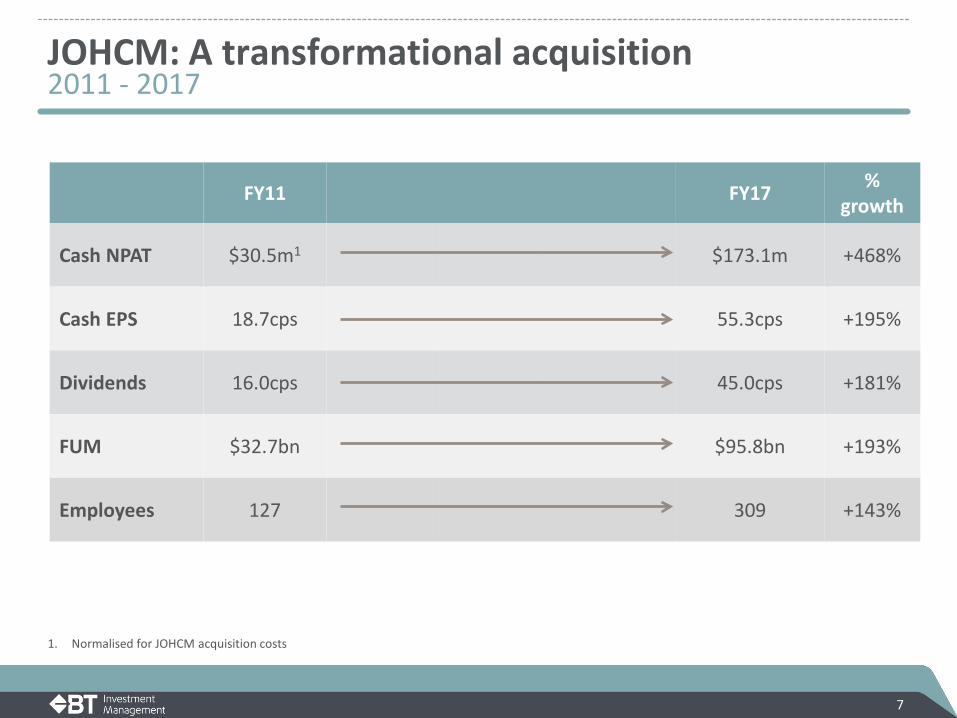
JOHCM: A transformational acquisition
FY11 FY17 % growth
Cash NPAT $30.5m1 $173.1m +468%
Cash EPS 18.7cps 55.3cps +195%
Dividends 16.0cps 45.0cps +181%
FUM $32.7bn $95.8bn +193%
Employees 127 309 +143%
2011 - 2017
1. Normalised for JOHCM acquisition costs
8 8 8 8
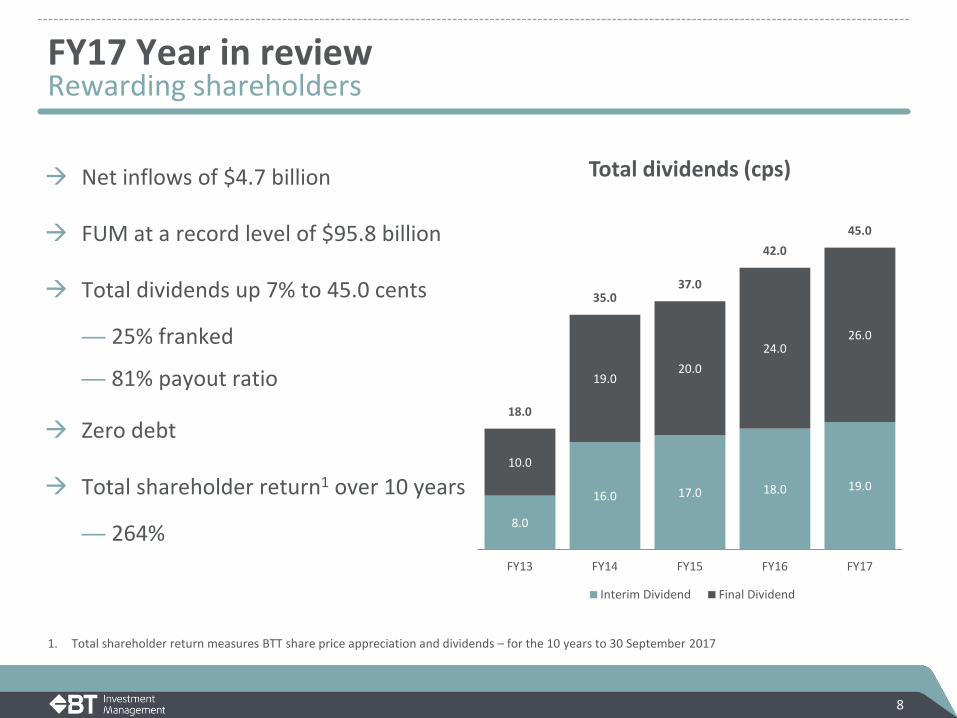
FY17 Year in review Rewarding shareholders
1. Total shareholder return measures BTT share price appreciation and dividends – for the 10 years to 30 September 2017
Net inflows of $4.7 billion
FUM at a record level of $95.8 billion
Total dividends up 7% to 45.0 cents
— 25% franked
— 81% payout ratio
Zero debt
Total shareholder return1 over 10 years
— 264%
Total dividends (cps)
8.0
16.0 17.0 18.0 19.0
10.0
19.0 20.0
24.0 26.0
18.0
35.0 37.0
42.0 45.0
FY13 FY14 FY15 FY16 FY17
Interim Dividend Final Dividend
9 9 9 9
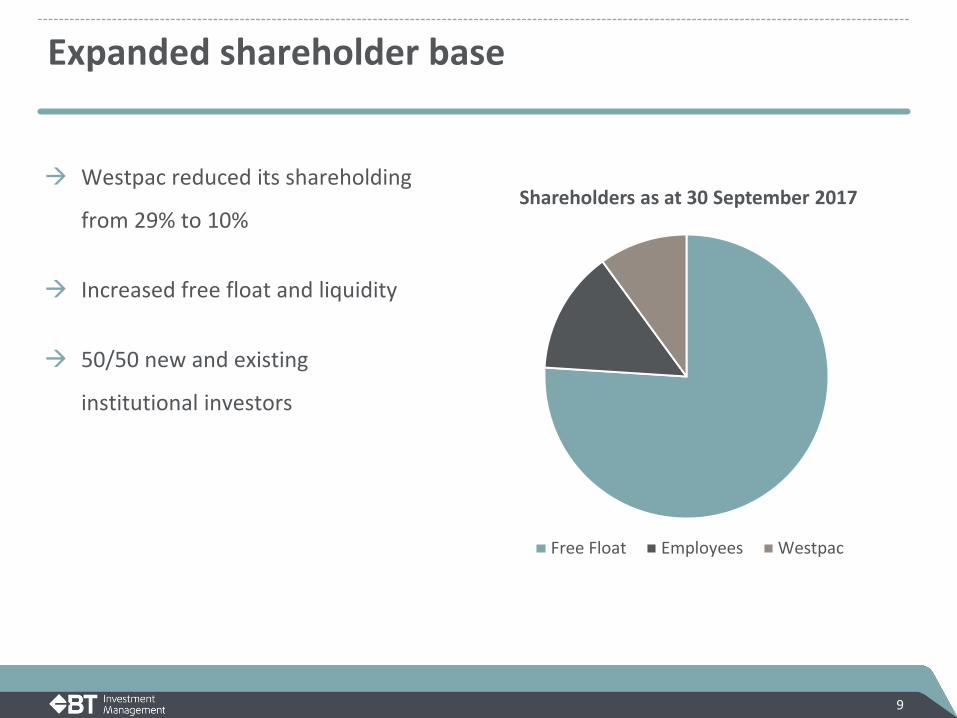
Expanded shareholder base
Westpac reduced its shareholding
from 29% to 10%
Increased free float and liquidity
50/50 new and existing
institutional investors
Shareholders as at 30 September 2017
Free Float Employees Westpac

10 10 10 10
Investing in people Attracting and retaining superior investment talent

11 11 11 11
Corporate governance Managing the risks of being a truly global business
Committees Subsidiary boards
Global Executive Committee
BTIM Board of Directors
Local leadership and global focus
Investment teams and support structure
Asset management
BT Investment Management
Clients
Shareholders
Supervision and oversight
12 12 12 12
Remarkable ten year track record of investment outperformance and shareholder returns
We will continue executing our strategy by:
— Investing in talented people
— Expanding our investment capabilities
— Pursuing growth through diversification
Outlook
13 13 13 13
Emilio Gonzalez
Group Chief Executive Officer’s Address
14 14 14 14
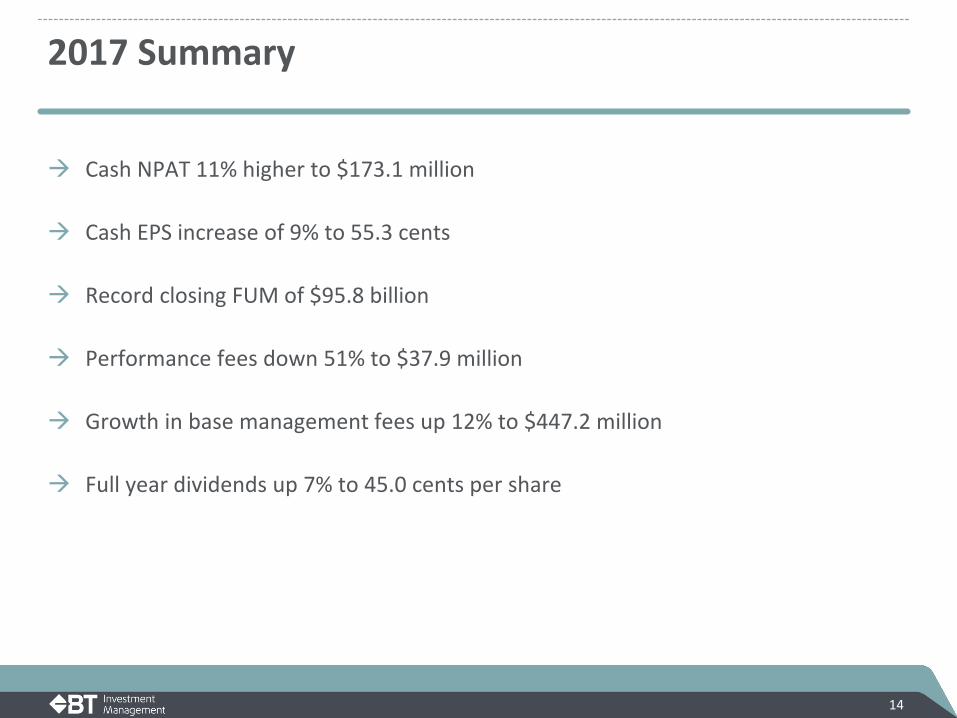
2017 Summary
Cash NPAT 11% higher to $173.1 million
Cash EPS increase of 9% to 55.3 cents
Record closing FUM of $95.8 billion
Performance fees down 51% to $37.9 million
Growth in base management fees up 12% to $447.2 million
Full year dividends up 7% to 45.0 cents per share

15 15 15 15
Markets & currencies Macroeconomic drivers
-3%
-15%
-4% -3%
USD GBP EUR JPY
Major currencies v AUD Average levels FY17 v FY16
Global markets in local currency terms 13% higher on average
AUD stronger against other major currencies
+13% +14%
+15%
+8%
+11%
+9%
MSCI ACWI(local
currency)
S&P500 FTSE 100 MSCI ACEurope(local
currency)
Nikkei 225 ASX300
World markets Average levels FY17 v FY16

16 16 16 16
Strategies: – Good flows in Global/International +$4.2b – European net inflows +$1.4b – Cash and fixed income +$0.9b
Channels:
– Strong support from institutional channel +$2.2b
– Positive net inflows across key higher margin wholesale channel:
– US Pooled +$2.6b – OEICs +$0.7b
$4.7b net inflows; FUM growth of $11.8 billion Strong net inflows

17 17 17 17
82% of FUM has outperformed1 over 3 years and 95% over 5 years
Key funds exceeding benchmarks:
– JOHCM UK Dynamic Fund +9.7% – JOHCM UK Equity Income Fund +9.5% – BT Wholesale Focus Australian Share
Fund +8.1% – BT Wholesale MicroCap
Opportunities Fund +7.2% – BT Wholesale Ethical Share Fund
+5.6% – BT Wholesale Australian Long Short
Fund +5.2% Softer performance over last 12 months,
particularly from funds with defensive characteristics
Asset Classes FUM
30 Sep 17 ($b)
% FUM outperformed1
3 Year
% FUM outperformed1
5 Year Equities
Australian 14.8 84% 90%
Global/International 24.9 68% 97%
UK 11.8 94% 100%
European 10.4 100% 100%
Emerging Markets 4.0 100% 100%
Asian 3.5 56% 48%
Property 1.8 74% 74%
Cash 8.5 100% 100%
Fixed Income 7.5 53% 85%
Multi asset 7.2 74% 100%
Other 1.4 100% 100%
Total FUM 95.8 82% 95%
1. Fund performance is pre-fee, pre-tax and relative to the fund benchmark; % of FUM outperforming relates to FUM with sufficient track record only
Generating strong long-term outperformance Investment performance
18 18 18 18
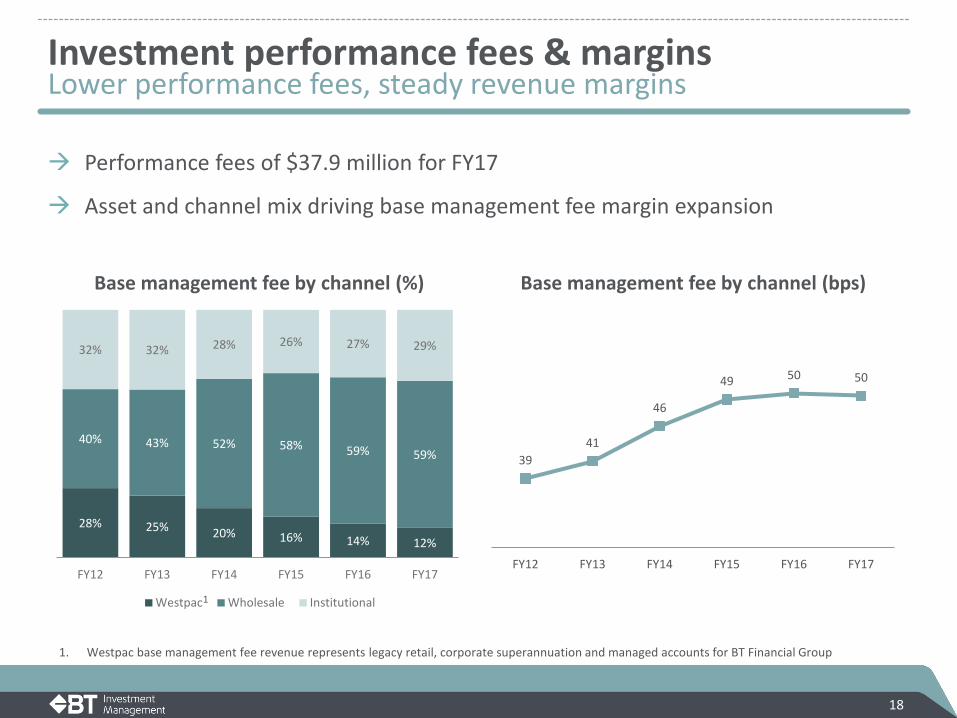
Investment performance fees & margins Lower performance fees, steady revenue margins
Base management fee by channel (%) Base management fee by channel (bps)
Performance fees of $37.9 million for FY17
Asset and channel mix driving base management fee margin expansion
39 41
46
49 50 50
FY12 FY13 FY14 FY15 FY16 FY17
28% 25% 20% 16% 14% 12%
40% 43% 52% 58% 59% 59%
32% 32% 28% 26% 27% 29%
FY12 FY13 FY14 FY15 FY16 FY17
Westpac Wholesale Institutional
1. Westpac base management fee revenue represents legacy retail, corporate superannuation and managed accounts for BT Financial Group
1
19 19 19 19
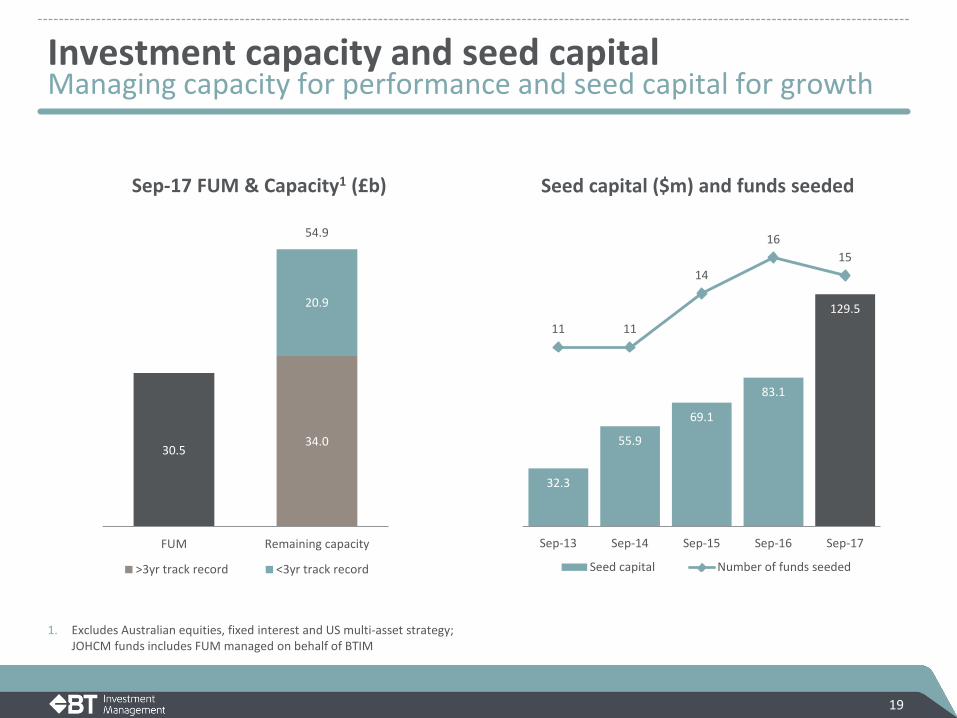
Investment capacity and seed capital Managing capacity for performance and seed capital for growth
1. Excludes Australian equities, fixed interest and US multi-asset strategy; JOHCM funds includes FUM managed on behalf of BTIM
32.3
55.9
69.1
83.1
129.5 11 11
14
16 15
0
2
4
6
8
10
12
14
16
18
(10)
10
30
50
70
90
110
130
150
170
Sep-13 Sep-14 Sep-15 Sep-16 Sep-17
Seed capital ($m) and funds seeded
Seed capital Number of funds seeded
Sep-17 FUM & Capacity1 (£b)
30.5 34.0
20.9
54.9
FUM Remaining capacity
>3yr track record <3yr track record
20 20 20 20
Talent and new products
Addition of multi-asset capabilities in the US
Addition of multi-asset capabilities in Australia
Launch of Global Income strategy in the US (2017)
Launch of CPI-Plus investment strategy in Australia (2018)

21 21 21 21
Responding to growing regulatory focus
MiFID II: Centrepiece of European securities market legislation covering product governance, transaction reporting, unbundling of research, best execution amongst others
UCITS V Directive: Strengthen the UCITS regime covering remuneration, sanctions and depositary regulation AIFMD: Regulation of all investment vehicles that are not UCITS in order to harmonise EU
framework and increase investor protection
Senior Managers Certification Regime:
FCA Asset Management Market Study:
Strengthen market integrity by making individuals more accountable for their conduct and competence
Regulatory review on competition in the asset management sector and value for money for investors
Industry Thematic Reviews:
Ongoing thematic reviews conducted by regulator. Following a thematic visit JOHCM is the subject of an investigation from its UK regulator relating to eligibility of certain services approximating £5.0m ($8.6m) paid out of dealing commissions between 2006 and 2016. It is possible that the eligibility of other services may also be assessed. The likely outcome or consequence of this matter (including any sanctions or penalties) is unable to be reliably estimated at this time.
RG97: Enhanced fee disclosure in particular indirect fees and costs RG259: Obligation to maintain adequate risk management systems for REs Levy to be based on company’s activities to recoup costs of regulation ASIC Industry Funding Model:

22 22 22 22
Continue to identify new investment capabilities
Develop and launching new investment strategies
Remain disciplined in capacity management
Build out our business in the US
Utilise distribution channels to drive sales
Manage key relationships to retain FUM and foster growth
Strategy Building out a global asset management business

23 23 23 23
To receive and consider the following reports for the financial year ended 30 September 2017:
— Financial Report
— Directors’ Report
— Auditor’s Report
Financial reports Resolution

24 24 24 24
Re-election of Directors Resolution 2(a) – Re-election of James Evans
James Evans
25 25 25 25
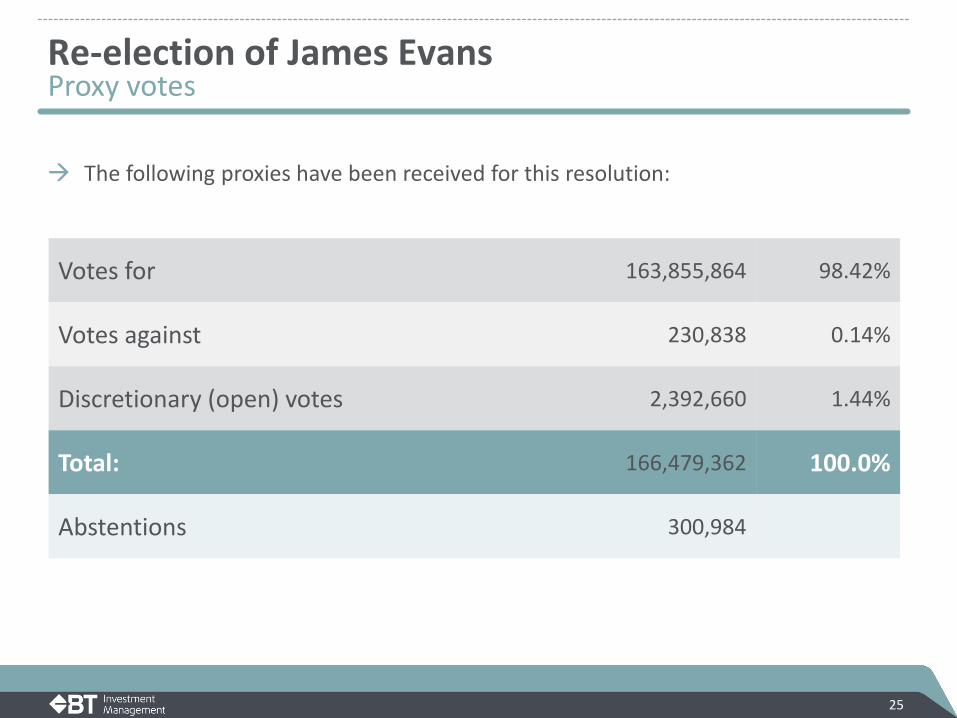
The following proxies have been received for this resolution: Votes for 163,855,864 98.42%
Votes against 230,838 0.14%
Discretionary (open) votes 2,392,660 1.44%
Total: 166,479,362 100.0%
Abstentions 300,984
Proxy votes Re-election of James Evans

26 26 26 26
Re-election of Directors Resolution 2(b) – Re-election of Deborah Page AM
Deborah Page AM
27 27 27 27
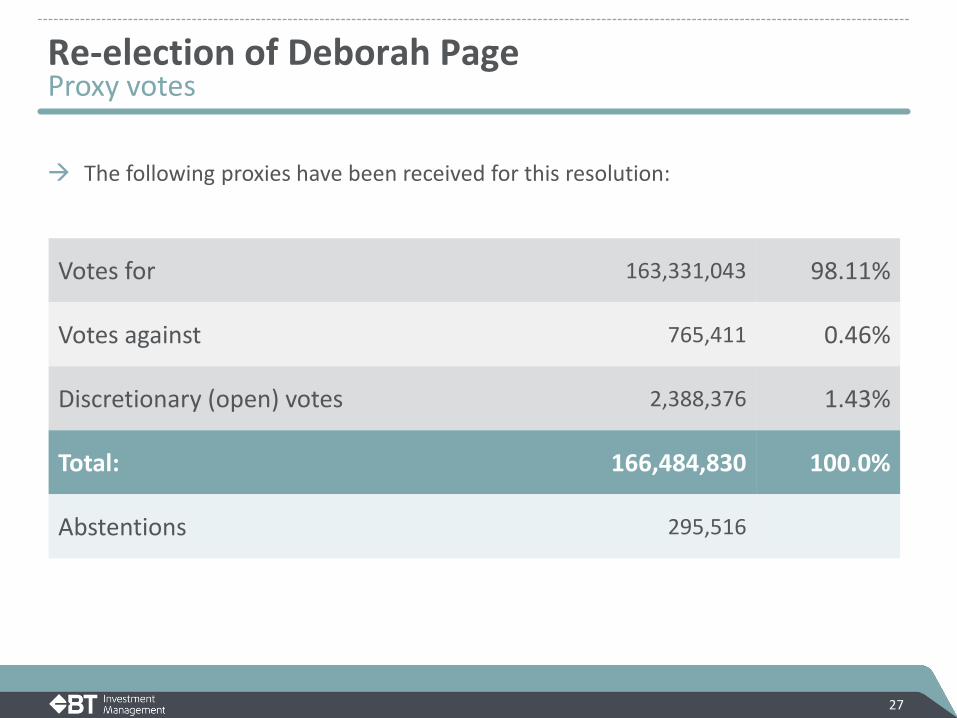
The following proxies have been received for this resolution:
Proxy votes Re-election of Deborah Page
Votes for 163,331,043 98.11%
Votes against 765,411 0.46%
Discretionary (open) votes 2,388,376 1.43%
Total: 166,484,830 100.0%
Abstentions 295,516

28 28 28 28
To consider and, if thought fit, to pass the following ordinary resolution: To adopt the Company’s Remuneration Report for the year ended 30 September 2017.
Adoption of the Remuneration Report Resolution

29 29 29 29
Proxy votes Adoption of the Remuneration Report
The following proxies have been received for this resolution: Votes for 161,659,701 97.37%
Votes against 2,013,843 1.21%
Discretionary (open) votes 2,362,985 1.42%
Total: 166,036,529 100.0%
Abstentions 724,231

30 30 30 30
To consider and, if thought fit, to pass the following ordinary resolution: That the Company approves the grant of Performance Share Rights (and acquisition of ordinary shares on exercise of the vested Performance Share Rights to Mr Emilio Gonzalez under the terms of the Performance Reward Scheme) on the terms described in the Explanatory Notes to this Notice of Meeting.
Approval of 2017 LTI Grant of Performance Share Rights Resolution
31 31 31 31
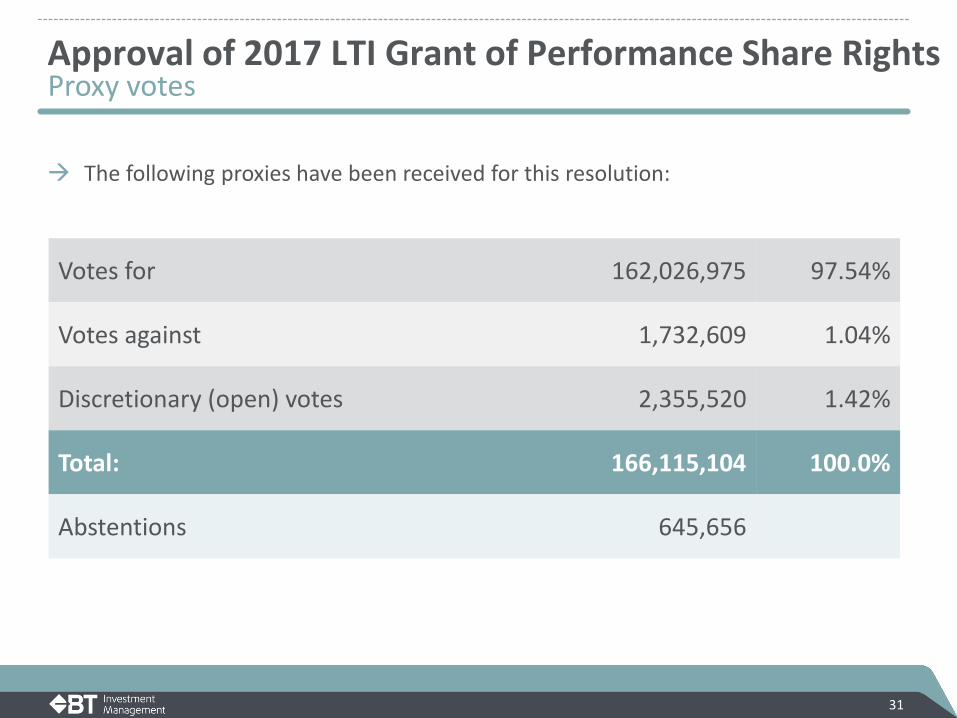
Proxy votes Approval of 2017 LTI Grant of Performance Share Rights
The following proxies have been received for this resolution: Votes for 162,026,975 97.54%
Votes against 1,732,609 1.04%
Discretionary (open) votes 2,355,520 1.42%
Total: 166,115,104 100.0%
Abstentions 645,656
32 32 32 32
Disclaimer
This presentation has been prepared by BT Investment Management Limited (BTIM).
While the information in this presentation has been prepared in good faith and with reasonable care, no representation or warranty, express or implied, is made as to the accuracy, adequacy or reliability of any statements, estimates, opinions or other information contained in the presentation.
This presentation contains forward looking statements. These forward looking statements have been made based upon BTIM’s expectations and beliefs concerning future developments and their potential effect upon BTIM and are subject to risks and uncertainty which are, in many instances, beyond BTIM’s control. No assurance is given that future developments will be in accordance with BTIM’s expectations. Actual results could differ materially from those expected by BTIM.
The information contained in this presentation is not intended to be relied upon as advice to investors or potential investors, who should consider seeking independent professional advice depending upon their specific investment objectives, financial situation or particular needs.
In this presentation, unless otherwise stated or the context otherwise requires, references to 'dollar amounts', '$', 'AUD' or 'A$' are to Australian dollars.