2017 annual general meeting - computershare.com · 2 reconciliation of statutory to management...
TRANSCRIPT
2017 ANNUAL
GENERAL MEETING
Delivering sustained earnings growth
14 November 2017

2017 ANNUAL
GENERAL MEETING
Chairman’s address
Simon Jones
14 November 2017
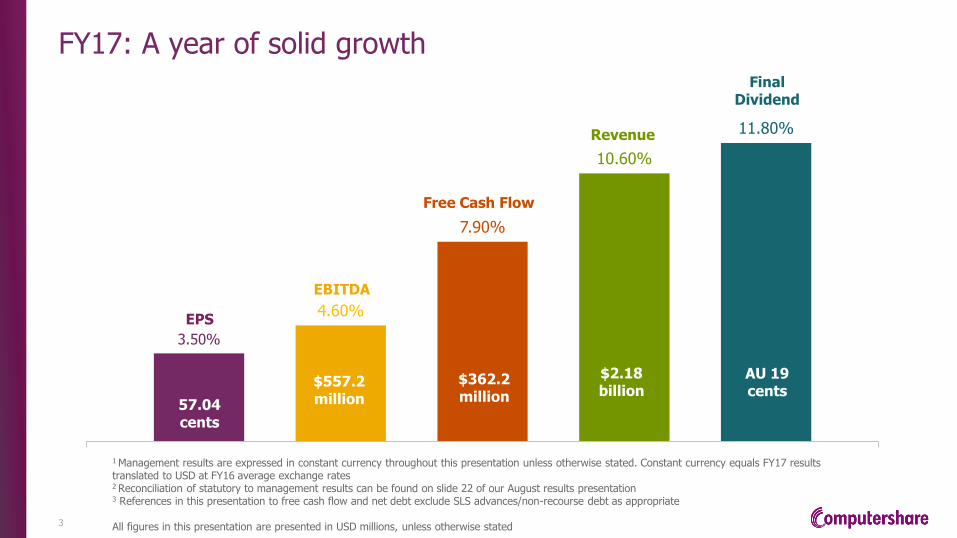
FY17: A year of solid growth
3
3.50%
4.60%
7.90%
10.60%
11.80%
$557.2million
$362.2 million
$2.18 billion
AU 19 cents
57.04 cents
EPS
EBITDA
Free Cash Flow
Revenue
Final Dividend
1 Management results are expressed in constant currency throughout this presentation unless otherwise stated. Constant currency equals FY17 results translated to USD at FY16 average exchange rates 2 Reconciliation of statutory to management results can be found on slide 22 of our August results presentation 3 References in this presentation to free cash flow and net debt exclude SLS advances/non-recourse debt as appropriate All figures in this presentation are presented in USD millions, unless otherwise stated

Key operational statistics
4
As at 30 June 2017 *includes Indian JV
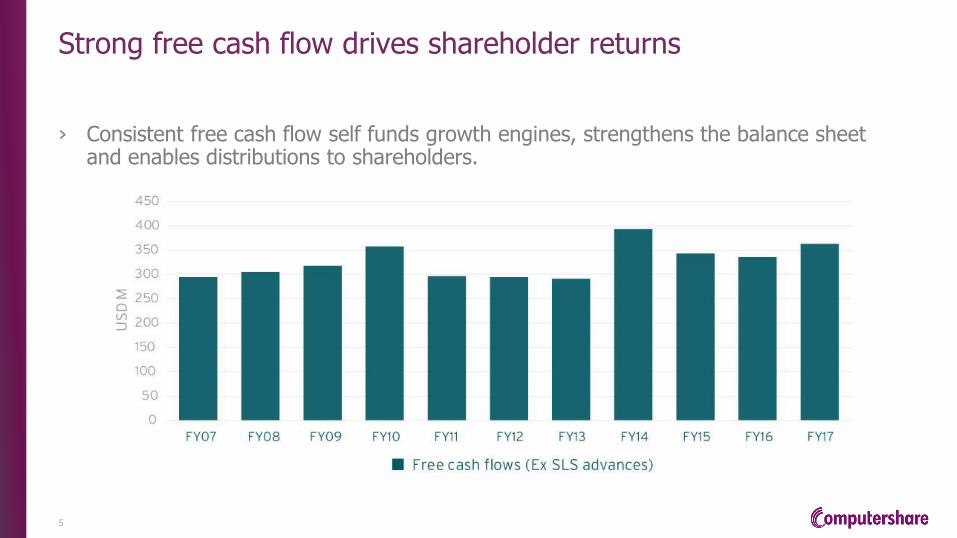
Strong free cash flow drives shareholder returns
5
› Consistent free cash flow self funds growth engines, strengthens the balance sheet and enables distributions to shareholders.

Consistent dividend track record
Full year dividend increased by 11.8% in FY17
6

Delivering strong returns for shareholders
CPU share price
7

Corporate responsibility
8

2017 ANNUAL
GENERAL MEETING
CEO’s address
Stuart Irving
14 November 2017
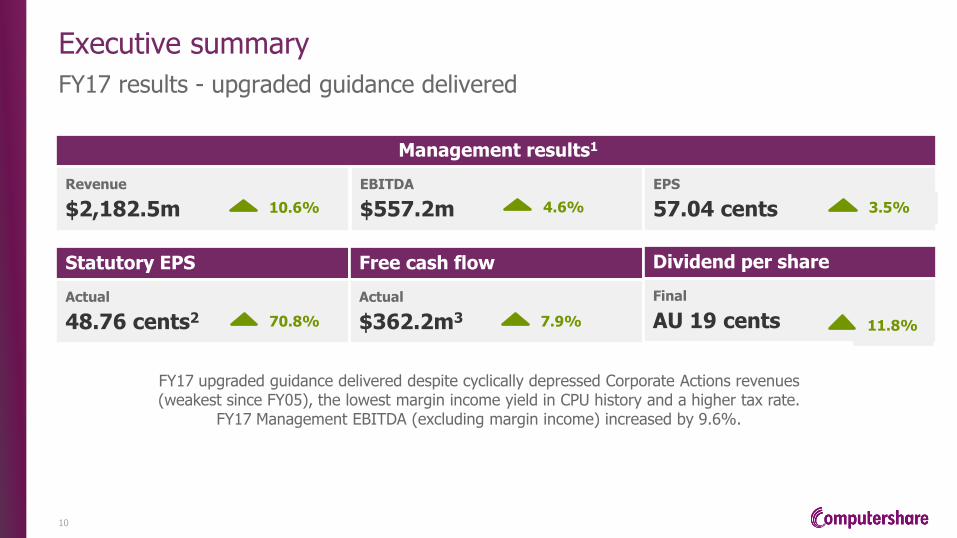
Executive summary
FY17 results - upgraded guidance delivered
10
FY17 upgraded guidance delivered despite cyclically depressed Corporate Actions revenues (weakest since FY05), the lowest margin income yield in CPU history and a higher tax rate.
FY17 Management EBITDA (excluding margin income) increased by 9.6%.
Statutory EPS
Actual
48.76 cents2
Free cash flow
Actual
$362.2m3
Dividend per share
Final
AU 19 cents
Management results1
Revenue
$2,182.5m 10.6%
EBITDA
$557.2m
EPS
57.04 cents 4.6% 3.5%
70.8% 7.9% 11.8%

Strategies driving performance and earnings potential
11

US
› Execution of growth strategy on track
› Strengthening relationships with government agencies creating new sizeable revenue opportunities
› Structural market change positive for CPU with industry leading service quality driving new revenue opportunities
› Benefits at scale reaffirmed: $100bn UPB = 20% PBT margins and 12-14% post tax free cash flow return on
average invested capital
UK
› Strong UKAR revenue contribution with dilution to group EBITDA margins as expected
› Integration of UK mortgage services ahead of schedule targeting a single platform in FY19
› All servicing contracts retained with new asset owners
› A number of new contract wins from “challenger banks” – servicing volumes to grow with new originations
› Increase in regulatory costs driving outsourcing considerations for in-house bank servicers
12
Growth: Mortgage services performing to plan
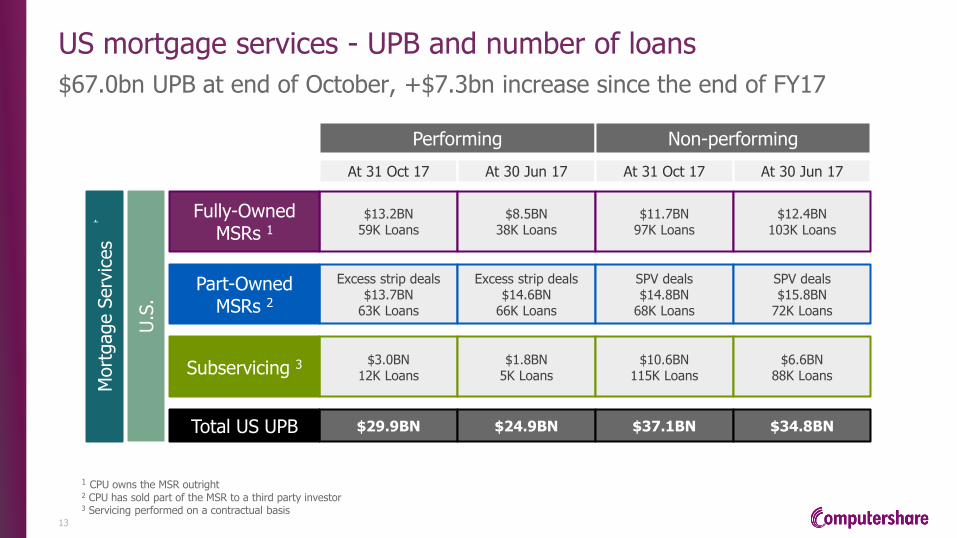
US mortgage services - UPB and number of loans
$67.0bn UPB at end of October, +$7.3bn increase since the end of FY17
13
1 CPU owns the MSR outright 2 CPU has sold part of the MSR to a third party investor 3 Servicing performed on a contractual basis
Performing Non-performing
At 31 Oct 17 At 30 Jun 17 At 31 Oct 17 At 30 Jun 17
U.S
.
$13.2BN 59K Loans
$8.5BN 38K Loans
$11.7BN 97K Loans
$12.4BN 103K Loans
Fully-Owned MSRs 1
Excess strip deals $13.7BN
63K Loans
Excess strip deals $14.6BN
66K Loans
SPV deals $14.8BN
68K Loans
SPV deals $15.8BN
72K Loans
Part-Owned MSRs 2
$3.0BN
12K Loans
$1.8BN 5K Loans
$10.6BN 115K Loans
$6.6BN 88K Loans Subservicing 3
$29.9BN $24.9BN $37.1BN $34.8BN Total US UPB
Mort
gage S
erv
ices

Growth: Employee share plans performing well
14
› Strong recovery in transactional volumes driven by improved equity market strength and currency volatility
› Reduced margin income impacted by cut in UK interest rates and lower sharesave balances
› Investment in customer facing technologies and product refreshes improving competitive position
› Structural growth drivers intact with c. $125bn of assets under administration, over half ‘in the money’
› Asian share plans market developing strongly. CPU has leading position with unrivalled plan design and management expertise
- Significant new client wins following CPU recent entry into A share market e.g. HP3 and LeTV
- Entered Singapore market with strategic new client wins, Olam and Sea Ltd
- Designed and launched Lenovo’s Global ESPP (35 Jurisdictions, over 25,000 eligible participants). Strong participation
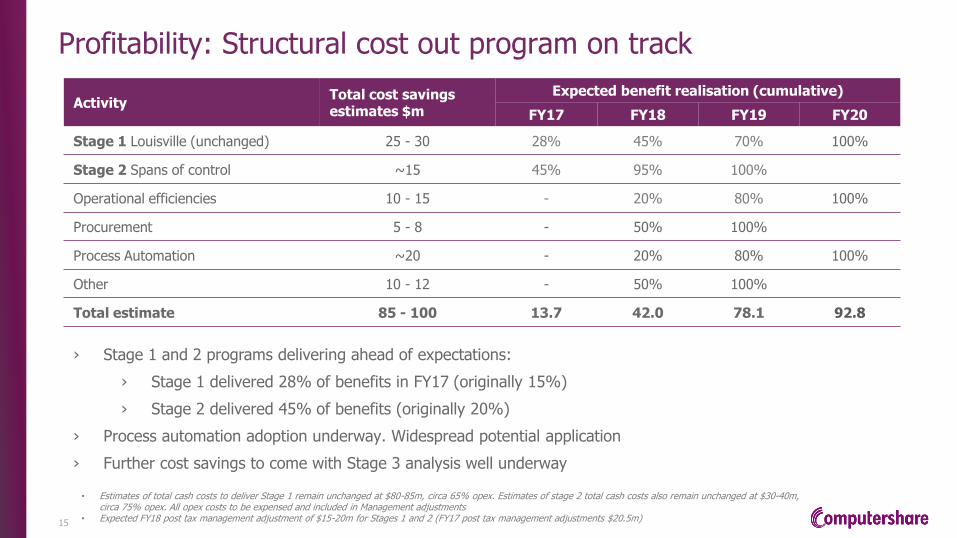
Profitability: Structural cost out program on track
15
› Stage 1 and 2 programs delivering ahead of expectations:
› Stage 1 delivered 28% of benefits in FY17 (originally 15%)
› Stage 2 delivered 45% of benefits (originally 20%)
› Process automation adoption underway. Widespread potential application
› Further cost savings to come with Stage 3 analysis well underway
Activity Total cost savings estimates $m
Expected benefit realisation (cumulative)
FY17 FY18 FY19 FY20
Stage 1 Louisville (unchanged) 25 - 30 28% 45% 70% 100%
Stage 2 Spans of control ~15 45% 95% 100%
Operational efficiencies 10 - 15 - 20% 80% 100%
Procurement 5 - 8 - 50% 100%
Process Automation ~20 - 20% 80% 100%
Other 10 - 12 - 50% 100%
Total estimate 85 - 100 13.7 42.0 78.1 92.8
• Estimates of total cash costs to deliver Stage 1 remain unchanged at $80-85m, circa 65% opex. Estimates of stage 2 total cash costs also remain unchanged at $30-40m, circa 75% opex. All opex costs to be expensed and included in Management adjustments
• Expected FY18 post tax management adjustment of $15-20m for Stages 1 and 2 (FY17 post tax management adjustments $20.5m)
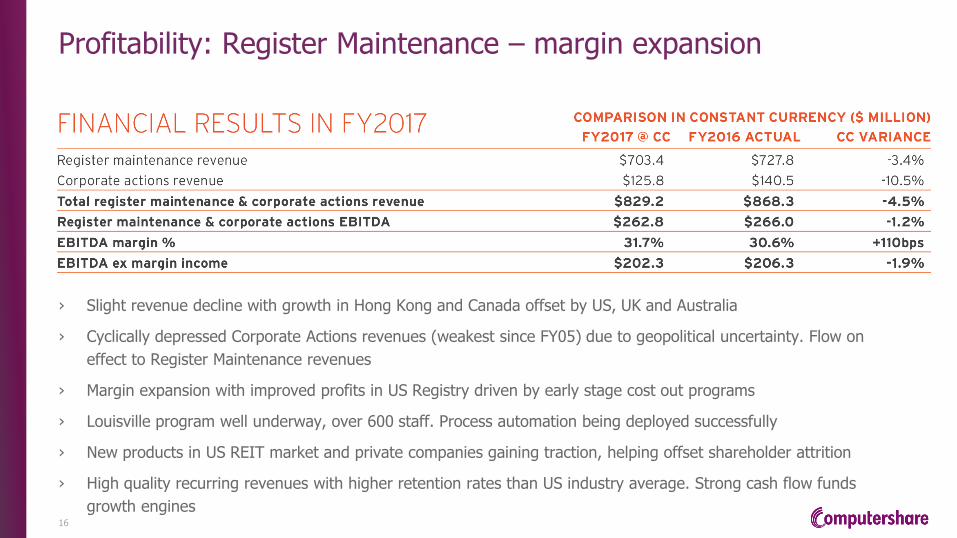
Profitability: Register Maintenance – margin expansion
16
› Slight revenue decline with growth in Hong Kong and Canada offset by US, UK and Australia
› Cyclically depressed Corporate Actions revenues (weakest since FY05) due to geopolitical uncertainty. Flow on
effect to Register Maintenance revenues
› Margin expansion with improved profits in US Registry driven by early stage cost out programs
› Louisville program well underway, over 600 staff. Process automation being deployed successfully
› New products in US REIT market and private companies gaining traction, helping offset shareholder attrition
› High quality recurring revenues with higher retention rates than US industry average. Strong cash flow funds
growth engines

Client balances and margin income
17
Avera
ge C
lient
Bala
nce
s f
or
period U
SD
bill
ion
Lowest yield in CPU history – turned positive in 2H17
Note: Margin income and balances translated at actual average FX rates for the period
14.4 14.0
15.1 15.2 15.0
16.3 16.6 16.8
105.8
86.8 89.4 86.4
79.0 74.3
66.6 69.6
0.0
2.0
4.0
6.0
8.0
10.0
12.0
14.0
16.0
18.0
1H14 2H14 1H15 2H15 1H16 2H16 1H17 2H17
Average balances Margin Income (USD m)
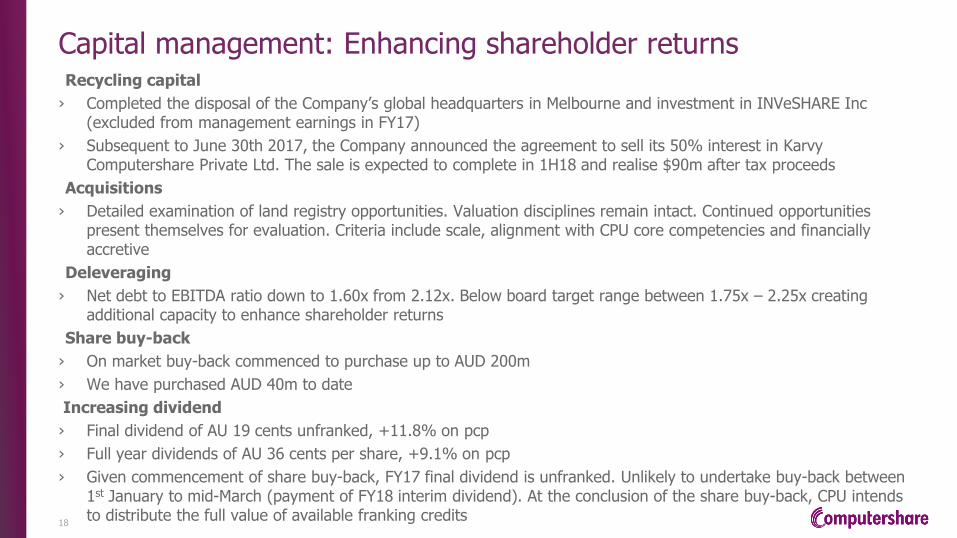
Capital management: Enhancing shareholder returns
18
Recycling capital
› Completed the disposal of the Company’s global headquarters in Melbourne and investment in INVeSHARE Inc (excluded from management earnings in FY17)
› Subsequent to June 30th 2017, the Company announced the agreement to sell its 50% interest in Karvy Computershare Private Ltd. The sale is expected to complete in 1H18 and realise $90m after tax proceeds
Acquisitions
› Detailed examination of land registry opportunities. Valuation disciplines remain intact. Continued opportunities present themselves for evaluation. Criteria include scale, alignment with CPU core competencies and financially accretive
Deleveraging
› Net debt to EBITDA ratio down to 1.60x from 2.12x. Below board target range between 1.75x – 2.25x creating additional capacity to enhance shareholder returns
Share buy-back
› On market buy-back commenced to purchase up to AUD 200m
› We have purchased AUD 40m to date
Increasing dividend
› Final dividend of AU 19 cents unfranked, +11.8% on pcp
› Full year dividends of AU 36 cents per share, +9.1% on pcp
› Given commencement of share buy-back, FY17 final dividend is unfranked. Unlikely to undertake buy-back between 1st January to mid-March (payment of FY18 interim dividend). At the conclusion of the share buy-back, CPU intends to distribute the full value of available franking credits

FY18 outlook - upgrade
19
Guidance
› In constant currency, Computershare expects FY18 Management EPS to increase by around +10% on FY17 (previously +7.5%)
Assumptions
› This outlook continues to assume that equity markets remain at current levels, interest rate markets remain in line with current market expectations and that there is a modest improvement in Corporate Actions revenue compared to FY17. The outlook also assumes no impact from potential US tax law changes
› Consistent with FY17 guidance approach, this guidance assumes that FY17 average exchange rates are used to translate the FY18 earnings to USD
› For comparative purposes, the base FY17 Management EPS is 54.41 cents

Conclusions
20
› Delivered on FY17 upgraded guidance despite cyclically depressed Corporate Actions revenues
› Clear, deliberate strategies in place to grow Computershare, improve profitability and enhance shareholder returns with capital management
› Entering period of sustained performance with significant earnings potential and capability to drive shareholder returns
› Growth: Mortgage services progressing to plan, Share Plans performing well
› Profitability: Cost out program on track with further benefits to come
› $10.3b of exposed client balances - significant leverage to rising interest rates
› Capital management: Strong free cash flow self funds growth and shareholder returns
› In constant currency, Computershare now expects FY18 Management EPS to increase by around +10% on FY17; upgrade from 7.5% expected in August 2017
› Transformation to a simpler, more transparent, disciplined and profitable CPU continues
Important notice
21
Forward-looking statements
› This announcement may include 'forward-looking statements'. Such statements can generally be identified by the use of words such as 'may', 'will', 'expect', 'intend', 'plan', 'estimate', 'anticipate', 'believe', 'continue', 'objectives', 'outlook', 'guidance' and similar expressions. Indications of plans, strategies, management objectives, sales and financial performance are also forward-looking statements.
› Such statements are not guarantees of future performance, and involve known and unknown risks, uncertainties and other factors, many of which are outside the control of Computershare. Actual results, performance or achievements may vary materially from any forward-looking statements. Readers are cautioned not to place undue reliance on forward-looking statements, which are current only as at the date of this announcement.