2017 annual report · 2 annual report internships non-credit internships are popular amongst u-m...
TRANSCRIPT

ANNUALR e P O R T
E n g i n e e r i n g C a r e e r R e s o u r c e C e n t e r
D a t a f r o m 2 0 1 5 - 2 0 1 6
20
16
20
17

Annual Report 1
Co-op2015-16
Cooperative educationThe optional non-credit Cooperative Education (Co-op) Program
enables students to alternate school and work terms and apply
their skills to the work setting. In addition to providing a source
of valuable talent, co-op students offer employers an opportunity
to identify qualified candidates prior to graduation. Ideally, co-op
is eight-months of hands-on engineering experience, occurring
either May through December or January through August.
Total
218
† Majors with less than 4 submissions were omitted. †† Data from students who registered for ENGR 400, but did not provide salary information was omitted.
Program† Hires†† Median Monthly Salary Average Monthly Salary
Aerospace Engineering 7 $3,770 $4,027
Biomedical Engineering 7 $3,640 $3,553
Chemical Engineering 22 $3,944 $4,114
Computer Engineering 13 $6,500 $5,467
Computer Science 61 $6,500 $5,592
Electrical Engineering 8 $4,074 $4,426
Industrial & Operations Engineering 35 $3,900 $4,280
Mechanical Engineering 43 $3,466 $3,708
Registered Co-op Students
AdamMS Material Science ‘16
The ECRC helped in every step
of the career search process.
It helped me define the types
of jobs I would enjoy as well as
the top industries I would like to
work in. Further, advice from the
ECRC helped me move beyond
a polished resume and elevator
pitch, to where I was actually
developing a professional identity
and sense of confidence that was
truly desirable to employers.

2 Annual Report
InternshipsNon-credit internships are popular amongst U-M engineering
and computer science students. Students have the opportunity
to gain valuable work experience in an engineering environment.
The assignments typically occur May through August and may
be in locations all over the world. Many students at the College
participate in internships. The internships in this publication
only include those that were reported to the eCRC.
Interns2015-16
NicoleSparrow Health System
Sparrow Health has hired
a number of Michigan
Engineering students as
analysts and interns working
to help our clinicians and
other caregivers leverage
technology to provide
excellent patient care.
* Data only reflects internships reported to the ECRC.
Guide for Recruiters 3
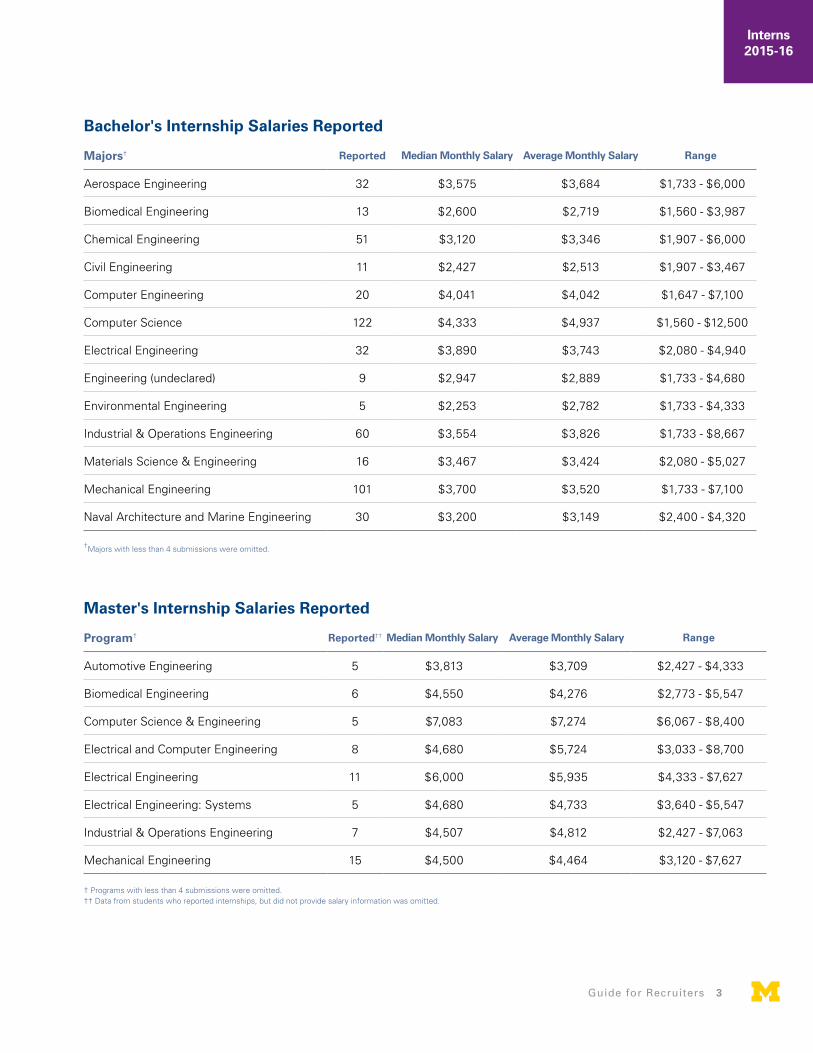
Bachelor's Internship Salaries Reported
Majors† Reported Median Monthly Salary Average Monthly Salary Range
Aerospace Engineering 32 $3,575 $3,684 $1,733 - $6,000
Biomedical Engineering 13 $2,600 $2,719 $1,560 - $3,987
Chemical Engineering 51 $3,120 $3,346 $1,907 - $6,000
Civil Engineering 11 $2,427 $2,513 $1,907 - $3,467
Computer Engineering 20 $4,041 $4,042 $1,647 - $7,100
Computer Science 122 $4,333 $4,937 $1,560 - $12,500
Electrical Engineering 32 $3,890 $3,743 $2,080 - $4,940
Engineering (undeclared) 9 $2,947 $2,889 $1,733 - $4,680
Environmental Engineering 5 $2,253 $2,782 $1,733 - $4,333
Industrial & Operations Engineering 60 $3,554 $3,826 $1,733 - $8,667
Materials Science & Engineering 16 $3,467 $3,424 $2,080 - $5,027
Mechanical Engineering 101 $3,700 $3,520 $1,733 - $7,100
Naval Architecture and Marine Engineering 30 $3,200 $3,149 $2,400 - $4,320
† Programs with less than 4 submissions were omitted. †† Data from students who reported internships, but did not provide salary information was omitted.
†Majors with less than 4 submissions were omitted.
Master's Internship Salaries Reported
Program† Reported†† Median Monthly Salary Average Monthly Salary Range
Automotive Engineering 5 $3,813 $3,709 $2,427 - $4,333
Biomedical Engineering 6 $4,550 $4,276 $2,773 - $5,547
Computer Science & Engineering 5 $7,083 $7,274 $6,067 - $8,400
Electrical and Computer Engineering 8 $4,680 $5,724 $3,033 - $8,700
Electrical Engineering 11 $6,000 $5,935 $4,333 - $7,627
Electrical Engineering: Systems 5 $4,680 $4,733 $3,640 - $5,547
Industrial & Operations Engineering 7 $4,507 $4,812 $2,427 - $7,063
Mechanical Engineering 15 $4,500 $4,464 $3,120 - $7,627
Interns2015-16

4 Annual Report
Bachelor's GraduatesDemographics Degrees Conferred Fall 2016 Enrollment
Total 1,751 6,556
Women 26% 27%
Underrepresented Minorities* 8% 10%
International Students 15% 11%
Note: Data compiled from students who graduated August 2015 to June 2016.* Includes Black, Hispanic and Native American. % based on ethnicity of domestic Engineering students. Does not include LSA Computer Science.
Demographics by Program Degrees Conferred Fall 2016 Enrollment
Aerospace Engineering 112 314
Biomedical Engineering 78 256
Chemical Engineering 174 412
Climate and Meteorology 0 5
Civil Engineering 46 133
Computer Engineering 81 257
Computer Science 317 921
Computer Science - LSA* 168 325
Data Science 1 24
Earth Systems Science & Engineering 8 11
Electrical Engineering 104 312
Engineering Interdisciplinary 3 0
Engineering Physics 8 26
Engineering Undeclared Major 0 2015
Environmental Engineering 27 70
Industrial & Operations Engineering 202 480
Materials Science & Engineering 56 126
Mechanical Engineering 301 740
Naval Architecture & Marine Engineering 36 58
Nuclear Engineering & Radiological Science 29 67
Space Science and Engineering 0 4
Total 1,751 6,556
Note: Data compiled from students who graduated August 2015 to June 2016.* CS-LSA is administered through the Computer Science and Engineering division, but is only for LSA students.
The average
base salary
for 2015-2016
engineering
bachelor's
graduates
was $75,660.
Bachelor's2015-16
JennyCapital One
Michigan Engineering
students have the
knowledge base
and skill set to be
successful. But
more than skills,
they have the ability
to think – and that's
what is most important
to Capital One.

Annual Report 5
Post-graduation Plans
Accepted full-time job offers 921 66%
Continuing education 378 27%
Seeking employment 54 4%
Other* 32 2%
Total 1,385
Salaries by MajorData reflects total respondents indicating salary Base Salary Information
Respondents* Median Average Range
Aerospace Engineering 24 $67,000 $65,998 $58,000 - $75,000
Biomedical Engineering 6 $63,000 $63,583 $55,000 - $73,000
Chemical Engineering 49 $70,000 $70,410 $40,000 - $97,000
Civil Engineering 12 $59,037 $61,304 $48,880 - $75,000
Computer Engineering 18 $92,500 $87,889 $60,000 - $130,000
Computer Science 110 $95,000 $94,352 $51,389 - $155,000
Electrical Engineering 22 $70,007 $72,142 $62,000 - $97,999
Environmental Engineering 5 $60,000 $66,896 $58,000 - $92,000
Industrial & Operations Engineering 68 $70,000 $67,806 $45,000 - $90,000
Materials Science & Engineering 13 $68,000 $62,685 $30,000 - $79,000
Mechanical Engineering 85 $68,500 $67,512 $43,178 - $98,000
Naval Architecture & Marine Engineering 4 $66,000 $66,250 $58,000 - $75,000
* Categories with less than four data points were omitted.
Salaries by RegionData reflects total knowledge of salary and location Base Salary Information
Respondents % Median Average Range
Mid-Atlantic DC, DE, MD, PA, VA, WV 16 4% $67,500 $67,345 $53,000 - $88,000
Midwest IA, IL, IN, KS, MI, MN, MO, NE, ND, OH, SD, WI 219 54% $69,400 $68,779 $30,000 - $120,000
Northeast CT, MA, ME, NH, NJ, NY, RI, VT 35 9% $73,000 $78,184 $57,000 - $115,000
South AL, FL, GA, KY, LA, MS, NC, SC, TN 13 3% $68,000 $68,692 $53,000 - $88,000
Southwest AZ, CO, NM, OK, TX 31 8% $70,000 $74,037 $55,000 - $100,000
West AK, CA, HI, ID, MT, NV, OR, UT, WA, WY 92 23% $100,000 $95,043 $50,000 - $155,000
*Other includes military, volunteer service, etc.Note: Out of graduating class of 1,751, data on 1,385 students was collected from December 2015 to November 7, 2016. Knowledge rate = 79%.
Bachelor's2015-16
66% Accepted full-time job offers
27% Continuingeducation
4% Seeking employment
2% Other
6 Annual Report
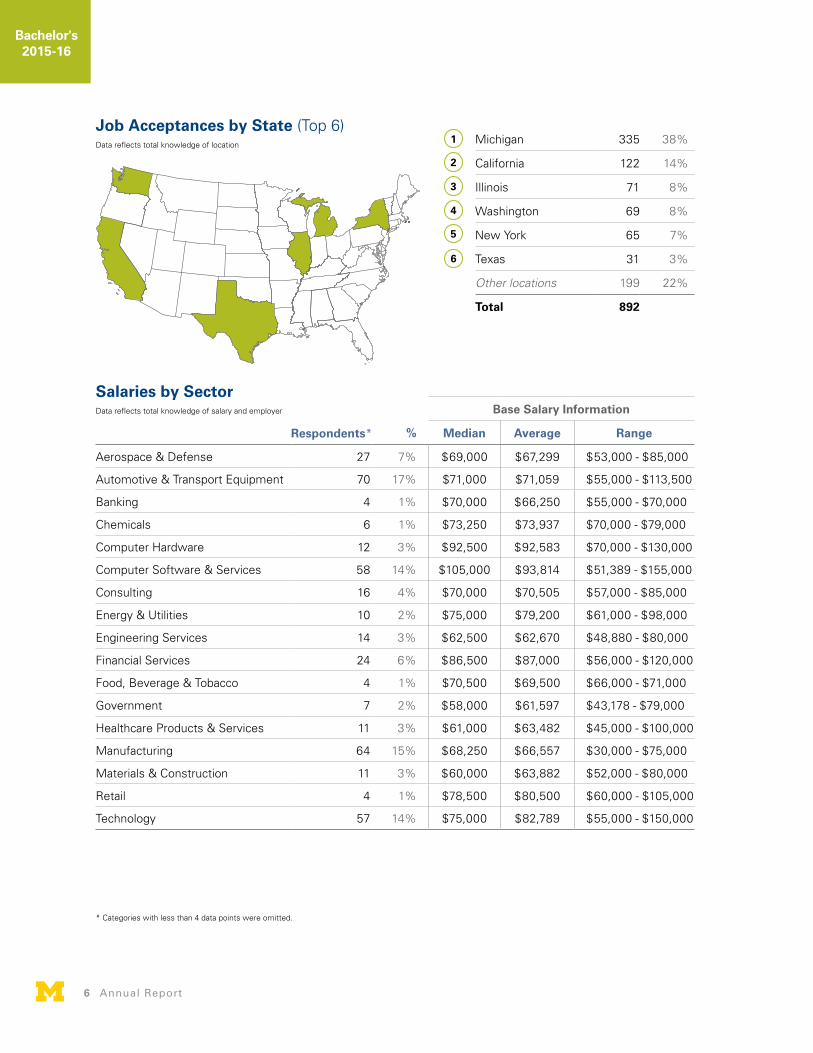
Salaries by SectorData reflects total knowledge of salary and employer Base Salary Information
Respondents* % Median Average Range
Aerospace & Defense 27 7% $69,000 $67,299 $53,000 - $85,000
Automotive & Transport Equipment 70 17% $71,000 $71,059 $55,000 - $113,500
Banking 4 1% $70,000 $66,250 $55,000 - $70,000
Chemicals 6 1% $73,250 $73,937 $70,000 - $79,000
Computer Hardware 12 3% $92,500 $92,583 $70,000 - $130,000
Computer Software & Services 58 14% $105,000 $93,814 $51,389 - $155,000
Consulting 16 4% $70,000 $70,505 $57,000 - $85,000
Energy & Utilities 10 2% $75,000 $79,200 $61,000 - $98,000
Engineering Services 14 3% $62,500 $62,670 $48,880 - $80,000
Financial Services 24 6% $86,500 $87,000 $56,000 - $120,000
Food, Beverage & Tobacco 4 1% $70,500 $69,500 $66,000 - $71,000
Government 7 2% $58,000 $61,597 $43,178 - $79,000
Healthcare Products & Services 11 3% $61,000 $63,482 $45,000 - $100,000
Manufacturing 64 15% $68,250 $66,557 $30,000 - $75,000
Materials & Construction 11 3% $60,000 $63,882 $52,000 - $80,000
Retail 4 1% $78,500 $80,500 $60,000 - $105,000
Technology 57 14% $75,000 $82,789 $55,000 - $150,000
* Categories with less than 4 data points were omitted.
Michigan 335 38%
California 122 14%
Illinois 71 8%
Washington 69 8%
New York 65 7%
Texas 31 3%
Other locations 199 22%
Total 892
1
2
3
4
5
6
Job Acceptances by State (Top 6)Data reflects total knowledge of location
Bachelor's2015-16

Annual Report 7
Master's2015-16
Master's GraduatesDemographics
Degrees Conferred 1,078
Women 21%
Underrepresented Minorities* 11%
International Students 52%
Fall 2016 Enrollment 1,884
Women 24%
Underrepresented Minorities* 11%
International Students 63%
Note: Data compiled from students who graduated August 2015 to June 2016.* Includes Black, Hispanic and Native American. % based on ethnicity of domestic students.
2015 - 2016 Degrees Conferred Fall 2016
enrollmentDemographics by Program
Aerospace Engineering 59 86
Applied Climate 2 7
Atmospheric, Oceanic & Space Sciences 12 8
Automotive Engineering 25 58
Biomedical Engineering 72 106
Chemical Engineering 39 19
Civil Engineering 27 52
Computer Science & Engineering 86 110
Construction Engineering & Management 13 22
Design Science 2 11
Electrical and Computer Engineering 80 331
Electrical Engineering 78 85
Electrical Engineering: Systems 44 68
Energy Systems Engineering 59 73
Engineering Education Research 1 0
Environmental Engineering 13 24
Financial Engineering 2 0
Global Automotive & Manufacturing Engineering 49 172
Industrial & Operations Engineering 90 126
Macromolecular Science & Engineering 6 9
Manufacturing 14 40
Materials Science & Engineering 25 19
Mechanical Engineering 172 256
Naval Architecture & Marine Engineering 44 58
Nuclear Engineering & Radiological Science 28 32
Nuclear Science 1 0
Pharmaceutical Engineering 3 1
Plasma Science & Engineering 1 0
Robotics 4 48
Robotics & Autonomous Vehicles 2 0
Space Engineering 20 29
Structural Engineering 4 7
Systems Engineering & Design 1 11
Unclassified 0 16
Total 1,078 1,884
The average
base salary
for 2015-2016
engineering
master's
graduates
was $82,392.
Note: Data compiled from students who graduated August 2015 to June 2016.

8 Annual Report
Salaries by ProgramData reflects total respondents indicating salary Base Salary Information
Respondents* Median Average Range
Aerospace Engineering 7 $80,000 $81,832 $73,000 - $95,000
Automotive Engineering 18 $75,000 $75,722 $65,000 - $95,000
Biomedical Engineering 9 $68,000 $68,811 $65,000 - $75,000
Chemical Engineering 4 $78,500 $74,250 $58,000 - $82,000
Civil Engineering 7 $60,000 $60,641 $59,488 - $63,000
Computer Science and Engineering 9 $105,000 $100,222 $72,000 - $120,000
Electrical and Computer Engineering 19 $100,000 $93,191 $40,000 - $125,000
Electrical Engineering 15 $93,000 $96,273 $55,000 - $120,000
Electrical Engineering-Systems 21 $87,000 $90,607 $50,000 - $135,000
Industrial and Operations Engineering 26 $80,000 $82,962 $60,000 - $120,000
Manufacturing 4 $77,000 $79,000 $42,000 - $120,000
Materials Science and Engineering 4 $66,500 $68,629 $63,515 - $78,000
Mechanical Engineering 37 $77,000 $79,454 $57,093 - $135,000
Naval Architecture & Marine Engineering 4 $74,000 $76,750 $69,000 - $90,000
Nuclear Engineering and Radiological Sciences 4 $71,500 $69,200 $58,800 - $75,000
Space Engineering 7 $85,500 $83,786 $75,000 - $90,000
* Categories with four or less respondents were omitted.
Salaries by RegionData reflects total respondents indicating salary and location Base Salary Information
Respondents % Median Average Range
Mid-Atlantic DC, DE, MD, PA, VA, WV 12 6% $75,000 $74,858 $50,000 - $88,500
Midwest IA, IL, IN, KS, MI, MN, MO, NE, ND, OH, SD, WI 103 50% $75,000 $74,290 $54,000 - $120,000
Northeast CT, MA, ME, NH, NJ, NY, RI, VT 14 7% $81,650 $78,739 $40,000 - $105,000
South AL, FL, GA, KY, LA, MS, NC, SC, TN 6 3% $76,500 $74,500 $60,000 - $82,000
Southwest AZ, CO, NM, OK, TX 14 7% $83,913 $86,707 $42,032 - $116,000
West AK, CA, HI, ID, MT, NV, OR, UT, WA, WY 57 28% $100,000 $99,686 $65,000 - $135,000
Post-graduation Plans
Accepted full-time job offers 563 66%
Continuing education 232 27%
Seeking employment 41 5%
Other* 15 2%
Total 851
*Other includes Military, Volunteer Service, etc Note: Out of graduating class of 1,078, data on 851 students was collected from December 2015 to November 7, 2016. Knowledge rate = 79%.
Master's2015-16
66% Accepted full-time job offers
5% Seeking employment
2% Other
27% Continuingeducation

Annual Report 9
Job Acceptances by SectorData reflects total knowledge of salary and employer Base Salary Information
Respondents* % Median Average Range
Aerospace & Defense 22 11% $81,913 $81,357 $62,000 - $95,000
Automotive & Transport Equipment 33 16% $80,000 $78,206 $65,000 - $100,000
Computer Hardware 5 2% $105,000 $108,000 $75,000 - $135,000
Computer Software & Services 26 13% $100,000 $100,577 $55,000 - $125,000
Consulting 8 4% $71,000 $70,186 $54,000 - $80,000
Energy & Utilities 6 3% $77,500 $77,967 $58,800 - $104,000
Engineering Services 14 7% $70,000 $70,571 $60,000 - $96,000
Financial Services 8 4% $90,000 $91,375 $73,000 - $120,000
Government 5 2% $70,000 $68,552 $55,666 - $85,000
Healthcare Products & Services 4 2% $71,000 $68,500 $50,000 - $82,000
Manufacturing 35 17% $75,000 $75,960 $60,000 - $114,000
Materials & Construction 4 2% $82,500 $74,250 $42,000 - $90,000
Technology 27 13% $93,000 $92,172 $42,032 - $120,000
* Categories with less than four data points were omitted.
Michigan 192 38%
California 93 18%
Illinois 31 6%
Washington 31 6%
New York 21 4%
Texas 19 4%
Other locations 123 24%
Total 510
1
2
3
4
5
6
Job Acceptances by State (Top 6)Data reflects total knowledge of location
Master's2015-16

10 Annual Report
Demographics by Program 2015 - 2016 Degrees Conferred
Fall 2016 Enrollment
Aerospace Engineering 13 123
Atmospheric, Oceanic and Space Sciences 6 59
Biomedical Engineering 18 104
Chemical Engineering 10 140
Civil Engineering 6 42
Computer Science and Engineering 30 223
Design Science 1 13
Electrical and Computer Engineering 0 87
Electrical Engineering 31 134
Electrical Engineering-Systems 22 54
Environmental Engineering 3 29
Industrial and Operations Engineering 13 72
Macromolecular Science and Engineering 4 37
Manufacturing 1 2
Materials Science and Engineering 29 107
Mechanical Engineering 37 252
Naval Architecture and Marine Engineering 7 32
Nuclear Engineering & Radiological Sciences 14 93
Nuclear Science 1 2
Robotics 0 26
Total 246 1,631
Doctoral GraduatesDemographics 2015 - 2016
Degrees ConferredFall 2016
Enrollment
Total 246 1,631
Women 20% 24%
Underrepresented Minorities* 6% 15%
International Students 52% 51%
Note: Data compiled from students who graduated August 2015 to June 2016.* Includes Black, Hispanic and Native American. % based on ethnicity of domestic students only.
The average
industry
base salary
for 2015-2016
engineering
doctoral
graduates
was $106,899.
Note: Data compiled from students who graduated August 2015 to June 2016.
Doctoral2015-16
JenniferShell
Michigan Engineers have a history and
reputation for being very successful at Shell.
They tend to be very goal oriented and able
to prioritize in order to meet those goals,
both short term and long term.

Annual Report 11
Top Hiring Companies (2015-2016)*
Full-time Co-op Intern Total Hires
Ford Motor Company 86 - 47 133
General Motors 103 - 10 113
Amazon 49 21 6 76
Microsoft 41 4 13 58
APPLE 33 5 6 44
Google 36 - 8 44
Intel 23 2 5 30
Fiat Chrysler Automobiles 22 - 6 28
Goldman Sachs 18 4 5 27
Toyota 11 10 4 25
Cummins, Inc. 11 5 8 24
Boeing Company 13 - 9 22
Dow Chemical USA 9 9 4 22
Epic 20 1 21
Facebook 12 2 7 21
Bosch 11 1 6 18
DTE Energy 2 5 8 15
GENERAL ELECTRIC - GE 5 3 7 15
SpaceX 5 6 4 15
Ernst & Young 12 1 1 14
Northrop Grumman Corporation 7 - 7 14
Yazaki North America 3 1 10 14
BASF Corporation 7 3 3 13
3M Company 5 - 7 12
PwC 8 - 4 12
Raytheon 9 - 3 12
United Airlines 2 6 4 12
ZF TRW 10 1 1 12
Johnson & Johnson 1 6 4 11
Lockheed Martin 9 - 2 11
Manhattan Associates 11 - 11
Oracle 11 - 11
Stryker 7 1 3 11
U.S. Army 7 - 4 11
Cisco Systems 7 - 3 10
Expedia 5 4 1 10
NASA 2 - 8 10
Complete list available at career.engin.umich.edu/companylist.pdf
Recruit
* Hires calculated by reported job acceptances, more hires may have been made than listed.

12 Annual Report
Top Hiring Companies (2015-2016)
Recruit

Engineering Career Resource Center230 Chrysler Center2121 Bonisteel BoulevardAnn Arbor, Michigan 48109-2092
(734) [email protected]
This publication includes post-graduate and salary data reported as of November 7, 2016.
Regents of the University of Michigan
Michael J. Behm, Grand BlancMark J. Bernstein, Ann ArborShauna Ryder Diggs, Grosse Pointe Denise Ilitch, Bingham FarmsAndrea Fischer Newman, Ann ArborAndrew C. Richner, Grosse Pointe ParkRon Weiser, Ann ArborKatherine E. White, Ann ArborMark S. Schlissel, ex officio
The University of Michigan, as an equal opportunity/affirmative action employer, complies with all applicable federal and state laws regarding nondiscrimination and affirmative action. The University of Michigan is committed to a policy of equal opportunity for all persons and does not discriminate on the basis of race, color, national origin, age, marital status, sex, sexual orientation, gender identity, gender expression, disability, religion, height, weight, or veteran status in employment, educational programs and activities, and admissions. Inquiries or complaints may be addressed to the Senior Director for Institutional Equity, and Title IX/Section 504/ADA Coordinator, Office of Institutional Equity, 2072 Administrative Services Building, Ann Arbor, Michigan 48109-1432, 734-763-0235, TTY 734-647-1388. For other University of Michigan information call 734-764-1817.
© 2017 Regents of the University of Michigan