2017 annual report and financial statements · marcus klug eso council martin steinacher ex-officio...
TRANSCRIPT

Audited by representatives of theSUPREME AUDIT OFFICE OF POLAND
NAJWYŻSZA IZBA KONTROLI (NIK)
CERN/FC/6228CERN/3359Original: English19 April 2018
2017 Annual Report
and Financial Statements for the year ended 31 December
PENSION FUND

The Finance Committee and the Council are invited to take note of the Annual Report of the CERN Pension Fund for 2017.
The Finance Committee is invited to recommend to the Council, and the Council is invited to approve the Financial Statements of the CERN Pension Fund for the Financial Year 2017 and to grant discharge to the Pension Fund Governing Board.
For recommendationFINANCE COMMITTEE 364th Meeting12-13 June 2018
Simple majority of Member States represented and voting and 51% of the contributions of all Member States
For approvalCOUNCIL189th Session14-15 June 2018
Simple majority of Member States represented and voting
Action to be taken
Voting Procedure

PENSION FUND
Annual Report
and Financial Statements
for the year ended 31 December 2017
The Financial Statements included in this Report are published in accordance with
International Public Sector Accounting Standards (IPSAS) and the Rules and
Regulations of the Pension Fund.


1 | 78
Table of contents
CHAIR’S LETTER .............................................................................................................................................. 3
ANNUAL REPORT
I. PENSION FUND GOVERNING BOARD REPORT...................................................................................... 7
1. Composition of the bodies of the Fund and Advisers (2017) .............................................. 7
2. Overview of the year 2017 ....................................................................................................... 10
3. Members and beneficiaries ..................................................................................................... 12
4. Actuarial Status of the Fund .................................................................................................... 13
5. Investment Report ..................................................................................................................... 17
II. ANNEX....................................................................................................................................................... 25
FINANCIAL STATEMENTS
III. AUDIT OPINION ....................................................................................................................................... 35
IV. FINANCIAL STATEMENTS ....................................................................................................................... 41
1. Statement of Financial Position ............................................................................................... 41
2. Statement of Financial Performance .................................................................................... 42
3. Cash Flow Statement ................................................................................................................ 43
4. Statement of Changes in Net Assets Available for Benefits .............................................. 44
V. NOTES TO THE FINANCIAL STATEMENTS .............................................................................................. 45
VI. EXTRACT OF ACTUARY’S REPORT ON THE FUND AS AT 31 DECEMBER 2017 ............................... 75

2 | 78
3 | 78
Chair’s Letter
As Chair of the CERN Pension Fund Governing Board (PFGB), it is my pleasure to present to you the
Fund’s Annual Report and Financial Statements for the Financial Year ending 31 December 2017. I trust
that this report will give you an informative update on the financial status of the Fund, as well as a summary
of the investment strategy and performance over the last year.
It was a positive year in financial markets and this was reflected in the Fund’s investment return, which is
reported on page 38.
Following a competitive tender of the Fund’s global custodian, the PFGB appointed Northern Trust as the
Fund’s custodian. Northern Trust is a key player in the custody market and we very much look forward to
benefiting from the extensive experience that Northern Trust has in supporting inter-governmental and
global pension fund clients. The transition to the new custodian will take place during 2018 and ahead of
this, I would like to extend my gratitude to State Street for their work and dedication serving as the Fund’s
custodian for the past twenty four years.
PricewaterhouseCoopers, Geneva was appointed as the Fund’s Specialised Internal Auditor with effect
from 1 May 2017 and Dr Jean-Pierre Lalain was appointed as the Fund’s Consulting Medical Practitioner
with effect from 1 December 2017, following the completion of the respective tenders. I would like to take
this opportunity to thank the outgoing Specialised Internal Auditor, Mazars, Geneva, for the work that they
performed over the last four years and Dr Zrounba for his contribution over a number of years as the Fund’s
Consulting Medical Practitioner.
I am pleased to report that, during its June meeting, CERN Council re-appointed Matthew Eyton-Jones as
Chief Executive Officer of the Fund for a term of office of three years as of 1 July 2018.
The PFGB appointed Jacob Bjorheim as one of the external professional experts to the Pension Fund
Investment Committee (PFIC) with effect from 1 January 2018, repIacing Pierre Sauvagnat who served on
the PFIC for a six-year term.
On behalf of the PFGB, I would also like to extend my warm appreciation to Lord Richard Balfe who left the
Actuarial and Technical Committee (ATC) during the year. He previously served as a member of the PFGB
for a period of six years and as member of the ATC for six years.
In closing, I would like to warmly thank the Pension Fund Management Unit’s staff for their contribution this
year, as well as all the members of the Governing Board and committees for their continued service and
dedication.
Thomas Roth, Chair, Pension Fund Governing Board

4 | 78

5 | 78
ANNUAL REPORT

6 | 78

7 | 78
I. Pension Fund Governing Board Report
The PFGB hereby presents its Annual Report and Financial Statements for the year ended
31 December 2017.
A description of the Fund and its governance structure can be found in Note 1 “General Information” of the
Financial Statements.
1. Composition of the bodies of the Fund and Advisers (2017)
Governing Board
Members Appointed by:
Thomas Roth, Chair
Véronique Halloin CERN Council
Marcus Klug ESO Council
Martin Steinacher
Ex-officio (in capacity as member
of CERN Management
responsible for Administration)
Alessandro Raimondo, Vice-Chair
Peter Hristov CERN Staff Association
Andreas Glindemann ESO Staff Association
Michel Baboulaz CERN and ESO Pensioners
Association
John Breckenridge
Adrian Cunningham
Professional members appointed
by CERN Council

8 | 78
Investment Committee
Members
Alessandro Raimondo, Chair
Jayne Atkinson
Pierre Sauvagnat (until 31.12.2017)
Jacob Bjorheim (as of 01.01.2018)
Martin Steinacher
Matthew Eyton-Jones Ex-officio (in capacity as Chief Executive Officer)
Actuarial and Technical Committee
Members
Adrian Cunningham, Chair
Michel Baboulaz
Richard Balfe (until 14.03.2017)
Marcus Klug
Matthew Eyton-Jones Ex-officio (in capacity as Chief Executive Officer)
Chief Executive Officer
Matthew Eyton-Jones
Auditors
Appointed by:
CERN External Auditors
Najwyższa Izba Kontroli (NIK), Warsaw, Poland CERN Council
Auditors specialised in pension fund matters
Mazars SA, Geneva, Switzerland (until 30.04.2017)
PricewaterhouseCopers SA Geneva, Switzerland (as of 01.05.2017)
Pension Fund
Governing Board

9 | 78
Advisers
Fund Actuary
Conduent HR Services (Buck Consultants Limited), London, UK
Custodian
State Street Bank GmbH, Munich, Germany
Risk Consultant
ORTEC Finance AG, Pfäffikon, Switzerland
CERN Consulting Medical Practitioner
Fadel Zrounba, Ferney-Voltaire, France (until 30.11.2017)
Jean-Pierre Lalain, Geneva, Switzerland (as of 01.12.2017)
A detailed list of the Fund’s Advisers is included as an annex to this report.

10 | 78
2. Overview of the year 2017
Pension Fund Governing Board
The PFGB met six times during the year (2016: six times). There was a 97% attendance record by the
members of the PFGB.
The PFGB agendas included recurrent items such as the approval of the submission of the Fund’s Annual
Report and Financial Statements to CERN Council, the approval of the Fund’s risk measure, the review of
the Fund’s actuarial “dashboard” presented by the Fund’s Actuary, the review and approval of the audit
plan of the specialised internal auditor, as well as the approval of the Fund’s budget for administrative
expenses and an update on the Fund’s Internal Control System.
The PFGB approved a revised version of the Statement of Investment Principles and Investment Policy, as
well as approving the Fund’s new Internal Control System Policy.
During the year, the competitive tender for the Fund’s global custodian service was successfully completed
and the PFGB appointed Northern Trust as the Fund’s custodian. The planning for the transition to the new
custodian started in early 2018.
Other appointments by the PFGB during 2017 included the selection of PricewaterhouseCoopers, Geneva
as the Fund’s Specialised Internal Auditor and Dr Jean-Pierre Lalain as the Fund’s Consulting Medical
Practitioner, following the completion of the respective tender processes.
During its June meeting, the PFGB agreed to recommend that CERN Council re-appoint
Matthew Eyton-Jones as Chief Executive Officer of the Fund for a second period of three years from
1 July 2018.
The PFGB also appointed Jacob Bjorheim as a new external professional expert to the PFIC, following a
selection process.
Pension Fund Investment Committee
The PFIC met five times during the year (2016: five times) including a joint meeting with the PFGB.
The PFIC received regular reports from the Pension Fund Management Unit (PFMU) on the performance
of individual asset classes, examining and reviewing the actions by the PFMU aimed at optimizing the
performance of the Fund in line with the risk limit set by the PFGB.
The Statement of Investment Principles and Investment Policy was reviewed by the PFIC who proposed
an updated version to the PFGB for approval.
During the year the PFIC reviewed some of the existing external advisory services such as the due diligence
service and proxy voting.
In November the PFIC reviewed the assumptions and modelling techniques used by the Fund’s risk
consultant to measure the Fund's risk and expected returns. At the same meeting, the PFIC approved the
Fund’s Strategic Asset Allocation for 2018.
The PFIC also received regular reporting from the PFMU on the progress of the custodian tender and
proposed the appointment of the new custodian to the PFGB.

11 | 78
Actuarial and Technical Committee
The Actuarial and Technical Committee met three times during the year (2016: four times).
The ATC was delegated responsibility by the PFGB for the selection and oversight of the tender process
for the specialised internal auditor. The ATC met in early 2017 to evaluate the bids, including receiving
presentations from each of the bidders. Following this evaluation, which was conducted in accordance with
the CERN Procurement Rules, the ATC made its recommendation to the PFGB.
During the year, the ATC agenda also included regular items such as the review of the Actuary’s year-end
report and semi-annual dashboard. The ATC also reviewed the annual report from the Fund’s Medical
Practitioner and a report from the PFMU on the annual life certificate exercise.

12 | 78
3. Members and beneficiaries
The number of members and beneficiaries as at 31 December was as follows:
The number of members as at 31 December 2017 was 3,916 (3,767 as at 31 December 2016), representing
an increase of 4% compared to 31 December 2016.
The number of beneficiaries as at 31 December 2017, excluding participants in the Progressive Retirement
Programme, was 3,631 (3,610 as at 31 December 2016), representing an increase of 0.6% compared to
31 December 2016.
There were 381 members who left the two Organisations (CERN and ESO) during the year 2017 (301 in
2016), 40 of which were retirements (50 in 2016):
2017 2016
CERN ESO Total CERN ESO Total
Members (pre 01.01.2012) 1,861 332 2,193 1,915 341 2,256
Members (post 01.01.2012) 1,579 144 1,723 1,395 116 1,511
Total Members 3,440 476 3,916 3,310 457 3,767
Deferred retirement pensions 173 51 224 152 47 199
Retirement pensions 2,460 95 2,555 2,496 92 2,588
Surviving spouse pensions 757 17 774 732 11 743
Orphan pensions 40 3 43 41 4 45
Disability and ex-gratia 29 6 35 30 5 35
Total Beneficiaries 3,459 172 3,631 3,451 159 3,610
2017 2016
Men Women Total % Men Women Total %
Retirement 33 7 40 10% 44 6 50 17%
Deferred Pension 14 5 19 5% 3 3 6 2%
Disability 1 - 1 0% 4 2 6 2%
Transfer Value 245 73 318 84% 188 47 235 78%
Deaths 2 1 3 1% 3 1 4 1%
Total Departures 295 86 381 100% 242 59 301 100%

13 | 78
4. Actuarial Status of the Fund
A key measure when assessing the financial situation of a defined-benefit pension fund such as the CERN
Pension Fund (the “Fund”) is the funding ratio. The funding ratio indicates the degree to which the Fund’s
assets cover the value of liabilities to be paid now and in the future and is calculated by dividing the net
assets at the balance sheet date with the present value of the liabilities.
A funding ratio of 100% means that a pension fund is in a position to service all of its obligations whereas
funding ratios in excess of 100% and below 100% indicate overfunding and underfunding scenarios
respectively. Funding levels can fluctuate hence many pension funds target a funding ratio above 100%.
Liability Measurement
It is important to note that a pension fund’s liabilities can be defined and measured in a variety of ways and
therefore different funding ratios may be calculated for the same fund.
The accumulated benefit obligation (ABO) measure takes into account those liabilities accumulated or
accrued at a given valuation date. Only those benefit payments that are due to be made to members and
existing beneficiaries at the valuation date are included in this measure and therefore no future
accumulation of benefits is assumed.
Another approach to liability measurement which does take into account anticipated increases in benefits
is the projected benefit obligation (PBO) method. This measure accounts for expected salary advancement
and indexation, and also pension indexation. The funding ratio based on the PBO is generally considered
the single most appropriate measure for assessing the financial position of the Fund at a given date.
When considering how a pension fund’s liabilities will evolve over time the PBO liability is projected forward
using a consistent set of actuarial assumptions. The PBO can be projected forward on either a ‘closed fund’
or ‘open fund’ basis. For a closed fund projection, no allowance is made for any new entrants to the Fund
over time such that the analysis focuses only on the current membership. Conversely, an open fund
projection will anticipate new entrants to the Fund, making allowance for the accrual of benefits for these
members as time progresses.
Table 1 below summarises the elements of the different liability measures described above:
Table 1
Actuarial Assumptions
In addition, these different methods of determining a funding ratio may use different actuarial assumptions
including, salary and pension indexation, longevity and the discount rate. These assumptions are typically
derived from studies of previous experience of trends in these variables over different periods of time. The
Fund’s actual experience over the study period is compared to the current actuarial assumptions used in
the Fund’s actuarial models and where variations are detected adjustments may be made to better reflect,
in the actuarial model, the recent and accumulated history of these assumptions. Note that where an
experience study is not feasible, actuarial assumptions may instead be set with reference to a fund’s
investment strategy, current market conditions, publicly available statistics, legislation, accounting
standards, or a best estimate of future trends. The Fund’s Actuary is appointed by the PFGB to carry out
the actuarial studies on an independent basis.
Liability Measure Accrued service Salary Indexation Pension Indexation New Entrants
ABO X
PBO (Closed Fund) X X X
PBO (Open Fund) X X X X

14 | 78
In 2017 the CERN Pension Fund has disclosed information on the financial situation of the Fund based on
the following different liability measures:
1. The Accounting Measure under International Accounting Standard 26 (IAS 26) – Accounting and
Reporting by Retirement Benefit Plans (PBO – Closed Fund)
2. The Updated Funding Measure – Best Estimate assumptions (PBO – Closed Fund)
3. The Periodic Actuarial Review as at 1 January 2016 – Best Estimate assumptions (PBO – Open
Fund)
The key actuarial assumptions applied in the different liability measures are indicated in Table 2 below.
The actuarial assumptions used for the Updated Funding Measure as at 31 December 2017 were the “Best
Estimate” assumptions. These assumptions are those that were used in the Periodic Actuarial Review as
at 1 January 2016.
Table 2
*The underlying best estimate assumption has the following term structure: 1% p.a. until 2024, 1.50% p.a. from 2025 and is unchanged
from 31 December 2016. The single equivalent spot rate describes this underlying term structure.
** Following analysis of the mortality experience of the Fund over the years 2003 to 2015, CERN’s best estimate for the Life
Expectancy assumption is 83% of the mortality rates contained within the pension VZ2010 base tables. The pension VZ2010 base
tables are based on statistics from over 21 public pension funds. The tables include an exponential projection model for future mortality
improvements and also use the official demographic projection of the Swiss Federal Office for Social Insurance.
Discount Rate
A key actuarial assumption is the discount rate which is used to calculate the present value of a pension
fund’s future liabilities and can be determined in different ways. Given the long term nature of pension fund
liabilities, discount rates can be based on long term market interest rates or on actuarial assumptions that
are more stable. Even small differences in the discount rate used can have a significant effect on the value
of the liabilities and therefore the funding ratio. Different discount rates may be used under different
approaches to liability measurement disclosed by the Fund. For further details regarding the discount rate
applied under IAS 26 please refer to section VI. “Extract of Actuary’s Report on the Fund as at 31 December
2017”
Accounting Measure
under IAS 26
Updated Funding
Measure
Periodic Actuarial
Review
Actuarial Assumptions Best Estimate Best Estimate
PBO (Closed Fund) PBO (Closed Fund) PBO (Open Fund)
31 December 2017 31 December 2017 1st January 2016
4.0%: 2018-2019 4.0%: 2016-2019
Discount Rate 1.38%* 4.5%: 2020-2024 4.5%: 2020-2024
5.0%: 2025 onwards 5.0%: 2025 onwards
1.0%: 2018-2024 1.0%: 2016-2024
1.5%: 2025 onwards 1.5%: 2025 onwards
1.0%: 2018-2024 1.0%: 2016-2024
1.5%: 2025 onwards 1.5%: 2025 onwards
Fellows: 0.0% Fellows: 0.0%
Life Expectancy 83% VZ 2010 GEN** 83% VZ 2010 GEN** 83% VZ 2010 GEN**
Non fellows: 1.4% to
0.6%. Linear
reduction between
age 18 to 64
Salary Advancement 1.50%Non fellows: 1.4% to
0.6%. Linear
reduction between
age 18 to 64
Future Salary increase 1.38%*
Future Pension increase 1.38%*

15 | 78
Explanation of different liability measures and actuarial assumptions
The Accounting Measure under International Accounting Standard 26 (IAS 26) – Accounting and
Reporting by Retirement Benefit Plans
The Fund prepares its financial statements in accordance with International Public Sector Accounting
Standards (IPSAS) and International Accounting Standard 26 (IAS 26). As there is no IPSAS with respect
to the reporting of the pension plan the Fund conforms to the provisions of IAS 26 in presenting the net
assets available for benefits, the actuarial present value of promised retirement benefits and the resulting
excess or deficit.
The Fund uses the PBO closed fund approach to value liabilities under IAS 26 and this permits an
assessment of the financial position of the Fund by comparing the net assets of the Fund with its liabilities
as at 31 December 2017. As the PBO method takes account of future salary and pension increases, it
presents a higher value for liabilities than that which would be calculated under the ABO method.
Under IAS 26 the Fund uses a discount rate that represents the long-term Swiss Confederation Bonds
interest rate, with a floor of the expected future long-term inflation rate. This is a variable rate and as such
is likely to produce volatile funding ratios from one year to the next. Using this variable discount rate to
calculate the present value of promised retirement benefits illustrates the extent to which the Fund’s net
assets as at 31 December 2017, if invested with minimal investment risk or in assets providing returns in
line with inflation, would meet the liabilities at this date. It is important to note that the “risk free” approach
to determining the discount rate, although required by accounting standards, produces a very conservative
funding ratio that is inappropriate for assessing the financial health of the Fund.
Updated Funding Measure
This measure of the Fund’s liabilities also uses the PBO closed fund approach but with a different set of
actuarial parameters that represent a best estimate of the long term funding view. Best Estimate actuarial
assumptions are those which are most likely to be borne out in practice. For each assumption there is a
50% chance of actual experience being more favourable than assumed and a 50% chance of experience
being less favourable than the best estimate assumption. The aggregate effect is that actuarial gains and
losses should be equally likely in future years.
An important difference from the actuarial assumptions under the Accounting Measure is the discount rate
which under this method represents the Fund’s long term investment return target. The use of a consistent
discount rate reduces the funding ratio volatility which is inherent in the Accounting Measure approach.
The Periodic Actuarial Review as at 1 January 2016
As provided for under Article I 4.04 of the Fund’s Rules and Regulations a Periodic Actuarial Review is
performed at least every three years. The purpose of this review is to inform the CERN Council of the
financial situation of the Fund. The last Periodic Actuarial Review was carried out as at 1 January 2016.
With respect to this liability measurement the actuary projects the assets and liabilities to 1 January 2041
to determine the expected funding level in the future. As is the case with the updated funding measure, the
Fund’s Actuary uses best estimate actuarial assumptions. The PBO method is again used but in addition
future contributions, the expected return on assets and future accrual of service for current and new
members of staff is included in the projection. Given this inclusion of expected future service for the current
and future population and the use of a consistent discount rate, this measure of a future funding ratio is the
most appropriate approach for funding purposes.

16 | 78
Funding Situation under different Liability Measures
Table 3 below shows the funding situation under each of the liability measurement approaches:
Table 3
There is no Funding Ratio at 1 January 2041 under the first two measurement approaches above as they
are projected on a closed fund basis.
Summary
Different approaches to the measurement of liabilities may be applied to determine the financial situation
of a pension fund under different scenarios and to meet the requirements of accounting standards.
The most appropriate method of liability measurement for assessing the funding situation is the PBO in an
open fund scenario as determined in the Fund’s three-yearly Periodic Actuarial Review.
Funding Position Funding Position Funding Position
Liability Measure
Accounting Measure
under IAS 26
Updated Funding
Measure
Periodic Actuarial
Review
As at 31 December
2017
As at 31 December
2017
As at 1 January
2016
kCHF kCHF kCHF
Net assets of the Fund 4,258,645 4,258,645 4,092,809
Acturial Liabilities 10,259,256 5,608,816 5,604,318
Surplus/(Deficit) in the Fund (6,000,611) (1,350,171) (1,511,509)
Funding Ratio at date of measure 41.5% 75.9% 73.0%
Funding Ratio at 1 January 2041 N/A N/A 113.6%

17 | 78
5. Investment Report
Macroeconomic Highlights
In 2017, global economic growth became stronger and more synchronised but did not translate into higher
inflation. Some central banks tightened their monetary policy as they expected price pressure to pick up
eventually. Nevertheless, the financial conditions became more supportive. This, combined with a stronger
international economy and the expectation of a fiscal stimulus package in the US, made investors more
optimistic about the prospects for corporate earnings. Political and market risks remained high, and some
indicators of investor complacency rose to new highs.
Economic indicators in developed and emerging economies were relatively robust throughout the year.
Business confidence indicators rose to multi-year highs in most geographical regions, and production and
GDP data also picked up. For example, GDP in the Eurozone grew by 2.5%, the highest annual rate in a
decade. Emerging markets also saw an improvement, with Chinese GDP growth rising to 6.9% from 6.7%
in 2016, the first yearly acceleration since 2010. These developments were accompanied by tighter labour
market conditions and lower unemployment rates in most economies.
Despite the improvement in growth and lower unemployment rates, consumer price inflation was relatively
subdued. In the US, core inflation slowed from 2.2% to 1.8% at the end of the year, while in the Eurozone
it remained low at 1.1%.
With steady global growth and the potential for prices to rise faster going forward, some major central banks
tightened their monetary policy. In the US, the Federal Reserve raised interest rates by 75 bps to 1.5% and
started to reduce its balance sheet. In the Eurozone, the European Central Bank announced that it would
reduce its asset purchases in January 2018, while in the UK the Bank of England raised interest rates for
the first time since 2007.
However, financial conditions continued to loosen despite the reduction in monetary stimulus. Long-term
government interest rates remained relatively stable, corporate credit spreads tightened, equity market
valuations rose and the US dollar depreciated.
In the US, optimism grew that the government would agree on an important fiscal stimulus package in the
near term. This tax reform, which was ultimately signed into law at the end of the year, is expected to
provide a significant boost in corporate earnings in the US and even abroad.
Against this positive growth and financial backdrop, the level of risk nonetheless remained high. Although
political risk did recede somewhat as extremist political parties failed to win elections in major European
countries, political uncertainty remained an important theme, with growing conjecture over the future
relationship between the United Kingdom and the European Union, the risk of increased protectionism,
turbulence in Spain and the potential for military escalation in the Korean peninsula. Market risk also
appeared to have risen, with several indicators pointing to rising investor complacency. For example, the
levels of implied volatility in various markets were at multi-year lows. Other indicators of optimism, such as
US consumer confidence expectations for further positive equity returns, were at record highs.
Risk Management and Asset Allocation
The Fund’s risk management and asset allocation policy is set out in the Statement of Investment Principles
and Investment Policy (SIP), which is approved by the PFGB. It is based on setting an annual risk limit and
an annual Strategic Asset Allocation (SAA), and on managing the asset allocation exposure in a manner
compatible with both the risk limit and the investment return objective.
The Fund’s return objective is to meet or exceed the actuarial best estimate discount rate, adjusted for
Geneva inflation, over the long term. For 2017, this objective corresponds to a return of 3% above Geneva
inflation. The PFGB set the same risk limit for 2017 as for 2016, namely a 5% CVaR limit of -8%.
18 | 78
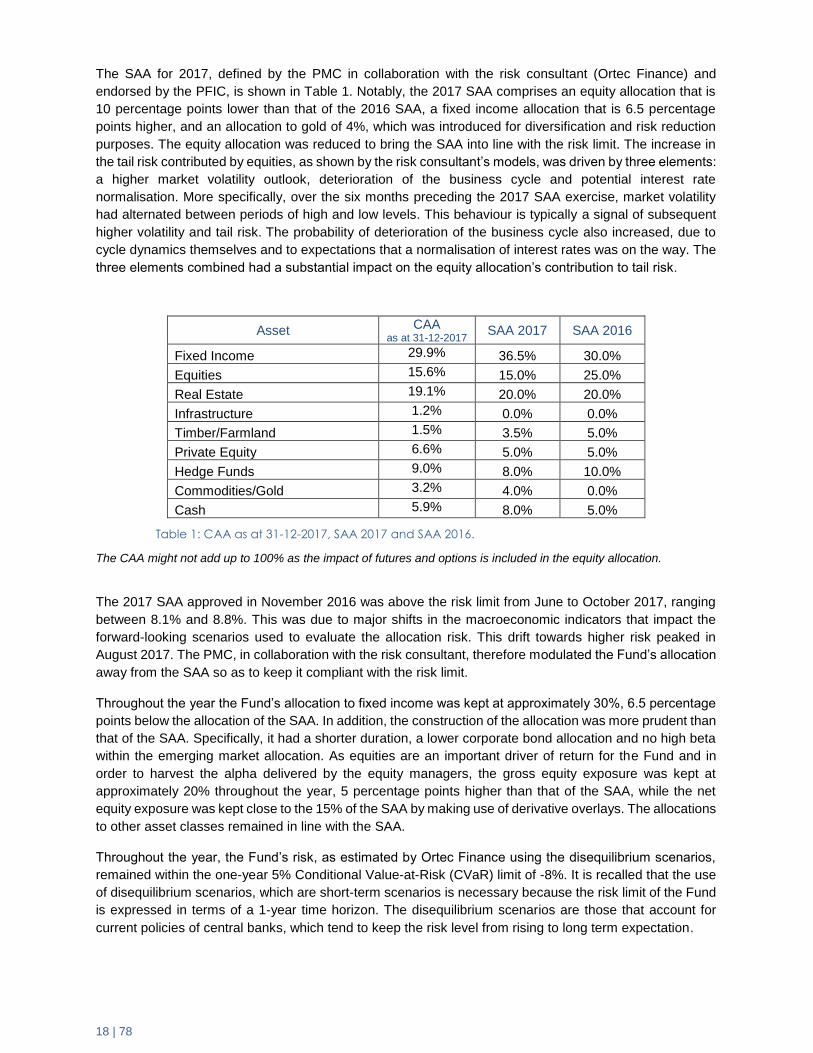
The SAA for 2017, defined by the PMC in collaboration with the risk consultant (Ortec Finance) and
endorsed by the PFIC, is shown in Table 1. Notably, the 2017 SAA comprises an equity allocation that is
10 percentage points lower than that of the 2016 SAA, a fixed income allocation that is 6.5 percentage
points higher, and an allocation to gold of 4%, which was introduced for diversification and risk reduction
purposes. The equity allocation was reduced to bring the SAA into line with the risk limit. The increase in
the tail risk contributed by equities, as shown by the risk consultant’s models, was driven by three elements:
a higher market volatility outlook, deterioration of the business cycle and potential interest rate
normalisation. More specifically, over the six months preceding the 2017 SAA exercise, market volatility
had alternated between periods of high and low levels. This behaviour is typically a signal of subsequent
higher volatility and tail risk. The probability of deterioration of the business cycle also increased, due to
cycle dynamics themselves and to expectations that a normalisation of interest rates was on the way. The
three elements combined had a substantial impact on the equity allocation’s contribution to tail risk.
Asset CAA as at 31-12-2017
SAA 2017 SAA 2016
Fixed Income 29.9% 36.5% 30.0%
Equities 15.6% 15.0% 25.0%
Real Estate 19.1% 20.0% 20.0%
Infrastructure 1.2% 0.0% 0.0%
Timber/Farmland 1.5% 3.5% 5.0%
Private Equity 6.6% 5.0% 5.0%
Hedge Funds 9.0% 8.0% 10.0%
Commodities/Gold 3.2% 4.0% 0.0%
Cash 5.9% 8.0% 5.0%
Table 1: CAA as at 31-12-2017, SAA 2017 and SAA 2016.
The CAA might not add up to 100% as the impact of futures and options is included in the equity allocation.
The 2017 SAA approved in November 2016 was above the risk limit from June to October 2017, ranging
between 8.1% and 8.8%. This was due to major shifts in the macroeconomic indicators that impact the
forward-looking scenarios used to evaluate the allocation risk. This drift towards higher risk peaked in
August 2017. The PMC, in collaboration with the risk consultant, therefore modulated the Fund’s allocation
away from the SAA so as to keep it compliant with the risk limit.
Throughout the year the Fund’s allocation to fixed income was kept at approximately 30%, 6.5 percentage
points below the allocation of the SAA. In addition, the construction of the allocation was more prudent than
that of the SAA. Specifically, it had a shorter duration, a lower corporate bond allocation and no high beta
within the emerging market allocation. As equities are an important driver of return for the Fund and in
order to harvest the alpha delivered by the equity managers, the gross equity exposure was kept at
approximately 20% throughout the year, 5 percentage points higher than that of the SAA, while the net
equity exposure was kept close to the 15% of the SAA by making use of derivative overlays. The allocations
to other asset classes remained in line with the SAA.
Throughout the year, the Fund’s risk, as estimated by Ortec Finance using the disequilibrium scenarios,
remained within the one-year 5% Conditional Value-at-Risk (CVaR) limit of -8%. It is recalled that the use
of disequilibrium scenarios, which are short-term scenarios is necessary because the risk limit of the Fund
is expressed in terms of a 1-year time horizon. The disequilibrium scenarios are those that account for
current policies of central banks, which tend to keep the risk level from rising to long term expectation.

19 | 78
A new version of the Fund’s risk framework was drawn up by the PMC in collaboration with the Ortec
Finance and was approved by the PFGB in November. This new risk framework, which now includes
measures of price risk in addition to the Conditional Value-at-Risk measure, is aimed at fostering the
coherence of risk management actions during market dislocations of various kinds. In order to ensure its
systematic deployment the PFMU developed new IT and quantitative infrastructures.
In addition, the PFMU continued to develop other infrastructures, including its portfolio diagnostics tools,
and fostered the development of macroeconomic and market diagnostics tools. The team also started to
develop an application that will integrate the Risk and Asset Allocation tools into a single piece of software
as well as providing the team with strategy back-testing and monitoring capabilities.
Portfolio Performance in 2017
In 2017 the Fund returned 6.93% net of external management fees, as reported by the custodian as at 31
December 2017. This performance of the Fund for 2017 is calculated using time-weighted rate of return to
eliminate the impact of external cash flows, their timing included, on return calculations. In addition, it
neither includes the Private Equity performance for the fourth quarter, which is reported with one-quarter
time lag, nor the increase in capital value of the Real Estate allocation between October and December
2017. It includes however the increase of Real Estate capital value between October and December 2016
as well as the private equity performance of the fourth quarter 2016.
Figure 1 shows the Fund’s cumulative returns compared to the return objective since December 2011, as
reported by the custodian. The cumulated returns of the Fund since 31 December 2011 exceeded the
objective by 14.73 percentage points as at 31 December 2017.
Figure 1: Cumulative Returns vs. Objective
Currency Hedging Policy
Throughout the year the Fund maintained a prudent currency hedging policy, hedging between 90% and
100% of its overall currency exposure on average.
Fixed Income
Throughout the year the Fund’s allocation to fixed income was kept at approximately 30%, 6.5 percentage
points below the allocation of the SAA. This tactical underweight anticipated the strong momentum in bond
sell-off that materialised in the second half of the year. In addition, the high cost of currency risk hedging
limited the spectrum of available opportunities namely in short dated bonds which would have yielded less
than cash.
95%
100%
105%
110%
115%
120%
125%
130%
135%
CERN PF
3% + GenevaInflation

20 | 78
Fixed Income excluding Private Debt
In 2016 the portfolio duration was kept within a low range of 3 to 5 years (including derivative hedges),
which allowed the Fund to limit its losses when the sell-off occurred at the end of the year, both in EUR
and USD. From the start of 2017, the portfolio was repositioned for a continued increase in rates, with end-
year targets of 0.65% for 10-year German bunds and 2.85% for 10-year US treasuries. The duration was
increased smoothly in line with the trend in rates. The volatility of the portfolio was actively managed with
derivative instruments. In terms of maturity the portfolio exposure to durations below 10 years was kept at
90%. By the end of the year this proportion was increased to 94% as a result of profit-taking on a trade in
anticipation of the flattening of the yield curve.
The structure of the portfolio evolved throughout the year: the allocation to government bonds (including
emerging sovereigns) was increased from about 40% to 50% of the portfolio, while corporate debt was cut
from about 55% to less than 50%.
The gradual reduction of the allocation to corporate bonds was driven by profit taking. The abundance of
liquidity and the hunt for yield drove the spread to a very compressed level, resulting in an unfavourable
risk return profile for certain segments of the market. The reduction did not affect the granularity of the
portfolio, with more than 120 issuers kept to mitigate idiosyncratic risks. The strategy of active trading in
insurance company subordinated debt and subordinated corporate bonds was pursued for the second year
running. The two allocations of 50 MCHF each returned more than 6% and 9%, respectively, in Swiss franc
terms.
The government bond allocation was tilted to inflation-linked bonds, mainly in the US, with the exposure
increasing from below 5% to more than 10% of the portfolio. This increase was achieved by implementing
a thematic inflation trade, motivated by the fact that the market was not discounting any inflation at the end
of 2016 while growth was picking up. The bulk of the government bond allocation focussed on peripheral
countries, with an emphasis on Portugal and on agencies (EFSF, ESM and EIB). This geographical
positioning aimed at taking advantage of the growth and recovery potential in Portugal, Spain and Italy.
Portuguese treasuries attained investment grade status just after the summer.
Similarly, because growth was picking up globally, the emerging market exposure was increased from 10%
to 15% of the allocation, with emphasis on the low beta part of the segment, i.e. Gulf countries and eastern
sovereigns. Preference was given to the least volatile instruments issued by states with strong
macroeconomic and political fundamentals.
The portfolio was almost entirely invested throughout the year, with cash representing an average of only
2% to 4%.
Private Debt
As of December 2017, the Fund was committed to eight private debt vehicles. The European fund allocation
comprises one 40 MEUR allocation focused on syndicate loans and one 9 MEUR allocation relating to a
short-term bridge loans. The 40 MEUR investment was fully deployed in defensive European loans. The 9
MEUR allocation is dedicated to bridge loan investments for renewable energy companies, mainly in
France, alongside recognised investors. Half of the 9 MEUR has been called to date.
The US fund allocation comprises five funds representing a total commitment of 42 MUSD. Most of these
US middle-market funds invest in senior secured loans of companies with an enterprise value of between
10 and 75 MUSD. Three-quarters of the capital committed has been deployed and the yields have been
between 9% and 10% so far.
The best performer was the CLO (collateralised loan obligation) mezzanine tranche, to which the Fund
committed 55 MEUR. The investment returned more than 10% in 2017.

21 | 78
Equities
For the equity markets the year was punctuated by two major political events: firstly, the rather
disorganised beginning of President Trump’s US Administration in January (including uncertainties
surrounding trade and immigration policy, tensions with North Korea and the continual turnover in the White
House staff) and secondly, the French presidential election in May. The US equity markets were
nevertheless buoyed by the pro-business Trump agenda and markets in Europe performed well early on,
in anticipation of a “safe” outcome of the French elections. Strong economic growth in Europe and Japan
and a continuation of easy monetary policy was supportive of both those markets. Emmanuel Macron’s
victory and pro-euro centrist agenda had a positive impact on stability in Europe and European stock
performance. Japan remained committed to its very accommodative negative interest rate policy, which,
coupled with the promise of economic reforms (the “Abenomics” policy), helped to drive Japanese equity
markets higher. The Japanese economy continued to improve and has now seen seven consecutive
quarters of growth, and unemployment is at its lowest level for over two decades. Whilst European markets
suffered in the immediate aftermath of the French elections and from the resulting strengthening of the
euro, the US equity market forged higher, driven by strong contributions from secular growth companies,
particularly in the technology and healthcare sectors, which together form almost 40% of the US S&P 500
index. 2017 was also the first year since 1995 that the S&P 500 index did not experience a drawdown of
3% or more and the VIX index (a measure of S&P 500 implied volatility) experienced record low levels,
averaging 11.1 during the year and reaching a low of 8.54. Emerging markets continued the recovery which
had begun in the early part of 2016, benefitting strongly from both synchronised global growth and secular
growth themes as well as from the obvious cyclical advantages of a rebound in global trade and increased
stability in the US economy. Chinese stock indices and therefore the wider EM indices were helped by the
technology component of the index as Asia’s ‘BAT’ stocks (Baidu, Alibaba, Tencent), a US FAANG
equivalent, performed extremely well.
The Pension Fund’s equity allocation is focussed around three principle developed markets, consisting of
Europe, US and Japan. While the Fund has historically been biased towards European equities, this bias
has been reduced over recent years to take advantage of attractive investment opportunities outside
Europe. The Fund’s equity investments are a combination of passive and equity portfolios, and external
and internal managers. In Europe, there is a core portfolio that is managed internally, but there are also a
number of external mandates, including a defensive, European value manager and several European small
cap funds, as well as a passive European small cap ETF. The US large cap allocation has historically been
made up of passive ETFs but the PMC has also been successful in managing the sector weights actively
via sector ETFs according to the PMC’s views. The remaining part of the US allocation is a mandate with
a small cap growth manager that has delivered consistent long-term alpha since inception, and a small
allocation to an internal US quant fund.
At the beginning of the year the allocation to equities, after futures hedges and including cash held within
the portfolios, was 16.0% (including 3.8% US futures hedges and 6.7% European futures hedges). This
represented a slight increase compared to the 2017 SAA of 15%, largely reflecting the PFMU’s more
positive view of the equity asset class whilst remaining within the prescribed risk levels. Within this
allocation, 8.9% was allocated to European equities, 4.5% to US equities, 2.5% to Japan and 0% to
Emerging Markets. At the very end of the year, the allocation moved down towards the level of SAA to
reach approximately 15.6% including beta-adjusted futures hedges and tactical tail-hedge option
structures. The geographical breakdown had also shifted, partly by drift and partly by active allocation
changes consisting of 6.6% to Europe, 6.2% to the US, 2.6% to Japan and 0.2% to Emerging Markets,
excluding the new Infrastructure equity portfolio and cash held within portfolios. This is comparable with
the SAA 2018 equity allocation.
The two European large cap portfolios achieved considerable success during the year and complemented
each other well.

22 | 78
The internal portfolio posted a 25.7% performance versus the MSCI Europe ETF of 20.0%. Performance
was particularly helped by overweights in technology names such as ST Microelectronics, AMS, Soitec
and Just Eat. A large overweight in the luxury goods group LVMH was also one of the largest contributors,
as well as investments in the pharmaceutical company Novonordisk and the Swedish telecom company
Com Hem Hldg. Technology remains the largest sector overweight in the portfolio going into 2018.
The external European portfolio manager delivered a 24.2% performance versus the same benchmark.
Highlights were the UK specialty insurance provider Beazley, the reinsurance company Hiscox and the
Spanish telecoms operator Cellnex. The European small cap funds selected by the internal managers also
delivered significant outperformance, particularly Alken, which delivered 30.1% versus its MSCI European
Small Cap benchmark of 15.1%.
The PMC also initiated a listed equities infrastructure portfolio, which ended the year with a 21.5%
performance.
The US part of the equity allocation performed extremely well, due in part to the Granahan US small cap
growth mandate, which posted a performance of 27.2% versus the Russell 2000 Growth benchmark
performance of 16.8%. The Fund also benefitted from internal overweights in US technology via ETFs and
direct investments in FAANG stocks and others including Microsoft and Salesforce. Throughout the year
the PMC also increased the US financials sector exposure to allow the Fund to benefit from improving
conditions for US banks, the increasing US yield curve and higher anticipated earnings.
Real Assets: Real Estate – Farmland - Timber
Real Estate
2017 was a record year for the global real-estate market, with investment volumes at their highest levels
for a decade. Consequently, the property yield compression that started in 2013 continued, leading to
historically low levels and limiting the investment growth for many disciplined investors.
In accordance with global trends, a significant yield compression was recorded for the Fund’s properties in
the UK, France and Switzerland. The net running yield of the Fund’s Swiss properties was 3.69% in 2016
and dropped to 2.81% in 2017. For the UK and French properties (excluding sold properties), the net
running yield was 3.51% and 2.70% in 2017 respectively, compared to 3.93% and 3.94% in 2016. The
increase in capital value (11% in France, 7% in Switzerland, 1% in the UK, expressed in local currencies)
was the main driver of this yield reduction; the second driver was the renovation work undertaken on several
Swiss, UK and French properties. The German properties recorded a 15% increase in capital value;
nonetheless, the net running yield increased from 3.34% in 2016 to 3.63% in 2017 as the cost for work and
maintenance was lower.
At the end of 2017, the real-asset portfolio comprised 15 properties. The holdings are three residential
buildings in Switzerland, six residential and commercial properties in France, including four parcels of
woodland with a total area of approximately 2,000 hectares, two office buildings in Germany and three
buildings and a farm in the UK. The Fund also has exposure to US forestry and New Zealand dairy farmland
through two limited partnerships.
In 2017, the Fund sold a property in Paris known as “Bingen-Legendre” (offices with a total area of 938
m2) and one in London known as “Canongate” (1863 m2 of offices and 337 m2 of commercial space). The
Bingen-Legendre property was sold, for a price of 11.7 MEUR, to capture the material value increase over
5 years (21%). The UK-based asset was sold, for 19.8 MGBP, mostly to lock in a profit (a capital value
increase of 24% since inception in 2013). This translated into an IRR since inception of 10.21%.
In addition, another underlying reason for divesting was the material cost of hedging the sterling (1.36%),
which is far higher than, for example, the cost of euro hedging (0.45%).

23 | 78
In line with its traditional disciplined and prudent approach, the Fund remained conservative throughout the
year in terms of reinvestments, mindful of the risks related to the normalisation of interest rates The focus
of the market search continued to be prime locations, in particular in Berlin and in Paris where, thanks to
previous acquisitions, the Fund is able to leverage its knowledge of the local market. Several of the assets
identified through those searches in 2017 might be acquired in 2018.
Farmland
Global farmland has experienced a slowing of value growth compared to 2016 because of pressure on
commodity prices. In fact, the Savills Global Farmland Index recorded an average annualised growth of
13.3% since 2002 (-1.5% YoY) and of 2% (-4.6% YoY) over the past five years. Nonetheless, farmland as
an asset class is still in demand thanks to competitive land use (urban development and recreational uses)
and increased food production.
The farm in the UK, a 664 hectare property near Cambridge, recorded an increase in capital value of 6.9%
compared to 2016, largely due to an increase of its residential value (34% of the increase) and for the first
time taking into account of a few items such as roof-mounted photovoltaics, reservoirs, etc. ( 22% of the
increase).
The Craigmore Dairy partnership, a dairy farmland fund in New Zealand, is fully drawn and almost fully
invested. It recently completed the acquisition of a second dairy farm for a total of 19 MNZD.
Timber
The TIR Europe Forestry Fund in the US, purchased its second timberland property, “Paardeberg” in
Alabama, for a total of 21 MUSD. This 5260-hectare property is well positioned in a strong timber market,
with access to a variety of processing facilities. The fund is now fully committed.
The Pension Fund’s real-assets portfolio includes four parcels of forests in France with a total area of 2,084
hectares, largely dedicated to the growth of oak trees. As of December 2017, its value in local currency
had increased by 8.5% compared to 2016 due to an increase in the prices of oak largely driven by Chinese
demand.
Private Equity
Like other alternative investments, the private equity industry faced specific challenges throughout 2017,
such as a very strong inflow of capital, which led to increasing entry price levels and yield shrinkage. For
example, as reported by Preqin, a leading independent data provider in the alternative industry, global
assets under management reached a level of 2.83 trillion USD (at June 2017), an all-time high representing
an increase of nearly 10% compared to 2016. As a result of the increasing amount of private equity capital
available, the average purchase price multiple for deals increased to an average of 10.6x EV/EBITDA in
2017, far higher than the post-crisis value of 7.7x in 2009.
The portfolio’s total NAV was 267 MCHF at December 2017, with 112 MCHF of outstanding commitments.
Over the course of 2017 the Fund received 28 MCHF in distributions and paid out 50.7 MCHF in capital
calls. In addition, it committed the equivalent of 22.5 MCHF across four funds: 19.6 MCHF to three primary
leverage buyout funds and the remaining 3 MCHF to a secondary investment.
The Fund’s total exposure, in terms of strategy, was dominated by leveraged buyout (LBO) (47%), followed
by growth equity (19%) and venture capital (13%). The geographic exposure is shared equally between
Europe (44%) and North America (47%).
As of December 2017, the Fund had 79 active investments (mainly funds, plus a very small number of
direct investments in companies). Of these 79 active investments, 30 were made between 1997 and 2014,
when the Fund’s private equity strategy was reviewed, resulting in a shift towards LBOs and growth equity
funds where the return distributions tend to exhibit less negative skewness.

24 | 78
Hedge Funds
The hedge fund allocation was reduced to 7% of the overall portfolio in 2017, bringing it into line with the
SAA. The Fund trimmed the allocations to Millennium (20 MUSD), Citadel (60 MUSD) and CFM (5 USD)
to take profit on recent strong performances and diversify away from large positions.
New allocations mainly concerned the opportunistic portfolio. The Fund allocated 3 MUSD to QIM and 10
MUSD to AHL Evolution and added some capital to existing strategies such as Aeolus (3 MUSD).
2017 was a supportive environment for multi-strategy funds and for some systematic strategies that
implement relative value and statistical arbitrage. Performance came mainly from the multi-strategy funds,
with a 4.2% contribution to the total portfolio performance of +7.4% in US dollars and 4.93% in CHF terms
for 2017.
The portfolio maintained a relatively low market exposure to both equity and credit markets (0.10 beta on
a 24-month rolling basis). The absolute performance of the portfolio is encouraging in this context, as the
returns were achieved with low sensitivity to the rally in risk assets.
Updates to the Investment Framework
In 2017, the PMC reviewed the internal competencies required for investing in alternative asset classes as
well as the cost of consultants involved in sourcing and due diligence. As a result of this review, a new due
diligence framework applicable to all alternative investments was proposed. The new framework
internalises the sourcing and the investment due diligence, while the operational due diligence remains
outsourced. The requirements of investment and operational due diligence were aligned with the best
practice standards recommended by CAIA. This new framework was approved by the PFIC and is expected
to bring considerable savings in terms of fees: for private equity alone, it is expected to save 1.7 M in fees
per year compared to the previous system for the same investment volume).
Conclusions – Macro Outlook
In 2018, despite a relatively benign economic picture, the outlook remains relatively unclear.
The announcement of a relatively large fiscal stimulus programme in the US, synchronised global growth,
loose financial conditions and a pick-up in investment spending suggest that we could witness relatively
buoyant growth in the coming quarters. However, as inflationary pressures eventually become more
evident and monetary stimulus is reduced, it remains to be seen if market conditions remain as positive.
Political uncertainty remains elevated and, as illustrated by the recent correction of the markets, there are
signs that volatility could rise significantly. Given these concerns, the investment outlook is relatively
positive but requires a great amount of caution.

25 | 78
II. Annex
Bankers
ABN Amro Bank N.V., Utrecht, Netherlands
Banque Cantonale de Fribourg, Fribourg, Switzerland
Barclays Bank plc, Cambridge, UK
Bankhaus Ellwanger & Geiger KG, Stuttgart, Germany
Caisse de Credit Mutuel, Saint Genis Pouilly, France
Credit Agricole Centre-Est, Oyonnax, France
Credit Suisse AG, Zurich, Switzerland
Deutsche Bank AG, Berlin, Germany
Mirabaud & Cie Banquiers Privés SA, Geneva, Switzerland
Post Finance SA, Lausanne, Switzerland
Société Générale SA, Annemasse, France
UBS SA, Nyon, Switzerland
Brokers and Derivatives Counterparties
Bank of America Merrill Lynch, New York, USA
Barclays Bank plc, London, UK
BBSP Partners SAS, Paris, France
Bloomberg L.P., New York, USA
BNP Paribas SA, Paris, France
Canaccord Genuity Corp., Vancouver, Canada
Cantor Fitzgerald L.P., New York, USA
Carax SA, Paris, France
Citigroup Inc., New York, USA
La Compagnie Benjamin de Rothschild SA, Geneva, Switzerland
Deutsche Bank AG, Frankfurt, Germany
Exane SA, Paris, France
Goldman Sachs Group, Inc., New York, USA
Helvea, Geneva, Switzerland
Jefferies, London, UK

26 | 78
Brokers and Derivatives Counterparties (continued)
J.P. Morgan Chase & Co., London, UK
Louis Capital Market, London, UK
MainFirst Bank AG, Frankfurt, Germany
Mirabaud Securities LLP, London, UK
Mizuho Intenational plc, London, UK
Morgan Stanley & Co. International plc, London, UK
Natixis, Paris, France
Rabobank, Utrecht, Netherlands
Santander Investment, Santander, Spain
Sociéte Générale SA, Paris, France
State Street Corporation, Boston, USA
Stifel Financial Corp., Saint-Louis, Missouri, USA
Tachibana Securities Co.Ltd, Tokyo, Japan
UBS Limited, London, UK
UniCredit SPA, Munich, Germany
Wells Fargo & Co, London, UK
Data Services
AlterNet Limited, London, UK
New York - USA Bloomberg Finance L.P., New York, USA
Capital Economics Ltd, London, UK
Equinoxe AIS Ltd, Dublin, Ireland
Ethos Services SA, Geneva, Switzerland
FTSE International Ltd, London, UK
London -UK FX Connect & Trade Services LLC, Frankfurt, Germany
Frankfurt - Germany Haver Analytics, New York, USA
New York - USA Hyperpyron International Partners Inc., Celina, USA
Celina - USA Highsoft, Vik I Sogn, Norway
IPD Investment Property Databank GmbH, Frankfurt, Germany
Frankfurt - Germany Links Analytics B.V., Delft, The Netherlands
Mcube Investment Technologies LLC, Plano, USA

27 | 78
Data Services (continued)
Morningstar Switzerland GmbH, Zurich, Switzerland
Zurich - Switzerland Ned Davis Research Inc., Venice, USA
Venice - USA
NYSE Market Inc., Pittsburgh, USA
Pittsburgh - USA Peracs GmbH, Frankfurt, Germany
Preqin Ltd, London, UK
London - UK S&P Dow Jones Indices LLC, Chicago, USA
Chicago - USA Towers Watson AG, Zurich, Switzerland
Zurich - Switzerland
External Legal Advisers
14 Pyramides Notaires SCP, Paris, France
Letulle Notaires, Paris, France
LPA-CGR avocats, Paris, France
Freshfields, Frankfurt, Germany
Gowling WLG LLP, London, UK
Oberson Abels SA, Geneva, Switzerland
Willkie Farr & Gallagher LLP, London, UK
Raue LLP, Berlin, Germany
External Investment Managers – Hedge Funds
Aeolus Capital Management Ltd., Hamilton, Bermuda
Bridgewater Associates Inc., Westport, USA
Capital Fund Management SA, Paris, France
Citadel Advisors LLC, Chicago, USA
Corvex Management L.P., New York, USA
Effissimo Capital Management, Singapore
King Street Capital Management L.P., New York, USA
Man Group, London, UK
Millennium International, New York, USA
Pentwater Capital Management L.P., Evanston, USA
Systematica Investments, Geneva, Switzerland
Taconic Capital Advisors L.P., New York, USA

28 | 78
External Investment Managers – Hedge Funds (continued)
Tudor Investment Corporation, Greenwich, USA
Two Sigma Investments, New York, USA
External Investment Managers – Private Debt
External Investment Managers – Private Equity
3i Investments plc, London, UK
AE Industrial Partners LLC, Florida, USA
AIF Capital Limited, Hong Kong
Alcuin Capital Partners LLP, London, UK
Alken Luxembourg SA, Luxembourg
American Capital Limited, Maryland, USA
Apax Partner SAS, Paris, FR
Arbor Private Investment Company IV, LLC, Chicago, USA
Capricorn Investment Group LLC, Palo Alto, US
CapVest Associates LLP, London, UK
Craigmore Sustainables, Christchurch, New Zealand
Cressey & Company L.P., Chicago, USA
Crestview Partners, New York, USA
DN Capital (UK) LLP, London, UK
American Century Investments, Luxembourg
Audax Group, New York, USA
AXA Funds Management SA, Luxembourg
Barings Global Credit Funds, Luxembourg
Eiffel Investment Group SAS, Paris, France
EQT Fund Management S.à r.l., Luxembourg
Freeport Financial Partners LLC, Chicago, USA
H2O Asset Management, London, UK
NXT Capital, Chicago, USA
TIAA Global Asset Management, New York, USA
SYZ Asset Management Luxembourg, Luxembourg

29 | 78
External Investment Managers – Private Equity (continued)
Edmond De Rothschild Group, Luxembourg
Endeavour Vision SA, Geneva, Switzerland
Essling Capital, Paris, France
Fortissimo Capital, L.P, Rosh Haayin, IL
FTV Capital, San Francisco, USA
GHO Capital Management Limited, London, UK
Globetrotter Co-Investment (GP) Inc., Delaware, USA
Graham Partners, Newton Square, USA
Groupe Siparex, Lyon, France
HarbourVest Partners LLC, Boston, USA
Keensight Capital, Paris, France
L Catterton Partners, Greenwich, USA
LBO France FPCI, Paris, France
Littlejohn & Co., Greenwich, USA
Macquarie Funds Group, Sydney, Australia
Main Post Partners LP, San Francisco, USA
MML Capital Partners, London, UK
Montefiore Investment, Paris, France
Nemo Investor Aggregator Limited, Greenwich, USA
NeoMed Management, Oslo, Norway
Oak Hill Advisors, L.P., New York, USA
Pacific Community Ventures Inc., San Francisco, USA
PAI Partners SAS., Paris, France
Parallax Capital Partners, Laguna Hills, USA
Paul Capital Investments, San Francisco, USA
Premiere Global Services Inc., New York, USA
Quilvest Switzerland Limited, Zurich, Switzerland
Silverstone Capital Partners, Atlanta, USA
Siris Capital Group LLC, New York, USA
Sofinnova Partners SAS, Paris, France
Spectrum Equity Investors, Boston, USA

30 | 78
External Investment Managers – Private Equity (continued)
Spindletop Capital, Austin, USA
Talde Gestion SGEIC SA., Bilbao, Spain
TDR Capital LLP, London, UK
Technology Crossover Ventures, Palo Alto, USA
The CapStreet Group LLC., Houston, USA
Timberland Investment Resources LLC, Boston, USA
TowerBrook Capital Partners L.P., New York, USA
TPG Capital, Fort Worth, USA
Triangle Private Holdings I, LLC, New York, USA
Tudor Investment Corporation, Greenwich, USA
Veronis Suhler Stevenson LLC, New York, USA
Vision Capital Administration LLC, Burlingame, USA
Webster Capital Partners LLC, Waltham, USA
External Investment Managers – External Equity Mandate
Hedge Fund Adviser
Aksia Europe Limited, London, UK
Private Equity Adviser
Stepstone Group Europe LLP, London, UK
Real Estate Managers
Comité des forêts, Paris, France
Kinney Green, London, UK
Hayter International, Paris, France
Moser Vernet & Cie, Geneva, Switzerland
PRÄZISA, Berlin, Germany
Savills (UK) Limited, Cambridge, UK
Granahan Investment Management Inc., Waltham, USA
MFS International (U.K.) Limited, London, UK

31 | 78
Real Estate Valuation Experts
BNP Paribas Real Estate, Paris, France
Savills (Incorporating SmithGore), London, UK
EURL P Cochery, Rambouillet, France
Real Estate Auditors
BDO AG, Berlin, Germany
Cabinet Louis Planche, Lyon, France
Rawlinson & Hunter Audit LLP, London, UK
REVIDOR Société Fiduciaire SA, Geneva, Switzerland

32 | 78

33 | 78
FINANCIAL STATEMENTS

34 | 78

35 | 78
III. Audit Opinion
36 | 78
EXTERNAL AUDITOR’S REPORT
Addressed to:
COUNCIL OF THE EUROPEAN ORGANIZATION FOR NUCLEAR RESEARCH
(CERN)
CH-1211, Genève 23, Switzerland
We have audited the accompanying financial statements of the European Organization for Nuclear
Research Pension Fund (the Fund), which comprise the statement of financial position as at
December 31, 2017, and the statement of financial performance, cash flow statement and
statement of changes in net assets available for benefits for the year then ended, and a summary
of significant accounting policies and other explanatory information.
Audit Opinion on the CERN Pension Fund financial statements
In our opinion, the financial statements present fairly, in all material respects, the financial
position of the CERN Pension Fund as at December 31, 2017, its financial performance and
its cash flows for the year then ended in accordance with the International Public Sector
Accounting Standards and International Accounting Standard 26.
We have also audited the Fund’s management compliance with the Rules and Regulations of the
Pension Fund, CERN Financial Rules and Regulations for the Implementation of the CERN
Financial Rules as well as other rules and regulations and service agreements related to and
affecting the use of the Fund financial resources.
Audit Opinion on compliance of the Fund’s management with rules and regulations
In our opinion, the transactions related to the CERN Pension Fund, handling receipts of the
Fund members contributions, collecting the contributions of the Fund beneficiaries to the
CERN Health Insurance Scheme, payments of benefits, operating investments of the Fund
assets, and incurring other expenses have been conducted, in all material respects, in
compliance with the CERN and CERN Pension Fund Rules and Regulations and all other
relevant rules and regulations and service agreements.
Basis for Opinions
We conducted our audit in accordance with International Standards of Supreme Audit Institutions
(ISSAIs). Our responsibilities under those standards are further described in the Auditor’s
Responsibilities for the Audit of the Financial Statements section of our report. We are independent
of the audited Organisation in accordance with the ISSAI 10 – Mexico Declaration of SAI1
Independence and ISSAI 30 – Code of Ethics, together with other requirements that are relevant
to our audit of the financial statements of an international institution as stated in ISSAI 5000 –
Audit of International Institutions – Guidance for SAIs and the Code of Conduct of the Supreme
Audit Office of Poland, and we have fulfilled our ethical and other responsibilities in accordance
with the said standards. We believe that the audit evidence we have obtained is sufficient and
appropriate to provide a basis for our opinion.
1 SAI – Supreme Audit Institution

37 | 78
Emphasis of matter
We draw the Council’s attention to decreased technical deficit of the Fund (MCHF 6,001 as
compared to MCHF 6,106 in 2016) and accompanied higher level of the PF Funding Ratio (41.5%
as compared to 39.9% in 2016). Net assets available for benefits also increased from MCHF 4,060
in 2016 to MCHF 4,259 in 2017. The level of net assets available for benefits went up close to the
level of 2007 (MCHF 4,614) before the financial crisis of 2008. Nevertheless, the funding ratio
of the Fund calculated in accordance with IPSAS remains low and the financial position of the
Fund is exposed to the risk of unpredictable fluctuations on the market.
Key Audit Matters
Key audit matters are those matters that, in our professional judgment, were of most significance
in our audit of the financial statements of the current period and compliance with authorities. These
matters were addressed in the context of our audit of the financial statements as a whole and
compliance with authorities, and in forming our opinion thereon.
Key audit matters in the audit of the CERN PF Financial Statements for 2017 were as follows:
1) Valuation of Pension Fund Assets
Pension Fund Assets constitute the crucial item in the Pension Fund Financial Statements
of the total gross value MCHF 4,325. They form the basis of PF capability of providing
benefits to CERN and ESO pensioners and other beneficiaries as well as meeting other
Fund’s liabilities.
The matter was addressed in the audit by verification of the information provided in the
Custodian’s monthly reports against relevant account balances and reconciliation of the
values reported in the Statement of Financial Position with the relevant accounting data.
For investment property (kCHF 824), a verification of existence, completeness and
valuation was also performed on the basis of the information provided in property
managers and evaluators reports.
2) Accuracy of reporting Pension Fund Investments
Pension Fund investment reflect active use of PF assets in excess of those utilised for the
payment of defined benefits and other expenses of the Fund. As members’ and employers’
(CERN and ESO) contributions to the Fund are not alone sufficient to meet PF obligations
the level of return from investments decides about PF long-term capability to pay benefits.
The matter was addressed in the audit by verification of the information provided in the
Custodian’s monthly reports against relevant account balances and reconciliation of the
amounts reported in the Statement of Financial Performance with the relevant accounting
data.
3) Accuracy of and compliance of payments of Pension Fund benefits
Payment of Pension Fund benefits is the ultimate goal of the PF operations. The financial
reporting objective of the Fund is to comply with the Rules and Regulations of the Fund
in calculating benefits and to report accurately benefits paid.
The matter was addressed by substantive analytical procedures for contributions and
benefits, taking into account quantities of new members and beneficiaries and quantities
of those who left the Fund and making recalculations and comparisons of relevant totals
of contributions and benefits.
4) Going concern assumption
Under the going concern basis of accounting, the financial statements are prepared on the
assumption that the entity is a going concern and will continue its operations for the
foreseeable future. General purpose financial statements are prepared using the going

38 | 78
concern basis of accounting, unless management either intends to liquidate the entity or to
cease operations, or has no realistic alternative but to do so. IPSAS contain an explicit
requirement for management to make a specific assessment of the entity’s ability to
continue as a going concern, and standards regarding matters to be considered and
disclosures to be made in connection with going concern.
For the CERN Pension Fund such an assessment is important from the point of view of
vested interests of its beneficiaries and members as well as economic and operational
interests of its sponsors.
The matter was addressed during the audit by inquiries with the Fund management,
inspection of a document on the going concern assessment, inspection of the annual
Actuary’s Report and analysis of the current financial position of the Fund. We were
satisfied with the approach of the management and the result of the going concern
assessment this year.
5) Internal control system
We believe that well-designed internal control system supports the achievement of the
Fund’s objectives and is an effective and efficient measure against risks to materialise in
the form of misstatements in financial reporting and/or incidents of non-compliance with
authorities, thus hampering financial and compliance objectives of the Fund. In 2015, we
assessed that the Fund’s internal control system was well designed and was satisfactorily
effective in support of the Funds daily operations. Nevertheless, we recommended the
Fund’s management to take into account fundamental principles of COSO Internal Control
Integrated framework while upgrading the Fund’s internal control system.
The matter was addressed by inquiries with the Fund’s management, discussions on
patterns of relating objectives with risks and mitigating controls. The system has been
upgraded in two important services of the Fund and is going to be enhanced in other ones.
Information Other than the Financial Statements and Auditor’s Report Thereon
Management is responsible for the other information, included in the Pension Fund Annual Report
that comprises Pension Fund Governing Board Report and Extract of Actuary’s Report on the
Fund as at 31 December 2017, apart from the financial statements and our auditor’s report thereon.
Our opinion on the financial statements does not cover the other information and we do not express
any form of assurance conclusion thereon. However, in connection with our audit of the financial
statements, our responsibility is to read the other information and, in doing so, consider whether
the other information is materially inconsistent with the financial statements or our knowledge
obtained in the audit or otherwise appears to be materially misstated. If, based on the work we
have performed, we conclude that there is a material misstatement of this other information, we
are required to report that fact. We have nothing to report in this regard.
Responsibilities of CERN Pension Fund Management and Those Charged with Governance
for the Financial Statements
CERN Pension Fund management is responsible for the preparation and fair presentation of these
financial statements in accordance with the International Accounting Standard 26 and
International Public Sector Accounting Standards, and for such internal control as the management
determines is necessary to enable the preparation of financial statements that are free from material
misstatement, whether due to fraud or error.

39 | 78
In preparing the financial statements, management is responsible for assessing the Fund’s ability
to continue as a going concern, disclosing, as applicable, matters related to going concern and
using going concern basis of accounting unless relevant authorities either intend to liquidate the
Fund or to cease operations, or has no realistic alternative but to do so.
The Fund’s management is also responsible for the use of the Fund’s financial resources in
compliance with all applicable policies, rules and regulations.
Those charged with governance are responsible for overseeing the Fund’s financial reporting
process.
Auditor’s Responsibilities of the Supreme Audit Office of Poland (NIK) for the Audit of the
Financial Statements
Our objectives are to obtain reasonable assurance about whether the financial statements as
a whole are free from material misstatement, whether due to fraud or error, and to issue an
auditor’s report that includes our opinion. Reasonable assurance is a high level of assurance, but
is not a guarantee that an audit conducted in accordance with ISSAIs will always detect
a material misstatement when it exists. Misstatements can arise from fraud or error and are
considered material if, individually or in the aggregate, they could reasonably be expected to
influence the economic decisions of users taken on the basis of these financial statements.
Our objective is also to express an audit opinion on compliance of respective CERN Pension Fund
authorities with the CERN and CERN Pension Fund all applicable policies, rules and regulations
as regards making use of financial resources of the Fund.
As part of an audit in accordance with ISAs, we exercise professional judgment and maintain
professional scepticism throughout the audit. We also:
• Identify and assess the risks of material misstatement of the financial statements, whether due
to fraud or error, design and perform audit procedures responsive to those risks, and obtain
audit evidence that is sufficient and appropriate to provide a basis for our opinion. The risk of
not detecting a material misstatement resulting from fraud is higher than for one resulting from
error, as fraud may involve collusion, forgery, intentional omissions, misrepresentations, or the
override of internal control.
• Obtain an understanding of internal control relevant to the audit in order to design audit
procedures that are appropriate in the circumstances, but not for the purpose of expressing an
opinion on the effectiveness of the Fund’s internal control.
• Evaluate the appropriateness of accounting policies used and the reasonableness of accounting
estimates and related disclosures made by management.
• Conclude on the appropriateness of management’s use of the going concern basis of
accounting and, based on the audit evidence obtained, whether a material uncertainty exists
related to events or conditions that may cast significant doubt on the Fund’s ability to continue
as a going concern. If we conclude that a material uncertainty exists, we are required to draw
attention in our auditor’s report to the related disclosures in the financial statements or, if such
disclosures are inadequate, to modify our opinion. Our conclusions are based on the audit
evidence obtained up to the date of our auditor’s report. However, future events or conditions
may cause the Fund to cease to continue as a going concern.
• Evaluate the overall presentation, structure and content of the financial statements, including
the disclosures, and whether the financial statements represent the underlying transactions and
events in a manner that achieves fair presentation.
We communicate with those charged with governance regarding, among other matters, the
planned scope and timing of the audit and significant audit findings, including any significant
deficiencies in internal control that we identify during our audit.

40 | 78
We also provide those charged with governance with a statement that we have complied with
relevant ethical requirements regarding independence, and to communicate with them all
relationships and other matters that may reasonably be thought to bear on our independence, and
where applicable, related safeguards.
From the matters communicated with those charged with governance, we determine those matters
that were of most significance in the audit of the financial statements of the current period and are
therefore the key audit matters. We describe these matters in our auditor’s report unless law or
regulation precludes public disclosure about the matter or when, in extremely rare circumstances,
we determine that a matter should not be communicated in our report because the adverse
consequences of doing so would reasonably be expected to outweigh the public interest benefits
of such communication.
18 May 2018
Supreme Audit Office
ul. Filtrowa 57
Warsaw, Poland

41 | 78
IV. Financial Statements
1. Statement of Financial Position
**Extract of Actuary’s Report – see section VI
(in kCHF) Note 2017 2016
Assets
Cash and Cash Equivalents 5 439,738 351,160
Short-Term Deposits 6 108,505 103,600
Settlements Receivable 79,486 32,120
Sundry Debtors 7 3,765 3,612
Other Receivables 8 4,981 5,652
Derivatives 9 41,157 28,420
Bonds 10 958,177 938,358
Equities 11 634,226 727,315
Investment Funds 12 1,230,061 1,177,320
Total Financial assets 3,500,096 3,367,557
Investment Property 13 824,478 764,399
Total Non-Financial assets 824,478 764,399
Total assets 4,324,574 4,131,956
Liabilities
Settlements Payable 2,359 1
Sundry Creditors 14 15,107 14,642
Other Payables 15 3,632 3,214
Derivatives 9 44,831 54,147
Total liabilities 65,929 72,004
Net assets available for benefits 4,258,645 4,059,952
(in kCHF) Note 2017 2016
Vested pension capital **
Transfer values of active members or current value of deferred
pensions (without future adjustment) 5,033,870 5,030,941
Mathematical reserves of the beneficiaries 5,225,386 5,134,845
Vested pension capital 10,259,256 10,165,786
Technical deficit (6,000,611) (6,105,834)
Funding Ratio 41.5% 39.9%
As at 31 December
As at 31 December

42 | 78
2. Statement of Financial Performance
(in kCHF) Note 2017 2016
Investment Income
Financial Assets
Dividend Income 40,100 37,129
Interest Income 16 24,962 26,150
Unrealised Gains/(Losses) on Financial Assets at Fair Value Through Profit & Loss 17 233,795 63,887
Realised Gains/(Losses) on Financial Assets at Fair Value Through Profit & Loss 18 21,729 (74,595)
Non-Financial Assets
Investment Property Income 19 140,266 28,901
Foreign Exchange Gains/(Losses) 20 (131,165) 14,996
Total Investment Income/(Loss) 329,687 96,468
Investment Expenses
Financial Assets
Investment Management Fees 21 22,170 22,269
Custody Fees and Administration of Securities 1,296 1,291
Transaction Costs 1,349 2,357
Taxation 165 196
Non-Financial Assets
Investment Property Expenditure 22 10,636 8,901
Investment Related Expenditure 3,635 3,348
Total Investment Expenses 39,251 38,362
Net Investment Income/(Loss) 290,436 58,106
Other Expenses
Bank Charges 100 55
Other Financial Expenses 23 2,789 1,933
Administration Costs 24, 26 5,518 5,357
Total Other Expenses 8,407 7,345
Change in Net Assets before Membership Activities 282,029 50,761
Membership Activities 25
Contributions
Member Contributions 61,625 59,307
Employer Contributions 113,124 110,159
Employer Special Contributions 61,300 61,300
Purchase of additional years of membership 2,656 2,113
Indemnities received from third parties 289 506
Compensations 27 1,186 1,065
Procurement of entitlement to pension for surviving spouse 61 65
Total Contributions 240,241 234,515
Benefits and Payments
Retirement pensions 251,452 252,302
Disability pensions 2,661 2,581
Surviving spouse pensions 41,162 39,323
Orphans pensions 1,417 1,319
Family allowances 14,391 14,671
Ex gratia payments granted 66 66
Transfer values paid to members 12,028 7,365
Transfer values paid to other schemes 232 357
Contributions paid to other schemes 166 149
Total Benefits and Payments 323,577 318,133
Net Membership Activities Cost (83,336) (83,618)
Net Increase/(Decrease) in Net Assets During Year 198,693 (32,857)
Net Assets Available for Benefits at Beginning of Year 4,059,952 4,092,809
Net Assets Available for Benefits at End of Year 4,258,645 4,059,952
Year ended 31 December

43 | 78
3. Cash Flow Statement
*Re-stated
(in kCHF) Note 2017 2016
Cash flows from membership activities
Contributions and other receipts 239,931 234,355
Benefits and other payments (321,961) (321,093)
Net cash flows from membership activities (82,030) (86,738)
Cash flows from investing activities 28
Financial Assets
Purchases of Short-Term Deposits (104,610) (54,115)
Purchases of Bonds (1,156,030) (1,260,170)
Purchases of Equities (500,374) (667,528)
Purchases of Investment Funds (313,979) (562,494)
Proceeds of Short-Term Deposits 104,610 54,115
Proceeds from sale of Bonds 1,179,454 1,307,573
Proceeds from sale of Equities 660,923 454,958
Proceeds from sale of Investment Funds 380,420 610,541
Net payments from Derivatives (199,408) 2,555 *
Dividends received 40,590 36,071
Interest received 20,489 23,847
Non-Financial Assets
Investment Property payments (16,683) (15,598)
Investment Property purchases - -
Proceeds from sale of Investment Property 44,812 39,906
Investment Property receipts 41,160 44,642
Tax reimbursements 75 120
Management and Custody Fees paid (5,751) (7,222)
Administrative and other Operating expenses paid (10,683) (10,922)
Net cash flows from investing activities 165,015 (3,721)
Net (decrease) increase in cash and cash equivalents 82,984 (90,458)
Cash at beginning of the year 351,160 440,915
Exchange gains /(losses) on cash and cash equivalents 5,594 703 *
Cash at end of the year 439,738 351,160
Year ended 31 December

44 | 78
4. Statement of Changes in Net Assets Available for Benefits
(in kCHF) Note 2017 2016
Balance as at 1 January 4,059,952 4,092,809
Employer Contributions 113,124 110,159
Member Contributions 61,625 59,307
Employer Special Contributions 61,300 61,300
Purchase of additional years 2,656 2,113
Indemnities and Compensations 1,475 1,571
Procurement of Entitlement to pension for surviving spouse 61 65
Benefits paid (311,151) (310,262)
Transfer values and contributions paid (12,426) (7,871)
Investment Income/(Loss) 329,687 96,468
Investment Expenses (39,251) (38,362)
Other Expenses (8,407) (7,345)
Balance as at 31 December 4,258,645 4,059,952

45 | 78
V. Notes to the Financial Statements
1. General Information .................................................................................................................. 46
2. Summary of Significant Accounting Policies ........................................................................ 49
3. Critical Accounting Estimates and Judgements ................................................................. 55
4. Financial Risks ............................................................................................................................. 58
5. Cash and Cash Equivalents ..................................................................................................... 67
6. Short-Term Deposits ................................................................................................................... 67
7. Sundry Debtors ........................................................................................................................... 67
8. Other Receivables ..................................................................................................................... 67
9. Derivatives ................................................................................................................................... 68
10. Bonds ............................................................................................................................................ 68
11. Equities ......................................................................................................................................... 68
12. Investment Funds ....................................................................................................................... 69
13. Investment Property .................................................................................................................. 69
14. Sundry Creditors ......................................................................................................................... 69
15. Other Payables........................................................................................................................... 70
16. Interest Income .......................................................................................................................... 70
17. Unrealised Gains/(Losses) on Financial Assets at Fair Value through Profit & Loss ........ 70
18. Realised Gains/(Losses) on Financial Assets at Fair Value through Profit & Loss ........... 71
19. Investment Property Income ................................................................................................... 71
20. Foreign Exchange Gains/(Losses) ........................................................................................... 72
21. Investment Management Fees ............................................................................................... 72
22. Investment Property Expenditure ........................................................................................... 73
23. Other Financial Expenses ......................................................................................................... 73
24. Administration Costs .................................................................................................................. 73
25. Membership Activities ............................................................................................................... 73
26. Related-Party Transactions ...................................................................................................... 74
27. Compensations .......................................................................................................................... 74
28. Cash Flow Statement ................................................................................................................ 74
29. Events after the Balance Sheet Date .................................................................................... 74

46 | 78
1. General Information
1.1. Fund description
Under Chapter IV of the CERN Staff Rules and Regulations, the European Organization for Nuclear
Research (CERN), which has its seat in Geneva, is responsible for the social insurance coverage of its
staff. Thus it set up in 1955 a pension fund which constitutes the CERN personnel’s social protection for
disability, old age and death.
The governance structure of the Fund and its relations with the Council and the Director General of CERN
are defined in the Rules of the Pension Fund (“the Rules,” available at: http://pensionfund.cern.ch). The
Rules and Regulations of the Fund are approved by CERN Council.
The Rules state that “The purpose of the Fund is to insure its members and beneficiaries as well as the
members of their families against the economic consequences of the disability and old age of its members
and of the death of its members and beneficiaries” (Art. I 1.01).
With respect to the status of the Fund within the Organisation, according to the Rules, “The Fund is an
integral part of CERN, and, as such, has no separate legal personality and is under the supreme authority
of Council” (Art. I 2.01). As well, “The Fund shall enjoy operational autonomy within CERN and shall be
managed independently through bodies referred to in Article I 2.04, paragraph 1, of the Rules”. Article I
2.04, paragraph 1, states that “the management of the Fund shall be entrusted to the following bodies:
a) the Governing Board
b) the Fund’s Chief Executive Officer.”
The Rules also provide that the bodies of the Fund shall be assisted by:
a) the Investment Committee (PFIC), subsidiary and expert body of the Governing Board on investment
matters;
b) the Actuarial and Technical Committee (ATC), subsidiary and expert body of the Governing Board on
actuarial and technical matters.
Article I 2.03 of the Rules further provides that the assets of the Fund shall be held separately from those
of CERN and shall be used solely for the purpose of the Fund.
The Fund operates as a defined-benefit scheme. The members of the personnel of CERN and the members
of the personnel of the European Southern Observatory (ESO), which has its seat in Munich, are members
of the CERN Pension Fund. Conditions relating to the admission of ESO staff to the Fund are defined in
the Fund’s Rules and Regulations and the CERN/ESO Agreement.
Pensions are calculated in the following manner:
i. For members who joined the Fund on or before 31 December 2011, 2% of the Basis for the
Calculation of Benefits, as set out in Article II 1.08 of the Rules, for each year of membership, up
to a maximum of 35 years;
ii. For members who joined the Fund on or after 1 January 2012, 1.85% of the Basis for the
Calculation of Benefits, as set out in Article II 1.08, of the Rules, for each year of membership, up
to a maximum of 37 years and 10 months.

47 | 78
The retirement age is as follows:
i. For members who joined the Fund on or before 31 December 2011: 65 years;
ii. For members who joined the Fund on or after 1 January 2012: 67 years.
The entitlement to a pension begins after a minimum of five years’ contributions.
1.2. Funding arrangements
According to the Rules, the resources of the Fund derive from (a) contributions from CERN and ESO, (b)
contributions from its members, (c) the income from the investment of its assets, and (d) gifts and legacies.
The contributions are expressed as a percentage of each member's reference salary, which is equal to the
basic remuneration for 40 hours’ work per week multiplied by a coefficient set out in Annex A to the Rules.
Contributions are apportioned between the member and the participating Organizations as follows:
i. For members who joined the Fund on or before 31 December 2011: member: 11.33%;
Organization: 22.67%; total: 34%;
ii. For members who joined the Fund on or after 1 January 2012: member: 12.64%; Organization:
18.96%; total: 31.6%.
1.3. Termination terms
When membership of the Fund terminates before the applicable age of retirement for a reason other than
death or total incapacity, a transfer value is calculated on the basis of the reference salary at the date of
termination:
i. Less than five years of service: where the member has less than five years of service, the transfer
value is paid into another pension scheme, or, at his request, to the member himself;
ii. Between five and ten years of service: the member has the choice between a deferred retirement
pension, or payment into another pension scheme, or, if the latter option is not possible, to himself;
iii. Ten or more years of service: the member has the choice between a deferred retirement pension,
and payment into another pension scheme, or, if the latter option is not possible, into a private
insurance scheme offering comparable guarantees.
Payment of a transfer value extinguishes any right to a pension, except that for partial disability that is
already being paid.

48 | 78
1.4. Significant Activities for the period
There were no significant activities during the year.
1.4.1. Beneficiaries
As at 31 December 2017 the number of beneficiaries was 3,631 (3,610 as at 31 December 2016),
representing an increase of 0.6%.
1.4.2. Members
As at 31 December 2017 the number of members of the Fund was 3,916 (CERN: 3,440 and ESO: 476)
compared to 3,767 (CERN: 3,310 and ESO: 457) as at 31 December 2016. This represents an increase of
4%.
1.5. Investment policy
The Fund’s principles governing the investment policy are set out in the Statement of Investment Principles
and Investment Policy (SIP) CERN/PFGB/66.8/Rev.3/A which is approved by the PFGB.
The Fund strives to maximise returns while remaining below a maximum level of risk. The maximum level
of allowable risk is referred to as the “risk limit”.
The Fund’s portfolio is constructed and managed with the objective of remaining at all times within the risk
limits approved by the PFGB, while striving to attain the Fund’s investment return objective.
When selecting and managing investments, the Fund considers adapting the time horizon to the market
conditions or to the circumstances of the Fund. In addition, the requirement for active management and
the sensitivity of the risk and return to market cycles are also considered.
The Fund may invest in a wide range of asset classes including listed equity, government and non-
government debt, currencies, money market instruments, property, commodities, private equity/debt. The
Fund may also invest in strategies with absolute return focus. Investments may be undertaken directly
(internally), or indirectly (e.g. via funds or investment agreements), in physical assets or derivatives.

49 | 78
2. Summary of Significant Accounting Policies
2.1. Basis of preparation
The CERN Pension Fund Financial Statements for the financial year ended 31 December 2017 have been
prepared on a going-concern basis and pursuant to Article I 4.02 of the Rules of the Pension Fund, in
accordance with International Public Sector Accounting Standards (IPSAS) and International Accounting
Standard 26, Accounting and Reporting by Retirement Benefit Plans, as there is no such equivalent IPSAS.
The preparation of financial statements in conformity with IPSAS requires the use of certain critical
accounting estimates. It also requires the Fund to exercise its judgement in the process of applying the
Pension Fund’s accounting policies. The areas involving a higher degree of judgement or complexity, or
areas where assumptions and estimates are significant to the financial statements are disclosed under
note 3. If such estimates and assumptions deviate from the actual circumstances, the original estimates
and assumptions will be modified as appropriate in the year in which the circumstances change.
At its meeting on 19 April 2018 the PFGB approved the submission of the CERN Pension Fund Financial
Statements for 2017 to CERN Council, via the Finance Committee, for approval and discharge.
The accounting policies set out below have been applied consistently by the Fund and throughout all
periods presented in these financial statements.
The following new standards, that are issued but not yet effective, up to the date of issuance of the Fund’s
financial statements, are disclosed below. The Fund intends to adopt these standards, if applicable, when
they become effective:
i. IPSAS 39, Employee Benefits (will replace IPSAS 25) - effective January 1, 2018.
ii. IPSAS 40, Public Sector Combinations – effective January 1, 2019.
Once effective, the above standards are not expected to have any effects on the amounts in the Statement
of Financial Position, Statement of Financial Performance, Cash Flow Statement nor the Statement of
Changes in Net Assets Available for Benefits.
2.2. Measurement base
The measurement base adopted is that of historical cost as modified by the revaluation of financial assets
and financial liabilities (including derivative financial instruments) and investment property at fair value
through profit or loss.

50 | 78
2.3. Foreign currency translation
2.3.1. Functional and presentation currency
Pursuant to Article I 4.02 of the Rules of the Pension Fund, the unit of account of the Pension Fund is the
Swiss franc which is the functional and presentation currency.
2.3.2. Transaction and balances
At each balance sheet date monetary assets and liabilities that are denominated in foreign currencies are
translated into Swiss francs at the exchange rates ruling on that date. Foreign currency transactions are
accounted for at the exchange rates prevailing at the date of the transaction. Gains and losses arising on
translation are shown separately in the Statement of Financial Performance for the period.
2.4. Classification of assets and liabilities
The CERN Pension Fund is an entity that, inter alia, manages assets used to pay pensions. As such, the
assets and liabilities are disclosed in the Statement of Financial Position in an order that broadly reflects
their relative liquidity.
2.5. Cash and cash equivalents
Cash and cash equivalents include cash in hand, deposits held at call with banks and other short-term
highly liquid investments with original maturities of three months or less, as well as margin accounts with
brokers that cover margin calls on derivative positions.
2.6. Financial assets
Financial assets are recognised on the Fund’s Statement of Financial Position when the Fund becomes a
party to the contractual provisions of the instrument.
The Fund classifies its financial assets in the following categories: at fair value through profit or loss and
loans and receivables. The classification depends on the purpose for which the financial assets were
acquired. Management determines the classification of its financial assets at initial recognition.
2.6.1. Financial assets at fair value through profit or loss
The Fund’s business is investing in assets with a view to profiting from their total return in the form of
interest, dividends, distributions and increases in fair value.

51 | 78
A. Classification
The Fund classifies its investments in debt, equity securities, investment funds and derivatives as financial
assets at fair value through profit or loss. Bonds, equities and investment funds are designated by the Fund
at fair value through profit or loss. Derivatives are classified as assets held for trading.
The portfolio of investment funds, private equity and private debt investments are categorized as financial
assets designated at fair value through profit or loss at inception and are shown under Investment Funds
on the Statement of Financial Position.
B. Recognition and derecognition
Purchases and sales of unquoted and quoted investments are recognised and derecognised on trade date
where a purchase or sale is made under a contract whose terms require delivery within the timeframe
established by the market concerned.
Financial assets are derecognised when the rights to receive cash flows from the investments have expired
or have been transferred and the Fund has transferred substantially all risks and rewards of ownership.
C. Measurement
Financial assets at fair value through profit or loss are initially recognised at acquisition cost. Transaction
costs are expensed in the Statement of Financial Performance. Subsequent to initial recognition, all
financial assets at fair value through profit or loss are measured at fair value which is based on the last
reported bid price (sales price) at the balance sheet date. Unrealised gains and losses arising from changes
in the fair value of the “financial assets at fair value through profit or loss” category are presented in the
Statement of Financial Performance in the period in which they arise.
Interest, dividends and investment management fees arising from financial assets are shown separately in
the Statement of Financial Performance and are not included in Unrealised or Realised Gains/(Losses) on
Financial Assets at Fair Value Through Profit and Loss.
2.6.2. Loans and receivables
Loans and receivables are non-derivative financial assets with fixed or determinable payments that are not
quoted in an active market. Sundry debtors include recoverable withholding tax levied at source on
dividends and reimbursable value added tax paid on investment property transactions, investment property
debtors and other due amounts.
Settlements receivable represent amounts due to the Fund for securities sold that have been contracted
for but not yet settled or delivered at the balance sheet date.
Other receivables include accrued interest on cash and short-term deposits, dividends receivable and
outstanding receipts.
These amounts which do not carry any interest are expected to be received within twelve months and are
accordingly stated at their nominal value. Loans and receivables are subsequently carried at amortised
cost using the effective interest method less any impairment losses.

52 | 78
2.7. Impairment of financial assets
Financial Assets carried at amortised costs are Loans and Receivables.
The Fund assesses at the end of each reporting period whether there is objective evidence that this group
of financial assets is impaired. A financial asset or a group of financial assets is impaired and impairment
losses are incurred only if there is objective evidence of impairment as a result of one or more events that
occurred after the initial recognition of the asset (a “loss event”) and that loss event (or events) has an
impact on the estimated future cash flows of the financial asset or group of financial assets that can be
reliably estimated.
Evidence of impairment may include indications that the debtors or a group of debtors is experiencing
significant financial difficulty, default or delinquency in interest or principal payments, the probability that
they will enter bankruptcy or other financial reorganisation, and where observable data indicates that there
is a measureable decrease in the estimated future cash flows, such as changes in arrears or economic
conditions that correlate with defaults.
For loans and receivables, the amount of loss is measured as the difference between the asset’s carrying
amount and the present value of the estimated future cash flows (excluding future credit losses that have
been not been incurred) discounted at the financial asset’s original effective interest rate. The carrying
amount of the asset is reduced and the amount of the loss is recognised in the Statement of Financial
Performance.
2.8. Offsetting financial instruments
Financial assets and liabilities are offset and the net amount reported in the Statement of Financial Position
when there is a legally enforceable right to offset the recognised amounts and there is an intention to settle
on a net basis or realise the asset and settle the liability simultaneously.
2.9. Non-financial assets
Those assets where there is no contractual right to receive cash or another financial asset are listed under
this heading.
2.9.1. Investment property
Investment property is defined as land, buildings and forests held to earn rental income and capital
appreciation and is not occupied by the Fund.
Investment property is measured initially at its cost, including related transaction costs. After initial
recognition investment property is carried at fair value, representing open market value determined
annually by external valuators with professional qualifications and experience. Fair value is based on active
market prices, adjusted, if necessary, for any difference in the nature, location or condition of the specific
asset. If the information is not available, the Fund uses alternative valuation methods such as recent prices
on less active markets or discounted cash flow projections. Changes in fair values are recorded in the
Statement of Financial Performance, as part of Investment Property Income.
The costs of the day-to-day running of the properties, e.g. repairs and maintenance, are recognised in the
Statement of Financial Performance as incurred. Expenditure incurred in the replacement or renovation of
part of an existing investment property that is 5% or more of the value of that property is recognised in the
carrying amount, only when it is probable that future economic benefits associated with the item will flow
to the Fund and the cost of the item can be reliably measured.

53 | 78
2.10. Other financial liabilities
Other financial liabilities include Settlements Payable, Sundry Creditors and Other Payables.
Settlements payable represent amounts due by the Fund for securities purchased that have been
contracted for but not yet settled or delivered at the balance sheet date.
These amounts are not interest-bearing and are due within twelve months. They are initially recognised at
their fair value and subsequently measured at amortised cost using the effective interest method.
2.11. Derivative financial instruments and hedging activities
The Fund's activities expose it to the financial risks such as foreign currency risk, interest rate risk and
credit risk. Therefore the Fund may use derivative instruments such as foreign exchange forward contracts,
interest rate swap contracts and credit default swaps to hedge these exposures. The Fund may also use
derivative instruments for investment purposes, principally to gain exposure to specific markets.
Derivatives are initially recognised at fair value on the date on which a derivative contract is entered into
and are subsequently re-measured at fair value. Any gains and losses arising from changes in the fair value
are recognised in the Statement of Financial Performance. The Fund does not apply hedge accounting.
Derivatives are carried as financial assets when the fair value is positive and as financial liabilities when
the fair value is negative.
The Fund may, at a given time, hold the following derivative instruments:
A. Forward contracts
Forward contracts are contractual obligations to buy or sell financial instruments on a future date at a
specified price. A forward contract is a non-standardised contract written by the Fund and the counterparty
to the agreement. The contracts are collateralised by cash and changes in the forward contracts’ value are
settled on reset, rollover or closure of the contract. The forward contracts are settled on a gross basis.
B. Options
An option is a contractual arrangement under which the seller (writer) grants the purchaser (holder) the
right, but not the obligation, either to buy (a call option) or sell (a put option) at or by a set date or during a
set period, a specific amount of securities or a financial instrument at a predetermined price. The seller
receives a premium from the purchaser in consideration for the assumption of the future securities price.
Options are settled on a gross basis.
C. Swaps
Swaps are contracts to exchange cash (flows) on or before a specified future date based on the underlying
value of currencies/exchange rates, bonds/interest rates, commodities, stocks or other assets.
D. Futures
Future contracts are contractual obligations to buy or sell financial instruments on a future date at a
specified price established in an organised market. The futures contracts are collateralised by cash and
changes in the futures contracts’ value are settled daily with the exchange. Futures are settled on a net
basis.

54 | 78
E. Credit default swaps
Credit default swaps are contractual obligations under which the seller receives a premium or interest-
related payments in return for agreeing to compensate the buyer in the event of a credit event on an
underlying reference obligation. Credit events usually include bankruptcy and payment default.
2.12. Provisions
Provisions are recognised when the Fund has a present obligation (legal or constructive) as a result of a
past event, it is probable that an outflow of resources embodying economic benefits or service potential
will be required to settle the obligation and a reliable estimate can be made of the amount of the obligation.
2.13. Actuarial liabilities
The PFGB approves the significant actuarial assumptions for the calculation of the actuarial present value
of promised retirement benefits at the end of the period, taking advice from an independent actuary
concerning the appropriateness of the assumptions. The actuarial present value of promised retirement
benefits at the end of the period is included in the Statement of Financial Position under the heading
“Vested pension capital”.
The actuarial present value of the promised retirement benefits, based on projected salaries and capitalised
pension indexation, is disclosed to indicate the magnitude of the potential obligation on a going concern
basis.
In accordance with IAS 26, the actuarial method used to calculate the actuarial commitments is the
projected unit credit method (PUC method). The projected unit credit method considers that each service
period allows for an additional unit of benefits rights and evaluates each of these units separately to obtain
the final value of the liability.
2.14. Revenue recognition
2.14.1. Revenue from exchange transactions
i. Interest income is recognised on time proportionate basis using the effective interest method;
ii. Rental income is recognised over the term of the lease on a straight line basis;
iii. Dividend income is recognised when the right to receive payment is established.
2.14.2. Revenue from non-exchange transactions
The Fund does not recognise revenue from non-exchange transactions. Non-exchange transactions
include administrative support and office accommodation provided free of charge by CERN.

55 | 78
3. Critical Accounting Estimates and Judgements
The Fund makes estimates and assumptions that affect the reported amounts of assets and liabilities.
Estimates and judgements are continually evaluated by the Fund, with input from independent experts, and
are based on historical experience and other factors, including assumptions about future events that are
believed to be reasonable under the circumstances. The resulting accounting estimates will, by definition,
seldom equal the related actual results.
The most significant estimates made during the period are outlined below. The Fund has not been required
to make any significant judgements for the financial years 2017 and 2016.
3.1. Actuarial assumptions
The liabilities of the Fund, in respect of promised benefits to be paid, have been determined using methods
relying on actuarial estimates and assumptions. These assumptions reflect the long-term nature of future
benefits. Changes in these estimates and assumptions could materially affect liabilities in respect of
benefits.
The basis for the Fund’s actuarial assumptions is set out under note 2. “Summary of Significant Accounting
Policies”.
The table hereafter shows the significant actuarial assumptions proposed by the Fund’s Actuary and
approved by the PFGB at its meeting of 22 February 2018 (CERN/PFGB/73.3) and also those used in the
corresponding period. The reference discount rate is the interest rate on long-term Swiss Confederation
Bonds, however, the principle that the discount rate should not fall below the best estimate of future inflation
has been applied in 2017. The best estimate of future inflation is 1.38%. As a result the discount rate
applied for 2017 is 1.38% (1.37% in 2016).
*The underlying best estimate assumption has the following term structure: 1% p.a. until 2024, 1.50% p.a. from 2025 and is unchanged from 31 December 2016. The single equivalent spot rate describes this underlying term structure.
Conduent HR Services (Buck Consultants Limited), London is the Fund’s Actuary. An extract of the
Actuary’s Report on the Fund as at 31 December 2017 is included in section VI for information purposes.
In 2017, the Fund’s Actuary did not propose changes to the actuarial assumptions compared to 2016 and
these were accepted by the PFGB.
Total liabilities, as at 31 December 2017, were 10,259 MCHF (10,166 MCHF as at 31 December 2016).
Actuarial Assumptions 2017 2016
Discount Rate 1.38%* 1.37%*
Future Salary Increase 1.38%* 1.37%*
Future Pension Increase 1.38%* 1.37%*
Salary Advancement 1.50% 1.50%
Life Expectancy 83% VZ 2010 GEN 83% VZ 2010 GEN

56 | 78
3.2. Fair value of Investment Property
The fair value of the Fund’s investment property is considered to be its market value. As at 31 December
2017 the fair value of Investment Property was 824,478 kCHF (764,399 kCHF as at 31 December 2016).
The fair values of the Investment Property were determined based on valuations performed by independent
valuers, as at 31 December 2017 and 2016. The fair values of the properties (excluding the forests) have
been determined using a sales comparison approach, where possible, and supported by a discounted cash
flow method, in order to arrive at the most reliable estimate of the fair value within a range of reasonable
fair value estimates. The independent valuers use assumptions that are mainly based on market conditions
existing at each balance sheet date. The fair values of the forests have been determined by an expert in
the forest industry, using market practice for valuing forest land i.e. taking into account current market
prices for forest land and inventory.
The principal considerations underlying the estimation of fair value are those related to:
Current or recent prices of similar properties;
Appropriate discount rates ranging from 3.48% to 5.75% (3.55% to 5.75% in 2016);
The receipt of contractual rentals;
Expected future market rentals;
Void periods;
Maintenance requirements;
Current market prices for forest inventory.
These valuations are regularly compared to actual market yield data, and actual transactions and those
reported by the market. The expected future market rentals are determined on the basis of current market
rentals for similar properties in the same location and condition.
3.3. Fair value of financial assets not quoted in an active market
In arriving at the fair value of financial assets not quoted in an active market, the Fund considers factors
such as industry performance, company performance, quality of management, the price of the most recent
financing round, exit opportunities which are available, liquidity preference, comparable market
transactions, discounted cash-flows, earnings multiples and net present value analysis. The maximum use
of market inputs is made with as little reliance as possible on entity-specific inputs.
3.3.1. Investment Funds
The Fund holds positions in investment funds, many of whom have the same reporting period as the Fund.
Consequently, in some cases, audited financial statements attesting, inter alia, to the value of the Fund’s
investments in these funds were not available at the reporting date. Where audited statements were not in
evidence, the Fund used unaudited statements as at 31 December 2017 provided by the independent
administrators or fund. In the case of seventy four private equity/debt funds (fifty three in 2016) unaudited
statements as at 30 September 2017 were used, as adjusted for capital movements between the last
received statements and 31 December 2017.

57 | 78
As at 31 December 2017 the Fund had holdings in investment funds totalling 641,105 kCHF
(625,600 kCHF in 2016) that are not quoted in an active market. Valuations totalling 507,998 kCHF
(526,617 kCHF in 2016) were based on unaudited statements. These holdings are included in note 12
“Investment Funds”.
The Fund has the following outstanding commitments to Private Equity, Real Estate and Private Debt funds
as at 31 December:
3.3.2. Over- the-counter derivatives instruments
The fair value of over-the-counter derivatives instruments is determined using quoted prices at the balance
sheet date. When an instrument or its equivalent does not have a market price, its valuation is determined
using a valuation model that is based on observable market inputs.
(in kCHF)
Total Net
Asset Value
Outstanding
Commitment
Total Net
Asset Value
Outstanding
Commitment
European Private Equity 114,633 64,744 82,673 43,457
US Private Equity 91,381 46,527 82,107 59,157
Private Debt 136,074 24,283 55,981 30,477
Real Estate funds 60,778 737 31,340 29,709
Total 402,866 136,291 252,101 162,800
2017 2016
58 | 78
4. Financial Risks
4.1. Financial risk factors
The Pension Fund’s activities expose it to a variety of financial risks: market risk (including price risk, foreign
exchange risk, interest rate risk), credit risk and liquidity risk. The Fund’s overall risk management
programme seeks to maximise the returns derived for the level of risk to which the Fund is exposed and
seeks to minimise potential adverse effects on the Fund’s financial performance. The Fund uses derivative
financial instruments to both hedge and to create certain risk exposures.
All securities investments present a risk of loss of capital. The maximum loss of capital on bonds, equities,
investment funds and purchased options is limited to the fair value of those positions. The maximum loss
of capital on written put options, long futures and forward currency contracts is limited to the notional
contract values of those positions. On written call options and short future positions the maximum loss of
capital can be unlimited.
The management of these risks is carried out by the Fund in line with investment guidelines approved by
the Investment Committee. The Fund uses different methods to measure and manage the various types of
risk to which it is exposed; these methods are explained below.
4.1.1. Market risk
The risk management policy of the Fund is defined in the Statement of Investment Principles and
Investment Policy. It is based on setting a risk measure, an annual risk limit and managing the asset
allocation exposure compatible with the risk limit and with the return objective.
The Fund uses CVaR (Conditional Value at Risk) to measure and monitor its market risk. The CVaR of a
certain confidence level measures the expected return of the corresponding tail of the return distribution. 1
Year 5% CVaR is defined as the annual expected return in the worst 5% of the return distribution of a
portfolio. CVaR is also called expected shortfall.
The risk measure of 1 Year 5% CVaR is approved by the PFGB, based on the recommendation of the
PFIC. The annual 1 Year 5% CVaR risk limit of -8% for 2017 was set by the PFGB taking into account the
actuarial return considerations. The risk exposure of the Strategic Asset Allocation (SAA) and the Fund is
estimated and reported to the PFIC by the independent risk consultant on a quarterly basis and compared
to the risk limit set by the PFGB. In addition the Fund’s Risk Manager monitors the expected risk relative
to the risk limit on a daily basis using reports provided by the Fund’s Custodian.
During 2017 all quarterly evaluations of the estimated 1 Year 5% CVaR showed that the Fund was within
the risk limit. As at 31 December 2017 the estimated 1 Year 5% CVaR of the Fund was -7.1% (-7.1% as at
31 December 2016), according to data provided by the Fund’s independent risk consultant (and not the
data included in these Financial Statements).
A. Price risk
The Fund is exposed to securities and derivative price risk. This arises from investments held by the Fund
for which prices in the future are uncertain. Where assets of the Fund are denominated in currencies other
than the Swiss franc, the price initially expressed in foreign currency and then converted into Swiss franc
will also fluctuate because of changes in foreign exchange rates. Paragraph B: “Foreign exchange risk”
sets out how this component of price risk is managed and measured.

59 | 78
Some of the Funds’ financial assets and liabilities are exposed to market price risk. The fair value of these
assets as at 31 December is as follows:
B. Foreign exchange risk
The Fund is exposed to foreign exchange risks arising essentially upon investments in assets denominated
in foreign currencies as outlined in the table below. As a general policy, the Fund hedges its exchange rate
risk to the level of 100% of its exposure, but may alter the hedge ratios depending on tactical
considerations. The Fund uses three month rolling forward foreign exchange contracts and currency
options to cover the currency exposure of existing and anticipated investments in foreign currency. The
value of currency forward contracts as at 31 December 2017 is disclosed in note 9. “Derivatives”.
As at 31 December 2017, given a shift of 10% in foreign currency rates against the Swiss Franc with all
other variables held constant, the Statement of Financial Performance would have shown a higher/lower
result of 36,618 kCHF (27,575 kCHF as at 31 December 2016).
The table below summarises the Fund’s net assets that are denominated in a currency other than the Swiss
franc. The table excludes the forward foreign exchange contracts that are used to hedge foreign exchange
rate exposure:
The Fund uses year-end exchange rates supplied by its custodian. The source of these rates is Reuters
World Markets.
(in kCHF) 2017 2016
Assets
Bonds 958,177 938,358
Equities 634,226 727,315
Investment Funds 1,230,061 1,177,320
Derivatives 41,157 28,420
Total Financial assets 2,863,621 2,871,413
Liabilities
Derivatives 44,831 54,147
Total Financial liabilities 44,831 54,147
(in kCHF) 2017 2016
US dollar 1,569,926 1,606,500
Euro 1,712,912 1,425,197
Pound sterling 421,516 491,647
Japanese yen 133,133 94,774
Swedish krona 30,107 27,581
Other currencies 53,801 33,538
Total 3,921,395 3,679,237

60 | 78
The table below shows the rates used by the Fund at 31 December to covert the major currencies in the
Fund’s portfolio to the Swiss franc:
C. Cash flow and fair value interest rate risk
Fair value interest rate risk arises from the effects of fluctuations in the prevailing levels of market interest
rates on the fair value of financial assets and future cash flows. The Fund holds some fixed income
investments and cash on short-term deposits. The duration of the fixed income investments is regulated
by investment guidelines. The Fund may use derivatives to hedge interest rate exposure.
The analysis below summarises the maturity range of the Fund’s principal fixed income portfolio at 31
December and is a measure of the sensitivity of the fair value of the Fund’s fixed interest securities to
changes in market interest rates:
The duration of the above securities, which is the weighted-average term to maturity of the cash flows, was
7.14 years at 31 December 2017 (2016: 6.09 years).
The following table indicates the Fund’s exposure to fair value interest rate risk in respect of cash and short-
term deposits:
The Fund also holds cash, a limited number of floating rate debt and derivatives that expose the Fund to
cash flow interest rate risk.
As at 31 December 2017, if interest rates on these investments had been 1% higher with all other variables
held constant, the net assets available for benefits at the end of the year would have been higher by
4,858 kCHF (4,688 kCHF higher as at 31 December 2016).
Currency 2017 2016
Euro 1.1701 1.0719
Pound sterling 1.3182 1.2558
US dollar 0.9745 1.0164
2017 2016
Global Fixed Income 958 MCHF 938 MCHF
0 - 1 year 0% 0%
1 - 3 years 0% 6%
3 - 5 years 14% 24%
5 - 7 years 26% 24%
7 - 10 years 39% 31%
> 10 years 21% 15%
Total 100% 100%
(in kCHF) 2017 2016
Euro 58,505 53,600
Swiss franc 69,847 69,927
Total 128,352 123,527

61 | 78
4.1.2. Credit risk
The Fund is exposed to credit risk, which is the risk that the counterparty will be unable to pay amounts in
full when they fall due.
Credit risk arises from cash and cash equivalents short-term deposits, derivative financial instruments and
bonds, as well as credit exposures including outstanding receivables and committed transactions.
All transactions in listed securities are contracted using approved brokers and settled/paid for upon delivery.
The risk of default is considered minimal, as delivery of the securities sold is only made once the custodian
has received payment. Payment is made on a purchase once the securities have been received by the
custodian. The trade will fail if either party fails to meet its obligation.
The Fund invests in fixed income securities issued by various bodies such as governments, agencies or
corporations. These holdings are managed in line with the investment guidelines to ensure issuer quality
and diversification. In addition, the Fund limits the amount of credit exposure to any financial institution
through diversification of its counterparties and strict monitoring of open receivables on derivatives
instruments. If a derivative position is showing a profit, the Fund may ask for collateral or force the reset of
the position.
The analysis below summarises the issuer quality of the Fund’s principal fixed income portfolio at 31
December:
The maximum exposure to credit risk at 31 December is set out below:
No material financial assets were past due as at 31 December 2017.
2017 2016
Global Fixed Income 958 MCHF 938 MCHF
AAA 4% 5%
AA 21% 15%
A 17% 16%
BBB 43% 47%
BB-B 14% 16%
NR/NA 1% 1%
Total 100% 100%
Source of issuer data: provided by Custodian (minimum of Standards & Poor's and Moody's)
(in kCHF) 2017 2016
Bonds 958,177 938,358
Cash and Cash Equivalents 439,738 351,160
Private Debt 136,074 55,981 *
Short Term Deposits 108,505 103,600
Derivatives 41,157 28,420
Settlements Receivable 79,486 32,120
Other assets 8,746 9,264
Total 1,771,883 1,518,903 *
*Re-stated: Private Debt included for 2016

62 | 78
4.1.3. Liquidity risk
Liquidity risk is the risk that the Fund may not be able to generate sufficient cash resources to settle its
obligations in full as they fall due, or can only do so on terms that are materially disadvantageous. In
addition to its commitments to pay monthly benefits, the Fund is exposed to the periodic settlement of
margin calls and gains and losses on derivative positions. The hedging of exchange rate risk can generate
substantial cash flows that are difficult to predict. Therefore the Fund aims to maintain sufficient levels of
cash and cash equivalents to meet its short-term liabilities. The Fund does not take leveraged positions on
the market.
The table below analyses the Fund’s financial liabilities (excluding the derivative financial instruments in a
loss position) into relevant maturity groupings, based on the remaining period at the balance sheet date to
the contractual maturity date:
An amount of 890 kCHF as at 31 December 2016 previously classified as “Reimbursements of
Contributions” has been re-classified as “Payments Outstanding”.
*Re-stated
(in kCHF) < 7 days 1-3 months 3-12 months
As at 31 December 2017
Settlements payable
Members and Beneficiaries 5,211
Investment property deposits 3,468
Taxes Payable 457
Investment property Creditors 5,548
Reimbursements of contributions 1,074
Payments Outstanding 2,558
Total 6,285 8,563 3,468
As at 31 December 2016
Settlements payable 1
Members and Beneficiaries 3,701
Investment property deposits 3,564
Taxes Payable 684
Investment property Creditors 6,336
Reimbursements of contributions 1,162 *
Payments Outstanding 2,052 *
Total 4,864 9,072 3,564

63 | 78
The following table analyses the Fund’s derivative financial instruments in a loss position that will be settled
on a gross basis into relevant maturity groupings based on the remaining period at the balance sheet to
the contractual maturity date:
An amount of 1,382 kCHF as at 31 December 2016, previously classified as “Forwards“, has been re-
classified as “Futures“.
4.2. Fair value estimation
The fair value of financial assets traded in active markets (such as trading securities) is based on quoted
market prices at the close of trading on the reporting date.
An active market is a market in which transactions for the asset take place with a sufficient frequency and
volume to provide pricing information on an on-going basis.
The fair value of assets not traded in an active market is determined using valuation techniques. The Fund
uses a variety of methods and makes assumptions that are based on market conditions existing at each
year end date. Valuation techniques include the use of recent arm’s length transactions, reference to other
instruments that are substantially the same, discounted cash flow analysis, and option pricing models,
making maximum use of market inputs and relying as little as possible on entity-specific inputs.
The carrying amounts of the financial assets and liabilities not measured at fair value in the Statement of
Financial Position approximate their fair value.
*Re-stated
(in kCHF) 1-6 months
At 31 December 2017
Forwards 33,099
Credit default swaps 7,354
Swaps 3,536
Futures 312
Options 530
Total 44,831
At 31 December 2016
Forwards 49,188 *
Credit default swaps 2,652
Swaps 611
Futures 1,382 *
Options 314
Total 54,147

64 | 78
Specific valuation techniques used to value financial instruments include:
i. Quoted market prices or dealer quotes for similar instruments;
ii. Prices sourced from broker quotes, inter-dealer prices or other reliable pricing services;
iii. The present value of the estimated future cash flows using observable yield curves, prices and
other available market information;
iv. The latest available valuation received from fund administrators;
v. Other techniques, such as discounted cash flow analysis.
The fair value hierarchy has the following levels:
- Level 1 inputs are quoted prices (unadjusted) in active markets for identical assets that the Fund
can access at the measurement date;
- Level 2 inputs are inputs other than quoted prices included within Level 1 that are observable for
the asset or liability, either directly, or indirectly;
- Level 3 inputs are based on unobservable market inputs for the asset or liability.
The level in the fair value hierarchy within which the fair value measurement is categorised in its entirety is
determined on the basis of the lowest level input that is significant to the fair value measurement in its
entirety. For this purpose the significance of an input is assessed against the fair value measurement in its
entirety. If a fair value measurement uses observable inputs that require significant adjustment based on
unobservable inputs, that measurement is a Level 3 measurement. Assessing the significance of a
particular input to the fair value measurement in its entirety requires judgement, considering factors specific
to the asset.
The determination of what constitutes “observable” requires significant judgement by the Fund. The Fund
considers observable data to be that market data that is readily available, regularly distributed or updated,
reliable and verifiable, not proprietary, and provided by independent sources that are actively involved in
the relevant market.
The following table analyses within the fair value hierarchy the Fund’s assets measured at fair value at 31
December 2017:
(in kCHF) Level 1 Level 2 Level 3 Total
Assets
Financial assets designated at fair value through profit or loss:
Equities 634,167 - 59 634,226
Bonds - 958,177 - 958,177
Investment Funds 552,285 - 677,776 1,230,061
Sub total 1,186,453 958,177 677,834 2,822,464
Financial assets held for trading:
Derivatives 4,570 35,612 975 41,157
Sub total 4,570 35,612 975 41,157
Total assets at fair value through profit or loss 1,191,022 993,790 678,809 2,863,621
Liabilities
Financial liabilities held for trading:
Derivatives (448) (43,989) (394) (44,831)
Total liablities at fair value through profit or loss (448) (43,989) (394) (44,831)

65 | 78
The following table analyses within the fair value hierarchy the Fund’s assets measured at fair value at 31
December 2016:
Investments whose values are based on quoted market prices in active markets, and are therefore
classified within Level 1, include listed equities, exchange-traded derivatives and exchange-traded funds.
Financial instruments that trade in markets that are not considered to be active but are valued based on
quoted market prices, dealer quotations or alternative pricing sources supported by observable inputs are
classified within Level 2. These include government bonds, corporate bonds, and over the counter
derivatives. As Level 2 investments include positions that are not traded in active markets and/or subject
to transfer restrictions, valuations may be adjusted to reflect illiquidity and/or non-transferability, which are
generally based on available market information.
Investments classified within Level 3 have significant unobservable inputs, as they trade infrequently. Level
3 instruments include unlisted investment funds, over the counter derivatives and unlisted equities. As
observable prices are not available for these securities, the Fund has used valuation techniques to derive
the fair value.
There were no transfers between levels for the year ended 31 December 2017 nor 31 December 2016.
(in kCHF) Level 1 Level 2 Level 3 Total
Assets
Financial assets designated at fair value through profit or loss:
Equities 727,081 - 234 727,315
Bonds - 938,358 - 938,358
Investment Funds 541,028 - 636,292 1,177,320
Sub total 1,268,109 938,358 636,526 2,842,993
Financial assets held for trading:
Derivatives 804 27,411 205 28,420
Sub total 804 27,411 205 28,420
Total assets at fair value through profit or loss 1,268,913 965,769 636,731 2,871,413
Liabilities
Financial liabilities held for trading:
Derivatives (2,493) (51,487) (168) (54,147)
Total liablities at fair value through profit or loss (2,493) (51,487) (168) (54,147)

66 | 78
The following table presents the movement in level 3 instruments for the year ended 31 December 2017
by class of financial instrument:
The following table presents the movement in level 3 instruments for the year ended 31 December 2016
by class of financial instrument:
4.3. Investments exceeding five percent of net assets available for benefits
There were no investments representing five percent or more of net assets available for benefits as at
31 December 2017 nor as at 31 December 2016.
The Fund was invested in a total of 318,850 kCHF, including two exchange-traded funds and two unlisted
funds, as at 31 December 2017, each investment representing five percent or more of Investment Funds.
(As at 31 December 2016: 347,310 kCHF in two exchange-traded funds and two unlisted funds).
The Fund had currency forward asset positions hedging US dollars against Swiss francs, totalling
22,204 kCHF as at 31 December 2017 representing five percent or more of the Derivatives assets balance.
(As at 31 December 2016: 24,631 kCHF representing currency forward positions hedging US dollars,
Pound Sterling, Euro and Japanese Yen against Swiss francs).
As at 31 December 2017 the Fund had currency forward liability positions hedging Euro, US dollars and
Pound Sterling totalling 31,673 kCHF, representing five percent or more of the Derivatives liabilities
balance. (As at 31 December 2016: 47,342 kCHF representing currency forward positions hedging US
dollars and Pound Sterling).
(in kCHF) Equities Derivatives
Investment
Funds Total
Opening balance 234 37 636,292 636,563
Purchases 54 59,232 59,285
Sales (126) - (99,326) (99,452)
Transfers into level 3 - - - -
Unrealised Gains/(Losses) on Financial Assets at Fair Value -
Through Profit & Loss - - 78,310 78,310
Realised Gains/(Losses) on Financial Assets at Fair Value
Through Profit & Loss (103) 544 3,268 3,710
Closing balance 59 581 677,776 678,416
(in kCHF) Equities Derivatives
Investment
Funds Total
Opening balance 248 451 711,583 712,282
Purchases - - 75,061 75,061
Sales - - (161,281) (161,281)
Transfers into level 3 - -
Unrealised Gains/(Losses) on Financial Assets at Fair Value -
Through Profit & Loss - - 12,213 12,213
Realised Gains/(Losses) on Financial Assets at Fair Value -
Through Profit & Loss (14) (414) (1,284) (1,712)
Closing balance 234 37 636,292 636,563

67 | 78
5. Cash and Cash Equivalents
For the purposes of the cash flow statement, cash and cash equivalents comprise the following balances
with original maturity of 90 days or less:
The amounts under the heading “Margin accounts with brokers” concern cash collateral pledged with
derivative counterparties of the Fund. The cash is held in segregated accounts with the brokers and is
callable by the Fund to the extent that collateral balances are in excess of the net fair value liability amount
of the open derivative positions held with each broker.
6. Short-Term Deposits
Short-term deposits are made for varying periods, depending on the immediate cash requirements of the
Fund and earn interest at the respective short-term rate. The deposits are made for more than 3 months
and hence are classified as short-term deposits.
7. Sundry Debtors
8. Other Receivables
(in kCHF) 2017 2016
Current accounts 396,141 313,799
Deposit accounts 19,847 19,927
Margin accounts with brokers 23,750 17,434
Total 439,738 351,160
(in kCHF) 2017 2016
Recoverable taxes 1,486 1,115
Investment property debtors 2,230 2,460
Other due amounts 49 37
Total 3,765 3,612
(in kCHF) 2017 2016
Accrued interest 34 154
Dividends receivable 287 553
Outstanding receipts 467 78
Payments in advance 4,193 4,867
Total 4,981 5,652

68 | 78
9. Derivatives
The following table shows the types of derivative contracts held by the Fund as at 31 December:
Amounts as at 31 December 2016 previously classified as “Forwards others” have been re-classified as
“Futures”.
10. Bonds
The fair value of investments in bonds, 958,177 kCHF as at 31 December 2017 (938,358 kCHF as at
31 December 2016) is as follows:
The exposure of bonds to market and credit risk is described under note 4.1. “Financial Risk Factors”.
11. Equities
The fair value of investments in equities, 634,226 kCHF as at 31 December 2017 (727,315 kCHF as at
31 December 2016) is as follows:
The exposure of equities to market risk is described under note 4.1. “Financial Risk Factors”.
*Re-stated
2017 2016
(in kCHF) Assets Liabilities Assets Liabilities
Forwards:
Currency Overlay programme 26,582 (29,458) 23,240 (47,504)
Other 1,024 (3,641) 1,982 * (1,685) *
Credit default swap 4,814 (7,354) 1,464 (2,652)
Swaps 3,192 (3,536) 765 (611)
Futures 1,344 (312) 479 * (1,382) *
Options 4,201 (530) 490 (314)
Total 41,157 (44,831) 28,420 (54,147)
(in kCHF) 2017 2016
Europe, Middle East and Africa 596,094 622,742
North America 247,636 242,095
Asia 89,918 55,561
Emerging Markets 24,529 17,960
Total 958,177 938,358
Source of geographical data: country of risk data provided by Custodian
(in kCHF) 2017 2016
Europe, Middle East and Africa 487,010 590,834
North America 140,326 122,493
Asia 5,605 6,529
Emerging Markets 1,285 7,459
Total 634,226 727,315
Source of geographical data: country of risk data provided by Custodian

69 | 78
12. Investment Funds
The fair value of Investment Funds, 1,230,061 kCHF as at 31 December 2017 (1,177,320 kCHF as at
31 December 2016) is as follows:
13. Investment Property
The fair value of Investment Property, 824,478 kCHF as at 31 December 2017 (764,399 kCHF as at
31 December 2016) is as follows:
During the year, there were two sales of Investment Property, one in France and one in the United Kingdom.
(two in France and one in the Netherlands in 2016).
14. Sundry Creditors
Sundry creditors include rent guarantee deposits, rents received in advance, amounts due to members
leaving the Fund and value added tax payable.
(in kCHF) 2017 2016
Alternative funds 297,403 373,499
Equity funds 425,801 430,191
Fixed Income funds 103,991 121,529
Private Debt 136,074 55,981
Private Equity 206,014 164,780
Real Estate funds 60,778 31,340
Total 1,230,061 1,177,320
(in kCHF) 2017 2016
As at 1 January 764,399 813,843
Sales (36,716) (40,587)
Net gain/(loss) for fair value adjustments (price) 57,598 37,782
Net gain/(loss) for fair value adjustments (foreign exchange) 39,197 (46,637)
As at 31 December 824,478 764,399
(in kCHF) 2017 2016
Members and Beneficiaries 5,211 3,701
Investment property deposits 3,468 3,564
Taxes Payable 457 684
Investment property creditors 5,548 6,336
Deferred Income 423 357
Total 15,107 14,642

70 | 78
15. Other Payables
Other Payables include contributions to be reimbursed to members leaving the Fund and amounts due
mainly in respect of management and custody fees.
An amount of 890 kCHF as at 31 December 2016 in “Reimbursements of Contributions” has been re-
classified as “Payments Outstanding”.
16. Interest Income
17. Unrealised Gains/(Losses) on Financial Assets at Fair Value
through Profit & Loss
The following table shows the amount of unrealised gains/(losses) on financial assets at fair value through
profit and loss and discloses the gains and losses arising as a result of changes in price and changes in
foreign exchange currency movements for Bonds, Equities, Investment Funds and Derivatives. The Fund
hedges the foreign exchange exposure it has to assets denominated in non-Swiss franc currencies.
The unrealised gains/(losses) arising as a result of changes in price and changes in foreign exchange
currency movements on derivative products are on a best estimate basis.
*Re-stated
(in kCHF) 2017 2016
Reimbursements of Contributions 1,074 1,162 *
Payments Outstanding 2,558 2,052 *
Total 3,632 3,214
(in kCHF) 2017 2016
Cash and Cash Equivalents 74 181
Short term deposits 372 521
Bonds 24,516 25,448
Total 24,962 26,150
2017 2016
(in kCHF) Price Currency Total Price Currency Total
Bonds 9,123 23,266 32,389 5,328 (3,048) 2,280
Equities 73,081 17,352 90,433 39,351 (22,628) 16,723
Investment Funds 116,565 (5,406) 111,159 33,147 13,872 47,019
Derivatives (145) (41) (186) (2,140) 5 (2,135)
Total 198,624 35,171 233,795 75,686 (11,799) 63,887

71 | 78
18. Realised Gains/(Losses) on Financial Assets at Fair Value through
Profit & Loss
The following table shows the amount of realised gains/(losses) on financial assets at fair value through
profit and loss and discloses the gains and losses arising as a result of changes in price and changes in
foreign exchange currency movements for Bonds, Equities, Investment Funds and Derivatives. The Fund
hedges the foreign exchange exposure it has to assets denominated in non-Swiss franc currencies.
The realised gains/(losses) arising as a result of changes in price and changes in foreign exchange
currency movements on derivative products are on a best estimate basis.
19. Investment Property Income
The following table shows Investment Property Income arising from both rental income and non-rental
income:
Amounts of 57,598 kCHF for fair value price adjustments and 39,197 kCHF for fair value adjustments as a
result of foreign exchange movements, are included in “Changes in fair value” above. The corresponding
amounts in 2016 were a gain of 39,197 kCHF and a loss of 46,637 kCHF respectively.
2017 2016
(in kCHF) Price Currency Total Price Currency Total
Bonds 9,953 9,765 19,718 11,630 (8,165) 3,465
Equities 29,273 1,333 30,606 (11,540) (6,704) (18,244)
Investment Funds 14,748 (5,315) 9,433 (11,615) 4,925 (6,690)
Derivatives (38,137) 108 (38,029) (55,169) 2,043 (53,126)
Total 15,838 5,891 21,729 (66,694) (7,901) (74,595)
(in kCHF) 2017 2016
Rental Income:
Residential Property 12,202 12,007
Office Property 21,003 23,917
Agricultural property 238 214
Non-Rental Income:
Residential Property - 18
Agricultural property 1,255 1,377
Forests 471 496
Changes in fair value 96,795 (8,855)
Gains/(Losses) on Sales 8,302 (273)
Total 140,266 28,901

72 | 78
With regard to its Investment Property the Fund is a lessor of operating leases and as such is required to
make the following disclosures in respect of future minimum lease payments.
The Fund has leases that are contracted for remaining periods of between one and ten years. Some of the operating leases include break clauses.
20. Foreign Exchange Gains/(Losses)
Foreign Exchange Gains/(Losses) includes losses of 139,298 kCHF (gains of 20,899 kCHF in 2016)
relating to trades executed as part of the Currency Overlay programme that is used by the Fund to hedge
its foreign exchange rate risk.
21. Investment Management Fees
21.1. Recorded Investment Management Fees
The following table shows Investment Management Fees recognised in the Statement of Financial
Performance.
The above Investment Management fees also include performance fees.
21.2. Non-recorded Investment Management Fees
For less than 3% of Total Financial assets (less than 3% in 2016) there was insufficient information
available regarding Investment Management Fees. As a result no Investment Management Fees have
been disclosed for these assets that are all Private Equity/Debt funds. The total carrying value of these
assets as at 31 December 2017 was 132,429 kCHF (98,537 kCHF as at 31 December 2016).
Carried interest payable in the future to the general partners of Private Equity funds has not been disclosed
as there was insufficient information available.
(in kCHF) 2017 2016
Not later than 1 year 28,732 31,467
Between 1 and 5 years 94,612 82,028
Later than 5 years 23,610 14,729
Total 146,954 128,224
(in kCHF) 2017 2016
Currency Overlay programme (139,298) 20,899
Other exchange rate movements 8,133 (5,903)
Total (131,165) 14,996
(in kCHF) 2017 2016
Reported Investment Management Fees 20,834 21,108
Calculated Investment Management Fees 1,336 1,161
Total 22,170 22,269

73 | 78
22. Investment Property Expenditure
23. Other Financial Expenses
Other Financial Expenses were 2,789 kCHF for the period ending 31 December 2017 (1,933 kCHF in
2016). During the year the Fund was exposed to negative interest rates in some currencies, notably Swiss
Franc and Euro rates. The increase in Other Financial Expenses was largely as a result of an increase in
the level of cash held during the year compared to 2016.
24. Administration Costs
Administration costs of 5,517 kCHF in the period ending 31 December 2017 (5,357 kCHF for the period
ending 31 December 2016) were as follows:
25. Membership Activities
This heading shows the contributions of the members of the Fund and the participating Organisations and
other amounts received, as well as the various benefits and other amounts paid during the period.
(in kCHF) 2017 2016
Residential Property 7,518 4,280
Office Property 1,815 3,272
Agricultural property 1,066 1,170
Forests 237 179
Total 10,636 8,901
(in kCHF) 2017 2016
Personnel Costs 3,940 3,686
Operating Expenses 1,279 1,369
Supplies 79 60
Audit/Valuation costs relating to Investment Property 220 242
Total 5,518 5,357

74 | 78
26. Related-Party Transactions
Parties are considered to be related if one party has the ability to control the other party or exercise
significant influence over the other party in making financial or operational decisions.
Related parties of the Fund during the period were:
i. Professional members appointed by the CERN Council to act as experts in the PFGB and
professional members appointed by the PFGB to the PFIC and ATC. These professional members
provide advice on governance, investment and actuarial issues respectively. Fees in 2017 totalled
116 kCHF (102 kCHF in 2016);
ii. Key personnel are the Chair of the PFGB, Chair of the PFIC, Chair of the ATC and the Chief
Executive Officer of the Fund. The aggregate remuneration paid to the remaining key personnel
includes salaries, allowances and other entitlements paid in accordance with the Staff Rules and
Regulations;
iii. CERN, the Organization, contributes a significant portion of the Fund’s financing. While the Fund
is an autonomous operating entity without separate legal identity, for the purposes of IPSAS 20
disclosure requirements, CERN is considered a related party. Although the Fund meets the cost
of its operating expenses, CERN provides free of charge some central support services and office
accommodation.
During the year the Fund paid the following amounts to CERN:
- Finance and Administrative Processes department: 339 kCHF for the development of a new
Benefits Management System (179.4 kCHF in 2016).
- Industry, Procurement and Knowledge Transfer department: 26 kCHF for procurement
services (52 kCHF in 2016).
- IT department: 6 kCHF (6 kCHF in 2016) for the maintenance cost of two servers.
- Legal Service: 82 kCHF.
- Translation Service: 4 kCHF (4.9 kCHF in 2016).
In 2017 the Fund did not grant any loan or pay any other remuneration (except for the above mentioned
amounts) to the key management personnel or to their close family members.
27. Compensations
The Fund is compensated by CERN for the additional cost associated with Administrative Circular No. 22
A (Rev.1) “Award of additional periods of membership in the Pension Fund for long-term shift work”.
Compensations received for the period ending 31 December 2017 were 1,091 kCHF (1,065 kCHF in 2016).
28. Cash Flow Statement
The following amounts, previously under the heading “Exchange gains/(losses) on cash and cash
equivalents” have been re-classified for 2016 as “Net proceeds on Derivatives”: 42,660 kCHF.
29. Events after the Balance Sheet Date
There were no material events after the Balance Sheet Date.

75 | 78
VI. Extract of Actuary’s Report on the Fund as at
31 December 2017
The Actuary to the Fund has provided technical assessments of the Fund in line with the requirements of
IAS26 using two separate sets of assumptions as set out below. The first set of assumptions are those
assumptions used to measure the liabilities for inclusion in the Statement of Financial Position (IAS26).
The second set reflects assumptions as set out in the report ‘Actuary’s Report on the Fund as at 31
December 2017’ dated March 2018 (Best Estimate).
The technical assessments were based on member and asset data provided by CERN.
1. Actuarial assumptions
The actuarial assumptions in the table below have been used for the technical assessment of the Fund.
Actuarial assumptions
IAS26
31 December 2017
IAS26
31 December 2016
Best Estimate
31 December 2017
and 31 December
2016
Financial assumptions % p.a. % p.a. % p.a.
Discount rate 1.38 1.37
4.00 (Until 2019)
4.50 (2020 – 2024)
5.00 (2025 onward)
Indexation of pensions linked to
inflation
1.38 1.37 1.00 (Until 2024)
1.50 (2025 onward)
Inflation and salary increase linked to
inflation
1.38 1.37
Salary increase linked to career
change
1.50 1.50 Age related scale
Demographic assumptions
Mortality and disability tables 83% VZ 2010
Generational
83% VZ 2010
Generational
83% VZ 2010
Generational
Exit assumptions Contract specific –
set by CERN
Contract specific –
set by CERN
Contract specific – set
by the Fund
Some narrative has been provided below on changes in the key actuarial assumptions to the IAS 26
assumptions.

76 | 78
Discount rate
IAS26 measures pension fund liabilities by reference to a discount rate which reflects the time value of
money of an appropriate duration and currency. In order to ensure that the discount rate more adequately
reflects the time value of money, I believe that it is reasonable for CERN to continue to adopt the principle
that the discount rate should never fall below the best estimate of future inflation. Applying a consistent
approach to the 31 December 2016 disclosures results in a discount rate of 1.38% p.a. when expressed
as a 30 year spot rate (1.37% p.a. as at 31 December 2016). The underlying best estimate assumption has
the following term structure: 1% p.a. until 2024, 1.50% p.a. from 2025 and is unchanged from 31 December
2016. The single equivalent spot rate describes this underlying term structure.
Prior to 2015, the determination of the discount rate by CERN was made on the basis of the spot yield on
Swiss Confederation bond issues at term 30 years as published by the Swiss National Bank. At 31
December 2017 the yield was 0.36% p.a. As this yield is below the inflation assumption, the relevant floor
has been applied.
Inflation – related assumptions
IAS26 does not state any method for determining the rate of inflation to be assumed. Consequently the
rate of inflation, on which indexation of benefits provided by the Fund and also salary increases are
dependant, has been set by the principles of best estimate and also of mutual compatibility with other
assumptions. The assumption adopted is a long term assumption appropriate over the entire remaining
lifetime of existing members and beneficiaries of the Fund in relation to their accrued benefits as at 31
December 2017.
For the 31 December 2017 disclosure CERN have set their assumption to be consistent with the current
best estimate of future inflation suggested by the Fund’s risk advisor, Ortec. This results in an inflation
assumption of 1.38% p.a. as at 31 December 2017 when expressed as a 30 year spot rate (1.37% p.a. as
at 31 December 2016). The underlying best estimate assumption has the following term structure: 1% p.a.
until 2024, 1.50% p.a. from 2025 and is unchanged from 31 December 2016. The single equivalent spot
rate describes this underlying term structure.
Mortality assumption
Following analysis of the mortality experience of the Fund over the years 2003 to 2015 CERN’s best
estimate for the morality assumption is 83% of the VZ2010 base table. This is consistent with the
assumption used at 31 December 2016.

77 | 78
2. Technical balance sheet under IAS26
Balance sheet
31 December 2017
as reported
000’s CHF
31 December 2017
with 2016 IAS assumptions
000’s CHF*
31 December 2016
as reported
000’s CHF
Total assets of the Fund 4,258,645 4,258,645 4,059,952
Liabilities in respect of members (5,033,870) (5,033,870) (5,030,941)
Liabilities in respect of
beneficiaries (5,222,386) (5,222,386) (5,134,845)
Total liabilities (10,259,256) (10,259,256) (10,165,786)
Surplus/(Deficit) in the Fund (6,105,834) (6,105,834) (6,105,834)
Funding Level under IAS26 (%) 41.5 41.5 39.9
Method of evaluating benefits on exit
18% Transfer Value / 82% present value of
accrued deferred pension
18% Transfer Value / 82% present value of
accrued deferred pension
18% Transfer Value / 82% present value of
accrued deferred pension
* The underlying term structure for the discount rate and inflation assumption, and all other assumptions, are unchanged from 31 December 2016. Consequently, the IAS26 balance sheet position at 31 December 2017 is identical under the prior year assumptions. The sensitivity of the total liabilities of 10,259,256 k CHF at 31 December 2017 to changes in the discount rate, inflation and salary increase assumptions is as set out below. Please note that for the purpose of these sensitivities, all assumptions are changed in isolation while keeping the other assumptions constant:
Assumption changed*
(Increase)/decrease to liabilities resulting from a 0.5% increase in
the assumption
000’s CHF
(Increase)/decrease to liabilities resulting from a 0.5% decrease in
the assumption
000’s CHF
Discount rate 962,516 (1,126,625)
Inflation (including impact on indexation of pensions and salaries)**
(1,035,080) 842,914
Indexation of salaries (282,818) 262,475
*Please note that the changes in the liabilities resulting from the increase/decrease to the individual assumptions shown in the table above are slightly asymmetric around the base value of the liabilities of 10,259,256 k CHF. The asymmetry occurs a result of compounding the inflation related assumptions and the discount rate assumption as part of the present value liability calculation. In this instance, the asymmetry is more significant than might be expected owing to a fairly low discount rate (in nominal terms).
**For this sensitivity there is no corresponding change to the discount rate, which remains fixed at the stated assumption.

78 | 78
3. Technical balance sheet using the Best Estimate actuarial assumptions
Balance sheet 31 December 2017
000’s CHF
31 December 2016
000’s CHF
Total assets of the Fund 4,258,645 4,059,952
Liabilities in respect of members (1,954,182) (1,943,925)
Liabilities in respect of
beneficiaries
(3,654,634) (3,654,318)
Total liabilities (5,608,816) (5,598,243)
Surplus/(Deficit) in the Fund (1,350,171) (1,538,291)
Funding Level using the Best
Estimate assumptions 75.9 72.5
Method of evaluating benefits on
exit
Percentage assumed to take transfer values:
- Age under 35: 70%
- Age 35 to 45: 65%
- Age 45 to 55: 15%
- Over 55: 5%
Percentage assumed to take transfer values:
- Age under 35: 70%
- Age 35 to 45: 65%
- Age 45 to 55: 15%
- Over 55: 5%
For the purposes of the figures at 31 December 2016 above, I have provided prior year comparative figures on the Best Estimate assumptions using membership data as at 31 December 2016.

