2017 annual report - maersk
TRANSCRIPT

2017Annual Report
Esplanaden 50, DK-1098 Copenhagen K / Registration no. 22756214
A.P. Møller - Mærsk A/S

The Annual Report for 2017 of A.P. Møller - Mærsk A/S (further referred
to as A.P. Moller - Maersk as the consolidated group of companies and
A.P. Møller - Mærsk A/S as the parent company) has been pre pared in
accordance with the International Financial Reporting Standards (IFRS)
as adopted by the EU and further requirements in the Danish Financial
Statements Act.
Changes in presentation
Following the classification of Maersk Oil, Maersk Tankers, Maersk Drilling
and Maersk Supply Service as discontinued operations, the businesses
are presented separately on an aggregated level in the income statements,
balance sheet and cash flow statements. In accordance with IFRS, the
income statement and cash flow statement have both been restated in pre-
vious years, while the balance sheet has not been restated in previous years.
Forward-looking statements
The Annual Report contains forward-looking statements. Such state-
ments are subject to risks and uncertainties as various factors, many of
which are beyond A.P. Moller - Maersk’s control, may cause the actual de-
velopment and results to differ materially from expectations contained
in the Annual Report.
Comparative figures
Unless otherwise stated, all figures in parenthesis refer to the corre-
sponding figures for the previous year.
Contents Directors’ report Pages 3-61
Financials Pages 62-136
Additional information Pages 137-149
Overview
Chairman’s statement . . . . . . . . . . . . . . . . . . . . . . . . . . . . . . . . . . . . . . . . . . . . . . . . . . . . . . . . . . . . . . . . . 4
Letter from the CEO . . . . . . . . . . . . . . . . . . . . . . . . . . . . . . . . . . . . . . . . . . . . . . . . . . . . . . . . . . . . . . . . . . . . . . 7
A.P. Moller - Maersk at a glance . . . . . . . . . . . . . . . . . . . . . . . . . . . . . . . . . . . . . . . . . . . . . . . . . . . 9
Five-year summary . . . . . . . . . . . . . . . . . . . . . . . . . . . . . . . . . . . . . . . . . . . . . . . . . . . . . . . . . . . . . . . . . . . . . . . 10
Highlights 2017 . . . . . . . . . . . . . . . . . . . . . . . . . . . . . . . . . . . . . . . . . . . . . . . . . . . . . . . . . . . . . . . . . . . . . . . . . . . . . 11
Guidance for 2018 . . . . . . . . . . . . . . . . . . . . . . . . . . . . . . . . . . . . . . . . . . . . . . . . . . . . . . . . . . . . . . . . . . . . . . . . . 14
Execution on strategy
Separation of the energy businesses . . . . . . . . . . . . . . . . . . . . . . . . . . . . . . . . . . . . . . . . . 16
Hamburg Süd joins A.P. Moller - Maersk . . . . . . . . . . . . . . . . . . . . . . . . . . . . . . . . . . . . . 21
Strategy and performance
Business model . . . . . . . . . . . . . . . . . . . . . . . . . . . . . . . . . . . . . . . . . . . . . . . . . . . . . . . . . . . . . . . . . . . . . . . . . . . . . 25
Strategy . . . . . . . . . . . . . . . . . . . . . . . . . . . . . . . . . . . . . . . . . . . . . . . . . . . . . . . . . . . . . . . . . . . . . . . . . . . . . . . . . . . . . . . . . 26
Performance in 2017 . . . . . . . . . . . . . . . . . . . . . . . . . . . . . . . . . . . . . . . . . . . . . . . . . . . . . . . . . . . . . . . . . . . . . 30
Governance and risk
Corporate governance . . . . . . . . . . . . . . . . . . . . . . . . . . . . . . . . . . . . . . . . . . . . . . . . . . . . . . . . . . . . . . . . . . 50
Risk management . . . . . . . . . . . . . . . . . . . . . . . . . . . . . . . . . . . . . . . . . . . . . . . . . . . . . . . . . . . . . . . . . . . . . . . . 53
Sustainability . . . . . . . . . . . . . . . . . . . . . . . . . . . . . . . . . . . . . . . . . . . . . . . . . . . . . . . . . . . . . . . . . . . . . . . . . . . . . . . . 57
Remuneration . . . . . . . . . . . . . . . . . . . . . . . . . . . . . . . . . . . . . . . . . . . . . . . . . . . . . . . . . . . . . . . . . . . . . . . . . . . . . . . 59
Shareholder information . . . . . . . . . . . . . . . . . . . . . . . . . . . . . . . . . . . . . . . . . . . . . . . . . . . . . . . . . . . . . 60
Consolidated financial
statements 2017 . . . . . . . . . . . . . . . . . . . . . . . . . . . . . . . . . . 63
Parent company
financial statements 2017 . . . . . . . . . . . . . . . . . 108
Statement of the Board of Directors
and the Executive Board . . . . . . . . . . . . . . . . . . . . 132
Independent Auditor’s Report . . . . . . . . . 133
Board of Directors 1 . . . . . . . . . . . . . . . . . . . . . . . . . . . . . 138
Executive Board 1 . . . . . . . . . . . . . . . . . . . . . . . . . . . . . . . . 140
Company overview 2 . . . . . . . . . . . . . . . . . . . . . . . . . . . . 141
Definition of terms . . . . . . . . . . . . . . . . . . . . . . . . . . . . . . 144
Company announcements . . . . . . . . . . . . . . . . 145
Highlights Q4 2017 1 . . . . . . . . . . . . . . . . . . . . . . . . . . . . . 146
Quarterly summary 1 . . . . . . . . . . . . . . . . . . . . . . . . . . . 148
External financial reporting
for A .P . Moller - Maersk 1 . . . . . . . . . . . . . . . . . . . . . 149
1 Part of Directors’ report
2 Part of Financials
A.P. Moller - Maersk | Annual Report 20172
CONTENTS

DIRECTORS’ REPORT
Chairman’s statement | Letter from the CEO | A.P. Moller - Maersk at a glance | Five-year summary | Highlights 2017 | Guidance for 2018
A.P. Moller - Maersk | Annual Report 20173
DIRECTORS’ REPORT

Leading the trans formation of our industry
2017 has been a year of considerable and
rapid change for A.P. Moller - Maersk, as
we have progressed on the execution
of our new strategy: finding future
solutions for our energy businesses,
integrating and transforming the
transport and logistics business and
strengthening the governance.
A transformation that will not only
change A.P. Moller - Maersk, but the
entire industry.
The future focus is to deliver best-
in-class services within container
shipping, ports and logistics, as an
integrated company with expanded
coverage of the whole value chain.
By offering a wider range of logistics
services, as well as products not re-
lated to sea transport, we will deliver
more value to our customers, seek
growth, increased earnings, and
reduced volatility of our business.
It has always been and remains an
integral part of our purpose to safe-
guard the long-term viability of our
companies by investing in and building
value-creating businesses that have
a positive impact on society. This has
been a guiding principle in our strate-
gic change, as well as in our work to
define viable solutions for our oil and
oil-related businesses.
Future growth will be based on organic
growth in the individual transport and
logistics businesses combined with
targeted acquisitions, and in December
2017, we welcomed Hamburg Süd
to the Maersk family in a significant
strengthening of our customer offer-
ing and container line presence.
This meant new beginnings for
our transport, logistics and ports
businesses in defining the future of
A.P. Moller - Maersk as well as new
structural solutions for our oil and
oil-related businesses, which have
been an integral part of our company
identity for decades.
Finding future solutions for our energy businesses We set out to have defined new struc-
tural solutions for all the oil and oil-re-
lated businesses before the end of 2018.
Already in 2017, this resulted in not only
defining, but also executing on solu-
tions for two of our oldest and most
iconic energy businesses; the sales of
Maersk Oil and Maersk Tankers.
On 21 August 2017, we entered into an
agreement to sell Maersk Oil to Total
S.A. for USD 7.45 billion in a combined
share and debt transaction. Maersk Oil
will become part of the world’s fourth-
largest oil and gas company, which has
a strong performance record and long-
term growth and investment interest
in the oil and gas sector. Denmark will
become the regional hub for Total’s
activities in Denmark, Norway and the
Netherlands, a testament to Maersk
Oil’s capabilities and position and en-
suring a continued Danish stronghold
in the North Sea. The transaction is
progressing as planned and we expect
to close during Q1 2018, pending regu-
latory approvals.
Furthermore, we sold Maersk Tankers
to APMH Invest, a subsidiary of
A.P. Møller Holding, for USD 1,171 million
in an all-cash transaction, which closed
10 October 2017. In determining the
future ownership for Maersk Tankers,
Chairman’s statement
JIM HAGEMANN SNABEChairman of A.P. Møller - Mærsk A/S
CHAIRMAN’S STATEMENT LETTER FROM THE CEO A.P. MOLLER - MAERSK AT A GLANCE FIVE-YEAR SUMMARY HIGHLIGHTS 2017 GUIDANCE FOR 2018 DIRECTORS’ REPORT OVERVIEW
A.P. Moller - Maersk | Annual Report 20174

it was imperative to ensure a finan-
cially solid owner with industry insight
and a long-term view on the inherent
cyclical nature of the tanker industry.
This to ensure that Maersk Tankers
can continue to take advantage of
market opportunities, while upholding
the capabilities and the organisation
on which its strong name and global
leading market position are built.
Over the last six months, we have seen
signs of improved market conditions in
the offshore drilling industry. This has,
amongst other elements, raised our
confidence in finding structural solu-
tions for Maersk Drilling and Maersk
Supply Service before the end of 2018.
Maersk Drilling was reclassified as dis-
continued operations in the third quar-
ter financial statement, and Maersk
Supply Service in the fourth quarter
financial statement.
I would like to take this opportunity to
extend my sincere gratitude to all our
employees in the oil and oil-related
businesses for their continued pas-
sion, efforts and dedication during
the separation process.
Transforming the transport and logistics industry by reducing complexity The digital revolution has fundamen-
tally impacted behaviours and trade
patterns over the last 5-10 years,
making its marks on many industries.
However, the transport and logistics
industry has not yet undergone any
significant transformation.
There are many reasons for this; the
most important being the complex-
ity of container shipping, the lack of
standardisation, and ability to adjust
to multiple unforeseen events in the
handling process, as the underlying
processes in shipping remain largely
manual, paper-based and typically
with little standardisation between
different countries and authorities.
We ship one in five containers and
one in four reefer containers globally,
corresponding to approximately 13
million forty foot containers annually.
For each container shipped, there
may be up to 30 different parties
involved, communicating up to 200
times. Although we have seen some
development over the last decade,
the basic shipping experience is vir-
tually unchanged seen from a cus-
tomer’s point of view.
We want to transform the industry by
reducing the complexity. We believe it
should be as easy for our customers to
ship a container as it is to send a parcel
with a postal carrier.
Based on our leading position within
container shipping, port activities,
supply chain management and freight
forwarding, we want to improve and
simplify the shipping experience by uti-
lising and integrating our capabilities
across the value chain. This enables us
to offer seamless value-adding end-to-
end services to our customers based
on digital, innovative customer solu-
tions, extending the industry’s most
effective and efficient delivery network
to every market in the world.
The opportunities from digitisation
are significant. It has the potential
to both simplify the customer expe-
rience and improve the productivity
of assets, primarily ships and ports,
effectively reducing costs across the
value chain.
It is my sincere belief that this company
is best positioned to front the digiti-
sation of the shipping industry, having
operated the complexities of container
shipping for four decades in more than
130 countries around the world. We
have the capabilities, the assets and
the potential to fundamentally change
the shipping industry, already having
launched various initiatives that focus
on digitising the paper flow.
With a leading position comes responsibility Responsible business is engraved in
the very identity of A.P. Moller - Maersk.
With the scale of our company and our
involvement all over the globe, it is es-
sential that we, as an industry leader,
address global challenges through
innovation, investment and collabo-
ration and use our influence, position
and commercial strength to system-
atically reduce negative and enhance
positive impacts on the societies of
which we are a part.
This includes eliminating facilitation
payments, taking an active stand on
responsible ship recycling to radically
improve the working conditions and
reduce the environmental impact, as
well as leading the reduction of global
emissions in the transport sector.
The future focus is to deliver best-in-class services within container shipping, ports and logistics, as an integrated company with expanded coverage of the whole value chain.
JIM HAGEMANN SNABEChairman
CHAIRMAN’S STATEMENT LETTER FROM THE CEO A.P. MOLLER - MAERSK AT A GLANCE FIVE-YEAR SUMMARY HIGHLIGHTS 2017 GUIDANCE FOR 2018 DIRECTORS’ REPORT OVERVIEW
A.P. Moller - Maersk | Annual Report 20175
The transport sector is responsible
for 23% of global energy-related emis-
sions. Of these, shipping accounts
for 3-4%. We are pursuing a CO2 re-
duction of 60% per container moved
by 2020 compared to 2007 through
efficiency improvements and more
fuel-efficient vessels. We have so far
reduced CO2 emissions by 43%.
Strengthening corporate governance In 2017, we strengthened our corporate
governance system and adapted the
focus points on the Board of Directors’
agenda to fit our transformation prior-
ities and the separation of the energy
businesses. The key objectives of our
governance system are to support
early identification of opportunities
and challenges, ensure efficient pro-
cesses for informed decision-making,
support agile planning and fast execu-
tion while always maintaining sound
controls and clear allocation of powers
and responsibilities.
In 2017, the Board formed the Trans-
formation & Innovation Committee,
and the Board has defined success
criteria and a governance structure
around the separation of our energy
businesses to closely monitor prepa-
rations and execution.
To further accelerate the integration
of our container shipping, ports and
logistics businesses, and the develop-
ment of customer-oriented end-to-end
transport and logistics solutions, the
Executive Board was expanded and
strengthened in December 2017 with
the appointment of the Chief Oper-
ating Officer and Chief Commercial
Officer of Maersk Line as well as the
CEO of APM Terminals.
Since taking up my position as
Chairman in March 2017, I have been
immensely impressed by all our em-
ployees across A.P. Moller - Maersk,
their ability to adapt to change and the
passion for their industry and the de-
velopment of our businesses. This was
most notable during the cyber-attack
in June, when all employees rallied
together, working relentlessly as one
global team to uphold our services to
customers and partners.
This loyalty and focus is what has built
our unique position over decades and
made A.P. Moller - Maersk into the sig-
nificant company it is today. It is also
the foundation for our future – taking
care of today, actively preparing for
tomorrow.
CHAIRMAN’S STATEMENT LETTER FROM THE CEO A.P. MOLLER - MAERSK AT A GLANCE FIVE-YEAR SUMMARY HIGHLIGHTS 2017 GUIDANCE FOR 2018 DIRECTORS’ REPORT OVERVIEW
A.P. Moller - Maersk | Annual Report 20176

It has been an unusual and eventful
year for A.P. Moller - Maersk.
We progressed in the remaking of
the company, separating out the oil
and oil-related businesses and trans-
forming our container shipping, ports
and logistics businesses. Business
results were improved from a low 2016
base, and we did a total of USD 14 bil-
lion worth of M&A transactions. We
overcame an aggressive cyber-attack
which led to a difficult third quarter
and consequently financial results
were negatively impacted.
New and strong ownership was found
for Maersk Oil and Maersk Tankers.
We agreed to sell Maersk Oil to oil
and gas major Total S.A. and have
sold Maersk Tankers to A.P. Moller
Holding. In a separate step, we sold
the remaining 19% stake in Dansk
Supermarked Group to the Salling
Companies, which allows us to further
focus on the core business.
We successfully acquired Hamburg
Süd and the integration is progress-
ing well. With this acquisition, one in
five of all containers in the world and
one in four of all reefer containers are
moved by Maersk Line.
We continued to progress on the
digital transformation of our core
business, moving customer transac-
tions online and digitising the way we
operate our assets. Our e-pay solu-
tions have launched and are ramping
up successfully. We launched Twill,
a digital forwarder, primarily in Asia-
Europe trade lanes and customers are
responding well in adapting to new
self-service solutions.
Our vision of becoming the global
integrator of container logistics, con-
necting and simplifying our custom-
ers’ supply chains, is taking shape.
Financially, we reported revenue
growth of USD 3.7 billion to USD 30.9
billion and an underlying profit of USD
356 million in 2017. The underlying
profit in the transport and logistics
business of USD 1.0 billion was in line
with latest guidance.
There were strong underlying market
conditions through most of the year,
but the result was negatively impacted
by the cyber-attack, weaker rates and
increasing bunker costs, especially in
the fourth quarter.
Enhanced customer offering Hamburg Süd is an outstanding brand
with high-quality products and by
combining our two businesses we will
reinforce the global positions of both
companies and enhance our service
offerings to customers.
It supports Maersk Line’s growth
strategy and is a unique opportunity
to realise commercial opportunities as
well as sizable operational synergies
between the two companies. In the
early stages of our integration journey,
there has been a positive and welcom-
ing attitude on both sides and willing-
ness to work and learn together.
Maersk Line and Hamburg Süd will offer
customers better market coverage,
attractive direct services and benefits
via a combined global network. The
cost synergies will primarily be derived
from integrating and optimising the
networks as well as standardising pro-
curement. Together, Maersk Line and
Hamburg Süd will have a total container
capacity of more than 4 million TEU
and a global capacity market share of
approximately 19%.
Delivering on the vision We continue to believe that the liner
industry will consolidate further, which
we will benefit from, and that there is
a low need for capital expenditure as
future ordering is expected to stay low
for the coming years.
The transport and logistics market is
big and growing. Estimated revenue in
Becoming the global integrator of container logistics
Letter from the CEO
SØREN SKOUCEO of A.P. Møller - Mærsk A/S
DIRECTORS’ REPORT OVERVIEW
A.P. Moller - Maersk | Annual Report 20177
CHAIRMAN’S STATEMENT LETTER FROM THE CEO A.P. MOLLER - MAERSK AT A GLANCE FIVE-YEAR SUMMARY HIGHLIGHTS 2017 GUIDANCE FOR 2018
A.P. Moller - Maersk | Annual Report 20177

container shipping is USD 150 billion
with expected growth in line with GDP,
and for contract logistics USD 245
billion with growth above GDP. Tradi-
tional freight forwarding may be grow-
ing below global GDP yet has revenue
of USD 180 billion, while supply chain
management is smaller at USD 40 bil-
lion but growing faster.
We are in a strong position, with a
competitive advantage from combin-
ing asset operations with capabilities
to deliver end-to-end solutions that
tap into markets covering the whole
journey from producer to consumer.
Our vision to become the global inte-
grator of container logistics implies
three essential building blocks. The first
is to provide those simple end-to-end
solutions to meet our customers’ com-
plex supply chain needs, and as part of
this we are planning several value-added
services online to complement the
physical offering, including inland ser-
vices and custom house brokerage.
Secondly, we will elevate the customer
experience through digital innovation,
such as Remote Container Manage-
ment (RCM), which allows customers
to monitor conditions inside our reefer
containers from when their goods are
locked inside right up to delivery at the
final destination. Damco’s new digital
freight forwarder, Twill, is another ex-
citing development in the digital field,
allowing customers to book the whole
freight forwarding package online or
via an app.
The third part is to extend the indus-
try’s most effective and efficient de-
livery network to every market in the
world, and we will achieve this both
organically and through acquisitions.
A larger network is an enabler for
our growth ambition as it enhances
customer offerings, and furthermore
helps secure cost leadership. As part
of this third element, we will restore
Maersk Line’s reliability to top quartile
and optimise the APM Terminals hub
ports.
One integrated company Integration and transformation of
our container, port and logistics busi-
nesses is well under way. We are mak-
ing progress towards operating as one
integrated company and delivering the
expected synergies that are estimated
to create a ROIC improvement of two
percentage points by the end of 2019,
or around USD 600 million.
Examples of this include Maersk Line’s
volume growth at APM Terminals;
Maersk Line, APM Terminals and
Damco working together to provide
more complete solutions for custom-
ers; and the stronger results at Maersk
Container Industry. Svitzer is further
developing its cooperation with the
other brands to harvest synergies
through improved operational opti-
misation, collaboration and scaling
across ports and regions.
We are targeting profitable growth
and accordingly, we have established
Growth, a unit that examines business
ideas and pursues those which have
the potential to create new world-class
businesses.
The focus in 2018 will be on improving
the customer experience in Maersk
Line; expanding our presence outside
ocean transport and building towards
offering end-to-end solutions online;
successfully integrating Hamburg Süd;
and improving the financial perfor-
mance of APM Terminals and reducing
the unit cost, based on fixed bunker
price, in Maersk Line.
It will also be a priority to strengthen
the IT backbone and increase cyber
resilience. In June, A.P. Moller - Maersk
was hit by a cyber-attack that was one
of the most aggressive that we and our
global partners have ever experienced.
The effect on profitability was USD
250-300 million, with the vast majority
of the impact related to Maersk Line
in Q3. We are putting in place different
and further protective measures, and
are continuing to review and strengthen
systems to protect against future
attacks.
Safety first There are many changes in the com-
pany but there is nothing different in
our approach to safety and our em-
ployees. Work remains to be done in
this vitally important area.
Sadly and to our deep regret, in 2017
we have suffered seven fatalities while
working at A.P. Moller - Maersk-owned
facilities. It is deeply unsettling to me
personally that any colleague should
lose their life while working for the
company. It is deeply unsatisfactory
and we must work ever harder to en-
sure this number is reduced to zero.
Thank you A year of such change can be unset-
tling for many colleagues, yet it has
also been hugely exciting. My deepest
gratitude goes to all our employees for
their dedication and contribution to
the company’s performance and trans-
formation in 2017.
With the right people in place, we are
delivering on the strategy and creating
the A.P. Moller - Maersk of the future.
Our company, through its focus on
new technologies, will transform the
transport and logistics industry for the
benefit of customers, world trade and
our shareholders.
We have made substantial progress in combining the container shipping, ports and logistics businesses.
SØREN SKOUCEO of A.P. Møller - Mærsk A/S
DIRECTORS’ REPORT OVERVIEW
A.P. Moller - Maersk | Annual Report 20178
CHAIRMAN’S STATEMENT LETTER FROM THE CEO A.P. MOLLER - MAERSK AT A GLANCE FIVE-YEAR SUMMARY HIGHLIGHTS 2017 GUIDANCE FOR 2018
A.P. Moller - Maersk | Annual Report 20178

2017 2016 2015 2014 2013
2017 2016 2015 2014 201320132014201520162017 20132014201520162017
2013201420152016201720132014201520162017
30,945
4,3324,914
4,267
1,264
2,596
4,398
5,284
4,365
2,475
3,532
1,9922,6352,415
-809
-3,591
33,90827,266 34,80630,161
14,864
11,64210,737 7,6987,770
1,837
2,580
1,553
-496
356
A.P. Moller - Maersk at a glance
Following the separation of the energy businesses, with Maersk Oil, Maersk Tankers and Maersk Drilling classified as discontinued operations in Q3 2017, and Maersk Supply Service in Q4 2017, the below key figures reflect only the continuing operations.
Revenue increased to USD 30.9bn (USD 27.3bn) with a USD 3.1bn or 14.9% increase
in Maersk Line (excluding Hamburg Süd), predominantly due to an 11.7% increase in
average freight rates and a 3.0% increase in volumes. Revenue in Hamburg Süd for
December added USD 0.5bn, while the other businesses overall reported revenue on
a par with last year except Maersk Container Industry, which reported an increase of
USD 0.5bn to USD 1.0bn.
REVENUE (USD million)
The underlying profit of USD 356m consisted of USD 1.0bn related to the transport
and logistics businesses in line with the guidance of around USD 1.0bn and net
USD 0.7bn related to financial expenses, etc. The improvement was mainly related
to Maersk Line, partly countered by an increase in net financial expenses due to
adverse currency movements and higher interest costs following an increased net
interest-bearing debt.
UNDERLYING PROFIT/LOSS (USD million) EBITDA (USD million)
The higher revenue resulted in an increase in EBITDA to USD 3.5bn (USD 2.5bn),
equal to 43%. The EBITDA margin of 11.4% (9.1%) reflects an increased profitability
in Maersk Line compared to 2016.
The acquisition of Hamburg Süd with a net cash impact of USD 4.2bn contributed
to an increase in net interest-bearing debt, partially offset by cash proceeds from
the Maersk Tankers transaction of USD 1.2bn. A.P. Moller - Maersk is committed to
maintaining an investment grade credit rating.
NET INTEREST-BEARING DEBT (USD million)
The free cash flow of negative USD 3.6bn (negative USD 809m) is impacted by
net cash flow related to the acquisition of Hamburg Süd of USD 4.2bn, partly offset by
proceeds from sale of businesses of USD 0.3bn and the remaining shares in Dansk
Supermarked Group of USD 0.9bn. Adjusted for the acquisition and divestments,
the free cash flow was negative by USD 0.6bn.
CASH FLOW FROM OPERATING ACTIVITIES (USD million) FREE CASH FLOW (USD million)
Cash flow from operating activities was USD 2.6bn (USD 1.3bn), impacted by higher
profit, and partly offset by higher net working capital. Maersk Line contributed with
USD 2.4bn (USD 1.1bn), while the other businesses overall were on a par with 2016.
DIRECTORS’ REPORT OVERVIEW
A.P. Moller - Maersk | Annual Report 20179
CHAIRMAN’S STATEMENT LETTER FROM THE CEO A.P. MOLLER - MAERSK AT A GLANCE FIVE-YEAR SUMMARY HIGHLIGHTS 2017 GUIDANCE FOR 2018

Five-year summary
Income statement 2017 2016 2015 2014 2013
Revenue 30,945 27,266 30,161 34,806 33,908
Profit before depreciation, amortisation and impairment losses, etc. (EBITDA) 3,532 2,475 4,365 5,284 4,398
Depreciation, amortisation and impairment losses, net 3,015 2,495 2,391 2,730 2,226
Gain on sale of non-current assets, etc., net 154 190 391 505 128
Share of profit/loss in joint ventures -131 130 147 29 134
Share of profit/loss in associated companies 101 -55 97 416 337
Profit/loss before financial items (EBIT) 641 245 2,610 3,505 2,771
Financial items, net -616 -543 -452 -727 -636
Profit/loss before tax 25 -298 2,158 2,778 2,134
Tax 219 171 225 509 134
Profit/loss for the year – continuing operations -194 -469 1,934 2,269 2,000
Profit/loss for the year – discontinued operations1 -970 -1,428 -1,009 2,925 1,777
Profit/loss for the year -1,164 -1,897 925 5,195 3,777
A.P. Møller - Mærsk A/S’ share -1,205 -1,939 791 5,015 3,450
Underlying profit/loss – continuing operations 356 -496 1,553 2,580 1,837
Balance sheet
Total assets 63,227 61,118 62,408 68,844 74,509
Total equity 31,425 32,090 35,739 42,225 42,513
Invested capital 46,362 42,808 43,509 49,927 54,630
Net interest-bearing debt 14,864 10,737 7,770 7,698 11,642
Investments in property, plant and equipment and intangible assets – continuing operations 9,205 4,585 3,597 3,552 3,070
Cash flow statement
Cash flow from operating activities 2 2,596 1,264 4,267 4,914 4,332
Cash flow used for capital expenditure 2 -6,187 -2,073 -1,852 -2,279 -2,340
Net cash flow from discontinued operations 1,251 503 226 1,806 150
Financial ratios
Return on invested capital after tax (ROIC) – continuing operations3 1.6% 0.5% 8.2% 8.4% 7.6%
Return on equity after tax -3.7% -5.6% 2.4% 12.3% 9.2%
Equity ratio 49.7% 52.5% 57.3% 61.3% 57.1%
Stock market ratios 2017 2016 2015 2014 2013
Earnings per share – continuing operations, USD -11 -25 84 97 84
Diluted earnings per share – continuing operations, USD -11 -25 84 97 84
Cash flow from operating activities per share, USD 125 61 199 225 198
Ordinary dividend per share, DKK 150 150 300 3004 280
Ordinary dividend per share, USD 24 21 44 494 52
Share price (B share), end of year, DKK 10,840 11,270 8,975 12,370 11,770
Share price (B share), end of year, USD 1,746 1,597 1,314 2,021 2,175
Total market capitalisation, end of year, USD m 35,419 32,215 27,587 42,848 46,305
Business drivers
Maersk Line 3
Transported volumes (FFE in ‘000) 10,731 10,415 9,522 9,442 8,839
Average freight rate (USD per FFE) 2,005 1,795 2,209 2,630 2,674
Unit cost (USD per FFE incl. VSA income) 2,079 1,982 2,288 2,584 2,731
Average fuel price (USD per tonne) 320 223 315 562 595
Maersk Line fleet, owned 287 292 285 274 275
Maersk Line fleet, chartered 389 347 305 336 299
Fleet capacity (TEU in ‘000) 3,564 3,239 2,962 2,946 2,631
APM Terminals
Containers handled (measured in million TEU and weighted with ownership share) 39.7 37.3 36.0 38.3 36.3
Number of terminals 74 73 63 64 65
1 Discontinued operations comprise Maersk Oil, Maersk Tankers, Maersk Drilling and Maersk Supply
Service. Comparative figures have been restated for the income statement and cash flow statement.
2 From continuing operations.
3 Excluding Hamburg Süd for comparison purposes.
4 An extraordinary cash dividend equal to DKK 1,671 per share of nominally DKK 1,000 was declared in
connection with the sale of Danske Bank A/S.
DIRECTORS’ REPORT OVERVIEW
A.P. Moller - Maersk | Annual Report 201710
CHAIRMAN’S STATEMENT LETTER FROM THE CEO A.P. MOLLER - MAERSK AT A GLANCE FIVE-YEAR SUMMARY HIGHLIGHTS 2017 GUIDANCE FOR 2018
Amounts in USD million
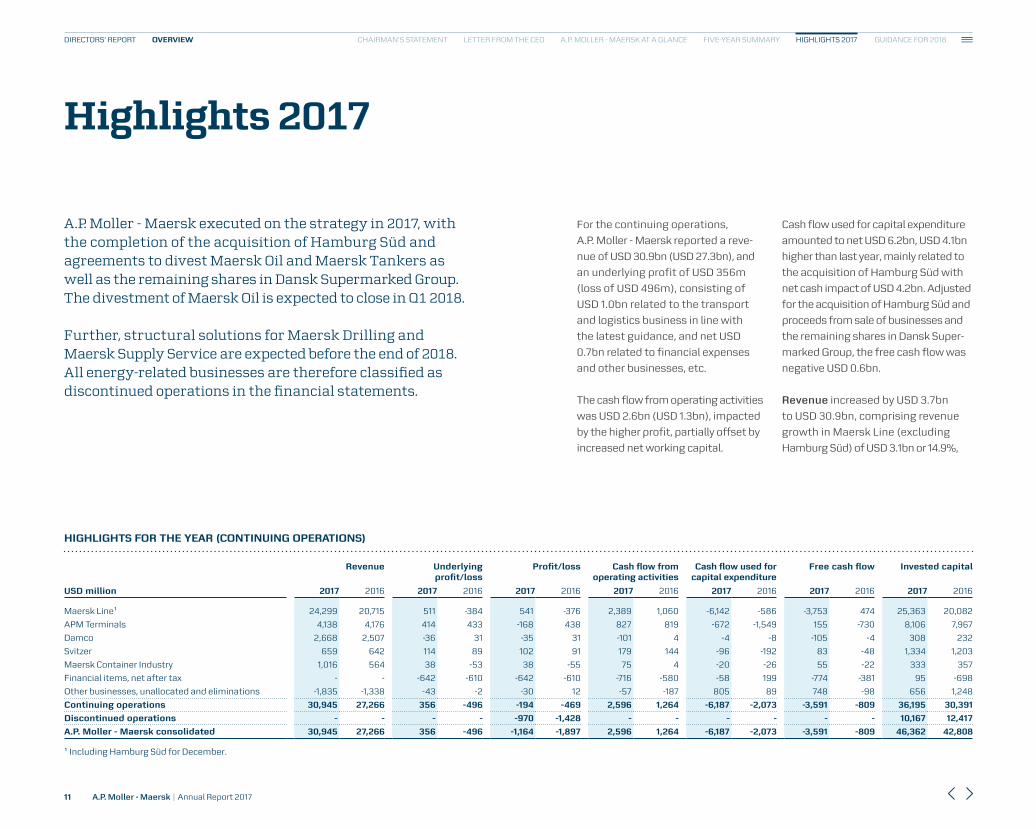
For the continuing operations,
A.P. Moller - Maersk reported a reve-
nue of USD 30.9bn (USD 27.3bn), and
an underlying profit of USD 356m
(loss of USD 496m), consisting of
USD 1.0bn related to the transport
and logistics business in line with
the latest guidance, and net USD
0.7bn related to financial expenses
and other businesses, etc.
The cash flow from operating activities
was USD 2.6bn (USD 1.3bn), impacted
by the higher profit, partially offset by
increased net working capital.
Highlights 2017
A.P. Moller - Maersk executed on the strategy in 2017, with the completion of the acquisition of Hamburg Süd and agreements to divest Maersk Oil and Maersk Tankers as well as the remaining shares in Dansk Supermarked Group. The divestment of Maersk Oil is expected to close in Q1 2018.
Further, structural solutions for Maersk Drilling and Maersk Supply Service are expected before the end of 2018. All energy-related businesses are therefore classified as discontinued operations in the financial statements.
Cash flow used for capital expenditure
amounted to net USD 6.2bn, USD 4.1bn
higher than last year, mainly related to
the acquisition of Hamburg Süd with
net cash impact of USD 4.2bn. Adjusted
for the acquisition of Hamburg Süd and
proceeds from sale of businesses and
the remaining shares in Dansk Super-
marked Group, the free cash flow was
negative USD 0.6bn.
Revenue increased by USD 3.7bn
to USD 30.9bn, comprising revenue
growth in Maersk Line (excluding
Hamburg Süd) of USD 3.1bn or 14.9%,
HIGHLIGHTS FOR THE YEAR (CONTINUING OPERATIONS)
Revenue Underlying profit/loss
Profit/loss Cash flow from operating activities
Cash flow used for capital expenditure
Free cash flow Invested capital
USD million 2017 2016 2017 2016 2017 2016 2017 2016 2017 2016 2017 2016 2017 2016
Maersk Line1 24,299 20,715 511 -384 541 -376 2,389 1,060 -6,142 -586 -3,753 474 25,363 20,082
APM Terminals 4,138 4,176 414 433 -168 438 827 819 -672 -1,549 155 -730 8,106 7,967
Damco 2,668 2,507 -36 31 -35 31 -101 4 -4 -8 -105 -4 308 232
Svitzer 659 642 114 89 102 91 179 144 -96 -192 83 -48 1,334 1,203
Maersk Container Industry 1,016 564 38 -53 38 -55 75 4 -20 -26 55 -22 333 357
Financial items, net after tax - - -642 -610 -642 -610 -716 -580 -58 199 -774 -381 95 -698
Other businesses, unallocated and eliminations -1,835 -1,338 -43 -2 -30 12 -57 -187 805 89 748 -98 656 1,248
Continuing operations 30,945 27,266 356 -496 -194 -469 2,596 1,264 -6,187 -2,073 -3,591 -809 36,195 30,391
Discontinued operations - - - - -970 -1,428 - - - - - - 10,167 12,417
A.P. Moller - Maersk consolidated 30,945 27,266 356 -496 -1,164 -1,897 2,596 1,264 -6,187 -2,073 -3,591 -809 46,362 42,808
1 Including Hamburg Süd for December.
DIRECTORS’ REPORT OVERVIEW
A.P. Moller - Maersk | Annual Report 201711
CHAIRMAN’S STATEMENT LETTER FROM THE CEO A.P. MOLLER - MAERSK AT A GLANCE FIVE-YEAR SUMMARY HIGHLIGHTS 2017 GUIDANCE FOR 2018

The net result of the continuing oper-
ations was a loss of USD 194m (loss of
USD 469m), mainly due to impairments
in APM Terminals of USD 621m in com-
mercially challenged markets.
The businessesMaersk Line, excluding Hamburg Süd
(see pages 21-23), reported a revenue
of USD 23.8bn (USD 20.7bn), posi-
tively impacted by an increase in the
average freight rate of 11.7% to 2,005
USD/FFE (1,795 USD/FFE) and by a
3.0% increase in volumes to 10,731k
FFE (10,415k FFE).
The underlying profit was USD 521m
(loss of USD 384m), positively im-
pacted by the higher revenue and a
unit cost at fixed bunker price almost
on a par with last year. The unit cost
at fixed bunker price was negatively
impacted by the cyber-attack in Q3
as well as lower headhaul utilisation
and less backhaul volumes. The total
unit cost, which was 4.9% higher
Revenue growth of USD 3.7bn and an underlying profit in the transport and logistics business in line with the latest guidance.
Discontinued operations
A.P. Moller - Maersk executed on the strat-
egy to separate out its energy businesses
in 2017 with an agreement for Total S.A.
to acquire Maersk Oil for USD 7,450m in
a combined share and debt transaction,
and A.P. Moller Holding to acquire Maersk
Tankers for USD 1,171m in an all-cash trans-
action. The Maersk Tankers transaction
closed in October, while the Maersk Oil
transaction is expected to close in Q1 2018.
Further, structural solutions for Maersk
Drilling and Maersk Supply Service are ex-
pected before the end of 2018.
In the consolidated financial statements,
the results for Maersk Oil, Maersk Drilling
and Maersk Supply Service, as well as
Maersk Tankers up to closing in October,
are classified under discontinued opera-
tions with a net loss of USD 1.0bn (loss of
USD 1.4bn), negatively impacted by impair-
ment losses net totalling USD 2.2bn (USD
2.7bn), primarily related to Maersk Drilling
and Maersk Tankers.
The cash flow from operating activities was
USD 2.0bn (USD 3.1bn), while the cash flow
used for capital expenditure amounted to
USD 1.8bn (USD 2.3bn), leaving a free cash
flow of USD 0.2bn (USD 0.8bn), excluding
cash proceeds from the Maersk Tankers
transaction of USD 1.2bn.
The results of the discontinued businesses
are presented in one separate line in the
income statement, cash flow statement
and balance sheet. Both the income state-
ment and cash flow statement have been
restated in previous years, while the bal-
ance sheet has not been restated. Further
details are set out in note 9 to the consoli-
dated financial statements.
than in 2016, was further negatively
impacted by a 43% increase in the
average bunker price.
Cash flow from operating activities
increased by USD 1.3bn to USD 2.4bn.
Cash flow used for capital expenditure
excluding the acquisition of Hamburg
Süd amounted to net USD 2.0bn, an
increase of USD 1.4bn compared to
2016, reflecting the delivery of nine
newbuild vessels. Including Hamburg
Süd, Maersk Line reported a negative
free cash flow of USD 3.8bn (positive
USD 474m).
APM Terminals reported a revenue
of USD 4.1bn on a par with 2016,
however with an underlying volume
growth on an equity-weighted basis
of 6.5%. The underlying profit was
USD 414m (USD 433m), while the net
result was a loss of USD 168m (profit
of USD 438m), due to impairments
of USD 621m in commercially chal-
lenged markets.
predominantly due to higher average
freight rates and higher volumes. In
addition, Hamburg Süd added revenue
for December of USD 0.5bn. Overall,
the rest of the businesses reported
revenue on a par with last year, except
Maersk Container Industry, which grew
revenue from USD 564m to USD 1.0bn.
The underlying profit of USD 356m
(loss of USD 496m) was positively im-
pacted by an improvement in Maersk
Line excluding Hamburg Süd of USD
905m compared to 2016, in the low end
of the latest guidance, which stated
an improvement of around USD 1bn.
The underlying profit for the continuing
businesses was negatively impacted by
the effects of the cyber-attack in Q3 es-
timated at USD 250-300m. Further, net
financial expenses after tax increased
to USD 642m (USD 610m), primarily
due to adverse currency movements
and higher interest costs following an
increased net interest-bearing debt
towards the end of the year.
DIRECTORS’ REPORT OVERVIEW
A.P. Moller - Maersk | Annual Report 201712
CHAIRMAN’S STATEMENT LETTER FROM THE CEO A.P. MOLLER - MAERSK AT A GLANCE FIVE-YEAR SUMMARY HIGHLIGHTS 2017 GUIDANCE FOR 2018

Cash flow from operating activities was
USD 827m (USD 819m). Cash flow used
for capital expenditure was USD 672m
(USD 1.5bn), leaving a free cash flow of
USD 155m (negative USD 730m).
Damco reported a revenue of USD
2.7bn (USD 2.5bn), driven by volume
growth in both ocean and air freight as
well as supply chain management. The
underlying loss was USD 36m (profit
of USD 31m), negatively impacted by
the cyber-attack as well as by lower
margins and investments in products
and digitisation.
Cash flow from operating activities
was negative USD 101m (positive USD
4m), impacted by the temporary effect
of the cyber-attack on Damco’s oper-
ations and invoicing processes. Cash
flow used for capital expenditure was
USD 4m (USD 8m), leaving a free cash
flow of negative USD 105m (negative
USD 4m).
Svitzer reported a revenue of USD
659m (USD 642m) and an underlying
profit of USD 114m (USD 89m), posi-
tively impacted by increased towage
activities in Australia and the Americas,
cost reductions and optimisation of
the portfolio and the fleet.
Cash flow from operating activities
was USD 179m (USD 144m), while cash
flow used for capital expenditure was
USD 96m (USD 192m), leaving a free
cash flow of positive USD 83m (nega-
tive USD 48m).
Maersk Container Industry reported
a revenue of USD 1.0bn (USD 564m),
which equates to a growth of 80%. The
underlying profit of USD 38m (loss of
USD 53m) was positively impacted by
improved efficiency across the three
factories, higher sales prices for dry
containers and significantly higher
sales volumes of both dry and reefer
containers.
Other businesses reported a profit of
USD 75m (loss of USD 61m). The result
for 2016 included an impairment of
USD 131m in the RORO business.
With an equity ratio of 49.7% (52.5%) and a liquidity reserve of USD 9.6bn (USD 11.8bn), A.P. Moller - Maersk maintains its strong financial position.
Capital structure and credit rating
Net interest-bearing debt increased to USD
14.9bn (USD 10.7bn), mainly due to the ac-
quisition of Hamburg Süd, partly offset by
proceeds from the sale of Maersk Tankers,
Mercosul Line and the remaining shares
in Dansk Supermarked Group. Total equity
was USD 31.4bn (USD 32.1bn), negatively
impacted by the loss for the year of USD
1.2bn, including impairment losses in the
discontinued operations.
A.P. Moller - Maersk remains investment
grade-rated, and holds a Baa2 rating from
Moody’s and a BBB rating from Standard
& Poor’s. Both ratings remain on review
for a possible downgrade following the
announcement of the sale of Maersk Oil
in August 2017.
New members of the Executive Board
In focusing the future business on container
shipping, ports and logistics, and to further
accelerate the development of customer-
oriented end-to-end transport and logistics
solutions, Vincent Clerc, Chief Commercial
Officer (CCO) at Maersk Line,
Morten Engelstoft, Chief Executive Officer
(CEO) at APM Terminals and Søren Toft,
Chief Operating Officer (COO) at Maersk
Line, joined Søren Skou (CEO), Claus V.
Hemmingsen (Vice CEO) and Jakob
Stausholm (CFO) on the Executive Board
of A.P. Moller - Maersk in December.
DIRECTORS’ REPORT OVERVIEW
A.P. Moller - Maersk | Annual Report 201713
CHAIRMAN’S STATEMENT LETTER FROM THE CEO A.P. MOLLER - MAERSK AT A GLANCE FIVE-YEAR SUMMARY HIGHLIGHTS 2017 GUIDANCE FOR 2018

Guidance for 2018
A.P. Moller - Maersk expects an underlying profit above 2017 (USD 356m) and earnings before interests, tax, depreciation and amortisation (EBITDA) in the range of USD 4.0-5.0bn (USD 3.5bn).
Factors Change Impact on EBITDA
Container freight rate +/- 100 USD/FFE +/- USD 1.3bn
Container freight volume +/- 100,000 FFE +/- USD 0.1bn
Bunker price +/- 100 USD/tonne -/+ USD 0.5bn
Sensitivity guidanceA.P. Moller - Maersk’s guidance for 2018
is subject to considerable un cer tainty,
not least due to developments in the
global economy and the container
freight rates.
A.P. Moller - Maersk’s expected EBITDA
depends on a number of factors. Based
on the expected earnings level and all
else being equal, the sensitivities for
2018 for three key value drivers are
listed in the table below:
All figures in parenthesis refer to full year 2017.
DIRECTORS’ REPORT OVERVIEW
A.P. Moller - Maersk | Annual Report 201714
CHAIRMAN’S STATEMENT LETTER FROM THE CEO A.P. MOLLER - MAERSK AT A GLANCE FIVE-YEAR SUMMARY HIGHLIGHTS 2017 GUIDANCE FOR 2018

Separation of the energy businesses | Hamburg Süd joins A.P. Moller - Maersk
EXECUTION ON STRATEGY
A.P. Moller - Maersk | Annual Report 201715
DIRECTORS’ REPORT EXECUTION ON STRATEGY
In the effort to create an integrated transport and logistics company, execution on the separation of the oil and oil- related businesses moved forward in 2017. The criteria for the separation have been to find the optimum structural solutions before the end of 2018, while at the same time bringing maximum value to A.P. Moller - Maersk’s share-holders, retaining a strong capital structure and remaining investment grade-rated.
Two significant steps were taken in 2017 to establish viable solutions for the future ownership of Maersk Oil and Maersk Tankers.
Throughout the separation process,
all the oil and oil-related businesses in
A.P. Moller - Maersk have focused on
their underlying performance, delivering
a profit before net impairment losses
of USD 1.2bn (USD 1.3bn) for 2017, and
proving their capabilities and resilience
in challenging circumstances.
However, due to the challenging mar-
ket conditions, the net result for the
year was negatively impacted by net
impairment losses of USD 2.2bn (USD
2.7bn), primarily related to Maersk
Drilling and Maersk Tankers.
Total S .A . acquires Maersk OilMaersk Oil was the first of the four oil
and oil-related businesses for which
a structural solution was established
when A.P. Moller - Maersk entered
into an agreement on 21 August 2017
to sell Maersk Oil to Total S.A. for an
enterprise value of USD 7,450m (debt-
free basis before any closing adjust-
ments) in a combined share and debt
transaction.
A.P. Moller - Maersk has been the main
operator in the Danish North Sea
for half a century, establishing and
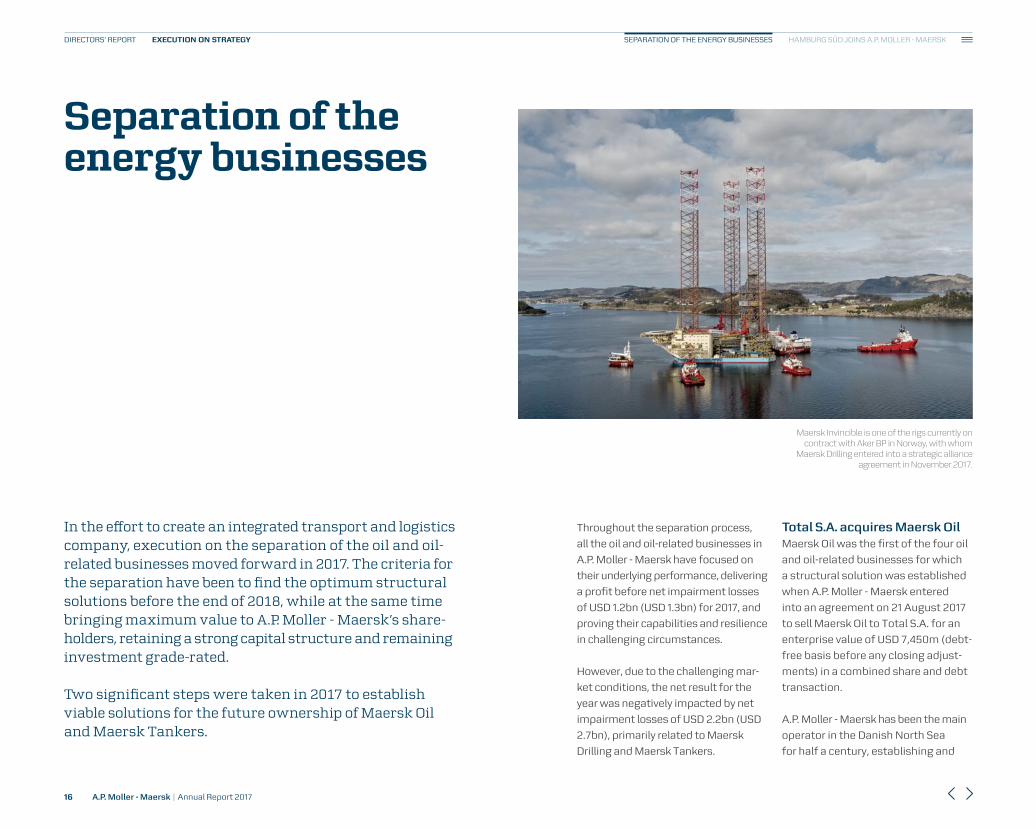
Maersk Invincible is one of the rigs currently on contract with Aker BP in Norway, with whom
Maersk Drilling entered into a strategic alliance agreement in November 2017.
Separation of the energy businesses
SEPARATION OF THE ENERGY BUSINESSES HAMBURG SÜD JOINS A.P. MOLLER - MAERSK DIRECTORS’ REPORT EXECUTION ON STRATEGY
A.P. Moller - Maersk | Annual Report 201716

On board the tanker vessel MARIE MÆRSK, His Royal Highness Prince Henrik, in the presence of Mærsk Mc-Kinney Møller, opened the taps that allowed the first Danish oil to flow ashore on 1 August 1972.
maintaining Denmark’s position as
self-sufficient within oil and gas. With
Maersk Oil at the forefront, the Danish
oil and gas industry has contributed
DKK 400bn in taxes to Denmark and
provided employment to 15,000 people
in the sector over the past 50 years.
In determining the best future owner-
ship structure for Maersk Oil, it has
been essential that the capabilities
and assets created in Maersk Oil can
continue to be developed, and that
long-term investments are upheld,
especially in the Danish part of the
North Sea.
Maersk Oil will become part of the
world’s fourth-largest oil and gas com-
pany with a strong performance record
and long-term growth and investment
interest in the oil and gas sector. Total
S.A. will take over Maersk Oil’s entire
portfolio, obligations and rights with
a continued Danish stronghold in
the North Sea. Furthermore, Maersk
Oil will remain close to its technology
and innovation partners at the Danish
technical institutions and in the oil and
gas service industry for the benefit of
all parties.
A.P. Moller - Maersk will receive 97.5m
shares in Total S.A. with a value of USD
4.95bn at the time of signing, equal to
approx. 3.76% of Total S.A. (after issu-
ing shares to A.P. Moller - Maersk). In ad-
dition to the shares, A.P. Moller - Maersk
will receive cash proceeds of USD 2.5bn
before closing adjustments. The sale
is based on a locked box transaction,
whereby all cash flows from Maersk Oil
from 30 June 2017 until closing belong
to Total S.A. As compensation for the
lost cash flows, A.P. Moller - Maersk will
receive a locked box interest of 3% p.a.
of the enterprise value.
The cash proceeds will be used by
A.P. Moller - Maersk to reduce debt.
Subject to meeting its investment
grade objective, A.P. Moller - Maersk
plans to return a material portion of
the value of the received Total S.A.
shares to the A.P. Moller - Maersk
shareholders during 2018/2019 in the
form of extraordinary dividend, share
buy-back and/or distribution of Total
S.A. shares.
Calculated as of 30 June 2017, the
transaction gain after tax amounted
to USD 2.8bn. The accounting gain
will be recorded partly from earnings
until closing and the residual at closing
minimal preconditions, and is commit-
ted to upholding the planned develop-
ment schedules and investments to
ensure the continued development of
Maersk Oil’s worldwide strategic and
selective assets.
As a testament to Maersk Oil’s capa-
bilities and strong position, the Copen-
hagen office will form the future regional
hub for Total S.A.’s activities in Denmark,
Norway and the Netherlands, ensuring
SEPARATION OF THE ENERGY BUSINESSES HAMBURG SÜD JOINS A.P. MOLLER - MAERSK DIRECTORS’ REPORT EXECUTION ON STRATEGY
A.P. Moller - Maersk | Annual Report 201717

The Tyra field in the Danish
part of the North Sea.
together with changes in the Total S.A.
share price in the period up to closing.
At 7 February 2018, the Total S.A.
share price was EUR 44.76 per share,
equal to an added value of the shares
of USD 435m compared to 21 August
2017. The transaction is progressing
as planned towards an expected close
during Q1 2018, pending regulatory
approvals.
During the separation process,
Maersk Oil’s organisation continued
to focus strongly on the execution
of its strategy. In 2017, Maersk Oil
produced 220,000 barrels of oil per
day, and adapted its portfolio, or-
ganisation and cost level with a full
year 2017 NOPAT break-even price of
USD 30 per barrel. Maersk Oil has pro-
gressed the Culzean development as
planned and on budget. Furthermore,
in December, Danish Underground
Consortium, where Maersk Oil is the
operator, approved an investment of
approx. DKK 21bn (equal to approx.
USD 3.4bn) in the full redevelopment
of the Tyra gas field in the Danish
North Sea.
Maersk Tankers acquired by A .P . Moller HoldingA.P. Moller - Maersk entered into an
agreement on 20 September 2017
to sell Maersk Tankers to A.P. Moller
Holding for USD 1,171m in an all-cash
transaction. The transaction closed
on 10 October 2017, and the proceeds
from the transaction have been used
to reduce debt in A.P. Moller - Maersk.
Maersk Tankers has been part of
A.P. Moller - Maersk since 1928. Maersk
Tankers is one of the world’s largest
product tanker companies, transport-
ing refined oil products globally, and is
today a digital frontrunner in the indus-
try using digitisation to ensure higher
accuracy in forecasting the markets
and cargos. Maersk Tankers employs
3,100 people and operates 161 vessels.
In determining the future ownership
of Maersk Tankers, it was imperative
to secure a financially solid owner
with industry insight and a long-term
view on the inherent cyclical nature of
the tanker industry. This is to ensure
that Maersk Tankers can continue to
take advantage of market opportuni-
ties, as well as uphold the capabilities
and the organisation on which Maersk
Tankers’ strong name and global lead-
ing market position was built. Maersk
Tankers will continue to operate un-
der the name Maersk Tankers, using
the A.P. Moller - Maersk seven-pointed
-star logo as part of its brand.
Should the product tanker market
significantly improve with a rebound in
vessel values before the end of 2019,
the agreement entails a market upside
provision regulating total payment.
The potential adjustment is capped at
USD 200m.
As the transaction was between re-
lated parties, fairness opinions were
obtained from Morgan Stanley & Co.
Int. Plc and DNB Bank ASA, which
confirmed that the transaction value
including the agreed price adjustment
mechanism was fair from a financial
point of view.
Maersk Drilling and Maersk Supply ServiceOver the last three to six months, there
have been signs of improved market
conditions in the offshore industry.
Even though day rates are still at a low
level, the slight pick-up in the oil price
and the activity level is a positive devel-
opment. This has, among other things,
raised confidence in finding structural
solutions for both Maersk Drilling and
Maersk Supply Service before the end
of 2018, which is why both businesses
are classified as assets held for sale
and discontinued operations in the
consolidated financial statements.
SEPARATION OF THE ENERGY BUSINESSES HAMBURG SÜD JOINS A.P. MOLLER - MAERSK DIRECTORS’ REPORT EXECUTION ON STRATEGY
A.P. Moller - Maersk | Annual Report 201718

Maersk Drilling reported a loss of
USD 1.5bn (loss of USD 709m), neg-
atively impacted by an accounting
impairment of USD 1.75bn following
the classification as discontinued
operations. The result was further
negatively impacted by a number
of idle rigs and the expiration of
contracts signed at higher day rates
and an accounting loss from the sale
of the shares in the Egyptian Drilling
Company (EDC) of USD 47m. The re-
sult was positively impacted by high
operational uptime and cost savings.
The result for 2016 was negatively im-
pacted by impairments of USD 1.5bn.
The operational performance across
the fleet resulted in an average oper-
ational uptime of 98% (98%) for the
jack-up rigs and 98% (98%) for the
deepwater rigs.
By the end of Q4 2017, Maersk Drilling’s
forward contract coverage was 63%
for 2018, 35% for 2019 and 25% for
2020. The total revenue backlog
amounted to USD 3.3bn (USD 3.7bn)
at the end of 2017.
Maersk Drilling continues to reduce
costs, with costs 5% lower in 2017
than in 2016, excluding exchange rate
effects and savings from stacked rigs.
Maersk Drilling continues to evaluate
stacking on a case-by-case basis and,
to date, all idle rigs have been warm
stacked, improving their potential for
market re-entry.
Maersk Drilling remains committed
to increasing efficiencies for its cus-
tomers and reducing offshore oil pro-
duction costs through strategic part-
nerships and new business models. In
line with this, Maersk Drilling entered
into an alliance agreement with Aker
BP in November 2017. The alliance is
founded on a unique collaboration
model, which aims to lower the cost
per barrel for Aker BP and increase
profitability for the alliance partners.
In the alliance, Maersk Drilling will
utilise its high-performance jack-up
rigs as a platform to implement digital
solutions, which will improve drilling
efficiency and ultimately shorten the
lead time from discovery to first oil.
One of Maersk Tankers’ newest MR vessels, Maersk Tangier, during an operation in Singa-pore in June 2017.
The marketDespite an increase in oil price, activity
levels in the offshore drilling industry
declined for the third year in a row. The
total number of floaters on contract
decreased by approx. 14% to 150 units
when compared to 2016, while jack-up
rigs decreased by approx. 3% to 320
units. Maersk Drilling does not expect
to see significant improvements in
offshore rig demand until the market
reaches a stable oil price above USD
60 per barrel or until lifting cost levels
adjust to a lower oil price.
In conjunction with the weak demand
for drilling rigs, the significant excess
capacity in global rig supply continues
to adversely affect the offshore drilling
industry. Capacity reduction in the
offshore drilling fleet continues to be
negligible and the newbuild orderbook
remains all but unchanged compared
to 2016. Without a considerable im-
provement in offshore rig demand, this
confluence of factors is expected to
result in total industry utilisation and
day rates to remain depressed.
Leading indicators, however, showed
signs of support for future drilling rig
activity. Buoyed by an increase in ten-
dering activity, the number of contracts
awarded globally has risen approx. 20%
compared to 2016, while the average
duration of these contracts remained
largely unchanged.
The offshore drilling industry has
in 2017 continued to strengthen its
competitiveness through operational
SEPARATION OF THE ENERGY BUSINESSES HAMBURG SÜD JOINS A.P. MOLLER - MAERSK DIRECTORS’ REPORT EXECUTION ON STRATEGY
A.P. Moller - Maersk | Annual Report 201719

The marketThe industry continues to be charac-
terised by oversupply, financial restruc-
turings and consolidation and Maersk
Supply Service expects market outlook
for the industry to remain subdued in
the near and mid-term. The market
demand remains challenged due to the
low activity in the offshore industry,
Maersk Supply Service successfully
completed the tow-out of the Hebron
drilling and production platform
in East Canada in June, generating
significant revenue in Q2. Six Maersk
Supply Service vessels safely trans-
ported the 750,000 tonnes heavy
platform, one of the largest offshore
structures ever built.
and thus the offshore supply vessel
industry has approximately 30% of ves-
sels laid up globally, including Maersk
Supply Service with 15 (11) vessels laid
up end of 2017.
efficiency improvements, integrated
alliances and partnerships, financial
restructuring, and mergers and acqui-
sitions. Further gains from direct cost
cutting measures are becoming more
difficult given the significant reduc-
tions that have already been achieved
For Maersk Supply Service, the mar-
ket situation remains challenged.
Maersk Supply Service reported a
loss of USD 251m (loss of USD 1.2bn),
negatively impacted by impairments
of USD 180m (USD 1.2bn) because of
oversupply and reduced long-term
demand expectations due to lower
offshore spending.
Maersk Supply Service’s Integrated
Solutions business has shown satis-
factory progress during 2017 by adding
new clients, larger work scopes and new
regions. Two contracts were awarded
in Brazil and Angola, illustrating how
Maersk Supply Service helps to solve its
customers’ challenges by firstly offer-
ing a vessel and subsequently project
management and engineering capa-
bilities. Both projects will enhance the
geographical footprint.
Maersk Supply Service was awarded
the project management of the com-
plete towing, mooring installation and
hook-up service scopes for the Culzean
project in the North Sea in the UK by
Maersk Oil, and continued its work on
the Janice decommissioning project,
where an innovative approach was ap-
plied to pipe removal, saving both time
and cost.
Since joining the Maersk Supply Service fleet in
March 2017, Maersk Master has worked
on decom missioning projects in the North Sea, towed a drilling
rig from Europe to Australia, and won
the OSJ Vessel of the Year Award.
SEPARATION OF THE ENERGY BUSINESSES HAMBURG SÜD JOINS A.P. MOLLER - MAERSK DIRECTORS’ REPORT EXECUTION ON STRATEGY
A.P. Moller - Maersk | Annual Report 201720

Introduction to Hamburg SüdAt the time of acquisition, Hamburg
Süd was the world’s seventh-largest
container shipping line operating 106
owned and chartered vessels with an
average age of six years and slot ca-
pacity of 590,000 TEU. Hamburg Süd
has 6,300 employees and more than
250 offices worldwide, and markets its
services through the brands Hamburg
Süd and Aliança (based in Brazil). Ham-
burg Süd is a leader in the North-South
trades (see combined capacity market
share by trade on page 23).
As from 1 December 2017, Hamburg
Süd is a fully owned subsidiary of
Maersk Line A/S, and is therefore in-
cluded in the consolidated financial
reporting from this date. The table
below sets out the contribution of
Hamburg Süd’s container activities
for December 2017, stand-alone
figures for Maersk Line for 2017 and
unaudited pro forma information as
if the acquisition had occurred on
1 January 2017 (Pro forma full year):
Hamburg Süd joins A.P. Moller - Maersk
CONTRIBUTION OF HAMBURG SÜD’S CONTAINER ACTIVITIES
USD million 2017 Actual 2017 Pro forma
Hamburg Süd contribution from acquisition date to
31 December 2017
Maersk Line stand-alone excluding Hamburg Süd
contribution (A)
Combined Maersk Line and Hamburg Süd1
Hamburg Süd pro forma full year
(B)
Pro forma full year Combined Maersk Line
and Hamburg Süd(A+B)
Revenue 458 23,793 24,299 5,416 29,209
Profit before depreciation, amortisation and impairment losses, etc. (EBITDA) -5 2,631 2,624 554 3,185
Profit before financial items (EBIT) -43 744 700 80 824
Underlying profit/loss -8 521 511 85 606
1 Including adjustments and eliminations, etc.
On 1 December 2016, it was announced that Maersk Line and the Oetker Group had reached an agreement for Maersk Line to acquire 100% of the shares in the German container shipping line Hamburg Süd. Following final approvals by the competition authorities, the transaction closed on 30 November 2017 on payment of the purchase price to the Oetker Group.
CAPACITY MARKET SHARE
~19%
Hamburg Süd ~2 .6%
Maersk Line ~16 .7%
Source: Alphaliner, end December 2017.
Hamburg Süd 0 .5m
Maersk Line 3 .6m
SLOT CAPACITY (TEU) end November 2017
4.1m
DIRECTORS’ REPORT EXECUTION ON STRATEGY
A.P. Moller - Maersk | Annual Report 201721
SEPARATION OF THE ENERGY BUSINESSES HAMBURG SÜD JOINS A.P. MOLLER - MAERSK

To have a comparable basis for the
development during 2017 in Maersk
Line, the contribution of Hamburg Süd
for December 2017 is excluded from
the financial review section for Maersk
Line on page 31.
The presented pro forma figures for
Hamburg Süd are based on unaudited
internal management accounts, ad-
justed to take into account additional
information available at the time of
acquisition, including translation
of prior German GAAP accounting
figures to IFRS for the most mate-
rial areas. Due to impracticalities,
revenue recognition and functional
currency are not fully conformed to
the accounting practice applied by
Maersk Line. Further, intercompany
companies’ strengths, customers
will be offered enhanced services
with better market coverage, direct
services and other benefits from a
combined global network.
With the acquisition, Maersk Line ex-
pects to grow the global capacity mar-
ket share to approx. 19% and the nom-
inal slot capacity to around 4.1m TEU.
In general, the expectation is that the
transaction will boost the combined
company’s presence on North-South
shipping routes, which will also deliver
growth to APM Terminals.
From the outset, the integration
model has been designed to retain
both the Hamburg Süd and Aliança
brands including the related customer
experience. Further, the Hamburg
Süd head office in Hamburg will be
retained, as will separate and inde-
pendent commercial global front-line
functions, including global sales and
customer service departments. Oper-
ational execution around vessels and
equipment will be integrated to drive
maximum synergies.
Annual synergies of USD 350-400m
are expected to be realised as from
2019, primarily derived from:
• Integrating and optimising the
vessel network both on ocean and
feeder legs
• Standardised supplier contracts
realising scale efficiencies
• Additional volumes in ports owned
by APM Terminals, especially in
South America.
revenue and costs between Maersk
Line and Hamburg Süd have not been
eliminated. Given the inherent uncer-
tainty relating to the estimates and
assumptions applied, the presented
pro forma figures will not necessarily
equate to the actual figures that the
combined entity would have gener-
ated if the acquisition of Hamburg
Süd had been completed on 1 January
2017, and had they been prepared
fully in accordance with the account-
ing policies of Maersk Line.
In 2017, the pro forma revenue of
Hamburg Süd’s container activities
amounted to USD 5,416m, reflecting
an increased market share over the
year. Pro forma EBITDA amounted to
USD 554m, equal to an EBITDA margin
of 10%. The pro forma underlying profit
amounted to USD 85m, impacted by
the purchase price allocation effects,
including the amortisation of intan-
gible assets in the form of customer
relationships and brands.
The pro forma figures for 2017 dis-
closed above may not be predictive of
future results and, accordingly, com-
menting on the future development
of the combined entity is only possible
to a very limited extent.
Integration of Hamburg SüdCompleting the acquisition of Ham-
burg Süd brings together two of the
world’s largest shipping companies,
each with a long history and a proud
heritage. By combining the two
MAERSK LINE
Hamburg Süd
106 vesselsAverage fleet age — 6 years
Maersk Line
680 vesselsAverage fleet age — 9 years
Combined vessel fleet end November 2017
786vessels
(owned and chartered)
EMPLOYEES
6,300 31,600
REEFERS (units)
83,250 282,000
DIRECTORS’ REPORT EXECUTION ON STRATEGY
A.P. Moller - Maersk | Annual Report 201722
SEPARATION OF THE ENERGY BUSINESSES HAMBURG SÜD JOINS A.P. MOLLER - MAERSK

Intra Asia
8%
Oceania
24%West central Asia
17%Africa
34%Latin America
35%
Asia-Europe
21%Atlantic
14%Paci�c
10%
Intra Europe
16%
No. 2
No. 1
No. 1
No. 2
Intra America
28%
No. 1
No. 3No. 3
No. 1 No. 1 No. 1
By combining the two companies, the
enlarged group is also expected to be
able to drive down costs through busi-
ness scale efficiencies.
In 2018, integration costs of approx.
USD 100m are expected, among other
things related to optimising the vessel
network and integrating IT systems.
Consideration paid, purchase price allocation and goodwillAt the close of the acquisition, the
purchase price of EUR 3.7bn on a
debt-free basis (Enterprise Value)
COMBINED CAPACITY MARKET SHARE BY TRADE
East-West
North-South
Intra-regional
Source: Alphaliner, end December 2017.
was paid in a cash settlement equal
to USD 4.4bn (Equity Value including
impact from hedging of the EUR ex-
posure). In accordance with IFRS, the
acquired net assets of Hamburg Süd
have been measured at fair value us-
ing the acquisition method Purchase
Price Allocation (PPA). A large com-
ponent thereof is the identification
and assignment of the fair market
value of all intangible assets, prop-
erty, plant and equipment and other
assets acquired, as well as liabilities
and contingent liabilities assumed in
the acquisition.
At the acquisition date of 1 December
2017, the overall provisional PPA
indicates the following material net
assets:
• Customer relationships, USD 731m
• Brands, USD 412m
• Vessels (owned), USD 2,403m
• Containers (owned), USD 686m
• Containers (finance leases),
USD 707m.
And liabilities:
• Finance lease obligations, USD 606m
• Unfavourable contracts, USD 317m.
As at 31 December 2017, the provisional
PPA resulted in the recognition of a
goodwill of USD 388m, equal to approx.
9% of the purchase price paid. This
goodwill consists of, among others, the
buyer-specific synergies expected from
the integration (see above).
Further details, are set out in note 21
to the consolidated financial state-
ments.
DIRECTORS’ REPORT EXECUTION ON STRATEGY
A.P. Moller - Maersk | Annual Report 201723
SEPARATION OF THE ENERGY BUSINESSES HAMBURG SÜD JOINS A.P. MOLLER - MAERSK

STRATEGY AND PERFORMANCE
Business model | Strategy | Performance in 2017
A.P. Moller - Maersk | Annual Report 201724
DIRECTORS’ REPORT STRATEGY AND PERFORMANCE

Our vision is new, and every word has
a particular meaning.
A global company with customers,
colleagues and business partners all
across the globe – a prerequisite to
compete and win in our markets.
Becoming an integrator taking full
accountability for the end-to-end
services we deliver to our customers,
by controlling critical assets in the
delivery network and by integrating
data flows across the value chain.
Container shipping is an integral
part of the global supply chain, and
is where we have a world leading
position. It is from this foundation
that we will build our future.
Developing into a shipping, ports and
logistics company with a broad port-
folio of products and solutions, deliv-
ered at scale, according to our promise.
We want to connect the dots in the
supply chain, leveraging data and ad-
vanced analytics to give our custom-
ers increased visibility and control.
Applying new technologies and lever-
aging data to simplify complex supply
chains, thereby allowing our custom-
ers to serve their customers better.
It starts and ends with customers.
We must continue to strengthen this
focus to become a truly customer-
centric company, serving our custom-
ers’ individual needs.
Our scope of service will be the full
supply chain of our customers, and
the primary focus will be on solving
customers’ supply chain needs.
Our vision is to become the global integrator of container logistics, aiming to connect and simplify our customers’ supply chains.
Business model
MAERSK LINE
SVITZER
APM TERMINALS
DAMCO
MAERSK CONTAINER INDUSTRY
BUSINESS MODEL STRATEGY PERFORMANCE IN 2017DIRECTORS’ REPORT STRATEGY AND PERFORMANCE
A.P. Moller - Maersk | Annual Report 201725

Growth rates and other market dy-
namics differ significantly between
the different market segments.
Over the last five years, global con-
tainer volumes increased by a decent
3.7% on average, albeit lower than
pre-crisis average growth, and highly
variable from year-to-year, touching
a low of 1% growth in 2015 and a high
of around 5% growth in 2017. The
container market has remained under
pressure over this period because the
supply of new capacity has grown by
The marketTotal revenue in the market in which
A.P. Moller - Maersk operates is es-
timated to be around USD 900bn.
Approximately half of this revenue is
generated by asset operations (ship-
ping, terminals, warehouses, inter-
modal, air cargo), while the other half
stems from third and fourth-party
logistics (freight forwarding, contract
logistics, supply chain management).
The market is illustrated in the figure
on page 27, and is referred to as the
container logistics market.
A.P. Moller - Maersk announced in September 2016 that it would depart from the ‘Premium Conglomerate’ strategy, and pursue a new strategy to become an integrated container shipping, logistics and ports company, and consequently to find new structural solutions for its energy-related businesses. Since then, A.P. Moller - Maersk has been organised under two divisions, Transport & Logistics and Energy.
A.P. Moller - Maersk will lead the transformation of the container transport and logistics industry through offering customers more integrated services, and by using data and digital technology to create opportunities through the end-to-end container logistics value chain.
This strategy review is for the continuing business, with activities within transport and logistics.
Strategy 5.4% on average, faster than demand.
Consequently, the EBIT margin for the
container shipping industry averaged
1.4% over the last five years (Drewry
Maritime Research).
Supported by strong demand growth,
earnings in the container liner industry
strengthened in 2017 compared to
the weak 2016. Nevertheless, market
fundamentals remain challenging
due to the abundance of global vessel
capacity. The industry has responded
by further consolidation; COSCO
acquired OOCL (pending regulatory
approval), and A.P. Moller - Maersk
acquired Hamburg Süd, while UASC
and Hapag-Lloyd completed their
merger in 2017. Furthermore, the
three Japanese carriers NYK, K Line
and MOL are still preparing for a joint
venture, which will be launched in
2018. The current wave of mergers in
the industry, which started with the
merger of Hapag-Lloyd and CSAV in
2014, has increased the top five mar-
ket share in the industry from 45% in
2014 to 64%, once the COSCO/OOCL
deal and the Japanese joint venture
have been implemented in Q1 2018.
The container port industry has also
benefited from strong demand growth
of 6% in 2017 (Drewry Q4 Forecaster).
Nevertheless, structural challenges
from the cascading of large container
vessels, reinforced carrier alliances
and increased point-to-point services,
combined with ongoing capacity
increases in many ports, continue to
weigh on the industry. The increased
2014 Q1 2018
TOP FIVE MARKET SHARE
45%64%
29,209Revenue (USD million)
37,900Employees
3,185EBITDA (USD million)
1 Pro forma including full year Hamburg Süd.
MAERSK LINE
The world´s largest container shipping company1
4,138Revenue (USD million)
22,192Employees
705EBITDA (USD million)
APM TERMINALS
Provides port and inland infrastructure to drive global commerce
2,668Revenue (USD million)
10,993Employees
-4EBITDA (USD million)
DAMCO
Provider of freight forwarding and supply chain manage ment services
659Revenue (USD million)
2,760Employees
197EBITDA (USD million)
SVITZER
Has provided safety and support at sea since 1833
1,016Revenue (USD million)
5,393Employees
87EBITDA (USD million)
MAERSK CONTAINER INDUSTRY
Develops and manufactures refrigerated and dry containers and StarCoolTM refrigeration machine
DIRECTORS’ REPORT STRATEGY AND PERFORMANCE
A.P. Moller - Maersk | Annual Report 201726
BUSINESS MODEL STRATEGY PERFORMANCE IN 2017

load on the terminals is triggering
requirements for upgrades of the ter-
minal infrastructure, equipment, man-
ning and planning capabilities, leading
to more capital expenditure and oper-
ational cost, but lower utilisation. At
the same time, carriers are looking for
ways to reduce their terminal costs,
which have become the largest single
cost item. The pick-up in global trade
volumes in 2017 has supported the
broader logistics segment. However,
there is variation across this segment.
Gross margins in the freight forward-
ing market remain under structural
end-to-end or bundled services are
typically not the companies in oper-
ational control of the critical assets.
There are no players in the contain-
erised logistics space offering opera-
tionally integrated services as seen in
the CEP industry.
A.P. Moller - Maersk believes, that
within the next 3-5 years, it should
be as easy to ship a container across
the world as it is today for consumers
to send a parcel with any of the CEP
operators. By building on the strong
operational heritage and leading the
way in the digitisation of the industry,
A.P. Moller - Maersk will change the way
container logistics is done. This will be
achieved by offering a much- improved
customer experience, thereby enabling
customers to simplify and optimise
their supply chain.
pressure from digital offerings.
Freight forwarders are attempting
to mitigate these pressures by sell-
ing value-added services on top of
basic freight forwarding products
and by developing their own digi-
tal offerings to stay ahead of new
entrants. Contract logistics, a frag-
mented market, has experienced
rapid growth in 2017, supported by a
demand for fulfilment activities from
the booming e-commerce segment.
Supply chain management also grew
robustly with a few focused players
increasing value-added services
through digitalised offerings.
MARKET SIZE (REVENUE) (USDbn, 2016) EXPECTED INDUSTRY GROWTH (2018-2021)
180
245
+900
40
100
50
60
150
100
Containerised intermodal
Container terminal and coastal storage
Warehousing
Container shipping
Air cargo
Traditional freight forwarding
Contract logistics
Fourth-party logistics and supply
chain services
Total
Second-party logistics Third and fourth-party logistics
Growth above global GDP growth Growth in line with global GDP growth Growth below global GDP growth
A.P. Moller - Maersk believes, that within the next 3-5 years, it should be as easy to ship a container across the world as it is today for consumers to send a parcel.
Opportunities in the market placeBesides being a sizeable and growing
market, there are significant value cre-
ation opportunities in container logis-
tics through fundamentally changing
the way customers are served.
The standard customer experience in
container logistics today is far from
what consumers experience when
shipping a parcel with companies
such as UPS, FedEx, DHL and other
courier, express and parcel (CEP) op-
erators. The root causes are several,
but the manual and paper-based
nature of many of the underlying pro-
cesses in container logistics is one
of the most important. Furthermore,
the separation between operators
and third-party logistics providers is
another. Those companies offering
DIRECTORS’ REPORT STRATEGY AND PERFORMANCE
A.P. Moller - Maersk | Annual Report 201727
BUSINESS MODEL STRATEGY PERFORMANCE IN 2017

• Seamless customer engagement:
Offering proactive, tailored and
value-adding service through
connected, digital and engaging
interfaces with A.P. Moller - Maersk’s
customers.
• Superior delivery network end-
to-end: Operating the industry’s
largest, most reliable and most
cost-competitive network on all
markets that matter to customers.
With these three building blocks,
A.P. Moller - Maersk aims to reposition
itself to compete on differentiation,
service level and customer satisfac-
tion, while safeguarding cost leader-
ship and competitiveness.
The starting point and license to winA.P. Moller - Maersk’s transport and
logistics businesses command a
unique position across the container
logistics value chain. Maersk Line is
the world’s largest container carrier,
APM Terminals is the fourth-largest
container terminal operator, while
Damco has outstanding capabilities in
supply chain management as well as
solid experience in freight forwarding.
By integrating the businesses across
the different value chain segments,
A.P. Moller - Maersk can offer a better
value proposition to its customers in
two ways; A.P. Moller - Maersk can de-
liver bundles of services to meet cus-
tomer needs along with a single point
of accountability for the delivery, and
A.P. Moller - Maersk is operationally in
control of the critical parts of the de-
livery network.
Operational control of the ocean net-
work (vessels, transhipment hubs and
gateway terminals) is an essential
element in delivering better service
to container logistics customers. Ef-
ficient operations mean lower costs
for customers, but more importantly,
they make it possible to control the
quality of the physical flow. Further-
more, as the transport and logistics
industry digitises further, control of
the container fleet means an ability to
turn containers into smart boxes and
data generators, and thereby create
additional value for A.P. Moller - Maersk
customers. This value can stem from
improved real-time, end-to-end visibility
of the customers’ supply chains, data
flows to reduce cost, or the use of
analytics to innovate the customers’
supply chains.
The growth ambitionThe new strategy focuses on organic,
adjacent as well as acquisitive growth.
Organically, A.P. Moller - Maersk
is targeting slightly above-market
volume growth for most of its busi-
nesses in the coming years, and
with the acquisition of Hamburg
Süd, A.P. Moller - Maersk has already
achieved a significant element of ac-
quisitive growth.
This is expressed in A.P. Moller - Maersk’s
new vision that was announced in
December 2016.
A .P . Moller - Maersk’s vision and strategyA.P. Moller - Maersk’s vision of becom-
ing the ‘global integrator of container
logistics connecting and simplifying
our customers’ supply chain’ can be
broken down into the following three
strategic building blocks:
• Simple end-to-end offering of
products and services: Developing
a broader, scalable and flexible
portfolio of products and solutions
to serve all our customers’ supply
chain needs.
DIRECTORS’ REPORT STRATEGY AND PERFORMANCE
A.P. Moller - Maersk | Annual Report 201728
BUSINESS MODEL STRATEGY PERFORMANCE IN 2017
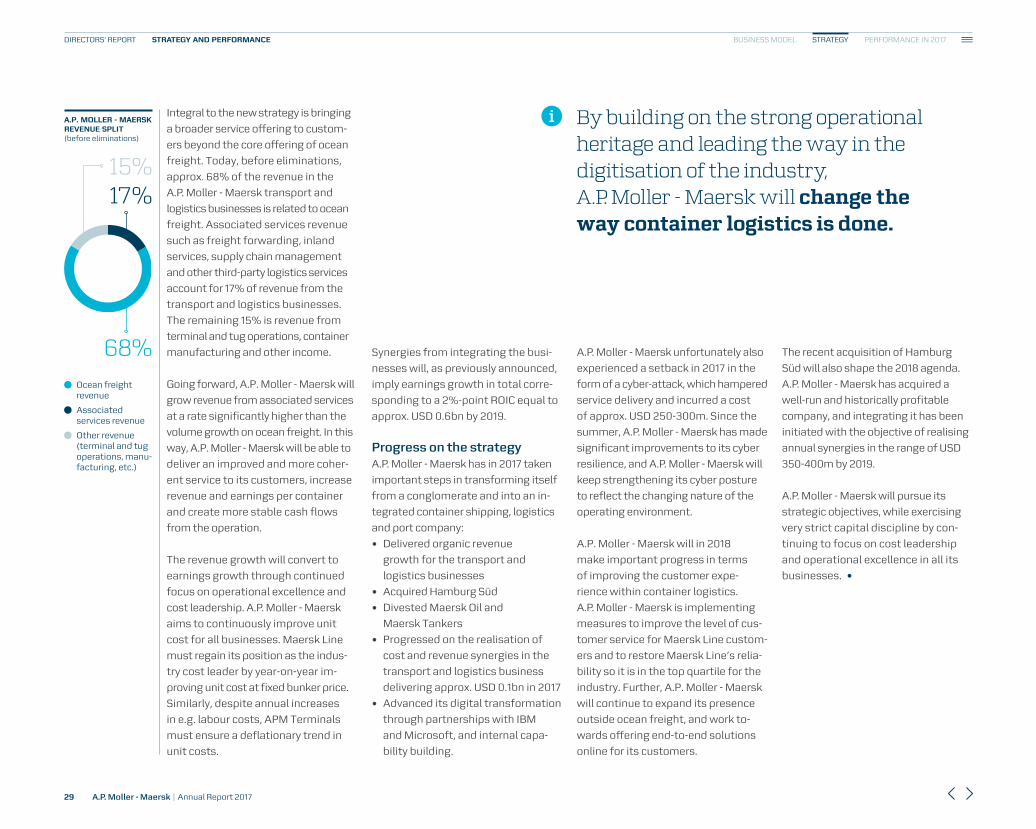
A.P. Moller - Maersk unfortunately also
experienced a setback in 2017 in the
form of a cyber-attack, which hampered
service delivery and incurred a cost
of approx. USD 250-300m. Since the
summer, A.P. Moller - Maersk has made
significant improvements to its cyber
resilience, and A.P. Moller - Maersk will
keep strengthening its cyber posture
to reflect the changing nature of the
operating environment.
A.P. Moller - Maersk will in 2018
make important progress in terms
of improving the customer expe-
rience within container logistics.
A.P. Moller - Maersk is implementing
measures to improve the level of cus-
tomer service for Maersk Line custom-
ers and to re store Maersk Line’s relia-
bility so it is in the top quartile for the
industry. Further, A.P. Moller - Maersk
will continue to expand its presence
outside ocean freight, and work to-
wards offering end-to-end solutions
online for its customers.
Integral to the new strategy is bringing
a broader service offering to custom-
ers beyond the core offering of ocean
freight. Today, before eliminations,
approx. 68% of the revenue in the
A.P. Moller - Maersk transport and
logistics businesses is related to ocean
freight. Associated services revenue
such as freight forwarding, inland
services, supply chain management
and other third-party logistics services
account for 17% of revenue from the
transport and logistics businesses.
The remaining 15% is revenue from
terminal and tug operations, container
manufacturing and other income.
Going forward, A.P. Moller - Maersk will
grow revenue from associated services
at a rate significantly higher than the
volume growth on ocean freight. In this
way, A.P. Moller - Maersk will be able to
deliver an improved and more coher-
ent service to its customers, increase
revenue and earnings per container
and create more stable cash flows
from the operation.
The revenue growth will convert to
earnings growth through continued
focus on operational excellence and
cost leadership. A.P. Moller - Maersk
aims to continuously improve unit
cost for all businesses. Maersk Line
must regain its position as the indus-
try cost leader by year-on-year im-
proving unit cost at fixed bunker price.
Similarly, despite annual increases
in e.g. labour costs, APM Terminals
must ensure a deflationary trend in
unit costs.
Synergies from integrating the busi-
nesses will, as previously announced,
imply earnings growth in total corre-
sponding to a 2%-point ROIC equal to
approx. USD 0.6bn by 2019.
Progress on the strategyA.P. Moller - Maersk has in 2017 taken
important steps in transforming itself
from a conglomerate and into an in-
tegrated container shipping, logistics
and port company:
• Delivered organic revenue
growth for the transport and
logistics businesses
• Acquired Hamburg Süd
• Divested Maersk Oil and
Maersk Tankers
• Progressed on the realisation of
cost and revenue synergies in the
transport and logistics business
delivering approx. USD 0.1bn in 2017
• Advanced its digital transformation
through partnerships with IBM
and Microsoft, and internal capa-
bility building.
A.P. MOLLER - MAERSK REVENUE SPLIT (before eliminations)
Ocean freight revenue
Associated services revenue
Other revenue (terminal and tug operations, manu-facturing, etc.)
68%
15%17%
The recent acquisition of Hamburg
Süd will also shape the 2018 agenda.
A.P. Moller - Maersk has acquired a
well-run and historically profitable
company, and integrating it has been
initiated with the objective of realising
annual synergies in the range of USD
350-400m by 2019.
A.P. Moller - Maersk will pursue its
strategic objec tives, while exercising
very strict capital discipline by con-
tinuing to focus on cost leadership
and operational excellence in all its
businesses.
By building on the strong operational heritage and leading the way in the digiti sation of the industry, A.P. Moller - Maersk will change the way container logistics is done.
DIRECTORS’ REPORT STRATEGY AND PERFORMANCE
A.P. Moller - Maersk | Annual Report 201729
BUSINESS MODEL STRATEGY PERFORMANCE IN 2017

PERFORMANCE IN 2017
Maersk Line | APM Terminals | Damco | Svitzer | Maersk Container Industry
A.P. Moller - Maersk | Annual Report 201730
DIRECTORS’ REPORT STRATEGY AND PERFORMANCE

Maersk Line(Excluding Hamburg Süd)
Maersk Line reported an increase in revenue of 14.9% to USD 23.8bn, and an underlying profit of USD 521m (loss of USD 384m), equal to an improvement of USD 905m. Cash flow from operating activities increased to USD 2.4bn (USD 1.1bn).
23.8bnREVENUE 2017 (USD)
521m
UNDERLYING PROFIT 2017 (USD)
DIRECTORS’ REPORT STRATEGY AND PERFORMANCE
A.P. Moller - Maersk | Annual Report 201731
BUSINESS MODEL STRATEGY PERFORMANCE IN 2017 | MAERSK LINE

Revenue increased by 14.9% to USD
23.8bn (USD 20.7bn) driven by an 11.7%
increase in the average freight rate to
2,005 USD/FFE (1,795 USD/FFE) and by
a 3.0% increase in volumes to 10,731k
FFE (10,415k FFE) despite the negative
impact of the cyber-attack. The volume
increase was driven East-West by 2.4%,
North-South by 2.2% and Intra-regional
by 7.3%. The increase in volume reflects
a strong market demand, with esti-
mated growth of around 5% compared
to 2016.
Freight rates increased across all
trades, as East-West rates increased
19.3%, North-South rates increased
8.9% and Intra-regional rates increased
2.4%. East-West freight rates were
driven primarily by Europe trades, while
North-South rates were driven by all
trade clusters led by West Central
Asia and Africa trades. The increase in
freight rates was a result of a record
low level in 2016. The reported 2017
freight rates peaked in Q2 2017, fol-
lowed by a slowdown especially from
the beginning of Q4 2017 and for the
remainder of the year. As a result,
recognised freight revenue ended at
USD 21.4bn (USD 18.6bn). Other reve-
nue ended at USD 2.4bn (USD 2.1bn).
The total unit cost of 2,079 USD/FFE
(1,982 USD/FFE) was 4.9% higher than
in 2016, while the unit cost at fixed
bunker price was 0.2% above 2016. The
unit cost at fixed bunker was negatively
impacted by lower headhaul utilisation
as well as lower backhaul volumes. The
total unit cost was further negatively
The global container demand was strong in 2017,
despite a slowdown in the second half of the year
following a strong first half, which resulted in
increased freight rates compared to the previous
year. Maersk Line grew volumes by 3.0%, with vol-
umes above market growth in Q4.
The year was challenged by a cyber-attack and
bunker price increases, however Maersk Line re-
turned to profit with a significant improvement
compared to the disappointing 2016.
The acquisition of Hamburg Süd and the divestment
of Mercosul Line were completed in December 2017.
MAERSK LINE FINANCIAL HIGHLIGHTS (excluding Hamburg Süd)
USD million 2017 2016
Revenue 23,793 20,715
Profit/loss before depreciation, amortisation and impairment losses, etc. (EBITDA) 2,631 1,525
Depreciation, amortisation and impairment losses, net 1,997 1,946
Gain on sale of non-current assets, etc., net 110 25
Profit/loss before financial items (EBIT) 744 -396
Tax 160 +20
Net operating profit/loss after tax (NOPAT) 584 -376
Underlying profit/loss 521 -384
Cash flow from operating activities 2,389 1,060
Cash flow used for capital expenditure -1,960 -586
Invested capital 20,530 20,082
ROIC, annualised 2.9% -1.9%
Transported volumes (FFE in ‘000) 10,731 10,415
Average freight rate (USD per FFE) 2,005 1,795
Unit cost (USD per FFE incl. VSA income) 2,079 1,982
Average fuel price (USD per tonne) 320 223
Maersk Line fleet, owned 287 292
Maersk Line fleet, chartered 389 347
Fleet capacity (TEU in ‘000) 3,564 3,239
Maersk Line back to profit in an operationally challenged year
DIRECTORS’ REPORT STRATEGY AND PERFORMANCE
A.P. Moller - Maersk | Annual Report 201732
BUSINESS MODEL STRATEGY PERFORMANCE IN 2017 | MAERSK LINE

impacted by a 43% increase in the
average bunker price. The bunker cost
was USD 3.3bn (USD 2.1bn), and bunker
efficiency per loaded FFE deteriorated
by 4.7% to 953 kg/FFE (910 kg/FFE).
Part of the deterioration in bunker
efficiency per FFE is explained by the
increased capacity committed to car-
rying volumes from the slot purchase
agreements which are not counted as
loaded volume, while efficiency is also
impacted by lower headhaul utilisation,
lower backhaul volumes and, not least,
the June cyber-attack.
The EBIT margin gap to peers is esti-
mated at around 2% for the full year (Q4
2016 to Q3 2017), which is below the 5%
ambition level. The EBIT margin gap to
peers decreased compared to 2016 by
5.4%, among other things due to the
negative impact of the cyber-attack.
The Maersk Line fleet consisted of 287
owned vessels (2,054k TEU) and 389
chartered vessels (1,510k TEU) with a to-
tal capacity of 3,564k TEU by the end of
2017, an increase of 10.0% compared to
the end of 2016. Compared to Q3 2017
it represents an increase of 0.8% (30k
TEU). The increase compared to 2016
is partly due to more capacity being
deployed to accommodate the incom-
ing volumes from the slot purchase
agreement signed in Q1 2017 with
Hamburg Süd and Hyundai Merchant
TRANSPORTED VOLUMES
FFE (’000) 2017 2016 Change Change %
East-West 3,779 3,691 88 2.4
North-South 5,213 5,103 110 2.2
Intra-regional 1,739 1,621 118 7.3
Total 10,731 10,415 316 3.0
AVERAGE FREIGHT RATES
USD/FFE 2017 2016 Change Change %
East-West 2,142 1,795 347 19.3
North-South 2,148 1,973 175 8.9
Intra-regional 1,340 1,308 32 2.4
Total 2,005 1,795 210 11.7
Key initiatives in 2017
Maersk Line and the Oetker Group reached
an agreement on 1 December 2016 for
Maersk Line to acquire Hamburg Süd, and
the acquisition became effective from
1 December 2017. Maersk Line and CMA
CGM announced on 13 June an agreement
for CMA CGM to acquire Mercosul Line
subject to Brazilian regulatory approval and
the closing of Maersk Line’s acquisition of
Hamburg Süd. The divestment was effec-
tive from 1 December 2017, and resulted in
an accounting gain net of transaction costs
of USD 37m.
Maersk Line launched Remote Container
Management for customers in July. By
making each refrigerated container’s
location visible throughout its journey,
as well as the atmospheric conditions
inside each container, Remote Container
Management gives customers, shipping
refrigerated cargo, an unprecedented
understanding of their supply chain.
In Q2 2017, Maersk Line announced a collab-
oration with IBM on developing blockchain
solutions to digitise supply chain documen-
tation. In January 2018, A.P. Moller - Maersk
and IBM announced their intent to establish
a joint venture to provide more efficient
and secure methods for conducting global
trade using blockchain technology.
Trade Finance was first launched as a pilot
project in India in late 2015 followed by
successful launches in Singapore, Spain
and the Netherlands in 2016. In 2017, Trade
Finance was also launched for the UAE and
for six states in the USA. Trade Finance
simplifies the processes between banks,
transport providers and customers’ finance
departments. Through Trade Finance,
customers have a trade and financing
partner in Maersk Line.
Maersk Line took delivery in 2017 of five out
of 11 second-generation Triple-E’s and four
out of nine 15.2k TEU vessels, which had
been ordered in 2015. The new vessels have
replaced older and less efficient vessels,
and as part of this process Maersk Line
recycled 16 vessels in 2017. In total, Maersk
Line ordered 27 vessels in 2015, of which
the remaining 18 vessels will be delivered
until Q1 2019. In addition, the newbuilding
contract signed with Hyundai Heavy
Industries in 2015 to build nine vessels
with a 15.2k TEU capacity included an
option for up to eight additional vessels.
Out of these eight optional vessels, Maersk
Line in Q4 2017 decided to exercise the op-
tion to have two vessels delivered in 2019.
The two vessels will help meet increased
demand and form part of the ongoing net-
work optimisations.
DIRECTORS’ REPORT STRATEGY AND PERFORMANCE
A.P. Moller - Maersk | Annual Report 201733
BUSINESS MODEL STRATEGY PERFORMANCE IN 2017 | MAERSK LINE

Marine. Idle capacity at the end of 2017
was 24.1k TEU (three vessels), which
was flat compared to 24.7k TEU (three
vessels) of idle capacity at the end of
2016. Maersk Line’s idle capacity cor-
responds to around 6.3% of total idle
capacity in the market.
Cash flow from operating activities
excluding Hamburg Süd increased
by USD 1.3bn to USD 2.4bn compared
to 2016. Cash flow used for capital
expenditure excluding the acquisi-
tion of Hamburg Süd was USD 1.4bn
higher at USD 2.0bn, as Maersk Line
took delivery of nine newbuild ves-
sels. Excluding Hamburg Süd, Maersk
Line reported a free cash flow of USD
429m (USD 474m).
The market Global container demand grew
around 5% in 2017. Demand growth
was particularly high in the first three
quarters of the year, while growth
in Q4 2017 slowed down. The strong
development in demand in 2017 partly
reflects a rebound from weak demand
in the first months of 2016, as well
as fundamental improvements in
the global economic environment.
Container demand on the East-West
trades was solid in 2017, driven by
higher US imports and supported by
stronger US growth, and particularly
by solid growth in durable goods con-
sumption. European imports also
grew firmly on the back of the eco-
nomic recovery.
UNIT COST (fixed)
Unit cost at fixed bunker price was 0.2% above 2016, as 2017 was impacted by contingencies, a
cyber-attack and lower headhaul utilisation. Unit cost was at its lowest for the year in Q4 2017,
with volume recovery following a challenging Q3 2017 impacted by the cyber-attack.
Unit cost fixed at 200 USD/tonne
1,500
2,000
2,500
3,000 Unit cost
20172016201520142013Q1 Q4 Q1 Q4 Q1 Q4 Q1 Q4 Q1 Q4
CAGR -4.8%
AVERAGE VOLUMES, FREIGHT RATES AND UNIT COST (floating)
Volumes increased by 3.0% to 10,731k FFE (10,415k FFE), and the average freight rate increased
by 11.7% to 2,005 USD/FFE (1,795 USD/FFE), driven by a strong market demand growth of around
5% compared to 2016. Unit cost at floating bunker was 4.9% above 2016, mainly driven by a 43%
increase in average bunker price.
Volumes (’000 FFE) Freight rates (USD/FFE) Unit cost floating bunker
1,500
2,000
2,500
3,000 Unit cost
Volumes
Freight rate
20172016201520142013
Container demand on the North-South
trades strengthened notably in 2017,
mainly in parts of South America and
Africa. This development reflected an
economic stabilisation in countries
such as Brazil, Argentina and Nigeria,
but also came in the wake of a strong
correction in inventory dynamics fol-
lowing sharp reductions in the preced-
ing years. Chinese import growth was
strong in the first half of 2017, but
slowed down in the second half of
the year following similar develop-
ments in Chinese economic activity.
The tightened restrictions on pollu-
tion in northern China together with
initiatives to restrict imports of waste
and scrap materials also impacted
Chinese imports.
At the end of 2017, the global con-
tainer fleet stood at 21m TEU, which
was 3.7% higher than a year earlier.
Deliveries totalled 1,200k TEU (158
vessels) in 2017, and, like previous
years, were dominated by vessels
larger than 10k TEU. Scrappings were
particularly high at the start of the
year, and in total 427k TEU (161 ves-
sels) were scrapped. There was a de-
clining trend in the number of vessels
standing idle, with 1.8% of the global
DIRECTORS’ REPORT STRATEGY AND PERFORMANCE
A.P. Moller - Maersk | Annual Report 201734
BUSINESS MODEL STRATEGY PERFORMANCE IN 2017 | MAERSK LINE

fleet idle at the end of 2017 compared
to 6.9% a year earlier. New vessel or-
dering increased especially during the
second half of the year, and a total of
671k TEU (107 vessels) of new capacity
was ordered in 2017.
At the end of the year, the order-
book-to-fleet-ratio stood at 12.7%.
Due to the large number of scrap-
pings, nominal capacity grew less
than headhaul demand in 2017. How-
ever, the sharp fall in the number of
idle vessels added significantly to the
available carrying capacity.
Compared to the extraordinarily low
levels recorded in 2016, average freight
rates were higher in 2017, supported
by developments in oil and fuel prices.
On average, the China Composite
Freight Index (CCFI) increased by 15%
in 2017.
FLEET OVERVIEW
TEU Number of vessels
2017 2016 2017 2016
Own container vessels
0 – 2,999 TEU 120,217 127,624 62 66
3,000 – 4,699 TEU 304,029 343,567 74 83
4,700 – 7,999 TEU 178,522 241,566 28 37
> 8,000 TEU 1,451,220 1,216,532 123 106
Total 2,053,988 1,929,289 287 292
Chartered container vessels
0 – 2,999 TEU 414,729 383,383 216 200
3,000 – 4,699 TEU 271,116 197,072 67 49
4,700 – 7,999 TEU 390,463 425,540 66 70
> 8,000 TEU 433,262 304,132 40 28
Total 1,509,570 1,310,127 389 347
Newbuilding programme (own vessels)
3,000 – 4,699 TEU 25,172 25,172 7 7
> 8,000 TEU 229,990 363,282 13 20
Container vessels total 255,162 388,454 20 27
DIRECTORS’ REPORT STRATEGY AND PERFORMANCE
A.P. Moller - Maersk | Annual Report 201735
BUSINESS MODEL STRATEGY PERFORMANCE IN 2017 | MAERSK LINE
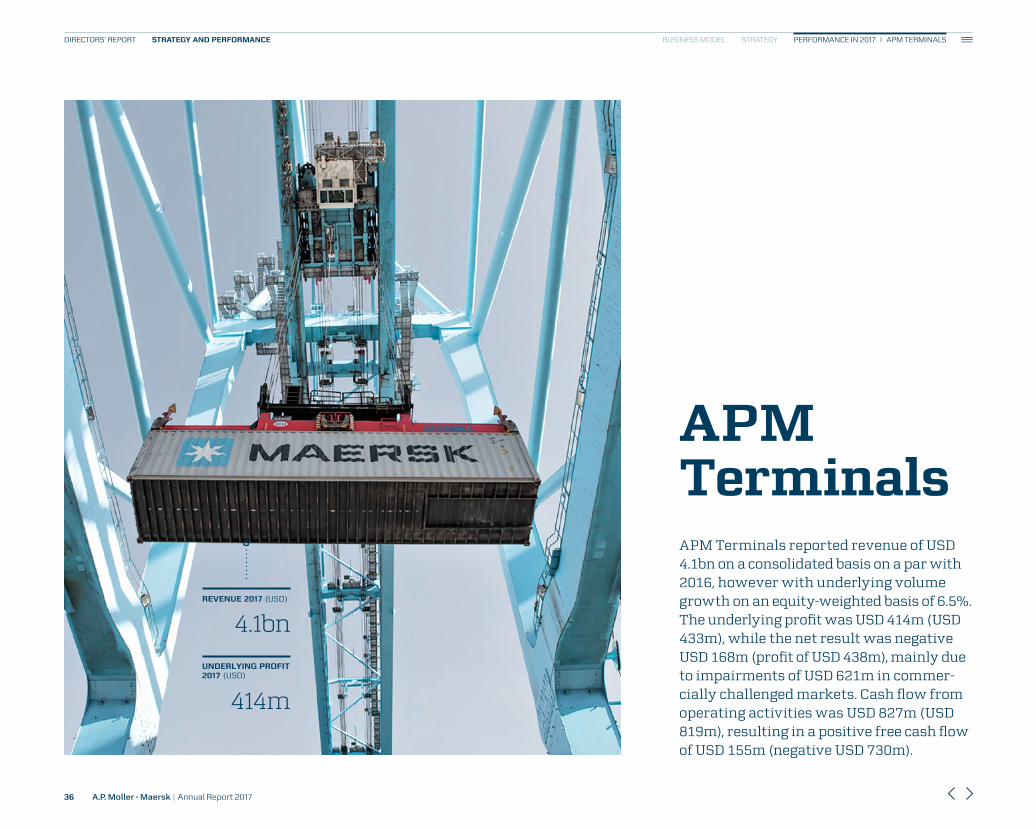
APM TerminalsAPM Terminals reported revenue of USD 4.1bn on a consolidated basis on a par with 2016, however with underlying volume growth on an equity-weighted basis of 6.5%. The under lying profit was USD 414m (USD 433m), while the net result was negative USD 168m (profit of USD 438m), mainly due to impairments of USD 621m in commer-cially challenged markets. Cash flow from operating activities was USD 827m (USD 819m), resulting in a positive free cash flow of USD 155m (negative USD 730m).
4.1bnREVENUE 2017 (USD)
414m
UNDERLYING PROFIT 2017 (USD)
DIRECTORS’ REPORT STRATEGY AND PERFORMANCE
A.P. Moller - Maersk | Annual Report 201736
BUSINESS MODEL STRATEGY PERFORMANCE IN 2017 | APM TERMINALS
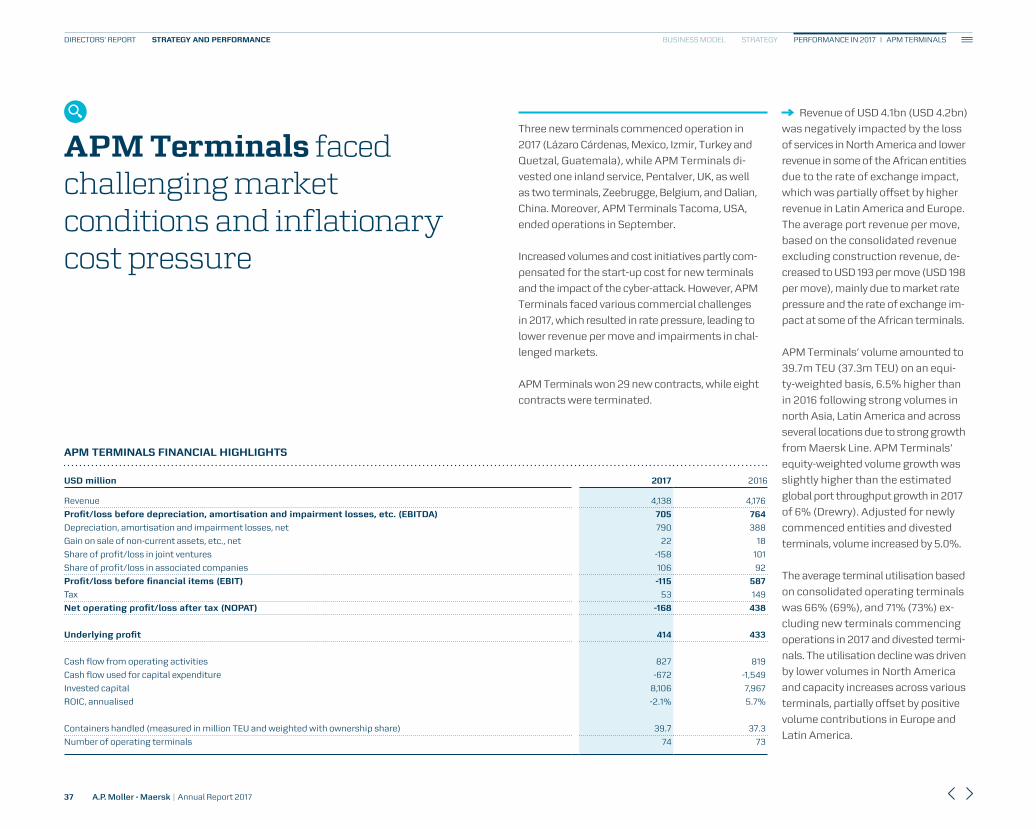
Revenue of USD 4.1bn (USD 4.2bn)
was negatively impacted by the loss
of services in North America and lower
revenue in some of the African entities
due to the rate of exchange impact,
which was partially offset by higher
revenue in Latin America and Europe.
The average port revenue per move,
based on the consolidated revenue
excluding construction revenue, de-
creased to USD 193 per move (USD 198
per move), mainly due to market rate
pressure and the rate of exchange im-
pact at some of the African terminals.
APM Terminals’ volume amounted to
39.7m TEU (37.3m TEU) on an equi-
ty-weighted basis, 6.5% higher than
in 2016 following strong volumes in
north Asia, Latin America and across
several locations due to strong growth
from Maersk Line. APM Terminals’
equity-weighted volume growth was
slightly higher than the estimated
global port throughput growth in 2017
of 6% (Drewry). Adjusted for newly
commenced entities and divested
terminals, volume increased by 5.0%.
The average terminal utilisation based
on consolidated operating terminals
was 66% (69%), and 71% (73%) ex-
cluding new terminals commencing
operations in 2017 and divested termi-
nals. The utilisation decline was driven
by lower volumes in North America
and capacity increases across various
terminals, partially offset by positive
volume contributions in Europe and
Latin America.
APM TERMINALS FINANCIAL HIGHLIGHTS
USD million 2017 2016
Revenue 4,138 4,176
Profit/loss before depreciation, amortisation and impairment losses, etc. (EBITDA) 705 764
Depreciation, amortisation and impairment losses, net 790 388
Gain on sale of non-current assets, etc., net 22 18
Share of profit/loss in joint ventures -158 101
Share of profit/loss in associated companies 106 92
Profit/loss before financial items (EBIT) -115 587
Tax 53 149
Net operating profit/loss after tax (NOPAT) -168 438
Underlying profit 414 433
Cash flow from operating activities 827 819
Cash flow used for capital expenditure -672 -1,549
Invested capital 8,106 7,967
ROIC, annualised -2.1% 5.7%
Containers handled (measured in million TEU and weighted with ownership share) 39.7 37.3
Number of operating terminals 74 73
Three new terminals commenced operation in
2017 (Lázaro Cárdenas, Mexico, Izmir, Turkey and
Quetzal, Guate mala), while APM Terminals di-
vested one inland service, Pentalver, UK, as well
as two terminals, Zeebrugge, Belgium, and Dalian,
China. Moreover, APM Terminals Tacoma, USA,
ended operations in September.
Increased volumes and cost initiatives partly com-
pensated for the start-up cost for new terminals
and the impact of the cyber-attack. However, APM
Terminals faced various commercial challenges
in 2017, which resulted in rate pressure, leading to
lower revenue per move and impairments in chal-
lenged markets.
APM Terminals won 29 new contracts, while eight
contracts were terminated.
APM Terminals faced challenging market con ditions and inflationary cost pressure
DIRECTORS’ REPORT STRATEGY AND PERFORMANCE
A.P. Moller - Maersk | Annual Report 201737
BUSINESS MODEL STRATEGY PERFORMANCE IN 2017 | APM TERMINALS

The cost per move, based on the con-
solidated operating terminals excluding
cost from terminals under construction,
was USD 172 (USD 172) as a positive rate
of exchange impact, higher volumes
and cost savings were offset by infla-
tionary pressure and the cost of termi-
nals in ramp-up stage.
Operating business reported a loss
of USD 146m (profit of USD 487m),
negatively impacted by impairments
in challenging markets, while projects
under implementation realised a loss
of USD 23m (loss of USD 49m) stem-
ming from start-up costs.
The share of profit/loss in joint ven-
tures and associated companies
was a loss of USD 52m (profit of USD
193m). Excluding the impact of im-
pairments, the result from joint ven-
tures and associated companies was
a profit of USD 212m, USD 19m higher
than in 2016.
Tax decreased to USD 53m (USD 149m),
mainly due to prior-year adjustments,
the rate of exchange impact on de-
ferred tax and a reduced tax rate in the
USA following changes in legislation.
Cash flow from operating activities
was USD 827m (USD 819m). Cash
flow used for capital expenditure was
USD 672m (USD 1.5bn), of which USD
490m related to terminal implemen-
tation projects. The capital expendi-
ture in 2016 was mainly due to the ac-
quisition of the Spanish Grup Marítim
TCB’s port and rail interests.
TERMINALS
Three new terminals were added to the portfolio in Lázaro Cárdenas, Mexico, Izmir, Turkey and Quetzal, Guate mala, while one inland service and three ter-minals were divested.
2017 2016
REVENUE
USD million 2017 2016
Port revenue1 3,549 3,515
Inland revenue 589 661
Total 4,138 4,176
Construction revenue 237 257
1 Construction revenue is part of port revenue.
The slight increase in port revenue, which was mainly due to volume increase in Latin America was partially offset by
volume decrease in North America, while inland revenue declined due to the divestment of Pentalver, UK, in Q2.
19 / 19Asia
23 / 24Europe, Russia and Baltics
16 / 16Africa and Middle East
16 / 14Americas
Key initiatives in 2017
APM Terminals Lázaro Cárdenas,
Mexico, Latin America’s largest
semi-automated terminal, com-
menced operations in April. The ter-
minal has the capacity to receive the
world’s largest ships. With the first
phase of the terminal complete,
APM Terminals Lázaro Cárdenas
occupies an area of 49 hectares,
with a 750-metre-long quay and
an annual capacity of 1.2m TEU.
As part of APM Terminals’ strategy
implementation and portfolio opti-
misation, APM Terminals completed
in 2017 the divestment of its 100%
stake in Pentalver, the UK-based
provider of container transport and
other container-related services, its
51% stake in Zeebrugge, Belgium,
with 1.3m TEU annual capacity and
its 20% stake in Dalian, China, with
2.3m TEU annual capacity. APM
Terminals Tacoma, USA, ended op-
erations at the end of September
as part of its portfolio optimisation
plans, and transferred its conces-
sion to SSA Marine.
APM Terminals’ portfolio of inland
services has been growing its pres-
ence with six new locations, includ-
ing the opening of a container depot
in Sullana, Peru. Sullana is one of
the largest areas for grapes produc-
tion as well as for growing organic
bananas and mangos. Across its
portfolio, APM Terminals launched
new products for landside custom-
ers to further support their logistics
requirements.
As part of the TCB transaction in
2016, APM Terminals acquired the
Terminal de Contenedores Quetzal
(TCQ) in Guatemala. A public inves-
tigation launched a few weeks after
APM Terminals became the owner
of TCQ (now APM Terminals Quetzal
(APMTQ)) alleges irregularities
dating back to the time before APM
Terminals acquired the terminal.
The administrative court ruled in
December 2017 in favour of the re-
quest to have the contract nullified,
which is currently subject to appeal
by APMTQ. APMTQ commenced op-
erations in Q1 2017. With an annual
container throughput capacity of
340,000 TEU, APMTQ is currently
the largest facility on the west coast
of Central America between the port
of Lázaro Cárdenas in Mexico and
the Panama Canal.
DIRECTORS’ REPORT STRATEGY AND PERFORMANCE
A.P. Moller - Maersk | Annual Report 201738
BUSINESS MODEL STRATEGY PERFORMANCE IN 2017 | APM TERMINALS

Ports Inland services
APM Terminals’ ports and inland services
capacity of the top 10 carriers, which
is expected to rise further, given the
upcoming mergers of K-Line, MOL
and NYK, and Cosco and OOCL. This
may result in continued rate pressure
across the market.
Throughout 2017, the global container
throughput has generally been growing
with demand recovering by 6%, mark-
ing the highest surge since 2011 (Dre-
wry Q4 Forecaster). There was higher
growth in all regions compared to Q3
Drewry Forecaster, with very strong
growth in South Asia of 8.8%, in North
America of 7.8% and in Latin America
of 6.9%, and with high growth in the
Middle East of 5.8%, in Asia of 5.8%
and in Europe of 5%. Drewry’s five-year
global container port demand forecast
is 4% per annum and the projected port
capacity expansion is 2.7% per annum.
Despite signs of stability in some mar-
kets, industry-wide market challenges
and rate pressure are expected to
continue in 2018. APM Terminals will
continue to collaborate closely with
all customers including Maersk Line in
all regions, with the focus on support-
ing customers’ needs and improving
the utilisation of its facilities. With
synergies from closer collaboration
and additional volumes resulting from
the Hamburg Süd acquisition, APM
Terminals expects to deliver further
volume growth in 2018.
FINANCIALLY CONSOLIDATED VOLUME
Million moves 2017 2016 Growth (%)
Americas 3.7 3.6 2.8
Europe, Russia and Baltics 6.8 6.4 6.3
Asia 2.1 1.9 10.5
Africa and Middle East 4.5 4.5 0.0
Total 17.1 16.4 4.3
The 4.3% increase in consolidated volume was mainly due to strong
volumes in Latin America and Europe.
EQUITY-WEIGHTED VOLUME
Million TEU 2017 2016 Growth (%)
Americas 6.4 6.4 0.0
Europe, Russia and Baltics 12.7 11.8 7.6
Asia 13.6 12.5 8.8
Africa and Middle East 7.0 6.6 6.1
Total 39.7 37.3 6.5
The 6.5% increase in equity-weighted volume was due to strong
volumes in north Asia, Latin America and across several locations
following strong growth from Maersk Line.
APM Terminals generated a positive
free cash flow of USD 155m (negative
USD 730m).
Invested capital increased to USD
8.1bn (8.0bn), mainly due to capital
investment in projects under imple-
mentation, partially offset by impair-
ment and capital discipline.
The market After the launch of new alliances in
April 2017, the shipping industry saw
a new high in industry concentration
at 77% (Alphaliner) of combined
DIRECTORS’ REPORT STRATEGY AND PERFORMANCE
A.P. Moller - Maersk | Annual Report 201739
BUSINESS MODEL STRATEGY PERFORMANCE IN 2017 | APM TERMINALS

DamcoDamco reported revenue of USD 2.7bn (USD 2.5bn), with volume growth in both ocean, air and supply chain management. The underlying loss of USD 36m (profit of USD 31m) was negatively impacted by the cyber-attack as well as by lower margins and product investments.
2.7bnREVENUE 2017 (USD)
36m
UNDERLYING LOSS 2017 (USD)
DIRECTORS’ REPORT STRATEGY AND PERFORMANCE
A.P. Moller - Maersk | Annual Report 201740
BUSINESS MODEL STRATEGY PERFORMANCE IN 2017 | DAMCO

DAMCO FINANCIAL HIGHLIGHTS
USD million 2017 2016
Revenue 2,668 2,507
Profit/loss before depreciation, amortisation and impairment losses, etc. (EBITDA) -4 70
Depreciation, amortisation and impairment losses, net 19 26
Gain on sale of non-current assets, etc., net 1 -
Share of profit/loss in joint ventures 11 11
Profit/loss before financial items (EBIT) -11 55
Tax 24 24
Net operating profit/loss after tax (NOPAT) -35 31
Underlying profit/loss -36 31
Cash flow from operating activities -101 4
Cash flow used for capital expenditure -4 -8
Invested capital 308 232
ROIC, annualised -12.7% 14.6%
Revenue of USD 2.7bn (USD
2.5bn) was positively impacted by
increasing volumes in supply chain
management of 6% and air freight
volumes of 8%, while ocean volumes
are slightly up 1% compared to last
year. The growth was driven by the
strong market demand throughout
the entire year supported by product
specific investments.
Damco reported an underlying loss of
USD 36m (profit of USD 31m), signifi-
cantly impacted by the cyber-attack as
well as by lower margins and product
investments.
Gross profit decreased by 5% to USD
716m (USD 754m), negatively impacted
by declining margins across all prod-
ucts. Supply chain management mar-
gins have been negatively affected by
the cyber-attack. The ocean margins
started the year weak, but corrective
initiatives were reflected in improved
margins throughout the year. By the
end of 2017, ocean margins were back
at the same level as in 2016. Margins on
air have stabilised after the continued
decline throughout the previous year.
Several cost initiatives aimed at re-
ducing overall overhead costs were
implemented, however, more than
offset by product investments as well
as costs related to the recovery of the
cyber-attack.
The current year’s tax charge was ad-
versely affected by the reduction in the
value of deferred tax assets in the USA,
Despite volume growth, Damco realised a loss in 2017, primarily due to the negative impact of the cyber-attack
In a continually challenging market environment,
Damco managed to grow sales across its product
portfolio. Particularly for ocean, margins were un-
der pressure in the first part of the year.
The full year result was significantly impacted by
the cyber-attack. The response and dedication of
employees in handling the challenge and the un-
derstanding and flexibility shown by stakeholders
was exceptional, and contributed to limiting the
negative effects.
Damco succeeded in launching the digital freight
forwarding platform Twill in Q2, and is rapidly ex-
panding coverage, product features and customer
base. Damco continues to invest in marketing
excellence, product features and digital solutions,
which is considered an important step to support
the overall strategy of becoming the global inte-
grator of container logistics.
DIRECTORS’ REPORT STRATEGY AND PERFORMANCE
A.P. Moller - Maersk | Annual Report 201741
BUSINESS MODEL STRATEGY PERFORMANCE IN 2017 | DAMCO

PRODUCT
Volumes 2017 2016
Ocean (TEU) 664,448 659,687
Air (tonnes) 206,208 190,674
Supply chain management (’000 cbm) 69,574 65,700
Volumes have increased across the product offering. The
largest increase relates to the core product, supply chain
management. In the combined service offering, supply chain
management may include freight forwarding volumes. Other
products are measured by multiple metrics, and are there-
fore not included in the chart.
REVENUE
USD million 2017 2016
Ocean 666 687
Air 659 541
Supply chain management 778 694
Others 565 585
Besides ocean, revenue has grown across all products. Revenue
has substantially increased in the core product supply chain
management as well as air. The category ‘Others’ consists of
warehousing and other value-adding services.
DAMCO SUPPLY CHAIN CHART
From origin to destination, Damco covers the
end-to-end supply chain. Origin and destination
services such as custom house brokerage
(CHB, covering all aspects of customs services
– from document submission to com modity
classification) or container freight stations
(CFS, facility to (de-) consolidate freight ship-
ments between transport legs), are ensuring
that goods are not only safely manoeuvred from
port to port but from factory to the customer.
The list of services is not conclusive but only
lists examples.
as a result of the reduction in Federal
tax rate, which became effective in
December.
Cash flow from operating activities
was negative USD 101m (positive USD
4m), impacted by the temporary effect
of the cyber-attack on Damco’s oper-
ations and invoicing processes. Cash
flow used for capital expenditure was
USD 4m (USD 8m), leaving a free cash
flow of negative USD 105m (negative
USD 4m).
DocumentationCHB
Warehousing Consolidation
Documentation
CHB CFS
Warehousing
De-consolidation
DESTINATION
DESTINATION SERVICES
ORIGIN
ORIGIN SERVICES
Key initiatives in 2017
With customer-centric logistics and freight
forwarding operations in over 300 locations
worldwide and a presence in more than
100 countries, Damco is well embedded in
Maersk’s vision for transport and logistics.
The application of digital technology makes it
possible to connect and simplify supply chains.
Twill and the Supply Chain Orchestrator are
examples of a digitised approach to freight
forwarding and supply chain management.
Twill is a digital freight forwarding platform
founded by Damco. Twill exists to make
shipping simpler for customers. The booking
process is as easy as buying an airplane
ticket, and takes just 30 seconds. Customers
can log in to the platform from any device,
they can see exactly what the next milestone
is and when their cargo will arrive, and they
are able to find all important documentation
in one place.
Supply Chain Orchestrator is Damco’s
4PL–platform providing a single visibility
platform, integration point, control point and
optimisation partner. A modular programme
that supports the evolution of capabilities
and the management of multiple service
providers.
DIRECTORS’ REPORT STRATEGY AND PERFORMANCE
A.P. Moller - Maersk | Annual Report 201742
BUSINESS MODEL STRATEGY PERFORMANCE IN 2017 | DAMCO

SvitzerSvitzer reported revenue of USD 659m (USD 642m). The underlying profit of USD 114m (USD 89m) was positively impacted by higher volumes from increased towage activities in Australia and the Americas, ongoing portfolio and fleet optimisation, and reduced operating and administration costs. Free cash flow amounted to USD 83m (negative USD 48m).
659mREVENUE 2017 (USD)
114m
UNDERLYING PROFIT 2017 (USD)
DIRECTORS’ REPORT STRATEGY AND PERFORMANCE
A.P. Moller - Maersk | Annual Report 201743
BUSINESS MODEL STRATEGY PERFORMANCE IN 2017 | SVITZER

SVITZER FINANCIAL HIGHLIGHTS
USD million 2017 2016
Revenue 659 642
Profit/loss before depreciation, amortisation and impairment losses, etc. (EBITDA) 197 166
Depreciation, amortisation and impairment losses, net 101 86
Gain on sale of non-current assets, etc., net 6 5
Share of profit/loss in joint ventures 7 11
Share of profit/loss in associated companies 1 1
Profit/loss before financial items (EBIT) 110 97
Tax 8 6
Net operating profit/loss after tax (NOPAT) 102 91
Underlying profit 114 89
Cash flow from operating activities 179 144
Cash flow used for capital expenditure -96 -192
Invested capital 1,334 1,203
ROIC, annualised 7.9% 7.5%
Revenue was USD 659m (USD
642m), mainly impacted by a USD
32m increase in revenue in Australia
and the Americas offset by a USD 12m
decrease in revenue in Europe. Organic
growth adjusted for currency develop-
ment totalled 2.4%.
Svitzer’s harbour towage activities
increased by 3% compared to 2016,
driven by increased activity in Australia
and the Americas. Volumes in Australia
improved during 2017 because of higher
commodity exports, and because the
market share for harbour towage in
competitive ports in Australia was
slightly higher in 2017 than in 2016.
While activity in Europe remained
stable, Svitzer’s market share for har-
bour towage in competitive ports was
slightly higher in 2017 than in 2016.
However, more intense competition
from consolidation amongst towage
providers and the increasing supply
of tugs led to lower prices.
In the Americas, activity in Argentina
increased in 2017, driven by towage
services provided at two LNG termi-
nals and other harbour towage activi-
ties, amongst others in Buenos Aires,
where Svitzer started operations in
October. In Brazil, Svitzer grew its ac-
tivities, driven by new customers in the
ports entered during 2017 as well as
additional volumes and market share
in existing operations.
In Asia, the Middle East and Africa,
activity remained unchanged compared
Svitzer has been optimising its existing market
portfolio by focusing on growth in selected mar-
kets such as Argentina and Brazil. Furthermore,
Svitzer has ceased operations in locations with
less strategic fit such as in Montreal, Canada.
Higher market shares in Europe and Australia
and port entries in Latin America along with fleet
optimisation have improved utilisation and profit-
ability in harbour towage in 2017.
Overall, revenue in terminal towage remained flat,
however, the divestment of idle fleet and other
cost-reduction initiatives including reductions of
administrative costs improved profitability.
Svitzer improved both profitability and cash flows
DIRECTORS’ REPORT STRATEGY AND PERFORMANCE
A.P. Moller - Maersk | Annual Report 201744
BUSINESS MODEL STRATEGY PERFORMANCE IN 2017 | SVITZER
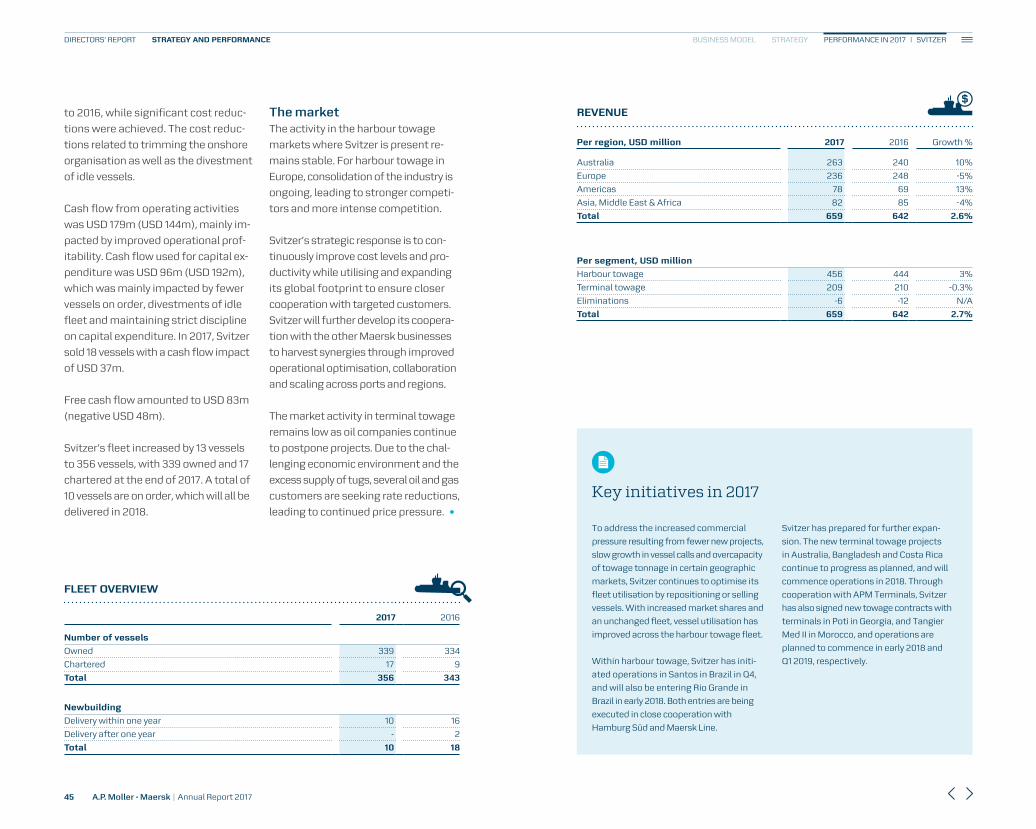
to 2016, while significant cost reduc-
tions were achieved. The cost reduc-
tions related to trimming the onshore
organisation as well as the divestment
of idle vessels.
Cash flow from operating activities
was USD 179m (USD 144m), mainly im-
pacted by improved operational prof-
itability. Cash flow used for capital ex-
penditure was USD 96m (USD 192m),
which was mainly impacted by fewer
vessels on order, divestments of idle
fleet and maintaining strict discipline
on capital expenditure. In 2017, Svitzer
sold 18 vessels with a cash flow impact
of USD 37m.
Free cash flow amounted to USD 83m
(negative USD 48m).
Svitzer’s fleet increased by 13 vessels
to 356 vessels, with 339 owned and 17
chartered at the end of 2017. A total of
10 vessels are on order, which will all be
delivered in 2018.
The marketThe activity in the harbour towage
markets where Svitzer is present re-
mains stable. For harbour towage in
Europe, consolidation of the industry is
ongoing, leading to stronger competi-
tors and more intense competition.
Svitzer’s strategic response is to con-
tinuously improve cost levels and pro-
ductivity while utilising and expanding
its global footprint to ensure closer
cooperation with targeted customers.
Svitzer will further develop its coopera-
tion with the other Maersk businesses
to harvest synergies through improved
operational optimisation, collaboration
and scaling across ports and regions.
The market activity in terminal towage
remains low as oil companies continue
to postpone projects. Due to the chal-
lenging economic environment and the
excess supply of tugs, several oil and gas
customers are seeking rate reductions,
leading to continued price pressure.
REVENUE
Per region, USD million 2017 2016 Growth %
Australia 263 240 10%
Europe 236 248 -5%
Americas 78 69 13%
Asia, Middle East & Africa 82 85 -4%
Total 659 642 2.6%
Per segment, USD million
Harbour towage 456 444 3%
Terminal towage 209 210 -0.3%
Eliminations -6 -12 N/A
Total 659 642 2.7%
FLEET OVERVIEW
2017 2016
Number of vessels
Owned 339 334
Chartered 17 9
Total 356 343
Newbuilding
Delivery within one year 10 16
Delivery after one year - 2
Total 10 18
Key initiatives in 2017
To address the increased commercial
pressure resulting from fewer new projects,
slow growth in vessel calls and overcapacity
of towage tonnage in certain geographic
markets, Svitzer continues to optimise its
fleet utilisation by repositioning or selling
vessels. With increased market shares and
an unchanged fleet, vessel utilisation has
improved across the harbour towage fleet.
Within harbour towage, Svitzer has initi-
ated operations in Santos in Brazil in Q4,
and will also be entering Rio Grande in
Brazil in early 2018. Both entries are being
executed in close cooperation with
Hamburg Süd and Maersk Line.
Svitzer has prepared for further expan-
sion. The new terminal towage projects
in Australia, Bangladesh and Costa Rica
continue to progress as planned, and will
commence operations in 2018. Through
cooperation with APM Terminals, Svitzer
has also signed new towage contracts with
terminals in Poti in Georgia, and Tangier
Med II in Morocco, and operations are
planned to commence in early 2018 and
Q1 2019, respectively.
DIRECTORS’ REPORT STRATEGY AND PERFORMANCE
A.P. Moller - Maersk | Annual Report 201745
BUSINESS MODEL STRATEGY PERFORMANCE IN 2017 | SVITZER

Maersk Container IndustryMaersk Container Industry reported rev-enue of USD 1.0bn (USD 564m), equal to growth of 80%. The underlying profit of USD 38m (loss of USD 53m) was positively impacted by improved efficiency across the three factories, higher sales prices for dry containers and significantly higher sales volumes of both dry and reefer containers.
1.0bnREVENUE 2017 (USD)
38m
UNDERLYING PROFIT 2017 (USD)
DIRECTORS’ REPORT STRATEGY AND PERFORMANCE
A.P. Moller - Maersk | Annual Report 201746
BUSINESS MODEL STRATEGY PERFORMANCE IN 2017 | MAERSK CONTAINER INDUSTRY

MAERSK CONTAINER INDUSTRY FINANCIAL HIGHLIGHTS
USD million 2017 2016
Revenue 1,016 564
Profit/loss before depreciation, amortisation and impairment losses, etc. (EBITDA) 87 -31
Depreciation, amortisation and impairment losses, net 36 30
Gain on sale of non-current assets, etc., net - -2
Share of profit/loss in joint ventures - -
Share of profit/loss in associated companies - -
Profit/loss before financial items (EBIT) 51 -63
Tax 13 -8
Net operating profit/loss after tax (NOPAT) 38 -55
Underlying profit/loss 38 -53
Cash flow from operating activities 75 4
Cash flow used for capital expenditure -20 -26
Invested capital 333 357
ROIC, annualised 12.0% -13.3%
Revenue increased to USD 1.0bn
(USD 564m), driven by higher sales vol-
umes in both reefer and dry containers
and from sales prices increasing by 40%
for dry containers compared to 2016.
Overall, there was a strong demand
for both dry and reefer containers
from Maersk Line and international
shipping, leasing and other customers.
The Maersk Line demand accounts for
approx. 80% of total revenue. Two fac-
tories in China have been operating at
near full capacity throughout 2017. The
factory in Chile saw a strike stemming
from a collective bargaining dispute,
which interrupted production across
three weeks in October. Production
was re-established in early November
after a new two-year agreement was
signed with the unions.
The underlying profit of USD 38m (loss
of USD 53m) was strongly impacted by
the higher revenue compared to 2016,
as well as efficiency improvements
and cost-reduction programmes. Prof-
itability per reefer container was on a
par with 2016, whereas profitability on
dry containers increased due to higher
increases in sales prices compared to
manufacturing costs. This was partly
due to the change from solvent-based
paint to water-based paint. The result
was negatively impacted by a challeng-
ing production ramp-up at the reefer
container factory in Chile.
Cash flow from operating activities
totalled USD 75m (USD 4m), and cash
flow used for capital expenditure
With a growing demand for both refrigerated and
dry containers in 2017, the two factories in Qingdao
and Dongguan have been producing at nearly full
capacity, with volumes up 90% compared to 2016.
Profitability was significantly better than in 2016,
despite disappointing sales volumes in the factory
in Chile as well as higher commodity prices.
Maersk Container Industry improved profitability and increased sales
DIRECTORS’ REPORT STRATEGY AND PERFORMANCE
A.P. Moller - Maersk | Annual Report 201747
BUSINESS MODEL STRATEGY PERFORMANCE IN 2017 | MAERSK CONTAINER INDUSTRY

totalled USD 20m (USD 26m). Cash
flow used for capital expenditure was
driven by improvement projects across
all three factories. Free cash flow was
positive USD 55m (negative USD 22m).
The marketThe shipping industry has been char-
acterised by overcapacity and consol-
idation in recent years, impacting the
global demand for ocean containers
negatively. The demand for reefer con-
tainers increased in 2017 compared to
the unprecedented low level in 2016,
but was still below 2015 volumes. The
demand for dry containers was above
2016. Generally, the ocean container
manufacturing market for dry and
reefer containers remains character-
ised by oversupply, and Maersk Con-
tainer Industry expects this to continue
for the foreseeable future.
The year was impacted by several
sudden and significant changes in
commodity pricing, impacting man-
ufacturing costs. Reefer container
prices stayed relatively stable, and
overall on a par with 2016, whereas
dry container prices increased sig-
nificantly during 2017.
EBITDA, REEFERS (USD million)
42
-6
2017 2016
EBITDA, DRY CONTAINERS (USD million)
2017 2016
2017 2016
VOLUMES, NUMBER OF CONTAINERS
94,6992017
44,051 2016
31,900 2016
45,6252017
45
-25
Dry containers Reefers
Key initiatives in 2017
To expand carriers’ operational trans-
parency into actual energy consump-
tion throughout the transport window
over land and sea, Maersk Container
Industry introduced an energy metering
feature on all new Star Cool machines
in 2017.
Maersk Container Industry launched a
retrofittable 56%-improved refrigerant
solution to support customers in the
worldwide focus on CO2 emissions.
Furthermore, an expanded version of
the controlled atmosphere system was
made available to the market, allowing
shippers to bring more produce types
to new markets.
DIRECTORS’ REPORT STRATEGY AND PERFORMANCE
A.P. Moller - Maersk | Annual Report 201748
BUSINESS MODEL STRATEGY PERFORMANCE IN 2017 | MAERSK CONTAINER INDUSTRY

GOVERNANCE AND RISK
Corporate governance | Risk management | Sustainability | Remuneration | Shareholder information
A.P. Moller - Maersk | Annual Report 201749
DIRECTORS’ REPORT GOVERNANCE AND RISK

Corporate governance
A.P. Møller - Mærsk A/S continuously considers the corporate governance framework in response to its strategic development, goals and activities, the external environment and input from stakeholders.
The governance structure supports
close coordination between the Board
of Directors, the Executive Board and
leaders throughout the organisation,
and promotes the objectives of:
• Early identification of opportunities
and challenges
• Efficient processes for informed
decision-making
• Agile planning and fast execution
• Sound controls and clear allocation
of authorities and responsibilities.
The five core values “Constant Care”,
“Humbleness”, “Uprightness”, “The
Employees” and “Our Name” remain pil-
lars for the way A.P. Møller - Mærsk A/S
conducts its business. Engrained in
the company for more than a century,
these corporate values are continu-
ously promoted throughout the global
organisation, and serve as guiding prin-
ciples for employees and leaders. Read
more about our core values https://
www.maersk.com/about/core-values
In addition to applicable legislation
and regulations, the formal basis
for the corporate governance of
A.P. Møller - Mærsk A/S consists of:
• The Articles of Association. The
English version can be found http://
investor.maersk.com/guidelines.cfm
• Rules of procedure applicable
to the Board of Directors and the
Executive Board as well as proce-
dures specific to each of the three
Board committees
• Policies on health and safety, legal
compliance, working culture, tax
and other key areas within corporate
governance and good corporate
citizenship. Read more about our
policies https://www.maersk.com/
about
• The internal governance framework
named COMMIT, stipulating more
detailed policies, rules, instruc-
tions and guidelines applicable to
all group entities and employees.
Among others, the framework covers
Enterprise Risk Management, finan-
cial risks, responsible procurement,
anti-corruption, legal compliance, etc.
• The Maersk Whistleblower System,
established in 2011, enabling employ-
ees in 130 countries to report wrong-
doings. Further information on whis-
tleblower reports is available in the
Sustainability Report https://www.
maersk.com/business/sustainabil-
ity/sustainability-reports-and-pub-
lications/reports
Recommendations for corporate governanceAs a Danish listed company,
A.P. Møller - Mærsk A/S must comply
with or explain deviations from the
“Recommendations for Corporate
Governance” implemented by NASDAQ
Copenhagen in the Rules for issuers of
shares and Section 107b of the Danish
Financial Statements Act.
The Board of Directors of
A.P. Møller - Mærsk A/S has prepared a
statement on corporate governance for
the financial year 2017. The statement
includes a description of the Company’s
approach to each of the recommen-
dations in the “Recommendations for
Corporate Governance” as well as a
description of the management struc-
ture and the main elements of the
Company’s internal control and risk
management systems related to the
financial reporting process.
A.P. Møller - Mærsk A/S complies
with 36 recommendations, complies
partly with five recommendations and
does not comply with six recommen-
dations. For thorough elaborations
on the 47 different recommendations
and explanations for deviation from
recommendations, the Statement
on Corporate Governance can be con-
sulted http://investor.maersk.com/
governancestatement.cfm
Governance structureShareholders and the Annual General MeetingThe Annual General Meeting is
the supreme governing body of
A.P. Møller - Mærsk A/S. The sharehold-
ers exercise their rights at the Annual
General Meeting e.g. in relation to elect-
ing the Board members and the auditors
of the Company, approving the Annual
Report and dividends and deciding the
Articles of Association. The Company
has two share classes: A shares carrying
voting rights and B shares carrying
no voting rights. A and B shares carry
equal economic rights, and are traded
publicly at NASDAQ Copenhagen.
Board of DirectorsA.P. Møller - Mærsk A/S has a two-tier
management structure consisting of
the Board of Directors and the Execu-
tive Board as illustrated below. There
is no overlap between members of the
Board of Directors and members of the
Executive Board. By inviting business
leaders, functional leaders and relevant
experts to participate in parts of its
meetings, the Board of Directors and
its committees interact with represent-
atives from various parts of the organi-
sation as well as external specialists.
CORPORATE GOVERNANCE RISK MANAGEMENT SUSTAINABILITY REMUNERATION SHAREHOLDER INFORMATIONDIRECTORS’ REPORT GOVERNANCE AND RISK
A.P. Moller - Maersk | Annual Report 201750

All Board members are elected by the
Annual General Meeting. The majority
of the members of the Board of Direc-
tors as well as of each Board commit-
tee are independent members. The
Chairman of the Board of Directors and
the chairman of each committee are all
independent.
In connection with the Annual General
Meeting on 28 March 2017, Michael
Pram Rasmussen stepped down from
the Board of Directors and the Board
elected Jim Hagemann Snabe as its
new Chairman. Since then, the Board of
Directors has had 11 members. Further
information on the members of the
Board of Directors and membership
of the committees is available http://
investor.maersk.com/directors.cfm
The Board of Directors lays down the
general business and management
principles, and ensures the proper
organisation of the Company. Further-
more, the Board of Directors decides
the strategy and the risk policies, and
supervises the performance of the
Company and its management. The
Board of Directors shall consist of 4-13
members elected by the Annual Gen-
eral Meeting. The Board members are
elected for a two-year term. There are
Board members up for election every
year to ensure continuity in the work of
the Board of Directors. Board members
are eligible for re-election.
The Board of Directors has established
the following committees:
The ChairmanshipThe Chairmanship is elected by and
among the members of the Board
of Directors and is comprised of the
Chairman and the two Vice Chairmen.
The Chairmanship performs certain
preparations and planning in relation
to board meetings, the nomination of
candidates for the Board of Directors
and coordination with the Executive
Board. The majority of the members
are independent.
The Audit CommitteeThe Audit Committee consists of
three members elected by the Board
of Directors among its members. The
tasks of the Audit Committee include
conducting reviews of accounting,
auditing and control matters, including
reviews of material related parties’
transactions. All of the members are
independent.
The Remuneration CommitteeThe Remuneration Committee is
elected by and among the Board of
Directors, and consists of the Chair-
man and the two Vice Chairmen of the
Board. The Committee, for example,
submits proposals for the remunera-
tion of the Executive Board, remunera-
tion policies and incentive guidelines,
as well as reviews incentive schemes
and overall budgets for salary adjust-
ments. The majority of the members
are independent.
The Transformation & Innovation CommitteeIn 2017, the Board of Directors estab-
lished the Transformation & Innovation
Committee to support the develop-
ment of the Company’s overall strate-
gic direction and innovation agenda
by providing strategic insight in three
main areas: transformation, consolida-
tion and growth. The Committee con-
sists of three members elected by and
among the Board of Directors. The ma-
jority of the members are independent.
Other ad hoc workConsidering the importance and
magnitude of the work involved in
separating out the energy businesses,
two members of the Board of Directors
and three members of the Executive
Board participate in an ad hoc steering
committee. Among others, the focus
is on ensuring that submissions to the
Board of Directors on separating out
the energy businesses consider the
risks, rewards, feasibility and financial
implications of all potential separation
solutions, and incorporating the
directions provided by the Board of
Directors.
The Executive Board The members of the registered man-
agement (the Executive Board) of
A.P. Møller - Mærsk A/S as of 1 January
2017 were CEO Søren Skou, Vice CEO
Claus V. Hemmingsen and CFO Jakob
Stausholm. On 1 December 2017, the
Company expanded the Executive
Board from three to six members by
appointing Morten Engelstoft, Vincent
Clerc and Søren Toft as additional
members.
The expansion of the Executive Board
supports efficient decision-making
processes, and enhances coordination
between the Board of Directors, the
Executive Board and other leaders of
the Company by shortening the chains
of command. Further, it strengthens
the pace of the strategy implementa-
tion and accelerates the development
of customer-oriented end-to-end trans-
port and logistics solutions. Additional
information on the members of the
Executive Board is available http://in-
vestor.maersk.com/management.cfm
Members of the Executive Board are
appointed by the Board of Directors to
carry out the day-to-day management
of the Company.
For more information, see Statement
on Corporate Governance http://
investor.maersk.com/governance-
statement.cfm
Shareholders
Board of Directors
Executive Board
Organisation
Chairmanship
Audit Committee
Remuneration Committee
Transformation & Innovation
Committee
Internal Audit
FRAMEWORK FOR CORPORATE GOVERNANCE
CORPORATE GOVERNANCE RISK MANAGEMENT SUSTAINABILITY REMUNERATION SHAREHOLDER INFORMATIONDIRECTORS’ REPORT GOVERNANCE AND RISK
A.P. Moller - Maersk | Annual Report 201751

The Board of Directors
Responsibility for the overall management and
strategic direction of the Company, including
for instance:
• Lay down general business and manage-
ment principles of the Company
• Decide strategy and risk policies for the
Company
• Supervise the performance of the Company,
the Executive Board and secure the proper
organisation of the Company
• Review the Company’s financial position,
capital resources and reporting on financials
and performance
• Appoint members of the Executive Board.
The Board of Directors normally plans 7-9
meetings per annum and held 12 meetings
in 2017.
The Executive Board
• Carry out the day-to-day management of the
Company in accordance with the directions
provided by the Board of Directors
• Develop the business and submit strategy
proposals to the Board of Directors for
decision
• Implement the strategy for the Company,
and execute on investments and divest-
ments
• Develop the organisational structure of the
Company and allocate resources
• Drive and monitor the performance of the
Company
• Prepare of internal and external
financial reporting
• Monitor and plan capital resources and li-
quidity
• Establish internal policies and procedures
for relevant topics such as accounting,
finance, IT, etc.
• Enterprise Risk Management
• Reporting to the Board of Directors.
Matters handled by the Board of Directors in 2017 (including but not limited to):
• Strategy review and target setting
• Follow-up on M&A activities
• Monitor and assess structural solutions
for divestment of energy businesses
• Divestment of Mærsk Olie og Gas A/S,
Maersk Tankers A/S and the remaining
stake in Dansk Supermarked Group
• Monitor recovery and remedies following
the June cyber-attack
• Review the Company’s governance
framework
• Monitor the functioning of the new
organisational structure (decided in 2016),
separating into a Transport & Logistics
division and an Energy division
• Election of new Chairman
• Establishment of the Transfor mation
& Innovation Committee
• Appointment of three new Executive Board
members
• Approval of the Annual Report 2016 and the
2017 Interim Reports.
The Chairmanship
• Preparations and planning in relation to
board meetings
• Preparations for the nomination of
candidates for the Board of Directors
• Coordination with the Executive Board.
The Chairmanship meets regularly and
as required. The Chairmanship held nine
meetings in 2017.
The Audit Committee
• Monitor the financial reporting and report-
ing process, including accounting estimates
and risks, accounting policies, process and
reporting integrity
• Review annual and interim financial reports
• Monitor the effectiveness of internal control
systems, fraud risks and fraud prevention
• Review material related parties’ trans-
actions, such as the divestment of Maersk
Tankers to A.P. Møller Holding
• Discuss key audit matters, monitor the
services, audit plans, reports, independence
of external auditors and recommend
auditor rotation
• Monitor the Internal Audit function,
resolution of audit findings, its independ-
ence, scope and performance, resources
and reporting
• Oversee the Company’s Enterprise Risk
Management framework and processes
• Meet with Head of Internal Audit, CFO,
Head of External Accounting and Tax, other
functional leaders and external auditors.
The Committee normally plans six meetings
per annum. The Audit Committee held nine
meetings in 2017.
The Remuneration Committee
• Propose the remuneration of the
Executive Board
• Review remuneration, incentives, etc.,
for key leaders
• Decide budgets for overall salary
adjustment
• Proposals for remuneration policies
and incentive guidelines
• Review incentive schemes and their
implementation.
The Committee normally plans four
meetings per annum. The Remuneration
Committee held five meetings in 2017.
The Transformation & Innovation Committee
• Support the development of the Company’s
overall strategic direction and innovation
agenda
• Act as a sparring partner for the Executive
Board within three principal areas: Transfor-
mation, consolidation and growth
• Assist in setting the right priorities and
ambition levels for transformation
• Focus the Board of Directors’ attention on
critical disruptions and future opportunities,
oversight of the transformation and key
strategic innovation projects.
The Transformation & Innovation Commit-
tee was formed in June 2017 and held one
meeting in the year. The Committee plans
3-4 meetings per annum from 2018 on-
wards.
CORPORATE GOVERNANCE RISK MANAGEMENT SUSTAINABILITY REMUNERATION SHAREHOLDER INFORMATIONDIRECTORS’ REPORT GOVERNANCE AND RISK
A.P. Moller - Maersk | Annual Report 201752

Risk management
Risk management at A.P. Moller - Maersk is strategically focused and designed to contribute to the achievement of business objectives in the medium term and ensure the longevity of A.P. Moller - Maersk in the long term.
it is performed consistently and
captures the full array of risks across
A.P. Moller - Maersk. Risk officers are
appointed across the organisation to
continuously identify, assess, manage
and monitor risks. As part of the pro-
cess, the risk officers document and
report the risks identified, together
with the mitigating measures in place
to manage the risk.
The purpose of A.P. Moller - Maersk’s
risk management is to identify and
assess the risks to operations as well
as strategic goals, and to immediately
mitigate them to acceptable risk levels.
A structured Enterprise Risk Manage-
ment process ensures that risks across
multiple categories are regularly iden-
tified, assessed and reported, and that
decisions are made on the treatment
of such risks.
Part of the process is to continuously
monitor the development of the main
risks through established Key Risk
Indicators, which enable the Executive
Board and the Board of Directors to
decide on any additional risk treat-
ment required to keep the risks within
acceptable limits.
The established process is supported
by a defined Enterprise Risk Manage-
ment framework, which ensures that
ENTERPRISE RISK MANAGEMENT GOVERNANCE STRUCTURE AND PROCESS
• Executive Board
• Corporate functions
• Businesses
Ke
y st
ak
eh
old
ers
• Executive Board
• Business / Functional management
• Board of Directors
• Executive Board
SE
MI-
AN
NU
AL
RE
VIE
W
Gross risk Bottom-up reporting Top-down interviews
Existing mitigations Core values, governance, framework,
policies and rules
Residual risk Consolidation and
prioritisation
Mitigating action Risk ownership
Action plans
Target risk
ANNUAL ERM REPORT
DIRECTORS’ REPORT GOVERNANCE AND RISK
A.P. Moller - Maersk | Annual Report 201753
CORPORATE GOVERNANCE RISK MANAGEMENT SUSTAINABILITY REMUNERATION SHAREHOLDER INFORMATION

Risks Certain key risks and their potential
impact on the performance of
A.P. Moller - Maersk are illustrated
and commented on in the following:
Operational risksCyber-attack
A.P. Moller - Maersk fell in June 2017
victim to a major cyber-attack caused
by the NotPetya malware, which
affected many companies globally.
As a result, operations in transport
and logistics businesses were dis-
rupted, leading to unwarranted
impact on customers. The recovery
was fast, but within a brief period
A.P. Moller - Maersk suffered losses in
the order of USD 250-300m covering,
among other things, loss of revenue,
IT restoration costs and extraordinary
costs related to operations. To further
enhance cyber resilience, many imme-
diate and long-term initiatives have
been implemented and planned to
secure the digital business, strengthen
the IT infrastructure platform, enhance
IT service continuity and recovery as
well as reinforce business continuity
plans. Additionally, a cyber insurance
has been purchased to mitigate some
of the potentially negative financial
impact of repeated successful cyber-
attacks in the future.
Hamburg Süd integration
The acquisition of Hamburg Süd was
completed at the end of November
2017. An acquisition of this size
exposes A.P. Moller - Maersk to inte-
gration risks and other challenges.
The acquisition was premised on a
number of factors, including expected
synergies and the overall fit with the
broader strategic ambitions. The abil-
ity to harvest synergies and the value
from the transaction will, in part, be
dependent on the ability to success-
fully integrate Hamburg Süd, without
disruption to A.P. Moller - Maersk’s,
nor Hamburg Süd’s, existing business
and operations. If these synergies fail
to materialise, it could result in future
impairments and pressure on key
financials. The integration challenges
and the mitigating activities are be-
ing coordinated and supervised with
anchoring in senior management,
including a process to manage inte-
gration risks, with a view to ensuring
that the integration challenges are
adequately met. To protect the busi-
ness volume and the Hamburg Süd
brand, the front-line customer facing
commercial organisation have been
maintained, ensuring uninterrupted
customer interactions. IT platforms
are kept separate, while full integra-
tion of networks is being pursued.
Together with vendor contract effi-
ciencies, network integration is the
biggest synergy contributor and is
expected to be concluded in 2018.
Service delivery and
network reliability
Persistent challenges regarding the
schedule reliability of the network could
test the customers’ patience, and pos-
sibly result in valuable customers being
lost. The reliability of service delivery
could, for instance, be affected by down
time or lower productivity (e.g. due to
labour conflicts) at hub terminals, or by
a lack of operational control of cargo
transported by network partners under
vessel sharing agreements. Because of
the cyber-attack, A.P. Moller - Maersk
saw a temporary reduction in reliability,
resulting in lower volumes for a period.
Operations continuously reviews the
network to reduce unwarranted de-
pendency on certain hubs to handle
large cargo flows, and strives to secure
continuous alignment with vessel shar-
ing agreement partners in respect of
schedule reliability.
Major accident or oil spill
Operational safety is synonymous
with the license to operate. Major
naval or operational accidents such as
collisions or groundings, as well as po-
tential oil spills from vessels, continue
to be inherent in operational risks.
Pending separation of the energy
RISKS TO A.P. MOLLER - MAERSK’S STRATEGIC OBJECTIVES
Operational risks Strategic risks Compliance risks
IMPACT
LIK
ELI
HO
OD
25%
Sulphur cap implementation
Major accident or oil spill
Tax non-compliance
Hamburg Süd integration
Service delivery and network reliability
Transition risk
Industry dynamics
Digitisation of business model
Cyber-attack
Non-compliance with regulatory standards
DIRECTORS’ REPORT GOVERNANCE AND RISK
A.P. Moller - Maersk | Annual Report 201754
CORPORATE GOVERNANCE RISK MANAGEMENT SUSTAINABILITY REMUNERATION SHAREHOLDER INFORMATION
businesses, A.P. Moller - Maersk also
continues to carry the risk of major
oil-related accidents such as explo-
sions or a blow-out on a drilling rig.
A high-severity accident in any of the
businesses would first and foremost
present a risk to the safety of people
as well as potentially to the environ-
ment. Additionally, it could result in a
large-scale impact on assets, liquidity
position and reputation, and could
put the license to operate at risk. The
risks associated with operational ac-
cidents are mitigated through safety
and maintenance standards, response
preparedness, continuous training
and rigorous monitoring. Also, people,
assets and activities remain compre-
hensively insured against personal in-
juries, physical damage and liabilities
(with some level of self-insurance).
Strategic risks Transition risk
A.P. Moller - Maersk embarked in
2016 on a strategic journey towards a
structurally reshaped company. The
strategy entails separating out the
energy businesses and focusing on
the transport and logistics space, with
the aim of vertically integrating the
existing brands into a global end-to-
end transport and logistics operator.
A transition of such magnitude comes
with certain execution risks, including
the risk of overloading resources and
directing the focus inwards at the
expense of customer service. Also,
different organisational capabilities
are needed to transform and support
businesses in new strategies and
new business environments with in-
creased digitisation etc.
The transition away from the energy
businesses is progressing as planned,
with the separation of Maersk Oil and
Maersk Tankers completed, and with
strategic solutions for Maersk Drilling
and Maersk Supply Service expected
over the next 12 months. Furthermore,
a roadmap for the integration of the
existing transport and logistics brands
has been launched, starting with a new
and strengthened management struc-
ture to lead the integration.
As the portfolio narrows, the threat
of a credit rating deterioration con-
stitutes a separate risk. This is due
to the loss of business diversification
and higher volatility in returns and
cash flow. A deterioration in credit
worthiness leading to a credit rating
down-grade could result in higher
funding costs and a weakened ability
to raise funding in the debt capital
markets. Applying part of the pro-
ceeds from the separation of the
energy businesses to reduce debt,
tightened financial planning and rig-
orous discipline in respect of capital
expenditure serve as risk-reducing
measures. Further, increasing end-
to-end solutions and diversification
within transport and logistics could
lead to lower volatility over time.
Industry dynamics
Maersk Line’s profitability is strongly
impacted by supply and demand de-
velopments. With Maersk Line being
the largest contributor to volatility in
earnings, the overall profitability of
A.P. Moller - Maersk remains highly de-
pendent on freight rates. A change in the
freight rates of +/- 100 USD/FFE com-
pared to forecast will cause a change in
EBIT of USD 1.3bn. The freight rate risk is
mitigated through designing a compet-
itive network, pursuing cost leadership
in the industry, optimising network
utilisation through alliances and vessel
sharing agreements, and, through the
acquisition of Hamburg Süd, driving in-
dustry consolidation and geographically
diversifying A.P. Moller - Maersk’s earn-
ings. Further, in line with the strategy
of offering end-to-end solutions online,
A.P. Moller - Maersk seeks to expand its
presence outside ocean freight in or-
der to diversify and stabilise earnings
from adjacent revenue streams.
Although the portfolio may eventually
disconnect from the direct exposure to
the energy markets through separation
of the A.P. Moller - Maersk energy busi-
nesses, it will remain vulnerable to the
effect that commodity prices continue
to have in certain markets. APM Termi-
nals has suffered difficulties in certain
commodity-dependent markets, par-
ticularly in the North-South trades. This
risk is exacerbated by the addition of
Hamburg Süd’s trades, as these focus
on Latin America. APM Terminals is
conducting a review of its portfolio to
strengthen overall profitability.
Digitisation of business model
The strategy suggests exploring
new opportunities through digital
innovation. The shipping industry
remains very transactional and tech-
nologically lacking compared to other
industries, and could as such be prone
to disruption. Hence, without active
participation, digitisation may prove
a risk, as online sales and logistics
channels increasingly become rele-
vant players in the traditional trans-
port and logistics space. The estab-
lishment of a digital organisation and
the announced agreement with IBM
on a joint venture to create a digitised
trade platform is the response to and
a token of awareness of the disruptive
risks and opportunities emerging on
the industry’s virtual horizon.
Compliance risksSulphur cap implementation
Being a leading global shipping op-
erator, A.P. Moller - Maersk remains
exposed to regulatory changes within
the industry. One such change takes
effect in 2020, with a global sulphur
emission cap. From a sustainability
point of view, the initiative is wel-
comed, but there are risks associated
with the introduction of the new global
standards. Sub-par enforcement
mechanisms may skew the playing
field, leaving those complying with
the new legislation at a disadvantage,
as the price of compliant fuel is likely
to exceed that of the heavy fuel oil
currently in use. A strategy to operate
in compliance with the new sulphur
threshold from 2020 has been devel-
oped. At this stage, a deliberate choice
has been made not to invest in the
instalment of scrubbers on vessels
DIRECTORS’ REPORT GOVERNANCE AND RISK
A.P. Moller - Maersk | Annual Report 201755
CORPORATE GOVERNANCE RISK MANAGEMENT SUSTAINABILITY REMUNERATION SHAREHOLDER INFORMATION

(to enable the continued use of heavy
fuel oil), and to maintain a dialogue
with refineries to secure a sufficient
supply of compliant fuel by the time
the regulations come into force.
Non-compliance with regulatory
standards
Its global span and presence exposes
A.P. Moller - Maersk to many different
jurisdictions and regulatory environ-
ments. APM Terminals and Damco have
a substantial presence in countries with
difficult business conditions from an
anti-corruption perspective. One exam-
ple is the compliance issues that sur-
faced in Latin America following APM
Terminals’ acquisition of the Spanish
Grup Marítim TCB in 2016 (see page 38).
Maersk Line is continuously exposed to
competition law scrutiny, as evidenced
by the US Department of Justice’s
investigation into the container liner
industry initiated in March 2017. With
the latest addition of Hamburg Süd’s
trades, the focus remains on comply-
ing with applicable laws and stand-
ards. This includes the deployment
of consistent rules and standards
within the company wide governance
framework, COMMIT, awareness cam-
paigns, continuous assessments of
compliance risks and cooperation with
authorities concerning investigations.
Tax non-compliance
Much like the regulatory compli-
ance risk, the diversified nature of
A.P. Moller - Maersk’s activities and its
cross-border presence entails an expo-
sure to a wide range and variety of tax
environments. Part of the risk stems
from potential changes in regulations
or challenges to historic tax positions,
resulting in differing interpretations.
Additionally, local tax authority inves-
tigations, especially in regions with
national fiscal positions under strain,
remain an area with a continuous need
for collaboration and monitoring.
The latter dynamic can be exacer-
bated by changes in public opinion on
what is regarded as ‘good corporate
citizenship’. As with other regulatory
standards, the tax-related risk is mit-
igated through an upright approach,
collaboration with the authorities
in respect of investigations and en-
quiries, as well as ensuring that the
necessary competencies and an effi-
cient organisation of specialists is in
place to best meet the requirements
and tax regulations relevant to oper-
ations. Tax exposures are monitored
systematically on an ongoing basis.
Mexico City, pictured, is one of the world’s
largest cities and capital of a large and
expanding market.
DIRECTORS’ REPORT GOVERNANCE AND RISK
A.P. Moller - Maersk | Annual Report 201756
CORPORATE GOVERNANCE RISK MANAGEMENT SUSTAINABILITY REMUNERATION SHAREHOLDER INFORMATION

Sustainability
A changing world brings changing
expectations to business, adding up
to a new role for the private sector in
general and for large businesses in
particular. Global events, mega trends
and broad societal change have af-
fected the course of global develop-
ment faster than most of the world
imagined possible only five years ago.
This includes a growing opposition to
globalisation, increases in protection-
ist measures by countries, and a shift
in global power balances. Moreover,
climate change impacts have inspired
global agreements, increased focus
on climate adaptation and innovation
towards a low-carbon world. Mean-
while, technological advances at an
accelerated pace continue to alter
and disrupt industries.
Sustainability prioritiesA.P. Moller - Maersk reviewed its sus-
tainability priorities in light of the new
business strategy, the portfolio of risks
faced, and with a view to having the
greatest impact on the UN Sustainable
Development Goals in 2017. As a result,
A.P. Moller - Maersk has now defined
key sustainability priorities to create
shared value by pursuing and scaling
solutions to meet significant systemic
challenges for the benefit of society
and the businesses:
• Help decarbonise logistics
• Contribute to halving food loss
• Help multiply the benefits of trade
• Lead change in the ship recycling
industry.
Key to the priorities is responsible
business practices. A.P. Moller - Maersk
has strong management approaches
for material issues, including health,
safety, environment, human and
labour rights, anti-corruption, and
responsible tax practices. When com-
pliance challenges arise, action is
taken to improve processes and
ensure similar incidents will not hap-
pen again. In 2017, Maersk Oil experi-
enced two such cases, related to the
discharge of certain chemicals used
in offshore production operations and
the storage of naturally-occurring ra-
dioactive materials (NORM), and has
worked with relevant authorities to in-
vestigate and ensure full compliance.
CONTRIBUTE TO HALVING FOOD LOSS
A.P. Moller - Maersk wants
to support the efforts to
reduce the loss of 30% of
food in the post-harvest
and transport stage of the
supply chain. Working with partners, invest-
ments on the scale of USD millions will be
made to develop technical solutions over
the next three years. The outcome of these
investments is intended to create scalable
solutions to prevent food loss in logistics,
and to expand the use of cold chain tech-
nologies and offerings to new markets.
HELP MULTIPLY THE BENEFITS OF TRADE
To help multiply the
benefits of trade, invest-
ments will be made in
digital solutions to facil-
itate trade. This includes
the creation of a joint venture with IBM,
which establishes an open digital platform
for exchanging trade documentation and
information. Also, the further development
of Fromtu, a digital B2B trading platform for
Africa, and ConnectAmericas, a platform
for trade information and education in Latin
America. A.P. Moller - Maersk participates in
the Global Alliance for Trade Facilitation to
support implementation of the WTO Trade
Facilitation Agreement. A.P. Moller - Maersk
intends to contribute by working with
customers and partners to simplify supply
chains, digitise procedures and accelerate
trade reform to provide easier access to
global networks.
HELP DECARBONISE LOGISTICS
The aim is to contribute
to the decarbonisation
of logistics. This will re-
quire measures beyond in-
creased energy efficiency,
e.g. innovation in alternative fuels. In the
meantime, Maersk Line continues to pursue
a target of 60% relative CO2 reduction by
2020 (2007 baseline). At the end of 2017,
reductions of 43% have been achieved.
A.P. Moller - Maersk works to support sector-
wide agreements that help ensure a level
playing field, including increased regulation
of greenhouse gas emissions from shipping
through the International Maritime Organi-
zation. A.P. Moller - Maersk will also work to
understand and act on climate change risks
to the business.
LEAD CHANGE IN THE SHIP RECYCLING INDUSTRY
85% of all ships are dis-
mantled at sub-standard
facilities in South Asia,
despite many large ship-
owners having a policy
on responsible ship recycling. From an
A.P. Moller - Maersk point-of-view this is a
systemic issue. A.P. Moller - Maersk has,
therefore, been collaborating with selected
yards in Alang, India, since 2016 to use the
commercial power to change conditions on
the ground, in order to build the leverage
to be part of transforming the entire ship
recycling industry and at the same time en-
gaging with local stakeholders to improve
conditions for the wider Alang community,
focusing initially on access to health care.
Managing sustainability risk, responsibility and opportunity.
DIRECTORS’ REPORT GOVERNANCE AND RISK
A.P. Moller - Maersk | Annual Report 201757
CORPORATE GOVERNANCE RISK MANAGEMENT SUSTAINABILITY REMUNERATION SHAREHOLDER INFORMATION

SOX
531 ton
tonnes of SOx emitted
Material sustainability risks and responsibilitiesFour issues are of particular concern
to the financial community. Safety,
which affects the license to operate;
Climate change as a risk to the busi-
ness; Ship recycling, where activities
attract considerable attention; and
SOx, where 2020 legislation will lead
to a significant increase in fuel costs.
Safety: A.P. Moller - Maersk’s busi-
nesses and brands have management
systems to support the efforts to reach
the target of zero injuries and fatalities.
In 2017, there was a deeply unaccept-
able loss of seven lives and a downturn
in safety performance. Safety perfor-
mance is constantly reviewed and ac-
tion will be taken to reverse this trend.
One critical factor is much broader
leadership involvement in the safety
mindset.
in establishing the Ship Recycling
Transparency Initiative, where a group
of founding partners, including other
shipowners, financial institutions and
shipping industry customers, will strive
to create an overview of practices and
options through disclosure.
SOx: A global cap of 0.5% sulphur
content in fuel entering into force in
2020 carries enforcement challenges
and rising fuel costs. The lack of vi-
able methods for enforcement will
create an uneven playing field, pun-
ishing compliant shipowners finan-
cially. A.P. Moller - Maersk is exploring
viable solutions to the enforcement
challenges, both alone and as a board
member of the Trident Alliance, an
association of shipowners commit-
ted to the strong enforcement of
the global cap. Current suggestions
include making it illegal to buy fuel
with a sulphur content higher than
0.5% for vessels without an approved
technology for exhaust gas cleaning
such as scrubbers. A.P. Moller - Maersk
will not pursue scrubbers as an option
for compliance, but will replace the
cheaper bunker oil with fuels with a
lower sulphur content.
Companies can no longer stay on the sidelines when it comes to global issues. What we are and will be doing is fitting for a company of our size, knowledge, reach and leverage.
SØREN SKOU CEO of A.P. Møller - Mærsk A/S
Read more in the A.P. Moller - Maersk Sustainability Report 2017 https://www.maersk.com/business/sustain-ability/sustainabili-ty-reports-and-pub-lications/reports
SAFETY
7 fatalities
RELATIVE CO2 REDUCTION
reduction in Maersk Line’s relative CO2 emissions in 2017 compared to 2007 baseline.
43%
Climate change: The effects of
climate change increasingly pose
risks to business models and assets.
A.P. Moller - Maersk is a signatory to
and committed to developing climate
disclosures in accordance with the
Task Force on Climate-related Finan-
cial Disclosures’ guidelines, including
reporting on both transition risks
and physical risks, and analysing
A.P. Moller - Maersk businesses
using climate change scenarios.
Ship recycling: It was established in
2017 that responsible ship recycling
was possible in yards in Alang, India,
with regard to health, safety and
environmental impacts and that ship-
owners investing and committing to
upgrades of yards create a race to the
top among recycling yards. To accel-
erate development and create change
at scale, more shipowners need to
become involved. As a first step, in 2017
A.P. Moller - Maersk was instrumental
LOST-TIME INJURY FREQUENCY (LTIf)
LTIf is lost-time injury frequency per one million man-hours.The figures below are based on exposure hours for employees in operational scope. See Sustainability Accounting Principleshttps://www.maersk.com/busi-ness/sustainability/sustainability-re-ports-and-publica-tions/reports
0.54 / 0.42Maersk Line1
1.66 / 1.53APM Terminals
0.30 / 1.04Damco
0.28 / 0.63Svitzer
1.31 / 1.90Maersk Container Industry
0.59 / 0.43Maersk Oil
0.53 / 0.49Maersk Drilling
0.19 / 0.72Maersk Supply Service
1 Maersk Line LTIf for seafarers, where much of the opera-tional risk lies, is 1.06 in 2017 (0.8 in 2016).
2017 2016
DIRECTORS’ REPORT GOVERNANCE AND RISK
A.P. Moller - Maersk | Annual Report 201758
CORPORATE GOVERNANCE RISK MANAGEMENT SUSTAINABILITY REMUNERATION SHAREHOLDER INFORMATION

Remuneration
The Annual General Meeting of
A.P. Møller - Mærsk A/S adopts the
Remuneration Policy and General
Guidelines on Incentive Pay applicable
to the members of the Board of Direc-
tors and the registered management
(Executive Board). The Policy and Guide-
lines promote the overall objectives of:
• Supporting the Company’s value
creation both in the short and
long term
• Attracting and retaining qualified
candidates and motivating mem-
bers of the Board of Directors and
the Executive Board to achieve
the targets and strategy set by
the Company
• Ensuring alignment of interests
between the Company’s share-
holders, the Board of Directors
and the Executive Board.
The most recent Remuneration Policy
and General Guidelines on Incentive
Pay were adopted at the 28 March
2017 Annual General Meeting and are
available http://investor.maersk.com/
guidelines.cfm
Board of DirectorsEach member of the Board of Directors
receives a fixed annual fee. Ordinary
Board members receive a fixed amount,
while the Vice Chairmen receive fixed
multiples thereof. The Chairman re-
ceives a fixed amount. Members of the
Board of Directors serving on Board
committees or performing ad hoc work
beyond the normal work as a board
member receive an additional fixed fee.
Members of the Board of Directors and
the Board committees do not receive
any incentive or share-based pay. The
fee levels are guided by comparison
with companies of comparable size
and complexity based in Europe.
Executive BoardRemuneration of the members of
the Executive Board is decided by the
Board of Directors based on recom-
mendations from the Remuneration
Committee. Remuneration levels are
guided by comparisons to other inter-
national companies of comparable
size and complexity based in Europe.
Share-based incentive schemes
ensure that members of the Execu-
tive Board maintain exposure to the
development in the share price. The
remuneration and benefits package
consists of:
• Fixed base salary
• Short-term cash incentive with a
maximum value per annum of 50%
of the fixed base salary. The short-
term cash incentive is determined
by achievement of financial and
non-financial goals. Examples of the
criteria applied in 2017 are net result,
cash flow, return on invested capital,
cost-efficiency measures, prepara-
tion and execution of M&A trans-
actions, safety performance and
customer satisfaction. For 2018,
the focus is on execution of the
strategy of becoming the global
integrator of container logistics.
Achievements are measured over
the course of the year against
targets approved by the Board of
Directors
• Long-term incentive scheme. In
2017, members of the Executive
Board received stock options with
a maximum value at grant of 25%
of the fixed annual base salary
• Certain benefits, for instance com-
pany driver, phone, insurance cover-
age, news subscriptions, training/
education, etc.
• A company notice period of up to
24 months. During this period, the
Executive Board member is entitled
to receive up to 24 months’ worth of
total remuneration.
Further information on remuneration,
share-based and other incentives is set
out in notes 2 and 11 in the Consolidated
financial statements.
DIRECTORS’ REPORT GOVERNANCE AND RISK
A.P. Moller - Maersk | Annual Report 201759
CORPORATE GOVERNANCE RISK MANAGEMENT SUSTAINABILITY REMUNERATION SHAREHOLDER INFORMATION

The share price decreased 4% over the year, implying a total shareholder return of negative 2.5% for 2017. The Board of Directors in A.P. Møller - Mærsk A/S proposes an ordinary dividend of DKK 150 per share corresponding to a dividend yield of 1.4%.
Shareholderinformation
negative share price performance
since July was a consequence of the
negative financial and operational
impact of the cyber-attack combined
with deteriorating market conditions
in the container liner industry from
lower freight rates due to oversupply
and higher bunker cost.
Share capitalA.P. Moller - Maersk shares are listed
on NASDAQ Copenhagen and are di-
vided into two classes: A shares with
voting rights and B shares without
voting rights. Each DKK 1,000 A share
entitles the holder to two votes.
The A.P. Møller - Mærsk A/S’ share
capital amounts to nominally DKK
20,816,862,000.
OwnershipThe total number of registered share-
holders decreased by 8,500 to around
81,800 during 2017. Shareholders with
more than 5% of share capital or votes
held 50% of the share capital, while
the 20 largest institutional sharehold-
ers together owned around 13% of the
total share capital and 28.5% adjusted
for the free-float. Danish retail inves-
tors increased their ownership from
16% to 18.5% of the total share capital
since the end of 2016.
Own shares A.P. Møller - Mærsk A/S’ holding of own
shares comprised 0.29% of the share
capital at the end of 2017, cf. note 10 in
the consolidated financial statements.
Source: Bloomberg, data are rebased from the Maersk-B share price end of December 2017.
MSCI World Transport Maersk B OMXC20
10,000
11,000
12,000
13,000
14,000
15,000OMX
Maersk B
MSCI
Jan Feb Mar Apr May Jun Jul Aug Sep Oct Nov Dec
Share price developmentThe Maersk B share price decreased
4% from its closing price at the end
of 2016 of DKK 11,270. By comparison,
the benchmark indices MSCI World
Transpor tation and OMXC20 increased
by 25% and 12%, respectively. The
Maersk B share price reached its high-
est price of DKK 14,130 on 19 July 2017,
and its lowest price of DKK 10,140 on
23 November 2017. The total market
value of A.P. Møller - Mærsk A/S was
USD 35.4bn at the end of 2017. The
DKK
SHARE PRICE DEVELOPMENT
DIRECTORS’ REPORT GOVERNANCE AND RISK
A.P. Moller - Maersk | Annual Report 201760
CORPORATE GOVERNANCE RISK MANAGEMENT SUSTAINABILITY REMUNERATION SHAREHOLDER INFORMATION

DividendDividend is the primary distribution
of capital to the shareholders.
A.P. Møller - Mærsk A/S’ objective
is to increase the nominal dividend
per share over time, supported by
under lying earnings growth.
The Board of Directors proposes an
ordinary dividend to the shareholders
of DKK 150 per share of DKK 1,000
(DKK 150 per share of DKK 1,000).
The proposed dividend payment re-
presents an ordinary dividend yield
of 1.4% (1.3%), based on the Maersk B
share’s closing price of DKK 10,840 as
of 29 December 2017. Payment is ex-
pected to take place on 13 April 2018.
Annual General MeetingThe Annual General Meeting will be
held on 10 April 2018 in Copenhagen,
Denmark.
Investor RelationsTo keep investors and analysts updated
on the strategic development, market
outlook and financial performance,
A.P. Møller - Mærsk A/S arranges road-
shows and participates in investor and
industry conferences. Investor Rela-
tions, besides meeting domestic inves-
tors, also travels extensively to ensure
that international investors are kept
updated on the latest development.
In 2017, the Executive Board and the
Investor Relations team had more than
500 meetings with the participation of
more than 1,000 investors and analysts
in Europe, Asia and the USA.
A.P. Møller - Mærsk A/S’ is covered by
30 sell-side analysts, predominantly
from international investment banks,
who regularly publish research reports
and sector reports. A list of the analysts
and other relevant information, including
financial reports, investor presen tations,
share and bond information, is available
http://investor.maersk.com/
The Maersk B share price reached its highest price of DKK 14,130 on 19 July 2017, and its lowest price of DKK 10,140 on 23 November 2017.
THE MAERSK SHARE
Key figures 2017 2016 2015 2014 2013
Year-end share price (DKK, B share) 10,840 11,270 8,975 12,370 11,770
Share price range (DKK, B share) 3,990 4,140 7,605 4,100 3,778
Market capitalisation at year-end (USD bn, A and B share) 35.4 32.2 27.6 42.8 46.3
Earnings per share (USD) -58 -93 37 230 158
Dividend per share (DKK, A and B share) 1 150 150 300 300 280
Dividend yield (B share) 1.4% 1.3% 3.3% 15.9% 2 2.4%
Share buy-back programme (DKK bn) 3 - 3.2 5.2 3.9 -
1 Ordinary dividend in proposed year
2 Including extraordinary dividend
3 Actual payments on a cash basis
SHAREHOLDERS WITH MORE THAN 5% OF SHARE CAPITAL OR VOTES
Shareholders according to the Danish Companies Act § 55 are
Share capital Votes
A.P. Møller Holding A/S, Copenhagen, Denmark 41.51% 51.23%
A.P. Møller og Hustru Chastine Mc-Kinney Møllers Familiefond, Copenhagen, Denmark 8.84% 13.12%
Den A.P. Møllerske Støttefond, Copenhagen, Denmark 3.11% 5.99%
Financial calendar 2018
20 February . . . . . . . . . . . . . . . . . . . . . . . . . . . . . . . . . . . . . Capital Markets Day
10 April . . . . . . . . . . . . . . . . . . . . . . . . . . . . . . . . . . . . . . . . . . Annual General Meeting
17 May . . . . . . . . . . . . . . . . . . . . . . . . . . . . . . . . . . . . . . . . . . . Interim Report Q1 2018
17 August . . . . . . . . . . . . . . . . . . . . . . . . . . . . . . . . . . . . . . . Interim Report Q2 2018
14 November . . . . . . . . . . . . . . . . . . . . . . . . . . . . . . . . . . . Interim Report Q3 2018
DIRECTORS’ REPORT GOVERNANCE AND RISK
A.P. Moller - Maersk | Annual Report 201761
CORPORATE GOVERNANCE RISK MANAGEMENT SUSTAINABILITY REMUNERATION SHAREHOLDER INFORMATION

FINANCIALS 2017
Consolidated financial statements 2017 | Parent company financial statements 2017 | Statement of the Board of Directors and the Executive Board | Independent Auditor’s Report
A.P. Moller - Maersk | Annual Report 201762
FINANCIALS

A .P . Moller - Maersk
(In parenthesis the corresponding figures for 2016)
CONSOLIDATED FINANCIAL STATEMENTS 2017
Consolidated income statement | Consolidated statement of comprehensive income | Consolidated balance sheet at 31 December | Consolidated cash flow statement | Consolidated statement of changes in equity | Notes to the consolidated financial statements
A.P. Moller - Maersk | Annual Report 201763
CONSOLIDATED FINANCIAL STATEMENTS — NOTES OVERVIEWFINANCIALS CONSOLIDATED FINANCIAL STATEMENTS

Consolidated statement of comprehensive income
Consolidated income statement
Note 2017 2016
1 Revenue 30,945 27,266
2 Operating costs 27,420 24,800
Other income 200 168
Other costs 193 159
Profit before depreciation, amortisation and impairment losses, etc. 3,532 2,475
6, 7 Depreciation, amortisation and impairment losses, net 3,015 2,495
3 Gain on sale of non-current assets, etc., net 154 190
Share of profit/loss in joint ventures -131 130
Share of profit/loss in associated companies 101 -55
Profit/loss before financial items 641 245
4 Financial income 1,382 742
4 Financial expenses 1,998 1,285
Profit/loss before tax 25 -298
5 Tax 219 171
Profit/loss for the year – continuing operations -194 -469
9 Profit/loss for the year – discontinued operations -970 -1,428
Profit/loss for the year -1,164 -1,897
Of which:
Non-controlling interests 41 42
A.P. Møller - Mærsk A/S’ share -1,205 -1,939
10 Earnings per share – continuing operations, USD -11 -25
10 Diluted earnings per share – continuing operations, USD -11 -25
10 Earnings per share, USD -58 -93
10 Diluted earnings per share, USD -58 -93
Maersk Oil, Maersk Tankers, Maersk Drilling and Maersk Supply Service are classified as discontinued
operations and assets held for sale. Comparative figures have been restated for the income statement
and cash flow statement, while the balance sheet has not been restated.
Note 2017 2016
Profit/loss for the year -1,164 -1,897
Translation from functional currency to presentation currency:
Translation impact arising during the year 365 -330
Reclassified to income statement, gain on sale of non-current assets, etc., net 60 -
16 Other equity investments (assets available-for-sale):
Fair value adjustment for the year - 24
Reclassified to income statement, gain on sale of non-current assets, etc., net - -51
15 Cash flow hedges:
Value adjustment of hedges for the year 341 -231
Reclassified to income statement
– revenue -4 7
– operating costs -45 37
– financial expenses 55 64
– discontinued operations -3 40
Reclassified to non-current assets -28 116
5 Tax on other comprehensive income -32 16
Share of other comprehensive income of joint ventures and associated companies, net of tax 2 3
Total items that have been or may be reclassified subsequently to the income statement 711 -305
16 Other equity investments, fair value adjustments for the year 138 -
13 Actuarial gains/losses on defined benefit plans, etc. 159 -96
5 Tax on other comprehensive income -11 -
Total items that will not be reclassified to the income statement 286 -96
Other comprehensive income, net of tax 997 -401
Total comprehensive income for the year -167 -2,298
Of which:
Non-controlling interests 47 54
A.P. Møller - Mærsk A/S’ share -214 -2,352
A.P. Moller - Maersk | Annual Report 201764
Amounts in USD million
CONSOLIDATED FINANCIAL STATEMENTS — NOTES OVERVIEWFINANCIALS CONSOLIDATED FINANCIAL STATEMENTS

Consolidated balance sheet at 31 December
Note 2017 2016
6 Intangible assets 4,365 3,620
7 Property, plant and equipment 31,071 41,496
Investments in joint ventures 1,394 1,749
Investments in associated companies 963 855
16 Other equity investments 30 796
15 Derivatives 260 14
13 Pensions, net assets 298 96
Loans receivable 147 127
Other receivables 316 632
Financial non-current assets, etc. 3,408 4,269
8 Deferred tax 302 590
Total non-current assets 39,146 49,975
Inventories 974 862
17 Trade receivables 3,864 3,814
Tax receivables 243 291
15 Derivatives 116 161
Loans receivable 240 202
Other receivables 923 952
Prepayments 560 601
Receivables, etc. 5,946 6,021
Securities 1 52
Cash and bank balances 2,171 4,105
9 Assets held for sale 14,989 103
Total current assets 24,081 11,143
Total assets 63,227 61,118
Note 2017 2016
10 Share capital 3,774 3,774
Reserves 26,835 27,484
Equity attributable to A.P. Møller - Mærsk A/S 30,609 31,258
Non-controlling interests 816 832
Total equity 31,425 32,090
12 Borrowings, non-current 15,076 13,320
13 Pensions and similar obligations 287 238
14 Provisions 1,011 3,573
15 Derivatives 138 526
8 Deferred tax 461 605
Other payables 72 33
Other non-current liabilities 1,969 4,975
Total non-current liabilities 17,045 18,295
12 Borrowings, current 2,437 2,015
14 Provisions 539 1,255
Trade payables 5,250 4,901
Tax payables 282 212
15 Derivatives 128 536
Other payables 1,241 1,348
Deferred income 158 450
Other current liabilities 7,598 8,702
9 Liabilities associated with assets held for sale 4,722 16
Total current liabilities 14,757 10,733
Total liabilities 31,802 29,028
Total equity and liabilities 63,227 61,118
A.P. Moller - Maersk | Annual Report 201765
Amounts in USD million
CONSOLIDATED FINANCIAL STATEMENTS — NOTES OVERVIEWFINANCIALS CONSOLIDATED FINANCIAL STATEMENTS

Consolidated cash flow statement
Note 2017 2016
Profit/loss before financial items 641 245
6,7 Depreciation, amortisation and impairment losses, net 3,015 2,495
3 Gain on sale of non-current assets, etc., net -149 -102
Share of profit/loss in joint ventures 131 -130
Share of profit/loss in associated companies -101 55
20 Change in working capital -282 -399
Change in provisions and pension obligations, etc. -127 -225
20 Other non-cash items 159 113
Cash flow from operating activities before financial items and tax 3,287 2,052
Dividends received 213 232
Financial income received 131 68
Financial expenses paid -861 -630
Taxes paid -174 -458
Cash flow from operating activities 2,596 1,264
20 Purchase of intangible assets and property, plant and equipment -3,599 -1,998
Sale of intangible assets and property, plant and equipment 435 400
21 Acquisition of subsidiaries and activities -4,152 -708
21 Sale of subsidiaries and activities 314 14
Sale of associated companies 2 -
Other financial investments, net 813 219
Cash flow used for capital expenditure -6,187 -2,073
Purchase/sale of securities, trading portfolio 52 753
Cash flow used for investing activities -6,135 -1,320
Repayment of borrowings -2,632 -1.340
Proceeds from borrowings 3,454 2,977
Purchase of own shares - -475
Sale of own shares 14 2
Dividends distributed -454 -953
Dividends distributed to non-controlling interests -62 -53
Sale of non-controlling interests 4 -
Other equity transactions 1 -24
Cash flow from financing activities 325 134
Net cash flow from continuing operations -3,214 78
9 Net cash flow from discontinued operations 1,251 503
Net cash flow for the year -1,963 581
Cash and cash equivalents 1 January 4,077 3,996
Currency translation effect on cash and cash equivalents 154 -500
Cash and cash equivalents 31 December 2,268 4,077
Of which classified as assets held for sale -109 -19
Cash and cash equivalents 31 December 2,159 4,058
Note 2017 2016
Cash and cash equivalents
Cash and bank balances 2,171 4,105
Overdrafts 12 47
Cash and cash equivalents 31 December 2,159 4,058
Cash and bank balances include USD 1.0bn (USD 1.1bn) relating to cash and bank balances in countries with
exchange control or other restrictions. These funds are not readily available for general use by the parent
company or other subsidiaries.
A.P. Moller - Maersk | Annual Report 201766
Amounts in USD million
CONSOLIDATED FINANCIAL STATEMENTS — NOTES OVERVIEWFINANCIALS CONSOLIDATED FINANCIAL STATEMENTS

Consolidated statement of changes in equityA.P. Møller - Mærsk A/S
Share capital Translation reserve
Reserve for other equity investments
Reserve for hedges
Retained earnings
Total Non-controllinginterests
Total equity
Equity 1 January 2016 3,906 -381 -205 -301 32,068 35,087 652 35,739
Other comprehensive income, net of tax - -325 -27 46 -107 -413 12 -401
Profit/loss for the year - - - - -1,939 -1,939 42 -1,897
Total comprehensive income for the year - -325 -27 46 -2,046 -2,352 54 -2,298
Dividends to shareholders - - - - -953 -953 -53 -1,006
11 Value of share-based payment - - - - -7 -7 - -7
Acquisition of non-controlling interests - - - - -44 -44 164 120
Purchase of own shares - - - - -475 -475 - -475
Sale of own shares - - - - 2 2 - 2
10 Capital increases and decreases -132 1 - - - 132 1 - 15 15
Total transactions with shareholders -132 - - - -1,345 -1,477 126 -1,351
Equity 31 December 2016 3,774 -706 -232 -255 28,677 31,258 832 32,090
2017
Other comprehensive income, net of tax - 420 141 281 149 991 6 997
Profit/loss for the year - - - - -1,205 -1,205 41 -1,164
Total comprehensive income for the year - 420 141 281 -1,056 -214 47 -167
Dividends to shareholders - - - - -454 -454 -62 -516
11 Value of share-based payment - - - - 10 10 - 10
Sale of non-controlling interests - - - - - - -16 -16
Sale of own shares - - - - 14 14 - 14
10 Capital increases and decreases - - - - - - 15 15
16 Transfer of loss on disposal of equity investments at FVOCI to retained earnings - - 117 - -117 - - -
Other equity movements - - - - -5 -5 - -5
Total transactions with shareholders - - 117 - -552 -435 -63 -498
Equity 31 December 2017 3,774 -286 26 26 27,069 30,609 816 31,425
1 At the Annual General Meeting of A.P. Møller - Mærsk A/S on 12 April 2016, the shareholders decided on the cancellation of treasury shares, whereby the share capital has decreased by a transfer of reserves to retained earnings.
A.P. Moller - Maersk | Annual Report 201767
Amounts in USD million
CONSOLIDATED FINANCIAL STATEMENTS — NOTES OVERVIEWFINANCIALS CONSOLIDATED FINANCIAL STATEMENTS

Notes Note 1Segment information . . . . . . . . . . . . . . . . . . . . . . . . . . . . . . . . . . . . . . . . . . . . . . . . . . . . . . . . . . . . . . 69
Note 2Operating costs . . . . . . . . . . . . . . . . . . . . . . . . . . . . . . . . . . . . . . . . . . . . . . . . . . . . . . . . . . . . . . . . . . . . . . . . . 72
Note 3Gain on sale of non-current assets, etc., net . . . . . . . . . . . . . . . . . . . . . . . 73
Note 4Financial income and expenses . . . . . . . . . . . . . . . . . . . . . . . . . . . . . . . . . . . . . . . . . . . . 73
Note 5Tax . . . . . . . . . . . . . . . . . . . . . . . . . . . . . . . . . . . . . . . . . . . . . . . . . . . . . . . . . . . . . . . . . . . . . . . . . . . . . . . . . . . . . . . . . . . . . . . . 74
Note 6Intangible assets . . . . . . . . . . . . . . . . . . . . . . . . . . . . . . . . . . . . . . . . . . . . . . . . . . . . . . . . . . . . . . . . . . . . . . 75
Note 7Property, plant and equipment . . . . . . . . . . . . . . . . . . . . . . . . . . . . . . . . . . . . . . . . . . . . . . 76
Note 8Deferred tax . . . . . . . . . . . . . . . . . . . . . . . . . . . . . . . . . . . . . . . . . . . . . . . . . . . . . . . . . . . . . . . . . . . . . . . . . . . . . . . 78
Note 9Discontinued operations and assets held for sale . . . . . . . . . . . . 78
Note 10Share capital and earnings per share . . . . . . . . . . . . . . . . . . . . . . . . . . . . . . . . . . . 80
Note 11Share-based payment . . . . . . . . . . . . . . . . . . . . . . . . . . . . . . . . . . . . . . . . . . . . . . . . . . . . . . . . . . . . . 82
Note 12Borrowings and net debt reconciliation . . . . . . . . . . . . . . . . . . . . . . . . . . . . . . 85
Note 13Pensions and similar obligations . . . . . . . . . . . . . . . . . . . . . . . . . . . . . . . . . . . . . . . . . . 86
Note 14Provisions . . . . . . . . . . . . . . . . . . . . . . . . . . . . . . . . . . . . . . . . . . . . . . . . . . . . . . . . . . . . . . . . . . . . . . . . . . . . . . . . . . . 89
Note 15Derivatives . . . . . . . . . . . . . . . . . . . . . . . . . . . . . . . . . . . . . . . . . . . . . . . . . . . . . . . . . . . . . . . . . . . . . . . . . . . . . . . . . . 90
Note 16Financial instruments by category . . . . . . . . . . . . . . . . . . . . . . . . . . . . . . . . . . . . . . . 91
Note 17Financial risks, etc. . . . . . . . . . . . . . . . . . . . . . . . . . . . . . . . . . . . . . . . . . . . . . . . . . . . . . . . . . . . . . . . . . . . 93
Note 18Commitments – continuing operations . . . . . . . . . . . . . . . . . . . . . . . . . . . . . . 95
Note 19Contingent liabilities . . . . . . . . . . . . . . . . . . . . . . . . . . . . . . . . . . . . . . . . . . . . . . . . . . . . . . . . . . . . . . . . 96
Note 20Cash flow specifications . . . . . . . . . . . . . . . . . . . . . . . . . . . . . . . . . . . . . . . . . . . . . . . . . . . . . . . . . 97
Note 21Acquisition/sale of subsidiaries and activities . . . . . . . . . . . . . . . . . . 97
Note 22Related parties . . . . . . . . . . . . . . . . . . . . . . . . . . . . . . . . . . . . . . . . . . . . . . . . . . . . . . . . . . . . . . . . . . . . . . . . . . 100
Note 23Significant accounting policies . . . . . . . . . . . . . . . . . . . . . . . . . . . . . . . . . . . . . . . . . . . . . 101
Note 24Significant accounting estimates and judgements . . . . . . . . . 105
Note 25New financial reporting requirements . . . . . . . . . . . . . . . . . . . . . . . . . . . . . . . . . 107
A.P. Moller - Maersk | Annual Report 201768
Amounts in USD million
CONSOLIDATED FINANCIAL STATEMENTS — NOTES OVERVIEWFINANCIALS CONSOLIDATED FINANCIAL STATEMENTS

Segment informationNote 1
Maersk Line 3 APM Terminals Damco Svitzer Maersk Container Industry
Total reportable segments
2017External revenue 23,939 2,723 2,668 620 185 30,135Inter-segment revenue 360 1,415 - 39 831 2,645Total revenue 24,299 4,138 2,668 659 1,016 32,780
Profit/loss before depreciation, amortisation and impairment losses, etc. 2,624 705 -4 197 87 3,609Depreciation and amortisation 2,034 433 19 87 36 2,609Impairment losses - 363 - 14 - 377Reversal of impairment losses - 6 - - - 6Gain/loss on sale of non-current assets, etc., net 110 22 1 6 - 139Share of profit/loss in joint ventures - -158 11 7 - -140Share of profit/loss in associated companies - 106 - 1 - 107Profit/loss before financial items (EBIT) 700 -115 -11 110 51 735Tax 159 53 24 8 13 257Profit/loss for the period 541 -168 -35 102 38 478
Gain/loss on sale of non-current assets, etc., net 1 110 22 1 6 - 139Impairment losses, net 1 - -621 - -20 - -641Transaction and integration cost 59 - - - - 59Tax on adjustments 21 +17 - +2 - 2Underlying profit/loss 511 414 -36 114 38 1,041
Cash flow from operating activities 2,389 827 -101 179 75 3.369Cash flow used for capital expenditure -6,142 -672 -4 -96 -20 -6,934Free cash flow -3,753 155 -105 83 55 -3,565
Investments in non-current assets 2 8,190 846 8 126 21 9,191
Intangible assets 1,521 2,737 84 18 5 4,365
Property, plant and equipment 25,689 3,678 67 1,126 230 30,790Investments in joint ventures - 1,271 29 94 - 1,394 Investments in associated companies 5 762 - 16 - 783Other non-current assets 527 198 29 68 32 854Assets held for sale 28 50 - 20 - 98Other current assets 4,467 919 687 138 431 6,642
Total non-interest bearing assets 32,237 9,615 896 1,480 698 44,926
Non-interest bearing liabilities 6,874 1,509 588 146 365 9,482Invested capital, net 25,363 8,106 308 1,334 333 35,444
1 Including the Group’s share of gains on sale of non-current assets, etc., net, and impairments, net, recorded in joint ventures and associated companies.
2 Comprise additions of intangible assets and property, plant and equipment, including additions from business combinations.
3 Including Hamburg Süd (only for December 2017, refer to note 21).
A.P. Moller - Maersk | Annual Report 201769
Amounts in USD million
CONSOLIDATED FINANCIAL STATEMENTS — NOTES OVERVIEWFINANCIALS CONSOLIDATED FINANCIAL STATEMENTS

Segment informationNote 1 — continued
Maersk Line APM Terminals Damco Svitzer Maersk Container Industry
Total reportable segments
2016External revenue 20,416 2,821 2,507 611 253 26,608Inter-segment revenue 299 1,355 - 31 311 1,996Total revenue 20,715 4,176 2,507 642 564 28,604
Profit/loss before depreciation, amortisation and impairment losses, etc. 1,525 764 70 166 -31 2,494Depreciation and amortisation 1,929 378 26 83 30 2,446Impairment losses 17 10 - 3 - 30 Gain/loss on sale of non-current assets, etc., net 25 18 - 5 -2 46Share of profit/loss in joint ventures - 101 11 11 - 123Share of profit/loss in associated companies - 92 - 1 - 93Profit/loss before financial items (EBIT) -396 587 55 97 -63 280Tax +20 149 24 6 +8 151Profit/loss for the period -376 438 31 91 -55 129
Gain/loss on sale of non-current assets, etc., net 1 25 23 - 5 -2 51Impairment losses, net 1 -17 -10 - -3 - -30Tax on adjustments - +8 - - - +8Underlying profit/loss -384 433 31 89 -53 116
Cash flow from operating activities 1,060 819 4 144 4 2,031Cash flow used for capital expenditure -586 -1,549 -8 -192 -26 -2.361Free cash flow 474 -730 -4 -48 -22 -330
Investments in non-current assets 2 1,892 2,402 9 215 25 4,543
Intangible assets - 2,627 90 17 5 2,739Property, plant and equipment 21,596 3,470 70 1,094 238 26,468Investments in joint ventures - 1,479 27 82 - 1,588 Investments in associated companies - 641 - 14 - 655Other non-current assets 189 198 30 57 33 507Assets held for sale 2 70 - 3 - 75Other current assets 3,247 872 500 126 308 5,053Total non-interest bearing assets 25,034 9,357 717 1,393 584 37,085
Non-interest bearing liabilities 4,952 1,390 485 190 227 7,244Invested capital, net 20,082 7,967 232 1,203 357 29,841
1 Including the Group’s share of gains on sale of non-current assets, etc., net, and impairments, net, recorded in joint ventures and associated companies.
2 Comprise additions of intangible assets and property, plant and equipment, including additions from business combinations.
A.P. Moller - Maersk | Annual Report 201770
Amounts in USD million
CONSOLIDATED FINANCIAL STATEMENTS — NOTES OVERVIEWFINANCIALS CONSOLIDATED FINANCIAL STATEMENTS

Segment information
2017 2016
Revenue
Reportable segments 32,780 28,604
Other businesses 624 352
Unallocated activities 196 312
Eliminations -2,655 -2,002
Total 30,945 27,266
Of which:
Sale of goods 605 560
Rendering of services, etc. 30,340 26,706
Profit/loss for the period
Reportable segments 478 129
Other businesses 75 -61
Financial items, net -616 -543
Unallocated tax 52 -1
Other unallocated items, costs 176 22 1
Eliminations -7 29
Continuing operations -194 -469
Discontinued operations -970 -1,428
Total -1,164 -1,897
Assets
Reportable segments 44,926 37,085
Other businesses 919 537
Unallocated activities 1,012 2,208
Discontinued operations and assets held for sale 14,578 17,856
Eliminations and financial items -966 -1,185
Total non-interest bearing assets 60,469 56,501
Interest bearing assets 2,758 4,617
Total 63,227 61,118
Liabilities
Reportable segments 9,482 7,244
Other businesses 224 202
Unallocated activities 1,032 1,279
Discontinued operations and assets held for sale 4,412 5,439
Eliminations and financial items -1,043 -471
Non-interest bearing liabilities 14,107 13,693
Interest bearing liabilities 17,695 15,335
Total 31,802 29,028
1 Including gains and dividends received of USD 141m.
APM Terminals and Maersk Line have entered into a commercial agreement whereby Maersk Line is se-
cured dedicated capacity in certain strategically important terminals. Under the terms of the agreement,
substantially all of the risks and benefits associated with ownership of these terminals are transferred to
Maersk Line.
Management has chosen not to apply finance lease accounting for the internal reporting. Accordingly,
these terminals are still reported as part of APM Terminals in the segment information. The effect for
APM Terminals is USD 122m (USD 124m) in revenue and USD 39m (USD 49m) in EBIT excluding the gains
or losses in connection with the de-recognition of non-current assets. Maersk Line is affected by the same
amount on cost and EBIT.
The agreement has no effect on the Group as the transactions are eliminated in the consolidation.
External revenue Tax paid Non-current assets 1
Geographical split 2017 2016 2017 2016 2017 2016
Denmark 240 333 +119 193 15,825 17,353
Brazil 577 421 26 7 449 328
China and Hong Kong 1,937 1,570 19 5 3,047 3,040
Germany 962 759 +4 - 4,057 11
India 1,086 962 25 14 120 151
Netherlands 916 712 18 14 806 688
Singapore 165 156 1 2 3,469 5,133
Turkey 469 396 16 18 2 120
United Kingdom 1,255 1,180 - +3 146 3,465
USA 4,917 5,063 12 35 1,341 3,435
Other 18,421 15,714 180 173 6,174 11,392
Total 30,945 27,266 174 458 35,436 45,116
1 Comprise intangible assets and property, plant and equipment relating to continuing operations for
2017.
Geographical information
Revenue for the shipping activities is based on the destination for ships operated by the Group and on
customer location for ships on time charter. For non-current assets, which cannot be easily moved, geo-
graphical location is where the assets are located. For all other assets, geographical location is based on
the legal ownership. These assets consist mainly of ships and containers registered in China, Denmark,
Singapore, United Kingdom and the USA.
Note 1 — continued
A.P. Moller - Maersk | Annual Report 201771
Amounts in USD million
CONSOLIDATED FINANCIAL STATEMENTS — NOTES OVERVIEWFINANCIALS CONSOLIDATED FINANCIAL STATEMENTS

Operating costs
2017 2016
Costs of goods sold 465 470
Bunker costs 3,372 2,023
Terminal costs 5,662 5,211
Intermodal costs 3,122 2,870
Port costs 1,984 1,736
Rent and lease costs 2,294 2,317
Staff costs 4,129 3,938
Other 6,392 6,235
Total operating costs 27,420 24,800
Remuneration of employees
Wages and salaries 3,527 3,346
Severance payments 35 78
Pension costs, defined benefit plans 23 12
Pension costs, defined contribution plans 235 262
Other social security costs 324 296
Total remuneration 4,144 3,994
Of which:
Recognised in the cost of assets 1 4
Included in restructuring costs and other 14 52
Expensed as staff costs 4,129 3,938
Average number of employees1 75,813 76,265
1 The average number of employees including discontinued operations is 85,667 (87,736).
Rent and lease costs include contingent rent totalling USD 191m (USD 187m), which entirely relates to
operating leases.
Customary agreements have been entered into with employees regarding compensation in connection
with resignation with consideration for local legislation and collective agreements.
For information about share-based payment, reference is made to note 11.
Fees and remuneration to the Executive Board 2017 2016
Fixed annual fee 8 13
Cash incentive 2 2
Shared-based incentive plans 1 -2
Remuneration in connection with redundancy, resignation and release from duty to work - 22
Lump sum retirement payment - -1
Total remuneration to the Executive Board 11 34
Contract of employment for the Executive Board contains terms customary in Danish listed companies,
including termination notice and competition clauses. In connection with a possible takeover offer, neither
the Executive Board nor the Board of Directors will receive special remuneration. Fees and remuneration do
not include pension.
The Board of Directors has received fees of USD 3m (USD 3m).
Fees to the statutory auditors PricewaterhouseCoopers Statsautoriseret
Revisionspartnerselskab
PwC including network firms
2017 2016 2017 2016
Statutory audit 6 5 12 11
Other assurance services 1 - 1 -
Tax and VAT advisory services - 1 2 3
Other services 2 1 4 1
Total fees 9 7 19 15
Fees for other services than statutory audit of the financial statements provided by Pricewaterhouse-
Coopers Statsautoriseret Revisionspartnerselskab to A.P. Moller - Maersk mainly consist of audit of
non-statutory financial statements, financial due diligence and transaction advice, accounting advisory ser-
vices, tax advice and other services related to separating discontinued operations, review of the half year
interim report and other advisory accounting and tax services.
Note 2
A.P. Moller - Maersk | Annual Report 201772
Amounts in USD million
CONSOLIDATED FINANCIAL STATEMENTS — NOTES OVERVIEWFINANCIALS CONSOLIDATED FINANCIAL STATEMENTS

Gain on sale of non-current assets, etc., net
Financial income and expenses
Note 3 Note 4
2017 2016
Gains 1 203 228
Losses 49 38
Gain on sale of non-current assets, etc., net 154 190
1 Gains primarily relate to the sale of Mercosul Line of USD 59m (pre-tax) and the sale of Pentalver Trans-
port Ltd. of USD 31m.
In 2016, gains were primarily related to dividends received from available-for-sale investments of USD
88m and the sale of shares in Danmarks Skibskredit (Danish Ship Finance) of USD 54m.
2017 2016
Interest expenses on liabilities 630 525
Of which borrowing costs capitalised on assets1 63 49
Interest income on loans and receivables 104 55
Interest income on securities - 3
Fair value adjustment transferred from equity hedge reserve (loss) 55 69
Unwind of discount on provisions -5 -9
Net interest expenses 513 478
Exchange rate gains on bank balances, borrowings and working capital 645 526
Exchange rate losses on bank balances, borrowings and working capital 1,085 551
Net foreign exchange gains/losses -440 -25
Fair value gains from derivatives 598 64
Fair value losses from derivatives 268 170
Fair value gains from securities 1 46
Fair value losses from securities - 1
Net fair value gains/losses 331 -61
Dividends received from securities 1 21
Impairment losses on financial non-current receivables -5 -
Financial expenses, net 616 543
Of which:
Financial income 1,382 742
Financial expenses 1,998 1,285
1 The capitalisation rate used to determine the amount of borrowing costs eligible for capitalisation is
4.1% (4.1%).
For an analysis of gains and losses from derivatives, reference is made to note 15.
A.P. Moller - Maersk | Annual Report 201773
Amounts in USD million
CONSOLIDATED FINANCIAL STATEMENTS — NOTES OVERVIEWFINANCIALS CONSOLIDATED FINANCIAL STATEMENTS

TaxNote 5
2017 2016
Tax recognised in the income statement
Current tax on profits for the year 277 151
Adjustment for current tax of prior periods -78 -148
Utilisation of previously unrecognised deferred tax assets -5 -4
Total current tax 194 -1
Origination and reversal of temporary differences -32 66
Adjustment for deferred tax of prior periods 5 31
Adjustment attributable to changes in tax rates and laws -25 17
Recognition of previous unrecognised deferred tax assets -12 -6
Reassessment of recoverability of deferred tax assets, net 16 10
Total deferred tax -48 118
Total income tax 146 117
Tonnage and freight tax 73 54
Total tax expense 219 171
2017 2016
Tax reconciliation
Profit/loss before tax 25 -298
Profit/loss subject to Danish and foreign tonnage taxation, etc.1 -292 615
Internal gain/loss on sale of assets - -2
Share of profit/loss in joint ventures 131 -130
Share of profit/loss in associated companies -101 55
Profit/loss before tax, adjusted -237 240
Tax using the Danish corporation tax rate (22%) -52 52
Tax rate deviations in foreign jurisdictions -28 22
Non-taxable income -96 -77
Non-deductible expenses 136 78
Adjustment to previous years’ taxes -73 -117
Effect of changed tax rate -25 17
Change in recoverability of deferred tax assets -1 -
Deferred tax asset not recognised 168 50
Other differences, net 117 92
Total income tax 146 117
Tax recognised in other comprehensive income and equity 42 -16
Of which:
Current tax 12 4
Deferred tax 30 -20
1 Including impairment losses on vessels under tonnage taxation.
A.P. Moller - Maersk | Annual Report 201774
Amounts in USD million
CONSOLIDATED FINANCIAL STATEMENTS — NOTES OVERVIEWFINANCIALS CONSOLIDATED FINANCIAL STATEMENTS

Intangible assetsNote 6
Goodwill Terminal and service concession rights
Oil concession rights
Customer relations and brand name
Other rights Total
Cost
1 January 2016 495 1,524 7,518 - 578 10,115
Addition - 259 439 - 124 822
Acquired in business combinations 248 845 - - 36 1,129
Disposal - - 515 - 5 520
Transfer, assets held for sale -1 - - - - -1
Exchange rate adjustment -12 -57 - - -6 -75
31 December 2016 730 2,571 7,442 - 727 11,470
Addition - 245 75 - 37 357
Acquired in business combinations1 388 - - 1,143 - 1,531
Disposal - - 178 - 10 188
Transfer, assets held for sale - - -7,339 - -241 -7,580
Exchange rate adjustment 32 94 - -1 16 141
31 December 2017 1,150 2,910 - 1,142 529 5,731
Amortisation and impairment losses
1 January 2016 408 217 7,133 - 435 8,193
Amortisation - 65 72 - 51 188
Impairment losses - - - - 11 11
Disposal - - 515 - 5 520
Exchange rate adjustment -12 -8 - - -2 -22
31 December 2016 396 274 6,690 - 490 7,850
Amortisation - 79 42 6 58 185
Impairment losses - 128 - - 26 154
Disposal - 3 164 - 10 177
Transfer, assets held for sale - - -6,568 - -131 -6,699
Exchange rate adjustment 31 13 - - 9 53
31 December 2017 427 491 - 6 442 1,366
Carrying amount:
31 December 2016 334 2,2972 752 - 237 3 3,620
31 December 2017 723 2,4192 - 1,1361 87 3 4,365
1 Acquisition of Hamburg Süd, please refer to note 21 ‘Acquisition/sale of subsidiaries and activities’.
2 Of which USD 647m (USD 89m) is under development. USD 34m (USD 34m) is related to terminal rights with indefinite useful life in Poti Sea Port Corp. The impairment test is based on the estimated fair value according
to business plans. An average discount rate of 14.8% (12.9%) p.a. after tax has been applied in the calculations. Furthermore, the developments in volumes and rates are significant parameters. Service concession rights
with a carrying amount of USD 94m (USD 95m) have restricted title.
3 Of which USD 20m (USD 43m) is related to ongoing development of software.
A.P. Moller - Maersk | Annual Report 201775
Amounts in USD million
CONSOLIDATED FINANCIAL STATEMENTS — NOTES OVERVIEWFINANCIALS CONSOLIDATED FINANCIAL STATEMENTS

Intangible assetsNote 6 — continued
Impairment analysis
The recoverable amount of each CGU is determined on the basis of the higher of its value-in-use or fair
value less cost to sell. The value-in-use is calculated using certain key assumptions for the expected fu-
ture cash flows and applied discount factor.
The cash flow projections are based on financial budgets and business plans approved by management.
In nature, these projections are subject to judgement and estimates that are uncertain, though based
on experience and external sources where available. The discount rates applied reflect the time value of
money as well as the specific risks related to the underlying cash flows, i.e. project and/or country spe-
cific risk premium. Further, any uncertainties reflecting past performance and possible variations in the
amount or timing of the projected cash flows are generally reflected in the discount rates.
During 2017, certain terminals were faced with challenging market outlooks with decreasing volumes and
rates which resulted in impairment losses as recoverable amounts were lower than the carrying amount.
The key assumptions for APM Terminals' value calculations are container moves, revenue and cost per
move and discount rate. The cash flow projections cover the concession period and extension options
where deemed likely that they will be exercised. The growth rates assumed reflect current market expec-
tations for the relevant period.
For the intangible assets in APM Terminals the impairment losses can be specified as follows:
Applied discount rate p.a. after tax
Impairment losses
Operating segment 2017 2016 2017 2016
Terminal and service concession rights
APM Terminals 6.5% - 12.5% - 128 -
Other rights
APM Terminals 6.5% - 8% - 26 -
Other - - - 11
Total 154 11
After impairment losses the recoverable amount of the impaired intangible assets is nil.
Property, plant and equipmentNote 7
Ships, con-
tainers, etc.
Produc-tion and terminal facilites
and equip-ment, etc.
Rigs Construc-tion work
in pro-gress and payment
on account
Total
Cost
1 January 2016 43,749 30,656 9,785 4,856 89,046Addition 1,467 -57 1 115 2,844 4,369Acquired in business combinations 1 422 - 5 428Disposal 1,816 106 11 125 2,058Transfer 719 1,184 93 -1,996 - Transfer, assets held for sale -40 -66 - - -106Exchange rate adjustment -41 -284 - 4 -32131 December 2016 44,039 31,749 9,982 5,588 91,358Addition 1,504 60 1 3,799 5,364Acquired in business combinations 3,801 30 - 37 3,868Disposal 2,529 9,466 1 28 12,024
Transfer 2,094 1,421 648 -4,163 -Transfer, assets held for sale -5,715 -17,481 -10,630 -3,782 -37,608Exchange rate adjustment 127 310 - 31 46831 December 2017 43,321 6,623 - 1,482 51,426
Depreciation and impairment losses1 January 2016 18,613 23,129 2,281 1,024 45,047Depreciation 2,274 1,472 570 - 4,316Impairment losses 736 13 1,431 261 2,441Disposal 1,595 92 4 28 1,719Transfer, assets held for sale -27 -43 - - -70Exchange rate adjustment -26 -128 - 1 -15331 December 2016 19,975 24,351 4,278 1,258 49,862Depreciation 2,286 1,123 347 - 3,756Impairment losses 616 185 1,700 197 2,698Reversal of impairment losses - 241 - - 241Disposal 2,104 9,432 1 7 11,544Transfer 79 164 79 -322 -Transfer, assets held for sale -3,605 -13,245 -6,403 -1,121 -24,374Exchange rate adjustment 60 136 - 2 19831 December 2017 17,307 3,041 - 7 20,355
Carrying amount:31 December 2016 24,064 7,398 5,704 4,330 41,49631 December 2017 26,014 3,582 - 1,475 31,071
Of which carrying amount of finance leased assets:31 December 2016 2,377 73 - 8 2,458
31 December 2017 2,947 102 - 4 3,053
1 The negative addition is due to adjustments of abandonment provision predominantly in the UK.
A.P. Moller - Maersk | Annual Report 201776
Amounts in USD million
CONSOLIDATED FINANCIAL STATEMENTS — NOTES OVERVIEWFINANCIALS CONSOLIDATED FINANCIAL STATEMENTS

Property, plant and equipmentNote 7 — continued
Acquired in business combinations
The additions of USD 3.9bn are related to the acquisition of Hamburg Süd (see note 21).
Transfers
Transfers to assets held for sale primarily relate to Maersk Oil, Maersk Drilling, Maersk Tankers and Maersk Supply Service (see note 9).
In 2016, transfers were primarily related to APM Terminals’ divestment of Pentalver in the UK and four vessels in Maersk Tankers.
Finance leases
As part of the Group’s activities, customary leasing agreements are entered into, especially with regard to the chartering of vessels and lease of containers and other equipment. In some cases, the leasing agreements
comprise purchase options for the Group and options for extension of the lease term. In the financial statements, assets held under finance leases are recognised in the same way as owned assets.
Pledges
Ships, buildings, etc. with a carrying amount of USD 3.1bn (USD 4.0bn) have been pledged as security for loans of USD 2.0bn (USD 2.3bn).
Impairment analysis
For general information on basis for calculating recoverable amount reference is made to note 24 and note 6.
In the cash generating units set out below the impairment test gave rise to impairment losses and reversals.
Impairment losses Reversal of impairment losses
Applied discount rate p.a. after tax
Recoverable amount
Operating segment Cash generating unit 2017 2016 2017 2016 2017 2016 2017 2016
APM Terminals Terminals1 188 - - - 6.5%-18.3% - 457 -
Maersk Tankers2 All vessels 464 - - - - -
Maersk Oil3 Denmark - - 235 - - - 950 -
Maersk Drilling3 Deepwater rigs 1,024 1,069 - - 10.5% 8.5% 1,546 2,788
Jack-up rigs 676 441 - - 10.5% 8.5% 2,631 3,460
Maersk Supply3 Anchor Handling Tug Supply Vessels4 156 834 - 8.5% - 172
SSV 166 8 10.1% 8.5% 396 377
Others 14 57 10.1% 8.5% 14 22
Other 10 32 6 - - - - -
Total 2,698 2,441 241 - -
1 The impairment loss relates to certain terminals in commercially challenged markets. An additional USD 21m is recognised as impairment in the income statement and booked as provision (relates to assets that will be
delivered in 2018.)
2 Management's assessment led to an impairment of USD 464m related to vessels in Maersk Tankers in Q2 due to an expected continuation of the lower asset valuations (fair value). As Maersk tankers are divested year-end
2017 disclosure of discount rate and recoverable amounts is not considered relevant.
3 For Maersk Oil, Maersk Drilling, and Maersk Supply Service, impairment losses were recognised immediately before the initial classification of the businesses as assets held for sale. The reversal of prior impairments in
Maersk Oil reflects an assumed higher fair value of the assets in Denmark. For Maersk Drilling and Maersk Supply Service the impairment analysis is based on a discounted cash flow calculation for the remaining lifetime
of the assets. The key assumptions for these calculations are expected day rates, utilisation and discount rate (further details are set out in note 24).
4 Impairment loss of USD 156m relates to the impairment losses recognised on newbuildings in 2016 (onerous contracts) and reflected here as transfer upon delivery in 2017.
A.P. Moller - Maersk | Annual Report 201777
Amounts in USD million
CONSOLIDATED FINANCIAL STATEMENTS — NOTES OVERVIEWFINANCIALS CONSOLIDATED FINANCIAL STATEMENTS

Deferred taxNote 8
Recognised deferred tax assets and liabilities are attributable to the following:
Assets Liabilities Net liabilities
2017 2016 2017 2016 2017 2016
Property, plant and equipment 67 146 221 1,694 154 1,548
Provisions, etc. 133 770 81 59 -52 -711
Tax loss carry forwards 190 1,036 - - -190 -1,036
Other 56 109 303 323 247 214
Total 446 2,061 605 2,076 159 15
Offsets -144 -1,471 -144 -1,471 - -
Total 302 590 461 605 159 15
Change in deferred tax, net during the year 2017 2016
1 January 15 -611
Property, plant and equipment 137 -143
Provisions, etc. -33 564
Tax loss carry forwards -23 64
Other 12 20
Recognised in the income statement 93 1 505
Transfer to held for sale 53 3
Other including business combinations -2 118
31 December 159 15
1 Of which USD 141m (USD 387m) is recognised as an expense in discontinued operations.
Unrecognised deferred tax assets – continuing operations 2017 2016
Deductible temporary differences 149 13
Tax loss carry forwards 496 496
Total2 645 509
2 In addition, deductible temporary differences of USD 852m (USD 944m) and tax loss carry forward of
USD 442m (USD 551m) relate to discontinued operations.
The unrecognised deferred tax assets have no significant time limitations. There are no substantial
unrecognised tax liabilities on investments in subsidiaries, associated companies and joint ventures.
Maersk Oil, Maersk Tankers, up to closing in October, Maersk Drilling and Maersk Supply Service are classi-
fied as discontinued operations and assets held for sale in 2017.
A.P. Moller - Maersk executed on the strategy to separate its energy businesses in 2017 with an agree-
ment for Total S.A. to acquire Maersk Oil for USD 7,450m in a combined share and debt transaction, and
A.P. Moller Holding to acquire Maersk Tankers for USD 1,171m in an all-cash transaction. The Maersk Tank-
ers transaction closed in October, while the Maersk Oil transaction is expected to close in Q1 2018. Further,
structural solutions for Maersk Drilling and Maersk Supply Service are expected before the end of 2018.
In the consolidated financial statements, the results for Maersk Oil, Maersk Tankers, up to closing in
October, Maersk Drilling and Maersk Supply Service are classified under discontinued operations with a net
loss of USD 1.0bn (loss of USD 1.4bn), negatively impacted by net impairment losses totalling USD 2.2bn
(USD 2.7bn), primarily related to Maersk Drilling and Maersk Tankers. Impairment losses and reversals are
specified in notes 6 and 7. The cash flow from operating activities was USD 2.0bn (USD 3.1bn), while the
cash flow used for capital expenditure amounted to USD 0.6bn (USD 2.3bn), leaving a free cash flow of USD
0.2bn (USD 0.8bn), excluding cash proceeds from the Maersk Tankers transaction of USD 1.2bn.
The results of the discontinued businesses are presented in one separate line in the income statement,
cash flow statement and balance sheet. Both the income statement and cash flow statement have been
restated in previous years, while the balance sheet has not been restated.
Intangible assets held for sale amounts to USD 779m for Maersk Oil, USD 92m for Maersk Drilling and USD
4m for Maersk Supply Service. Property plant and equipment held for sale mainly comprises Maersk Oil
with USD 6.6bn, Maersk Drilling with USD 4.3bn and Maersk Supply Service with USD 941m.
Assets held for sale in 2016 were predominantly related to Pentalver in APM Terminals.
Discontinued operations and assets held for sale
Note 9
A.P. Moller - Maersk | Annual Report 201778
Amounts in USD million
CONSOLIDATED FINANCIAL STATEMENTS — NOTES OVERVIEWFINANCIALS CONSOLIDATED FINANCIAL STATEMENTS

Discontinued operations and assets held for saleNote 9 — continued
2017 2016
Profit/loss for the period – discontinued operations
Revenue 6,555 8,198
Expenses -3,097 -3,961
Gains/losses on sale of assets and businesses 16 -12
Depreciation and amortisation -1,295 -2,039
Impairment losses -2,413 -2,731
Reversal of impairment losses 236 -
Profit/loss before tax, etc. 2 -545
Tax 1 972 883
Profit/loss for the year – discontinued operations -970 -1,428
A.P. Møller - Mærsk A/S’ share of profit/loss -967 -1,428
Earnings per share -47 -68
Diluted earnings per share -47 -68
Cash flows from discontinued operations
Cash flow from operating activities 2,004 3,063
Cash flow used for investing activities -580 -2,281
Cash flow from financing activities -173 -279
Net cash flow from discontinued operations 1,251 503
1 The tax relates to the profit from the ordinary activities of discontinued operations. There is no tax re-
lated to the gain on sale of Maersk Tankers.
2017 2016
Balance sheet items comprise:
Intangible assets 875 1
Property, plant and equipment 11,911 42
Deferred tax assets 244 3
Other assets 491 8
Non-current assets 13,521 54
Current assets 1,468 49
Assets held for sale 14,989 103
Provisions 3,059 1
Deferred tax liabilities 226 -
Other liabilities 1,437 15
Liabilities associated with assets held for sale 4,722 16
Maersk Oil
On 21 August, A.P. Moller - Maersk announced the sale of Maersk Oil to Total S.A. for USD 7,450m in a com-
bined share and debt transaction. The sale is pending regulatory approval, and closure is expected during
Q1 2018. The sale is based on a locked box transaction effective 1 July 2017, whereby all cash flows from
Maersk Oil from 30 June 2017 until closing belong to the buyer. As compensation for the lost cash flow,
A.P. Moller - Maersk will receive locked box interest of 3% p.a. of the enterprise value.
Full year 2017
Maersk Oil reported a profit of USD 1.2bn (USD 449m). The profit was positively impacted by lower costs
due to cost reduction efforts, lower exploration costs, an average oil price of USD 54 per barrel (USD 44 per
barrel), 24% higher than for 2016, and one-offs mainly from reversal of impairments, tax and provisions.
Full year guidance to the market was an entitlement production between 215,000 boepd and 225,000
boepd. Maersk Oil delivered within the range at 220,000 boepd. The entitlement production of 220,000
boepd was lower than full year 2016 (313,000 boepd) primarily because of the exit from Qatar.
At 31 December 2017 Maersk Oil has capital commitments totalling to USD 2.0bn.
Maersk DrillingMaersk Drilling has been classified as discontinued operations and assets held for sale, as a structural
solution is expected before the end of 2018.
Full year 2017
Maersk Drilling reported a loss of USD 1.5bn (loss of USD 709m), negatively impacted by an accounting
impairment of USD 1,750m net of tax prior to classification as discontinued operations. The result was
further negatively impacted by a number of idle rigs and the expiration of contracts signed at higher day
rates and an accounting loss from sale of the shares in Egyptian Drilling Company of USD 47m. The result
was positively impacted by high operational uptime and cost savings.
Maersk Supply Service
Maersk Supply Service has been classified as discontinued operations and assets held for sale, as a struc-
tural solution is expected before the end of 2018.
Full year 2017
For Maersk Supply Service, the market situation remains challenged with a reported loss of USD 251m
(loss of USD 1.2bn), negatively impacted by impairments prior to classification as held for sale of USD 180m
(USD 1.2bn) because of over-supply and reduced long-term demand expectations due to lower offshore
spending. At 31 December 2017 Maersk Supply Service has capital commitments related to newbuilding
programme for 6 vessel totalling to USD 0.5bn.
A.P. Moller - Maersk | Annual Report 201779
Amounts in USD million
CONSOLIDATED FINANCIAL STATEMENTS — NOTES OVERVIEWFINANCIALS CONSOLIDATED FINANCIAL STATEMENTS

Discontinued operations and assets held for sale
Note 9 — continued
Cash flow from sale of Maersk Tankers 2017
Carrying amount
Intangible assets 6
Property, plant and equipment 1,159
Financial assets - non-current 10
Current assets 420
Provisions -10
Liabilities -1,011
Net assets sold 574
Non-controlling interests 0
A.P. Møller - Mærsk A/S’ share 574
Gain/loss on sale 3
Repayment of loan 760
Contingent considerations asset -28
Cash and bank balances sold -91
Cash flow from sale of subsidiaries and activities 1,218
Maersk Tankers
On 20 September 2017, A.P. Moller - Maersk entered into an agreement to divest Maersk Tankers to
A.P. Moller Holding for USD 1,171m in an all-cash transaction. The divestment was based on a locked
box transaction whereby all cash flows from Maersk Tankers from 30 June 2017 until closing belong to
A.P. Moller Holding. As cash flows were expected to be negative, the locked box interest was set at 0% p.a.
The purchase price will be adjusted in two scenarios. The first one is if the tanker markets improve based
on a fleet value accretion (Purchase Price Adjustment). The adjustment is capped at USD 200m, can be
exercised once and expires 31 December 2019. The second scenario is if A.P. Moller Holding sells on vessels
at a higher price than the purchase price and higher than an agreed hurdle rate (On-sale adjustment). The
on-sale adjustment expires 30 June 2019, or if the Purchase Price Adjustment is called, whichever is the
earliest.
The transaction was between related parties, so fairness opinions were obtained from Morgan Stanley
& Co. Int. Plc and DNB Bank ASA, which confirmed that the transaction value, including the agreed price
adjustment mechanism, was fair from a financial point of view.
The transaction closed on 10 October 2017.
Period ending 10 October 2017
Maersk Tankers reported a loss of USD 477m (profit of USD 66m), which was impacted by impairment of
vessels by USD 464m. The sale resulted in a minor accounting gain.
Share capital and earnings per share
Note 10
At the Annual General Meeting of A.P. Møller - Mærsk A/S on 12 April 2016, the shareholders decided on
the cancellation of 728,520 treasury shares, whereby the share capital has decreased. The cancellation of
the treasury shares took place in Q2 2016.
Development in the number of shares:
A shares of B shares of Nominal value
DKK 1,000
DKK 500
DKK 1,000
DKK 500
DKK million
USD million
1 January 2016 10,902,341 318 10,642,790 184 21,545 3,906
Cancellation 146,122 - 582,398 - 728 132
Conversion 2 -4 - - - -
31 December 2016 10,756,221 314 10,060,392 184 20,817 3,774
Conversion 41 -82 6 -12 - -
31 December 2017 10,756,262 232 10,060,398 172 20,817 3,774
All shares are fully issued and paid up.
One A share of DKK 1,000 holds two votes. B shares have no voting rights.
Adoption of resolutions regarding changes to the Company’s Articles of Association or increase or write-
down of the share capital requires that at least two-thirds of the A share capital at the General Meeting
shall be represented by persons entitled to vote and that at least two-thirds of the votes cast shall be cast
in favour of the adoption of the resolution.
Apart from a resolution for the dissolution of the Company, other resolutions at the General Meetings are
passed by simple majority, as long as legislation does not require particular voting majority. Reference is
made to the Company’s Articles of Association.
In the event of an increase of the Company’s share capital, the shareholders in the given share class shall
have a pre-emptive right to subscribe for a proportionate share of the capital increase.
The General Meeting authorised the Board to allow the Company to acquire own shares on an ongoing
basis to the extent that the nominal value of the Company’s total holding of own shares at no time ex-
ceeds 10% of the Company’s share capital. The purchase price must not deviate by more than 10% from
the price quoted on Nasdaq Copenhagen on the date of the purchase. This authorisation is to be in force
until 29 March 2020.
A.P. Moller - Maersk | Annual Report 201780
Amounts in USD million
CONSOLIDATED FINANCIAL STATEMENTS — NOTES OVERVIEWFINANCIALS CONSOLIDATED FINANCIAL STATEMENTS

Share capital and earnings per shareNote 10 — continued
Development in the holding of own shares:
No. of shares of DKK 1,000
Nominal value DKK million
% of share capital
2017 2016 2017 2016 2017 2016
A shares
1 January - 69,585 - 70 - 0.32%
Addition - 76,537 - 77 - 0.36%
Cancellation - 146,122 - 147 - 0.68%
31 December - - - - - 0.00%
B shares
1 January 77,642 361,409 78 361 0.37% 1.68%
Addition - 306,278 - 306 - 1.42%
Cancellation - 582,398 - 582 - 2.70%
Disposal 16,803 7,647 17 7 0.08% 0.03%
31 December 60,839 77,642 61 78 0.29% 0.37%
Disposals of own shares are primarily related to the share option programme.
The Board of Directors proposes a dividend to the shareholders of DKK 150 per share of DKK 1,000 – a total
of DKK 3,123m, equivalent to USD 503m at the exchange rate as per 31 December 2017 (DKK 150 per share of
DKK 1,000 – a total of DKK 3,123m equivalent to USD 443m).
Payment of dividends is expected to take place on 13 April 2018. Payment of dividends to shareholders
does not trigger taxes to A.P. Moller - Maersk.
Basis for calculating earnings per share is the following:
A.P. Møller - Mærsk A/S’ share of: 2017 2016
Profit/loss for the year of continuing operations -238 -511
Profit/loss for the year of discontinued operations -967 -1,428
Profit/loss for the year -1,205 -1,939
2017 2016
Issued shares 1 January 20,816,862 21,545,382
Average number of own shares 64,472 383,665
Average number of cancelled shares - 386,155
Average number of shares 20,752,390 20,775,562
At 31 December 2017, there is no dilution effect on earnings per share from the 25,530 issued share
options. The issued share options correspond to 0.12% of the total average number of shares in the
Group. At 31 December 2016, there was no dilution effect on earnings per share from the 11,475 issued
share options. The issued share options corresponded to 0.06% of the total average number of shares
in the Group.
A.P. Moller - Maersk | Annual Report 201781
Amounts in USD million
CONSOLIDATED FINANCIAL STATEMENTS — NOTES OVERVIEWFINANCIALS CONSOLIDATED FINANCIAL STATEMENTS

Share-based paymentNote 11
Equity-settled incentive plans (excluding share options plan)
A.P. Moller - Maersk has two different equity-settled incentive plans. The Restricted Shares Plan was introduced in 2013 and grants have been awarded to employees on a yearly basis since 2013. In 2014, the Group
established a 3-year Performance Shares Plan for members of the Executive Board and other employees.
The transfer of restricted and performance shares is contingent upon the employee still being employed and not being under notice of termination and takes place when three years have passed from the time of
granting. Transfer of the performance shares to members of the Executive Board was further contingent upon the member still being employed in A.P. Moller - Maersk at the time of publishing of the Annual Report 2016
for A.P. Møller - Mærsk A/S.
The actual transfer of performance shares was further contingent upon the degree of certain financial goals being achieved. This meant that the number of shares that eventually would vest was adjusted during
the vesting period.
The members of the Executive Board as well as other employees are not entitled to any dividends during the vesting period. Special conditions apply regarding illness, death and resignation as well as changes in
the Company’s capital structure, etc. A.P. Møller - Mærsk A/S’ holding of own B shares will be used to meet the Company’s obligations in connection with the Restricted Shares Plan.
Restricted Shares Plan Performance Shares Plan Performance Shares Plan Total fair value 1
Outstanding awards under equity-settled incentive plans (excl. share option plans)
Employees 1 Members of the Executive Board 1
Employees 1
No. No. No. USD million
1 January 2016 14,104 1,860 12,099
Granted 7,078 20 395 10
Exercised 5,730 - -
Adjustment 2 - -620 -11,339
Forfeited 385 1,260 312
Outstanding 31 December 2016 15,067 - 843
Granted 5,024 - 66 8
Exercised 4,591 - 842
Adjustment 2 - - -67
Forfeited 968 - -
Outstanding 31 December 2017 14,532 - -
1 At the time of grant.
2 Primarily due to changes in the degree of certain financial goals being achieved.
A.P. Moller - Maersk | Annual Report 201782
Amounts in USD million
CONSOLIDATED FINANCIAL STATEMENTS — NOTES OVERVIEWFINANCIALS CONSOLIDATED FINANCIAL STATEMENTS

Share-based paymentNote 11 — continued
Outstanding awards under cash- settled performance share plan
Employees 1 Total fair value 1 Carrying amount of liabilities
No. USD million USD million
1 January 2016 8,816
Granted 435 1
Adjustment 2 -8,686
Forfeited 565
Outstanding 31 December 2016 - -
Granted 780
Adjustment2 -780
Outstanding 31 December 2017 - -
1 At the time of grant.
2 Due to changes in the degree of certain financial goals being achieved.
The fair value of awards granted to 42 (27) employees was USD 0m (USD 1m) at the time of grant. The
total value of the awards recognised in the income statement is USD 0m (an income of USD 3m).
The average remaining contractual life for the cash-settled incentive plan as per 31 December 2017 is 0.3
years (1.1 years).
Share option plans
In addition to the plans described above, A.P.Moller - Maersk has Share Option Plans for members of the
Executive Board and other employees. Each share option granted is a call option to buy an existing B share
of nominal DKK 1,000 in A.P. Møller - Mærsk A/S.
The share options are granted at an exercise price corresponding to 110% of the average of the market
price on the first five trading days following the release of A.P. Møller - Mærsk A/S’ Annual Report. Exercise
of the share options is contingent upon the option holder still being employed at the time of exercise. The
share options can be exercised when at least two years (three years for share options granted to Executive
Board members) and no more than seven years (six years for share options granted to employees not
members of the Executive Board) have passed from the time of grant. Special conditions apply regarding
illness, death and resignation as well as changes in the Company’s capital structure, etc.
The fair value of restricted shares (A.P. Møller - Mærsk A/S B shares) granted to 132 (140) employees was
USD 8 m (USD 9m) at the time of grant. The total value of granted restricted shares recognised in the in-
come statement is USD 8m (USD 8m).
The fair value of performance shares (A.P. Møller - Mærsk A/S B shares) granted to no (1) members of the
Executive Board and to two (16) employees was USD 0m (USD 1m). The total value of granted performance
shares recognised in the income statement is an income of USD 1m (income of USD 15m).
The fair value per restricted share at the time of grant is DKK 11,550 (DKK 8,463), which is equal to the
volume weighted average share price on the date of grant, i.e. 1 April, 2017.
On 1 April 2017, the restricted shares originally granted in 2014 were settled with the employees. The
weighted average share price at that date was DKK 11,550.
The average remaining contractual life for the restricted shares as per 31 December 2017 is 1.3 years
(1.4 years).
Cash-settled incentive plan
In 2015, A.P.Moller - Maersk introduced the Performance Shares Plan to a broader range of employees. The
actual settlement of the awards is contingent upon the degree of certain financial goals being achieved,
the employee still being employed and not being under notice of termination at the date of settlement.
This means that the number of awards that eventually will vest may be adjusted during the vesting period.
Depending on the agreement, the settlement will take place two or three years after the initial granting
and the employee may have the option to settle the awards in shares.
The employees are not entitled to any dividends during the vesting period. Special conditions apply regard-
ing illness, death and resignation as well as changes in the Company’s capital structure, etc.
A.P. Moller - Maersk | Annual Report 201783
Amounts in USD million
CONSOLIDATED FINANCIAL STATEMENTS — NOTES OVERVIEWFINANCIALS CONSOLIDATED FINANCIAL STATEMENTS

Note 11 — continued
Share-based payment
Members of the
Executive Board 1
Employees1 Total Average exercise
price
Total fair value1
No. No. No. DKK USD million
1 January 2016 7,715 15,200 22,915 8,975
Exercised - 1,880 1,880 8,298
Expired 3,875 5,685 9,560 9,919
Outstanding 31 December 2016 3,840 7,635 11,475 8,298
Exercisable 31 December 2016 3,840 7,635 11,475 8,298
Granted 4,928 20,839 25,767 12,791 8
Exercised 3,840 7,530 11,370 8,298
Expired - 105 105 8,298
Forfeited - 237 237 12,791
Outstanding 31 December 2017 4,928 20,602 25,530 12,791
Exercisable 31 December 2017 - - -
1 At the time of grant.
The share options can only be settled in shares. A.P. Møller - Mærsk A/S’ holding of own B shares will be
used to meet the Company’s obligations in connection with the share option plans.
The fair value of awards granted to three members of the Executive Board and 79 employees was USD 8m
(USD 0m) at the time of grant. The total value of granted share options recognised in the income state-
ment is USD 3m (USD 0m).
The weighted average share price at the dates of exercise of share options was DKK 11,778 (DKK 10,154).
The average remaining contractual life as per 31 December 2017 is 6.1 years (0.3 years) and the exercise
price for outstanding share options is DKK 12,791 (DKK 8,298).
The fair value per option granted in 2017 to members of the Executive Board is calculated at DKK 2,130
at the time of grant, based on Black & Scholes’ option pricing model. The fair value per option granted in
2017 to employees not members of the Executive Board is calculated at DKK 2,281 at the time of grant
based on the same option pricing model.
The following principal assumptions are used in the valuation:
Share options granted to members of
the Executive Board
Share options granted to employees
not members of the Executive Board
Share price, five days volume weighted average after publication of Annual Report, DKK 11,628 11,628
Exercise price, DKK 12,791 12,791
Expected volatility (based on historic volatility) 31% 31%
Expected term 5 5.75
Expected dividend per share, DKK 300 300
Risk free interest rate -0.12% 0.01%
A.P. Moller - Maersk | Annual Report 201784
Amounts in USD million
CONSOLIDATED FINANCIAL STATEMENTS — NOTES OVERVIEWFINANCIALS CONSOLIDATED FINANCIAL STATEMENTS

Borrowings and net debt reconciliationNote 12
Net debt as at 31 December
Cash flows1 Non-cash changes Net debt as at 31 December
2016 AcquisitionsForeign exchange
movements Other2 2017
Bank and other credit institutions 4,967 1,982 146 80 -211 6,964
Finance lease liabilities 2,271 -309 606 5 172 2,745
Issued bonds 8,097 -872 - 603 -24 7,804
Total borrowings 15,335 801 752 688 -63 17,513
Derivatives hedge of borrowings, net 806 -224 - -619 -51 -88
Borrowings:
Classified as non-current 13,320 15,076
Classified as current 2,015 2,437
1 Difference from the net proceeds from borrowings as presented in the cash flow statement mainly relates to discontinued operations’ repayments of borrowings.2 Other includes transfers to held for sale, new finance leases and fair value changes.
Minimum lease payments
Interest Carrying amount Minimum lease payments
Interest Carrying amount
Finance lease liabilities 2017 2017 2017 2016 2016 2016
Within one year 583 131 452 326 126 200
Between one and five years 1,816 292 1,524 1,252 396 856
After five years 1,080 311 769 1,522 307 1,215
Total 3,479 734 2,745 3,100 829 2,271
The finance lease agreements are described in note 7.
As at 31 December 2017, USD 0.8bn of the Group’s borrowings, which include change of control clauses and negative pledges relating to assets such as supply vessels and drilling rigs which are classified as held for sale,
have been reclassified to current despite the loans falling due after one year. The terms of the loans require immediate repayment on sale or change of control.
A.P. Moller - Maersk | Annual Report 201785
Amounts in USD million
CONSOLIDATED FINANCIAL STATEMENTS — NOTES OVERVIEWFINANCIALS CONSOLIDATED FINANCIAL STATEMENTS

Pensions and similar obligationsNote 13
As employer, the Group participates in pension plans according to normal practice in the countries in
which the Group operates. Generally, the pension plans within the Group are defined contribution plans,
where contributions are recognised in the income statement on an accrual basis. A number of entities
have defined benefit plans, in which retirement benefits are based on length of service and salary level.
To a limited extent, these defined benefit plans also include payment of medical expenses, etc.
Pension and medical plans which, as part of collective bargaining agreements, have been entered into
with other enterprises (known as multi-employer plans) are treated as other pension plans. Such defined
benefit plans are treated as defined contribution plans when sufficient information for calculating the
individual enterprises’ share of the obligation is not available.
In 2018, the Group expects to pay contributions totalling USD 36m to funded defined benefit plans (USD
41m in 2017).
United Kingdom
Other Total United Kingdom
Other Total
2017 2017 2017 2016 2016 2016
Specification of net liability
Present value of funded plans 2,242 532 2,774 2,014 431 2,445
Fair value of plan assets -2,534 -425 -2,959 -2,091 -360 -2,451
Net liability of funded plans -292 108 -185 -77 71 -6
Present value of unfunded plans - 116 116 - 67 67
Impact of minimum funding requirement/asset ceiling 58 - 58 81 - 81
Net liability 31 December -234 224 -11 4 138 142
Of which:
Pensions, net assets 298 96
Pensions and similar obligations 287 238
The majority of the Group’s defined benefit liabilities are in the UK (78%) and the USA (13%). All of the
plans in the UK and the majority of the plans in the USA are funded. Although all of the UK plans are now
closed to new entrants, active members in the two largest plans continue to accrue new benefits. The
smaller UK plans are all closed to new accruals, although a salary link remains in some of the plans.
Overall, the plans have an average duration of 16 years and approximately 53% of the obligation is in re-
spect of pensioner members.
As well as being subject to the risks of falling interest rates, which would increase the obligation, poor
asset returns and pensioners living longer than anticipated, the Group is also subject to the risk of higher
than expected inflation. This is because many pension benefits, particularly in the UK plans, increase in
line with inflation (although some minimum and maximum limits apply).
United Kingdom
Total United Kingdom
Total
Significant financial assumptions 2017 2017 2016 2016
Discount rate 2.5% 2.7% 2.7% 2.9%
Inflation rate 3.3% 3.1% 3.4% 3.2%
Future salary increase 3.5% 3.1% 3.6% 3.6%
Future pension increase 3.0% 2.5% 3.1% 3.0%
Rates of life expectancy reflect the most recent mortality investigations, and in line with market practice
an allowance is made for future improvements in life expectancy. The Group assumes that future im-
provements will be in line with the latest projections (1.25% in 2017 and in 2016) for all UK plans.
31 December
Life expectancy 2017 2037 2016 2036
65-year-old male in the UK 21.8 23.3 21.9 23.7
A.P. Moller - Maersk | Annual Report 201786
Amounts in USD million
CONSOLIDATED FINANCIAL STATEMENTS — NOTES OVERVIEWFINANCIALS CONSOLIDATED FINANCIAL STATEMENTS

Pensions and similar obligationsNote 13 — continued
The liabilities are calculated using assumptions that are the Group’s best estimate of future experience bearing in mind the requirements of IAS 19.
The sensitivity of the liabilities and pension cost to the key assumptions are as follows:
Sensitivities to key assumptions in the UK Increase Decrease Increase Decrease
Factors 'Change in liability’ 2017 2017 2016 2016
Discount rate Increase/(decrease) by 10 basis points -35 36 -35 36
Inflation rate Increase/(decrease) by 10 basis points 19 -21 22 -24
Life expectancy Increase/(decrease) by 1 year 96 -94 92 -90
The Group’s plans are funded in accordance with applicable local legislation. In the UK, each plan has a Trustee Board that is required to act in the best interests of plan members. Every three years, a formal valuation of the
plan’s liabilities is carried out using a prudent basis and if the plan is in deficit, the Trustees agree with the Group or the sponsoring employer on a plan for recovering that deficit.
The expected contributions to the UK plans for 2018 are USD 32m (USD 36m in 2017) of which USD 9m (USD 15m in 2016) is deficit recovery contributions. In most of the UK plans, any surplus remaining after the last member
dies may be returned to the Group. However, the Merchant Navy Ratings Pension Fund (MNRPF) and the Merchant Navy Officers Pension Fund (MNOPF) contributions paid by the Group are not refundable in any circumstance
and the balance sheet liability reflects an adjustment for any agreed deficit recovery contributions in excess of deficit determined using the Group’s assumptions. In 2017, an adjustment of USD 31m (USD 46m) was applied in
this respect.
Specification of plan assets
United Kingdom Other Total United Kingdom Other Total
2017 2017 2017 2016 2016 2016
Shares 322 177 499 357 176 533
Government bonds 985 78 1,063 695 69 764
Corporate bonds 573 71 644 439 61 500
Real estate 113 5 118 100 5 105
Other assets 541 94 635 500 49 549
Fair value 31 December 2,534 425 2,959 2,091 360 2,451
Except for an insignificant portion, the plan assets held by the Group are quoted investments.
A.P. Moller - Maersk | Annual Report 201787
Amounts in USD million
CONSOLIDATED FINANCIAL STATEMENTS — NOTES OVERVIEWFINANCIALS CONSOLIDATED FINANCIAL STATEMENTS

Pensions and similar obligationsNote 13 — continued
Change in net liability
Present value of obliga-
tions
Fair value of plan assets
Adjust-ments
Net liability
Of which:United
Kingdom
1 January 2016 2,633 2,578 76 131 -45
Current service cost, administration cost, etc. 20 -6 - 26 7
Calculated interest expense/income 90 89 - 1 -3
Recognised in the income statement in 2016 110 83 - 27 4
Actuarial gains/losses from changes in financial and demographic assumptions, etc. 328 - - 328 336
Return on plan assets, exclusive calculated interest income - -249 - -249 -242
Adjustment for unrecognised asset due to asset ceiling - - 38 38 38
Adjustment for minimum funding requirement - - -21 -21 -21
Recognised in other comprehensive income in 2016 328 -249 17 96 111
Contributions from the Group and employees 1 79 - -78 -69
Benefit payments -156 -120 - -36 -
Settlements -21 -23 - 2 -
Exchange rate adjustment -383 -395 -12 - 3
31 December 2016 2,512 2,451 81 142 4
Current service cost, administration cost etc. 19 -6 - 25 7
Calculated interest expense/income 74 72 - 2 -1
Recognised in the income statement in 2017 93 66 - 27 6
Actuarial gains/losses from changes in financial and demographic assumptions, etc. 24 24 5
Return on plan assets, exclusive calculated interest income -152 -152 -122
Adjustment for unrecognised asset due to asset ceiling -11 -11 -11
Adjustment for minimum funding requirement -20 -20 -20
Recognised in other comprehensive income in 2017 24 -152 -31 -159 -148
Present value of obliga-
tions
Fair value of plan assets
Adjust-ments
Net liability
Of which:United
Kingdom
Contributions from the Group and employees 1 93 -92 -88
Benefit payments -162 -142 -20 -
Settlements -2 - -2 -
Effect of business combinations and disposals 219 122 97 3
Exchange rate adjustment 205 217 8 -4 -11
31 December 2017 2,890 2,959 58 -11 -234
Multi-employer plans
Under collective agreements, certain entities in the Group participate together with other employers in
defined benefit pension plans as well as welfare/medical plans (multi-employer plans).
For the defined benefit pension plans, the Group has joint and several liabilities to fund total obligations.
In 2017, the Group’s contributions are estimated at USD 134m (USD 141m) while the contributions to be
paid in 2018 are estimated at USD 154m. In general, the contributions to the schemes are based on man
hours worked or cargo tonnage handled, or a combination hereof.
No reliable basis exists for allocation of the schemes’ obligations and plan assets to individual employer
participants. For the plans where the Group has an interest and there is a deficit, the net obligations for all
employers totalled USD 1.1bn (USD 1.9bn). This net obligation is based on the most recent available finan-
cial data from the plan’s trustees, calculated in accordance with the rules for such actuarial calculation in
US GAAP. The deficit in some of the schemes may necessitate increased contributions in the future.
The welfare/medical plans are by nature contribution plans funded on a pay-as-you-go basis. As for the
defined benefit pension plans, the contributions are based on man-hours worked or cargo tonnage han-
dled, or a combination hereof.
A.P. Moller - Maersk | Annual Report 201788
Amounts in USD million
CONSOLIDATED FINANCIAL STATEMENTS — NOTES OVERVIEWFINANCIALS CONSOLIDATED FINANCIAL STATEMENTS

ProvisionsNote 14
Abandonment Restructuring Legal disputes, etc. Onerous and unfavourable contracts
Other Total
1 January 2017 2,988 122 1,062 327 329 4,828
Provision made - 48 277 92 87 504
Amount used 152 81 150 136 46 565
Amount reversed 6 27 204 114 113 464
Addition from business combinations - - 234 317 10 561
Unwind of discount 61 - -6 - 1 56
Transfer - - - - 1 1
Transfer, assets held for sale -2,891 -11 -292 -153 -38 -3,385
Exchange rate adjustment - 4 2 1 7 14
31 December 2017 - 55 923 334 238 1,550
Of which:
Classified as non-current - 1 623 230 157 1,011
Classified as current - 54 300 104 81 539
Non-current provisions expected to be realised after more than five years - - 18 - 82 100
Restructuring includes provisions for decided and publicly announced restructurings. Legal disputes, etc. include among other things tax, indirect tax and duty disputes.
Other includes provisions for warranties and risk under certain self-insurance programmes. The provisions are subject to considerable uncertainty, cf. note 24.
Reversals of provisions primarily relate to legal disputes and contractual disagreements, which are recognised in the income statement under operating costs and tax.
A.P. Moller - Maersk | Annual Report 201789
Amounts in USD million
CONSOLIDATED FINANCIAL STATEMENTS — NOTES OVERVIEWFINANCIALS CONSOLIDATED FINANCIAL STATEMENTS

DerivativesNote 15
Hedges comprise primarily currency derivatives and interest rate derivatives. Foreign exchange forwards
and option contracts are used to hedge the currency risk related to recognised and unrecognised trans-
actions. Interest rate and cross currency swaps are used to hedge interest rate exposure on borrowings.
Price hedge derivatives are used to hedge crude oil prices and bunker prices.
2017 2016
Non-current receivables 260 14
Current receivables 116 161
Non-current liabilities 138 526
Current liabilities 128 536
Assets, net 110 -887
The fair value of derivatives held at the balance sheet date can be allocated by type as follows:
Fair value, asset
Fair value, liability
Nominal amount of derivative
Fair value, asset
Fair value, liability
Nominal amount of derivative
2017 2017 2017 2016 2016 2016
Hedge of borrowings
Cross currency swaps
EUR 240 16 3,515 10 361 3,614
GBP 2 37 437 - 78 370
JPY 7 14 200 5 17 192
SEK - 68 305 - 137 473
NOK 6 41 693 - 87 674
Interest rate swaps
Cash flow hedges 4 12 1,037 2 15 662
Fair value hedges - 6 500 - 4 500
Total 259 194 17 699
Hedge of operating cash flows and investments in foreign currencies
Main currencies hedged
EUR 16 0 674 0 11 276
GBP 11 0 480 1 25 513
DKK 15 0 579 0 25 553
Other currencies 28 7 1,098 8 32 1,015
Total 70 7 9 93
Fair value
2017 2016
Held for trading
Currency derivatives -16 -128
Interest derivatives - 3
Price hedge - 2 4
Total - 18 -121
The hedges are expected to be highly effective due to the nature of the economic relation between the ex-
posure and hedge. The source of ineffectiveness is the credit risk of the hedging instruments. For hedges
where cost of hedging is applied, the forward points and change in basis spread are recognised in other
comprehensive income and transferred with the effective hedge when the hedged transaction occurs. The
cost of hedging reserve amount is USD 7m.
For information about risk management strategy, currencies, maturities, etc. reference is made to note 17.
Hedge of borrowings
Cross currency swaps are used to swap all non-USD issued bonds. Fixed to floating rate swaps are desig-
nated as a combination of fair value and cash flow hedges. The principal amounts hereof are (USD equiva-
lents): EUR 1,835m, GBP 95m, JPY 200m, SEK 171m and NOK 268m. The remaining swaps are fixed to fixed
rate or floating to fixed rate swaps and are designated as cash flow hedges of currency and interest risk.
The hedge ratio is 1:1. The maturity of the hedge instrument 0-5 years are (USD equivalents): EUR 3,419m,
GBP 32m, JPY 89m, SEK 305m and NOK 303m. 5-10 years: GBP 405m, JPY 111m and NOK 390m. Above 10
years: EUR 96m. Cross currency swaps are designated as a combination of hedge of principal cash flow
and hedge of interests at a weighted average rate of 3.7%.
Interest rate swaps are all denominated in USD and pays either floating (fair value hedge) or fixed interest
rates (cash flow hedge). The hedge ratio is 1:1 and the weighted average interest rate is 2.2%. The maturity
of the interest rate swaps 0-5 years: USD 442m and 5-10 years USD 1,095m.
For cash flow hedges related to borrowings USD 31m is recognised in other comprehensive income and
the cash flow hedges reserve is USD 31m. Reference is made to other comprehensive income.
The carrying amount of the borrowings in fair value hedge relation is USD 3,069m and the accumulated
fair value adjustment of the loans is USD 28m (negative). The loss on the hedging instrument in fair value
hedges recognised in the income statement for the year amounts to USD 33m (loss of USD 21m) and the
gain on hedged item amounts to USD 33m (gain USD 27m).
A.P. Moller - Maersk | Annual Report 201790
Amounts in USD million
CONSOLIDATED FINANCIAL STATEMENTS — NOTES OVERVIEWFINANCIALS CONSOLIDATED FINANCIAL STATEMENTS

DerivativesNote 15 — continued
Hedge of operating cash flows and investments in foreign currencies
Currency derivatives hedge future revenue, operating costs and investments/divestments and are rec-
ognised on an ongoing basis in the income statement and the cost of property, plant and equipment
respectively.
Hedges of future revenue and operating costs mature within a year, while hedges of investments mature
in 0-2 years.
For hedges related to operating cash flows and investment, USD 55m is recognised in other comprehen-
sive income and the cash flow hedge reserve is USD 55m.
Other economic hedges (no hedge accounting applied)
Furthermore, the Group enters into derivatives to hedge economic risks that are not accounted for as
hedging. These derivatives are accounted for as held for trading.
The gains/losses, including realised transactions, are recognised as follows:
2017 2016
Hedging foreign exchange risk on revenue 4 -7
Hedging foreign exchange risk on operating costs 45 -37
Hedging interest rate risk -55 -69
Hedging investment in associated companies -4 4
Hedging foreign exchange risk on the cost of non-current assets 119 -33
Hedging foreign exchange risk on discontinued operations -83 -117
Total effective hedging 26 -259
Ineffectiveness recognised in financial expenses -1 -5
Total reclassified from equity reserve for hedges 25 -264
Derivatives accounted for as held for trading
Currency derivatives recognised directly in financial income/expenses 334 -110
Interest rate derivatives recognised directly in financial income/expenses -37 -23
Oil prices and freight rate derivatives recognised directly in other income/costs -20 -18
Derivatives recognised in income statement for discontinued operations -6 -23
Net gains/losses recognised directly in the income statement 271 -174
Total 296 -438
For information about currencies, maturities, etc., reference is made to note 16.
Financial instruments by categoryNote 16
Carrying amount
Fair value
Carrying amount
Fair value
2017 2017 2016 2016
Carried at amortised cost
Loans receivable 387 387 329 329
Finance lease receivables 29 29 31 31
Other interest bearing receivables and deposits 62 62 92 92
Trade receivables 3,864 3,814
Other receivables (non-interest bearing) 1,137 1,461
Cash and bank balances 2,171 4,105
Financial assets at amortised cost 7,650 9,832
Derivatives 376 376 175 175
Carried at fair value through profit/loss
Other receivables (non-interest bearing)1 10 10 - -
Bonds - - 40 40
Shares - - 11 11
Other securities 1 1 1 1
Financial assets at fair value through profit/loss 11 11 52 52
Carried at fair value through other comprehensive income
Other equity investments (FVOCI)2 30 30 796 796
Financial assets at fair value through OCI 30 30 796 796
Total financial assets 8,067 10,855
Carried at amortised cost
Bank and other credit institutions 6,964 7,140 4,967 5,115
Finance lease liabilities 2,745 3,112 2,271 2,719
Issued bonds 7,804 8,020 8,097 8,244
Trade payables 5,250 4,901
Other payables 1,306 1,374
Financial liabilities at amortised cost 24,069 21,610
Derivatives 266 266 1,062 1,062
Carried at fair value
Other payables 7 7 7 7
Financial liabilities at fair value 7 7 7 7
Total financial liabilities 24,342 22,679
1 Relates to contingent consideration receivable.
2 Designated at initial recognition in accordance with IFRS 9. Available-for-sale in 2016.
A.P. Moller - Maersk | Annual Report 201791
Amounts in USD million
CONSOLIDATED FINANCIAL STATEMENTS — NOTES OVERVIEWFINANCIALS CONSOLIDATED FINANCIAL STATEMENTS

Disposal of the remaining 19% share in Dansk Supermarked Group
As the Salling Companies in November were able to complete the final transaction 2014, A.P. Møller - Mærsk A/S
sold its remaining 19% share of Dansk Supermarked Group for DKK 5.5bn equivalent to USD 871m.
The accumulated loss of USD 123m has been transferred within equity. The loss can be attributed to
the development in the DKK/USD exchange rate since initial recognition.
Equity Investments at fair value through other comprehensive income (FVOCI)
After disposal of the remaining 19% share in Dansk Supermarked Group, equity investments at fair value
through other comprehensive income (FVOCI) comprise only a number of minor investments.
Financial instruments measured at fair value
Financial instruments measured at fair value can be divided into three levels:
Level 1 — Quoted prices (unadjusted) in active markets for identical assets or liabilities;
Level 2 — Inputs other than quoted prices included within level 1 that are observable for the asset
or liability, either directly (i.e. as prices) or indirectly (i.e. derived from prices);
Level 3 — Inputs for the asset or liability that are not based on observable market data.
Fair value of listed securities is within level 1 of the fair value hierarchy. Non-listed shares and other
securities are within level 3 of the fair value hierarchy.
Fair value of derivatives is mainly within level 2 of the fair value hierarchy and is calculated on the basis
of observable market data as of the end of the reporting period. A minor amount of crude oil price
derivatives is within level 1 of the fair value hierarchy.
Fair value of level 3 assets and liabilities is primarily based on the present value of expected future cash
flows. A reasonably possible change in the discount rate is not estimated to affect the Group’s profit or
equity significantly.
Financial instruments carried at amortised cost
Fair value of the short-term financial assets and other financial liabilities carried at amortised cost is
not materially different from the carrying amount. In general, fair value is determined primarily based on
the present value of expected future cash flows. Where a market price was available, however, this was
deemed to be the fair value.
Fair value of listed issued bonds is within level 1 of the fair value hierarchy. Fair value of the remaining bor-
rowing items is within level 2 of the fair value hierarchy and is calculated on the basis of discounted future
cash flows.
Financial instruments by categoryNote 16 — continued
Movement during the year in level 3
Other equityinvestments
(FVOCI)1
Other receivables
Total financial
assets
Other payables
Total financial
liabilities
Carrying amount 1 January 2016 845 - 845 5 5
Addition 15 - 15 - -
Disposal 103 - 103 - -
Gains/losses recognised in the income statement - - - 1 1
Gains/losses recognised in other comprehensive income 24 - 24 - -
Exchange rate adjustment, etc. - - - 1 1
Carrying amount 31 December 2016 781 - 781 7 7
Addition - 28 28 - -
Disposal 877 - 877 - -
Gains/losses recognised in the income statement - -18 -18 - -
Gains/losses recognised in other comprehensive income 138 - 138 - -
Transfer, assets held for sale -31 - -31
Exchange rate adjustment, etc. 2 - 2 - -
Carrying amount 31 December 2017 13 10 23 7 7
1 Available for sale in 2016.
In 2016, the valuation of the significant financial asset in level 3 was tested against a combination of
valuation methodologies taking into account both the retail operations as well as the real estate port-
folio owned by Dansk Supermarked Group. The valuation is assessed using both a discounted cash flow
model with reference to selected listed peers and real estate yields. The discounted cash flow model
relies on a discount rate of 6.5% reflecting a weighted average of an assumed discount rate for the
retail business and an assumed yield for the real estate business as well as a long-term terminal growth
rate of 2%.
A.P. Moller - Maersk | Annual Report 201792
Amounts in USD million
CONSOLIDATED FINANCIAL STATEMENTS — NOTES OVERVIEWFINANCIALS CONSOLIDATED FINANCIAL STATEMENTS

Financial risks, etc.Note 17
The Group’s activities expose it to a variety of financial risks:
• Market risks, i.e. currency risk and interest rate risk
• Credit risk
• Liquidity risk.
The Group’s overall risk management programme focuses on the unpredictability of financial markets
and seeks to minimise the potential adverse effects on the Group’s financial performance. The Group
uses derivative financial instruments to hedge certain risk exposures.
Risk management is carried out by a central finance department under policies approved by the Board of
Directors. The finance department identifies, evaluates and hedges financial risks in close cooperation
with the Group’s business units.
Market risk
Market risk is the risk that changes in market prices, such as foreign exchange rates and interest rates,
will affect the Group’s profit or the value of its holdings of financial instruments. Below sensitivity analy-
ses relate to the position of financial instruments at 31 December 2017.
The sensitivity analyses for currency risk and interest rate risk have been prepared on the basis that the
amount of net debt, the ratio of fixed to floating interest rates of the debt and the proportion of financial
instruments in foreign currencies remain unchanged from hedge designations in place at 31 December
2017. Furthermore, it is assumed that the exchange rate and interest rate sensitivities have a symmetric
impact, i.e. an increase in rates results in the same absolute movement as a decrease in rates.
The sensitivity analyses show the effect on profit or loss and equity of a reasonably possible change in
exchange rates and interest rates.
Currency risk
The Group’s currency risk relates to the fact that while income from shipping and oil-related activities
is denominated mainly in USD, the related expenses are incurred in both USD and a wide range of other
currencies such as EUR, NOK, GBP, SEK, SGD and DKK. As the net income is in USD, this is also the primary
financing currency. Income and expenses from other activities, including APM Terminals, are mainly de-
nominated in local currencies, thus reducing the Group’s exposure to these currencies.
The main purpose of hedging the Group’s currency risk is to hedge the USD value of the Group’s net cash
flow and reduce fluctuations in the Group’s profit. The Group uses various financial derivatives, including
forwards, option contracts and cross-currency swaps, to hedge these risks. The key aspects of the cur-
rency hedging policy are as follows:
• Net cash flows in other significant currencies than USD are hedged using a layered model with a
12-month horizon;
• Significant capital commitments or divestments in other currencies than USD are hedged;
• Most non-USD debt is hedged, however, depending on the asset-liability match and the currency of the
generated cash flow.
An increase in the USD exchange rate of 10% against all other significant currencies to which the Group is
exposed is estimated to have a positive impact on the Group’s profit before tax by USD 0.3bn (USD 0.1 bn)
and to affect the Group’s equity, excluding tax, positively by USD 0.0bn (negatively by USD 0.1bn). The sen-
sitivities are based only on the impact of financial instruments that are outstanding at the balance sheet
date, cf. notes 15 and 16, and are thus not an expression of the Group’s total currency risk.
Interest rate risk
The Group has most of its debt denominated in USD, but part of the debt (e.g. issued bonds) is in other
currencies such as EUR, NOK, GBP, SEK and JPY.
The Group strives to maintain a combination of fixed and floating interest rates on its net debt, reflecting
expectations and risks. The hedging of the interest rate risk is governed by a duration range and is pri-
marily obtained through the use of interest rate swaps. The duration of the Group’s debt portfolio is 1.8
years (2.2 years). A general increase in interest rates by one percentage point is estimated, all other things
being equal, to affect profit before tax and equity, excluding tax effect, negatively by approximately USD
48m and USD 40m, respectively (positively by approximately USD 1m and USD 34m, respectively).
This analysis assumes that all other variables, in particular foreign currency rates, remain constant.
Next interest rate fixing
Borrowings by interest rate levels inclusive of interest rate swaps
Carrying amount
0-1 year
1-5 years
5- years
2017
0-3% 6,872 4,591 1,767 514
3-6% 9,419 4,467 3,285 1,667
6%- 1,222 31 215 976
Total 17,513 9,089 5,267 3,157
Of which:
Bearing fixed interest 8,788
Bearing floating interest 8,725
2016
0-3% 8,048 5,434 1,589 1,025
3-6% 5,719 2,605 1,156 1,958
6%- 1,568 100 415 1,053
Total 15,335 8,139 3,160 4,036
Of which:
Bearing fixed interest 7,363
Bearing floating interest 7,972
A.P. Moller - Maersk | Annual Report 201793
Amounts in USD million
CONSOLIDATED FINANCIAL STATEMENTS — NOTES OVERVIEWFINANCIALS CONSOLIDATED FINANCIAL STATEMENTS

Financial risks, etc.Note 17 — continued
Credit risk
Trade receivables
The Group has exposure to financial and commercial counterparties but has no particular concentration
of customers or suppliers. To minimise the credit risk, financial vetting is undertaken for all major cus-
tomers and financial institutions, adequate security is required for commercial counterparties, and credit
limits are set for financial institutions and key commercial counterparties.
A.P.Møller - Mærsk A/S applies the simplified approach to providing the expected credit losses prescribed
by IFRS 9, which permits the use of the lifetime expected loss provision for all trade receivables. To meas-
ure the expected credit losses, trade receivables have been grouped based on shared credit risk char-
acteristics and the days past due. In accordance with IFRS 9, also non-due trade receivables have been
impaired.
Maturity analysis of trade receivables 2017 2016
Receivables not due 2,360 2,529
Less than 90 days overdue 1,309 1,079
91-365 days overdue 293 309
More than 1 year overdue 174 176
Receivables, gross 4,136 4,093
Provision for bad debt 272 279
Carrying amount 3,864 3,814
The loss allowance provision for trade receivables as at 31 December 2017 reconciles to the opening loss
allowance as follows:
Change in provision for bad debt 2017 2016
1 January 279 301
Provision made 200 166
Amount used 110 126
Amount reversed 69 63
Transfer, assets held for sale -25 -
Exchange rate adjustment -3 1
31 December 272 279
Approximately 64%(63%) of the provision for bad debt is related to trade receivables overdue by more than
one year.
Other financial assets at amortised cost
Other financial assets at amortised cost comprise loans receivable, finance lease receivables and other
receivables. All of these financial assets are considered to have low credit risk and thus the impairment
provision calculated basis of 12 month expected losses is considered immaterial. The financial assets are
considered to be low risk when they have low risk of default and the issuer has a strong capacity to meet
its contractual cash flow obligations in the near term.
Liquidity risk
The Group’s objective is to maintain a liquidity profile in line with an investment grade credit rating. Capital
is managed for the Group as a whole. The equity share of total equity and liabilities was 49.7% at the end
of 2017 (52.5%).
2017 2016
Borrowings 17,513 15,335
Net interest-bearing debt 14,864 10,737
Liquidity reserve1 9,649 11,842
1 Liquidity reserve is defined as undrawn committed revolving facilities with more than one year to expiry,
securities and cash and bank balances, excluding securities and balances in countries with exchange
control or other restrictions.
In addition to the liquidity reserve, the Group has USD 2.8bn undrawn committed loans which are dedi-
cated to financing of specific assets, part of which will therefore only become available at certain times
in the future.
Based on the liquidity reserve, loans for the financing of specific assets, the maturity of outstanding
loans, and the current investment profile, the Group’s financial resources are deemed satisfactory.
The average term to maturity of loan facilities in the Group was about four years (about five years at
31 December 2016).
A.P. Moller - Maersk | Annual Report 201794
Amounts in USD million
CONSOLIDATED FINANCIAL STATEMENTS — NOTES OVERVIEWFINANCIALS CONSOLIDATED FINANCIAL STATEMENTS

Financial risks, etc.Note 17 — continued
It is of great importance for the Group to maintain a financial reserve to cover the Group’s obligations and
investment opportunities and to provide the capital necessary to offset changes in the Group’s
liquidity due to changes in the cash flow from operating activities.
The flexibility of the financial reserve is subject to ongoing prioritisation and optimisation, among other
things, by focusing on release of capital and following up on the development in working capital.
Cash flows including interest
Maturities of liabilities and commitments
Carrying amount
0-1 year
1-5 years
5- years
Total
2017
Bank and other credit institutions 6,964 1,901 4,958 906 7,765
Finance lease liabilities 2,745 583 1,816 1,080 3,479
Issued bonds 7,804 508 6,034 2,216 8,758
Trade payables 5,250 5,250 - - 5,250
Other payables 1,313 1,241 66 6 1,313
Non-derivative financial liabilities 24,076 9,483 12,874 4,208 26,565
Derivatives 266 128 86 52 266
Total recognised in balance sheet 24,342 9,611 12,960 4,260 26,831
Operating lease commitments1 1,950 4,496 5,853 12,299
Capital commitments1 2,111 622 1,121 3,854
Total 13,672 18,078 11,234 42,984
2016
Bank and other credit institutions 4,967 1,111 3,127 1,142 5,380
Finance lease liabilities 2,271 326 1,252 1,522 3,100
Issued bonds 8,097 1,029 5,352 2,838 9,219
Trade payables 4,901 4,901 - - 4,901
Other payables 1,381 1,348 16 17 1,381
Non-derivative financial liabilities 21,617 8,715 9,747 5,519 23,981
Derivatives 1,062 536 409 117 1,062
Total recognised in balance sheet 22,679 9,251 10,156 5,636 25,043
Operating lease commitments1 1,401 2,993 5,345 9,739
Capital commitments 1 2,892 1,562 916 5,370
Total 13,544 14,711 11,897 40,152
1 Related to continuing operations.
Commitments – continuing operations
Note 18
Operating lease commitments
As part of the Group’s activities, customary agreements are entered into regarding charter and operating
leases of ships, containers, port facilities, etc. The future charter and operating lease payments are:
Maersk Line1
APM Terminals
Other Total
2017
Within one year 1,501 282 167 1,950
Between one and two years 1,040 263 128 1,431
Between two and three years 841 291 90 1,222
Between three and four years 657 294 68 1,019
Between four and five years 467 305 52 824
After five years 855 4,850 148 5,853
Total 5,361 6,285 653 12,299
Net present value 2 4,605 3,637 544 8,786
2016
Within one year 993 281 127 1,401
Between one and two years 596 243 111 950
Between two and three years 489 246 93 828
Between three and four years 349 270 79 698
Between four and five years 180 274 63 517
After five years 248 4,888 209 5,345
Total 2,855 6,202 682 9,739
Net present value 2 2,529 3,527 548 6,604
1 About 40% of the time charter payments in Maersk Line reflected above estimated to relate to opera-
tional costs for the assets. USD 2.3bn of the increase in the operating lease commitments for Maersk
Line is due to the acquisition of Hamburg Süd in 2017.
2 The net present value has been calculated using a discount rate of 6% (6%).
A.P. Moller - Maersk | Annual Report 201795
Amounts in USD million
CONSOLIDATED FINANCIAL STATEMENTS — NOTES OVERVIEWFINANCIALS CONSOLIDATED FINANCIAL STATEMENTS

Commitments – continuing operations
Note 18 — continued
Capital commitmentsMaersk
LineAPM
TerminalsOther Total
2017
Capital commitments relating to acquisition of non-current assets 1,649 605 60 2,314
Commitments towards concession grantors - 1,540 - 1,540
Total capital commitments 1,649 2,145 60 3,854
2016
Capital commitments relating to acquisition of non-current assets 2,798 1,004 84 3,886
Commitments towards concession grantors - 1,484 - 1,484
Total capital commitments 2,798 2,488 84 5,370
The decrease in capital commitments is primarily related to contractual payments during 2017.
No.
Newbuilding programme 2018 2019 Total
Container vessels 17 3 20
Tugboats 9 - 9
Total 26 3 29
USD million
Capital commitments relating to the newbuilding programme 2018 2019 Total
Container vessels 1,266 295 1,561
Tugboats 43 - 43
Total 1,309 295 1,604
USD 1.6bn of the total capital commitments are related to the newbuilding programme for ships, rigs, etc.
at a total contract price of USD 2.2bn including owner-furnished equipment. The remaining capital com-
mitments of USD 2.3bn relate to investments mainly within APM Terminals.
The capital commitments will be financed by cash flow from operating activities as well as existing and
new loan facilities.
Contingent liabilitiesNote 19
Except for customary agreements within the Group’s activities, no material agreements have been
entered into that will take effect, change or expire upon changes of the control over the Company.
The necessary facility of USD 214m (USD 153 m) has been established in order to meet the requirements
for using US waters under the American Oil Pollution Act of 1990 (Certificate of Financial Responsibility).
Custom Bonds of USD 429m (USD 384m) have been provided to various port authorities in India.
Maersk Line and APM Terminals have entered into certain agreements with terminals and port authorities,
etc. containing volume commitments including an extra payment in case minimum volumes are not met.
The Group is involved in a number of legal disputes. The Group is also involved in tax disputes in certain
countries. Some of these involve significant amounts and are subject to considerable uncertainty.
Tax may crystallise if the companies leave the tonnage tax regimes and on repatriation of dividends.
Through participation in a joint taxation scheme with A.P. Møller Holding A/S, the Danish companies are
jointly and severally liable for taxes payable, etc. in Denmark.
A.P. Moller - Maersk | Annual Report 201796
Amounts in USD million
CONSOLIDATED FINANCIAL STATEMENTS — NOTES OVERVIEWFINANCIALS CONSOLIDATED FINANCIAL STATEMENTS

Cash flow specificationsNote 20
2017 2016
Change in working capital
Trade receivables -401 -680
Other working capital movements 99 309
Exchange rate adjustment of working capital 20 -28
Total -282 -399
Purchase of intangible assets and property, plant and equipment
Additions -3,805 -3,028
Of which finance leases, etc. 172 947
Of which borrowing costs capitalised on assets 63 49
Change in payables to suppliers regarding purchase of assets -29 34
Total -3,599 -1,998
Other non-cash items related primarily to adjustment of provision for bad debt regarding trade receivables.
Acquisition/sale of subsidiaries and activities
Note 21
Cash flow used for acquisitions in 2017 Hamburg Süd Other Total
Fair value at time of acquisition
Intangible assets 1,143 1 - 1,143
Property, plant and equipment 3,868 2 - 3,868
Financial assets 202 - 202
Deferred tax assets 19 - 19
Current assets 1,043 3 - 1,043
Provisions -561 4 - -561
Liabilities -1,751 5 - -1,751
Net assets acquired 3,963 - 3,963
Non-controlling interests - - -
Net assets acquired 3,963 - 3,963
Goodwill 388 - 388
Purchase price6 4,351 - 4,351
Contingent consideration paid - 1 1
Cash and bank balances assumed -200 - -200
Cash flow used for acquisition of subsidiaries and activities 4,151 1 4,152
1 Intangible assets consist mainly of customer relations and brand name rights.
2 Property, plant and equipment consist mainly of container vessels and containers.
3 Currents assets consist mainly of trade and other receivables.
4 Of which USD 317m relate to unfavourable lease contracts where USD 234m are reported as non-current
provisions and USD 83m as current provisions. Furthermore, USD 230m relate to tax provisions, where an
indemnification asset of USD 148m is recognised as a financial asset.
5 Non-current liabilities consist mainly of financial lease obligations, borrowings and other payables
whereas current liabilities consist mainly of trade payables.
6 The purchase price of USD 4,351m includes a positive hedge effect of USD 118m.
Acquisitions during 2017
Hamburg Südamerikanische Dampfschifffahrts-Gesellschaft KG (Hamburg Süd)
As of 1 December 2017, the Group acquired 100% of the shares in Hamburg Süd including partnership
shares in asset owning companies (SPCs) owning vessels, newbuild contracts and containers connected
hereto. Hamburg Süd is included in the consolidated financial reporting from 1st of December 2017. For
further details on the acquisition of Hamburg Süd reference is made to the Directors' report pages 21-23.
A.P. Moller - Maersk | Annual Report 201797
Amounts in USD million
CONSOLIDATED FINANCIAL STATEMENTS — NOTES OVERVIEWFINANCIALS CONSOLIDATED FINANCIAL STATEMENTS

The goodwill of USD 388m is primarily attributable to network synergies between Maersk Line and
Hamburg Süd including its Brazilian subsidiary Aliança and is not deductible for tax purposes.
From the acquisition date to 31 December 2017, Hamburg Süd Group contributed with a revenue of
USD 0.5bn while the result was immaterial. If the acquisition had occurred on 1 January 2017, the impact
on Group’s revenue would have been USD 5.4bn (proforma), while the result would have increased by
USD 0.1bn.
For 2017, the acquisition and integration costs amounted to USD 59m.
The accounting for the business combination is considered provisional at 31 December 2017 as the
acquisition was only completed on 1 December 2017.
Estimates and judgements
Fair value measurement
When applying the acquisition method of accounting, fair value assessments are made for identifiable
assets acquired and liabilities assumed. Determining fair values at the date of acquisition, by nature
entails management to apply estimates. Significant estimates are particularly applied in the valuation
of vessels, containers, customer relationships, brands, finance lease obligations and unfavourable con-
tracts. The inherent uncertainties in the fair value estimates may result in measurement adjustments
in the 12 months following closing of the transaction. Goodwill has been assessed as recoverable at
31 December 2017.
Acquired material net assets for which significant accounting estimates have been applied are recog-
nised using the following valuation techniques:
Intangible assets
Customer relationships have been measured using the excess earnings method, in which the present
value of future cash flows from recurring customers expected to be retained after the date of acquisition
is valued. The main input value drivers are estimated future retention rates and net cash flows of the
acquired customer base. These have been estimated based on management’s analysis of the acquired
customer base, historical data and general business insights. The useful life of customer relationships is
estimated at 15 years.
The fair value of brands has been measured using the relief from royalty method, in which management,
based on an analysis has assessed a royalty rate which an independent third party would charge for the
use of the brands. Besides the royalty rate, the main input value driver is estimated future revenue. The
useful life of customer relationships is estimated at 20 years.
The valuation of intangible assets reflects a market participants view applying a discount rate of 9-10%.
Property, plant and equipment
Fair value of vessels and containers are measured using the market comparison method based on inter-
nally prepared valuations compared with external valuations.
Financial lease obligations
The fair value of financial lease obligations has been measured using a discounted cash flow model in
which present value of the obligations have been determined based on the contractual future lease pay-
ments and an A.P. Moller - Maersk calculated borrowing rate.
Unfavourable contracts
The fair value of unfavourable contracts are measured using the market comparison method based on
the actual market rates for similar contracts.
Acquisition/sale of subsidiaries and activitiesNote 21 — continued
A.P. Moller - Maersk | Annual Report 201798
Amounts in USD million
CONSOLIDATED FINANCIAL STATEMENTS — NOTES OVERVIEWFINANCIALS CONSOLIDATED FINANCIAL STATEMENTS

Cash flow from sale 2017 2016
Carrying amount
Property, plant and equipment 178 -
Financial assets 20 -
Deferred tax assets 52 -
Current assets 143 -
Provisions -8 -
Liabilities -147 -
Net assets sold 238 -
Non-controlling interests -26 -
A.P. Møller - Mærsk A/S’ share 212 -
Gain/loss on sale 1 140 14
Proceeds from sale 352 14
Change in receivable proceeds, etc. 40 -
Non-cash items -31 -
Cash and bank balances sold -47 -
Cash flow from sale of subsidiaries and activities 314 14
1 Excluding accumulated exchange rate gain/loss previously recognised in equity.
Sales during 2017
In continuing operations, sales during 2017 primarily comprise Mercosul Line triggered by the Hamburg
Süd acquisition, Pentalver in the UK, Dalian terminal in China and Zeebrugge terminal in Belgium. The sale
of discontinued operations is disclosed in note 9.
Sales during 2016
No material sales of subsidiaries or activities were undertaken in 2016.
Non-current assets sold include assets that were previously classified as assets available-for-sale.
Note 21 — continued
Cash flow used for acquisitions in 2016Grup Marítim
TCB S.L.Other Total
Fair value at time of acquisition
Intangible assets 827 1 54 881
Property, plant and equipment 428 - 428
Financial assets 60 - 60
Deferred tax assets 6 - 6
Current assets 223 39 262
Provisions -5 - -5
Liabilities -814 2 -19 -833
Net assets acquired 725 74 799
Non-controlling interests -142 3 -37 -179
A.P. Møller - Mærsk A/S’ share 583 37 620
Goodwill 248 - 248
Purchase price 831 37 868
Contingent consideration assumed - -2 -2
Contingent consideration paid - 1 1
Cash and bank balances assumed -120 -39 -159
Cash flow used for acquisition of subsidiaries and activities 711 -3 708
1 Intangible assets consist mainly of terminal rights.
2 Liabilities acquired consist mainly of borrowings.
3 Non-controlling interest relates to companies owned less than 100% by Grup Marítim TCB S.L. and it is
measured at the non-controlling interest’s proportionate share of the acquirees’ identifiable net assets.
Acquisitions during 2016
Grup Marítim TCB S.L.
On 8 March 2016, the Group acquired 100% of the shares in Grup Maritim TCB, which owns eight termi-
nals in the Mediterranean and Latin America. The acquisition of two additional operating facilities in the
Canary Islands and one in Izmir, Turkey (representing less than 5% of the total transaction by value) did
not receive regulatory approval up to 8 March 2016, and is thus excluded from the current business combi-
nation. Taking control of Grup Marítim TCB has expanded the Group’s position in Spain and will accelerate
its growth in Latin America.
The total enterprise value of USD 1.2bn consisted of the total purchase price of USD 0.8bn and acquired
net interest bearing debt of USD 0.4bn. Adjustments to the provisional amounts were made since the ac-
quisition date including the allocation of goodwill of USD 248m.
The goodwill of USD 248m is attributable to network synergies between APM Terminals and Grup Marítim
TCB S.L. in Latin America and on the Iberian Peninsula and is not deductible for tax purposes. From the
acquisition date to 31 December 2016, Grup Marítim TCB S.L. contributed with revenue of USD 0.3bn. If the
acquisition had occurred on 1 January 2016, the impact on Group’s revenue would have been USD 0.3bn.
The result contributed to the Group is minor. The accounting for the business combination was consid-
ered provisional at 31 December 2016 due to certain contingencies, indemnities, etc.
Acquisition/sale of subsidiaries and activities
A.P. Moller - Maersk | Annual Report 201799
Amounts in USD million
CONSOLIDATED FINANCIAL STATEMENTS — NOTES OVERVIEWFINANCIALS CONSOLIDATED FINANCIAL STATEMENTS

Related partiesNote 22
Controlling parties Associated companies Joint ventures Management 1
2017 2016 2017 2016 2017 2016 2017 2016
Income statement
Revenue 13 - 29 16 101 74 - -
Operating costs 38 - 306 278 735 767 12 2 13 2
Remuneration to management - - - - - - 15 40
Other - - - - 1 - - -
Assets
Other receivables, non-current - - - - 143 121 - -
Trade receivables 2 - 7 14 40 34 - -
Cash and bank balances 29 - 41 39 87 51 - -
Liabilities
Bank and other credit institutions, etc. current - - - - 24 23 - -
Trade payables - - 40 39 125 86 - 1
Other 1 - - - - - - -
Purchase of property, plant and equipment, etc. - - - - - - - -
Sale of companies, property, plant and equipment, etc. 1,230 3 - - - - - - -
Dividends - - 56 51 157 160 - -
1 The Board of Directors and the Executive Board in A.P. Møller - Mærsk A/S, A.P. Møller Holding A/S, A.P. Møller og Hustru Chastine Mc-Kinney Møllers Fond til almene Formaal and their close relatives
(including undertakings under their significant influence). Trade receivables and payables include customary business related accounts in connection with shipping activities.
2 Includes commission and commercial receivables to Maersk Broker K/S from chartering as well as purchase and sale of ships.
3 Includes USD 1.2bn relating to the sale of shares in Maersk Tankers A/S to APMH Invest A/S and USD 13m for the sale of a building with A.P. Møller Holding A/S.
A.P. Møller Holding A/S, Copenhagen, Denmark has control over the Company and prepares consolidated financial statements. A.P. Møller og Hustru Chastine Mc-Kinney Møllers Fond til almene Formaal is
the ultimate owner.
Dividends distributed are not included.
A.P. Moller - Maersk | Annual Report 2017100
Amounts in USD million
CONSOLIDATED FINANCIAL STATEMENTS — NOTES OVERVIEWFINANCIALS CONSOLIDATED FINANCIAL STATEMENTS

Joint arrangements are entities in which A.P. Moller - Maersk, according to contractual agreements with
one or more other parties, has joint control. The arrangements are classified as joint ventures, if the con-
tracting parties’ rights are limited to net assets in the separate legal entities, and as joint operations, if
the parties have direct and unlimited rights to the assets and obligations for the liabilities of the arrange-
ment.
Entities in which A.P. Moller - Maersk exercises a significant but non-controlling influence are considered
associated companies. A significant influence is usually achieved by directly or indirectly owning or con-
trolling 20-50% of the voting rights. Agreements and other circumstances are considered when assessing
the degree of influence.
Consolidation is performed by summarising the financial statements of the parent company and its
subsidiaries, including the proportionate share of joint operations, part-owned vessels and pool ar-
rangements, which have been prepared in accordance with A.P. Moller - Maersk’s accounting policies. In-
tra-group income and expenses, shareholdings, dividends, intra-group balances and gains on intra-group
transactions are eliminated. Unrealised gains on transactions with associated companies and joint ar-
rangements are eliminated in proportion to A.P. Moller - Maersk’s ownership share. Unrealised losses are
eliminated in the same way, unless they indicate impairment.
Non-controlling interests’ share of profit/loss for the year and of equity in subsidiaries is included as part
of A.P. Moller - Maersk’s profit and equity respectively, but shown as separate items.
Foreign currency translation
The consolidated financial statements are presented in USD, the functional currency of the parent com-
pany. In the translation to the presentation currency for subsidiaries, associates or joint arrangements
with functional currencies other than USD, the total comprehensive income is translated into USD at
average exchange rates and the balance sheet is translated at the exchange rates as at the balance sheet
date. Exchange rate differences arising from such translations are recognised directly in other compre-
hensive income and in a separate reserve of equity.
The functional currency varies from business area to business area. For A.P. Moller - Maersk’s principal
shipping activities, the functional currency is typically USD. This means, among other things, that the
carrying amounts of property, plant and equipment and intangible assets and, hence, depreciation and
amortisation are maintained in USD from the date of acquisition. For other activities, including container
terminal activities and land-based container activities, the functional currency is generally the local cur-
rency of the country in which such activities are performed, unless circumstances suggest a different
currency is appropriate. The functional currency of oil and oil-related business within discontinued opera-
tions is USD.
Transactions in currencies other than the functional currency are translated at the exchange rate prevail-
ing at the date of the transaction. Monetary items in foreign currencies not settled at the balance sheet
date are translated at the exchange rate as at the balance sheet date. Foreign exchange gains and losses
are included in the income statement as financial income or expenses.
Basis of preparation
The consolidated financial statements for 2017 for A.P. Moller - Maersk have been prepared on a going
concern basis and in accordance with the International Financial Reporting Standards (IFRS) as adopted
by the EU and Danish disclosure requirements for listed companies. The consolidated financial state-
ments are also in accordance with IFRS as issued by the International Accounting Standards Board (IASB).
The accounting policies are consistent with those applied in the consolidated financial statements for
2016 except for the below areas:
The consolidated financial statements of A.P. Moller - Maersk are included in the consolidated financial
statements of A.P. Møller Holding A/S.
As stated in the Annual Report 2016, A.P. Moller - Maersk has decided to adopt IFRS 9 from 1 January 2017.
The implementation of IFRS 9 has not affected the classification and measurement of the Group’s financial
instruments, and the new standard does not fundamentally change the hedging relationships.
Management elected to classify the 19% shareholding in Dansk Supermarked Group as fair value through
other comprehensive income. The accumulated loss recognised in other comprehensive income will, as
a consequence, remain in equity, as will value adjustments related to this investment following this date.
The remaining equity investments previously classified as assets available for sale have also been clas-
sified as fair value through other comprehensive income. The accumulated amount recognised in other
comprehensive income for the remaining equity investments is not material.
The effect of the change from the ‘incurred loss’ model in IAS 39 to the ‘expected credit loss’ model in
IFRS 9 is considered immaterial due to the low credit risk in the Group. Due to immaterial effects from
implementing IFRS 9, the 2016 financial statements have not been restated. The effects as of end of 2016
have been recognised in 2017.
A number of changes to accounting standards became effective 1 January 2017. Those relevant to
A.P. Moller - Maersk are ‘Recognition of Deferred Tax Assets for Unrealised Losses’ (amendments to IAS
12) and ‘Disclosure initiative’ (amendments to IAS 7). The amendments encompass various guidance and
clarifications, which only affects disclosures.
In addition: ‘Annual improvements to IFRSs 2012-2014 cycle’ became effective 1 January 2017, but have not
been endorsed by the EU. The amendments encompass various guidance and clarifications, which would
have had no material effect on the financial statements if endorsed by the EU.
New financial reporting requirements coming into effect after 31 December 2017 are outlined in Note 26:
Consolidation
The consolidated financial statements comprise the parent company A.P. Møller - Mærsk A/S, its subsidi-
aries and proportionate shares in joint arrangements classified as joint operations.
Subsidiaries are entities controlled by A.P. Møller - Mærsk A/S. Control is based on the power to direct
the relevant activities of an entity and the exposure, or right, to variable returns arising from it. In that
connection, relevant activities are those that significantly affect the investee’s returns. Control is usually
achieved by directly or indirectly owning or in other ways controlling more than 50% of the voting rights or
by other rights, such as agreements on management control.
Significant accounting policiesNote 23
A.P. Moller - Maersk | Annual Report 2017101
Amounts in USD million
CONSOLIDATED FINANCIAL STATEMENTS — NOTES OVERVIEWFINANCIALS CONSOLIDATED FINANCIAL STATEMENTS

Significant accounting policiesNote 23 — continued
Revenue from terminal operations, freight forwarding activities and towing activities is recognised upon
completion of the service. In container terminals operated under certain restrictive terms of pricing and
service, etc., the value of tangible assets constructed on behalf of the concession grantor is recognised as
revenue during the construction.
Lease income from operating leases is recognised over the lease term.
Share of profit/loss in associated companies and joint ventures is recognised net of tax and corrected
for the share of unrealised intra-group gains and losses. The item also comprises any impairment losses
for such investments and their reversal.
Tax comprises an estimate of current and deferred income tax as well as adjustments to previous years of
those. Income tax is tax on taxable profits and consists of corporation tax, withholding tax of dividends,
etc. In addition, tax comprises tonnage tax. Tonnage tax is classified as tax when creditable in, or paid in
lieu of, income tax. Tax is recognised in the income statement to the extent it arises from items recog-
nised in the income statement, including tax of gains on intra-group transactions that have been elimi-
nated in the consolidation.
Earnings per share are calculated as A.P. Møller - Mærsk A/S’ share of the profit/loss for the year divided by the
number of shares (of DKK 1,000 each), excluding A.P. Moller - Maersk’s holding of own shares. Diluted earnings
per share are adjusted for the dilution effect of share-based compensation issued by the parent company.
Statement of comprehensive income
Other comprehensive income consists of income and costs not recognised in the income statement,
including exchange rate adjustments arising from the translation from functional currency to pres-
entation currency, fair value adjustments of other equity investments (at FVOCI), cash flow hedges,
forward points and currency basis spread as well as actuarial gains/losses on defined benefit plans, etc.
A.P. Moller - Maersk’s share of other comprehensive income in associated companies and joint ventures is
also included.
On disposal or discontinuation of an entity, A.P. Moller - Maersk’s share of the accumulated exchange rate
adjustment relating to the relevant entity with a non-USD functional currency is reclassified to the income
statement. Accumulated value adjustments of equity instruments classified as equity instruments at fair
value through other comprehensive income will remain in equity upon disposal.
Other comprehensive income includes current and deferred income tax to the extent the items recog-
nised in other comprehensive income are taxable or deductible.
Balance sheet
Intangible assets are measured at cost less accumulated amortisation and impairment losses. Amorti-
sation is calculated on a straight-line basis over the estimated useful lives of the assets. Intangible assets
in connection with acquired customer relationships and brand name are amortised over a useful life of 15
and 20 years respectively. IT software is amortised over a useful life of 3-5 years.
Segment information
The allocation of business activities into segments reflects A.P. Moller - Maersk’s character as an inte-
grated transport and logistics company and is in line with the internal management reporting. Activities
are related, but are managed individually. The reportable segments are as follows:
Maersk Line Global container shipping activities including Hamburg Süd from the date of acquisition
APM Terminals Container terminal activities and inland container services
Damco Freight forwarding and supply chain management services
Svitzer Towing and related marine activities
Maersk Container Industry Production of reefer and dry containers
Maersk Oil, Maersk Tankers, Maersk Drilling and Maersk Supply Service have been classified as discontin-
ued operations and assets held for sale in the Annual Report 2017.
In addition, A.P. Moller - Maersk comprises other businesses that neither individually nor in aggregate con-
stitute reportable segments. These include, inter alia, Maersk Aviation, Maersk Training, Höegh Autoliners
(associated company) and Maersk Oil Trading. Maersk Oil Trading’s activity in the form of purchasing bunker
and lubricating oil on behalf of entities in A.P. Moller - Maersk are from 1 July 2017 classified as Other business
(previously unallocated) due to increased external activity. Comparative figures have not been restated.
The reportable segments do not comprise costs in corporate functions.
Revenue between segments is limited except for terminal activities where a large part of the services is
delivered to Maersk Line. Sales of products and services between segments are based on market terms.
Segment profit/loss (NOPAT defined as net operating profit/loss after tax), free cash flow and invested
capital comprise items directly related to or which can be allocated to segments. Financial assets, liabil-
ities, income and expenses and cash flows from these items are not attributed to reportable segments.
With no effect on A.P. Moller - Maersk‘s results or financial position, long-term agreements between
Maersk Line and APM Terminals on reserved terminal facilities are treated as operating leases, which
under IFRS would be classified as finance leases.
Income statement
Revenue from sale of goods is recognised upon the transfer of risk to the buyer.
Revenue from shipping activities is recognised as the service is provided, including a share of revenue
from incomplete voyages at the balance sheet date. Invoiced revenue related to an estimated proportion
of remaining voyage time and activities at the destination port is deferred. Detention and demurrage fees
are recognised at the time of customers’ late return or pick-up of containers. Revenue is recognised net of
volume discounts and rebates.
A.P. Moller - Maersk | Annual Report 2017102
Amounts in USD million
CONSOLIDATED FINANCIAL STATEMENTS — NOTES OVERVIEWFINANCIALS CONSOLIDATED FINANCIAL STATEMENTS

Significant accounting policiesNote 23 — continued
Assets are held for sale, when the carrying amount of an individual non-current asset, or disposal groups,
will be recovered principally through a sale transaction rather than through continuing use. Assets are
classified as held for sale, when activities to carry out a sale have been initiated, the activities are available
for immediate sale in their present condition and the activities are expected to be disposed of within 12
months. Liabilities directly associated with assets held for sale are presented separately from other liabil-
ities.
Assets held for sale are measured at the lower of carrying amount immediately before classification as held
for sale and fair value less costs to sell and impairment tests are performed immediately before classifica-
tion as held for sale. Non-current assets are not depreciated or amortised while classified as held for sale.
Measurement of deferred tax and financial assets and liabilities is unchanged.
Lease contracts are classified as operating or finance leases at the inception of the lease. Once determined,
the classification is not subsequently reassessed unless there are changes to the contractual terms. Contracts
which transfer all significant risks and benefits associated with the underlying asset to the lessee are clas-
sified as finance leases. Assets held under finance leases are treated as property, plant and equipment.
Investments in associated companies and joint ventures are recognised at A.P. Moller - Maersk’s share
of the equity value inclusive of goodwill less any impairment losses. Goodwill is an integral part of the
value of associated companies and joint ventures and is therefore subject to an impairment test together
with the investment as a whole. Impairment losses are reversed to the extent the original value is consid-
ered recoverable.
Securities, including shares, bonds and similar securities, are recognised on the trading date at fair value
and subsequently measured at the quoted market price for listed securities and at estimated fair value
for non-listed securities. Fair value adjustments from equity investments at fair value through other com-
prehensive (FVOCI) remains in equity upon disposal. Dividends are recognised in the income statement.
Inventories mainly consist of bunker, containers (manufacturing), spare parts not qualifying for property,
plant and equipment and other consumables. Inventories are measured at cost, primarily according to the
FIFO method. The cost of finished goods and work in progress includes direct and indirect production costs.
Loans and receivables are initially recognised at fair value, plus any direct transaction costs and subse-
quently measured at amortised cost using the effective interest method. For loans and other receivables,
write-down is made for anticipated losses based on specific individual or group assessments. For trade
receivables the loss allowance is measured in accordance with IFRS 9 applying a provision matrix in order to
calculate the impairment. The provision matrix does include an impairment for non-due receivables.
Equity includes total comprehensive income for the year comprising the profit/loss for the year and other
comprehensive income. Proceeds on the purchase and sale of own shares and dividend from such shares
are recognised in equity.
The translation reserve comprises A.P. Moller - Maersk’s share of accumulated exchange rate differences
arising on translation from functional currency into presentation currency. The reserve for other equity
investments comprises accumulated changes in the fair value of equity investments (at FVOCI), net of tax.
Reserve for hedges includes the accumulated fair value of derivatives qualifying for cash flow hedge ac-
counting, net of tax, as well as forward points and currency basis spread.
For container terminals operated under certain restrictive price and service conditions, etc., concessional
rights to collect usage charges are included under intangible assets. The cost includes the present value
of minimum payments under concession agreements and the cost of property, plant and equipment
constructed on behalf of a grantor of a concession. The rights are amortised from the commencement of
operations over the concession period.
Property, plant and equipment are valued at cost less accumulated depreciation and impairment losses.
Depreciation is charged to the income statement on a straight-line basis over the useful lives at an esti-
mated residual value. The useful lives of new assets are typically as follows:
Ships, etc. 20-25 years
Containers, etc. 12 years
Buildings 10-50 years
Terminal infrastructure 10-20 years or concession period, if shorter
Plant and machinery, cranes and other terminal equipment
5-20 years
Other operating equipment, fixtures, etc. 3-7 years
Estimated useful lives and residual values are reassessed on a regular basis.
The cost of an asset is divided into separate components, which are depreciated separately if the useful
lives of the individual components differ. Dry-docking costs are recognised in the carrying amount of
ships when incurred and depreciated over the period until the next dry-docking.
The cost of assets constructed by A.P. Moller - Maersk includes directly attributable expenses. For assets
with a long construction period, borrowing costs during the construction period from specific as well
as general borrowings are attributed to cost. In addition, the cost includes the net present value of esti-
mated costs of removal and restoration.
Impairment losses are recognised when the carrying amount of an asset or a cash-generating unit ex-
ceeds the higher of the estimated value in use and fair value less costs of disposal. Goodwill is attributed
to cash-generating units on acquisition and impaired before other assets.
Intangible assets and property, plant and equipment are tested for impairment, if there is an indication
of impairment. However, annual impairment tests are carried out for goodwill and other intangible assets
with indefinite useful lives as well as intangible assets that are not yet in use.
A.P. Moller - Maersk | Annual Report 2017103
Amounts in USD million
CONSOLIDATED FINANCIAL STATEMENTS — NOTES OVERVIEWFINANCIALS CONSOLIDATED FINANCIAL STATEMENTS

Significant accounting policiesNote 23 — continued
Derivative financial instruments
Derivative financial instruments are recognised on the trading date and measured at fair value using gen-
erally acknowledged valuation techniques based on relevant observable swap curves and exchange rates.
The effective portion of changes in the value of derivative financial instruments designated to hedge
highly probable future transactions is recognised in other comprehensive income until the hedged trans-
actions are realised. At that time, the cumulated gains/losses are transferred to the items under which
the hedged transactions are recognised. The effective portion of changes in the value of derivative finan-
cial instruments used to hedge the value of recognised financial assets and liabilities is recognised in the
income statement together with changes in the fair value of the hedged assets or liabilities that can be
attributed to the hedging relationship. Currency basis spread and forward points are considered a cost of
hedge and deferred in equity.
The ineffective portion of hedge transactions and changes in the fair values of derivative financial instru-
ments, which do not qualify for hedge accounting, are recognised in the income statement as financial
income or expenses for interest and currency based instruments, and as other income/costs for oil price
hedges and forward freight agreements.
Cash flow statement
Cash flow from operating activities includes all cash transactions other than cash flows arisen from
investments and divestments, principal payments of loans, instalments on finance lease liabilities and
equity transactions. Capitalisation of borrowing costs is considered a non-cash item, and the actual pay-
ment thereof is included in cash flow from operations.
Cash and cash equivalents comprise cash and bank balances net of bank overdrafts where overdraft facil-
ities form an integral part of A.P. Moller - Maersk’s cash management.
Business combinations and disposal of subsidiaries
Upon acquisition of new entities, the acquired assets, liabilities and contingent liabilities are measured
at fair value at the date control was achieved using the acquisition method. Identifiable intangible assets
are recognised if they arise from a contractual right or can otherwise be separately identified. The differ-
ence between the fair value of the acquisition cost and the fair value of acquired identifiable net assets is
recognised as goodwill. Contingent consideration is measured at fair value and any subsequent changes
to contingent consideration are recognised as other income or other costs in the income statement.
Transaction costs are recognised as operating costs as they are incurred.
When A.P. Moller - Maersk ceases to have control of a subsidiary, the value of any retained investment
is re-measured at fair value and the value adjustment is recognised in the income statement as gain (or
loss) on sale of non-current assets. The difference between sales proceeds and the carrying amount of
the subsidiary is recognised in the income statement including fair value of contingent consideration at
the time of sale. Contingent consideration is re-measured at fair value with changes recognised in the
income statement
Equity-settled performance shares, restricted shares and share options allocated to the executive em-
ployees of A.P. Moller - Maersk as part of A.P. Moller - Maersk’s long-term incentive programme are recog-
nised as staff costs over the vesting period at estimated fair value at the grant date and a corresponding
adjustment in equity. Cash-settled performance awards allocated to employees below executive levels as
part of A.P. Moller - Maersk’s long-term incentive programme are recognised as staff costs over the vest-
ing period and a corresponding adjustment in other payables.
At the end of each reporting period, A.P. Moller - Maersk revises its estimates of the number of awards that are
expected to vest based on the non-market vesting conditions and service conditions. Any impact of the revi-
sion is recognised in the income statement with a corresponding adjustment to equity and other payables.
Provisions are recognised when A.P. Moller - Maersk has a present legal or constructive obligation from
past events. The item includes, among other things, legal disputes, onerous contracts, provisions for
unfavourable contracts acquired as part of a business combination as well as provisions for incurred, but
not yet reported, incidents under certain insurance programmes, primarily in the USA. Provisions are rec-
ognised based on best estimates and are discounted where the time element is significant and where the
time of settlement is reasonably determinable.
Pension obligations are the net liabilities of defined benefit obligations and the dedicated assets ad-
justed for the effect of minimum funding and asset ceiling requirements. Plans with a funding surplus
are presented as net assets on the balance sheet. The defined benefit obligations are measured at the
present value of expected future payments to be made in respect of services provided by employees up to
the balance sheet date. Plan assets are measured at fair value. The pension cost charged to the income
statement consists of calculated amounts for vested benefits and interest in addition to settlement
gains or losses, etc. Interest on plan assets is calculated with the same rates as used for discounting the
obligations. Actuarial gains/losses are recognised in other comprehensive income.
Pension plans where A.P. Moller - Maersk, as part of collective bargaining agreements, participates to-
gether with other enterprises, so called multi-employer plans, are treated as other pension plans in the
financial statements. Defined benefit multi-employer plans, where sufficient information to apply defined
benefit accounting is not available, are treated as defined contribution plans.
Deferred tax is calculated on temporary differences between the carrying amounts and tax bases of as-
sets and liabilities. Deferred tax is not recognised for differences on the initial recognition of assets or lia-
bilities where at the time of the transaction neither accounting nor taxable profit/loss is affected, unless
the differences arise in a business combination. In addition, no deferred tax is recognised for undistrib-
uted earnings in subsidiaries, when A.P. Moller - Maersk controls the timing of dividends, and no taxable
dividends are currently expected. A deferred tax asset is recognised to the extent that it is probable that it
can be utilised within a foreseeable future.
Financial liabilities are initially recognised at fair value less transaction costs. Subsequently, the financial
liabilities are measured at amortised cost using the effective interest method, whereby transaction costs
and any premium or discount are recognised as financial expenses over the term of the liabilities. Fixed
interest loans subject to fair value hedge accounting are measured at amortised cost with an adjustment
for the fair value of the hedged interest component. Liabilities in respect of finance leases are measured
at the interest rate implicit in the lease, if practicable to determine, or else at A.P. Moller - Maersk’s incre-
mental borrowing rate.
A.P. Moller - Maersk | Annual Report 2017104
Amounts in USD million
CONSOLIDATED FINANCIAL STATEMENTS — NOTES OVERVIEWFINANCIALS CONSOLIDATED FINANCIAL STATEMENTS

Significant accounting estimates and judgements
Note 24
The preparation of the consolidated financial statements requires management, on an ongoing basis, to
make judgements and estimates and form assumptions that affect the reported amounts. Management
forms its judgements and estimates on historical experience, independent advisors and external data
points as well as in-house specialists and on other factors believed to be reasonable under the circum-
stances.
In certain areas, the outcome of business plans, including ongoing negotiations with external parties to
execute those plans or to settle claims that are raised against A.P. Moller - Maersk, is highly uncertain.
Therefore, assumptions may change or the outcome may differ in the coming years, which could require
a material upward or downward adjustment to the carrying amounts of assets and liabilities. This note
includes the areas in which A.P. Moller - Maersk is particularly exposed to a material adjustment of the
carrying amounts as at the end of 2017.
General
Aspects of uncertainty
In its assumption setting, management deals with different aspects of uncertainty. One aspect of uncer-
tainty is whether an asset or liability exists where the assessment is basis for recognition or derecognition
decisions, including assessment of control. Another aspect is the measurement uncertainty, where man-
agement makes assumptions about the value of the assets and liabilities that are deemed to exist. These
assumptions concern the timing and amount of future cash flows and the risks inherent in these.
Container freight rates
The future development in the container freight rates is an uncertain and significant factor impacting es-
pecially Maersk Line which financial results are directly affected by the fluctuation in the container freight
rates. Freight rates are influenced by the global economic environment and trade patterns, as well as
industry specific trends in respect of supply and demand of capacity.
Oil prices
The future development in the oil price is an uncertain and significant factor impacting accounting es-
timates across A.P. Moller - Maersk either directly or indirectly. Maersk Line is directly impacted by the
price of bunker oil, where the competitive landscape determines the extent to which the development
is reflected in the freight rates charged to the customer. APM Terminals is indirectly impacted by the oil
price as terminals located in oil producing countries, e.g. Nigeria, Angola, Egypt, Russia, and Brazil, are
indirectly impacted by the development in oil prices and the consequences on the countries’ economies,
which not only affects volume handled in the terminals, but also the exchange rates.
Intangible assets and property, plant and equipment
A.P. Moller - Maersk carries goodwill of USD 723m (USD 334m) and intangible assets with indefinite lives
of USD 34m (USD 34m). The increase in goodwill relates to the acquisition of Hamburg Süd through a
business combination in December 2017 and relates to the global container activities. The majority of
non-current assets are amortised over their useful economic lives. Management assesses impairment in-
dicators across this asset base. Judgement is applied in the definition of cash generating units and in the
selection of methodologies and assumptions for impairment tests.
Discontinued operations and assets held for sale
Discontinued operations represent a separate major line of business disposed of or in preparation for sale.
The results of discontinued operations are presented separately in the income statement and the cash
flows from discontinued operations are presented separately in the cash flow statement with restatement
of comparative figures. Assets and liabilities held for sale from discontinued operations are presented as
separate items in the balance sheet with no restatement of comparison figures. Elimination between con-
tinuing business and discontinuing operations are presented in order to reflect continuing operations as
post-separation which entails elimination of interest, borrowing, dividends and capital increases.
Assets and liabilities from discontinued operations and assets held for sale except financial assets, etc.,
are measured at the lower of carrying amount immediately before classification as held for sale and fair
value less cost to sell. and impairment tests are performed immediately before classification as held for
sale. Non-current assets held for sale are not depreciated.
In addition to the above general accounting policies the following are significant in regard to discontinued
operations.
Oil and gas revenue is recognised as revenue upon discharge from the production site, reflecting the pro-
duction entitlement quantities. In agreements where tax is settled in oil, an amount corresponding to the
sales value is recognised as both revenue and tax. For drilling activities, revenue is recognised in accord-
ance with the agreed day rates for the work performed to date. Compensations received, or receivable,
for early termination are recognised as revenue with deferral of an estimated value of any obligations to
stand ready for new engagements in the remaining contract period.
Income tax in addition consists of oil tax based on gross measures. Oil tax on gross measures is a special
tax in certain countries on the production of hydrocarbons, and is separately disclosed within tax.
Intangible assets in connection with acquired oil resources (concession rights, etc.) are amortised over a
useful life of production until the fields’ expected production periods end, a period of up to 20 years.
In Property, plant and equipment, oil production facilities, where oil is received as payment for the in-
vestment (cost oil), depreciation generally takes place concurrently with the receipt of cost oil. The cost
includes the net present value of estimated costs of abandonment.
Annual impairment tests are not carried out for oil concession rights within the scope of IFRS 6.
The useful lives of new assets are 20 years for Rigs and up to 25 years for Oil and gas production facilities,
etc., based on the expected production periods of the fields.
Provisions includes provisions for abandonment of oil fields.
Significant accounting policiesNote 23 — continued
A.P. Moller - Maersk | Annual Report 2017105
Amounts in USD million
CONSOLIDATED FINANCIAL STATEMENTS — NOTES OVERVIEWFINANCIALS CONSOLIDATED FINANCIAL STATEMENTS

Significant accounting estimates and judgementsNote 24 — continued
Refer to notes 6 and 7 for information about impairment losses, recoverable amounts and discount rates.
Amortisation, depreciation and residual values
Useful lives are estimated based on past experience. Management decides from time to time to revise the
estimates for individual assets or groups of assets with similar characteristics due to factors such as quality
of maintenance and repair, technical development and environmental requirements. Refer to note 23 for
the useful lives typically used for new assets.
Residual values are difficult to estimate given the long lives of vessels and rigs, the uncertainty as to
future economic conditions and the future price of steel, which is considered as the main determinant
of the residual price. As a general rule, the residual values of vessels are initially estimated at 10% of the
purchase price excluding dry-docking costs. The long-term view is prioritised in order to disregard, to the
extent possible, temporary market fluctuations which may be significant.
Operations in countries with limited access to repatriating surplus cash
A.P. Moller - Maersk operates worldwide and in this respect, has operations in countries where the access
to repatriating surplus cash is limited. In these countries, management makes judgements as to how these
transactions and balance sheet items are recognised in the financial statement.
Provisions for pension and other employee benefits
For defined benefit schemes, management makes assumptions about future remuneration and pension
changes, employee attrition rates, life expectancy, inflation and discount rates. When setting those as-
sumptions, management takes advice from the actuaries performing the valuation. The inflation and dis-
count rates are determined centrally for the major plans on a country-by-country basis. All other assump-
tions are determined on a plan-by-plan basis. Refer to note 13 for information about key assumptions and
the sensitivity of the liability to changes in those.
Plan assets are measured at fair value by fund administrators.
Provisions for legal disputes, uncertain tax positions, etc.
Management’s estimate of the provisions in connection with legal disputes, including disputes on taxes
and duties, is based on the knowledge available on the actual substance of the cases and a legal assess-
ment of these. The resolution of legal disputes, through either negotiations or litigation, can take several
years to complete and the outcome is subject to considerable uncertainty.
A.P. Moller - Maersk is engaged in a number of disputes with tax authorities of varying scope. Appropriate
provisions have been made where the probability of payment of additional taxes in individual cases is con-
sidered more likely than not. Claims, for which the probability of payment is assessed by management to
be less than 50%, are not provided for. Such risks are instead evaluated on a portfolio basis by geograph-
ical area, and country risk provisions are established where the aggregated risk of additional payments is
more likely than not.
Deferred tax assets
Judgement has been applied in the measurement of deferred tax assets with respect to A.P. Moller - Maersk’s
ability to utilise the assets. Management considers the likelihood of utilisation based on the latest business
plans and recent financial performances of the individual entities. Net deferred tax assets recognised
in entities having suffered an accounting loss in either the current or preceding period amount to USD
The determination of cash generating units differs for the various businesses. Maersk Line operates its
fleet of container vessels in an integrated network for which reason the global container shipping activ-
ities are tested for impairment as a single cash generating unit. APM Terminals considers each terminal
individually in impairment tests, unless when the capacity is managed as a portfolio, which is the case for
certain terminals in Northern Europe and Global Ports Investments (Russia). Svitzer groups vessels ac-
cording to type, size, etc. in accordance with the structure governing management’s ongoing follow-up.
Projected cash flow models are used when fair value is not obtainable or when fair value is deemed lower
than value in use. External data is used to the extent possible and centralised processes, involving corporate
functions, ensure that indexes or data sources are selected consistently observing differences in risks and
other circumstances. Current market values for vessels, etc. are estimated using acknowledged brokers.
Impairment considerations
In Maersk Line, although freight rates improved compared to 2016, and despite generating positive cash
flows in the year, the continuing low freight rates are impairment indicators. In addition, the estimated
fair value of the fleet continues to be significantly lower than the carrying amount. Consequently, an esti-
mate of the recoverable amount has been prepared by a value in use calculation. The cash flow projection
is based on forecasts as per December 2017 covering plans for 2018-22. The key sensitivities are: develop-
ment in freight rates, container volumes, bunker costs, effect of cost savings as well as the discount rate.
Management has applied an assumption of growth in volumes and continued pressure on, but increasing
freight rates, and continued cost efficiency. The impairment test continues to show headroom from value
in use to the carrying amount. Management is of the opinion that the assumptions applied are sustainable.
In APM Terminals the decline in activity in oil producing countries are impairment indicators for the
terminals in these countries. Management assesses impairment triggers and based on these estimate
recoverable amounts on the individual terminals. For APM Terminals’ interest in Global Port Investments,
being the share of equity and significant intangible assets acquired, management assesses the recov-
erable amount of its interest on an ongoing basis. Uncertain variables in the estimate are the economic
outlook in Russia, local competition, effect on volume, operating expenses and discount rate. The carrying
amount of the investment may not be sustainable in the next few years, if markets develop significantly
adverse compared to current expectations. Estimates of recoverable amounts were also prepared for
other terminals where decreasing volumes triggered impairment tests. Impairments of USD 621m were
recognised in 2017 related to terminals in markets with challenging commercial conditions. Continued
economic deterioration and lacking cash repatriation opportunities in certain oil producing countries can
potentially put further pressure on carrying amounts of terminals in these countries.
For Maersk Drilling an impairment charge of USD 1.8bn before tax was recognised in Q3 2017 due to the
continuing challenging market conditions. The current supply/demand imbalance in the offshore rig
market along with the uncertainty regarding the future oil price projections driving demand and conse-
quently the day rates are the key drivers for the impairments in Maersk Drilling. The recoverable amount is
determined as fair value less cost to sell based on a discounted cash flow model. Day rates are expected
to moderately increase in the medium term compared to the all-time low rates recently seen. Although a
gradual move towards more economically sustainable rates in the long-term is expected, the level is ex-
pected to be lower than the historic rates due to continued uncertainty in oil demand and the significant
oversupply of rigs in the market. The fair value estimates using the discounted cash flow model is highly
uncertain due to the character of the assets and few transactions. The calculations are sensitive to ex-
pected future day rates and the risks of idle periods in addition to the discount rate.
A.P. Moller - Maersk | Annual Report 2017106
Amounts in USD million
CONSOLIDATED FINANCIAL STATEMENTS — NOTES OVERVIEWFINANCIALS CONSOLIDATED FINANCIAL STATEMENTS

Significant accounting estimates and judgements
Note 24 — continued
New financial reporting requirements
Note 25
The following new accounting standards are relevant to the Group for the years commencing from
1 January 2018 or later. A.P. Moller - Maersk has not yet applied the following standards:
• IFRS 15 Revenue from contracts with customers
• IFRS 16 Leases.
IFRS 15 is effective from 1 January 2018 and IFRS 16 is effective from 1 January 2019, and both are
endorsed by the EU. A.P.Moller - Maersk has decided to adopt IFRS 9 from 1 January 2017. Early adoption
of IFRS 16 is currently not considered by A.P. Moller - Maersk.
A.P. Moller - Maersk has, in all material aspects, concluded analyses of the impending changes resulting
from IFRS 15 and IFRS 16. The key findings are explained below.
IFRS 15 Revenue from contracts with customers
A.P. Moller - Maersk’s current practice for recognising revenue has shown to comply, in all material aspects,
with the concepts and principles encompassed by the new standard. Accordingly, the impact on the con-
solidated financial statement is considered immaterial.
IFRS 16 Leases
The new requirement in IFRS 16 to recognise a right-of-use asset and a related lease liability is expected to
have a material impact on the amounts recognised in the consolidated financial statements.
A.P. Moller - Maersk will adopt IFRS 16 on 1 January 2019, applying the following main transition options:
• No reassessment of lease definition compared to the existing IAS 17 and IFRIC 4
• Application of the simplified approach with no restatement of comparative figures for prior periods.
As at 31 December 2017, A.P. Moller - Maersk has non-cancellable operating lease commitments for con-
tinuing operations of USD 12bn (USD 10bn) on an undiscounted basis and including payments for service
components and variable lease payments which will be recognised under IFRS 16 as an expense in the
income statement, on a straight-line basis.
A preliminary assessment of the potential impact on the consolidated financial statements of implement-
ing IFRS 16 shows that a lease liability in the range of USD 6-8bn has to be recognised. This preliminary
assessment is based on a number of estimates and assumptions which by nature are subject to significant
uncertainty. The actual impact of applying IFRS 16 at 1 January 2019 will, among other factors, depend on
future economic conditions – including the composition of the lease portfolio at that date as well as the
level of time charter rates, incremental borrowing rates, etc.
206m (USD 140m) for continuing operations, excluding entities participating in joint taxation schemes.
These assets mainly relate to unused tax losses or deductible temporary differences generated, during
construction of terminals, where taxable profits have been generated either in the current period or are
expected within a foreseeable future.
Assessment of control, joint control or significant influence
A.P. Moller - Maersk’s control, joint control or significant influence over an entity or activity is subject to an
assessment of power and exposure to variability in returns.
The assessment of control in oil and gas activities entails analysis of the status of operators in joint ar-
rangements. Operators are responsible for the daily management of the activities carried out within the
jointly established framework. Since operators are not exposed to, and have no right to, returns beyond
the participating share, and since they can be replaced by agreement, the operators are regarded as
agents as defined in IFRS 10. Operators of pool arrangements in shipping are assessed similarly.
When assessing joint control, an analysis is carried out to determine which decisions require unanimity
and whether these concern the activities that significantly affect the returns. Joint control is deemed to
exist when business plans, work programmes and budgets are unanimously adopted. Within oil and gas
activities, an assessment of joint control is carried out for each phase. These are typically exploration and
development, production and decommissioning. Unanimity is often not required during the production
phase. Given that the contracting parties have direct and unrestricted rights and obligations in the ar-
rangements’ assets or liabilities regardless of voting rights, the arrangements are accounted for as joint
operations during all phases.
For pool arrangements in shipping, unanimity is not required in decisions on relevant activities. However,
the contracting parties have direct and unrestricted rights and obligations in the unit’s assets or liabilities,
and as the pool arrangements are not structured into separate legal entities, they are treated as joint
operations.
Leasing
Judgement is applied in the classification of lease as operating or finance lease. A.P. Moller - Maersk
enters into a substantial amount of lease contracts, some of which are combined lease and service con-
tracts like time charter agreements.
Management applies a formalised process for classification and estimation of present values for finance
leases with use of specialised staff in corporate functions.
Discontinued operations and assets held for sale
When classifying a disposal group as assets held for sale management applies judgement to the esti-
mated fair value of the disposal group. Depending on the disposal group’s activity, assets and liabilities,
the estimated value is encompassed by different levels of uncertainty and thus subsequent adjustments
are possible. Measurement of the fair value of disposal group is categorised as Level 3 in the fair value
hierarchy as measurement is not based on observable market data.
A.P. Moller - Maersk | Annual Report 2017107
Amounts in USD million
CONSOLIDATED FINANCIAL STATEMENTS — NOTES OVERVIEWFINANCIALS CONSOLIDATED FINANCIAL STATEMENTS

A .P . Møller - Mærsk A/S
(In parenthesis the corresponding figures for 2016)
PARENT COMPANY FINANCIAL STATEMENTS 2017
Income statement | Statement of comprehensive income | Balance sheet at 31 December | Cash flow statement | Statement of changes in equity | Notes to the parent company financial statements
A.P. Møller - Mærsk A /S | Annual Report 2017108
PARENT COMPANY FINANCIAL STATEMENTS — NOTES OVERVIEWFINANCIALS PARENT COMPANY FINANCIAL STATEMENTS

Statement of comprehensive income
Income statement
Note 2017 2016
1 Revenue 70 113
2 Operating costs 225 281
Other costs 18 -
Profit before depreciation, amortisation and impairment losses, etc. -173 -168
6,9 Depreciation, amortisation and impairment losses, net 1 -
3 Gain/loss on sale of companies and non-current assets, etc., net -386 54
Profit before financial items -560 -114
4 Dividends 2,839 182
4 Financial income 1,419 1,211
4 Financial expenses 3,434 2,113
Profit/loss before tax 264 -834
5 Tax -89 22
Profit/loss for the year – continuing operations 353 -856
9 Profit for the year – discontinued operations 407 204
Profit/loss for the year 760 -652
Appropriation:
Proposed dividend 503 443
Retained earnings 257 -1,095
760 -652
Proposed dividend per share, DKK 150 150
Proposed dividend per share, USD 24 21
Note 2017 2016
Profit/loss for the year 760 -652
15 Other equity investments (assets available-for-sale):
Fair value adjustment for the year - 24
Reclassified to income statement, gain on sale of non-current assets, etc., net - -51
14 Cash flow hedges:
Value adjustment of hedges for the year -13 -37
Reclassified to income statement 45 73
5 Tax on other comprehensive income -10 19
Total items that are or may be reclassified subsequently to the income statement 22 28
15 Other equity investments, fair value adjustments for the year 112 -
Total items that will not be reclassified to the income statement 112 -
Other comprehensive income, net of tax 134 28
Total comprehensive income for the year 894 -624
Amounts in USD million
109 A.P. Møller - Mærsk A /S | Annual Report 2017
PARENT COMPANY FINANCIAL STATEMENTS — NOTES OVERVIEWFINANCIALS PARENT COMPANY FINANCIAL STATEMENTS

Balance sheet at 31 December
Assets
Note 2017 2016
6 Property, plant and equipment 4 1,605
7 Investments in subsidiaries 13,385 30,496
7 Investments in associated companies 203 207
Other equity investments - 759
15 Interest-bearing receivables from subsidiaries, etc. 18,532 7,697
14 Derivatives 290 59
Other receivables 20 425
Financial non-current assets, etc. 32,430 39,643
8 Deferred tax - 99
Total non-current assets 32,434 41,347
Inventories - 38
Trade receivables 53 173
Tax receivables 223 197
15 Interest-bearing receivables from subsidiaries, etc. 4,992 4,493
14 Derivatives 94 267
Other receivables 117 44
Other receivables from subsidiaries, etc. 442 454
Prepayments 72 41
Receivables, etc. 5,993 5,669
Securities - 1
Cash and bank balances 686 2,060
9 Assets held for sale 6,893 -
Total current assets 13,572 7,768
Total assets 46,006 49,115
Equity & liabilities
Note 2017 2016
10 Share capital 3,774 3,774
Reserves 17,172 16,728
Total equity 20,946 20,502
12 Borrowings, non-current 11,687 9,772
13 Provisions - 1,335
14 Derivatives 141 513
8 Deferred tax 74 97
Other non-current liabilities 215 1,945
Total non-current liabilities 11,902 11,717
12 Borrowings, current 1,705 1,389
12 Interest bearing debt to subsidiaries, etc. 10,583 14,168
13 Provisions - 122
Trade payables 67 170
Tax payables 197 173
14 Derivatives 165 429
Other payables 413 379
Other payables to subsidiaries, etc. 25 52
Deferred income 3 14
Other current liabilities 870 1,339
Total current liabilities 13,158 16,896
Total liabilities 25,060 28,613
Total equity and liabilities 46,006 49,115
Amounts in USD million
110 A.P. Møller - Mærsk A /S | Annual Report 2017
PARENT COMPANY FINANCIAL STATEMENTS — NOTES OVERVIEWFINANCIALS PARENT COMPANY FINANCIAL STATEMENTS

Cash flow statement Statement of changes in equity
Note 2017 2016
Profit before financial items -560 -114
6,9 Depreciation, amortisation and impairment losses, net 1 -
3 Gain on sale of companies and non-current assets, etc., net 386 -54
19 Change in working capital -31 76
Other non-cash items -80 -30
Cash from operating activities before financial items and tax -284 -122
Dividends received 539 451
Financial income received 624 688
Financial expenses paid -739 -706
Taxes paid 158 -234
Cash flow from operating activities 298 77
Purchase of property, plant and equipment -5 -4
Acquisition of and capital increases in subsidiaries and activities -23 -76
Sale of subsidiaries and associates 1,397 -
Other financial investments, net 872 438
Cash flow used for capital expenditure 2,241 358
Purchase/sale of securities, trading portfolio - 703
Cash flow used for investing activities 2,241 1,061
Repayment of borrowings -1,630 -885
Proceeds from borrowings 3,318 2,791
Purchase of own shares - -475
Sale of own shares 14 2
Dividends distributed -454 -953
Movements in interest-bearing loans to/from subsidiaries, etc., net -5,252 -1,861
Cash flow from financing activities -4,004 -1,381
Net cash flow from continuing operations -1,465 -243
9 Net cash flow from discontinued operations - -3
Net cash flow for the year -1,465 -246
Cash and cash equivalents 1 January 2,013 2,387
Currency translation effect on cash and cash equivalents 134 -122
Cash and cash equivalents 31 December 682 2,019
Note 2017 2016
Cash and cash equivalents
Cash and bank balances 686 2,060
Overdrafts 4 41
Cash and cash equivalents 31 December 682 2,019
Share capital
Reserve for other
equity in-vestments
Reserve for hedges
Retained earnings
Total equity
Equity at 1 January 2016 3,906 -208 -55 18,913 22,556
Other comprehensive income, net of tax - -27 55 - 28
Profit/loss for the year - - - -652 -652
Total comprehensive income for the year - -27 55 -652 -624
Dividends to shareholders - - - -953 -953
11 Value of share-based payments - - - -4 -4
10 Purchase of own shares - - - -475 -475
10 Sale of own shares - - - 2 2
10 Capital increases and decreases -132 1 - - 132 1 -
Total transactions with shareholders -132 - - -1,298 -1,430
Equity 31 December 2016 3,774 -235 - 16,963 20,502
2017
Other comprehensive income, net of tax - 112 22 - 134
Profit/loss for the year - - - 760 760
Total comprehensive income for the year - 112 22 760 894
Dividends to shareholders - - - -454 -454
11 Value of share-based payments - - - -10 -10
10 Sale of own shares - - - 14 14
15 Transfer of loss on disposal of equity investments at FVOCI to retained earnings - 123 - -123 -
Total transactions with shareholders - 123 - -573 -450
Equity 31 December 2017 3,774 - 22 17,150 20,946
1 At the Annual General Meeting of A.P. Møller - Mærsk A/S on 12 April 2016, the shareholders decided on
the cancellation of treasury shares, whereby the share capital has decreased by a transfer of reserves to
retained earnings.
Amounts in USD million
111 A.P. Møller - Mærsk A /S | Annual Report 2017
PARENT COMPANY FINANCIAL STATEMENTS — NOTES OVERVIEWFINANCIALS PARENT COMPANY FINANCIAL STATEMENTS

Notes Note 1Revenue . . . . . . . . . . . . . . . . . . . . . . . . . . . . . . . . . . . . . . . . . . . . . . . . . . . . . . . . . . . . . . . . . . . . . . . . . . . . . . . . . . . . . . 113
Note 2Operating costs . . . . . . . . . . . . . . . . . . . . . . . . . . . . . . . . . . . . . . . . . . . . . . . . . . . . . . . . . . . . . . . . . . . . . . . . . 113
Note 3 Gain on sale of companies and non-current
assets, etc., net . . . . . . . . . . . . . . . . . . . . . . . . . . . . . . . . . . . . . . . . . . . . . . . . . . . . . . . . . . . . . . . . . . . . . . . . . . 114
Note 4 Financial income and expenses . . . . . . . . . . . . . . . . . . . . . . . . . . . . . . . . . . . . . . . . . . . . 114
Note 5Tax . . . . . . . . . . . . . . . . . . . . . . . . . . . . . . . . . . . . . . . . . . . . . . . . . . . . . . . . . . . . . . . . . . . . . . . . . . . . . . . . . . . . . . . . . . . . . . . . 115
Note 6Property, plant and equipment . . . . . . . . . . . . . . . . . . . . . . . . . . . . . . . . . . . . . . . . . . . . . . 115
Note 7 Investments in subsidiaries and
associated companies . . . . . . . . . . . . . . . . . . . . . . . . . . . . . . . . . . . . . . . . . . . . . . . . . . . . . . . . . . . . 116
Note 8Deferred tax . . . . . . . . . . . . . . . . . . . . . . . . . . . . . . . . . . . . . . . . . . . . . . . . . . . . . . . . . . . . . . . . . . . . . . . . . . . . . . . 116
Note 9 Discontinued operations and assets held for sale . . . . . . . . . . . 117
Note 10Share capital . . . . . . . . . . . . . . . . . . . . . . . . . . . . . . . . . . . . . . . . . . . . . . . . . . . . . . . . . . . . . . . . . . . . . . . . . . . . . . 117
Note 11Share-based payment . . . . . . . . . . . . . . . . . . . . . . . . . . . . . . . . . . . . . . . . . . . . . . . . . . . . . . . . . . . . . 118
Note 12Borrowings and net debt reconciliation . . . . . . . . . . . . . . . . . . . . . . . . . . . . . . 121
Note 13Provisions . . . . . . . . . . . . . . . . . . . . . . . . . . . . . . . . . . . . . . . . . . . . . . . . . . . . . . . . . . . . . . . . . . . . . . . . . . . . . . . . . . . 121
Note 14Derivatives . . . . . . . . . . . . . . . . . . . . . . . . . . . . . . . . . . . . . . . . . . . . . . . . . . . . . . . . . . . . . . . . . . . . . . . . . . . . . . . . . . 122
Note 15 Financial instruments by category . . . . . . . . . . . . . . . . . . . . . . . . . . . . . . . . . . . . . . . 123
Note 16Financial risks, etc. . . . . . . . . . . . . . . . . . . . . . . . . . . . . . . . . . . . . . . . . . . . . . . . . . . . . . . . . . . . . . . . . . . . 125
Note 17Commitments . . . . . . . . . . . . . . . . . . . . . . . . . . . . . . . . . . . . . . . . . . . . . . . . . . . . . . . . . . . . . . . . . . . . . . . . . . . 127
Note 18Contingent liabilities . . . . . . . . . . . . . . . . . . . . . . . . . . . . . . . . . . . . . . . . . . . . . . . . . . . . . . . . . . . . . . . . 127
Note 19 Cash flow specifications . . . . . . . . . . . . . . . . . . . . . . . . . . . . . . . . . . . . . . . . . . . . . . . . . . . . . . . . . 128
Note 20Related parties . . . . . . . . . . . . . . . . . . . . . . . . . . . . . . . . . . . . . . . . . . . . . . . . . . . . . . . . . . . . . . . . . . . . . . . . . . 129
Note 21 Significant accounting policies . . . . . . . . . . . . . . . . . . . . . . . . . . . . . . . . . . . . . . . . . . . . . 130
Note 22 Significant accounting estimates
and judgements . . . . . . . . . . . . . . . . . . . . . . . . . . . . . . . . . . . . . . . . . . . . . . . . . . . . . . . . . . . . . . . . . . . . . . . . 131
Parent company financial statements
Activities comprise other shipping. Also, holding of shares
in subsidiaries and associated companies, as well as funding,
procurement and cash management are included in the
parent company’s activities.
The parent company disposed the oil and gas activities in the
Danish sector of the North Sea and four drilling rigs. Both activ-
ities were transferred to subsidiaries as part of separating the
energy activities and are presented as discontinued operations.
Furthermore, the subsidiary Maersk Tankers A/S was disposed.
In the parent company financial statements, shares in sub-
sidiaries and associated companies are recognised at cost, cf.
note 21, less impairment losses, and in the income statement,
dividends from subsidiaries and associated companies are
recognised as income.
The net result for the year was a profit of USD 0.8bn (loss of
USD 0.7bn), mainly due to dividends from subsidiaries while
impairment losses on subsidiaries increased due to write-
down primarily related to Maersk Drilling Holding A/S and
Maersk Supply Service A/S.
Cash flow from operating activities was USD 0.3bn (USD 0.1bn).
Total assets amounted to USD 46.0bn (USD 49.1bn) and equity
totalled USD 20.9bn (USD 20.5bn) at 31 December 2017.
Amounts in USD million
112 A.P. Møller - Mærsk A /S | Annual Report 2017
PARENT COMPANY FINANCIAL STATEMENTS — NOTES OVERVIEWFINANCIALS PARENT COMPANY FINANCIAL STATEMENTS

Revenue Operating costsNote 1 Note 2
2017 2016
Revenue from vessels 55 55
Other revenue 15 58
Total revenue 70 113
2017 2016
Rent and lease costs 67 84
Staff costs reimbursed to Rederiet A.P. Møller A/S 1 108 116Other 50 81Total operating costs 225 281
Average number of employees directly employed by the Company 2 2
1 Wages and salaries USD 100m (USD 121m), pension plan contributions USD 8m (USD 9m), other social security costs USD 0m (USD 1m) less capitalised staff costs, etc. USD 0m (USD 15m).
The Company’s share of fees and remuneration to the Executive Board 2017 2016
Fixed annual fee 5 6
Cash incentive 1 1Share-based incentive plans 1 -1Remuneration in connection with redundancy, resignation and release from duty to work - 15Lump sum retirement payment - -1Total remuneration to the Executive Board 7 20
Contract of employment for the Executive Board contains terms customary in Danish listed companies, including termination notice and competition clauses. In connection with a possible takeover offer, nei-ther the Executive Board nor the Board of Directors will receive special remuneration. Fees and remunera-tion do not include pension.
The Board of Directors has received fees of USD 3m (USD 3m).
Fees to the statutory auditors of A.P. Møller - Mærsk A/S 2017 2016
PricewaterhouseCoopers Statsautoriseret Revisionspartnerselskab
Statutory audit 1 1Other assurance services - - Tax and VAT advisory services 0 0Other services 2 1Total fees 3 2
Fees for other services than statutory audit of the financial statements provided by Pricewaterhouse-Coopers Statsautoriseret Revisionspartnerselskab to A.P. Møller - Mærsk A/S mainly consist of audit of non-statutory financial statements, financial due diligence and transaction advice, accounting advisory services, tax advice and other services related to separating discontinued operations, review of the in-terim report and other advisory accounting and tax services.
Amounts in USD million
113 A.P. Møller - Mærsk A /S | Annual Report 2017
PARENT COMPANY FINANCIAL STATEMENTS — NOTES OVERVIEWFINANCIALS PARENT COMPANY FINANCIAL STATEMENTS

Gain on sale of companies and non-current assets, etc.
Financial income and expensesNote 3 Note 4
2017 2016
Gains 67 54
Losses 453 -
Loss/gain on sale of companies and non-current assets, etc., net -386 54
Gains were sale of shares in Egyptian Drilling Company SAE. Losses were related to sale of shares in
Maersk Tankers A/S.
Gains in 2016 related to sale of shares in Danmarks Skibskredit A/S (Danish Ship Financing).
2017 2016
Interest expenses on liabilities 548 391
Interest income on loans and receivables 594 481
Interest income on securities - 2
Fair value adjustment transferred from equity hedge reserve (loss) 46 77
Fair value adjustment on issued bonds attributable to interest rate risk (gain) 33 27
Net interest income 33 42
Exchange rate gains on bank balances, borrowings and working capital 351 306
Exchange rate losses on bank balances, borrowings and working capital 632 152
Net foreign exchange losses/gains -281 154
Fair value gains from derivatives 336 222
Fair value losses from derivatives 36 336
Fair value gains from securities - 44
Net fair value gains/losses 300 -70
Dividends received from subsidiaries and associated companies, net 2,835 76
Dividends received from other securities 4 106
Total dividend income 2,839 182
Reversal of impairment losses, investments in subsidiaries and associated companies 1 105 129
Impairment losses, investments in subsidiaries and associated companies 2 2,172 1,157
Financial income/expenses, net 824 -720
Of which:
Dividends 2,839 182
Financial income 1,419 1,211
Financial expenses 3,434 2,113
1 Reversal of impairment losses relates mainly to investment in Maersk Container Industry A/S, Maersk
Aviation Holding A/S and Maersk FPSOs A/S (in 2016 Maersk Aviation Holding A/S, Damco International
A/S and Maersk Tankers A/S).
2 Impairment losses to lower recoverable amount relate mostly to investment in Maersk Drilling Holding A/S
(USD 1.9bn based on fair value less costs to sell). Furthermore, Maersk Supply Service A/S of USD 0.2bn
and A.P. Moller Finance SA were impaired (in 2016 Maersk Supply Service A/S, Maersk Container Industry
A/S and Höegh Autoliners Holdings AS). Gross dividends received from subsidiaries in 2016 of USD 359m
were offset by impairment losses of USD 283m caused by the dividend paid.
Reference is made to note 14 for an analysis of gains and losses from derivatives.
Refer to note 22 for significant accounting estimates.
Amounts in USD million
114 A.P. Møller - Mærsk A /S | Annual Report 2017
PARENT COMPANY FINANCIAL STATEMENTS — NOTES OVERVIEWFINANCIALS PARENT COMPANY FINANCIAL STATEMENTS

TaxNote 5
2017 2016
Tax recognised in the income statement
Current tax on profit for the year -54 -31
Adjustment of tax provision -5 7
Adjustment for current tax of prior periods -63 4
Withholding taxes 11 5
Total current tax -111 -15
Origination and reversal of temporary differences 15 26
Adjustment for deferred tax of prior periods 7 12
Write-down of deferred tax assets - -1
Total deferred tax 22 37
Total tax expense -89 22
Tax reconciliation:
Profit/loss before tax 264 -834
Tax using the Danish corporation tax rate (2017: 22%, 2016: 22%) 58 -183
Non-deductible expenses 15 10
Gains related to shares, dividends, etc. -80 174
Adjustment to previous years’ taxes -70 26
Deferred tax asset not recognised - -1
Adjustment of tax provision -5 7
Other differences, net -7 -11
Total income tax -89 22
Tax recognised in other comprehensive income and equity -10 19
Of which:
Current tax -10 19
Property, plant and equipmentNote 6
Production facilities
and equip-ment, etc.
Rigs Construction work in pro-
gress and payment on
account
Total
Cost
1 January 2016 6,547 976 156 7,679
Addition 47 - 132 179
Transfer 176 - -176 -
31 December 2016 6,770 976 112 7,858
Addition - - 64 64
Disposal 6,879 976 62 7,917
Transfer 114 - -114 -
31 December 2017 5 - - 5
Depreciation and impairment losses
1 January 2016 5,447 516 - 5,963
Depreciation 187 50 - 237
Impairment losses - 53 1 - 53
31 December 2016 5,634 619 - 6,253
Depreciation 159 16 - 175
Reversal of impairment losses 235 - - 235
Disposal 5,557 635 - 6,192
31 December 2017 1 - - 1
Carrying amount:
31 December 2016 1,136 357 112 1,605
31 December 2017 4 - - 4
1 Impairment losses 2016 were related to one drilling rig, based on a recoverable amount of USD 0.
Operating leases as lessor
Property, plant and equipment included assets that were leased out as part of the Company’s activities.
The future lease income is USD 0m (USD 96m) of which USD 0m (USD 67m) is receivable within one year,
and USD 0m (USD 29m) between one and five years.
Pledges
Vessels, rigs and containers, etc., owned by subsidiaries with a carrying amount of USD 1.5bn (USD 1.6bn)
have been pledged as security for loans of USD 0.7bn (USD 0.9bn).
Amounts in USD million
115 A.P. Møller - Mærsk A /S | Annual Report 2017
PARENT COMPANY FINANCIAL STATEMENTS — NOTES OVERVIEWFINANCIALS PARENT COMPANY FINANCIAL STATEMENTS

Investments in subsidiaries and associated companies
Note 7
Investments in subsidiaries
Investments in associated
companies
2017 2017
Cost
1 January 2016 33,599 799
Addition1 1,306 -
31 December 2016 34,905 799
Addition2 846 -
Return of capital2 8,000 -
Disposal3 2,483 4
Transfer, assets held for sale4 9,926 -
31 December 2017 15,342 795
Impairment losses
1 January 2016 3,246 444
Impairment losses5 1,290 150
Disposal 0 -
Reversal of impairment losses 127 2
31 December 2016 4,409 592
Impairment losses5 2,172 -
Disposal 1,496 -
Reversal of impairment losses 105 -
Transfer, assets held for sale4 3,023 -
31 December 2017 1,957 592
Carrying amount:
31 December 2016 30,496 207
31 December 2017 13,385 203
1 Additions in 2016 are capital increases in Maersk Drilling Holding A/S USD 1.2bn (non-cash) and Maersk Container Industry A/S.
2 Additions in 2017 are capital increases in Maersk Drilling Holding A/S USD 0.3bn and Mærsk Olie og Gas A/S USD 0.5bn, both non-cash. Shares in these companies are transferred to assets held for sale. Further-more, capital has been increased in Maersk Training A/S and Fromtu A/S. Maersk A/S has returned USD 8bn in a non-cash transaction.
3 Shares in the subsidiary Maersk Tankers A/S and in the associated company Egyptian Drilling Company SAE were disposed.
4 All shares in companies related to energy business were transferred to assets held for sale.5 Impairments are recognised when the carrying amount exceeds recoverable amount as described in
notes 4, 21 and 22.
Reference is made to pages 141-143 for a list of significant subsidiaries and associated companies.
Deferred taxNote 8
Recognised deferred tax assets and liabilities are attributable to the following:
Assets Liabilities Net liabilities
2017 2016 2017 2016 2017 2016
Property, plant and equipment - 10 - 47 - 37
Inventories - - - 30 - 30
Provisions, etc. - 20 - - - -20
Liabilities, etc. - - 74 50 74 50
Tax loss carry forwards - 100 - - - -100
Other - 1 - 2 - 1
Total - 131 74 129 74 -2
Offsets - -32 - -32 - -
Total - 99 74 97 74 -2
Change in deferred tax, net during the year 2017 2016
1 January -2 -302
Disposal 54 -
Recognised in the income statement 22 1 300
31 December 74 -2
1 Relating to continued operations.
Unrecognised deferred tax assets
No tax assets are not recognised. Tax assets of USD 245m, mainly relating to provisions, were not rec-
ognised in 2016.
There are no significant unrecognised tax liabilities on investments in subsidiaries, associated companies
and joint ventures.
Amounts in USD million
116 A.P. Møller - Mærsk A /S | Annual Report 2017
PARENT COMPANY FINANCIAL STATEMENTS — NOTES OVERVIEWFINANCIALS PARENT COMPANY FINANCIAL STATEMENTS

Discontinued operations and assets held for sale
Share capitalNote 9 Note 10
The parent company transferred in 2017 the oil and gas activities in the Danish sector of the North Sea
and four drilling rigs to fully owned subsidiaries. As a result, these activities have been reclassified as
discontinued operations. The reclassification reflects the ongoing process on determining the structural
solution for separation of the energy related businesses from A.P. Moller - Maersk, where solution remains
to be defined before the end of 2018.
Shares in the subsidiaries Mærsk Olie og Gas A/S, Maersk Drilling Holding A/S and Maersk Supply Service A/S
are furthermore presented as assets held for sale, measured at cost price less write-downs.
The activities were transferred at carrying value of the net assets, hence the transfers did not result in any
gains/losses.
2017 2016
Profit for the year – discontinued operations
Revenue 867 932
Expenses 317 346
Depreciation, amortisation and impairment losses, net -60 290
Financial items, net -25 -30
Profit/loss before tax, etc. 585 266
Tax 1 178 62
Profit/loss for the year – discontinued operations 407 204
Cash flows from discontinued operations for the year
Cash flow from operating activities 254 212
Cash flow used for investing activities -60 -143
Cash flow from financing activities -194 -72
Net cash flow from discontinued operations - -3
Balance sheet items comprise:
Non-current assets 6,893 -
Assets held for sale 6,893 -
1 The tax relates to the profit from the ordinary activities of discontinued operations.
At the Annual General Meeting of A.P. Møller - Mærsk A/S on 12 April 2016, the shareholders decided on
the cancellation of 728,520 treasury shares, whereby the share capital has decreased. The cancellation of
the shares took place in Q2 2016.
Development in the number of shares:
A shares of B shares of Nominal value
DKK 1,000
DKK 500
DKK 1,000
DKK 500
DKK million
USD million
1 January 2016 10,902,341 318 10,642,790 184 21,545 3,906
Cancellation 146,122 - 582,398 - 728 132
Conversion 2 -4 - - - -
31 December 2016 10,756,221 314 10,060,392 184 20,817 3,774
Conversion 41 -82 6 -12 - -
31 December 2017 10,756,262 232 10,060,398 172 20,817 3,774
All shares are fully issued and paid up.
One A share of DKK 1,000 holds two votes. B shares have no voting rights.
Shareholder disclosure subject to section 104 of the Danish Financial Statements Act:
Share capital
Votes
A.P. Møller Holding A/S, Copenhagen, Denmark 41.51% 51.23%
A.P. Møller og Hustru Chastine Mc-Kinney Møllers Familiefond, Copenhagen, Denmark 8.84% 13.12%
Den A.P. Møllerske Støttefond, Copenhagen, Denmark 3.11% 5.99%
Note 10 in the consolidated financial statements includes rules for changing the share capital, and infor-
mation regarding the authorisation of the Board of Directors to acquire own shares as well as the total
number of own shares held by the Group.
Amounts in USD million
117 A.P. Møller - Mærsk A /S | Annual Report 2017
PARENT COMPANY FINANCIAL STATEMENTS — NOTES OVERVIEWFINANCIALS PARENT COMPANY FINANCIAL STATEMENTS

Development in the holding of own shares:
No. of shares of DKK 1,000
Nominal value DKK million
% of share capital
Own shares 2017 2016 2017 2016 2017 2016
A shares
1 January - 69,585 - 70 - 0.32%
Addition - 76,537 - 76 - 0.36%
Cancellation - 146,122 - 146 - 0.68%
31 December - - - - - 0.00%
B shares
1 January 77,642 361,409 78 361 0.37% 1.68%
Addition - 306,278 - 306 - 1.42%
Cancellation - 582,398 - 582 - 2.70%
Disposal 16,803 7,647 17 7 0.08% 0.03%
31 December 60,839 77,642 61 78 0.29% 0.37%
Disposals of own shares are primarily related to the share option programme.
Share capitalNote 10 — continued
Share-based paymentNote 11
Equity-settled incentive plans (excluding share option plans)
A.P. Moller - Maersk has two different equity-settled incentive plans. The Restricted Shares Plan was intro-
duced in 2013, and grants have been awarded to employees on a yearly basis since 2013. In 2014, the Group
established a three-year Performance Shares Plan for members of the Executive Board and other employees.
The transfer of restricted and performance shares is contingent upon the employee still being employed
and not being under notice of termination and takes place when three years have passed from the time
of granting. Transfer of the performance shares to members of Executive Board was further contingent
upon the member still being employed in A.P. Moller - Maersk at the time of publishing of the Annual Report
2016 for A.P. Møller - Mærsk A/S.
The actual transfer of performance shares was further contingent upon the degree of certain financial
goals being achieved. This meant that the number of shares that eventually would vest was adjusted
during the vesting period.
The members of the Executive Board as well as other employees are not entitled to any dividends during
the vesting period. Special conditions apply regarding illness, death and resignation as well as changes in
the Company’s capital structure, etc. A.P. Møller - Mærsk A/S’ holding of own B shares will be used to meet
the Company’s obligations in connection with the Restricted Shares Plan.
Restricted Shares Plan
Performance Shares Plan
Performance Shares Plan
Total fair value 1
Outstanding awards under equity-settled incentive plans (excl. share option plans)
Employees 1 Members of the Executive
Board 1
Employees 1
No. No. No. USD million
1 January 2016 14,104 1,860 12,099
Granted 7,078 20 395 10
Exercised 5,730 - -
Adjustment 2 - -620 -11,339
Forfeited 385 1,260 312
Outstanding 31 December 2016 15,067 - 843
Granted 5,024 - 66 8
Exercised 4,591 - 842
Adjustment 2 - - -67
Forfeited 968 - -
Outstanding 31 December 2017 14,532 - -
1 At the time of grant.
2 Primarily due to changes in the degree of certain financial goals being achieved.
Amounts in USD million
118 A.P. Møller - Mærsk A /S | Annual Report 2017
PARENT COMPANY FINANCIAL STATEMENTS — NOTES OVERVIEWFINANCIALS PARENT COMPANY FINANCIAL STATEMENTS

Share-based paymentNote 11 — continued
The fair value of restricted shares (A.P. Møller - Mærsk A/S B shares) granted to 132 (140) employees was
USD 8 m (USD 9m) at the time of grant. The total value of granted restricted shares recognised in the
income statement is USD 1 m (USD 2m).
The fair value of performance shares (A.P. Møller - Mærsk A/S B shares) granted to no (1) members of the
Executive Board and to two (16) employees was USD 0 m (USD 1m). The total value of granted performance
shares recognised in the income statement is USD 0m (cost USD 4m).
The fair value per restricted share at the time of grant is DKK 11,550 (DKK 8,463), which is equal to the volume
weighted average share price on the date of grant, i.e. 1 April 2017.
On 1 April 2017, the restricted shares originally granted in 2014 were settled with the employees. The weighted
average share price at that date was DKK 11,550.
The average remaining contractual life for the restricted shares as per 31 December 2017 is 1.3 years (1.4 years).
Cash-settled incentive plan
In 2015, A.P. Moller - Maersk introduced the Performance Shares Plan to a broader range of employees.
The actual settlement of the awards is contingent upon the degree of certain financial goals being achieved,
the employee still being employed and not being under notice of termination at the date of settlement.
This means that the number of awards that eventually will vest may be adjusted during the vesting period.
Depending on the agreement, the settlement will take place two or three years after the initial granting and
the employee may have the option to settle the awards in shares.
The employees are not entitled to any dividends during the vesting period. Special conditions apply
regarding illness, death and resignation as well as changes in the Company’s capital structure, etc.
Outstanding awards under cash- settled performance share plan
Employees 1 Total fair value 1 Carrying amount of liabilities
No. USD million USD million
1 January 2016 8,816
Granted 435 1
Adjustment 2 -8,686
Forfeited 565
Outstanding 31 December 2016 - -
Granted 780
Adjustment 2 -780
Outstanding 31 December 2017 0 -
1 At the time of grant.
2 Due to changes in the degree of certain financial goals being achieved.
The fair value of awards granted to 42 (27) employees was USD 0 m (USD 1 m) at the time of grant. The
total value of the awards recognised in the income statement is USD 0 m (cost USD 3m).
The average remaining contractual life for the cash-settled incentive plan as per 31 December 2017 is 0.3
years (1.1 years).
Share option plans
In addition to the plans described above, A.P.Møller - Mærsk has Share Option Plans for members of the
Executive Board and other employees. Each share option granted is a call option to buy an existing B share
of nominal DKK 1,000 in A.P. Møller - Mærsk A/S.
The share options are granted at an exercise price corresponding to 110% of the average of the market
price on the first five trading days following the release of A.P. Møller - Mærsk A/S’ Annual Report. Exercise
of the share options is contingent upon the option holder still being employed at the time of exercise. The
share options can be exercised when at least two years (three years for share options granted to Executive
Board members) and no more than seven years (six years for share options granted to employees not
members of the Executive Board) have passed from the time of grant. Special conditions apply regarding
illness, death and resignation as well as changes in the Company’s capital structure, etc.
Amounts in USD million
119 A.P. Møller - Mærsk A /S | Annual Report 2017
PARENT COMPANY FINANCIAL STATEMENTS — NOTES OVERVIEWFINANCIALS PARENT COMPANY FINANCIAL STATEMENTS

Share-based paymentNote 11 — continued
Members of the
Executive Board 1
Employees 1 Total Average exercise
price
Total fair value 1
No. No. No. DKK USD million
1 January 2016 7,715 15,200 22,915 8,975
Exercised - 1,880 1,880 8,298
Expired 3,875 5,685 9,560 9,919
Outstanding 31 December 2016 3,840 7,635 11,475 8,298
Exercisable 31 December 2016 3,840 7,635 11,475 8,298
Granted 4,928 20,839 25,767 12,791 8
Exercised 3,840 7,530 11,370 8,298
Expired - 105 105 8,298
Forfeited - 237 237 12,791
Outstanding 31 December 2017 4,928 20,602 25,530 12,791
Exercisable 31 December 2017 - - - - -
1 At the time of grant.
The share options can only be settled in shares. A.P. Møller - Mærsk A/S’ holding of own B shares will be
used to meet the Company’s obligations in connection with the share option plans.
The fair value of awards granted to three members of the Executive Board and 79 employees was USD 8m
(USD 0m) at the time of grant. The total value of granted share options recognised in the income state-
ment is USD 1m (USD 0m).
The weighted average share price at the dates of exercise of share options was DKK 11,778 (DKK 10,154).
The average remaining contractual life as per 31 December 2017 is 6.1 years (0.3 years) and the exercise
price for outstanding share options is DKK 12,791 (DKK 8,298).
The fair value per option granted in 2017 to members of the Executive Board is calculated at DKK 2,130
at the time of grant, based on Black & Scholes’ option pricing model. The fair value per option granted in
2017 to employees not members of the Executive Board is calculated at DKK 2,281 at the time of grant
based on the same option pricing model.
The following principal assumptions are used in the valuation:
Share options granted to
members of the Executive Board
Share options granted to
employees not members of the Executive Board
Share price, five days volume weighted average after publication of Annual Report, DKK 11,628 11,628
Exercise price, DKK 12,791 12,791
Expected volatility (based on historic volatility) 31% 31%
Expected term 5.00 5.75
Expected dividend per share, DKK 300 300
Risk free interest rate -0.12% 0.01%
Amounts in USD million
120 A.P. Møller - Mærsk A /S | Annual Report 2017
PARENT COMPANY FINANCIAL STATEMENTS — NOTES OVERVIEWFINANCIALS PARENT COMPANY FINANCIAL STATEMENTS

ProvisionsNote 13
Abandon-ment
Legal disputes,
etc.
Other Total
1 January 2017 1,366 87 4 1,457
Provision made - - 8 8
Amount used 13 77 8 98
Amount reversed - 10 - 10
Disposal 1,384 - 4 1,388
Unwind of discount 31 - - 31
31 December 2017 - - - -
Legal disputes, etc., include tax and duty disputes among other things. Other includes provisions for
unsettled claims and onerous contracts.
Reversals of provisions primarily relate to legal disputes, tax and duty disputes and contractual disagree-
ments, which are recognised in the income statement under operating costs and tax.
Borrowings and net debt reconciliation
Note 12
Net debt as at
31 December
Cash flow Foreign exchange
movements
Other changes
Net debt as at
31 December
2016 Other1 2017
Bank and other credit institutions 3,064 2,522 2 - 5,588
Issued bonds 8,097 -872 603 -24 7,804
Subsidiaries, etc., net 1,978 -5,252 -179 -9,488 -12,941
Total borrowings, net 13,139 -3,602 426 -9,512 451
Derivatives hedge of borrowings, net 719 -224 -603 -2 -110
Borrowings classification:
Classified as non-current 9,772 11,687
Classified as current 15,557 12,288
1 Non-cash dividends, capital increases, etc.
As at 31 December 2017, USD 0.8bn of the Company’s borrowings, which include change of control clauses
and negative pledges relating to assets such as supply vessels and drilling rigs which are classified as held
for sale, have been reclassified to current despite the loans falling due after one year. The terms of the loans
require immediate repayment on sale or change of control.
Amounts in USD million
121 A.P. Møller - Mærsk A /S | Annual Report 2017
PARENT COMPANY FINANCIAL STATEMENTS — NOTES OVERVIEWFINANCIALS PARENT COMPANY FINANCIAL STATEMENTS

Fair value
2017 2016
Held for trading
Currency derivatives -25 -36
Interest derivatives -1 2
Total -26 -34
The hedges are expected to be highly effective due to the nature of the economic relation between the
exposure and the hedge. The source of ineffectiveness is the credit risk of the hedging instruments.
For hedges where cost of hedging is applied, the forward points and change in basis spread are recognised
in other comprehensive income and transferred with the effective hedge when the hedged transaction
occurs. The cost of hedging reserve amounts to USD 6m (negative).
For information about risk management strategy, currencies, maturities, etc., reference is made to note 16.
Hedge of borrowings
Cross currency swaps are used to swap all non-USD issued bonds. Fixed to floating rate swaps are
designated as a combination of fair value and cash flow hedges. The principal amounts are: EUR 1,835m,
GBP 95m, JPY 200m, SEK 171m and NOK 268m. The remaining swaps are fixed to fixed rate or floating to
fixed rate swaps and are designated as cash flow hedges of currency and interest risk.
The hedge ratio is 1:1. The maturity of the hedge instrument 0-5 years (USD equivalents): EUR 3,419m,
GBP 32m, JPY 89m, SEK 305m and NOK 244m. 5-10 years: GBP 405m, JPY 111m and NOK 390m. Above
10 years: EUR 96m.
Cross currency swaps are designated as a combination of hedge of principal cash flows and hedge of
interests at a weighted average interest rate of 3.7%.
The carrying amount of the borrowings in fair value hedge relation is USD 3,069m and the accumulated
fair value adjustment of the loans is USD 28m (negative). The loss on the hedging instrument in fair value
hedges recognised in the income statement for the year amounts to USD 33m (loss of USD 21m) and the
gain on hedged item amounts to USD 33m (gain of USD 27m).
Interest rate swaps are all denominated in USD and pay floating interest rates. The hedge ratio is 1:1.
For hedges related to borrowings, USD 32m is recognised in other comprehensive income and the cash
flow hedges reserve is USD 32m.
Reference is made to Statement of other comprehensive income.
DerivativesNote 14
Hedges comprise primarily currency derivatives and interest rate derivatives. Foreign exchange forwards
and option contracts are used to hedge the currency risk related to recognised and unrecognised trans-
actions. Interest rate swaps are used to hedge interest rate exposure on borrowings.
2017 2016
Non-current receivables 290 59
Current receivables 94 267
Non-current liabilities 141 513
Current liabilities 165 429
Assets/liabilities, net 78 -616
The fair value of derivatives held at the balance sheet date can be allocated by type as follows:
Fair value, asset
Fair value, liability
Nominal amount of derivative
Fair value, asset
Fair value, liability
Nominal amount of derivative
2017 2017 2017 2016 2016 2016
Hedge of borrowings
Cross currency swaps
EUR 240 16 3,515 10 361 3,614
GBP 2 37 437 - 78 370
JPY 7 14 200 5 17 192
SEK - 68 305 - 95 276
NOK 6 10 634 - 42 603
Interest rate swaps
Fair value hedges - 6 500 - 4 500
Total 255 151 15 597
Amounts in USD million
122 A.P. Møller - Mærsk A /S | Annual Report 2017
PARENT COMPANY FINANCIAL STATEMENTS — NOTES OVERVIEWFINANCIALS PARENT COMPANY FINANCIAL STATEMENTS

DerivativesNote 14 — continued
Financial instruments by categoryNote 15
Carrying amount
Fair value
Carrying amount
Fair value
2017 2017 2016 2016
Carried at amortised cost
Interests bearing receivables from subsidiaries, etc. 23,524 23,524 12,190 12,190
Finance lease receivables 10 10 10 10
Other interest-bearing receivables and deposits 1 1 1 1
Total interest-bearing receivables 23,535 23,535 12,201 12,201
Trade receivables 53 173
Other receivables (non-interest-bearing) 116 458
Other receivables from subsidiaries, etc. 442 454
Cash and bank balances 686 2,060
Financial assets at amortised cost 24,832 15,346
Derivatives 384 384 326 326
Contingent considerations 10 10 - -
Carried at fair value through profit/loss
Shares - - 1 1
Carried at fair value through other comprehensive income
Other equity investments (available-for-sale) - - 759 759
Equity investments (FVOCI)1 - - - -
Other financial assets 394 394 1,086 1,086
Total financial assets 25,226 16,432
Carried at amortised cost
Bank and other credit institutions 5,588 5,750 3,064 3,188
Issued bonds 7,804 8,020 8,097 8,244
Interests bearing loans from subsidiaries etc. 10,583 10,583 14,168 14,168
Total borrowings 23,975 24,353 25,329 25,600
Trade payables 67 170
Other payables 413 379
Other payables to subsidiaries and associated companies, etc. 25 52
Financial liabilities at amortised cost 24,480 25,930
Carried at fair value
Derivatives 306 306 942 942
Financial liabilities at fair value 306 306 942 942
Total financial liabilities 24,786 26,872
1 Designated at initial recognition in accordance with IFRS 9.
Other economic hedges (no hedge accounting applied)
Furthermore, the Company enters into derivatives to hedge economic risks that are not accounted for as
hedging. These derivatives are accounted for as held for trading.
The gains/losses, including realised transactions, are recognised as follows:
2017 2016
Hedging foreign exchange risk on operating costs 1 -
Hedging foreign exchange risk on gain on sale of non-current assets, etc. - 4
Hedging interest rate risk -46 -77
Total reclassified from equity reserve for hedges -45 -73
Derivatives accounted for as held for trading:
Currency derivatives recognised directly in financial income/expenses 336 -98
Interest rate derivatives recognised directly in financial income/expenses -36 -16
Net gains/losses recognised directly in the income statement 300 -114
Total 255 -187
Amounts in USD million
123 A.P. Møller - Mærsk A /S | Annual Report 2017
PARENT COMPANY FINANCIAL STATEMENTS — NOTES OVERVIEWFINANCIALS PARENT COMPANY FINANCIAL STATEMENTS

Equity investments at fair value through other comprehensive income
After disposal of the remaining 19% share in Dansk Supermarked Group, equity investments at fair value
through other comprehensive income (FVOCI) comprise only a number of minor investments.
Disposal of the remaining 19% share in Dansk Supermarked Group
As the Salling Companies in November were able to complete the final transaction agreed on in 2014 one
year ahead of time, A.P.Møller - Mærsk A/S sold its remaining 19% share of Dansk Supermarked Group for
DKK 5.5bn equivalent to USD 871m.
The accumulated loss of USD 123m has been transferred within equity. The loss can mainly be attributed
to the development in the DKK/USD exchange rate since initial recognition.
Financial instruments measured at fair value
Financial instruments measured at fair value can be divided into three levels:
Level 1 — Quoted prices (unadjusted) in active markets for identical assets or liabilities;
Level 2 — Inputs other than quoted prices included within level 1 that are observable for the asset
or liability, either directly (i.e. as prices) or indirectly (i.e. derived from prices);
Level 3 — Inputs for the asset or liability that are not based on observable market data.
Fair value of listed shares falls within level 1 of the fair value hierarchy. Non-listed shares and other
securities fall within level 3 of the fair value hierarchy.
Fair value of derivatives falls mainly within level 2 of the fair value hierarchy and is calculated on the
basis of observable market data as of the end of the reporting period.
Fair value of level 3 assets and liabilities is primarily based on the present value of expected future cash
flows. A reasonably possible change in the discount rate is not estimated to affect the Company’s profit
or equity significantly.
Financial instruments carried at amortised cost
Fair value of the short-term financial assets and other financial liabilities carried at amortised cost is not
materially different from the carrying amount. In general, fair value is determined primarily based on
the present value of expected future cash flows. Where a market price was available, however, this was
deemed to be the fair value.
Fair value of listed issued bonds is within level 1 of the fair value hierarchy. Fair value of the remaining
borrowing items is within level 2 of the fair value hierarchy and is calculated on the basis of discounted
interests and instalments.
The closing balance in 2017 comprises minor equity investments recognised in other comprehensive
income.
Movement during the year in level 3
Non-listed shares Contingent Conside-
ration
Total financial
assets
Equity Investments
(FVOCI) 1
Held for trading
Carrying amount 1 January 2016 838 1 839
Disposal 103 - 103
Gains recognised in other comprehensive income 24 - 24
Carrying amount 31 December 2016 759 1 760
Addition - - 28 28
Disposal 871 1 - 872
Gains/losses recognised in the income statement - - -18 -18
Gains/losses recognised in other comprehensive income 112 - - 112
Carrying amount 31 December 2017 - - 10 10
1 Designated at initial recognition in accordance with IFRS 9 (available-for-sale in 2016).
The 2016 valuation is tested against a combination of valuation methodologies taking into account
both the retail operations as well as the real estate portfolio owned by Dansk Supermarked Group. The
valuation is assessed using both a discounted cash flow model with reference to selected listed peers and
real estate yields. The discounted cash flow model relies on a discount rate of 6.5% reflecting a weighted
average of an assumed discount rate for the retail business and an assumed yield for the real estate busi-
ness as well as a long-term terminal growth rate of 2%.
Financial instruments by categoryNote 15 — continued
Amounts in USD million
124 A.P. Møller - Mærsk A /S | Annual Report 2017
PARENT COMPANY FINANCIAL STATEMENTS — NOTES OVERVIEWFINANCIALS PARENT COMPANY FINANCIAL STATEMENTS

The Company’s activities expose it to a variety of financial risks: market risks, i.e. currency risk and interest
rate risk, credit risk and liquidity risk. The Company’s overall risk management programme focuses on the
unpredictability of financial markets and seeks to minimise the potential adverse effects on the Company’s
financial performance. The Company uses derivative financial instruments to hedge certain risk exposures.
Risk management is carried out by a central finance department under policies approved by the Board of
Directors. The finance department identifies, evaluates and hedges financial risks in close cooperation
with the Company’s businesses.
Market risk
Market risk is the risk that changes in market prices, such as foreign exchange rates and interest rates,
will affect the Company’s profit or the value of its holdings of financial instruments. Below sensitivity
analyses relate to the position of financial instruments at 31 December 2017.
The sensitivity analyses for currency risk and interest rate risk have been prepared on the basis that the
amount of net debt, the ratio of fixed to floating interest rates of the debt and the proportion of financial
instruments in foreign currencies remain unchanged from hedge designations in place at 31 December
2017. Furthermore, it is assumed that the exchange rate and interest rate sensitivities have a symmetric
impact, i.e. an increase in rates results in the same absolute movement as a decrease in rates.
The sensitivity analyses show the effect on profit or loss and equity of a reasonably possible change in
exchange rates and interest rate.
Currency risk
The Company’s currency risk arises due to income from shipping and oil-related activities are being de-
nominated mainly in USD, while the related expenses are incurred in both USD and a wide range of other
currencies such as DKK, EUR, CNY and GBP. Overall, the Company has net income in USD and net expenses
in most other currencies. After the Company’s disposal of the oil activities to a subsidiary, the net income
currency exposure is reduced. As the net income is in USD, this is also the primary financing currency. The
majority of the Company’s borrowings is thus in USD.
The main purpose of hedging the Company’s currency risk is to hedge the USD value of the Company’s
net cash flow and reduce fluctuations in the Company’s profit. The Company uses various financial de-
rivatives, including forwards, option contracts and cross-currency swaps, to hedge these risks. The key
aspects of the currency hedging policy are as follows:
• Net cash flows in other significant currencies than USD are hedged using a layered model with
a 12-month horizon;
• Significant capital commitments in other currencies than USD are hedged;
• Most non-USD debt is hedged, however, depending on the asset-liability match and the currency of
the generated cash flow.
Financial risks, etc.Note 16
An increase in the USD exchange rate of 10% against all other significant currencies to which the Com-
pany is exposed is estimated to have an impact on the Company’s profit before tax by USD -0.1bn (USD
-0.1bn) and the Company’s equity, excluding tax, by USD -0.1bn (USD -0.1bn). The sensitivities are based
only on the impact of financial instruments that are outstanding at the balance sheet date, cf. notes 14
and 15, and are thus not an expression of the Company’s total currency risk.
Interest rate risk
Most of the Company’s debt is denominated in USD, but part of the debt (e.g. issued bonds) is in other
currencies such as EUR, NOK, GBP and SEK. Some loans are at fixed interest rates, while others are at
floating interest rates.
The Company strives to maintain a combination of fixed and floating interest rates on its net debt,
reflecting expectations and risks. The hedging of the interest rate risk is governed by a duration range
and is primarily obtained with interest rate swaps.
A general increase in interest rates by one percentage point is estimated, all other things being equal,
to affect profit before tax and equity, excluding tax effect, negatively by approximately USD 72m and
USD 75m, respectively (negatively by approximately USD 47m and USD 19m, respectively).
This analysis assumes that all other variables, in particular foreign currency rates, remain constant.
Borrowings and interest-bearing debt to subsidiaries by interest rate levels inclusive of interest rate swaps
Next interest rate fixing
Carrying amount
0-1 year
1-5 years
5- years
2017
0-3% 16,759 14,620 1,636 503
3-6% 7,216 3,947 1,995 1,274
Total 23,975 18,567 3,631 1,777
Of which:
Bearing fixed interest 5,432
Bearing floating interest 18,543
2016
0-3% 21,122 18,643 1,475 1,004
3-6% 4,208 2,434 454 1,320
Total 25,330 21,077 1,929 2,324
Of which:
Bearing fixed interest 4,595
Bearing floating interest 20,735
Amounts in USD million
125 A.P. Møller - Mærsk A /S | Annual Report 2017
PARENT COMPANY FINANCIAL STATEMENTS — NOTES OVERVIEWFINANCIALS PARENT COMPANY FINANCIAL STATEMENTS

Financial risks, etc.Note 16 — continued
Credit risk
The Company has substantial exposure to financial and commercial counterparties but has no particular
concentration of customers or suppliers. To minimise the credit risk, financial vetting is undertaken for all
major customers and financial institutions, adequate security is required for commercial counterparties,
and credit limits are set for financial institutions and key commercial counterparties.
Financial assets at amortised cost comprise loans receivable, finance lease receivables, and other receiv-
ables. These are all considered to have low credit risk and thus the impairment provision calculated basis
of 12 month expected losses is considered immaterial. The financial assets are considered to be low risk
when they have low risk of default and the issuer has a strong capacity to meet its contractual cash flow
obligations in the near term.
A.P. Møller - Mærsk A/S applies the simplified approach to providing the expected credit losses pre-
scribed by IFRS 9, which permits the use of the lifetime expected loss provision for all trade receivables.
To measure the expected credit losses, trade receivables have been grouped based on shared credit risk
characteristics and the days past due. In accordance with IFRS 9, also non-due trade receivables have
been impaired.
Maturity analysis of trade receivables incl. subsidiaries, etc. 2017 2016
Receivables not due 6 145
Less than 90 days overdue 40 27
More than 90 days overdue 7 6
Receivables, gross 53 178
Provision for bad debt - 5
Carrying amount 53 173
Loans to subsidiaries
Other financial assets at amortised cost include loans to subsidiaries. As of 31 December 2017 the loans
amount to USD 23.5bn and are considered to have a low credit risk, thus the impairment provision to be
recognised during the period is limited to 12 months expected losses. The credit risk has not increased
significantly since the initial recognition and is considered low based on the investment grade credit
rating for the Group and consequently the financial strength of the major subsidiaries within the Group.
Liquidity risk
It is of great importance for the Company to maintain a financial reserve to cover the Company’s obligations
and investment opportunities and to provide the capital necessary to offset changes in the Com pany’s
liquidity due to changes in the cash flow from operating activities.
The flexibility of the financial reserve is subject to ongoing prioritisation and optimisation, among other
things, by focusing on release of capital and following up on the development in working capital.
Cash flows including interest
Maturities of liabilities and commitments
Carrying amount
0-1 year
1-5 years
5- years
Total
2017
Bank and other credit institutions 5,588 1,569 4,056 621 6,246
Issued bonds 7,804 508 6,034 2,216 8,758
Interest-bearing loans from subsidiaries, etc. 10,583 10,594 - - 10,594
Trade payables 67 67 - - 67
Other payables 413 413 - - 413
Other payables to subsidiaries, etc. 25 25 - - 25
Non-derivative financial liabilities 24,480 13,176 10,090 2,837 26,103
Derivatives 306 165 89 52 306
Total recognised in balance sheet 24,786 13,341 10,179 2,889 26,409
Operating lease commitments 65 43 - 108
Total 13,406 10,222 2,889 26,517
2016
Bank and other credit institutions 3,064 647 2,016 654 3,317
Issued bonds 8,097 1,029 5,352 2,838 9,219
Interest-bearing loans from subsidiaries, etc. 14,168 14,178 - - 14,178
Trade payables 170 170 - - 170
Other payables 379 379 - - 379
Other payables to subsidiaries, etc. 52 52 - - 52
Non-derivative financial liabilities 25,930 16,455 7,368 3,492 27,315
Derivatives 942 429 395 118 942
Total recognised in balance sheet 26,872 16,884 7,763 3,610 28,257
Operating lease commitments 72 95 25 192
Capital commitments 73 23 - 96
Total 17,029 7,881 3,635 28,545
Amounts in USD million
126 A.P. Møller - Mærsk A /S | Annual Report 2017
PARENT COMPANY FINANCIAL STATEMENTS — NOTES OVERVIEWFINANCIALS PARENT COMPANY FINANCIAL STATEMENTS

CommitmentsNote 17
Operating lease commitments
As part of the Company’s activities, customary agreements are entered into regarding operating lease of
vessels, equipment and office buildings, etc. The future charter and operating lease payments for contin-
uing operations are:
2017 2016
Within one year 65 72
Between one and two years 28 51
Between two and three years 10 20
Between three and four years 5 15
Between four and five years - 9
After five years - 25
Total 108 192
Net present value 1 105 164
1 The net present value has been calculated using a discount rate of 6% p.a. (6% p.a.).
About one-third of the time charter payments within shipping activities are estimated to relate to operating
costs for the assets.
Total operating lease costs incurred are stated in note 2.
Capital commitments
After the disposal of oil and gas activities, the Company has no material capital commitments at the end
of 2017. At the end of 2016, capital commitments amounted to USD 96m, primarily related to oil activities.
Contingent liabilitiesNote 18
Guarantees amount to USD 0.8bn (USD 0.8bn). Of this, USD 0.8bn (USD 0.8bn) is related to subsidiaries.
The guarantees are not expected to be realised, but they can mature within one year.
Except for customary agreements within the Company’s activities, no material agreements have been
entered into that will take effect, change or expire upon changes of the control over the Company.
The Company is involved in a number of legal disputes. The Company is also involved in tax disputes in
certain countries. Some of these involve significant amounts and are subject to considerable uncertainty.
Tax may crystallise on repatriation of dividends. Through participation in a joint taxation scheme with
A.P. Møller Holding A/S, the Company is jointly and severally liable for taxes payable, etc. in Denmark.
Amounts in USD million
127 A.P. Møller - Mærsk A /S | Annual Report 2017
PARENT COMPANY FINANCIAL STATEMENTS — NOTES OVERVIEWFINANCIALS PARENT COMPANY FINANCIAL STATEMENTS

2017 2016
Change in working capital
Trade receivables 6 8
Other receivables and prepayments -71 24
Trade payables and other payables, etc. -5 21
Other working capital movements 15 16
Exchange rate adjustment of working capital 24 7
Total -31 76
Cash flow specificationsNote 19
Amounts in USD million
128 A.P. Møller - Mærsk A /S | Annual Report 2017
PARENT COMPANY FINANCIAL STATEMENTS — NOTES OVERVIEWFINANCIALS PARENT COMPANY FINANCIAL STATEMENTS

Related partiesNote 20
Controlling party1 Subsidiaries Associated companies Joint ventures Management 2
2017 2016 2017 2016 2017 2016 2017 2016 2017 2016
Continuing operations
Income statement
Revenue 12 - 231 1,011 - - 1 5 - -
Operating costs 38 - 16 70 - - - - - -
Remuneration to management - - - - - - - - 10 23
Dividends - - 2,835 65 - - - 11 - -
Financial income - - 685 664 - - - - - -
Financial expenses - - 491 96 - - - - - -
Assets
Interest-bearing receivables, non-current - - 18,532 7,697 - - - - - -
Derivatives, non-current - - 31 45 - - - - - -
Trade receivables - - 43 149 - - - 11 - -
Tax receivables - - 133 113 - - - - - -
Interest-bearing receivables, current - - 4,992 4,493 - - - - - -
Derivatives, current - - 18 193 - - - - - -
Other receivables, current 29 - 442 454 - - - - - -
Liabilities
Derivatives, non-current - - 13 1 - - - - - -
Interest bearing debt, current - - 10,583 14,168 - - - - - -
Trade payables - - 9 40 - - - - - -
Tax payables - - 96 125 - - - - - -
Derivatives. current - - 73 44 - - - - - -
Other liabilities, current - - 25 52 - - - - - -
Investment in property, plant and equipment - - - 5 - - - - - -
Sale of companies, property, plant and equipment 1,217 3 - - 0 - - - - - -
Capital increases and purchase of shares - - 846 1,306 - - 1 - - -
Return of capital - - 8,000 - - - - - - -
Discontinued operations
Income statement – income - - 813 - - - 4 - - -
Income statement – expenses - - 51 - - - 5 - - -
1 A.P. Møller Holding A/S, Copenhagen, Denmark has control over the Company and prepares consolidated financial statements. A.P. Møller og Hustru Chastine Mc-Kinney Møllers Fond til almene Formaal is the ultimate owner.
2 The Board of Directors and the Executive Board in A.P. Møller - Mærsk A/S, A.P. Møller Holding A/S, A.P. Møller og Hustru Chastine Mc-Kinney Møllers Fond til almene Formaal and their close relatives (including undertakings
under their significant influence).
3 Sale of shares in Maersk Tankers A/S to APMH Invest A/S
Dividends distributed are not included.
Amounts in USD million
129 A.P. Møller - Mærsk A /S | Annual Report 2017
PARENT COMPANY FINANCIAL STATEMENTS — NOTES OVERVIEWFINANCIALS PARENT COMPANY FINANCIAL STATEMENTS

Significant accounting policiesNote 21
The financial statements for 2017 for A.P. Møller - Mærsk A/S have been prepared on a going concern
basis and in accordance with the International Financial Reporting Standards (IFRS) as adopted by the
EU and further requirements in the Danish Financial Statements Act. The financial statements are also in
accordance with IFRS as issued by the International Accounting Standards Board (IASB).
Aside from for the implementation of IFRS 9, the accounting policies of the Company are consistent with
those applied in the financial statements 2016. The accounting policies are furthermore consistent with
the accounting policies for the Group’s financial statements (note 23 in the Consolidated financial state-
ments) with the following exceptions:
• Shares in subsidiaries and associated companies are measured at cost or a lower recoverable amount;
• Dividends from subsidiaries and associated companies are recognised as income at the time of decla-
ration unless considered a return of capital in subsidiary;
• No segment information is disclosed;
• Value of granted share options, restricted shares and performance shares to employees in subsidiaries
is expensed directly in the relevant subsidiary. At the time of the grant, the subsidiary settles the amount
with A.P. Møller - Mærsk A/S and the counter posting made in equity. At the time of exercising, the pro-
ceeds are included in the Company's equity.
Energy related activities were transferred to subsidiaries as a contribution in kind. The cost of the subsidiary
is measured at the carrying amount of the net assets transferred. The profit/loss and cash flow are included
for the period up to the transfer of the activities.
As stated in the Annual Report 2016, the Company decided to adopt IFRS 9 from 1 January 2017. The im-
plementation of IFRS 9 has not affected the classification and measurement of the Company’s financial
instruments, and the new standard does not fundamentally change the hedging relationships.
Management elected to classify the 19% shareholding in Dansk Supermarked Group as fair value through
other comprehensive income. The accumulated loss recognised in other comprehensive income will, as a
consequence, remain in equity, as will value adjustments related to this investment following this date.
The remaining equity investments previously classified as assets available for sale have also been clas-
sified as fair value through other comprehensive income. The accumulated amount recognised in other
comprehensive income for the remaining equity investments is not material.
The effect of the change from the ‘incurred loss’ model in IAS 39 to the ‘expected credit loss’ model in
IFRS 9 is considered immaterial due to the low credit risk of other receivables. Other financial assets
include loans to subsidiaries, which are measured at amortised cost. Due to immaterial effects from
implementing IFRS 9, the 2016 financial statements have not been restated. The effects as of end of
2016 have been recognised in 2017.
New financial reporting requirements
The Company has not yet applied the following standards:
• IFRS 15 Revenue from contracts with customers
• IFRS 16 Leases
IFRS 15 is effective from 1 January 2018 and IFRS 16 is effective from 1 January 2019 and both are endorsed
by the EU. Early adoption of IFRS 16 is currently not considered by the Company.
The Company has in all material respect concluded analyses of the impending changes resulting from
IFRS 15 and IFRS 16. The key findings are explained below.
IFRS 15 Revenue from contracts with customers
The Company’s current practices for recognising revenue have shown to comply in all material aspects
with the concepts and principles encompassed by the new standard and impact on the financial state-
ments is considered immaterial.
IFRS 16 Leases
The new requirement in IFRS 16 to recognise a right-of-use asset and a related liability is not expected to
have material impact on the amounts recognised in the Company’s financial statements.
The Company will adopt IFRS 16 on 1 January 2019, applying the following main transitions options:
• No reassessment of lease definitions compared to existing IAS 17 and IFRIC 4
• Application of simplified approach with no restatement of comparative figures for prior periods.
Amounts in USD million
130 A.P. Møller - Mærsk A /S | Annual Report 2017
PARENT COMPANY FINANCIAL STATEMENTS — NOTES OVERVIEWFINANCIALS PARENT COMPANY FINANCIAL STATEMENTS

Significant accounting estimates and judgements
Note 22
When preparing the financial statements of the Company, management undertakes a number of
accounting estimates and judgements to recognise, measure and classify the Company's assets and
liabilities.
Estimates that are material to the Company’s financial reporting are made on the basis of, inter alia,
determination of the useful life and residual value of property, plant and equipment, determination of
impairment of property, plant and equipment and financial non-current assets including subsidiaries
and associated companies, recognition of deferred tax assets and recognition and measurements of
provisions. Reference is made to notes 6, 7, 8 and 13.
Management assesses impairment indicators for investments in subsidiaries and associated companies,
and determines the recoverable amount generally consistent with the assumptions described in note 6, 7
and 24 of the Consolidated financial statements to which reference is made. When classifying an invest-
ment as assets held for sale management applies judgement to the estimated fair value of the investment.
Depending on the activity, the estimated value is encompassed by different levels of uncertainty and thus
subsequent adjustments are possible. Measurement of the fair value is categorised as Level 3 in the fair
value hierarchy as measurement is not based on observable market data.
The accounting estimates and judgements are described in further detail in note 24 of the Consolidated
financial statements.
Amounts in USD million
131 A.P. Møller - Mærsk A /S | Annual Report 2017
PARENT COMPANY FINANCIAL STATEMENTS — NOTES OVERVIEWFINANCIALS PARENT COMPANY FINANCIAL STATEMENTS

The Board of Directors and the
Executive Board have today discussed
and approved the Annual Report of
A.P. Møller - Mærsk A/S for 2017.
The Annual Report for 2017 of
A.P. Møller - Mærsk A/S has been
prepared in accordance with Inter-
national Financial Reporting Stand-
ards (IFRS) as adopted by the EU and
further re quirements in the Danish
Financial Statements Act and in our
opinion gives a true and fair view of
A.P. Moller - Maersk’s and the Com-
pany’s assets and liabilities, financial
position at 31 December 2017 and of
the results of A.P. Moller - Maersk’s
and the Company’s operations and
cash flows for the financial year 2017.
In our opinion, the Directors’ report
includes a fair review of the develop-
ment in A.P. Moller - Maersk’s and the
Company’s operations and financial
conditions, the results for the year,
cash flows and financial position as
well as a description of the most sig-
nificant risks and uncertainty factors
that A.P. Moller - Maersk and the
Company face.
We recommend that the Annual
Report be approved at the Annual
General Meeting on 10 April 2018.
Copenhagen, 9 February 2018
Søren Toft — COO, Maersk Line Renata Frolova-Hammer
Claus V. Hemmingsen — Vice CEO Niels Jacobsen — Vice Chairman Jan Leschly
Søren Skou — CEO Jim Hagemann Snabe — Chairman Arne Karlsson
Jakob Stausholm — CFO Ane Mærsk Mc-Kinney Uggla — Vice Chairman Palle Vestergaard Rasmussen
Morten Engelstoft — CEO, APM Terminals Niels Bjørn Christiansen Robert Mærsk Uggla
Vincent Clerc — CCO, Maersk Line Dorothee Blessing Robert Routs
Statement of the Board of Directors and the Executive Board
Executive Board Board of Directors
A.P. Møller - Mærsk A /S | Annual Report 2017132
FINANCIALS STATEMENT OF THE BOARD OF DIRECTORS AND THE EXECUTIVE BOARD

Independent Auditor’s Report
To the shareholders of A.P. Møller - Mærsk A/S.
Our opinionIn our opinion, the consolidated finan-
cial statements and the parent com-
pany financial statements (pp 63-136
and pp 141-143) give a true and fair view
of the Group’s and the parent compa-
ny’s financial position at 31 December
2017 and of the results of the Group’s
and the parent company’s operations
and cash flows for the financial year
1 January to 31 December 2017 in ac-
cordance with International Financial
Reporting Standards as adopted by
the EU and further requirements in the
Danish Financial Statements Act.
Our opinion is consistent with our
Auditor’s Long-form Report to the Audit
Committee and the Board of Directors.
What we have auditedThe consolidated financial state-
ments and parent company financial
statements of A.P. Møller - Mærsk
A/S for the financial year 1 January to
31 December 2017 comprise income
statement and statement of com-
prehensive income, balance sheet,
statement of changes in equity, cash
flow statement and notes, including
summary of significant accounting
policies for the Group as well as for the
parent company. Collectively referred
to as the “financial statements”.
Basis for opinionWe conducted our audit in accord-
ance with International Standards
on Auditing (ISAs) and the additional
requirements applicable in Denmark.
Our responsibilities under those stand-
ards and requirements are further
described in the Auditor’s responsibili-
ties for the audit of the financial state-
ments section of our report.
We believe that the audit evidence we
have obtained is sufficient and appro-
priate to provide a basis for our opinion.
IndependenceWe are independent of the Group in
accordance with the International
Ethics Standards Board for Account-
ants’ Code of Ethics for Professional
Accountants (IESBA Code) and the
additional requirements applicable in
Denmark. We have also fulfilled our
other ethical responsibilities in accord-
ance with the IESBA Code.
To the best of our knowledge and
belief, prohibited non-audit services
referred to in Article 5(1) of Regulation
(EU) No 537/2014 were not provided.
AppointmentWe were first appointed auditors of
A.P. Møller - Mærsk A/S on 12 April 2012
for the financial year 2012. We have
been reappointed annually by share-
holder resolution for a total period of
uninterrupted engagement of 6 years
including the financial year 2017.
Key audit mattersKey audit matters are those matters
that, in our professional judgement,
were of most significance in our audit
of the financial statements for 2017.
These matters were addressed in the
context of our audit of the financial
statements as a whole, and in form-
ing our opinion thereon, and we do
not provide a separate opinion on
these matters.
Revenue recognitionKey audit matter
Recognition of the Group’s revenue is
complex due to the volume of transac-
tions and the extent of different reve-
nue streams within the segments.
We focused on this area, as recogni-
tion of revenue involves accounting
policy decisions and judgements made
by Management originating from dif-
ferent customer behaviour, market con-
ditions, terms and nature of services in
the various segments.
Further, the volume of transactions and
extent of different revenue streams
require various IT setups of revenue rec-
ognition throughout the Group, which
are complex and introduce an inherent
risk to the revenue recognition process.
Reference is made to notes 1 and 23
in the consolidated financial state-
ments.
How our audit addressed
the key audit matter
Our audit procedures included con-
sidering the appropriateness of the
Group’s revenue recognition account-
ing policies and assessing compliance
with applicable accounting standards.
A.P. Møller - Mærsk A /S | Annual Report 2017133
FINANCIALS INDEPENDENT AUDITOR’S REPORT

We tested the relevant controls,
including applicable information sys-
tems and Management’s monitoring
of controls, used to ensure the com-
pleteness, accuracy and timing of
revenue recognised.
We performed substantive procedures
over invoicing and significant contracts
in order to assess the accounting treat-
ment and principles applied.
We applied data-analytics and tested
journal entries on revenue.
Recoverability of the carrying amount of non-current assets Key audit matter
The principal risk is in relation to Man-
agement’s assessment of future tim-
ing and amount of cash flows, which
are used to project the recoverability
of the carrying amount of tangible
and intangible assets.
Bearing in mind the generally long-
lived nature of A.P. Moller - Maersk’s
assets, the most critical assumptions
are Management’s view on the long-
term outlook for freight rates and vol-
umes as well as oil price and rig rates.
We focused on this area, as Manage-
ment is required to exercise consider-
able judgement because of the inher-
ent complexity in estimating future
cash flows.
Reference is made to notes 6, 7, 9 and
24 in the consolidated financial state-
ments.
How our audit addressed
the key audit matter
In addressing the risk, we walked
through and tested the controls de-
signed and operated by the Group relat-
ing to the assessment of the carrying
value of tangible and intangible assets.
We considered the appropriateness
of Management defined cash-gen-
erating units (CGUs) within the busi-
ness. We tested whether there were
factors requiring Management to
change their classification since the
prior reporting period. We also tested
Management’s process for identifying
CGUs that required impairment test-
ing in line with IFRS and tested that
all assets requiring impairment test-
ing were identified.
We examined the methodology used
by Management to assess the carrying
amount of tangible and intangible
assets assigned to CGUs, to determine
its compliance with accounting stand-
ards and consistency of application.
We performed detailed testing for the
assets where the need for an impair-
ment review was identified by Man-
agement. For those assets expected
to be retained in the portfolio, we
checked the reasonableness of key
assumptions in relation to the ongo-
ing operation of the assets.
We corroborated Management’s
estimate of future cash flows and
challenged whether these were ap-
propriate in light of future oil price,
freight and rig rates, volume growth,
cost reduction initiative and capital
expenditure assumptions, including
assessed Management’s macroeco-
nomic assumptions regarding short-
term and long-term views on prices.
We also evaluated the discount rates
and market values used and tested
the mathematical accuracy of the rele-
vant value-in-use models prepared by
Management.
Estimation in respect of uncertain tax positionsKey audit matter
The Group operates in a complex mul-
tinational tax environment and there
are open tax audits and inquiries with
tax authorities.
Management is required to exercise
considerable judgement when de-
termining the appropriate amount
to provide in respect of uncertain tax
positions.
We focused on this area, as the
amounts involved are potentially ma-
terial and the valuation of tax assets
and liabilities is associated with un-
certainty and judgement.
At 31 December 2017, the Group had
recognised provisions in respect of
legal disputes etc., which among other
things include tax, indirect tax and
duty disputes.
Reference is made to notes 8, 14 and
24 in the consolidated financial state-
ments.
How our audit addressed
the key audit matter
We evaluated relevant procedures
and controls regarding completeness
of records of uncertain tax positions
and Management’s procedure for esti-
mating the provision for uncertain tax
positions.
In understanding and evaluating Man-
agement’s judgements, we considered
the status of recent and current tax
authority audits and enquiries, the out-
come of previous claims, judgmental
positions taken in tax returns and cur-
rent year estimates and developments
in the tax environment.
In addition, we used our tax special-
ists, evaluated and challenged the ad-
equacy of Management’s key assump-
tions and read correspondence with tax
authorities to assess Management’s
estimates.
Statement on Directors’ reportManagement is responsible for
Directors’ report.
Our opinion on the financial state-
ments does not cover Directors’ report,
and we do not express any form of as-
surance conclusion thereon.
In connection with our audit of the
financial statements, our responsi-
bility is to read Directors’ report and,
in doing so, consider whether Direc-
tors’ report is materially inconsistent
with the financial statements or our
knowledge obtained in the audit, or
A.P. Møller - Mærsk A /S | Annual Report 2017134
FINANCIALS INDEPENDENT AUDITOR’S REPORT

otherwise appears to be materially
misstated.
Moreover, we considered whether
Directors’ report includes the disclo-
sures required by the Danish Financial
Statements Act.
Based on the work we have performed,
in our view, Directors’ report is in
accordance with the consolidated
financial statements and the parent
company financial statements and
has been prepared in accordance
with the requirements of the Danish
Financial Statements Act. We did not
identify any material misstatement
in Directors’ report.
Management’s responsibilities for the financial statementsManagement is responsible for the
preparation of consolidated financial
statements and parent company
financial statements that give a true
and fair view in accordance with Inter-
national Financial Reporting Stand-
ards as adopted by the EU and further
requirements in the Danish Financial
Statements Act, and for such internal
control as Management determines is
necessary to enable the preparation
of financial statements that are free
from material misstatement, whether
due to fraud or error.
In preparing the financial statements,
Management is responsible for assess-
ing the Group’s and the parent compa-
ny’s ability to continue as a going con-
cern, disclosing, as applicable, matters
related to going concern and using
the going concern basis of accounting
unless Management either intends to
liquidate the Group or the parent com-
pany or to cease operations, or has no
realistic alternative but to do so.
Auditor’s responsibilities for the audit of the financial statementsOur objectives are to obtain reasonable
assurance about whether the financial
statements as a whole are free from
material misstatement, whether due
to fraud or error, and to issue an Audi-
tor’s Report that includes our opinion.
Reasonable assurance is a high level of
assurance, but is not a guarantee that
an audit conducted in accordance with
ISAs and the additional requirements
applicable in Denmark will always de-
tect a material misstatement when it
exists. Misstatements can arise from
fraud or error and are considered ma-
terial if, individually or in the aggregate,
they could reasonably be expected to
influence the economic decisions of
users taken on the basis of these finan-
cial statements.
As part of an audit in accordance with
ISAs and the additional requirements
applicable in Denmark, we exercise
professional judgement and maintain
professional scepticism throughout
the audit. We also:
• Identify and assess the risks of ma-
terial misstatement of the financial
statements, whether due to fraud
or error, design and perform audit
procedures responsive to those
risks, and obtain audit evidence
that is sufficient and appropriate to
provide a basis for our opinion. The
risk of not detecting a material mis-
statement resulting from fraud is
higher than for one resulting from
error, as fraud may involve collu-
sion, forgery, intentional omissions,
misrepresentations, or the override
of internal control.
• Obtain an understanding of internal
control relevant to the audit in order
to design audit procedures that are
appropriate in the circumstances,
but not for the purpose of express-
ing an opinion on the effectiveness
of the Group’s and the parent com-
pany’s internal control.
• Evaluate the appropriateness of
accounting policies used and the
reasonableness of accounting esti-
mates and related disclosures made
by Management.
• Conclude on the appropriateness
of Management’s use of the go-
ing concern basis of accounting
and based on the audit evidence
obtained, whether a material un-
certainty exists related to events or
conditions that may cast significant
doubt on the Group’s and the par-
ent company’s ability to continue
as a going concern. If we conclude
that a material uncertainty exists,
we are required to draw attention in
our Auditor’s Report to the related
disclosures in the financial state-
ments or, if such disclosures are
inadequate, to modify our opinion.
Our conclusions are based on the
audit evidence obtained up to the
date of our Auditor’s Report. How-
ever, future events or conditions
may cause the Group or the parent
company to cease to continue as a
going concern.
• Evaluate the overall presentation,
structure and content of the finan-
cial statements, including the dis-
closures, and whether the financial
statements represent the underlying
transactions and events in a manner
that achieves fair presentation.
• Obtain sufficient appropriate audit
evidence regarding the financial
information of the entities or busi-
ness activities within the Group to
express an opinion on the consoli-
dated financial statements. We are
responsible for the direction, super-
vision and performance of the group
audit. We remain solely responsible
for our audit opinion.
We communicate with those charged
with governance regarding, among
other matters, the planned scope and
timing of the audit and significant au-
dit findings, including any significant
deficiencies in internal control that we
identify during our audit.
We also provide those charged with
governance with a statement that we
have complied with relevant ethical re-
quirements regarding independence,
and to communicate with them all
relationships and other matters that
may reasonably be thought to bear on
our independence, and where applica-
ble, related safeguards.
A.P. Møller - Mærsk A /S | Annual Report 2017135
FINANCIALS INDEPENDENT AUDITOR’S REPORT

Mogens Nørgaard Mogensen State Authorised Public Accountant
mne21404
Gert Fisker TomczykState Authorised Public Accountant
mne9777
PricewaterhouseCoopers
From the matters communicated with
those charged with governance, we
determine those matters that were of
most significance in the audit of the
financial statements of the current
period and are therefore the key audit
matters. We describe these matters
in our Auditor’s Report unless law or
regulation precludes public disclosure
about the matter or when, in extremely
rare circumstances, we determine
that a matter should not be commu-
nicated in our report because the ad-
verse consequences of doing so would
reasonably be expected to outweigh
the public interest benefits of such
communication.
Copenhagen, 9 February 2018
Statsautoriseret RevisionspartnerselskabCVR no 3377 1231
A.P. Møller - Mærsk A /S | Annual Report 2017136
FINANCIALS INDEPENDENT AUDITOR’S REPORT

ADDITIONAL INFORMATION
Board of Directors1 | Executive Board1 | Company overview2 | Definition of terms | Company announcements | Highlights Q4 20171 | Quarterly summary1 | External financial reporting for A.P. Moller - Maersk
1 Part of Directors’ report 2 Part of Financials
A.P. Moller - Maersk | Annual Report 2017137
ADDITIONAL INFORMATION

Board of Directors
Jim Hagemann Snabe
Chairman
Born: 1965
Gender: Male
Joined the Board: 2016
Term of office will end: 2018
Former Co-CEO of SAP AG, Germany.
Other management duties, etc .: Siemens AG (Chairman); Allianz SE (Vice
Chairman); World Economic Forum (member
of the Board of Trustees); Adjunct professor
at Copenhagen Business School.
Considered independent.
Niels Jacobsen
Vice Chairman
Born: 1957
Gender: Male
Joined the Board: 2007
Latest re-election: 2017
Term of office will end: 2019
Former President & CEO of William Demant
Holding A/S.
Other management duties, etc .: William Demant Invest A/S (CEO); Jeudan A/S
(Chairman); Össur hf. (Chairman); HIMPP A/S
(Chairman); Sennheiser Communications A/S
(Chairman); Founders A/S (Chairman); William
Demant Holding A/S (Vice Chairman); Boston
Holding A/S; Nissens A/S (Chairman); Thomas
B. Thriges Fond (Chairman); KIRKBI A/S (Vice
Chairman).
Considered independent.
Ane Mærsk Mc-Kinney Uggla
Vice Chairman
Born: 1948
Gender: Female
Joined the Board: 1991
Latest re-election: 2016
Term of office will end: 2018
Other management duties, etc .: A.P. Møller og Hustru Chastine Mc-Kinney
Møllers Fond til almene Formaal (Chairman);
Den A.P. Møllerske Støttefond (Chairman);
A.P. Møller Holding A/S (Chairman);
Maersk Broker A/S (Chairman); Maersk
Broker K/S (Chairman); Estemco III A/S (CEO);
Timer ApS (CEO).
Not considered independent.Image from the left: Palle Vestergaard RasmussenJan LeschlyDorothee BlessingRobert RoutsAne Mærsk Mc-Kinney UgglaJim Hagemann SnabeNiels JacobsenArne KarlssonRobert Mærsk UgglaRenata Frolova-HammerNiels Bjørn Christiansen
A.P. Moller - Maersk | Annual Report 2017138
ADDITIONAL INFORMATION BOARD OF DIRECTORS

Dorothee Blessing
Born: 1967
Gender: Female
Joined the Board: 2014
Latest re-election: 2017
Term of office will end: 2019
Regional Head of Germany, Austria, Switzer-
land, Israel, Ireland and the Nordics; Vice
Chairman, Investment Banking EMEA; J.P.
Morgan. Member of the supervisory board of
J.P. Morgan AG.
Other management duties, etc .: Member of the board of directors of the
Association of German Banks.
Considered independent.
Arne Karlsson
Born: 1958
Gender: Male
Joined the Board: 2010
Latest re-election: 2017
Term of office will end: 2019
Former CEO, Ratos AB.
Other management duties, etc .: Bonnier Holding (Chairman); Bonnier AB;
SNS Förtroenderåd (SNS Board of Trustees)
(Chairman); Einar Mattsson (Chairman); Swedish
Corporate Governance Board (Chairman);
Ecolean (Chairman); Swedish Securities Council
and WCPF (World’s Children’s Prize Foundation)
(Chairman); ROL AB (Chairman).
Considered independent.
Renata Frolova-Hammer
Born: 1977
Gender: Female
Joined the Board: 2014
Latest re-election: 2016
Term of office will end: 2018
Head of Responsible Procurement
(employee).
Other management duties, etc .:IKEA Industry Holding BV.
Not considered independent.
Palle Vestergaard Rasmussen
Born: 1958
Gender: Male
Joined the Board: 2014
Latest re-election: 2016
Term of office will end: 2018
Captain (employee).
Other management duties, etc .:None.
Not considered independent.
Jan Leschly
Born: 1940
Gender: Male
Joined the Board: 2000
Latest re-election: 2016
Term of office will end: 2018
Chairman and managing partner of Care
Capital LLC. Former CEO, SmithKlineBeecham.
Other management duties, etc .: A.P. Møller Holding A/S; Vaxart
Pharmaceuticals; Adjunct professor at
Copenhagen Business School.
Not considered independent.
Robert Routs
Born: 1946
Gender: Male
Joined the Board: 2010
Latest re-election: 2016
Term of office will end: 2018
Former Executive Director, Royal Dutch Shell plc.
Other management duties, etc .: Aegon NV (Chairman); DSM NV (Chairman);
ATCO Group; AECOM.
Considered independent.
Niels Bjørn Christiansen
Born: 1966
Gender: Male
Joined the Board: 2014
Latest re-election: 2017
Term of office will end: 2019
CEO of LEGO A/S.
Other management duties, etc .: William Demant Holding A/S (Chairman).
Considered independent.
Robert Mærsk Uggla
Born: 1978
Gender: Male
Joined the Board: 2014
Latest re-election: 2016
Term of office will end: 2018
CEO of A.P. Møller Holding A/S.
Other management duties, etc .: Agata ApS (CEO); A.P. Møller Capital P/S
(Chairman); Estemco XII ApS (CEO); Four
subsidiaries of A.P. Møller Holding A/S;
Foundation Board of IMD.
Not considered independent.
A.P. Moller - Maersk | Annual Report 2017139
ADDITIONAL INFORMATION BOARD OF DIRECTORS

Executive Board
Søren Skou
Chief Executive Officer (CEO)
Born: 1964
Gender: Male
Joined the Executive Board: 2007
Other management duties, etc .: Skou Invest ApS; International Council of
Containership Operators (ICCO); Member of
European Round Table of Industrialists.
Vincent Clerc
Chief Commercial Officer (CCO), Maersk Line
Born: 1972
Gender: Male
Joined the Executive Board: 2017
Other management duties, etc .:None.
Claus V. Hemmingsen
Vice Chief Executive Officer (Vice CEO)
Born: 1962
Gender: Male
Joined the Executive Board: 2007
Other management duties, etc .: DFDS A/S (Chairman); Danske Rederier
(Chairman); Danish Chinese Business Forum
(Chairman); Den A.P. Møllerske Støttefond;
International Chamber of Shipping.
Morten Engelstoft
Chief Executive Officer (CEO), APM Terminals
Born: 1967
Gender: Male
Joined the Executive Board: 2017
Other management duties, etc .: Global Ports Investments;
TT Club Mutual Insurance Ltd.
Jakob Stausholm
Chief Finance, Strategy & Transformation Officer (CFO)Born: 1968
Gender: Male
Joined the Executive Board: 2016
Other management duties, etc .:None.
Søren Toft
Chief Operating Officer (COO), Maersk Line
Born: 1974
Gender: Male
Joined the Executive Board: 2017
Other management duties, etc .: World Shipping Council.
Image from the left: Morten EngelstoftJakob Stausholm Claus V. HemmingsenSøren SkouSøren Toft Vincent Clerc
A.P. Moller - Maersk | Annual Report 2017140
ADDITIONAL INFORMATION EXECUTIVE BOARD

Company overview
A.P. Moller - Maersk comprises more than 900 companies. Major companies of A.P. Moller - Maersk are listed below.
The Danish Financial Statements Act section 97a, par. 4 has been applied in the company overview.
A more comprehensive list of companies is available http://investor.maersk.com/financials.cfm
SUBSIDIARIES
Company Country of incorporation Owned share
SUBSIDIARIES
Company Country of incorporation Owned share
A.P. Moller Finance SA Switzerland 100%
A.P. Moller Singapore Pte. Ltd. Singapore 100%
Addicks & Kreye Container Service GmbH & Co. KG Germany 51%
Aliança Navegação e Logística Ltda. Brazil 100%
APM Terminals - Aarhus A/S Denmark 100%
APM Terminals Algeciras S.A. Spain 100%
APM Terminals Apapa Ltd. Nigeria 94%
APM Terminals B.V. The Netherlands 100%
APM Terminals Bahrain B.S.C. Bahrain 80%
APM Terminals Callao S.A. Peru 51%
APM Terminals China Co. Ltd. Hong Kong 100%
APM Terminals Elizabeth, LLC USA 100%
APM Terminals Gothenburg AB Sweden 100%
APM Terminals India Pvt. Ltd. India 100%
APM Terminals Inland Services S.A. Peru 100%
APM Terminals Lázaro Cárdenas S.A. de C.V. Mexico 100%
APM Terminals Liberia Ltd. Liberia 75%
APM Terminals Maasvlakte II B.V. The Netherlands 100%
APM Terminals Management B.V. The Netherlands 100%
APM Terminals Mobile, LLC USA 100%
APM Terminals Moin S.A. Costa Rica 100%
APM Terminals North America B.V. The Netherlands 100%
APM Terminals Pacific LLC USA 100%
APM Terminals Rotterdam B.V. The Netherlands 100%
APM Terminals Tangier SA Morocco 90%
Aqaba Container Terminal Company Ltd. Jordan 50%
Bermutine Transport Corporation Ltd. Bermuda 100%
Coman SA Benin 100%
Container Operators S.A. Chile 100%
Damco (UAE) FZE United Arab Emirates 100%
Damco A/S Denmark 100%
Damco Australia Pty. Ltd. Australia 100%
Damco Belgium NV Belgium 100%
Damco China Ltd. China 100%
Damco Distribution Services Inc. USA 100%
Damco France SAS France 100%
Damco India Pvt. Ltd. India 100%
Damco International A/S Denmark 100%
Damco Logistics Uganda Ltd. Uganda 100%
Damco Sweden AB Sweden 100%
Damco UK Ltd. UK 100%
Damco USA Inc. USA 100%
Farrell Lines Inc. USA 100%
Gateway Terminals India Pvt. Ltd. India 74%
Hamburg Südamerikanische
Dampfschifffahrts-Gesellschaft KG Germany 100%
Lilypond Container Depot Nigeria Ltd. Nigeria 100%
Maersk (China) Shipping Company Ltd. China 100%
Maersk A/S Denmark 100%
Maersk Agency U.S.A. Inc. USA 100%
Maersk Aviation Holding A/S Denmark 100%
A.P. Moller - Maersk | Annual Report 2017141
ADDITIONAL INFORMATION COMPANY OVERVIEW

SUBSIDIARIES
Company Country of incorporation Owned share
SUBSIDIARIES
Company Country of incorporation Owned share
Maersk B.V. The Netherlands 100%
Maersk Bangladesh Ltd. Bangladesh 100%
Maersk Container Industry A/S Denmark 100%
Maersk Container Industry Dongguan Ltd. China 100%
Maersk Container Industry Qingdao Ltd. China 100%
Maersk Denizcilik A.Ş. Turkey 100%
Maersk Drilling A/S Denmark 100%
Maersk Drilling Deepwater A/S Denmark 100%
Maersk Drilling Deepwater Egypt LLC Egypt 100%
Maersk Drilling Holdings Singapore Pte. Ltd. Singapore 100%
Maersk Drilling International A/S Denmark 100%
Maersk Drilling Norge AS Norway 100%
Maersk Drilling USA Inc. USA 100%
Maersk Drillship III Singapore Pte. Ltd. Singapore 100%
Maersk Drillship IV Singapore Pte. Ltd. Singapore 100%
Maersk Egypt For Maritime Transport SAE Egypt 100%
Maersk Energia Ltda. Brazil 100%
Maersk Energy Marketing A/S Denmark 100%
Maersk Energy UK Ltd. UK 100%
Maersk FPSOs A/S Denmark 100%
Maersk Gabon SA Gabon 100%
Maersk Global Service Centres (Chengdu) Ltd. China 100%
Maersk Global Service Centres (India) Pvt. Ltd. India 100%
Maersk Holding B.V. The Netherlands 100%
Maersk Hong Kong Ltd. Hong Kong 100%
Maersk Inc. USA 100%
Mærsk Innovator Norge A/S Denmark 100%
Mærsk Inspirer Norge A/S Denmark 100%
Maersk Integrator Norge A/S Denmark 100%
Maersk Inter Holding B.V. The Netherlands 100%
Maersk Interceptor Norge A/S Denmark 100%
Maersk Intrepid Norge A/S Denmark 100%
Maersk Line A/S Denmark 100%
Maersk Line Agency Holding A/S Denmark 100%
Maersk Line UK Ltd. UK 100%
Maersk Line, Limited Inc. USA 100%
Maersk Logistics Warehousing China Company Ltd. Hong Kong 100%
Maersk Oil Angola A/S Denmark 100%
Maersk Oil Brasil Ltda. Brazil 100%
Maersk Oil GB Ltd. UK 100%
Maersk Oil Gulf of Mexico Four LLC USA 100%
Maersk Oil Kazakhstan GmbH Germany 100%
Maersk Oil North Sea UK Ltd. UK 100%
Maersk Oil Norway AS Norway 100%
Maersk Oil Qatar A/S Denmark 100%
Maersk Oil Three PL B.V. The Netherlands 100%
Maersk Oil Trading Inc. USA 100%
Maersk Oil UK Ltd. UK 100%
Mærsk Olie Algeriet A/S Denmark 100%
Mærsk Olie og Gas A/S Denmark 100%
Maersk Shipping Hong Kong Ltd. Hong Kong 100%
Maersk Supply Service (Angola) Lda. Angola 49%
Maersk Supply Service A/S Denmark 100%
Maersk Supply Service Canada Ltd. Canada 100%
Maersk Supply Service International A/S Denmark 100%
Maersk Supply Service UK Ltd. UK 100%
Maersk Treasury Center (Asia) Pte. Ltd. Singapore 100%
Maersk Vietnam Ltd. Vietnam 100%
Maersk Viking LLC USA 100%
MCC Transport Singapore Pte. Ltd. Singapore 100%
New Times International Transport Service Co. Ltd. China 100%
Poti Sea Port Corporation Georgia 100%
PT Damco Indonesia Indonesia 98%
Rederiaktieselskabet Kuling Denmark 100%
Rederiet A.P. Møller A/S Denmark 100%
Safmarine (Pty) Ltd. South Africa 100%
Safmarine MPV NV Belgium 100%
Seago Line A/S Denmark 100%
Sogester - Sociedade Gestora De Terminais S.A. Angola 51%
Suez Canal Container Terminal SAE Egypt 55%
Svitzer A/S Denmark 100%
Svitzer Australia Pty Ltd Australia 100%
Svitzer Marine Ltd. UK 100%
Terminal 4 S.A. Argentina 100%
U.S. Marine Management, Incorporated USA 100%
West Africa Container Terminal Nigeria Ltd. Nigeria 100%
A.P. Moller - Maersk | Annual Report 2017142
ADDITIONAL INFORMATION COMPANY OVERVIEW

ASSOCIATED COMPANIES
Company Country of incorporation Owned share
JOINT VENTURES
Company Country of incorporation Owned share
Abidjan Terminal SA Côte d’Ivoire 40%
Brigantine International Holdings Ltd. Hong Kong 30%
Brigantine Services Ltd. Hong Kong 30%
Congo Terminal Holding SAS France 30%
Congo Terminal SA Republic of the Congo 23%
Cosco Ports (Nansha) Ltd. British Virgin Islands 34%
Guangzhou South China Oceangate
Container Terminal Co. Ltd. China 20%
Gujarat Pipavav Port Ltd. India 43%
Höegh Autoliners Holdings AS Norway 39%
Inttra Inc. USA 25%
Meridian Port Services Ltd. Ghana 42%
Salalah Port Services Company SAOG Oman 30%
Shanghai Tie Yang Multimodal
Transportation Co. Ltd. China 29%
South Asia Gateway Pvt. Ltd. Sri Lanka 33%
Tianjin Port Alliance International
Container Terminal Co. Ltd. China 20%
Anchor Storage Ltd. Bermuda 51%
Ardent Holdings Limited UK 50%
Brasil Terminal Portuario S.A. Brazil 50%
Cai Mep International Terminal Co. Ltd. Vietnam 49%
Douala International Terminal SA Cameroon 44%
Eurogate Container Terminal Wilhelmhaven
Beteiligungsgesellschaft GmbH Germany 30%
First Container Terminal ZAO Russian Federation 31%
Global Ports Investments PLC Cyprus 31%
North Sea Terminal Bremerhaven
Verwaltungsgesellschaft GmbH Germany 50%
Pelabuhan Tanjung Pelepas Sdn. Bhd. Malaysia 30%
Petrolesport OAO Russian Federation 31%
Qingdao New Qianwan Container Terminal Co. Ltd. China 18%
Qingdao Qianwan Container Terminal Co. Ltd. China 20%
Shanghai East Container Terminal Co. Ltd. China 49%
Smart International Logistics Company Ltd. China 49%
South Florida Container Terminal LLC USA 49%
Vostochnaya Stevedore Company OOO Russian Federation 31%
Xiamen Songyu Container Terminal Co. Ltd. China 25%
A.P. Moller - Maersk | Annual Report 2017143
ADDITIONAL INFORMATION COMPANY OVERVIEW

Definition of terms
Technical terms, abbreviations and definitions of key figures and financial ratios.
EBIT margin gap to peersPeer group includes CMA CGM, APL, Hapag Lloyd, Hanjin, ZIM, Hyundai MM, K Line, OOCL, NYK, MOL, COSCO and CSCL. Peer average is TEU-weighted. EBIT margins are adjusted for gains/losses on sale of assets, restructuring charges, income/loss from associates and impairments. Maersk Line’s EBIT margin is also adjusted for depreciation to match industry standards (25 years).
Economic utilisationThe number of contracted days in percentage of total days in the calendar year.
Energy divisionFrom 2017, the Energy division consists of Maersk Oil, Maersk Drilling, Maersk Supply Service and Maersk Tankers, as well as other businesses (Maersk Training and FPSOs) and unallocated Energy headquarter costs.
Equity ratioIs calculated as the equity divided by total assets.
FFEForty Foot Equivalent unit container.
Jack-up rigA drilling rig resting on legs that can operate in waters of 25–150 metres.
Locked box transactionThe sale of a business where the equity price is locked based on a designated balance sheet date (locked box date) prior to signing. Earn-ings and cash flow from the locked box date until closing of the transaction is at the discre-tion of the buyer. As compensation, the seller receives a locked box interest from the locked box date until closing equivalent of the expect-ed cash profits for the period. Consequently, the buyer assumes the economic outcome as from locked box date.
Net interest-bearing debt (NIBD)Equals interest-bearing debt less cash and bank balances less other interest-bearing assets.
NOPATNet operating profit or loss after tax.
Product tankerVessel transporting refined oil products.
AlphalinerAlphaliner is a worldwide provider of container shipping data and analysis.
BacklogThe value of future contract coverage (revenue backlog).
boepdBarrels of oil equivalent per day.
BunkerType of oil used in ship engines.
CAGRCompound annual growth rate.
Cash flow from operating activities per shareIs A.P. Moller - Maersk’s operating cash flow from continuing operations divided by the num-ber of shares (of DKK 1,000 each), excluding A.P. Moller - Maersk’s holding of own shares.
Contract coveragePercentage indicating the part of ship/rig days that are contracted for a specific period.
Discontinued operationsDiscontinued operations are a major line of business (disposal group) that is either held for sale or has been sold in previous periods. The disposal group is reported separately in a single line in the income statement and cash flow statement. Comparison figures are restated. In the balance sheet assets and liabilities are classified and disclosed separately on an aggre-gate level in the balance sheet as assets held for sale and liabilities associated with assets held for sale. In the balance sheet comparison figures are not restated. Maersk Oil, Maersk Tankers, Maersk Drilling and Maersk Supply Service have been classified as discontinued operations and assets held for sale in 2017.
Dividend yieldThe dividend yield is equal to the proposed divi-dends of the year divided by the shares’ price.
DrewryDrewry is a leading international provider of re-search and consulting services to the maritime and shipping industry.
DrillshipA vessel that has been fitted with drilling equipment, mainly used for deepwater drilling.
Return on equityIs calculated as the profit/loss for the year divided by the average equity.
ROICReturn on invested capital after tax.
TEUTwenty Foot Equivalent Unit container.
Segments’ return on invested capital after tax (ROIC)Is net operating profit/loss after tax (NOPAT) divided by the quarterly average invested capital, net (segment assets less liabilities).
Time charterHire of a vessel for a specified period.
Total market capitalisationIs the total number of shares – excluding A.P. Moller - Maersk’s holding of own shares – multiplied by the end-of-year price quoted by NASDAQ OMX Copenhagen.
Total shareholder returnTotal shareholder return is equal to the price appreciation rate (price variance from the beginning to the end of the year) and the dividend yield.
Transport & Logistics divisionFrom 2017, the Transport & Logistics division consists of all A.P. Moller - Maersk activities except unallocated financial items and those activities allocated to the Energy division.
Triple-ETriple-E stands for Economy of scale, Energy efficiency and Environmentally improved.
Underlying result profit/lossUnderlying profit/loss is profit/loss for the year from continuing operations adjusted for net gains/losses from sale of non-current assets, etc. and net impairment losses as well as transaction and integration costs related to acquisitions. The adjustments are net of tax and include A.P. Moller - Maersk’s share of mentioned items in associates and joint ventures. Underlying segment result also excludes unallocated financial items.
UptimeA period when a unit is functioning and available for use.
A.P. Moller - Maersk | Annual Report 2017144
ADDITIONAL INFORMATION DEFINITION OF TERMS

Company announcements
28 June
• Cyber attack update
16 August
• Interim Report Q2 2017
21 August
• Sale of Mærsk Olie og Gas A/S
20 September
• Sale of Maersk Tankers A/S
10 October
• Sale of Maersk Tankers A/S completed
7 November
• Interim Report Q3 2017
• Financial Calendar 2018
28 November
• Change of management
30 November
• A.P. Møller - Mærsk A/S — Maersk Line A/S’
acquisition of Hamburg Süd closed
8 February
• Annual Report 2016 for A.P. Møller - Mærsk A/S
• Change of Chairman of the Board of Directors and proposal
for election of members of the Board of Directors
3 March
• Notice convening the Annual General Meeting 2017
in A.P. Møller - Mærsk A/S
14 March
• Maersk Line A/S to acquire Hamburg Süd — Sale and Purchase
Agreement signed
28 March
• Development of the Annual General Meeting on 28 March 2017
• Articles of Association for A.P. Møller - Mærsk A/S
• New chairman of the Board of Directors
29 March
• Establishment of Stock Option Plan
28 April
• Maersk Line A/S to acquire Hamburg Süd — Sale and Purchase
Agreement approved
11 May
• Interim Report Q1 2017
• Financial Calendar 2017 - update
The complete list of announcements is available http://investor.maersk.com/financials.cfm
A.P. Moller - Maersk | Annual Report 2017145
ADDITIONAL INFORMATION COMPANY ANNOUNCEMENTS

Highlights Q4 2017
For the continuing operations, A.P. Moller - Maersk reported a revenue of USD 8.2bn, equal to a growth of 16% (8% adjusted for Hamburg Süd) compared to Q4 2016. Underlying profit was USD 36m (loss of USD 272m), positively impacted by an underlying profit in Maersk Line of USD 53m (loss of USD 155m) and an underlying profit in APM Terminals of USD 115m (USD 91m), partly offset by an underlying loss in Damco of USD 21m (profit of USD 4m).
Cash flow from operating activities was USD 1.2bn, up 84% compared to Q4 2016 driven by the improved profitability and net working capital.
Maersk Line (excluding Hamburg
Süd) reported an increase in revenue
of 14.1% to USD 6.1bn (USD 5.3bn) as
freight rates increased by 7.2% to 1,933
USD/FFE (1,804 USD/FFE) and volumes
increased by 3.6% to 2,799k FFE (2,701k
FFE). Freight rates were higher than in
Q4 2016 across all trades except North
America trades, while the increase in
volumes mainly was driven by East-
West trades and Intra-Asia trades.
The underlying profit (excluding gain/
loss, impairments etc.) was USD 63m
(loss of USD 155m). Net profit was USD
91m (loss of USD 147m).
Global container demand is estimated
to have grown around 3% in Q4 2017,
indicating a slowdown from previous
quarters’ high growth. The growth is
primarily driven by North-South and
Intra-regional trades, while container
HIGHLIGHTS Q4
Revenue Underlying profit/loss
Profit/loss Cash flow from operating activities
Cash flow used for capital expenditure
Free cash flow Invested capital
USD million 2017 2016 2017 2016 2017 2016 2017 2016 2017 2016 2017 2016 2017 2016
Maersk Line 6,576 5,321 53 -155 48 -146 871 561 -4,556 -332 -3,685 229 25,363 20,082
APM Terminals 1,117 1,088 115 91 108 87 263 199 -246 -186 17 13 8,106 7,967
Damco 737 657 -21 4 -21 4 -28 -20 -2 -1 -30 -21 308 232
Svitzer 166 154 25 19 26 18 66 26 -5 -41 61 -15 1,334 1,203
Maersk Container Industry 247 213 1 -9 1 -11 -53 57 -6 -13 -59 44 333 357
Financial items, net after tax - - -158 -293 -158 -293 82 -46 -69 -103 132 -149 95 -698
Other businesses, unallocated and eliminations -669 -357 21 71 28 -4 -30 -139 843 106 813 -33 656 1,248
Continuing operations 8,174 7,076 36 -272 32 -345 1,171 638 -4,041 -570 -2,870 68 36,195 30,391
Discontinued operations - - - - 354 -2,332 - - - - - - 10,167 12,417
A.P. Moller - Maersk consolidated 8,174 7,076 36 -272 386 -2,677 1,171 638 -4,041 -570 -2,870 68 46,362 42,808
volume growth on the East-West trades
was subdued. The nominal global con-
tainer fleet grew around 4% compared
to Q4 2016 but the growth in effective
capacity was higher due to less idling.
Unit cost at floating bunker of 2,046
USD/FFE (1,973 USD/FFE) was 3.7%
higher than the same period last year
driven by significantly higher bunker
prices and lower headhaul utilisation.
Total bunker cost increased by 34.7%
to USD 903m as the average bunker
price increased by 24.9%. Bunker effi-
ciency per FFE loaded deteriorated by
4.1% to 949 kg/FFE (912 kg/FFE). The
deterioration in bunker efficiency per
FFE is in part due to increased capac-
ity committed to incoming volumes
from the slot purchase agreement not
included as loaded volume, and in part
by lower headhaul utilisation.
A.P. Moller - Maersk | Annual Report 2017146
ADDITIONAL INFORMATION HIGHLIGHTS Q4 2017

Unit cost at fixed bunker price was on
a par with Q4 2016 at 1,913 USD/FFE
(1,907 USD/FFE), however reflecting a
significant improvement of 5.7% (115
USD/FFE) from Q3 2017-unit cost at
fixed bunker price of 2,028 USD/FFE.
This was partly because of volume
recovery following the cyber-attack,
while unit cost remained impacted by
contingencies in Q4 2017.
Free cash flow from Maersk Line (ex-
cluding Hamburg Süd) was USD 497m
(USD 229m), as cash flow from operat-
ing activities of USD 871m (USD 561m)
was partly offset by cash flow used for
capital expenditure of USD 374m (USD
332m), driven by container investments
and delivery of one second generation
Triple-E vessel and one 15.2k TEU ves-
sel. The acquisition of Hamburg Süd
had a net cash impact of USD 4.2bn re-
sulting in a net negative free cash flow
of USD 3.7bn.
APM Terminals reported a profit of
USD 108m (USD 87m). The operating
business generated a profit of USD
115m (USD 111m), while projects under
implementation had a loss of USD
8m (loss of USD 24m). The increase
in profit was mainly caused by higher
volumes compared to 2016 as well as
a 2% increase in revenue per move.
The equity-weighted throughput in-
creased by 6.8% compared to Q4 2016
and by 5.0% excluding newly operated
terminals and divested terminals.
The latest estimate for port container
volume growth for Q4 2017 was 4.9%
(Drewry Q4 Forecaster).
Free cash flow was positive by USD
17m (USD 13m), as cash flow from op-
erating activities of USD 263m (USD
199m) was positively impacted by
increased revenue, however offset
by increased capital expenditures of
USD 246m (USD 186m).
Damco reported a 12% increase in
revenue to USD 737m (USD 657m)
mainly driven by 8% growth in supply
chain management volumes and 16%
growth in air freight volumes. The air
freight growth is supported by strong
turnaround of air freight activities in
China. Ocean volumes ended 2% be-
low same quarter last year.
The loss for Q4 of USD 21m (profit of
USD 4m), was negatively impacted by
product investments, restructuring
costs and tax. The result was further
negatively impacted by recovery from
the cyber-attack in Q3.
Cash flow from operating activities was
negative by USD 28m (negative USD
20m), mainly driven by the reported
loss and the higher net working capi-
tal influenced by higher revenue in Q4
year-on-year. Working capital meas-
ured in days sales outstanding were
back to pre-cyber-attack levels in Q4.
Svitzer reported an 8% increase in rev-
enue to USD 166m (USD 154m), driven
by higher volumes in Europe and the
Americas partially offset by decrease
in contract prices on harbour towage
in some regions.
The profit of USD 26m (USD 18m) was
positively impacted by lower opera-
tional costs following implementation
of various cost saving initiatives.
Cash flow from operating activities
improved to USD 66m (USD 26m), while
cash flow used for capital expenditure
amounted to USD 5m (USD 41m). The
improvements were driven by improved
profitability, lower investments in new
vessels and divestment of idle fleet.
Maersk Container Industry reported
a profit of USD 1m (loss of USD 11m),
driven by increased prices and higher
volumes in dry containers, which were
operated on one shift during part of Q4
2016 against two shifts in Q4 2017.
The refrigerated segment came out
slightly better in Q4 2017.
The free cash flow was negative USD
59m (positive 44m), due to increased
net working capital across the business
towards the end of the year to support
commitments in Q1 2018.
Discontinued operations
Maersk Drilling reported a net profit before im-
pairments of USD 98m (loss of USD 61m), positively
impacted by elimination of depreciation following
classification as discontinued operation and nega-
tively impacted by rigs being idle and day rates on
new contracts remaining on a low level.
The economic utilisation of the fleet was 72% (70%),
negatively affected by eight rigs being idle or partly idle
during Q4, but slightly up compared to Q4 2016. Of the
idle rigs, Maersk Developer and Maersk Venturer are
preparing for contract commencement in Q1 2018.
The higher cash flow from operating activities of USD
234m (USD 159m) was mainly due to improved working
capital and lower tax paid in Q4 2017. Cash flow used for
capital expenditures was positive USD 122m (negative
USD 41m) including the effect from the sale of shares in
EDC by USD 100m.
The operational performance across the fleet resulted
in an average operational uptime of 98% (99%) for the
jack-up rigs and 98% (98%) for the deepwater rigs.
Maersk Drilling signed four new contracts and three
contract extensions during Q4, adding 3,867 days and
USD 873m to the backlog.
Maersk Supply Service reported a net loss before im-
pairments of USD 20m (profit of USD 6m) negatively
impacted by lower rates and fewer vessels available
for trading due to divestments and lay-ups.
Maersk Supply Service had 15 vessels in lay-up at the
end of 2017.
The cash flow from operating activities was negative
USD 3m (positive USD 14m) while free cash flow was
negative USD 208m following delivery of two new
SSV vessels.
A.P. Moller - Maersk | Annual Report 2017147
ADDITIONAL INFORMATION HIGHLIGHTS Q4 2017

2017 2016
Income statement Q4 Q3 Q2 Q1 Q4 Q3 Q2 Q1
Revenue 8,174 7,980 7,690 7,101 7,076 6,980 6,700 6,510
Profit before depreciation, amortisation and impairment losses, etc. (EBITDA) 844 977 1,073 638 589 628 604 654
Depreciation, amortisation and impairment losses, net 709 782 889 635 644 612 643 596
Gain on sale of non-current assets, etc., net 77 8 54 15 63 9 110 8
Share of profit/loss in joint ventures 27 -202 14 30 40 38 28 24
Share of profit/loss in associated companies 34 20 25 22 -120 20 24 21
Profit/loss before financial items (EBIT) 273 21 277 70 -72 83 123 111
Financial items, net -137 -112 -234 -133 -236 -63 -147 -97
Profit/loss before tax 136 -91 43 -63 -308 20 -24 14
Tax 104 21 33 61 37 39 78 17
Profit/loss for the year – continuing operations 32 -112 10 -124 -345 -19 -102 -3
Profit/loss for the year – discontinued operations1 354 -1,427 -274 377 -2,332 457 220 227
Profit/loss for the year 386 -1,539 -264 253 -2,677 438 118 224
A.P. Møller - Mærsk A/S’ share 374 -1,555 -269 245 -2,680 429 101 211
Underlying result 36 254 205 -139 -272 -30 -183 -11
Balance sheetTotal assets 63,227 60,260 61,310 60,428 61,118 63,442 63,299 64,239
Invested capital 46,362 43,266 43,899 43,958 42,808 46,599 46,424 46,457
Net interest-bearing debt 14,864 12,475 11,550 11,664 10,737 11,390 11,706 10,653
Cash flow statementCash flow from operating activities2 1,171 430 878 117 638 476 257 -107
Cash flow used for capital expenditure2 -4,041 -1,270 -494 -382 -570 -498 13 -1,018
Financial ratiosReturn on invested capital after tax – continuing operations (ROIC) 2.9% 0.0% 3.1% 0.2% -0.7% 1.2% 0.1% 1.2%
Stock market ratiosShare price (B share), end of year, DKK 10,840 11,960 13,090 11,570 11,270 9,720 8,705 8,590
Share price (B share), end of year, USD 1,746 1,899 2,008 1,662 1,597 1,456 1,299 1,312
Business driversMaersk Line3
Transported volumes (FFE in ‘000) 2,799 2,632 2,700 2,601 2,701 2,698 2,655 2,361
Average freight rate (USD per FFE) 1,933 2,063 2,086 1,939 1,804 1,811 1,716 1,857
Unit cost (USD per FFE incl. VSA income) 2,046 2,135 2,051 2,087 1,973 1,991 1,911 2,060
Average fuel price (USD per tonne) 340 307 313 320 272 244 194 178
Maersk Line fleet, owned 287 285 282 284 292 286 283 287
Maersk Line fleet, chartered 389 383 364 355 347 325 347 318
Fleet capacity (TEU ‘000) 3,564 3,535 3,400 3,236 3,239 3,140 3,143 2,992
APM Terminals
Containers handled (measured in million TEU and weighted with ownership share) 10.3 10.2 9.8 9.4 9.7 9.5 9.4 8.7
1 Discontinued operations comprise Maersk Oil, Maersk Tankers, Maersk Drilling and Maersk Supply Service. Comparative figures have been restated for the income statement and cash flow statement.
2 From continuing operations.
Quarterly summary
A.P. Moller - Maersk | Annual Report 2017148
ADDITIONAL INFORMATION QUARTERLY SUMMARY
Amounts in USD million

External financial reporting for A.P. Moller - Maersk
A.P. Moller - Maersk has tailored the ex-
ternal financial reporting specifically to-
wards the needs of our different stake-
holders with two annual publications.
The Annual Report has a focus on the
very detailed legally required informa-
tion, whereas the Annual Magazine
has a focus on providing an overview of
key developments during the year. The
reports can be read individually or com-
bined depending on our stakeholders’
interests. The Annual Report is avail-
able electronically in English http://
investor.maersk.com/financials.cfm
The Annual Magazine provides an
overview of the operations and per-
formance of A.P. Moller - Maersk in
a concise and easy-to-read format.
This publication is not a substitute
for the Annual Report and does not
contain all the information needed to
give as full an understanding of the
A.P. Moller - Maersk’s performance,
financial position and future prospects
as provided in the Annual Report.
The Annual Magazine is produced in
English and Danish, both available in
hard copy and for download http://in-
vestor.maersk.com/financials.cfm
A.P. Moller - Maersk also produces
Interim Reports for each of the first
three quarters of the financial year,
and a summary report for Q4 is in-
cluded in the Annual Report.
To further add value, with a focus on
the professional segment and others
with more specific interests, detailed
presentations are available each quar-
ter following the release of the Interim
Reports and the Annual Report.
A.P. Moller - Maersk also hosts, on a
regular basis, a Capital Markets Day,
which can be followed through a live
webcast and the speakers’ presenta-
tion slides can be accessed via links.
This extended information of Interim
Reports, presentations and webcasts
can be found on our Investor Relations
website http://investor.maersk.com/
Quarterly figures for 2010-2017 are
available http://investor.maersk.com/
financials.cfm
The Board of Directors of
A.P. Møller - Mærsk A/S continues to
consider the “Recommendations for
Corporate Governance” implemented
by NASDAQ Copenhagen. For further
information see page 50 of this report.
Sustainability and gender composition of managementAn independently assured Sustain-
ability Report for 2017 is published,
which provides detailed information
on A.P. Moller - Maersk’s sustaina bility
performance. The report serves as
A.P. Moller - Maersk’s Communica-
tion on Progress as required by the
UN Global Compact, and ensures
compliance with the requirements of
Section 99a & b of the Danish Financial
Statements Act (Årsregnskabsloven)
on corporate social responsibility and
reporting on the gender composition
of management. The report is available
https://www.maersk.com/business/
sustainability/sustainability-re-
ports-and-publications/reports
Additional information on how we
manage issues, explaining implemen-
tation, progress and relevant commit-
ments and frameworks can be found
on the Sustainability website http://
www.maersk.com/en/the-maersk-
group/sustainability
Government payments – Maersk OilDisclosure of tax payments on a
country-by-country basis for 2017 in
accordance with the EU Accounting
Directive and as implemented in
Section 99c of the Danish Financial
Statements Act (Årsregnskabsloven)
is provided in a separate report. The
report is available http://investor.
maersk.com/financials.cfm
A.P. Moller - Maersk | Annual Report 2017149
ADDITIONAL INFORMATION EXTERNAL FINANCIAL REPORTING FOR A.P. MOLLER - MAERSK

Colophon
Editors
Stig Frederiksen
Finn Glismand
Jesper Ridder Olsen
Design and layout
e-Types & e-Types Daily
ISSN 1604-2913
Produced in Denmark 2018
Board of Directors, A.P. Møller - Mærsk A/S
Jim Hagemann Snabe, Chairman
Niels Jacobsen, Vice Chairman
Ane Mærsk Mc-Kinney Uggla, Vice Chairman
Dorothee Blessing
Niels Bjørn Christiansen
Renata Frolova-Hammer
Arne Karlsson
Jan Leschly
Palle Vestergaard Rasmussen
Robert Routs
Robert Mærsk Uggla
Executive Board, A.P. Møller - Mærsk A/S
Søren Skou, Chief Executive Officer (CEO)
Claus V. Hemmingsen, Vice Chief Executive Officer (Vice CEO)
Jakob Stausholm, Chief Finance, Strategy & Transformation Officer (CFO)
Vincent Clerc, Chief Commercial Officer (CCO), Maersk Line
Morten Engelstoft, Chief Executive Officer (CEO), APM Terminals
Søren Toft, Chief Operating Officer (COO), Maersk Line
Audit Committee
Arne Karlsson, Chairman
Niels Bjørn Christiansen
Robert Routs
Remuneration Committee
Jim Hagemann Snabe, Chairman
Niels Jacobsen
Ane Mærsk Mc-Kinney Uggla
Transformation & Innovation Committee
Niels Bjørn Christiansen, Chairman
Jim Hagemann Snabe
Robert Mærsk Uggla
Auditor
PricewaterhouseCoopers
Statsautoriseret Revisionspartnerselskab
A.P. Moller - Maersk | Annual Report 2017150
COLOPHON

A.P. Møller - Mærsk A/S
Esplanaden 50
DK-1098 Copenhagen K
Tel. +45 33 63 33 63
www.maersk.com