2017 barooga public school annual report - amazon s3
TRANSCRIPT

Barooga Public SchoolAnnual Report
2017
1139
Printed on: 1 April, 2018Page 1 of 11 Barooga Public School 1139 (2017)

Introduction
The Annual Report for 2017 is provided to the community of Barooga Public School as an account of the school'soperations and achievements throughout the year.
It provides a detailed account of the progress the school has made to provide high quality educational opportunities forall students, as set out in the school plan. It outlines the findings from self–assessment that reflect the impact of keyschool strategies for improved learning and the benefit to all students from the expenditure of resources, including equityfunding.
John Francis
Principal
School contact details
Barooga Public SchoolHughes StBarooga, 3644www.barooga-p.schools.nsw.edu.aubarooga-p.School@det.nsw.edu.au03 5873 4242
Printed on: 1 April, 2018Page 2 of 11 Barooga Public School 1139 (2017)
School background
School vision statement
Barooga Public School is a vibrant and innovative learning community that is committed to delivering excellence within arich and diverse environment. Every student has the opportunity to achieve their personal best through engaged, activelearning in a safe, respectful and supportive school.
School context
Barooga Public School is the only public school located in the rural town of Barooga, adjacent to the larger Victorian townof Cobram. The school’s population in recent years has been around 150 students. In recent years an increasingnumber of low socio–economic families have enrolled at the school. The school has always had a multicultural mix andincludes a number of LBOE students. Around 5% of the school student body are Aboriginal. Parent and communitymembers of the community make valuable contributions to the school’s programs and welfare of the students. Whilstover the past few years the school’s main focus was to improve the literacy and numeracy standards of students,programs are also in place to develop the whole child. The You Can Do It program and philosophy is embedded into theschool’s culture with the Stephanie Alexander Kitchen Garden Program becoming an integral part of the school in recentyears. The school attracts equity funding to support its targeted programs.
Self-assessment and school achievement
Self-assessment using the School Excellence Framework
This section of the Annual Report outlines the findings from self–assessment using the School Excellence Framework,school achievements and the next steps to be pursued.
This year, our school undertook self–assessment using the School Excellence Framework. The framework supportspublic schools throughout NSW in the pursuit of excellence by providing a clear description of high quality practiceacross the three domains of Learning, Teaching and Leading.
[Insert a narrative of the progress achieved across the domains of Learning, Teaching, and Leading]
A School Excellence Framework self–evaluation was conducted for the 2017 school year.
In the area of Learning it was determined Barooga Public School was delivering in Learning Culture, Wellbeing,Curriculum, Assessment and Reporting and working towards delivering in Student Performance Measures.
In the area of Teaching it was determined Barooga Public School was delivering in Effective Classroom Practice, DataSkills and Use, Professional Standards and Learning and Development.
In the area of Leading it was determined that Barooga Public School was delivering in Educational Leadership, SchoolPlanning, Implementation and Reporting, School Resources and Management Practices and Processes
Our self–assessment process will assist the school to refine our school plan, leading to further improvements in thedelivery of education to our students.
For more information about the School Excellence Framework:
https://education.nsw.gov.au/teaching–and–learning/school–excellence–and–accountability/sef–evidence–guide
Printed on: 1 April, 2018Page 3 of 11 Barooga Public School 1139 (2017)
Strategic Direction 1
Quality Learning
Purpose
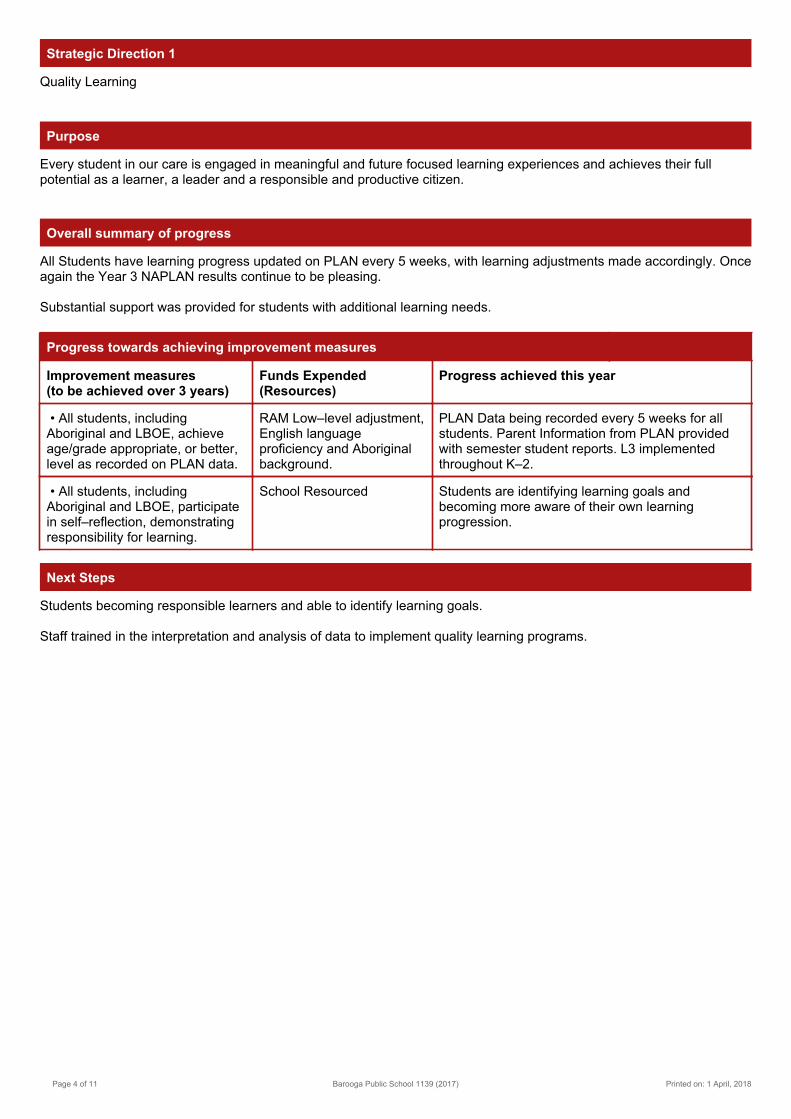
Every student in our care is engaged in meaningful and future focused learning experiences and achieves their fullpotential as a learner, a leader and a responsible and productive citizen.
Overall summary of progress
All Students have learning progress updated on PLAN every 5 weeks, with learning adjustments made accordingly. Onceagain the Year 3 NAPLAN results continue to be pleasing.
Substantial support was provided for students with additional learning needs.
Progress towards achieving improvement measures
Improvement measures(to be achieved over 3 years)
Funds Expended(Resources)
Progress achieved this year
• All students, includingAboriginal and LBOE, achieveage/grade appropriate, or better,level as recorded on PLAN data.
RAM Low–level adjustment,English languageproficiency and Aboriginalbackground.
PLAN Data being recorded every 5 weeks for allstudents. Parent Information from PLAN providedwith semester student reports. L3 implementedthroughout K–2.
• All students, includingAboriginal and LBOE, participatein self–reflection, demonstratingresponsibility for learning.
School Resourced Students are identifying learning goals andbecoming more aware of their own learningprogression.
Next Steps
Students becoming responsible learners and able to identify learning goals.
Staff trained in the interpretation and analysis of data to implement quality learning programs.
Printed on: 1 April, 2018Page 4 of 11 Barooga Public School 1139 (2017)
Strategic Direction 2
Quality Teaching and Leadership
Purpose
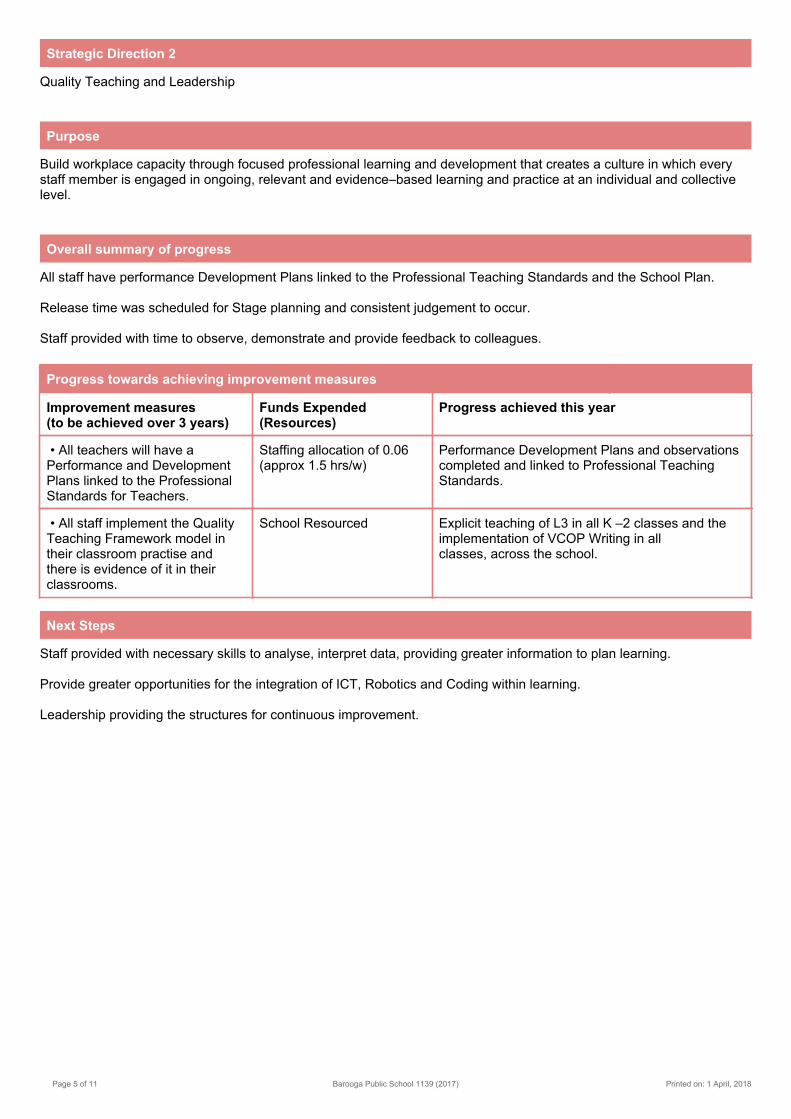
Build workplace capacity through focused professional learning and development that creates a culture in which everystaff member is engaged in ongoing, relevant and evidence–based learning and practice at an individual and collectivelevel.
Overall summary of progress
All staff have performance Development Plans linked to the Professional Teaching Standards and the School Plan.
Release time was scheduled for Stage planning and consistent judgement to occur.
Staff provided with time to observe, demonstrate and provide feedback to colleagues.
Progress towards achieving improvement measures
Improvement measures(to be achieved over 3 years)
Funds Expended(Resources)
Progress achieved this year
• All teachers will have aPerformance and DevelopmentPlans linked to the ProfessionalStandards for Teachers.
Staffing allocation of 0.06(approx 1.5 hrs/w)
Performance Development Plans and observationscompleted and linked to Professional TeachingStandards.
• All staff implement the QualityTeaching Framework model intheir classroom practise andthere is evidence of it in theirclassrooms.
School Resourced Explicit teaching of L3 in all K –2 classes and theimplementation of VCOP Writing in allclasses, across the school.
Next Steps
Staff provided with necessary skills to analyse, interpret data, providing greater information to plan learning.
Provide greater opportunities for the integration of ICT, Robotics and Coding within learning.
Leadership providing the structures for continuous improvement.
Printed on: 1 April, 2018Page 5 of 11 Barooga Public School 1139 (2017)

Strategic Direction 3
Quality School Culture
Purpose
Build stronger, positive relationships as an educational community, inspiring a culture of collaboration, engagedcommunication, empowered leadership and organisational practices to ensure our students thrive and show growth intheir learning in a supportive and mutually respected environment.
Overall summary of progress
Progress towards achieving improvement measures
Improvement measures(to be achieved over 3 years)
Funds Expended(Resources)
Progress achieved this year
• Increased enrolments fromBarooga and surrounding area.
School Resources Promotion throughout the Barooga communityof the school through print and social media.Extensive representation at Pre Schools. 6 weekTransition to School program for 2018Kindergarten.
• Increase in satisfaction ratingfrom surveys
Positive feedback from school surveys.
• Reduced incidents ofclassroom and playgroundmisbehaviour recorded.
School Resourced –Professional Learning
Expression of Interest in Positive Behaviour forLearning (PBL). Staff provided with initialtrainingBehaviour Matrix developed.
• Increased communityengagement, especially fromequity groups (Aboriginal &LBOE)
Continued multi platform approach to schoolpromotion.
Next Steps
To implement Positive Behaviour for Learning (PBL).
Provide parents and the community with greater opportunities for involvement and engagement with the school.
Printed on: 1 April, 2018Page 6 of 11 Barooga Public School 1139 (2017)

Key Initiatives Resources (annual) Impact achieved this year
Aboriginal background loading RAM
• Aboriginal backgroundloading ($4 977.00)
Good attendance for Aboriginal students.initial planning to update artwork in 2017began.
English language proficiency RAM • English languageproficiency ($1 927.00)
SLSOs supporting students
Low level adjustment for disability RAM • Low level adjustment fordisability ($25 789.00)
LaST team prioritising caseload, which hasincreased support for students needingassistance greatly.
Quality Teaching, SuccessfulStudents (QTSS)
Staffing Allocation • Quality Teaching,Successful Students(QTSS) ($0.00)
Provided professional learning opportunitiesfor all teaching staff.
Socio–economic background RAM • Socio–economicbackground ($2 809.00)
Used to support students access curriculumoptions and provide financial support forstudents to attend learning opportunities.
Support for beginning teachers RAM
• Support for beginningteachers ($5 444.00)
Concluded at the end of Term 1
Printed on: 1 April, 2018Page 7 of 11 Barooga Public School 1139 (2017)
Student information
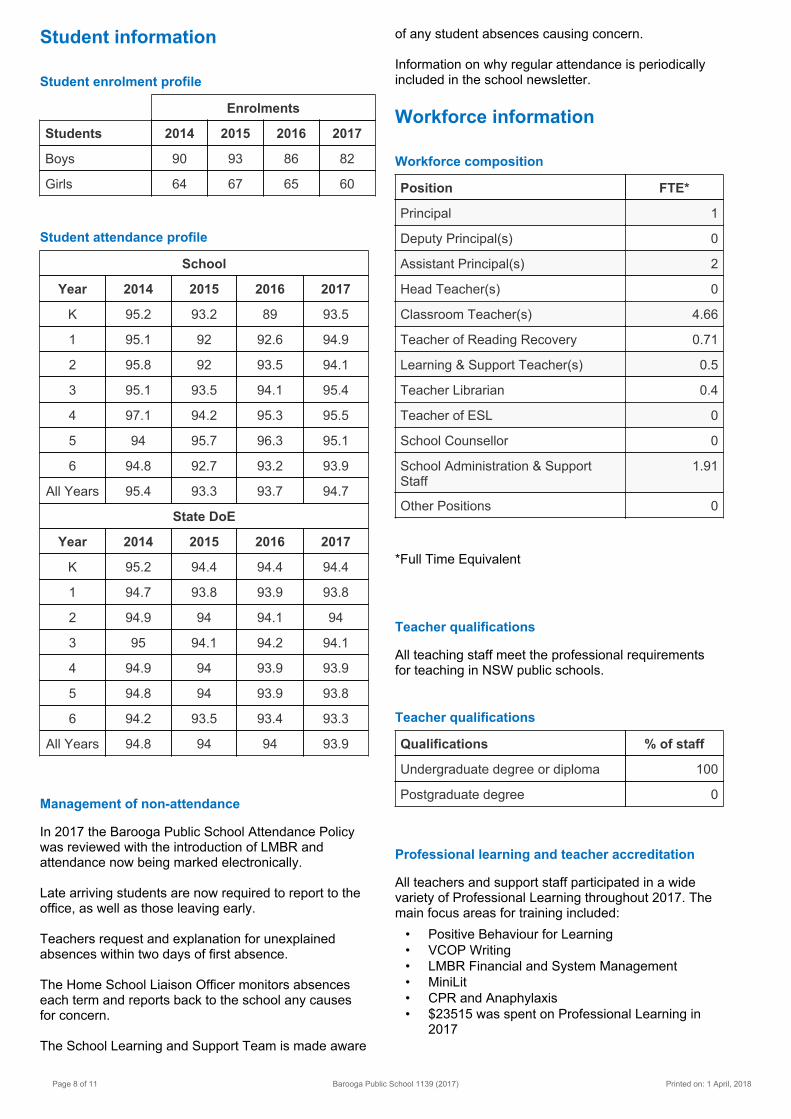
Student enrolment profile
Enrolments
Students 2014 2015 2016 2017
Boys 90 93 86 82
Girls 64 67 65 60
Student attendance profile
School
Year 2014 2015 2016 2017
K 95.2 93.2 89 93.5
1 95.1 92 92.6 94.9
2 95.8 92 93.5 94.1
3 95.1 93.5 94.1 95.4
4 97.1 94.2 95.3 95.5
5 94 95.7 96.3 95.1
6 94.8 92.7 93.2 93.9
All Years 95.4 93.3 93.7 94.7
State DoE
Year 2014 2015 2016 2017
K 95.2 94.4 94.4 94.4
1 94.7 93.8 93.9 93.8
2 94.9 94 94.1 94
3 95 94.1 94.2 94.1
4 94.9 94 93.9 93.9
5 94.8 94 93.9 93.8
6 94.2 93.5 93.4 93.3
All Years 94.8 94 94 93.9
Management of non-attendance
In 2017 the Barooga Public School Attendance Policywas reviewed with the introduction of LMBR andattendance now being marked electronically.
Late arriving students are now required to report to theoffice, as well as those leaving early.
Teachers request and explanation for unexplainedabsences within two days of first absence.
The Home School Liaison Officer monitors absenceseach term and reports back to the school any causesfor concern.
The School Learning and Support Team is made aware
of any student absences causing concern.
Information on why regular attendance is periodicallyincluded in the school newsletter.
Workforce information
Workforce composition
Position FTE*
Principal 1
Deputy Principal(s) 0
Assistant Principal(s) 2
Head Teacher(s) 0
Classroom Teacher(s) 4.66
Teacher of Reading Recovery 0.71
Learning & Support Teacher(s) 0.5
Teacher Librarian 0.4
Teacher of ESL 0
School Counsellor 0
School Administration & SupportStaff
1.91
Other Positions 0
*Full Time Equivalent
Teacher qualifications
All teaching staff meet the professional requirementsfor teaching in NSW public schools.
Teacher qualifications
Qualifications % of staff
Undergraduate degree or diploma 100
Postgraduate degree 0
Professional learning and teacher accreditation
All teachers and support staff participated in a widevariety of Professional Learning throughout 2017. Themain focus areas for training included: • Positive Behaviour for Learning • VCOP Writing • LMBR Financial and System Management • MiniLit • CPR and Anaphylaxis • $23515 was spent on Professional Learning in
2017
Printed on: 1 April, 2018Page 8 of 11 Barooga Public School 1139 (2017)

Financial information (for schoolsusing both OASIS and SAP/SALM)
Financial information
The three financial summary tables cover 13 months(from 1 December 2016 to 31 December 2017).
The financial summary consists of school incomebroken down by funding source and is derived from theschool Annual Financial Statement.
Barooga Public School was careful with it's expenditurein 2017 as funding arrangements are in the process ofchanging, along with the school's financial accountingchanging over from OASIS to SAP/SALM in July 2017.
Receipts $
Balance brought forward 118,866
Global funds 88,830
Tied funds 73,219
School & community sources 28,363
Interest 1,581
Trust receipts 3,624
Canteen 0
Total Receipts 195,617
Payments
Teaching & learning
Key Learning Areas 15,885
Excursions 1,755
Extracurricular dissections 19,887
Library 1,175
Training & Development 967
Tied Funds Payments 74,859
Short Term Relief 18,147
Administration & Office 20,586
Canteen Payments 0
Utilities 16,594
Maintenance 5,667
Trust Payments 5,253
Capital Programs 0
Total Payments 180,775
Balance carried forward 133,707
Figures presented in this report may be subject torounding so may not reconcile exactly with the bottom
line totals, which are calculated without any rounding.
The information provided in the financial summaryincludes reporting from 1 January 2017 to 31December 2017.
2017 Actual ($)
Opening Balance 0
Revenue 307,632
Appropriation 273,400
Sale of Goods and Services 950
Grants and Contributions 32,966
Gain and Loss 0
Other Revenue 0
Investment Income 316
Expenses -175,240
Recurrent Expenses -175,240
Employee Related -86,648
Operating Expenses -88,592
Capital Expenses 0
Employee Related 0
Operating Expenses 0
SURPLUS / DEFICIT FOR THEYEAR
132,392
Balance Carried Forward 132,392
The Opening balance for the 2017 school financial yearis displayed in the OASIS table as Balance broughtforward. The financial summary table for the yearended 31 December 2017 shows the Opening balanceas $0.00 because the Opening balance for the 2017school financial year is reported in the OASIS table (asBalance brought forward).
The amount displayed in the Appropriation category ofthe financial summary table is drawn from the Balancecarried forward shown in the OASIS table and includesany financial transactions in SAP the school hasundertaken since migration from OASIS to SAP/SALM.For this reason the amount shown for Appropriation willnot equal the OASIS Balance carried forward amount.
Barooga Public School was careful with it's expenditurein 2017 as funding arrangements are in the process ofchanging, along with the school's financial accountingchanging over from OASIS to SAP/SALM in July 2017.
Financial summary equity funding
The equity funding data is the main component of the'Appropriation' section of the financial summary above.
Printed on: 1 April, 2018Page 9 of 11 Barooga Public School 1139 (2017)
2017 Actual ($)
Base Total 1,207,568
Base Per Capita 23,077
Base Location 18,409
Other Base 1,166,082
Equity Total 137,320
Equity Aboriginal 5,378
Equity Socio economic 59,568
Equity Language 1,777
Equity Disability 70,596
Targeted Total 35,950
Other Total 83,574
Grand Total 1,464,411
Figures presented in this report may be subject torounding so may not reconcile exactly with the bottomline totals, which are calculated without any rounding.
A full copy of the school’s financial statement is tabledat the annual general meetings of the parent and/orcommunity groups. Further details concerning thestatement can be obtained by contacting the school.
School performance
NAPLAN
In the National Assessment Program, the results acrossthe Years 3, 5, 7 and 9 literacy andnumeracy assessments are reported on a scale fromBand 1 to Band 10. The achievement scalerepresents increasing levels of skillsand understandings demonstrated in theseassessments.
Year 3 students continue to demonstrate pleasingprogress in Literacy, with a greater percentage ofstudents in the lower two bands and more in the topband, than the school's recent average.
In Literacy, there is a lower percentage of Year 5students in the lowest band compared to the recentpast average.
Percentage in Bands:Year 3 - Grammar & Punctuation
Band 1 2 3 4 5 6
Percentage of students 0.0 8.7 21.7 21.7 21.7 26.1
School avg 2015-2017 3.0 13.5 26.4 19.0 20.5 17.5
Percentage in Bands:Year 3 - Reading
Band 1 2 3 4 5 6
Percentage of students 0.0 8.3 29.2 25.0 20.8 16.7
School avg 2015-2017 1.5 10.1 33.7 17.2 21.6 15.8
Percentage in Bands:Year 3 - Spelling
Band 1 2 3 4 5 6
Percentage of students 0.0 17.4 21.7 30.4 17.4 13.0
School avg 2015-2017 6.0 16.2 20.8 27.8 19.0 10.1
Percentage in Bands:Year 3 - Writing
Band 1 2 3 4 5 6
Percentage of students 0.0 0.0 20.8 50.0 16.7 12.5
School avg 2015-2017 4.5 4.5 32.5 31.3 17.2 10.0
Percentage in Bands:Year 5 - Grammar & Punctuation
Band 3 4 5 6 7 8
Percentage of students 5.6 44.4 16.7 11.1 22.2 0.0
School avg 2015-2017 8.2 36.1 18.5 16.6 17.2 3.3
Percentage in Bands:Year 5 - Reading
Band 3 4 5 6 7 8
Percentage of students 11.1 22.2 22.2 22.2 22.2 0.0
School avg 2015-2017 15.2 28.4 25.3 13.9 15.6 1.7
Percentage in Bands:Year 5 - Spelling
Band 3 4 5 6 7 8
Percentage of students 5.6 33.3 27.8 27.8 5.6 0.0
School avg 2015-2017 13.4 27.3 22.2 23.9 11.6 1.7
Percentage in Bands:Year 5 - Writing
Band 3 4 5 6 7 8
Percentage of students 11.1 27.8 55.6 5.6 0.0 0.0
School avg 2015-2017 18.4 20.5 46.2 10.0 3.3 1.7
Printed on: 1 April, 2018Page 10 of 11 Barooga Public School 1139 (2017)
Year 3 students continue to demonstrate pleasingprogress in Numeracy, with a greater percentage ofstudents in the lower two bands and more in the topband, than the school's recent average.
In Numeracy, there is a lower percentage of Year 5students in the lowest band compared to the recentpast average.
Percentage in Bands:Year 3 - Numeracy
Band 1 2 3 4 5 6
Percentage of students 0.0 16.7 20.8 33.3 8.3 20.8
School avg 2015-2017 3.0 24.1 19.3 21.8 18.5 13.2
Percentage in Bands:Year 5 - Numeracy
Band 3 4 5 6 7 8
Percentage of students 0.0 44.4 33.3 16.7 5.6 0.0
School avg 2015-2017 3.3 40.7 24.2 23.4 5.2 3.3
The percentage of Year 3 students achieving the topband in Year 3 Literacy and Numeracy has increased,compared to the average of recent years.
Parent/caregiver, student, teachersatisfaction
In satisfaction surveys conducted, a positive responsewas recorded. Approximately one third of familiesresponded with 70% very satisfied. The remainder ofthe responses were either satisfied or somewhatsatisfied.
Policy requirements
Aboriginal education
• Senior Aboriginal students led School Assemblyrecognising Sorry Day and Reconciliation Week.
• Year 6 student's gift to the school, from their ownfundraising was for a flagpole to fly the AboriginalFlag.
• Aboriginal students have excellent attendance,better than the school average.
• Aboriginal background funding was used toprovide personal learning plans and support forlearning and engagement.
Multicultural and anti-racism education
In 2017 Barooga Public School continues to embraceour cultural diversity. Students from languagebackgrounds other than English represent a smallproportion of the student population. Within our school,cultural diversity is recognised across the Key LearningAreas. Activities children participate in provide a vehicleto study and appreciate other cultures and encourageattitudes of respect and tolerance.
Our Anti–racism Contact Officer kept staff informedabout current policies and updates.
Printed on: 1 April, 2018Page 11 of 11 Barooga Public School 1139 (2017)