2017 fungicide test summary - fyi.extension.wisc.edu · standard mixed-model analysis of variance...
TRANSCRIPT
Wisconsin Field Crops Pathology Fungicide
Tests Summary
2017
Damon Smith, UW Plant Pathology Brian Mueller, UW Plant Pathology Scott Chapman, UW Entomology

ii
Acknowledgements
This report is a concise summary of pesticide related research trials conducted in 2017 under the direction of the Wisconsin Field Crops Pathology program in the Department of Plant Pathology at the University of Wisconsin-Madison. We thank many summer hourlies and research interns for assisting in conducting these trials. We would also like to thank Carol Groves, Jaime Willbur, Megan McCaghey, Cristina Zambrana-Echevarria, Bryan Jensen, John Gaska, Adam Roth and Shawn Conley for technical support. The authors would also like to thank the following for their support in 2017: Albaugh, LLC. AMVAC Chemical Corporation BASF Bayer CropScience DuPont FMC Gowan Koch Industries Midwest Forage Association North Central Soybean Research Program SipcamAdvan Syngenta Luxembourg-Pamol Wisconsin Soybean Marketing Board
Disclaimer
Mention of specific products in this publication are for your convenience and do represent an endorsement or criticism. This by no means is a complete test of all products available. You are responsible for using pesticides according to the manufacturers current label. Follow all label instructions when using any pesticide. Remember the label is the law!

iii
Table of Contents
Evaluation of foliar fungicide applications in reduced-lignin alfalfa systems in Wisconsin, 2017 ...... 1 Evaluation of foliar fungicides for control of common rust of dent corn in Wisconsin, 2017 .............. 4 Evaluation of foliar fungicides for control of ear rot and mycotoxin accumulation of corn for silage in Wisconsin, 2017 ..................................................................................................................................... 5 Evaluation of foliar fungicides for control of Septoria brown spot on soybean in Wisconsin, 2017 .... 6 Evaluation of foliar fungicide treatments for control of white mold of soybean in Hancock Wisconsin, Trial #1, 2017 ......................................................................................................................................... 7 Evaluation of foliar fungicide treatments for control of white mold of soybean in Hancock Wisconsin, Trial #2, 2017 ......................................................................................................................................... 8 Evaluation of foliar fungicide treatments for control of white mold of soybean in Hancock Wisconsin, Trial #3, 2017 ......................................................................................................................................... 10 Evaluation of foliar fungicides for control of common rust of sweet corn in Wisconsin, 2017 ............ 11 Evaluation of foliar fungicides for control of foliar diseases of wheat in Wisconsin, 2017 .................. 10

1
Evaluation of foliar fungicide applications in reduced-lignin alfalfa systems in Wisconsin, 2017 ALFALFA (Medicago sativa ‘DKA44-16RR’ and ‘HarvXtra’)
Common leaf spot; Pseudopeziza medicaginis A field trial was previously established at the Arlington Agricultural Research Station (AARS) located in Columbia and Dane Counties in Wisconsin in spring of 2015. Two alfalfa varieties, one conventional variety and one reduced-lignin variety, were seeded on April 17, 2015. Plots were 10 feet wide and 50 feet long. In 2017, three fungicide treatments were applied to both alfalfa varieties using a 10-foot wide hand-held boom attached to a CO2 pressurized backpack sprayer at a rate of 20 GPA. Fungicides were applied to each crop when alfalfa was six-to-eight inches tall. A non-treated control was also included for a total of four treatments. Targeted cutting intervals were 28 days or 35 days. However, due to weather, these intervals were modified in some cases. Treatments for the first crop were applied on April 21, 2017. On May 22, 2017 first crop (28-day cutting interval) was conducted by using a 30-inch wide small plot flail chopper to harvest one strip from one 5-ft section of each plot (randomly chosen section). Dry-matter yield, foliar disease severity, defoliation and forage quality samples were collected at the time of harvest. Eight days later (May 30, 2017), another 30-inch wide strip was harvested (35-day cutting interval) from the other 5-ft section of each plot. All yield, quality, and disease data were again collected. All remaining alfalfa was then removed from the entire trial on the same day. Thus, the second crop was established. Fungicide treatments were applied to the second crop on June 6, 2016. The second crop 28-day cutting interval was conducted on June 27, 2017 while the 35-day cutting interval was conducted on July 5, 2017. All procedures and data acquisition were conducted in the same manner as on the first crop and the field was cleared on July 6 to establish the third crop. A third application of fungicide was applied on July 13, 2017. The third crop 28-day cutting interval was conducted on August 1, 2017 while the 35-day cutting interval was conducted on August 9, 2017. All procedures and data acquisition were conducted as described previously. The experimental design was a split-split plot with 4 replicates. Alfalfa variety was considered the whole plot, fungicide treatment the sub-plot, and cutting treatment the sub-sub plot. All yield, quality, and disease data were compiled together for the entire season (e.g. average disease severity for the season, average season defoliation, total yield, etc.) and analyzed using standard mixed-model analysis of variance and means separated for treatment effects within each variety using the test of least significant difference. Here we report the yield and quality parameters together as milk per acre. Previous research where fungicide has been applied to conventional (e.g. no reduced-lignin or low-lignin trait) alfalfa in Wisconsin has resulted in infrequent cases where fungicide resulted in a significant increase in yield or a positive return on investment, because subjecting alfalfa to timely cutting (e.g. 30-day cutting intervals) usually results in plants with low foliar disease, undetectable defoliation, and extremely high quality. Plants under this optimal production system typically don’t respond to fungicide application, or respond infrequently. With the advent of low-lignin and reduced-lignin alfalfa varieties, management plans and cutting intervals are quickly changing. For these alfalfa varieties, cutting durations are being extended an extra 7-10 days. Subjecting alfalfa stands to longer cutting intervals (e.g. 35- or 40-day cutting interval) results in more disease pressure, detectable defoliation, and an inherent reduction in overall quality. Applying fungicide to alfalfa stands subjected to these longer cutting intervals appears to result in a higher likelihood of positive ROI. Continuing to cut low-lignin or reduced-lignin alfalfa varieties on a 28- to 30-day interval will result in reduced chance of ROI in Wisconsin. Combining reduced-lignin or low-lignin alfalfa with fungicide application on stands subjected to long cutting durations (35- to 40-days) will result in a higher likelihood of positive ROI in Wisconsin.
2
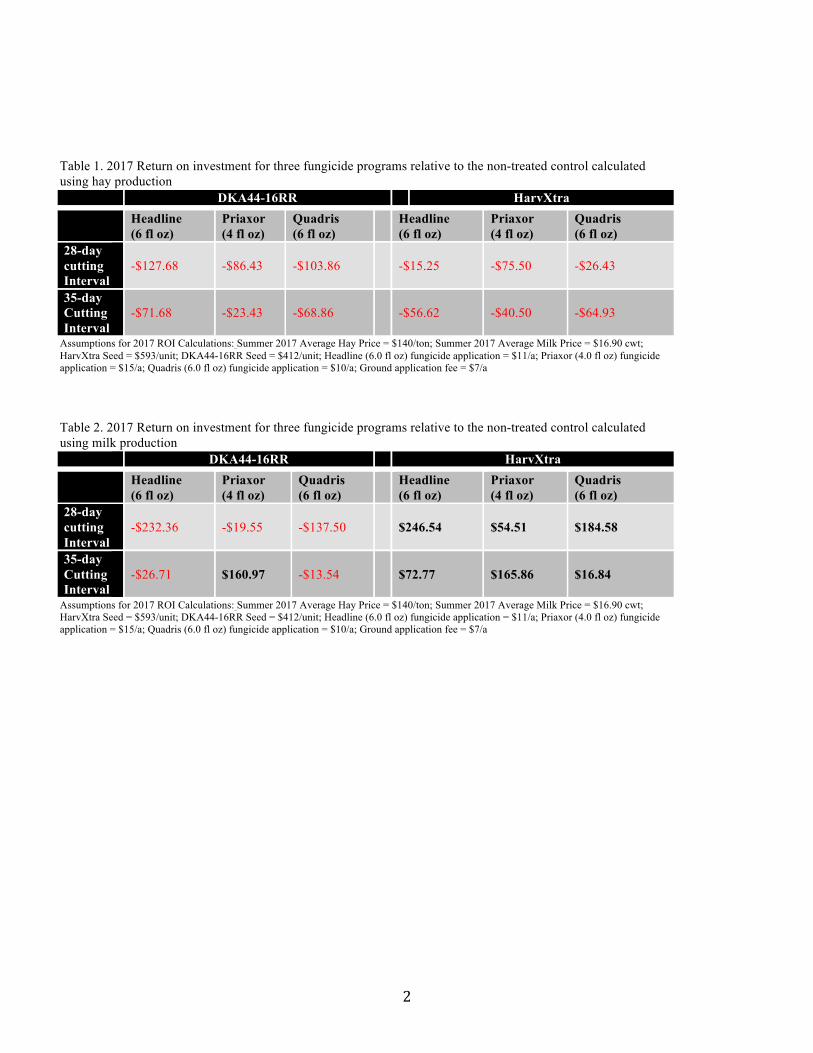
Table 1. 2017 Return on investment for three fungicide programs relative to the non-treated control calculated using hay production DKA44-16RR HarvXtra
Headline (6 fl oz)
Priaxor (4 fl oz)
Quadris (6 fl oz)
Headline (6 fl oz)
Priaxor (4 fl oz)
Quadris (6 fl oz)
28-day cutting Interval
-$127.68 -$86.43 -$103.86 -$15.25 -$75.50 -$26.43
35-day Cutting Interval
-$71.68 -$23.43 -$68.86 -$56.62 -$40.50 -$64.93
Assumptions for 2017 ROI Calculations: Summer 2017 Average Hay Price = $140/ton; Summer 2017 Average Milk Price = $16.90 cwt; HarvXtra Seed = $593/unit; DKA44-16RR Seed = $412/unit; Headline (6.0 fl oz) fungicide application = $11/a; Priaxor (4.0 fl oz) fungicide application = $15/a; Quadris (6.0 fl oz) fungicide application = $10/a; Ground application fee = $7/a
Table 2. 2017 Return on investment for three fungicide programs relative to the non-treated control calculated using milk production DKA44-16RR HarvXtra
Headline (6 fl oz)
Priaxor (4 fl oz)
Quadris (6 fl oz)
Headline (6 fl oz)
Priaxor (4 fl oz)
Quadris (6 fl oz)
28-day cutting Interval
-$232.36 -$19.55 -$137.50 $246.54 $54.51 $184.58
35-day Cutting Interval
-$26.71 $160.97 -$13.54 $72.77 $165.86 $16.84
Assumptions for 2017 ROI Calculations: Summer 2017 Average Hay Price = $140/ton; Summer 2017 Average Milk Price = $16.90 cwt; HarvXtra Seed = $593/unit; DKA44-16RR Seed = $412/unit; Headline (6.0 fl oz) fungicide application = $11/a; Priaxor (4.0 fl oz) fungicide application = $15/a; Quadris (6.0 fl oz) fungicide application = $10/a; Ground application fee = $7/a

3
nsns
ns
ns
ns
ns
ns
ns
16000
16500
17000
17500
18000
18500
19000
19500
20000
Non-treated Quadris(6.0floz) Headline(6.0floz) Priaxor(4floz)
TotalPoundsPerAcre
Figure1.2017MilkPerAcreCalculationsforArlington,WI(28-DayInterval)
DKA44-16RR HarvXtra
b
ab ab
a
b
abab
a
16000
16500
17000
17500
18000
18500
19000
19500
20000
Non-treated Quadris(6.0floz) Headline(6.0floz) Priaxor(4floz)
TotalPoundsPerAcre
Figure2.2017MilkPerAcreCalculationsforArlington,WI(35-DayInterval)
DKA44-16RR HarvXtra

4
Evaluation of foliar fungicides for control of common rust of dent corn in Wisconsin, 2017 DENT CORN (Zea mays ‘DKC 47-27RIB’)
Common rust; Puccinia sorghi
The trial was established at the Arlington Agricultural Research Station located in Arlington, WI. The corn hybrid ‘DKC 47-27RIB’ was chosen for this study. Corn was planted on 10 May in a field consisting of a Plano silt loam soil (0 to 2% slopes) with a Joy silt loam intrusion (0 to 4% slopes). The experimental design was a randomized complete block with four replicates. Plots consisted of four 30-in spaced rows, 20 ft long and 10 ft wide with 5-ft alleys between plots. Standard corn production practices as described by the University of Wisconsin Cooperative Extension Service were followed. Treatments consisted of one non-treated control and seven fungicide treatments. Pesticides were applied using a CO2-pressurized backpack sprayer equipped with 8002XR TurboJet flat fan nozzles calibrated to deliver 20 GPA at 30 psi. Pesticides were applied at growth stage R1 (26 Jul). Natural sources of pathogen inoculum were relied upon for disease. Plots were over-head irrigated every other day with 0.5 in. of water during the V12-R2 growth stage to encourage foliar disease. Common rust and greening severity were rated on 27 Sep. Common Rust was visually assessed by inspecting ear leaves on five plants in each plot with the aid of standardized area diagrams. Greening was rated by assessing percent green foliage at the R6 growth stage. Yield was determined by harvesting the center two rows of each plot using an Almaco SPC40 small-plot combine equipped with a HarvestMaster HM800 Classic grain gauge. Common rust severity, greening, and yield data were analyzed using a mixed model analysis of variance (α=0.05). Temperatures during the trial were below average for the growing region with adequate precipitation. Dry weather during the middle of the summer kept common rust levels low. There were no significant differences in greening effect severity, common rust severity, and yield among all treatments. Phytotoxicity was not observed for any treatment. Table 3. Greening effect, common rust severity, and grain yield for dent corn treated with fungicide or not treated with fungicide in Wisconsin in 2017.
Treatment and rate/A (crop growth stage at application)
Greening effect severity
(%)z Common Rust Severity (%)y Yield (bu/a)
Domark 230ME 5 fl oz (VT-R1) 38.8 3.0 264.4
Non-Treated Control 41.3 2.3 262.0
Quilt Xcel 2.2SE 10.5 fl oz (VT-R1) 41.3 1.5 261.6
Headline AMP 1.68SC 10 fl oz (VT-R1) 45.0 1.5 261.1
Quadris 2.08F 6 fl oz (VT-R1) 43.8 1.4 261.0
TrivaPro 2.2EC 13.7 fl oz (VT-R1) 37.5 1.5 259.8
Brixen 1.85S 19 fl oz (VT-R1) 37.5 1.3 255.3
Andiamo 230EC 5 fl oz (VT-R1) 43.8 2.7 253.4 LSD (α=0.05) nsx nsx nsx z Greening effect determined by rating the percentage green foliage still present in each plot at early black layer. yFoliar disease ratings were assessed on 5 ear leaves in each plot with the aid of a standard area diagram; means for each plot were used in the analysis. xLSD = Fisher’s Least Significant Difference (LSD; α=0.05); ns = no least significant difference (α=0.05)

5
Evaluation of foliar fungicides for control of ear rot and mycotoxin accumulation of corn for silage in Wisconsin, 2017 SILAGE CORN (Zea mays ‘P0956AMX’)
Gibberella Ear rot; Gibberella zeae The trial was established at the Arlington Agricultural Research Station located in Arlington, WI. The corn hybrid ‘P0956AMX’ was chosen for this study. Corn was planted on 11 May in a field consisting of a Plano silt loam soil (0 to 2% slopes) with a Joy silt loam intrusion (0 to 4% slopes). The experimental design was a randomized complete block with four replicates. Plots consisted of four 30-in spaced rows, 20 ft long and 10 ft wide with 5-ft alleys between plots. Standard corn production practices as described by the University of Wisconsin Cooperative Extension Service were followed. Treatments consisted of one non-treated control and nine fungicide treatments. Pesticides were applied using a CO2-pressurized backpack sprayer equipped with 8002XR TurboJet flat fan nozzles calibrated to deliver 20 GPA at 30 psi. Pesticides were applied at growth stages V6 (19 Jun), R1 (26 Jul), R1 + 5 days later (31 Jul), and R1 + 10 days later (4 Aug). Natural sources of pathogen inoculum were relied upon for disease. Plots were over-head irrigated every other day with 0.5 in. of water during the V12-R2 growth stage to encourage foliar disease. Ear rot severity was rated on 13 Sep. Ear rot severity was assessed by visually rating five ears per plot at the R6 growth stage. Yield was determined by harvesting the center two rows of each plot using a small plot silage chopper with an onboard platform weigh system. Chopped sub-samples were collected from each plot and analyzed for deoxynivalenol (DON) content. Ear rot severity, DON, and yield data were analyzed using a mixed model analysis of variance (α=0.05). Temperatures during the trial were below average for the growing region with adequate precipitation. Due to over-head irrigation, wet conditions were observed late in the summer at this location and elevated DON levels were observed. All fungicide treatments resulted in a significant reduction in DON content compared to the non-treated control except Delaro applied at V6 and Quilt Xcel applied at R1. Application of Experimental 1 fungicide applied at R1 resulted in the lowest DON content among treatments. Remaining treatments had comparable DON levels to Experimental 1 except for Quilt Xcel at R1. There were no significant differences in ear rot severity and yield among all treatments. Phytotoxicity was not observed for any treatment. Table 4. Dexoynivalenol (DON), ear rot severity, and dry matter yield for silage corn treated with fungicide or not treated with fungicide in Wisconsin in 2017.
Treatment and rate/A (crop growth stage at application) DON (ppm)z,x Ear Rot Severity (%)y Yield
(tons dry matter/a)
Experimental 1 (R1) 0.0 c 0.0 8.9
Experimental 2 (R1) 0.2 bc 0.3 9.1
Proline 480SC 5.7 fl oz (R1) 0.3 bc 0.1 10.8
Delaro 325SC 8 fl oz (R1) 0.5 bc 0.8 9.2
Proline 480SC 5.7 fl oz (R1 + 5 days) 1.3 bc 0.1 9.1
Headline AMP 1.68SC 10 fl oz (R1) 1.3 bc 1.6 9.6
Proline 480SC 5.7 fl oz (R1 + 10 days) 1.6 bc 0.9 10.8
Delaro 325SC 4 fl oz (V6) 2.4 abc 0.1 9.3
Quilt Xcel 2.2SE 10.5 fl oz (R1) 3.0 ab 1.1 10.4
Non-Treated Control 5.1 a 0.8 9.8 LSD (α=0.05) 2.9 nsw nsw zDeoxynivalnol (DON) content were analyzed for each plot; means for each plot were used in the analysis. yEar rot severity assessed visually on 5 ears per plot. xMeans followed by the same letter are not significantly different based on Fisher’s Least Significant Difference (LSD; α=0.05) wns = no least significant difference (α=0.05).
6
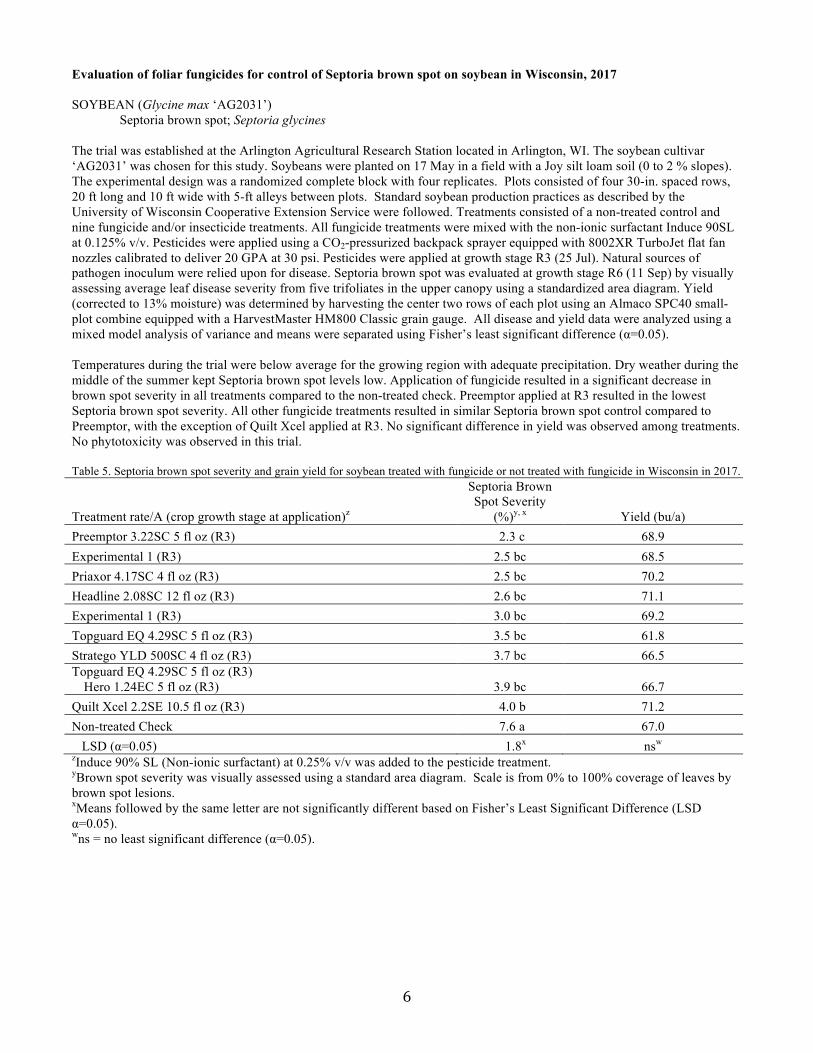
Evaluation of foliar fungicides for control of Septoria brown spot on soybean in Wisconsin, 2017 SOYBEAN (Glycine max ‘AG2031’)
Septoria brown spot; Septoria glycines The trial was established at the Arlington Agricultural Research Station located in Arlington, WI. The soybean cultivar ‘AG2031’ was chosen for this study. Soybeans were planted on 17 May in a field with a Joy silt loam soil (0 to 2 % slopes). The experimental design was a randomized complete block with four replicates. Plots consisted of four 30-in. spaced rows, 20 ft long and 10 ft wide with 5-ft alleys between plots. Standard soybean production practices as described by the University of Wisconsin Cooperative Extension Service were followed. Treatments consisted of a non-treated control and nine fungicide and/or insecticide treatments. All fungicide treatments were mixed with the non-ionic surfactant Induce 90SL at 0.125% v/v. Pesticides were applied using a CO2-pressurized backpack sprayer equipped with 8002XR TurboJet flat fan nozzles calibrated to deliver 20 GPA at 30 psi. Pesticides were applied at growth stage R3 (25 Jul). Natural sources of pathogen inoculum were relied upon for disease. Septoria brown spot was evaluated at growth stage R6 (11 Sep) by visually assessing average leaf disease severity from five trifoliates in the upper canopy using a standardized area diagram. Yield (corrected to 13% moisture) was determined by harvesting the center two rows of each plot using an Almaco SPC40 small-plot combine equipped with a HarvestMaster HM800 Classic grain gauge. All disease and yield data were analyzed using a mixed model analysis of variance and means were separated using Fisher’s least significant difference (α=0.05). Temperatures during the trial were below average for the growing region with adequate precipitation. Dry weather during the middle of the summer kept Septoria brown spot levels low. Application of fungicide resulted in a significant decrease in brown spot severity in all treatments compared to the non-treated check. Preemptor applied at R3 resulted in the lowest Septoria brown spot severity. All other fungicide treatments resulted in similar Septoria brown spot control compared to Preemptor, with the exception of Quilt Xcel applied at R3. No significant difference in yield was observed among treatments. No phytotoxicity was observed in this trial. Table 5. Septoria brown spot severity and grain yield for soybean treated with fungicide or not treated with fungicide in Wisconsin in 2017.
Treatment rate/A (crop growth stage at application)z
Septoria Brown Spot Severity
(%)y, x Yield (bu/a) Preemptor 3.22SC 5 fl oz (R3) 2.3 c 68.9 Experimental 1 (R3) 2.5 bc 68.5 Priaxor 4.17SC 4 fl oz (R3) 2.5 bc 70.2 Headline 2.08SC 12 fl oz (R3) 2.6 bc 71.1 Experimental 1 (R3) 3.0 bc 69.2 Topguard EQ 4.29SC 5 fl oz (R3) 3.5 bc 61.8 Stratego YLD 500SC 4 fl oz (R3) 3.7 bc 66.5 Topguard EQ 4.29SC 5 fl oz (R3)
Hero 1.24EC 5 fl oz (R3) 3.9 bc 66.7 Quilt Xcel 2.2SE 10.5 fl oz (R3) 4.0 b 71.2 Non-treated Check 7.6 a 67.0 LSD (α=0.05) 1.8x nsw zInduce 90% SL (Non-ionic surfactant) at 0.25% v/v was added to the pesticide treatment. yBrown spot severity was visually assessed using a standard area diagram. Scale is from 0% to 100% coverage of leaves by brown spot lesions. xMeans followed by the same letter are not significantly different based on Fisher’s Least Significant Difference (LSD α=0.05). wns = no least significant difference (α=0.05).

7
Evaluation of foliar fungicide treatments for control of white mold of soybean in Hancock Wisconsin, Trial #1, 2017 SOYBEAN (Glycine max ‘AG2031’)
White Mold; Sclerotinia sclerotiorum The trial was established at the Hancock Agricultural Research Station located in Hancock, WI. The soybean cultivar ‘AG2031’ was chosen for this study. Soybeans were planted on 25 May in a field with a Plainfield sand soil (0 to 2 % slopes). The field was overhead irrigated as needed to prevent wilt. The experimental design was a randomized complete block with four replicates. Plots consisted of four 30-in spaced rows, 20 ft long and 10 ft wide with 5-ft alleys between plots. Standard soybean production practices as described by the University of Wisconsin Cooperative Extension Service were followed. Treatments consisted of a non-treated control and nine fungicide treatments. All fungicide treatments were mixed with the non-ionic surfactant Induce 90SL at 0.125% v/v. Pesticides were applied using a CO2-pressurized backpack sprayer equipped with TX-VS10 ConeJet hollow cone nozzles calibrated to deliver 20 GPA at 30 psi. Pesticides were applied at growth stages R1 (14 Jul), R2 (20 Jul), R3 (28 Jul), or both R1 and R3. White mold incidence and severity was rated at R5.5 on 28 Aug. White mold severity index (DSI) was determined by rating 30 arbitrarily selected plants in each plot and scoring plants on a 0-3 scale: 0 = no infection; 1 = infection on branches; 2 = infection on main stem with little effect on pod fill; 3 = infection on main stem resulting in death or poor pod fill. The scores of the 30 plants were totaled for each class and divided by 0.9. Disease incidence was scored as percentage of symptomatic plants relative to the total stand. Natural sources of pathogen inoculum were relied upon for disease. Yield (corrected to 13% moisture) was determined by harvesting the center two rows of each plot using an Almaco SPC40 small-plot combine equipped with a HarvestMaster HM800 Classic grain gauge. All disease and yield data were analyzed using a mixed model analysis of variance and means were separated using Fisher’s least significant difference (α=0.05). Temperatures during the trial were below average for the growing region with adequate precipitation. Due to overhead irrigation throughout the season, conditions were favorable for disease development and pressure was very high in this trial. Applications of Aproach at R1 + R3, Endura at R1, Omega at R2, and Experimental 1 fungicide applied at R1 resulted in significant reductions in disease incidence and DSI levels compared to the non-treated check. Aproach applied at R1+R3 had the most significant reduction in disease incidence and DSI levels among treatments. All other treatments resulted in disease incidence and DSI levels comparable to the non-treated check. No significant differences in yield were identified among all treatments. Phytotoxicity was not observed with any treatment. Table 6. White mold disease incidence, disease severity index, and grain yield for soybean treated with fungicide or not treated with fungicide in Wisconsin in 2017, trial #1. Treatment and rate/A (crop growth stage at application)x
Disease Incidence (%) y,w
White mold DSI (0-100) z,w
Yield (bu/a)
Aproach 2.08SC 9 fl oz (R1+R3) 3.6 e 14.9 e 51.9 Endura 70WDG 8 oz (R1) 9.6 de 29.7 de 55.3 Omega 500F 12 fl oz (R2) 10.3 de 31.7 cde 46.4 Experimental 1 (R1) 14.4 cde 40.0 cd 49.3 Zolera 3.34FX 5 fl oz (R1) 15.3 bcd 47.5 bcd 47.9 Experimental 2 (R1) 20.7 a-d 51.1 bcd 48.3 Aproach 2.08SC 8 fl oz (R1) 20.7 a-d 54.2 bc 47.3 Experimental 1 (R2) 22.2 abc 66.1 ab 48.0 Non-treated check 25.7 ab 64.7 ab 47.1 Domark 230ME 4 fl oz (R1) 28.2 ab 78.6 ab 46.2 LSD (α=0.05) 10.9 24.4 nsv zWhite mold DSI was generated by rating 30 arbitrarily selected plants in each plot and scoring plants with on a 0-3 scale: 0 = no infection; 1 = infection on branches; 2 = infection on main stem with little effect on pod fill; 3 = infection on main stem resulting in death or poor pod fill. The scores of the 30 plants were totaled for each class and divided by 0.9 yPercentage of symptomatic plants relative to the total stand. xInduce 90SL (Non-ionic surfactant) at 0.25% v/v was added to the fungicide treatment. wMeans followed by the same letter are not significantly different based on Fisher’s Least Significant Difference (LSD; α=0.05). vns = not significant (α=0.05)

8
Evaluation of foliar fungicide treatments for control of white mold of soybean in Hancock Wisconsin, Trial #2, 2017 SOYBEAN (Glycine max ‘AG2031’)
White Mold; Sclerotinia sclerotiorum The trial was established at the Hancock Agricultural Research Station located in Hancock, WI. The soybean cultivar ‘AG2031’ was chosen for this study. Soybeans were planted on 25 May in a field with a Sparta loamy sand soil (0 to 2 % slopes). The field was overhead irrigated as needed to prevent wilt. The experimental design was a randomized complete block with four replicates. Plots consisted of four 30-in spaced rows, 20 ft long and 10 ft wide with 5-ft alleys between plots. Standard soybean production practices as described by the University of Wisconsin Cooperative Extension Service were followed. Treatments consisted of a non-treated control and 11 fungicide treatments. All fungicide treatments were mixed with the non-ionic surfactant Induce 90SL at 0.125% v/v. Pesticides were applied using a CO2-pressurized backpack sprayer equipped with 8002XR TurboJet flat fan nozzles calibrated to deliver 20 GPA at 30 psi. Pesticides were applied at growth stages V5 (7 Jul), R1 (18 Jul), R2 (20 Jul), R3 (28 Jul), or both V5 and R2 or R1 and R3. White mold incidence and severity was rated at R5.5 on 28 Aug. White mold severity index (DSI) was determined by rating 30 arbitrarily selected plants in each plot and scoring plants on a 0-3 scale: 0 = no infection; 1 = infection on branches; 2 = infection on main stem with little effect on pod fill; 3 = infection on main stem resulting in death or poor pod fill. The scores of the 30 plants were totaled for each class and divided by 0.9. Disease incidence was scored as percentage of symptomatic plants relative to the total stand. Natural sources of pathogen inoculum were relied upon for disease. Yield (corrected to 13% moisture) was determined by harvesting the center two rows of each plot using an Almaco SPC40 small-plot combine equipped with a HarvestMaster HM800 Classic grain gauge. All disease and yield data were analyzed using a mixed model analysis of variance and means were separated using Fisher’s least significant difference (α=0.05). Temperatures during the trial were below average for the growing region with adequate precipitation. Due to overhead irrigation throughout the season, conditions were favorable for disease development and pressure was very high in this trial. Propulse applied at R1 followed by Delaro applied at R3, Proline at R1 followed by Stratego YLD at R3, and Delaro applied at R1 + R3 resulted in significant reduction in disease incidence and significantly higher yield compared to non-treated checks. All other fungicide treatments were not significantly different from non-treated plots for disease incidence and yield. Propulse applied at R1 followed by Delaro at R3 resulted in the most significant reduction in disease incidence while Proline at R1 followed by Stratego YLD and Delaro at R1 + R3 had comparable disease control. Application of Propulse at R1 and Delaro at R3 and Proline at R1 and Stratego YLD at R3 had the highest yields among all treatments. No significant differences in DSI levels were identified among all treatments. Phytotoxicity was not observed with any treatment.

9
Table 7. White mold disease incidence, disease severity index, and grain yield for soybean treated with fungicide or not treated with fungicide in Wisconsin in 2017, trial #2. Treatment and rate/A (crop growth stage at application)x
Disease Incidence (%)
y,w White mold
DSI (0-100) z Yield
(bu/a)w
Propulse 3.34SC 6 fl oz (R1) Delaro 325SC 8 fl oz (R3) 18.8 c 32.8 52.3 a
Proline 480SC 3 fl oz (R1) Stratego YLD 4.18SC 4 fl oz (R3) 23.3 bc 43.3 52.0 a
Delaro 325SC 8 fl oz (R1 + R3) 22.3 bc 43.6 48.3 ab Experimental 1 (R1 + R3) 36.0 ab 63.1 42.8 bc Topguard EQ 4.29SC 5 fl oz (R1 + R3) 29.8 abc 52.5 42.6 bc Experimental 1 (R2) 36.3 ab 59.2 42.3 bc Experimental 1 (V5 + R2) 38.4 a 64.4 40.8 bc Topguard EQ 4.29SC 5 fl oz (R2) 29.2 abc 46.9 39.8 c Proline 480SC 3 fl oz (R1) 40.1 a 51.4 39.2 c Delaro 325SC 8 fl oz (R1) 36.1 ab 55.3 38.1 c Non-treated check 38.6 a 61.9 36.6 c Topguard EQ 4.29SC 5 fl oz (V5+ R2) 39.7 a 66.7 36.2 c LSD (α=0.05) 14.6 nsv 7.6 zWhite mold DSI was generated by rating 30 arbitrarily selected plants in each plot and scoring plants with on a 0-3 scale: 0 = no infection; 1 = infection on branches; 2 = infection on main stem with little effect on pod fill; 3 = infection on main stem resulting in death or poor pod fill. The scores of the 30 plants were totaled for each class and divided by 0.9 yPercentage of symptomatic plants relative to the total stand. xInduce 90SL (Non-ionic surfactant) at 0.25% v/v was added to the fungicide treatment. wMeans followed by the same letter are not significantly different based on Fisher’s Least Significant Difference (LSD; α=0.05). vns = not significant (α=0.05)

10
Evaluation of foliar fungicide treatments for control of white mold of soybean in Hancock Wisconsin, Trial #3, 2017 SOYBEAN (Glycine max ‘AG2031’)
White Mold; Sclerotinia sclerotiorum The trial was established at the Hancock Agricultural Research Station located in Hancock, WI. The soybean cultivar ‘AG2031’ was chosen for this study. Soybeans were planted on 25 May in a field with a Sparta loamy sand soil (0 to 2 % slopes). The field was overhead irrigated as needed to prevent wilt. The experimental design was a randomized complete block with four replicates. Plots consisted of four 30-in spaced rows, 20 ft long and 10 ft wide with 5-ft alleys between plots. Standard soybean production practices as described by the University of Wisconsin Cooperative Extension Service were followed. Treatments consisted of a non-treated control and seven fungicide treatments. Pesticides were applied using a CO2-pressurized backpack sprayer equipped with 8002XR TurboJet flat fan nozzles calibrated to deliver 20 GPA at 30 psi. Pesticides were applied at growth stages R1 (14 Jul), R2 (20 Jul), R3 (28 Jul), or both R1 and R3. White mold incidence and severity was rated at R5.5 (28 Aug). White mold severity index (DSI) was determined by rating 30 arbitrarily selected plants in each plot and scoring plants on a 0-3 scale: 0 = no infection; 1 = infection on branches; 2 = infection on main stem with little effect on pod fill; 3 = infection on main stem resulting in death or poor pod fill. The scores of the 30 plants were totaled for each class and divided by 0.9. Disease incidence was scored as percentage of symptomatic plants relative to the total stand. Natural sources of pathogen inoculum were relied upon for disease. Yield (corrected to 13% moisture) was determined by harvesting the center two rows of each plot using an Almaco SPC40 small-plot combine equipped with a HarvestMaster HM800 Classic grain gauge. All disease and yield data were analyzed using a mixed model analysis of variance and means were separated using Fisher’s least significant difference (α=0.05). Temperatures during the trial were below average for the growing region with adequate precipitation. Due to overhead irrigation throughout the season, conditions were favorable for disease development and pressure was very high in this trial. No significant differences in disease incidence and DSI levels were identified among all treatments. No treatments were statistically different in yield compared to not treating, however yield was highest for plots treated with Aproach at R1 + R3 and Endura applied at R1. Applications of Acropolis at R1, Topsin-M at R1, and Domark at R1 resulted in the lowest yields among treatments. Phytotoxicity due to fungicide treatment was not observed in this trial. Table 8. White mold disease incidence, disease severity index, and grain yield for soybean treated with fungicide or not treated with fungicide in Wisconsin in 2017, trial #3. Treatment and rate/A (crop growth stage at application)
Disease Incidence (%)
y White Mold
DSI (0-100) z Yield (bu/a)
Aproach 2.08SC 12 fl oz (R1+R3) 22.8 39.0 48.1 a Endura 70WDG 8 oz (R1) 24.4 42.6 47.3 ab Non-treated check 24.9 41.7 44.8 abc Acropolis 2.37LC 23 fl oz (R2) 34.8 58.6 43.4 abc Aproach 2.08SC 12 fl oz (R1) 38.0 61.0 42.0 bc Acropolis 2.37LC 23 fl oz (R1) 27.5 39.3 40.6 c Topsin-M 4.5F 20 fl oz (R1) 39.3 57.8 40.1 c Domark 230ME 5 fl oz (R1) 33.9 52.1 39.0 c LSD (α=0.05) nsw nsw 5.9 zWhite mold DSI was generated by rating 30 arbitrarily selected plants in each plot and scoring plants with on a 0-3 scale: 0 = no infection; 1 = infection on branches; 2 = infection on main stem with little effect on pod fill; 3 = infection on main stem resulting in death or poor pod fill. The scores of the 30 plants were totaled for each class and divided by 0.9 yPercentage of symptomatic plants relative to the total stand. xMeans followed by the same letter are not significantly different based on Fisher’s Least Significant Difference (LSD; α=0.05). wns = not significant (α=0.05)

11
Evaluation of foliar fungicides for control of common rust of sweet corn in Wisconsin, 2017 SWEET CORN (Zea mays ‘Serendipity’) Common rust; Puccinia sorghi The trial was established at the Arlington Agricultural Research Station located in Arlington, WI. The sweet corn variety ‘Serendipity’ was chosen for this study. Sweet corn was planted on 21 Jun in a field with a Plano silt loam soil (0 to 2% slopes). The experimental design was a randomized complete block with four replicates. Plots consisted of six 30-in. spaced rows, 50 ft long and 15 ft wide with 6-ft alleys between plots. Standard sweet corn production practices as described by the University of Wisconsin Cooperative Extension Service were followed. Treatments consisted of a non-treated control and 14 fungicide treatments. Pesticides were applied using a small-plot, high-clearance, self-propelled equipped with 8002XR TurboJet flat fan nozzles calibrated to deliver 20 GPA at 40 psi. Fungicides were applied at the V9-10 (4 Aug) and VT-R1 (18 Aug) growth stages. Common rust severity (0-100%) was rated on five ear leaves in each plot on 18 Aug, followed by 1 and 15 Sep using a standard area diagram. Data were converted to area under the disease progress curve (AUDPC). Marketable ears were harvested by hand from one center row of each plot on 20 Sep. All disease and yield data were analyzed using a mixed model analysis of variance and means were separated using Fisher’s least significant difference (α=0.05). Temperatures during the trial were below average for the growing region with adequate precipitation. Rust persisted throughout the entire growing season, with pressure being very high in this trial. All fungicide treatments resulted in a significant reduction in AUDPC compared to the non-treated control. However, Viathon applied at V9-10 and Viathon applied at both V9-10 and VT-R1, resulted in the greatest reductions of common rust among treatments. Priaxor applied at V9-10 was not significantly different from Viathon applied at V9-10 followed by VT-R1. Yield was highest for plots that received Viathon at V9-10 followed by plots treated with Viathon at both V9-10 and VT-R1, Priaxor at V9-10, and Priaxor applied at V9-10 followed by VT-R1 application. Plots treated with all other programs yielded comparably to the non-treated check. Phytotoxicity was not observed in any plot in response to treatments. Table 9. Common rust severity and yield (marketable ears) for sweet corn treated with fungicide or not treated with fungicide in Wisconsin in 2017.
Treatment and rate/A (crop growth stage at application) Common rust severity
(AUDPC)z, y Yield
(tons/A) y Non-treated Check 1266.9 a 6.5 b Viathon 4.1SC 3.0 pt (VT-R1) 927.5 b 6.8 b Priaxor 4.17SC 4 fl oz (VT-R1) 813.2 b 6.3 b Priaxor 4.17SC 4 fl oz (V9-10, VT-R1) 620.7 c 8.4 a Priaxor 4.17SC 4 fl oz (V9-10) 584.1 cd 8.3 a Viathon 4.1SC 3.0 pt (V9-10, VT-R1) 481.9 de 8.2 a Viathon 4.1SC 3.0 pt (V9-10) 398.5 e 8.5 a LSD (P=0.05) 121.5 1.1 zCommon rust (0-100%) was rated on five ear leaves in each plot on 18 Aug, followed by 1 and 15 Sep using a standard area diagram. Data were converted to area under the disease progress curve (AUDPC) for analysis. yMeans followed by the same letter are not significantly different based on Fisher’s Least Significant Difference (LSD; α=0.05)
12
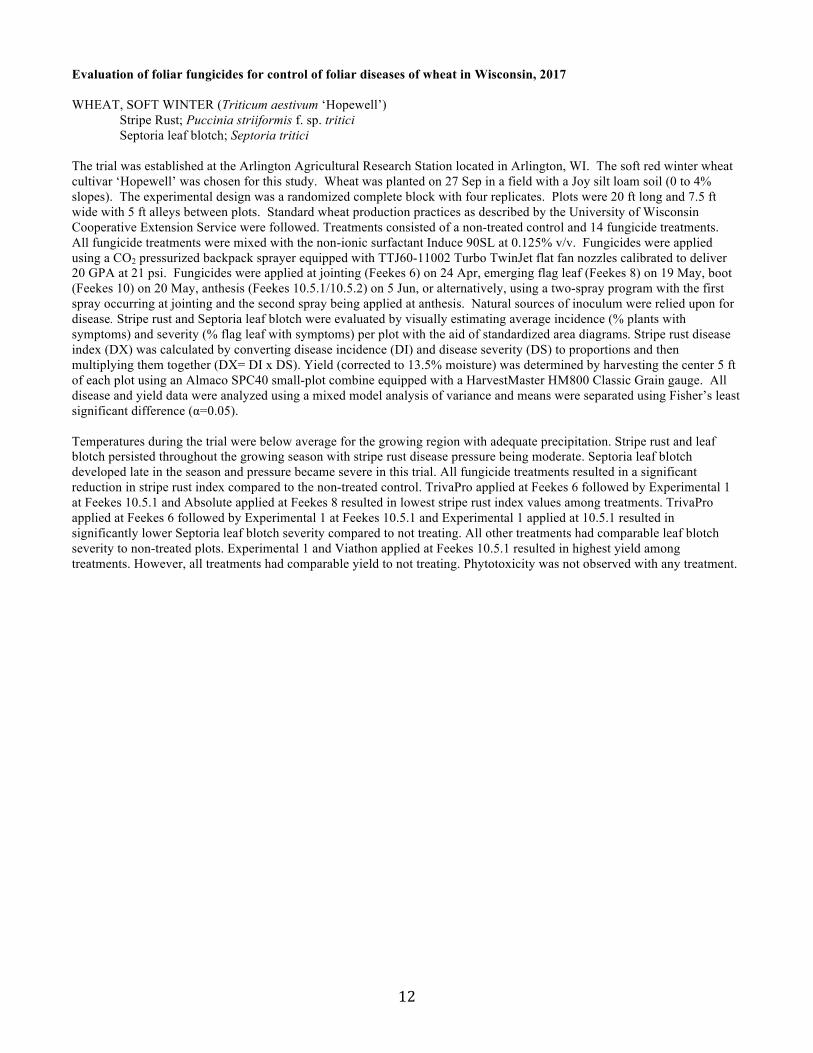
Evaluation of foliar fungicides for control of foliar diseases of wheat in Wisconsin, 2017 WHEAT, SOFT WINTER (Triticum aestivum ‘Hopewell’)
Stripe Rust; Puccinia striiformis f. sp. tritici Septoria leaf blotch; Septoria tritici The trial was established at the Arlington Agricultural Research Station located in Arlington, WI. The soft red winter wheat cultivar ‘Hopewell’ was chosen for this study. Wheat was planted on 27 Sep in a field with a Joy silt loam soil (0 to 4% slopes). The experimental design was a randomized complete block with four replicates. Plots were 20 ft long and 7.5 ft wide with 5 ft alleys between plots. Standard wheat production practices as described by the University of Wisconsin Cooperative Extension Service were followed. Treatments consisted of a non-treated control and 14 fungicide treatments. All fungicide treatments were mixed with the non-ionic surfactant Induce 90SL at 0.125% v/v. Fungicides were applied using a CO2 pressurized backpack sprayer equipped with TTJ60-11002 Turbo TwinJet flat fan nozzles calibrated to deliver 20 GPA at 21 psi. Fungicides were applied at jointing (Feekes 6) on 24 Apr, emerging flag leaf (Feekes 8) on 19 May, boot (Feekes 10) on 20 May, anthesis (Feekes 10.5.1/10.5.2) on 5 Jun, or alternatively, using a two-spray program with the first spray occurring at jointing and the second spray being applied at anthesis. Natural sources of inoculum were relied upon for disease. Stripe rust and Septoria leaf blotch were evaluated by visually estimating average incidence (% plants with symptoms) and severity (% flag leaf with symptoms) per plot with the aid of standardized area diagrams. Stripe rust disease index (DX) was calculated by converting disease incidence (DI) and disease severity (DS) to proportions and then multiplying them together (DX= DI x DS). Yield (corrected to 13.5% moisture) was determined by harvesting the center 5 ft of each plot using an Almaco SPC40 small-plot combine equipped with a HarvestMaster HM800 Classic Grain gauge. All disease and yield data were analyzed using a mixed model analysis of variance and means were separated using Fisher’s least significant difference (α=0.05). Temperatures during the trial were below average for the growing region with adequate precipitation. Stripe rust and leaf blotch persisted throughout the growing season with stripe rust disease pressure being moderate. Septoria leaf blotch developed late in the season and pressure became severe in this trial. All fungicide treatments resulted in a significant reduction in stripe rust index compared to the non-treated control. TrivaPro applied at Feekes 6 followed by Experimental 1 at Feekes 10.5.1 and Absolute applied at Feekes 8 resulted in lowest stripe rust index values among treatments. TrivaPro applied at Feekes 6 followed by Experimental 1 at Feekes 10.5.1 and Experimental 1 applied at 10.5.1 resulted in significantly lower Septoria leaf blotch severity compared to not treating. All other treatments had comparable leaf blotch severity to non-treated plots. Experimental 1 and Viathon applied at Feekes 10.5.1 resulted in highest yield among treatments. However, all treatments had comparable yield to not treating. Phytotoxicity was not observed with any treatment.

13
Table 10. Stripe rust index, Septoria leaf blotch severity, and grain yield for soft red winter wheat treated with fungicide or not treated with fungicide in Wisconsin in 2017. Treatment and rate/Az
Growth stage at application (Feekes) Stripe Rust
Indexy,w Septoria Severity
(%)x,w Yield
(bu/a) w Non-treated control 0.41 a 31.3 a-d 76.2 b-e Caramba 90EC 13.5 fl oz 6 0.11 b 52.5 a 73.0 de Prosaro 421SC 6.5 fl oz 6 0.09 bc 27.5 b-e 78.1 bcd TrivaPro 2.2EC 9.4 fl oz fb Experimental 1
6 fb 10.5.1 0.00 c 6.8 e 79.3 ab
Absolute 500SC 5 fl oz 8 0.01 c 20.0 de 79.5 ab Caramba 90EC 13.5 fl oz 8 0.07 bc 35.0 a-d 71.9 e Prosaro 421SC 6.5 fl oz 8 0.06 bc 36.3 a-d 76.7 b-e Caramba 90EC 13.5 fl oz 10 0.03 bc 23.8 cde 78.9 abc Prosaro 421SC 6.5 fl oz 10 0.05 bc 35.0 a-d 78.4 abc Caramba 90EC 13.5 fl oz 10.5.1 0.06 bc 46.3 ab 78.3 bcd Experimental 1 10.5.1 0.02 bc 9.3 e 80.2 ab Prosaro 421SC 6.5 fl oz 10.5.1 0.08 bc 23.8 cde 73.3 cde Viathon 4.08SC 2 pt 10.5.1 0.02 bc 37.5 a-d 80.2 ab Caramba 90EC 13.5 fl oz 5 days post-10.5.1 0.03 bc 43.8 abc 77.8 bcd Prosaro 421SC 6.5 fl oz 5 days post-10.5.1 0.03 bc 47.5 ab 75.0 a-e LSD (α=0.05) -- 0.1 22.0 5.3 p-value -- <0.001 <0.01 <0.05 zInduce 90% SL (Non-ionic surfactant) at 0.125% v/v was added to all fungicide treatments, fb = followed by. yStripe rust index (DX) was calculated taking proportional values of the disease incidence (DI) multiplied by disease severity (DS), (DX= DI x DS). xSeptoria severity was visually assessed as the average % flag leaf symptomatic per plot wMeans followed by the same letter are not significantly different based on Fisher’s Least Significant Difference (LSD; α=0.05).