2017 global auto industry conference - schaeffler group€¦ · 2017 global auto industry...
TRANSCRIPT

Schaeffler AG2017 Global Auto Industry Conference
January 10, 2017Detroit
This presentation contains forward-looking statements. The words "anticipate", "assume", "believe", "estimate", "expect", "intend", "may", "plan","project“, "should" and similar expressions are used to identify forward-looking statements. Forward-looking statements are statements that are nothistorical facts; they include statements about Schaeffler Group's beliefs and expectations and the assumptions underlying them. These statements arebased on plans, estimates and projections as they are currently available to the management of Schaeffler AG. Forward-looking statements therefore speakonly as of the date they are made, and Schaeffler Group undertakes no obligation to update any of them in light of new information or future events.By their very nature, forward-looking statements involve risks and uncertainties. These statements are based on Schaeffler AG management's currentexpectations and are subject to a number of factors and uncertainties that could cause actual results to differ materially from those described in theforward-looking statements. Actual results may differ from those set forth in the forward-looking statements as a result of various factors (including, butnot limited to, future global economic conditions, changed market conditions affecting the automotive industry, intense competition in the markets inwhich we operate and costs of compliance with applicable laws, regulations and standards, diverse political, legal, economic and other conditions affectingour markets, and other factors beyond our control).This presentation is intended to provide a general overview of Schaeffler Group’s business and does not purport to deal with all aspects and detailsregarding Schaeffler Group. Accordingly, neither Schaeffler Group nor any of its directors, officers, employees or advisers nor any other person makes anyrepresentationor warranty, express or implied, as to, and accordingly no reliance should be placed on, the accuracy or completeness of the information contained in thepresentation or of the views given or implied. Neither Schaeffler Group nor any of its directors, officers, employees or advisors nor any other person shallhave any liability whatsoever for any errors or omissions or any loss howsoever arising, directly or indirectly, from any use of this information or its contentsor otherwise arising in connection therewith.The material contained in this presentation reflects current legislation and the business and financial affairs of Schaeffler Group which are subject tochange.
2017 Global Auto Industry Conference | © Schaeffler 2017
Disclaimer
January 10, 20172
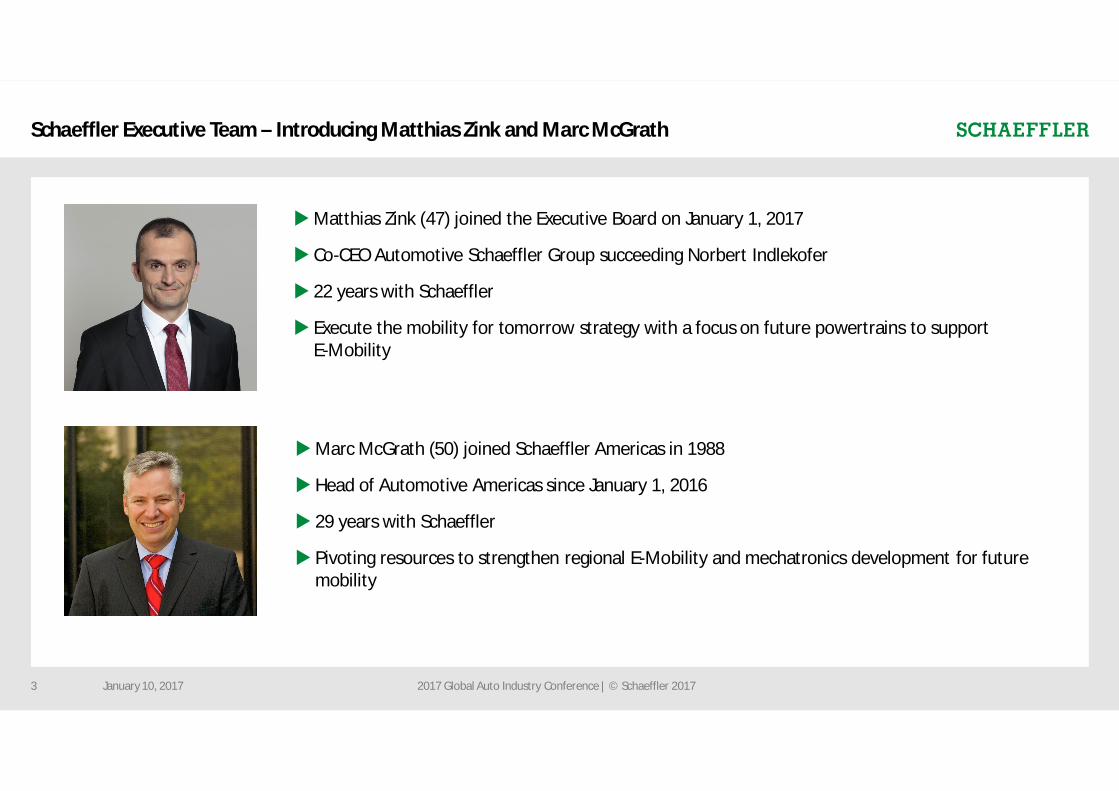
uMatthias Zink (47) joined the Executive Board on January 1, 2017
u Co-CEO Automotive Schaeffler Group succeeding Norbert Indlekofer
u 22 years with Schaeffler
u Execute the mobility for tomorrow strategy with a focus on future powertrains to supportE-Mobility
January 10, 2017 2017 Global Auto Industry Conference | © Schaeffler 20173
Schaeffler Executive Team – Introducing Matthias Zink and Marc McGrath
uMarc McGrath (50) joined Schaeffler Americas in 1988
u Head of Automotive Americas since January 1, 2016
u 29 years with Schaeffler
u Pivoting resources to strengthen regional E-Mobility and mechatronics development for futuremobility
1 Schaeffler at a glance
2 Strategy "Mobility for tomorrow"
3 Investment Highlights
4 Summary
Agenda
January 10, 2017 2017 Global Auto Industry Conference | © Schaeffler 20174
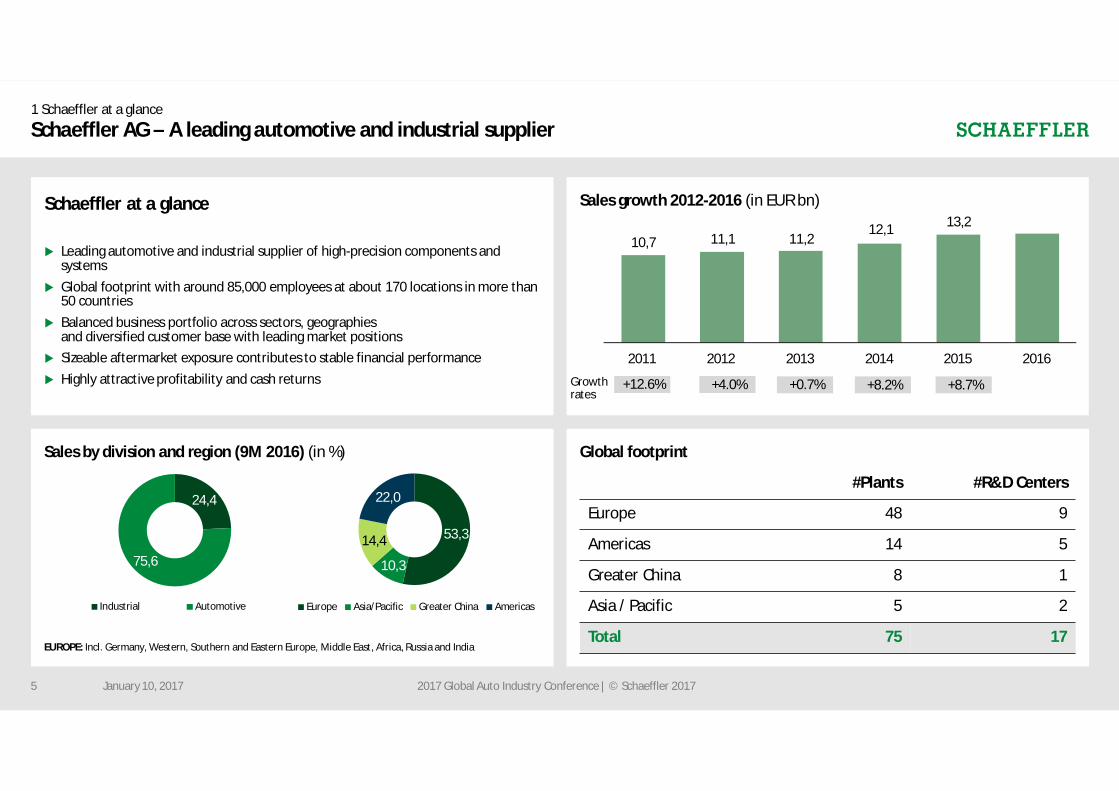
Sales growth 2012-2016 (in EUR bn)
Global footprintSales by division and region (9M 2016) (in %)
Growthrates
24,4
75,6
Industrial Automotive
53,3
10,3
14,4
22,0
Europe Asia/Pacific Greater China Americas
EUROPE: Incl. Germany, Western, Southern and Eastern Europe, Middle East, Africa, Russia and India
#Plants #R&D Centers
Europe 48 9
Americas 14 5
Greater China 8 1
Asia / Pacific 5 2
Total 75 17
10,7 11,1 11,212,1 13,2
201620152014201320122011
+12.6% +4.0% +0.7% +8.2% +8.7%
January 10, 2017 2017 Global Auto Industry Conference | © Schaeffler 20175
Schaeffler at a glance
u Leading automotive and industrial supplier of high-precision components andsystems
u Global footprint with around 85,000 employees at about 170 locations in more than50 countries
u Balanced business portfolio across sectors, geographiesand diversified customer base with leading market positions
u Sizeable aftermarket exposure contributes to stable financial performanceu Highly attractive profitability and cash returns
1 Schaeffler at a glance
Schaeffler AG – A leading automotive and industrial supplier
2 Strategy "Mobility for tomorrow"
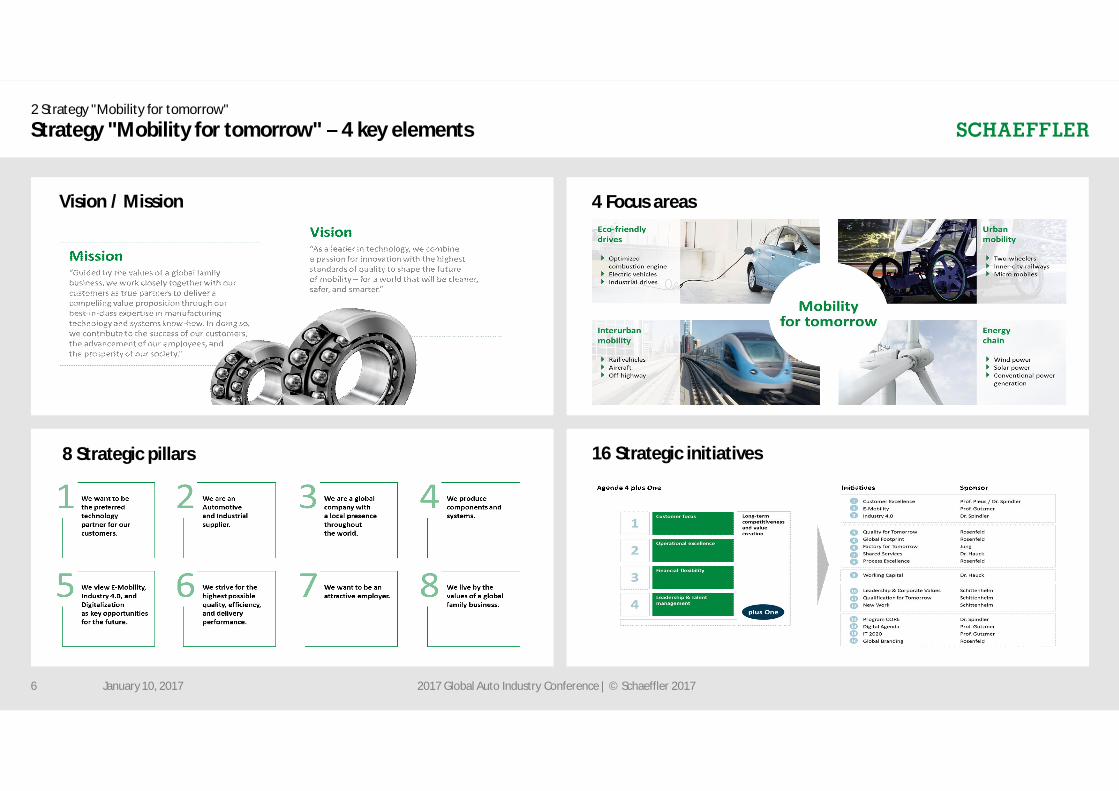
Strategy "Mobility for tomorrow" – 4 key elements
4 Focus areas
8 Strategic pillars 16 Strategic initiatives
Vision / Mission
January 10, 2017 2017 Global Auto Industry Conference | © Schaeffler 20176
2 Strategy "Mobility for tomorrow"
January 10, 2017 2017 Global Auto Industry Conference | © Schaeffler 20177
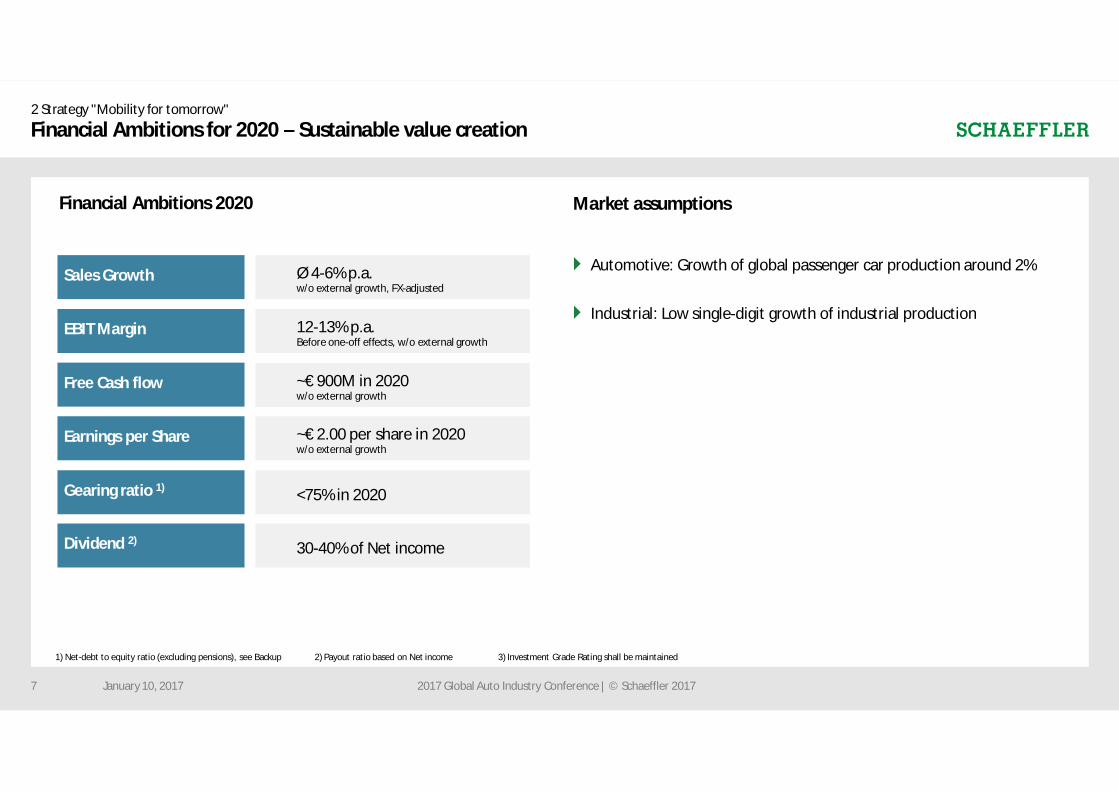
Financial Ambitions for 2020 – Sustainable value creation
4 Automotive: Growth of global passenger car production around 2%
4 Industrial: Low single-digit growth of industrial production
Market assumptions
1) Net-debt to equity ratio (excluding pensions), see Backup 2) Payout ratio based on Net income 3) Investment Grade Rating shall be maintained
EBIT Margin
Sales Growth Ø 4-6% p.a.w/o external growth, FX-adjusted
Free Cash flow
Earnings per Share
Gearing ratio 1)
Dividend 2)
12-13% p.a.Before one-off effects, w/o external growth
~€ 2.00 per share in 2020w/o external growth
<75% in 2020
30-40% of Net income
~€ 900M in 2020w/o external growth
Financial Ambitions 2020
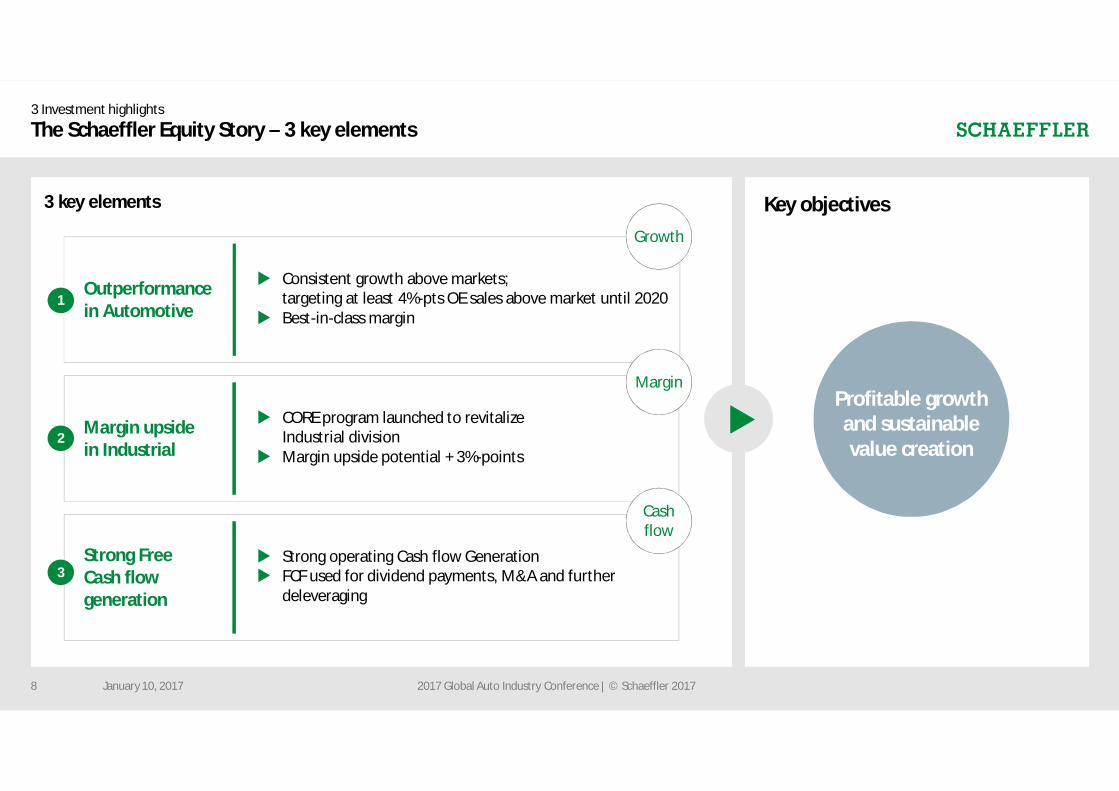
Outperformancein Automotive
Margin upsidein Industrial
Strong FreeCash flowgeneration
3 Investment highlights
The Schaeffler Equity Story – 3 key elements
2017 Global Auto Industry Conference | © Schaeffler 2017
Profitable growthand sustainablevalue creation
Key objectives
q
3 key elements
Growth
Margin
Cashflow
u Consistent growth above markets;targeting at least 4%-pts OE sales above market until 2020
u Best-in-class margin
u CORE program launched to revitalizeIndustrial division
u Margin upside potential + 3%-points
u Strong operating Cash flow Generationu FCF used for dividend payments, M&A and further
deleveraging
January 10, 20178
1
3
2
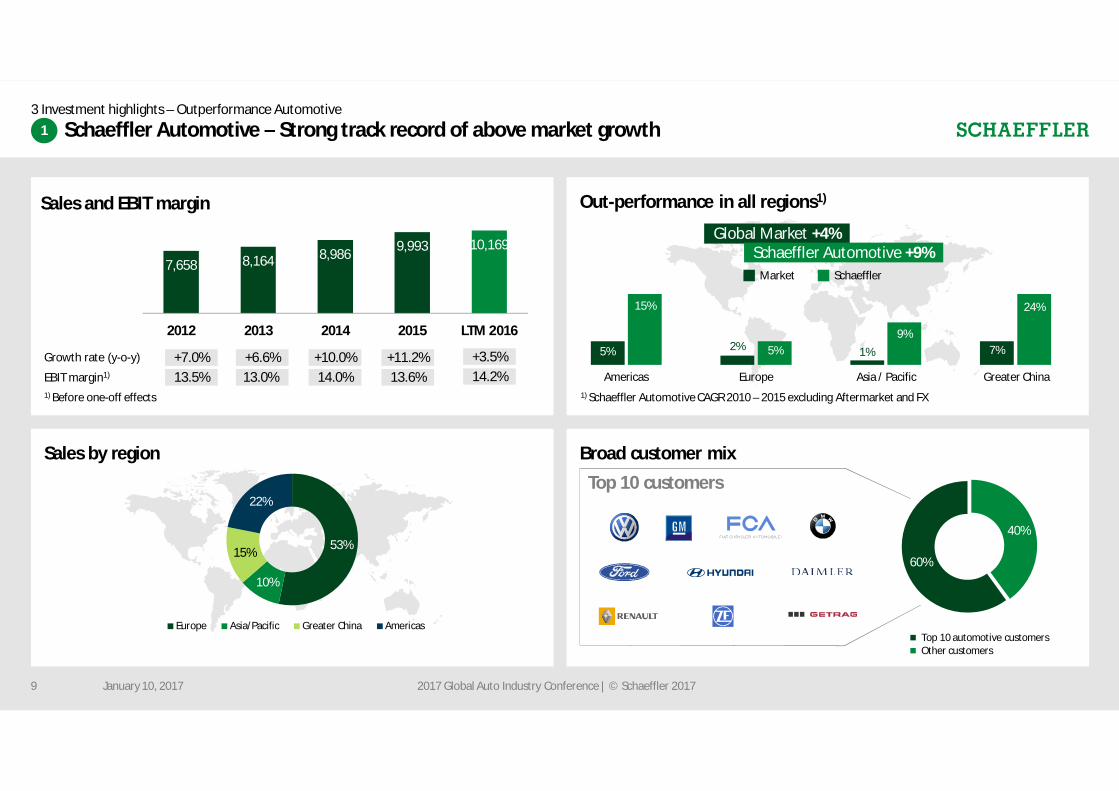
Sales and EBIT margin Out-performance in all regions1)
3 Investment highlights – Outperformance Automotive
Sales by region
Schaeffler Automotive – Strong track record of above market growth
53%
10%
15%
22%
Europe Asia/Pacific Greater China Americas
1) Before one-off effects 1) Schaeffler Automotive CAGR 2010 – 2015 excluding Aftermarket and FX
7,658 8,164 8,986 9,993 10,169
2012 2013 2014 2015 LTM 2016
Growth rate (y-o-y) +7.0% +6.6% +10.0% +11.2%EBIT margin1) 13.5% 13.0% 14.0% 13.6%
Global Market +4%Schaeffler Automotive +9%
Broad customer mixTop 10 customers
Market Schaeffler
5%
15%
2% 5% 1%9%
7%
24%
Americas Europe Asia / Pacific Greater China
40%
60%
Top 10 automotive customersOther customers
2017 Global Auto Industry Conference | © Schaeffler 20179 January 10, 2017
1
+3.5%14.2%
3 Investment highlights – Outperformance Automotive
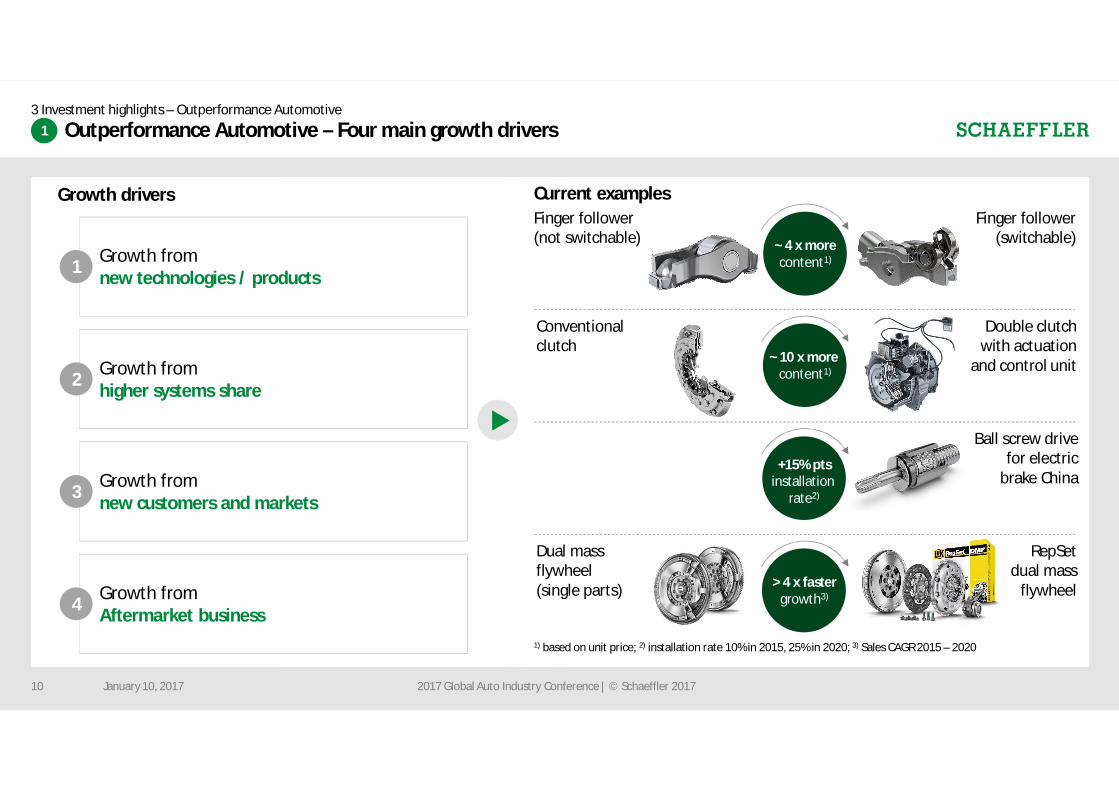
Outperformance Automotive – Four main growth drivers
January 10, 2017 2017 Global Auto Industry Conference | © Schaeffler 201710
1) based on unit price; 2) installation rate 10% in 2015, 25% in 2020; 3) Sales CAGR 2015 – 2020
Growth fromnew customers and markets
Growth fromhigher systems share
Growth fromnew technologies / products
Growth fromAftermarket business
~ 4 x morecontent1)
Finger follower(not switchable)
Finger follower(switchable)
Conventionalclutch
Double clutchwith actuation
and control unit
1
2
3
4
~ 10 x morecontent1)
Ball screw drivefor electric
brake China+15% pts
installationrate2)
Dual massflywheel(single parts)
RepSetdual mass
flywheel> 4 x fastergrowth3)
Current examplesGrowth drivers
q
1
3 Investment highlights – Outperformance Automotive
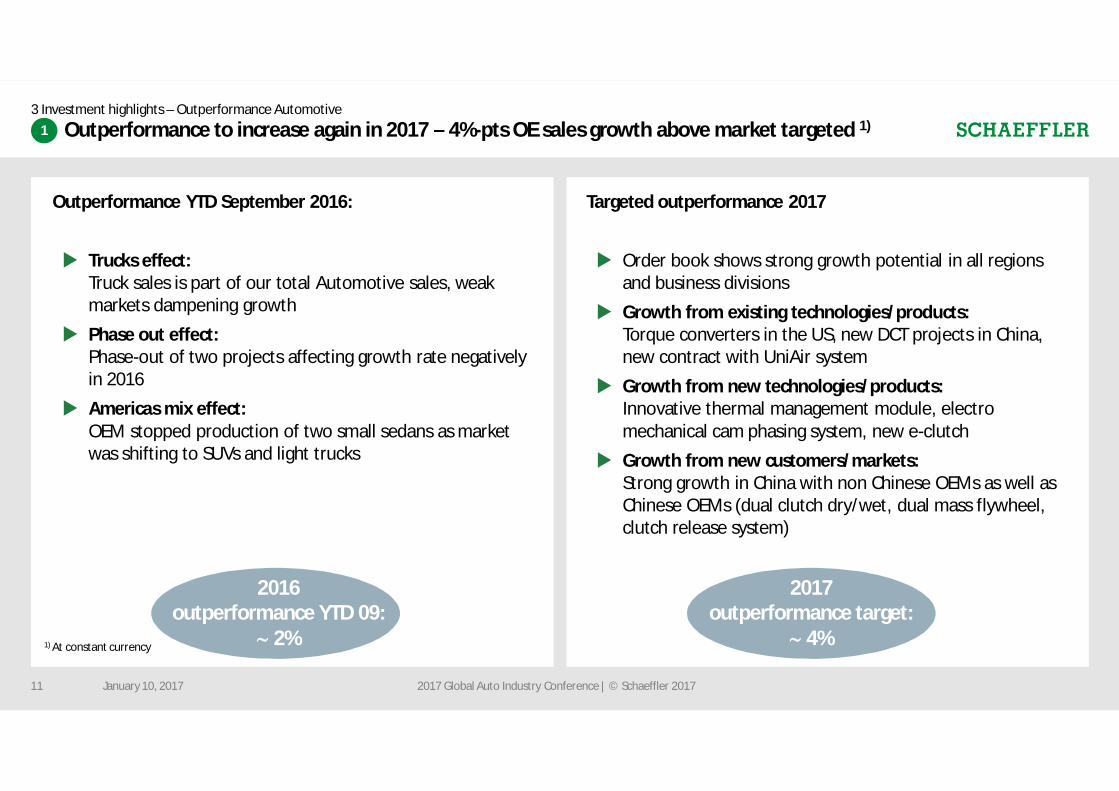
Outperformance to increase again in 2017 – 4%-pts OE sales growth above market targeted 1)
January 10, 2017 2017 Global Auto Industry Conference | © Schaeffler 201711
Targeted outperformance 2017
u Order book shows strong growth potential in all regionsand business divisions
u Growth from existing technologies/products:Torque converters in the US, new DCT projects in China,new contract with UniAir system
u Growth from new technologies/products:Innovative thermal management module, electromechanical cam phasing system, new e-clutch
u Growth from new customers/markets:Strong growth in China with non Chinese OEMs as well asChinese OEMs (dual clutch dry/wet, dual mass flywheel,clutch release system)
1) At constant currency
1
Outperformance YTD September 2016:
u Trucks effect:Truck sales is part of our total Automotive sales, weakmarkets dampening growth
u Phase out effect:Phase-out of two projects affecting growth rate negativelyin 2016
u Americas mix effect:OEM stopped production of two small sedans as marketwas shifting to SUVs and light trucks
2017outperformance target:
~ 4%
2016outperformance YTD 09:
~ 2%
3 Investment highlights – Outperformance Automotive
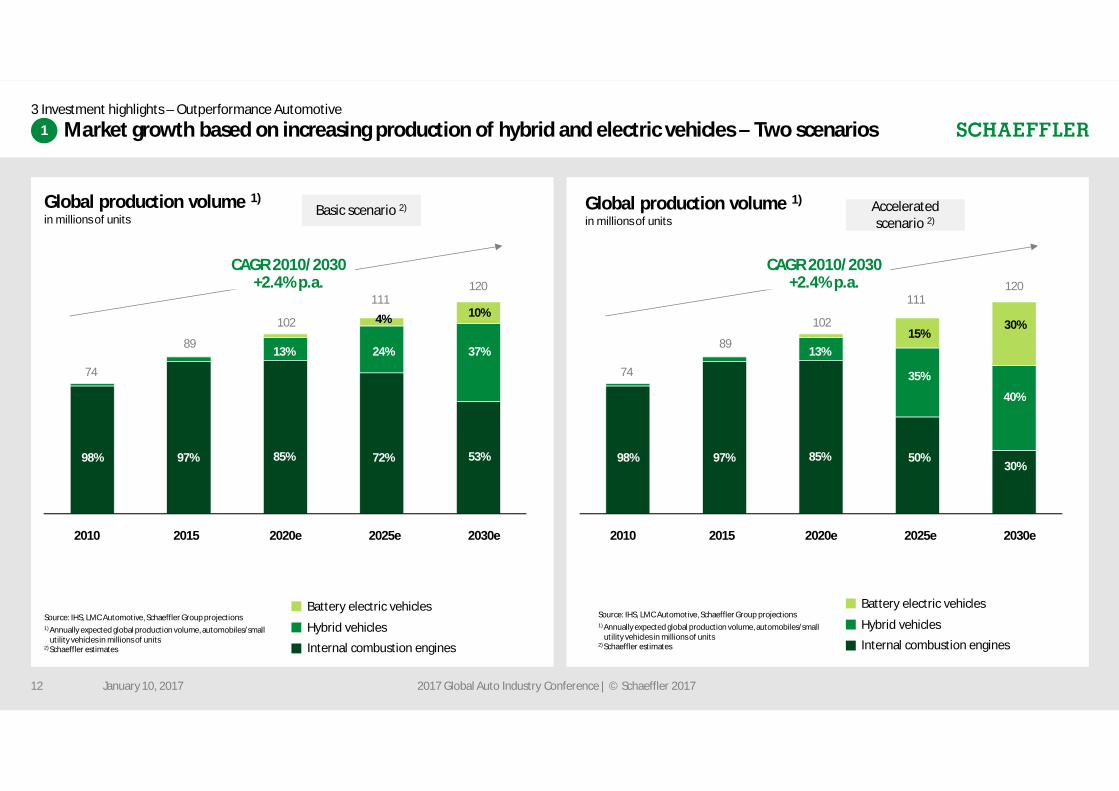
Market growth based on increasing production of hybrid and electric vehicles – Two scenarios
January 10, 2017 2017 Global Auto Industry Conference | © Schaeffler 201712
Global production volume 1)
in millions of units
Source: IHS, LMC Automotive, Schaeffler Group projections
2020e20152010 2030e2025e
1) Annually expected global production volume, automobiles/smallutility vehicles in millions of units
2) Schaeffler estimates
98% 97% 85% 72% 53%
13% 24% 37%
10%
Battery electric vehicles
Hybrid vehicles
Internal combustion engines
CAGR 2010/2030+2.4% p.a.
4%
Basic scenario 2)
74
89
102
111120
1
2020e20152010 2030e2025e
98% 97% 85% 50%30%
13%
35%
40%
30%
CAGR 2010/2030+2.4% p.a.
15%
74
89
102
111120
Acceleratedscenario 2)
Source: IHS, LMC Automotive, Schaeffler Group projections1) Annually expected global production volume, automobiles/small
utility vehicles in millions of units2) Schaeffler estimates
Battery electric vehicles
Hybrid vehicles
Internal combustion engines
Global production volume 1)
in millions of units
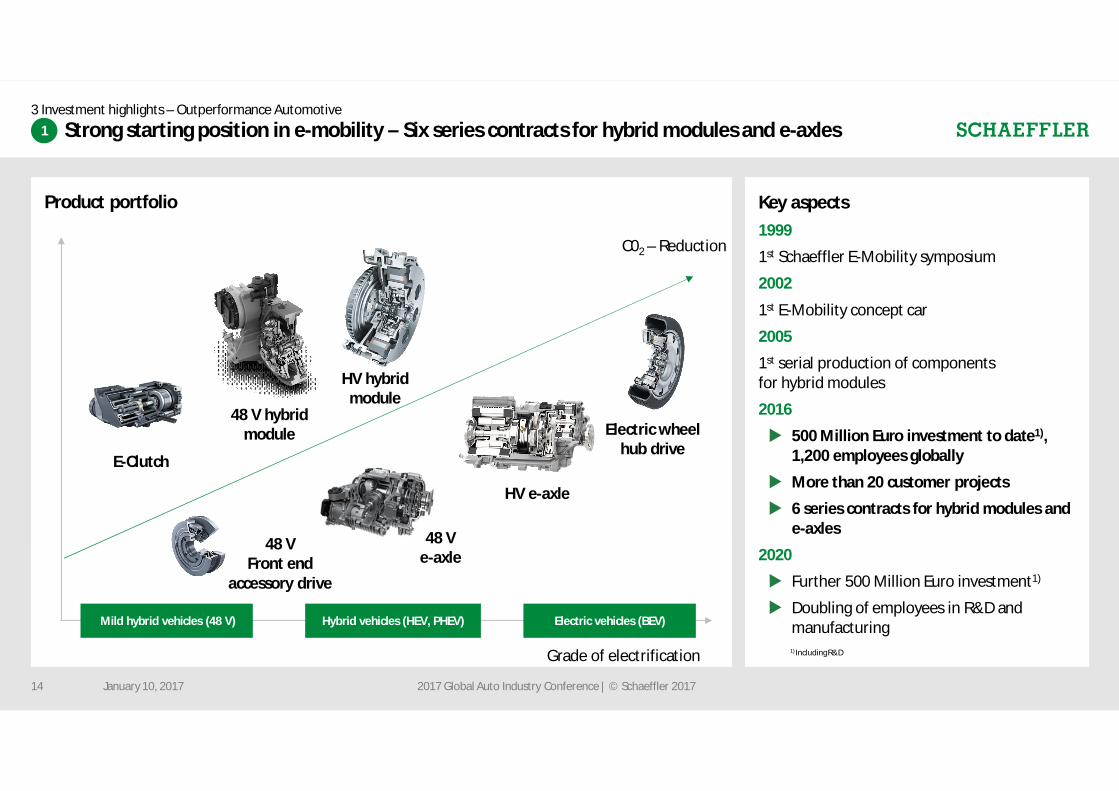
Product portfolio
C02 – Reduction
Grade of electrification
E-Clutch
HV hybridmodule
HV e-axle
Electric wheelhub drive
48 V hybridmodule
48 Ve-axle
Mild hybrid vehicles (48 V) Hybrid vehicles (HEV, PHEV) Electric vehicles (BEV)
Key aspects1999
1st Schaeffler E-Mobility symposium
2002
1st E-Mobility concept car
2005
1st serial production of componentsfor hybrid modules
2016
u 500 Million Euro investment to date1),1,200 employees globally
u More than 20 customer projects
u 6 series contracts for hybrid modules ande-axles
2020
u Further 500 Million Euro investment1)
u Doubling of employees in R&D andmanufacturing
48 VFront end
accessory drive
January 10, 2017 2017 Global Auto Industry Conference | © Schaeffler 2017
1) IncludingR&D
14
3 Investment highlights – Outperformance Automotive1 Strong starting position in e-mobility – Six series contracts for hybrid modules and e-axles
January 10, 2017 2017 Global Auto Industry Conference | © Schaeffler 201714
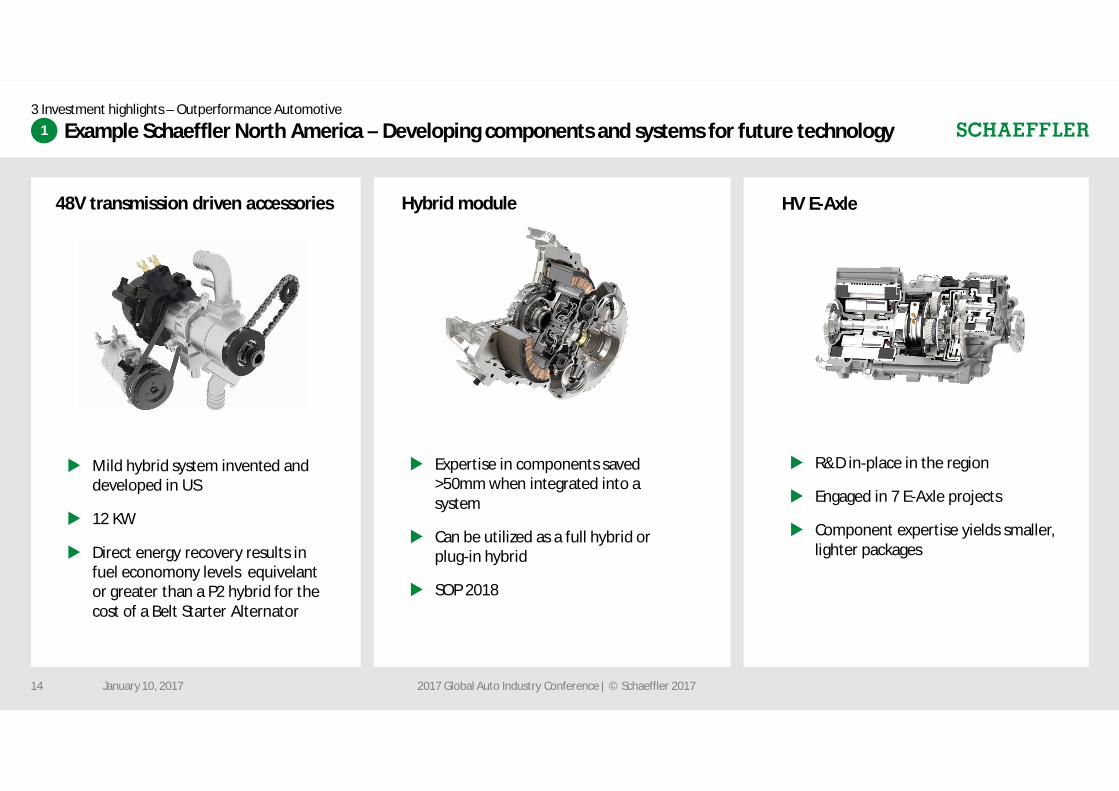
Example Schaeffler North America – Developing components and systems for future technology
u Expertise in components saved>50mm when integrated into asystem
u Can be utilized as a full hybrid orplug-in hybrid
u SOP 2018
u Mild hybrid system invented anddeveloped in US
u 12 KW
u Direct energy recovery results infuel economony levels equivelantor greater than a P2 hybrid for thecost of a Belt Starter Alternator
u R&D in-place in the region
u Engaged in 7 E-Axle projects
u Component expertise yields smaller,lighter packages
Hybrid module48V transmission driven accessories HV E-Axle
3 Investment highlights – Outperformance Automotive1
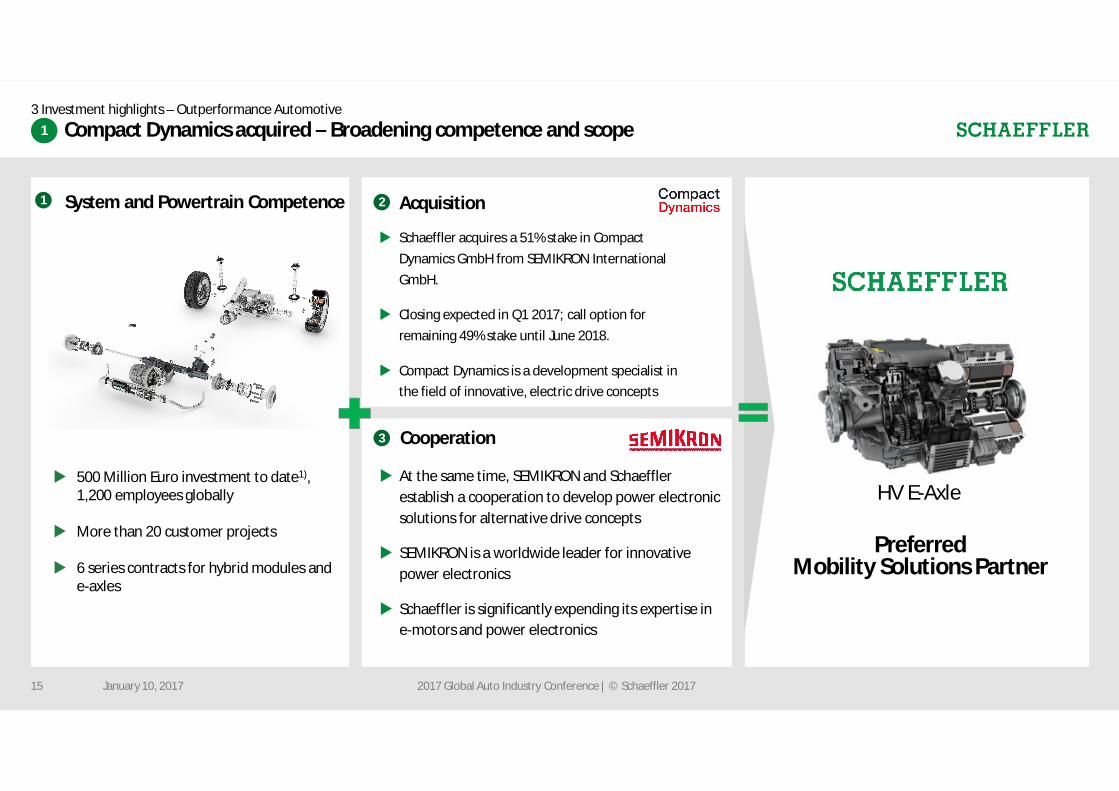
Compact Dynamics acquired – Broadening competence and scope
January 10, 2017 2017 Global Auto Industry Conference | © Schaeffler 201715
Acquisition2
Cooperation3
u Schaeffler acquires a 51% stake in CompactDynamics GmbH from SEMIKRON InternationalGmbH.
u Closing expected in Q1 2017; call option forremaining 49% stake until June 2018.
u Compact Dynamics is a development specialist inthe field of innovative, electric drive concepts
u At the same time, SEMIKRON and Schaefflerestablish a cooperation to develop power electronicsolutions for alternative drive concepts
u SEMIKRON is a worldwide leader for innovativepower electronics
u Schaeffler is significantly expending its expertise ine-motors and power electronics
PreferredMobility Solutions Partner
u 500 Million Euro investment to date1),1,200 employees globally
u More than 20 customer projects
u 6 series contracts for hybrid modules ande-axles
System and Powertrain Competence1
HV E-Axle
13 Investment highlights – Outperformance Automotive
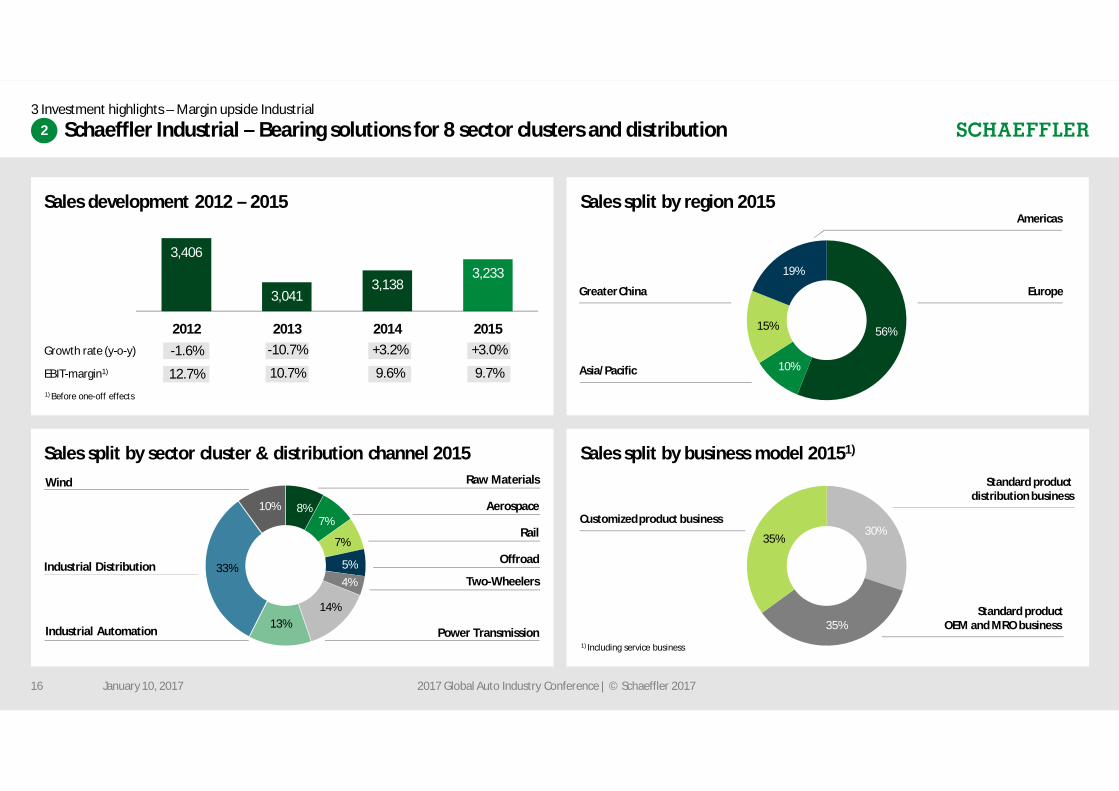
Sales split by region 2015Sales development 2012 – 2015
3 Investment highlights – Margin upside Industrial
Schaeffler Industrial – Bearing solutions for 8 sector clusters and distribution
Sales split by sector cluster & distribution channel 2015
3,406
3,0413,138
3,233
2012 2013 2014 2015-1.6% -10.7% +3.2% +3.0%Growth rate (y-o-y)
12.7% 10.7% 9.6% 9.7%EBIT-margin1)
1) Before one-off effects
56%
10%
15%
19%
Greater China
Americas
Europe
Asia/Pacific
16 2017 Global Auto Industry Conference | © Schaeffler 2017
10%
13%14%
8%7%
7%
5%4%
33%
Power Transmission
Two-Wheelers
Offroad
Rail
Aerospace
Raw Materials
Industrial Distribution
Wind
Industrial Automation
January 10, 2017
Sales split by business model 20151)
1) Including service business
30%
35%
35%
Customized product business
Standard productOEM and MRO business
Standard productdistribution business
2
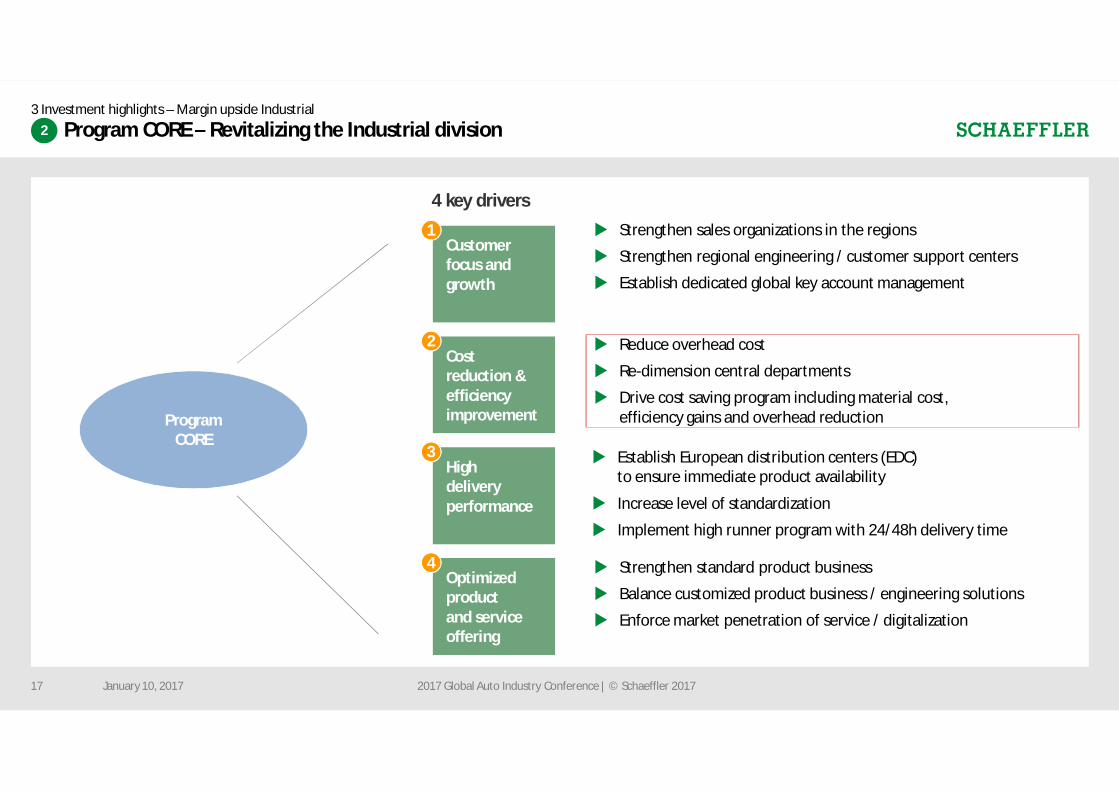
3 Investment highlights – Margin upside Industrial
Program CORE – Revitalizing the Industrial division
ProgramCORE
Customerfocus andgrowth
1
4 key drivers
Costreduction &efficiencyimprovement
2
Highdeliveryperformance
3
Optimizedproductand serviceoffering
4
u Reduce overhead cost
u Re-dimension central departments
u Drive cost saving program including material cost,efficiency gains and overhead reduction
u Establish European distribution centers (EDC)to ensure immediate product availability
u Increase level of standardization
u Implement high runner program with 24/48h delivery time
u Strengthen standard product business
u Balance customized product business / engineering solutions
u Enforce market penetration of service / digitalization
u Strengthen sales organizations in the regions
u Strengthen regional engineering / customer support centers
u Establish dedicated global key account management
January 10, 2017 2017 Global Auto Industry Conference | © Schaeffler 201717
2
3 Investment highlights – Margin upside Industrial
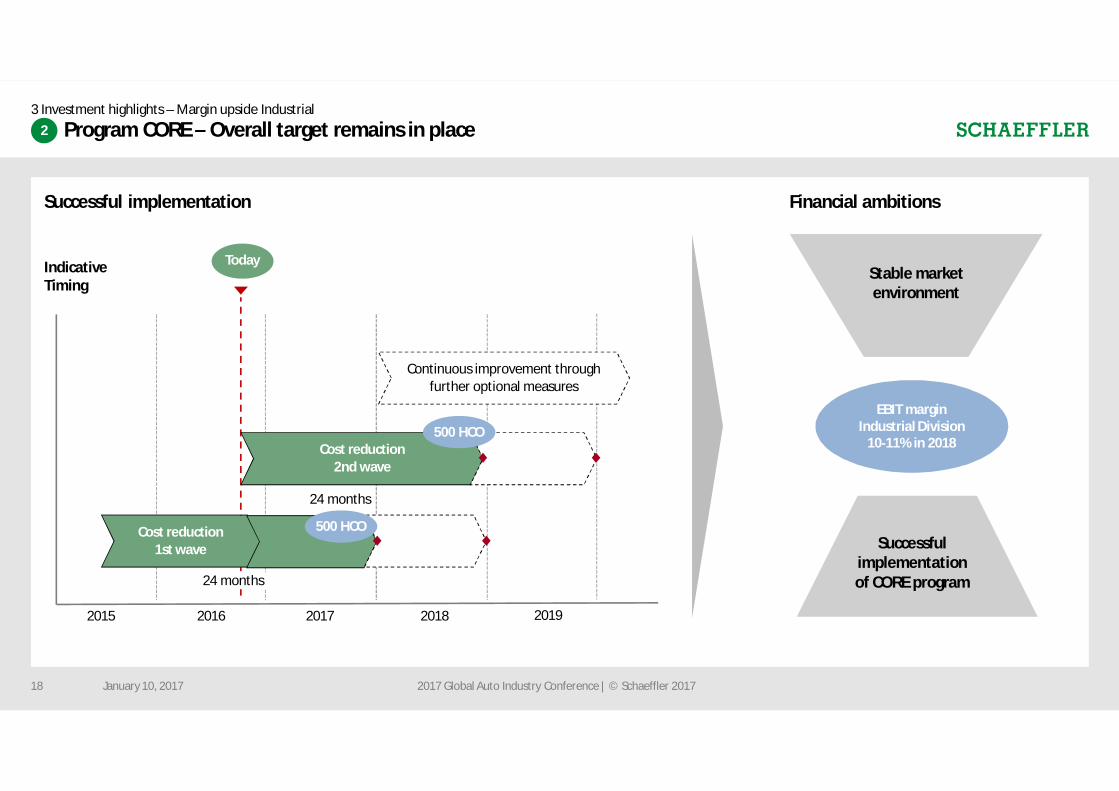
Program CORE – Overall target remains in place
Successful implementation Financial ambitions
2015 2016 2017 2018
Today
2019
IndicativeTiming
Cost reduction1st wave
24 months
24 months
500 HCO
Cost reduction2nd wave
Continuous improvement throughfurther optional measures
500 HCO
Stable marketenvironment
Successfulimplementationof CORE program
EBIT marginIndustrial Division
10-11% in 2018
January 10, 2017 2017 Global Auto Industry Conference | © Schaeffler 201718
2
3 Investment highlights – Strong Free Cash Flow Generation
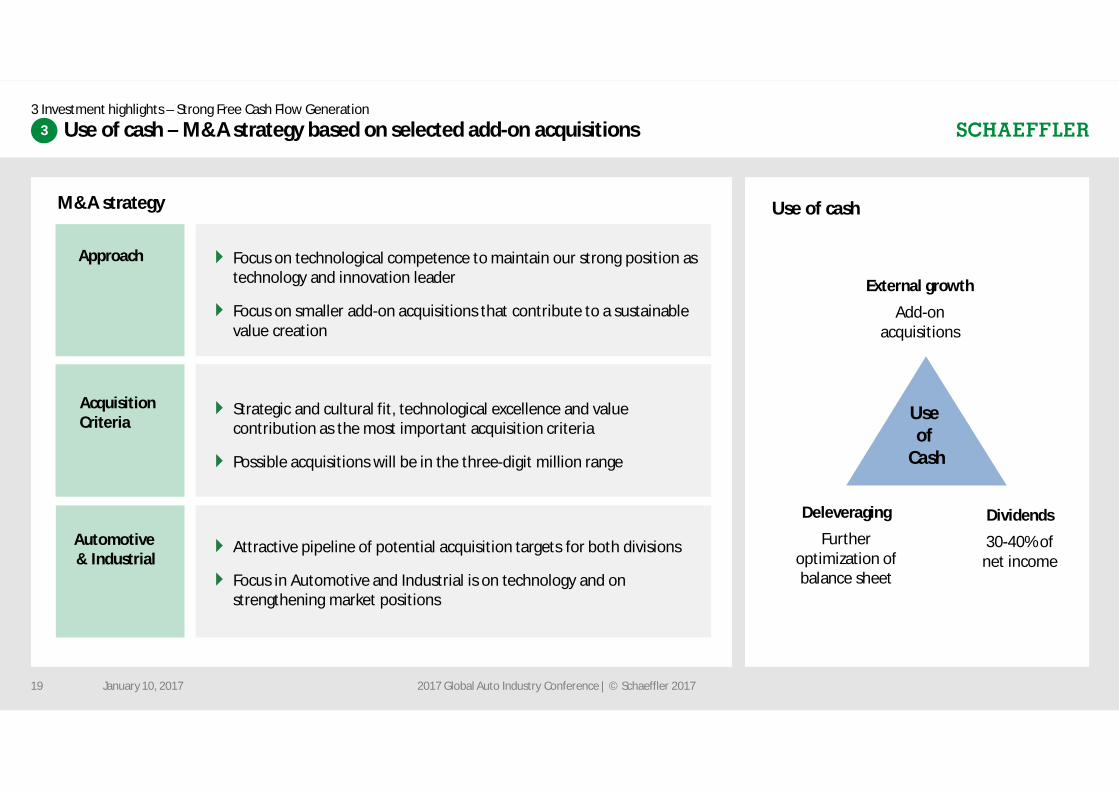
Use of cash – M&A strategy based on selected add-on acquisitions
Dividends
30-40% ofnet income
Use of cash
External growth
Add-onacquisitions
Deleveraging
Furtheroptimization ofbalance sheet
Useof
Cash
4 Strategic and cultural fit, technological excellence and valuecontribution as the most important acquisition criteria
4 Possible acquisitions will be in the three-digit million range
Approach
AcquisitionCriteria
Automotive& Industrial
4 Focus on technological competence to maintain our strong position astechnology and innovation leader
4 Focus on smaller add-on acquisitions that contribute to a sustainablevalue creation
4 Attractive pipeline of potential acquisition targets for both divisions
4 Focus in Automotive and Industrial is on technology and onstrengthening market positions
M&A strategy
January 10, 2017 2017 Global Auto Industry Conference | © Schaeffler 201719
3
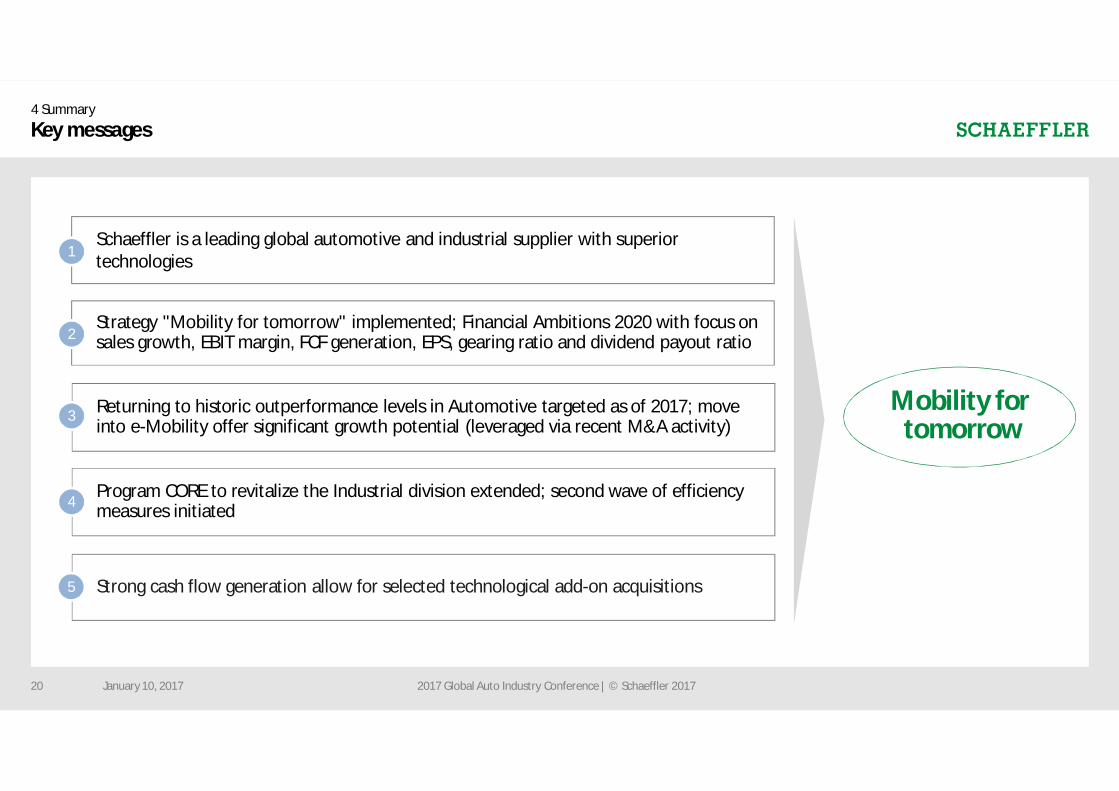
4 Summary
Key messages
Schaeffler is a leading global automotive and industrial supplier with superiortechnologies
Strategy "Mobility for tomorrow" implemented; Financial Ambitions 2020 with focus onsales growth, EBIT margin, FCF generation, EPS, gearing ratio and dividend payout ratio
Returning to historic outperformance levels in Automotive targeted as of 2017; moveinto e-Mobility offer significant growth potential (leveraged via recent M&A activity)
Program CORE to revitalize the Industrial division extended; second wave of efficiencymeasures initiated
Strong cash flow generation allow for selected technological add-on acquisitions
2
4
1
3
5
Mobility fortomorrow
January 10, 2017 2017 Global Auto Industry Conference | © Schaeffler 201720
Investor Relations
Phone: + 49 9132 82 4440
Email: [email protected]
Web: www.schaeffler.com/ir
Financial Calendar
FY 2016 results: March 8, 2017
Q1 2017 results: May 11, 2017
H1 2017 results: August 8, 2017
9M 2017 results: November 8, 2017
January 10, 2017 2017 Global Auto Industry Conference | © Schaeffler 201721
IR Contact
Backup
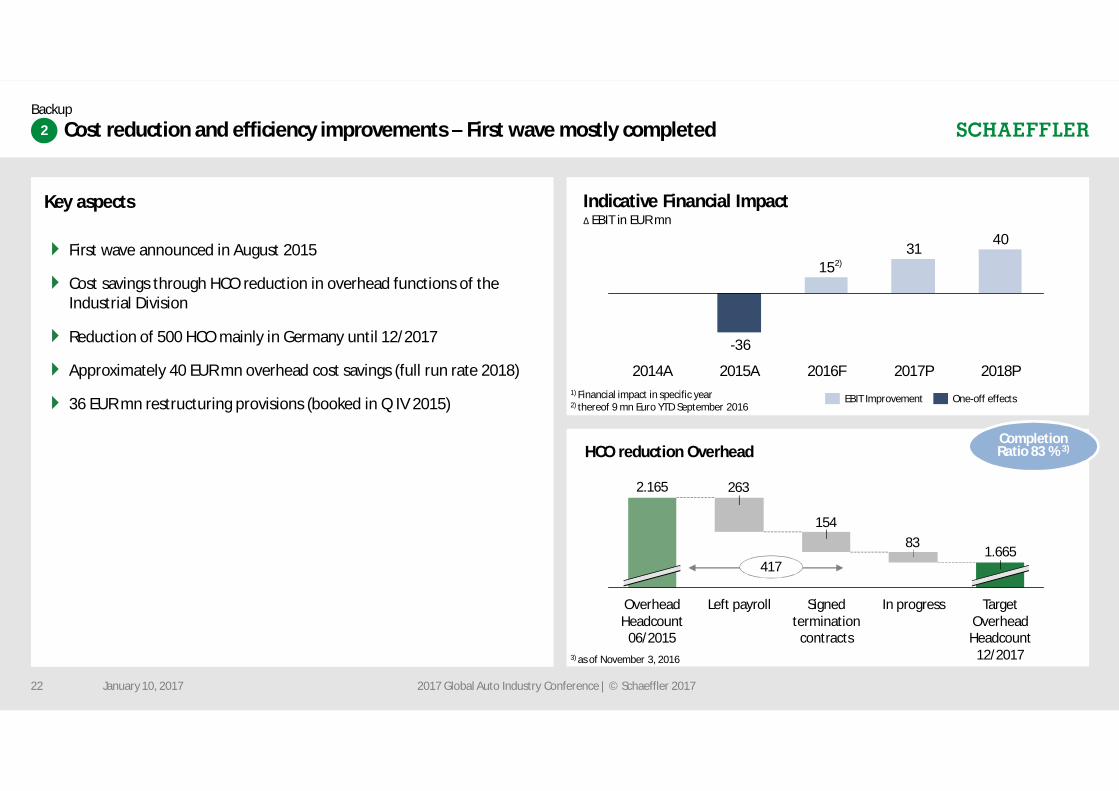
Cost reduction and efficiency improvements – First wave mostly completed
Key aspects
4 First wave announced in August 2015
4 Cost savings through HCO reduction in overhead functions of theIndustrial Division
4 Reduction of 500 HCO mainly in Germany until 12/2017
4 Approximately 40 EUR mn overhead cost savings (full run rate 2018)
4 36 EUR mn restructuring provisions (booked in Q IV 2015)
-36
4031
15
2018P2017P2016F2015A2014A
83154
263
TargetOverhead
Headcount12/2017
1.665
Signedtermination
contracts
Left payrollOverheadHeadcount
06/2015
2.165
In progress
HCO reduction OverheadCompletionRatio 83 % 3)
1) Financial impact in specific year2) thereof 9 mn Euro YTD September 2016
417
EBIT Improvement One-off effects
3) as of November 3, 2016
2)
Indicative Financial ImpactΔ EBIT in EUR mn
January 10, 2017 2017 Global Auto Industry Conference | © Schaeffler 201722
2
Backup
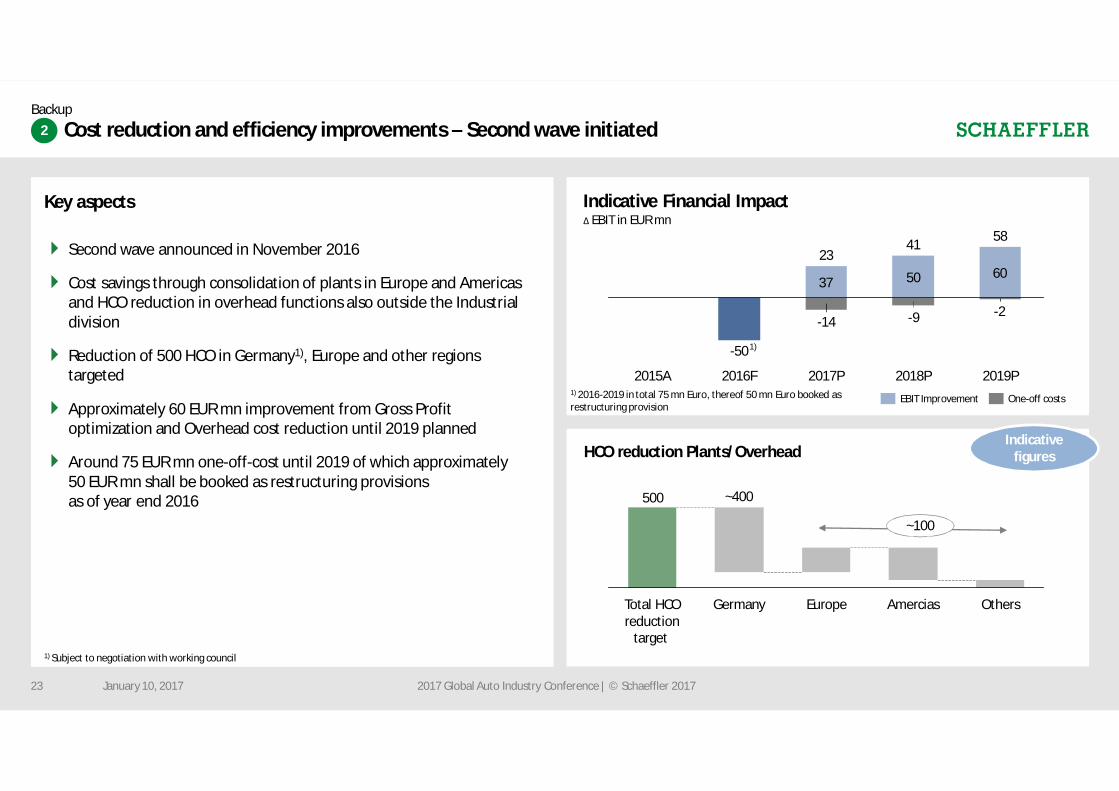
Cost reduction and efficiency improvements – Second wave initiated
Key aspects
1) Subject to negotiation with working council
37 50 60
-2-9-14
2019P
58
2018P
41
2017P
23
2016F
-50
2015A
Indicative Financial ImpactΔ EBIT in EUR mn
One-off costsEBIT Improvement
HCO reduction Plants/OverheadIndicative
figures
500
OthersAmerciasEuropeGermanyTotal HCOreduction
target
~400
~100
4 Second wave announced in November 2016
4 Cost savings through consolidation of plants in Europe and Americasand HCO reduction in overhead functions also outside the Industrialdivision
4 Reduction of 500 HCO in Germany1), Europe and other regionstargeted
4 Approximately 60 EUR mn improvement from Gross Profitoptimization and Overhead cost reduction until 2019 planned
4 Around 75 EUR mn one-off-cost until 2019 of which approximately50 EUR mn shall be booked as restructuring provisionsas of year end 2016
1)
1) 2016-2019 in total 75 mn Euro, thereof 50 mn Euro booked asrestructuring provision
January 10, 2017 2017 Global Auto Industry Conference | © Schaeffler 201723
2
Backup
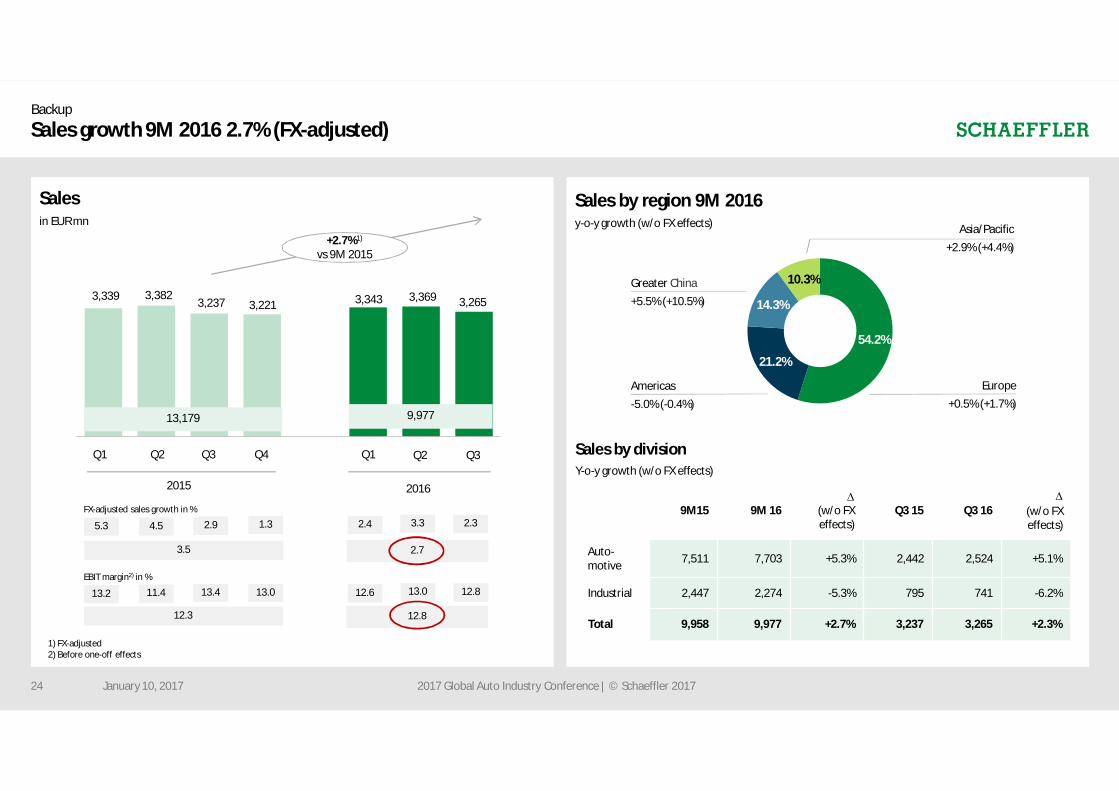
Sales growth 9M 2016 2.7% (FX-adjusted)
January 10, 2017 2017 Global Auto Industry Conference | © Schaeffler 2017
EBIT margin2) in %
1) FX-adjusted2) Before one-off effects
Salesin EUR mn
54.2%
21.2%
14.3%
10.3%
Americas-5.0% (-0.4%)
Greater China+5.5% (+10.5%)
Europe+0.5% (+1.7%)
Asia/Pacific+2.9% (+4.4%)
Sales by region 9M 2016y-o-y growth (w/o FX effects)
Sales by divisionY-o-y growth (w/o FX effects)
13.2 11.4 13.4 13.0
12.3
12.6
FX-adjusted sales growth in %
5.3 4.5 2.9 1.3 2.4
Q1
3,339
Q4
3,221
Q3
3,237
Q2
3,382
Q1
3,343
2015 2016
13,179
+2.7%1)
vs 9M 2015
3,369
9,977
3.3
Q2
13.0
12.8
3,265
Q3
2.3
12.8
3.5 2.7
9M15 9M 16D
(w/o FXeffects)
Q3 15 Q3 16D
(w/o FXeffects)
Auto-motive 7,511 7,703 +5.3% 2,442 2,524 +5.1%
Industrial 2,447 2,274 -5.3% 795 741 -6.2%
Total 9,958 9,977 +2.7% 3,237 3,265 +2.3%
24
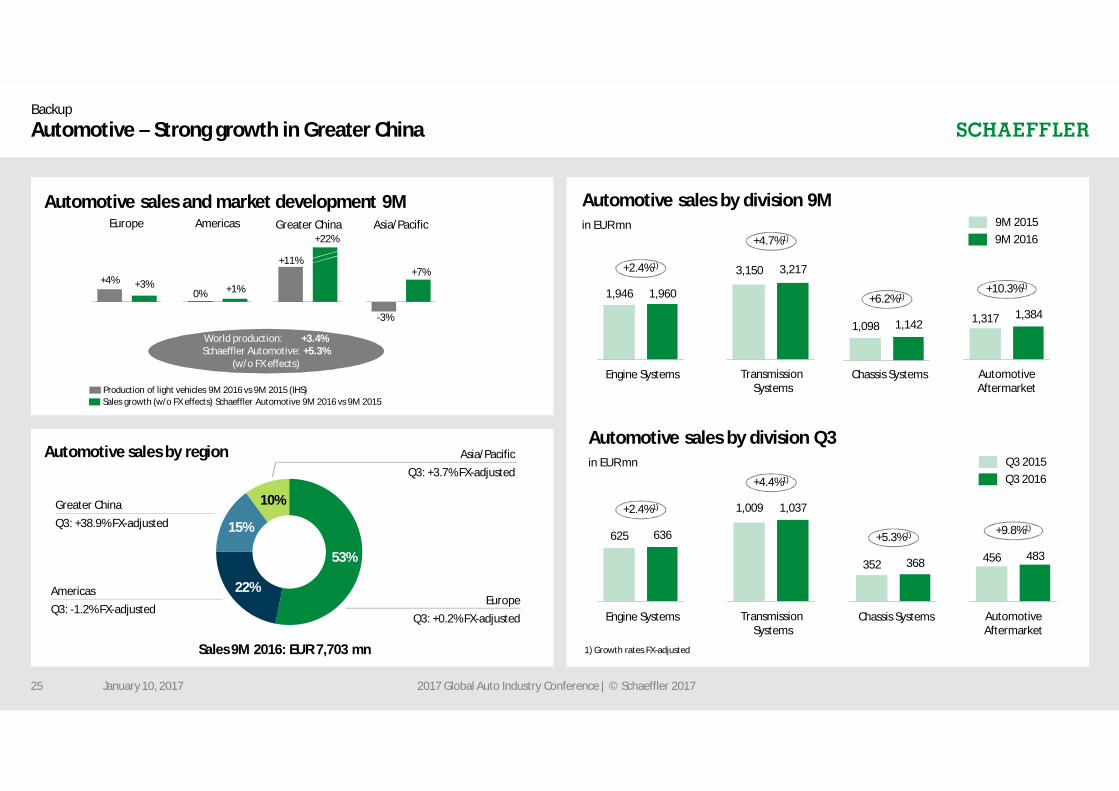
Automotive sales and market development 9M
Backup
Automotive sales by region
Automotive – Strong growth in Greater China
January 10, 2017 2017 Global Auto Industry Conference | © Schaeffler 2017
Production of light vehicles 9M 2016 vs 9M 2015 (IHS)Sales growth (w/o FX effects) Schaeffler Automotive 9M 2016 vs 9M 2015
+3%+4%
Europe Americas Asia/PacificGreater China
+1%0%
+7%
-3%
+22%
+11%
World production: +3.4%Schaeffler Automotive: +5.3%
(w/o FX effects)
53%
22%
15%
10%
AmericasQ3: -1.2% FX-adjusted
Greater ChinaQ3: +38.9% FX-adjusted
EuropeQ3: +0.2% FX-adjusted
Asia/PacificQ3: +3.7% FX-adjusted
Sales 9M 2016: EUR 7,703 mn
25
Automotive sales by division 9Min EUR mn
Automotive sales by division Q3in EUR mn
1) Growth rates FX-adjusted
1,960
+2.4%1)
1,946
3,150
+4.7%1)
3,217
1,098 1,142
+6.2%1)
1,384
+10.3%1)
1,317
Engine Systems TransmissionSystems
Chassis Systems AutomotiveAftermarket
+2.4%1)
625 636
1,037
+4.4%1)
1,009
+5.3%1)
368352483456
+9.8%1)
Engine Systems TransmissionSystems
Chassis Systems AutomotiveAftermarket
Q3 2015Q3 2016
9M 20159M 2016
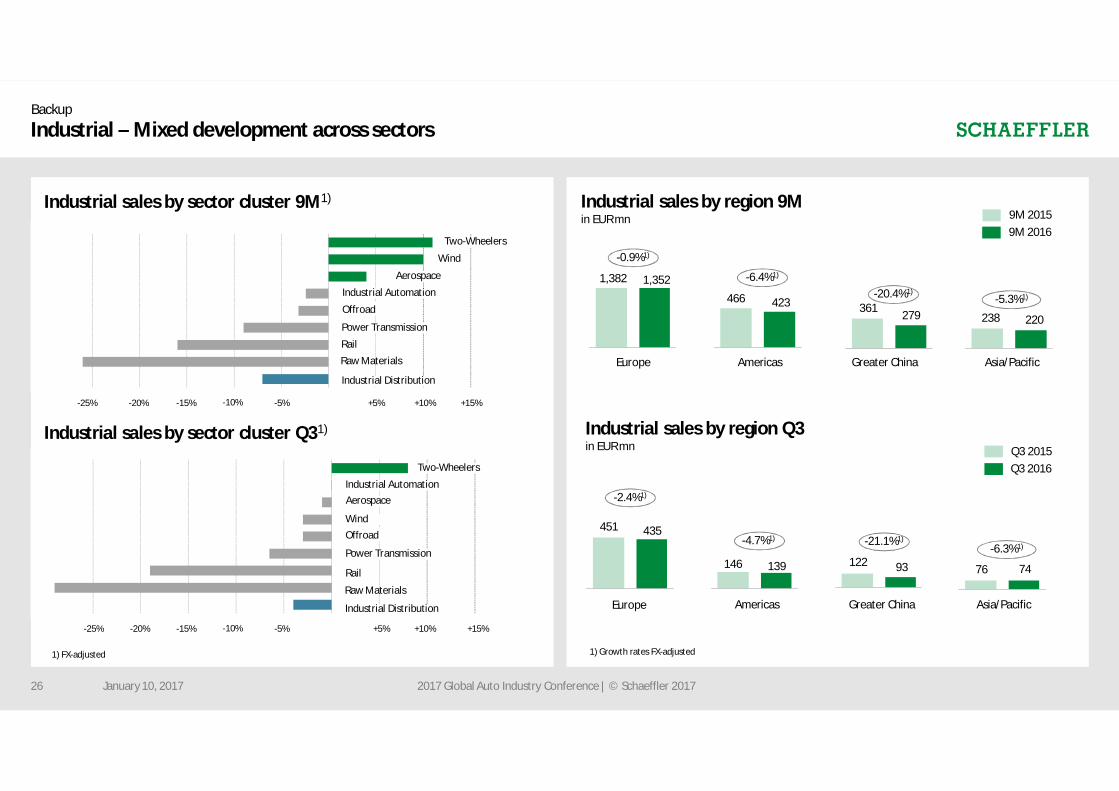
Industrial sales by sector cluster 9M1)
Backup
Industrial – Mixed development across sectors
January 10, 2017 2017 Global Auto Industry Conference | © Schaeffler 201726
-15% -10% -5% +5% +10% +15%
Aerospace
Rail
Industrial Automation
Two-Wheelers
Offroad
Power Transmission
Raw Materials
Wind
-20%-25%
Industrial Distribution
Industrial sales by sector cluster Q31)
-15% -10% -5% +5% +10% +15%
Aerospace
Rail
Industrial Automation
Two-Wheelers
Offroad
Power Transmission
Raw Materials
Wind
-20%-25%
Industrial Distribution
1) FX-adjusted
Industrial sales by region 9Min EUR mn
Industrial sales by region Q3in EUR mn
1) Growth rates FX-adjusted
1,352
-0.9%1)
1,382
466
-6.4%1)
423 361 279
-20.4%1)
220
-5.3%1)
238
Europe Americas Greater China Asia/Pacific
-2.4%1)
451 435
139
-4.7%1)
146
-21.1%1)
93122 7476
-6.3%1)
Europe Americas Greater China Asia/Pacific
Q3 2015Q3 2016
9M 20159M 2016
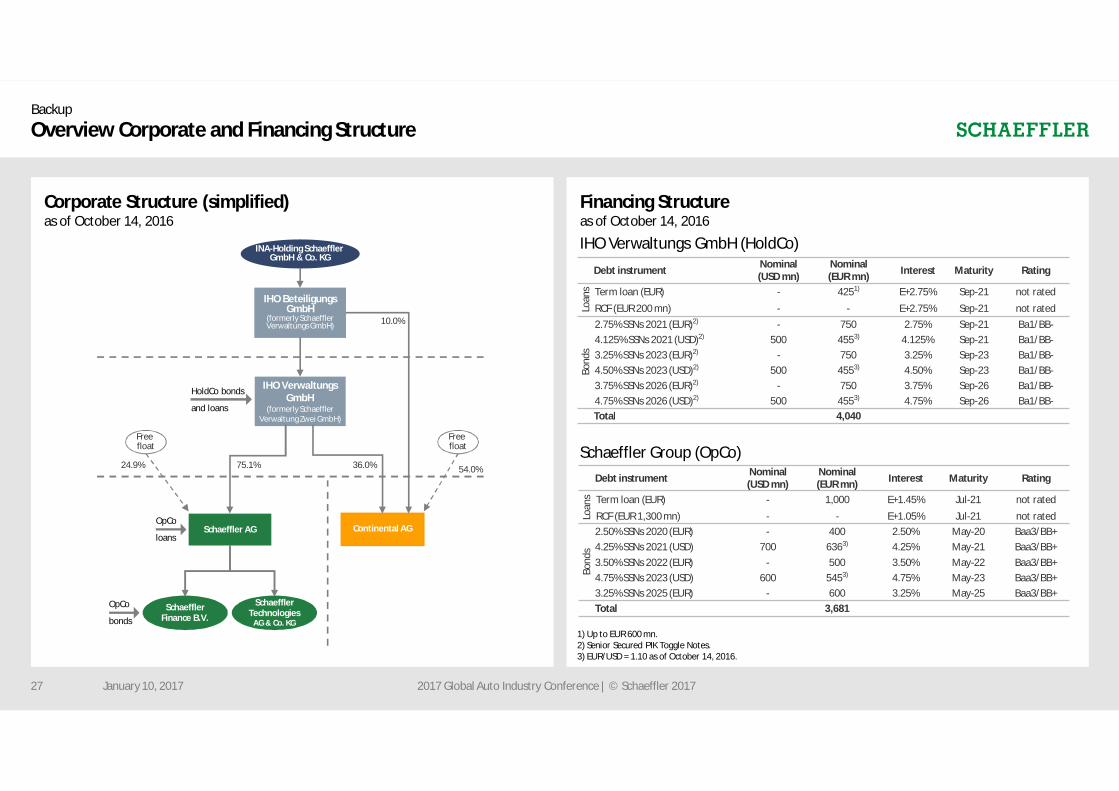
Overview Corporate and Financing Structure
Corporate Structure (simplified)as of October 14, 2016
Financing Structureas of October 14, 2016
Backup
54.0%24.9%
IHO VerwaltungsGmbH
(formerly SchaefflerVerwaltung Zwei GmbH)
IHO BeteiligungsGmbH
(formerly SchaefflerVerwaltungs GmbH)
Continental AGSchaeffler AGOpCo
loans
SchaefflerFinance B.V.
OpCo
bonds
Freefloat
10.0%
75.1%
HoldCo bonds
and loans
36.0%
SchaefflerTechnologies
AG & Co. KG
INA-Holding SchaefflerGmbH & Co. KG
Freefloat
Debt instrument Nominal(USD mn)
Nominal(EUR mn) Interest Maturity Rating
Loan
s Term loan (EUR) - 1,000 E+1.45% Jul-21 not ratedRCF (EUR 1,300 mn) - - E+1.05% Jul-21 not rated
Bond
s
2.50% SSNs 2020 (EUR) - 400 2.50% May-20 Baa3/BB+4.25% SSNs 2021 (USD) 700 6363) 4.25% May-21 Baa3/BB+3.50% SSNs 2022 (EUR) - 500 3.50% May-22 Baa3/BB+4.75% SSNs 2023 (USD) 600 5453) 4.75% May-23 Baa3/BB+3.25% SSNs 2025 (EUR) - 600 3.25% May-25 Baa3/BB+Total 3,681
IHO Verwaltungs GmbH (HoldCo)
Schaeffler Group (OpCo)
1) Up to EUR 600 mn.2) Senior Secured PIK Toggle Notes.3) EUR/USD = 1.10 as of October 14, 2016.
Debt instrument Nominal(USD mn)
Nominal(EUR mn) Interest Maturity Rating
Loan
s Term loan (EUR) - 4251) E+2.75% Sep-21 not ratedRCF (EUR 200 mn) - - E+2.75% Sep-21 not rated
Bond
s
2.75% SSNs 2021 (EUR)2) - 750 2.75% Sep-21 Ba1/BB-4.125% SSNs 2021 (USD)2) 500 4553) 4.125% Sep-21 Ba1/BB-3.25% SSNs 2023 (EUR)2) - 750 3.25% Sep-23 Ba1/BB-4.50% SSNs 2023 (USD)2) 500 4553) 4.50% Sep-23 Ba1/BB-3.75% SSNs 2026 (EUR)2) - 750 3.75% Sep-26 Ba1/BB-4.75% SSNs 2026 (USD)2) 500 4553) 4.75% Sep-26 Ba1/BB-Total 4,040
January 10, 2017 2017 Global Auto Industry Conference | © Schaeffler 201727