2017 half-year results - lloydsbankinggroup.com · implementing regulatory reform and ring-fencing,...
TRANSCRIPT

2017 HALF-YEAR RESULTSNews Release

BASIS OF PRESENTATION
This release covers the results of Lloyds Banking Group plc together with its subsidiaries (the Group) for the half-year
ended 30 June 2017.
Statutory basis: Statutory information is set out on pages 50 to 85. However, a number of factors have had a significant
effect on the comparability of the Group’s financial position and results. Accordingly, the results are also presented on an
underlying basis.
Underlying basis: The statutory results are adjusted for certain items which are listed below, to allow a comparison
of the Group’s underlying performance.
losses on redemption of the Enhanced Capital Notes and the volatility in the value of the embedded equity
conversion feature;
market volatility and asset sales, which includes the effects of certain asset sales, the volatility relating to the
Group’s own debt and hedging arrangements and that arising in the insurance businesses and insurance gross up;
the unwind of acquisition-related fair value adjustments and the amortisation of purchased intangible assets;
restructuring costs, comprising severance related costs relating to the Simplification programme, the costs of
implementing regulatory reform and ring-fencing, the rationalisation of the non-branch property portfolio and the
integration of MBNA; and
payment protection insurance and other conduct provisions.
Unless otherwise stated, income statement commentaries throughout this document compare the half-year ended
30 June 2017 to the half-year ended 30 June 2016, and the balance sheet analysis compares the Group balance
sheet as at 30 June 2017 to the Group balance sheet as at 31 December 2016.
MBNA: MBNA’s results and balance sheet have been consolidated with effect from 1 June 2017.
Alternative performance measures: The Group uses a number of alternative performance measures, including
underlying profit, in the discussion of its business performance and financial position. Further information on these
measures is set out on page 89.
FORWARD LOOKING STATEMENTS
This document contains certain forward looking statements with respect to the business, strategy and plans of Lloyds Banking Group and its current goals and expectations relating to its future financial condition and performance. Statements that are not historical facts, including statements about Lloyds Banking Group's or its directors' and/or management's beliefs and expectations, are forward looking statements. By their nature, forward looking statements involve risk and uncertainty because they relate to events and depend upon circumstances that will or may occur in the future. Factors that could cause actual business, strategy, plans and/or results (including but not limited to the payment of dividends) to differ materially from the plans, objectives, expectations, estimates and intentions expressed in such forward looking statements made by the Group or on its behalf include, but are not limited to: general economic and business conditions in the UK and internationally; market related trends and developments; fluctuations in interest rates (including low or negative rates), exchange rates, stock markets and currencies; the ability to access sufficient sources of capital, liquidity and funding when required; changes to the Group's credit ratings; the ability to derive cost savings and other benefits including, but without limitation as a result of any acquisitions, disposals and other strategic transactions; changing customer behaviour including consumer spending, saving and borrowing habits; changes to borrower or counterparty credit quality; instability in the global financial markets, including Eurozone instability, instability as a result of the exit by the UK from the European Union (EU) and the potential for other countries to exit the EU or the Eurozone and the impact of any sovereign credit rating downgrade or other sovereign financial issues; technological changes and risks to the security of IT and operational infrastructure, systems, data and information resulting from increased threat of cyber and other attacks; natural, pandemic and other disasters, adverse weather and similar contingencies outside the Group's control; inadequate or failed internal or external processes or systems; acts of war, other acts of hostility, terrorist acts and responses to those acts, geopolitical, pandemic or other such events; changes in laws, regulations, accounting standards or taxation, including as a result of the exit by the UK from the EU, or a further possible referendum on Scottish independence; changes to regulatory capital or liquidity requirements and similar contingencies outside the Group's control; the policies, decisions and actions of governmental or regulatory authorities or courts in the UK, the EU, the US or elsewhere including the implementation and interpretation of key legislation and regulation; the ability to attract and retain senior management and other employees; actions or omissions by the Group's directors, management or employees including industrial action; changes to the Group's post-retirement defined benefit scheme obligations; the extent of any future impairment charges or write-downs caused by, but not limited to, depressed asset valuations, market disruptions and illiquid markets; the value and effectiveness of any credit protection purchased by the Group; the inability to hedge certain risks economically; the adequacy of loss reserves; the actions of competitors, including non-bank financial services, lending companies and digital innovators and disruptive technologies; and exposure to regulatory or competition scrutiny, legal, regulatory or competition proceedings, investigations or complaints. Please refer to the latest Annual Report on Form 20-F filed with the US Securities and Exchange Commission for a discussion of certain factors together with examples of forward looking statements. Except as required by any applicable law or regulation, the forward looking statements contained in this document are made as of today's date, and Lloyds Banking Group expressly disclaims any obligation or undertaking to release publicly any updates or revisions to any forward looking statements. The information, statements and opinions contained in this document do not constitute a public offer under any applicable law or an offer to sell any securities or financial instruments or any advice or recommendation with respect to such securities or financial instruments.

CONTENTS
Page
Key highlights 1
Consolidated income statement 2
Balance sheet and key ratios 2
Summary consolidated balance sheet 3
Group Chief Executive’s statement 4
Summary of Group results 6
Underlying basis segmental analysis 11
Underlying basis quarterly information 12
Divisional highlights
Retail 13
Commercial Banking 15
Consumer Finance 17
Insurance 19
Run-off and Central items 21
Additional information
Reconciliation between statutory and underlying basis results 22
Banking net interest margin 23
Volatility arising in the insurance businesses 24
Number of employees (full-time equivalent) 24
Tangible net assets per share 25
Return on tangible equity 25
Risk management
Principal risks and uncertainties 26
Credit risk portfolio 27
Funding and liquidity management 37
Capital management 42
Statutory information
Primary statements 50
Consolidated income statement 51
Consolidated statement of comprehensive income 52
Consolidated balance sheet 53
Consolidated statement of changes in equity 55
Consolidated cash flow statement 58
Notes to the consolidated financial statements 59
Summary of alternative performance measures 89
Contacts 90

LLOYDS BANKING GROUP PLC 2017 HALF-YEAR RESULTS
Page 1 of 90
RESULTS FOR THE HALF-YEAR
‘Following the successful transformation of the Group to become a simple, low risk, UK focused retail and commercial
bank, we have delivered another strong set of results with increased underlying and statutory profit and strong capital
generation, whilst completing the acquisition of MBNA and returning to full private ownership.
The UK economy remains resilient following strong employment and GDP growth in recent years together with private
sector deleveraging and rising house prices. Inflation is however now rising above disposable income given the recent
depreciation in sterling and, while this may affect consumption going forward, the economy should benefit from rising
exports and earnings from foreign assets.
We have announced that our next strategy update for the period 2018-2020 will accompany the Group’s full year results
in February 2018, and in preparation for this we have made a number of organisational and senior management
changes. The changes are aimed at aligning and strengthening the Group’s structure to ensure we meet evolving
customer needs and deliver the continuous transformation required of the organisation in the most effective way.
Our differentiated UK focused business model continues to deliver, with our cost leadership and lower risk positioning
providing competitive advantage. Our strong financial performance and strategic progress continue to position us well for
delivering our purpose of Helping Britain Prosper.’
António Horta-Osório
Group Chief Executive
Strong financial performance with improvements in underlying and statutory profit
Underlying profit of £4.5 billion, up 8 per cent; underlying return on tangible equity of 16.6 per cent
Total income 4 per cent higher at £9.3 billion
Net interest income of £5.9 billion, up 2 per cent with improved margin of 2.82 per cent
Other income 8 per cent higher at £3.3 billion
Operating costs 1 per cent lower at £4.0 billion. Market-leading cost:income ratio improved to 45.8 per cent
Asset quality remains strong with impairment charge of £268 million, asset quality ratio stable at 12 basis points
Loans and advances increased to £453 billion, including the benefit of the acquisition of MBNA
Statutory profit before tax 4 per cent higher at £2.5 billion, despite an additional £1 billion of conduct charges in the
second quarter, primarily in respect of PPI
Strong capital generation of c.100 basis points reflecting strong underlying performance with common equity tier 1
(CET1) ratio of 14.0 per cent (13.5 per cent post dividend); leverage ratio of 4.9 per cent
Tangible net assets per share of 52.4 pence (31 Dec 2016: 54.8 pence) after payment of 2016 final dividend of
2.2 pence per share and a 1.4 pence per share reduction from the acquisition of MBNA
2017 guidance for NIM and AQR updated, with all other guidance reaffirmed
Net interest margin for the full year now expected to be close to 2.85 per cent, including MBNA
Asset quality ratio for the full year now expected to be less than 20 basis points, including MBNA
Continue to expect 2017 capital generation at the top end of the 170-200 basis points ongoing guidance range
All other longer term guidance remains unchanged
Increased interim dividend
Interim ordinary dividend of 1.0 pence per share, up 18 per cent, in line with our progressive and sustainable
approach to ordinary dividends

LLOYDS BANKING GROUP PLC 2017 HALF-YEAR RESULTS
Page 2 of 90
CONSOLIDATED INCOME STATEMENT − UNDERLYING BASIS
Half-year Half-year Half-year to 30 June to 30 June to 31 Dec 2017 2016 Change 2016 Change £ million £ million % £ million % Net interest income 5,925 5,782 2 5,653 5
Other income 3,348 3,093 8 2,972 13
Total income 9,273 8,875 4 8,625 8
Operating lease depreciation (495) (428) (16) (467) (6)
Net income 8,778 8,447 4 8,158 8
Operating costs (4,018) (4,041) 1 (4,052) 1
Impairment (268) (245) (9) (400) 33
Underlying profit 4,492 4,161 8 3,706 21 Volatility and other items (358) (1,247) (297)
Payment protection insurance provision (1,050) – (1,000)
Other conduct provisions (540) (460) (625)
Statutory profit before tax 2,544 2,454 4 1,784 43
Taxation (905) (597) (1,127)
Profit for the period 1,639 1,857 (12) 657 149 Earnings per share 2.0p 2.3p (13) 0.6p 233 Banking net interest margin 2.82% 2.74% 8bp 2.69% 13bp
Average interest-earning banking assets £431bn £437bn (1) £435bn (1)
Cost:income ratio 45.8% 47.8% (2.0)pp 49.7% (3.9)pp
Asset quality ratio 0.12% 0.11% 1bp 0.18% (6)bp
Return on risk-weighted assets 4.20% 3.75% 45bp 3.35% 85bp
Underlying return on tangible equity 16.6% 15.1% 1.5pp 13.2% 3.4pp
Return on tangible equity 8.2% 9.7% (1.5)pp 3.6% 4.6pp
BALANCE SHEET AND KEY RATIOS
At 30 June At 31 Dec Change 2017 2016 % Loans and advances to customers1 £453bn £450bn 1
Customer deposits2 £417bn £413bn 1
Loan to deposit ratio 109% 109% –
Total assets £815bn £818bn –
Pro forma common equity tier 1 ratio pre 2017 dividend accrual3 14.0% 13.8% 0.2pp
Pro forma common equity tier 1 ratio3 13.5% 13.8% (0.3)pp
Transitional total capital ratio 20.8% 21.4% (0.6)pp
Pro forma leverage ratio3 4.9% 5.0% (0.1)pp
Risk-weighted assets £218bn £216bn 1
Tangible net assets per share4 52.4p 54.8p (2.4)p
1 Excludes reverse repos of £11.4 billion (31 December 2016: £8.3 billion). 2 Excludes repos of £1.0 billion (31 December 2016: £2.5 billion). 3 The common equity tier 1 and leverage ratios at 30 June 2017 and 31 December 2016 are reported on a pro forma basis, separately
reflecting dividends paid by the Insurance business in July 2017 (in relation to 2017 interim earnings) and February 2017 (in relationto 2016 full year earnings).
4 Tangible net assets per share at 30 June 2017 reflected the payment of the final dividend of 2.2 pence per share in May 2017 and a1.4 pence per share reduction from the acquisition of MBNA.

LLOYDS BANKING GROUP PLC 2017 HALF-YEAR RESULTS
Page 3 of 90
SUMMARY CONSOLIDATED BALANCE SHEET
At 30 June At 31 Dec 2017 2016 £ million £ million Assets
Cash and balances at central banks 50,491 47,452
Trading and other financial assets at fair value through profit or loss 161,970 151,174
Derivative financial instruments 30,024 36,138
Loans and receivables Loans and advances to banks 8,865 26,902
Loans and advances to customers 464,604 457,958
Debt securities 3,841 3,397
477,310 488,257
Available-for-sale financial assets 51,803 56,524
Other assets 43,321 38,248
Total assets 814,919 817,793 Liabilities
Deposits from banks 24,879 16,384
Customer deposits 417,617 415,460
Trading and other financial liabilities at fair value through profit or loss 55,671 54,504
Derivative financial instruments 29,190 34,924
Debt securities in issue 71,557 76,314
Liabilities arising from insurance and investment contracts 116,970 114,502
Subordinated liabilities 18,575 19,831
Other liabilities 32,114 37,059
Total liabilities 766,573 768,978
Shareholders’ equity 42,513 43,020
Other equity instruments 5,355 5,355
Non-controlling interests 478 440
Total equity 48,346 48,815
Total equity and liabilities 814,919 817,793

LLOYDS BANKING GROUP PLC 2017 HALF-YEAR RESULTS
Page 4 of 90
GROUP CHIEF EXECUTIVE’S STATEMENT
We have delivered another strong financial performance in the first half with increased underlying and statutory profit and
strong capital generation. We have returned to full private ownership, completed the acquisition of MBNA and have made
good strategic progress. As a simple, low risk, UK focused bank we are well placed to continue to help Britain prosper.
Operating environment
The UK economy remains resilient following strong employment and GDP growth in recent years together with private
sector deleveraging and rising house prices. Inflation is however now rising above disposable income given the recent
depreciation in sterling and, while this may affect consumption going forward, the economy should benefit from rising
exports and earnings from foreign assets.
The regulatory environment continues to evolve and there are a number of areas on which we await further clarity
including Basel IV, but given the strength of our balance sheet and the capital generative nature of our business model,
we are well placed to meet these requirements.
Financial performance
The Group has delivered another strong financial performance in the first half of the year. Underlying profit was 8 per
cent higher at £4.5 billion with underlying return after tax on tangible equity 1.5 percentage points higher at 16.6 per cent.
Income was 4 per cent higher reflecting higher net interest income and other income. Operating costs continue to fall as
delivery of the Simplification programme drives further efficiency, and the Group’s cost:income ratio fell to 45.8 per cent.
Asset quality remains strong and the asset quality ratio remained stable at 12 basis points. Statutory profit before tax
increased 4 per cent to £2.5 billion. This was after taking additional provisions for PPI and other conduct related issues
which was disappointing. The Group is also currently undertaking a review of the HBOS Reading fraud and is in the
process of paying compensation to the victims of the fraud for economic losses, ex-gratia payments and awards for
distress and inconvenience. The strong underlying performance has nevertheless enabled the Group to generate
approximately 100 basis points of CET1 capital in the period, at the top end of our guided range.
Our balance sheet remains strong, with a pre dividend CET1 ratio of 14.0 per cent (13.5 per cent post dividend), a total
capital ratio of 20.8 per cent and a leverage ratio of 4.9 per cent. Given the strong capital generation in the first half of the
year, the Board has recommended an interim ordinary dividend of 1.0 pence per share, an increase of 18 per cent.
Strategic progress
We have continued to make good progress on our strategic priorities in 2017 as we approach the final months of our plan
period.
Creating the best customer experience
As a customer focused business, we are committed to meeting our customers’ evolving needs and preferences through
our multi-brand and multi-channel approach. We operate the UK’s largest branch network and the largest digital bank
with nearly 13 million active online users. We have more than 8.5 million mobile banking users and for the third
consecutive year, the Lloyds Bank app has been rated the most feature rich mobile banking app of all the UK major
banks.
Improvements continue to be made across the business as we transform key customer journeys. In Mortgages,
customers can receive an agreement in principle in less than 15 minutes and there has been a 36 per cent increase in
customers receiving their mortgage offer in less than 14 days with some offers now in two working days. In account
opening and onboarding we have opened 300,000 branch savings accounts in less than 30 minutes with a new
streamlined process that has halved appointment times. In Commercial Banking we have delivered a 77 per cent
increase in the proportion of SME clients onboarded in less than 30 days, with approximately 50 per cent using digital
agreements. In Insurance, a core part of our strategy, we have received a number of industry and consumer awards
across our key business propositions.

LLOYDS BANKING GROUP PLC 2017 HALF-YEAR RESULTS
Page 5 of 90
Becoming simpler and more efficient
Cost management continues to be a strategic priority and we remain focused on maintaining competitive advantage
through our cost leadership. The Simplification programme is on track to deliver the target of £1.4 billion of annual
run-rate savings by the end of 2017, with £1.2 billion of run-rate savings delivered to date. The savings have been
delivered through process redesign and automation, improvements in our sourcing arrangements and through
organisational changes. These will remain areas of focus as we move into the next phase of our strategy. The Group’s
market-leading cost:income ratio improved to 45.8 per cent and we continue to expect to exit 2019 with a cost:income
ratio of around 45 per cent.
Delivering sustainable growth
We are making good progress in growing market share in areas where we are underrepresented. In Consumer Finance
we have grown our motor finance and credit card portfolios organically and the acquisition of MBNA allows us to
significantly increase our participation in the UK prime credit card market within our prudent risk appetite. In addition, we
have continued to grow SME lending ahead of the market and are committed to supporting first-time home buyers where
we are still the largest lender. Open book mortgage balances at 30 June were broadly stable compared to the end of
2016, including the reacquisition of a portfolio of mortgages from TSB, and we expect them to grow in the second half of
the year. In Insurance, we continue to invest in developing the brand and the business, including our financial planning
and retirement capabilities and have also completed five bulk annuity deals in 2017.
We remain committed to supporting the people, businesses and communities in the UK through our Helping Britain
Prosper Plan. As part of this plan, we have already provided more than £4 billion in funding support to the manufacturing
sector, ahead of our original 2014 target. We have also supported more than 63,000 start-ups and helped around
2,500 clients to start exporting this year and we are on track to exceed our 2017 targets in both areas.
We have also announced that our next strategy update for the period 2018-2020 will accompany the Group’s full year
results in February 2018, and in preparation for this we have made a number of organisational and senior management
changes. The changes are aimed at aligning and strengthening the Group’s structure to ensure we meet evolving
customer needs and deliver the continuous transformation required of the organisation in the most effective way.
The combination of the progress we have made towards our strategic priorities and our strong financial performance has
enabled the Group to be returned to full private ownership with the UK taxpayer receiving approximately £900 million
more than the £20.3 billion originally invested.
Outlook
Our differentiated UK focused business model continues to deliver with our cost leadership and lower risk positioning
providing competitive advantage, and our updated financial targets reflect our confidence in the future prospects of the
Group.
For the full year, and after including MBNA, net interest margin is now expected to be close to 2.85 per cent and the
asset quality ratio is expected to be less than 20 basis points. We continue to expect capital generation for 2017 at the
top end of the ongoing 170-200 basis points range and for the cost:income ratio to be lower than in 2016. All other longer
term guidance remains unchanged.
António Horta-Osório
Group Chief Executive

LLOYDS BANKING GROUP PLC 2017 HALF-YEAR RESULTS
Page 6 of 90
SUMMARY OF GROUP RESULTS
Strong financial performance with improvements in underlying and statutory profit
Underlying profit in the first half of 2017 was £4,492 million, 8 per cent higher than in the first half of 2016 with higher
total income and lower operating costs offset by a small increase in the impairment charge.
Statutory profit before tax in the period was 4 per cent higher at £2,544 million and included charges for PPI and other
conduct issues, of which a further £1,040 million was taken in the second quarter. Statutory profit after tax was
£1,639 million and the return on tangible equity was 8.2 per cent.
The Group’s CET1 ratio strengthened to 14.0 per cent on a pro forma basis (31 December 2016: 13.8 per cent pro
forma) pre dividends with the Group generating c.100 basis points of CET1 capital in the first half of 2017. Tangible net
assets per share at 30 June were 52.4 pence.
Total income Half-year Half-year Half-year to 30 June to 30 June to 31 Dec 2017 2016 Change 2016 Change £ million £ million % £ million % Net interest income 5,925 5,782 2 5,653 5
Other income 3,348 3,093 8 2,972 13
Total income 9,273 8,875 4 8,625 8
Operating lease depreciation1 (495) (428) (16) (467) (6)
Net income 8,778 8,447 4 8,158 8
Banking net interest margin 2.82% 2.74% 8bp 2.69% 13bp
Average interest-earning banking assets £430.9bn £436.9bn (1) £434.9bn (1) 1 Net of gains on disposal of leased assets. Further detail on net interest income is included on page 23.
Total income at £9,273 million increased by 4 per cent with growth in both net interest and other income.
Net interest income increased to £5,925 million, 2 per cent higher, reflecting an 8 basis point improvement in the net
interest margin to 2.82 per cent, partly offset by a 1 per cent reduction in average interest-earning banking assets. The
improvement in net interest margin continues to be driven by lower deposit and wholesale funding costs, which have
more than offset reduced lending rates, and includes a small uplift from the consolidation of MBNA. Average
interest-earning banking assets were 1 per cent lower at £431 billion with continued growth in Consumer Finance offset
by some further contraction in the mortgage book and reduced lending to the Global Corporates segment.
Given the acquisition of MBNA, the Group now expects growth in both average interest-earning assets and net interest
margin in the second half of the year, and expects the full year net interest margin to be close to 2.85 per cent.
The Group manages the risk to its capital and earnings from adverse movements in interest rates centrally by hedging
liabilities which are deemed to be stable or less sensitive to change in market interest rates. As at 30 June 2017, the
balance hedged was c.£143 billion (31 December 2016: £111 billion) with an average duration of c.3 years and an
earning rate of approximately 1.4 per cent over LIBOR (half-year to 30 June 2016: 1.3 per cent over LIBOR). In the first
half of 2017, the benefit from the structural hedge totalled £0.9 billion over LIBOR (half-year to 30 June 2016:
£0.8 billion).
Other income was £3,348 million, 8 per cent higher than in the first half of 2016. The improvement reflected a strong
performance by Commercial Banking which included income earned from support given to Mid Market and Global
Corporate clients with a number of significant refinancing and hedging transactions in the second quarter, further growth
in Consumer Finance in relation to the Lex Autolease business, and the gain of £146 million on the sale of the Group’s
interest in VocaLink.

LLOYDS BANKING GROUP PLC 2017 HALF-YEAR RESULTS
Page 7 of 90
Operating costs Half-year Half-year Half-year to 30 June to 30 June to 31 Dec 2017 2016 Change 2016 Change £ million £ million % £ million % Operating costs 4,018 4,041 1 4,052 1
Cost:income ratio 45.8% 47.8% (2.0)pp 49.7% (3.9)pp
Operating jaws 5%
Simplification savings annual run-rate 1,174 642 947
Operating costs of £4,018 million were 1 per cent lower reflecting the Group’s tight cost control and the benefits of the
improvements in efficiency delivered through the Simplification programme. The Group further increased its investment
in developing digital capability and improving the branch network to respond to changing customer preferences.
The Group has delivered £1.2 billion of run-rate savings to date and remains on track to deliver £1.4 billion of targeted
Simplification annual run-rate savings by the end of 2017.
The cost:income ratio improved to 45.8 per cent with positive operating jaws in the period of 5 per cent. The Group
continues to expect the cost:income ratio for 2017 to be lower than 2016 (48.7 per cent).
Impairment Half-year Half-year Half-year to 30 June to 30 June to 31 Dec 2017 2016 Change 2016 Change £ million £ million % £ million % Total impairment charge 268 245 (9) 400 33
Asset quality ratio 0.12% 0.11% 1bp 0.18% (6)bp
Gross asset quality ratio 0.23% 0.26% (3)bp 0.29% (6)bp
Impaired loans as a % of closing advances 1.8% 2.0% (0.2)pp 1.8% –
Provisions as a % of impaired loans 43.4% 43.5% (0.1)pp 43.4% –
Asset quality remains strong and the loan portfolios are well positioned, reflecting the Group’s continued prudent through
the cycle approach to credit risk appetite.
The impairment charge increased by £23 million to £268 million in the first half. Whilst new impairment charges were
lower, mainly in Commercial Banking, this was more than offset by a reduced benefit from provision releases and
write-backs. The asset quality ratio was 12 basis points (half-year to 30 June 2016: 11 basis points) with the gross asset
quality ratio (before releases and write-backs) falling 3 basis points compared with the same period in 2016 and
remaining stable compared with the first quarter in 2017.
The Group now expects the asset quality ratio for the year to be less than 20 basis points including MBNA.
Impaired loans have fallen by £0.2 billion to £8.3 billion (31 December 2016: £8.5 billion) and represent 1.8 per cent of
total lending at 30 June 2017. The reduction was mainly due to a large disposal in Commercial Banking during the first
quarter and further reductions in Run-off.
Provisions as a percentage of impaired loans were unchanged at 43.4 per cent (31 December 2016: 43.4 per cent).

LLOYDS BANKING GROUP PLC 2017 HALF-YEAR RESULTS
Page 8 of 90
Statutory profit Half-year Half-year Half-year to 30 June to 30 June to 31 Dec 2017 2016 Change 2016 Change £ million £ million % £ million % Underlying profit 4,492 4,161 8 3,706 21 Volatility and other items
Enhanced Capital Notes – (790) –
Market volatility and asset sales 136 128 311
Amortisation of purchased intangibles (38) (168) (172)
Restructuring costs (321) (307) (315)
Fair value unwind and other (135) (110) (121)
(358) (1,247) (297)
Payment protection insurance provision (1,050) – (1,000)
Other conduct provisions (540) (460) (625)
Statutory profit before tax 2,544 2,454 4 1,784 43
Taxation (905) (597) (1,127)
Profit for the period 1,639 1,857 (12) 657 149
Further information on the reconciliation of underlying to statutory results is included on page 22.
Statutory profit before tax increased 4 per cent to £2,544 million (2016: £2,454 million) driven by the increased underlying
profit, partly offset by increased conduct provisions. The charge of £790 million for Enhanced Capital Notes in the first half of 2016 represented the write-off of the embedded
derivative and premium paid on the redemption of remaining notes. Market volatility and asset sales of £136 million included positive insurance volatility of £165 million. The credit of
£128 million in 2016 included the gain on sale of Visa Europe of £484 million offset by negative insurance volatility of
£372 million. Amortisation of purchased intangibles was lower at £38 million (2016: £168 million) as certain intangible assets are now
fully amortised. Restructuring costs increased to £321 million and comprised severance costs relating to the
Simplification programme, the rationalisation of the non-branch property portfolio, the integration of MBNA and the work
on implementing the ring-fencing requirements. The Group anticipates c.£0.2 billion of further implementation costs for
the ring-fenced bank between now and the end of 2018, with a total cost of c.£0.5 billion. The £1,050 million charge for PPI includes an additional £700 million provision taken in the second quarter reflecting
current claim levels, which remain above the Group’s previous provision assumption. The additional provision will now
cover reactive claims of around 9,000 per week through to the end of August 2019. Other conduct provisions of
£540 million include an additional £340 million in the second quarter. The additional provision covers a number of items
including packaged bank accounts and arrears handling. Following a review of the Group’s arrears handling activities,
the Group has put in place a number of actions to improve further its handling of customers in these areas and the Group
is reimbursing mortgage arrears fees. The Group is also currently undertaking a review of the HBOS Reading fraud and
is in the process of paying compensation to the victims of the fraud for economic losses, ex-gratia payments and awards
for distress and inconvenience. A provision of £100 million was taken in the first quarter and reflects the estimated
compensation costs for HBOS Reading. Taxation
The tax charge was £905 million, representing an effective tax rate of 35.6 per cent. The high effective tax rate largely
reflects the restrictions on deductibility of conduct provisions and the banking surcharge. Return on tangible equity
The return on tangible equity was 8.2 per cent with improved underlying profit offset by increased PPI and other conduct
provisions. The Group continues to expect to generate a return on tangible equity of between 13.5 and 15.0 per cent in
2019.

LLOYDS BANKING GROUP PLC 2017 HALF-YEAR RESULTS
Page 9 of 90
Balance sheet At 30 June At 31 Dec Change 2017 2016 % Loans and advances to customers1 £453bn £450bn 1
Customer deposits2 £417bn £413bn 1
Loan to deposit ratio 109% 109% – Wholesale funding £102bn £111bn (8)
Wholesale funding <1 year maturity £30bn £35bn (13)
Of which money-market funding <1 year maturity3 £17bn £14bn 23
Liquidity coverage ratio – eligible assets £122bn £121bn 1
1 Excludes reverse repos of £11.4 billion (31 December 2016: £8.3 billion). 2 Excludes repos of £1.0 billion (31 December 2016: £2.5 billion). 3 Excludes balances relating to margins of £2.9 billion (31 December 2016: £3.2 billion) and settlement accounts of £1.2 billion
(31 December 2016: £1.8 billion).
Loans and advances to customers increased to £453 billion compared with £450 billion at 31 December 2016, largely
driven by the acquisition of the MBNA credit card portfolio. Lending to Consumer Finance and SME customers continued
to grow ahead of the market, increasing by 7 per cent (excluding MBNA) and 1 per cent respectively since 31 December
2016. This was more than offset by reductions in the Global Corporate segment as a result of the Group’s continued
focus on optimising capital and returns and lower closed book mortgage balances.
Open book mortgage balances at 30 June were broadly stable compared to the end of 2016 and include the
reacquisition of £1.7 billion of mortgages from TSB in the second quarter. The open mortgage book is expected to grow
in the second half of the year and close the year slightly above the 2016 closing position.
Capital ratios and risk-weighted assets At 30 June At 31 Dec Change 2017 2016 % Pro forma common equity tier 1 ratio pre 2017 dividend accrual1 14.0% 13.8% 0.2pp
Pro forma common equity tier 1 ratio1 13.5% 13.8% (0.3)pp
Transitional tier 1 capital ratio 16.6% 17.0% (0.4)pp
Transitional total capital ratio 20.8% 21.4% (0.6)pp
Pro forma leverage ratio1 4.9% 5.0% (0.1)pp
Risk-weighted assets £218bn £216bn 1 Shareholders’ equity £43bn £43bn (1)
Tangible net assets per share 52.4p 54.8p (2.4)p
1 The common equity tier 1 and leverage ratios at 30 June 2017 and 31 December 2016 are reported on a pro forma basis, separately
reflecting dividends paid by the Insurance business in July 2017 (in relation to 2017 interim earnings) and February 2017 (in relation to 2016 full year earnings).
The Group’s CET1 ratio improved to 14.0 per cent on a pro forma basis before accruing for 2017 dividends. The Group
continues to be strongly capital generative and generated c.100 basis points of capital in the period. This comprised
c.140 basis points of underlying capital generation along with c.40 basis points from a reduction in risk-weighted assets
(before MBNA) and other factors, partly offset by c.80 basis points to cover conduct provisions. In addition, the Group
utilised the CET1 capital retained at 31 December 2016 to cover the acquisition of MBNA. The Group continues to
expect capital generation in 2017 at the upper end of the 170-200 basis points ongoing guidance range.

LLOYDS BANKING GROUP PLC 2017 HALF-YEAR RESULTS
Page 10 of 90
While there remain a number of potential regulatory capital developments (including the introduction of the systemic risk
buffer in 2019), the Board’s view of the current level of CET1 capital required to grow the business, meet regulatory
requirements and cover uncertainties remains unchanged at around 13 per cent.
The amount of capital we believe is appropriate to hold is likely to vary from time to time depending on circumstances
and the Board will continue to give due consideration, subject to the situation at the time, to the distribution of any surplus
capital through the use of special dividends or share buy backs.
Risk-weighted assets increased to £218 billion as a result of the acquisition of MBNA and targeted growth in key
customer segments, partly offset through active portfolio management, disposals and other movements.
The leverage ratio reduced by 0.1 per cent on a pro forma basis to 4.9 per cent, largely reflecting the impact of the
acquisition of MBNA on both tier 1 capital and the leverage exposure measure.
Tangible net assets per share fell to 52.4 pence (31 December 2016: 54.8 pence), largely reflecting the payment of the
2016 final dividend of 2.2 pence per share during May 2017 and the 1.4 pence per share impact of the MBNA
acquisition.
Structural reform (ring-fencing) update
The Group is making good progress with the implementation of its ring-fencing programme, including the non ring-fenced
bank, Lloyds Bank Corporate Markets plc (LBCM), and remains on track to meet the legal and regulatory requirements
by 1 January 2019. LBCM will primarily comprise Commercial Banking Markets Financing (including loan markets, bonds
and asset securitisation), Commercial Banking Financial Markets Products (including elements of FX and rates), the
business undertaken by Lloyds Bank International Ltd and the Group’s branches in the United States, Singapore and
Crown Dependencies.
As a simple, UK retail and commercial bank, the impact on the Group is relatively limited and there will be minimal impact
for the majority of the Group’s retail and commercial customers. Approximately 3 per cent of the Group’s loans and
advances to customers and approximately 7 per cent of Group’s risk-weighted assets will be in the non ring-fenced bank.
A conditional banking licence with restrictions has been approved for the non ring-fenced entity and preliminary credit
ratings for LBCM have been confirmed by S&P (A-/A-2) and Fitch (A/F1).
In addition to the ring-fenced and non ring-fenced banks, the Group will continue to operate its Insurance business as a
separate entity and will have a new Equity sub-group which will broadly comprise the LDC business and strategic
investments.

LLOYDS BANKING GROUP PLC 2017 HALF-YEAR RESULTS
Page 11 of 90
UNDERLYING BASIS – SEGMENTAL ANALYSIS
Half-year to 30 June 2017 Run-off and Commercial Consumer Central Retail Banking Finance1 Insurance items Group £m £m £m £m £m £m Net interest income 3,337 1,425 1,041 (50) 172 5,925
Other income 477 1,100 755 872 144 3,348
Total income 3,814 2,525 1,796 822 316 9,273
Operating lease depreciation – (18) (449) – (28) (495)
Net income 3,814 2,507 1,347 822 288 8,778
Operating costs (2,077) (1,057) (463) (414) (7) (4,018)
Impairment (139) (13) (125) – 9 (268)
Underlying profit 1,598 1,437 759 408 290 4,492 Banking net interest margin 2.29% 3.45% 5.58% 2.82%Average interest-earning banking assets £297.3bn £84.9bn £37.9bn £10.8bn £430.9bnAsset quality ratio 0.09% 0.02% 0.67% 0.12%
Return on risk-weighted assets 5.83% 3.11% 4.36% 4.20%
Loans and advances to customers2 £295.8bn £95.9bn £45.4bn £16.1bn £453.2bnCustomer deposits3 £269.4bn £138.8bn £7.1bn £1.3bn £416.6bn
Half-year to 30 June 2016 Run off and Commercial Consumer Central Retail Banking Finance Insurance items Group £m £m £m £m £m £m Net interest income 3,296 1,306 994 (80) 266 5,782
Other income 558 982 658 921 (26) 3,093
Total income 3,854 2,288 1,652 841 240 8,875
Operating lease depreciation – (52) (368) – (8) (428)
Net income 3,854 2,236 1,284 841 232 8,447
Operating costs (2,144) (1,035) (466) (395) (1) (4,041)
Impairment (162) 35 (128) – 10 (245)
Underlying profit 1,548 1,236 690 446 241 4,161
Banking net interest margin 2.23% 3.18% 6.27% 2.74%Average interest-earning banking assets £305.0bn £88.1bn £32.9bn £10.9bn £436.9bnAsset quality ratio 0.11% (0.06)% 0.79% 0.11%
Return on risk-weighted assets 5.70% 2.42% 4.47% 3.75%
Loans and advances to customers2 £300.5bn £102.0bn £33.7bn £16.8bn £453.0bnCustomer deposits3 £271.3bn £141.4bn £9.1bn £1.5bn £423.3bn
1 Includes MBNA with effect from 1 June 2017. 2 Excludes reverse repos of £11.4 billion (30 June 2016: £nil). 3 Excludes repos of £1.0 billion (30 June 2016: £nil).

LLOYDS BANKING GROUP PLC 2017 HALF-YEAR RESULTS
Page 12 of 90
UNDERLYING BASIS – QUARTERLY INFORMATION
Quarter Quarter Quarter Quarter Quarter ended ended ended ended ended 30 June 31 Mar 31 Dec 30 Sept 30 June 2017 2017 2016 2016 2016 £m £m £m £m £m Net interest income 2,997 2,928 2,805 2,848 2,876
Other income 1,866 1,482 1,545 1,427 1,616
Total income 4,863 4,410 4,350 4,275 4,492
Operating lease depreciation (263) (232) (226) (241) (235)
Net income 4,600 4,178 4,124 4,034 4,257
Operating costs (2,050) (1,968) (2,134) (1,918) (2,054)
Impairment (141) (127) (196) (204) (96)
Underlying profit 2,409 2,083 1,794 1,912 2,107
Market volatility and asset sales 124 12 46 265 331
Amortisation of purchased intangibles (15) (23) (85) (87) (84)
Restructuring costs (164) (157) (232) (83) (146)
Fair value unwind and other items (74) (61) (75) (46) (63)
Payment protection insurance provision (700) (350) – (1,000) –
Other conduct provisions (340) (200) (475) (150) (345)
Statutory profit before tax 1,240 1,304 973 811 1,800
Banking net interest margin 2.83% 2.80% 2.68% 2.69% 2.74%
Average interest-earning banking assets £431.0bn £430.9bn £434.0bn £435.9bn £435.6bnCost:income ratio 44.6% 47.1% 51.7% 47.5% 48.2%
Asset quality ratio 0.13% 0.12% 0.17% 0.18% 0.09%

LLOYDS BANKING GROUP PLC 2017 HALF-YEAR RESULTS
Page 13 of 90
DIVISIONAL RESULTS
RETAIL
Retail offers a broad range of financial service products, including current accounts, savings and mortgages, to UK
personal customers, including Wealth and small business customers. It is also a distributor of insurance, and a range of
long-term savings and investment products. Its aim is to be the best bank for customers in the UK, by building deep and
enduring relationships that deliver value to customers, as well as providing them with greater choice and flexibility. It will
maintain its multi-brand, multi-channel strategy, continue to simplify the business and provide more transparent products,
helping to improve service levels and reduce conduct risks.
Progress against strategic initiatives
Creating the best customer experience
Announced a new approach to overdrafts that is simple, clear and puts customers in control.
Largest UK digital bank with nearly 13 million active online users including over 8.5 million mobile users.
For the third year running, Lloyds Bank’s mobile banking app has been independently ranked number one in the UK
for functionality.
Implemented click to call technology enabling customers to contact the call centre from the Group’s Mobile App
without the need for additional ID verification for the majority of transactions.
36 per cent increase in customers receiving their mortgage offer in less than 14 days, with some offers completed in
two working days.
Around 90 per cent of new branch savings accounts opened in less than 30 minutes using new digital process, with
appointment times halved.
Retail complaint volumes (excluding PPI) were down 24 per cent in the year to date versus the same period in 2016.
Becoming simpler and more efficient
Continued investment in new distribution technology; iPads introduced in more than 1,800 branches and used for
over 5 million transactions since going live.
Maintained the UK’s largest branch network with a 21 per cent market share, despite a small number of branch
closures.
Improving accessibility in rural areas by increasing the number of mobile branches to 20, with further increases
planned in the second half of the year.
Delivering sustainable growth
Continued the Group’s commitment to support first-time buyers, with more than £5 billion lent so far in 2017, on track
to meet the target of £10 billion in the year.
On track to exceed the Group’s commitment on start-up businesses with over 63,000 supported in 2017 to date.
Financial performance
Underlying profit increased 3 per cent to £1,598 million with improved net interest margin and further cost reductions
more than offsetting continued pressure on sources of other income.
Net interest income increased 1 per cent reflecting a 6 basis point improvement in net interest margin partly offset by
a reduction in interest-earning banking assets.
Other income was 15 per cent lower than the first half of 2016, driven by changing customer needs.
Operating costs decreased 3 per cent to £2,077 million, driven by further efficiency savings which have more than
covered increased investment in the business.
Impairment charge decreased 14 per cent to £139 million, benefiting from higher unsecured debt sales and a benign
credit environment. Underlying credit quality remains stable.
Loans and advances to customers fell 1 per cent to £295.8 billion. Open book mortgage balances at 30 June were
broadly stable compared to the end of 2016 after reflecting the reacquisition of £1.7 billion of mortgages from TSB in
the second quarter.
Customer deposits decreased 1 per cent to £269.4 billion, driven by the continued reduction in tactical balances.
Risk-weighted assets have remained broadly flat at £55.3 billion.

LLOYDS BANKING GROUP PLC 2017 HALF-YEAR RESULTS
Page 14 of 90
Performance summary Half-year Half-year Half-year to 30 June to 30 June to 31 Dec 2017 2016 Change 2016 Change £m £m % £m % Net interest income 3,337 3,296 1 3,201 4
Other income 477 558 (15) 495 (4)
Total income 3,814 3,854 (1) 3,696 3
Operating lease depreciation – – –
Net income 3,814 3,854 (1) 3,696 3
Operating costs (2,077) (2,144) 3 (2,030) (2)
Impairment (139) (162) 14 (211) 34
Underlying profit 1,598 1,548 3 1,455 10
Banking net interest margin 2.29% 2.23% 6bp 2.16% 13bp
Average interest-earning banking assets £297.3bn £305.0bn (3) £300.4bn (1)
Asset quality ratio 0.09% 0.11% (2)bp 0.14% (5)bp
Impaired loans as % of closing advances 1.5% 1.4% 0.1pp 1.5% –
Return on risk-weighted assets 5.83% 5.70% 13bp 5.21% 62bp
At 30 June At 31 Dec 2017 2016 Change £bn £bn % Loans and advances excluding closed portfolios 270.6 271.0 –
Closed portfolios 25.2 26.7 (6)
Loans and advances to customers 295.8 297.7 (1) Relationship balances 254.9 253.8
Tactical balances 14.5 17.2 (16)
Customer deposits 269.4 271.0 (1) Risk-weighted assets 55.3 55.2 −

LLOYDS BANKING GROUP PLC 2017 HALF-YEAR RESULTS
Page 15 of 90
COMMERCIAL BANKING
Commercial Banking has a client-led, low risk, capital efficient strategy, helping UK-based clients and international clients
with a link to the UK. Through its four client facing divisions – SME, Mid Markets, Global Corporates and Financial
Institutions – it provides clients with a range of products and services such as lending, transactional banking, working
capital management, risk management, debt capital markets services, as well as access to private equity through Lloyds
Development Capital. Progress against strategic initiatives
Commercial Banking continues to meet its strategic objective of improving returns on risk-weighted assets. In the first
half of 2017, Commercial Banking has delivered a return of 3.11 per cent significantly outperforming the commitment of
2.40 per cent for 2017. Creating the best customer experience
Awarded Business Bank of the Year at the FDs’ Excellence Awards for the 13th consecutive year.
Helping Britain prosper globally through its newly launched International Trade Portal which provides clients with
access to 110,000 importers, 30,000 suppliers, 25,000 market reports, 20,000 trade shows and live tenders.
Becoming simpler and more efficient
Continue to improve the end-to-end journey for clients by significantly improving the way SMEs open an account with
approximately 50 per cent of SME account openings in 2017 using the new digital signature tool.
Increased digital capability; clients can now simply and quickly place, review and renew their online deposits 24 hours
a day which has improved client experiences.
Delivering sustainable growth
Participated in over £3.6 billion of financing in the first half of 2017 to support UK government infrastructure projects.
On track to exceed the annual £1 billion Helping Britain Prosper funding commitment for manufacturing businesses in
each year since the commitment was made in 2014. The cumulative target of £4 billion over four years has been met
in the first half of the year, six months ahead of schedule.
Financial performance
Underlying profit increased 16 per cent to £1,437 million.
Return on risk-weighted assets increased to 3.11 per cent, up 69 basis points, demonstrating the continued progress
in delivering sustainable returns.
Income growth of 10 per cent to £2,525 million with strong growth in Mid Markets and Global Corporates.
Net interest income up 9 per cent to £1,425 million, supported by disciplined deposit pricing and expanded asset
margins due to reduced funding costs. Net interest margin improved by 27 basis points.
Other income up 12 per cent led by good franchise growth including support given to Mid Market and Global
Corporate clients with a number of significant refinancing and hedging transactions. Growth in LDC driven by
successful equity exits.
Operating lease depreciation reduced due to accelerated charges in the prior year on certain leasing assets.
Operating costs up 2 per cent due to continued investment in the business including simplifying the end-to-end
customer journey. Disciplined management of staff-related costs has supported positive operating jaws of
10 per cent.
Impairment charge of £13 million reflects effective credit risk management and the continued low interest rate
environment. Asset quality ratio remains low at 0.02 per cent.
Loans and advances fell 4 per cent to £95.9 billion mainly due to reductions in Global Corporates. Lending growth in
SME has remained at above market growth levels.
Deposits increased by 5 per cent to £138.8 billion. Strong momentum in attracting high quality transactional banking
deposits across the franchise that continues to support the balance sheet strength of the Group.
Continued active portfolio management with risk-weighted assets decreasing £5.2 billion, driven primarily by the
reduction in loans and advances.

LLOYDS BANKING GROUP PLC 2017 HALF-YEAR RESULTS
Page 16 of 90
Performance summary Half-year Half-year Half-year to 30 June to 30 June to 31 Dec 2017 2016 Change 2016 Change £m £m % £m % Net interest income 1,425 1,306 9 1,429 –
Other income 1,100 982 12 1,005 9
Total income 2,525 2,288 10 2,434 4
Operating lease depreciation (18) (52) 65 (53) 66
Net income 2,507 2,236 12 2,381 5
Operating costs (1,057) (1,035) (2) (1,098) 4
Impairment (charge) release (13) 35 (51) 75
Underlying profit 1,437 1,236 16 1,232 17 Banking net interest margin 3.45% 3.18% 27bp 3.33% 12bp
Average interest-earning banking assets £84.9bn £88.1bn (4) £89.0bn (5)
Asset quality ratio 0.02% (0.06)% 8bp 0.10% (8)bp
Impaired loans as % of closing advances 2.0% 2.3% (0.3)pp 2.2% (0.2)pp
Return on risk-weighted assets 3.11% 2.42% 69bp 2.46% 65bp
At 30 June At 31 Dec 2017 2016 Change £bn £bn % Loans and advances to customers 95.9 100.4 (4)
Customer deposits 138.8 132.6 5
Risk-weighted assets 90.8 96.0 (5)

LLOYDS BANKING GROUP PLC 2017 HALF-YEAR RESULTS
Page 17 of 90
CONSUMER FINANCE
Consumer Finance comprises the Group’s consumer lending products, including motor finance, credit cards (including
MBNA), unsecured personal loans and its European consumer business. Its aim is to deliver sustainable growth, within a
prudent risk appetite in these markets through its multi-brand, multi-channel distribution model.
Progress against strategic initiatives
The division continues to make significant progress against its strategic objectives, and in June, successfully completed
the acquisition of the MBNA credit card business from Bank of America. The acquisition consolidates the Group’s
position as Britain’s largest credit card issuer. Customer assets have grown by £11 billion since the start of the year,
primarily driven by £7.9 billion related to MBNA and continued organic growth.
Creating the best customer experience
Consumer Cards customer complaints reduced 25 per cent year-on-year, despite continued portfolio growth, as
customer concerns are addressed and fixed.
Black Horse completed the first phase of its new digital platform. This enables dealers to clearly present information
to customers and submit applications via a tablet.
Lex Autolease launched a new website for both business and personal customers, improving access from mobile
devices.
Loans introduced upfront eligibility checking for existing current account customers, and extended the Halifax offer
beyond existing customers.
Becoming simpler and more efficient
Black Horse has simplified the process for new customers through the introduction of welcome videos and the
issuance of contract information digitally.
Lex Autolease has re-platformed its IT infrastructure, improving IT resilience and doubling performance speed.
Bank of Scotland Germany has replaced its IT system with a modular digital platform that will result in an IT cost
reduction of c.30 per cent over a five year period.
Delivering sustainable growth
Consumer Finance continues to closely monitor the economic environment to maintain performance within its prudent
risk appetite.
Continue to tighten lending criteria with increased conservatism in residual risk management.
Lex Autolease has achieved its five year ambition to grow the fleet by 100,000 vehicles, cementing its position as the
UK’s leading motor vehicle leasing company.
Financial performance
Underlying profit at £759 million was up 10 per cent (6 per cent excluding MBNA), mainly driven by higher income
and lower impairments. Return on risk-weighted assets remained strong at 4.36 per cent.
Net interest income at £1,041 million was up 5 per cent from strong asset growth.
Other income was up 15 per cent at £755 million, with continued fleet growth in Lex Autolease. This increase was
partly offset by growth in associated operating lease depreciation.
Operating costs fell by 1 per cent to £463 million through continued underlying efficiency savings.
Impairment charge down 2 per cent at £125 million due to debt sales more than offsetting portfolio growth. Underlying
asset quality ratio was broadly flat at 1.30 per cent.
UK customer assets were up 30 per cent since December 2016, reflecting the acquisition of MBNA and continued
growth in Black Horse, in particular through the partnership with Jaguar Land Rover.
Customer deposits were down 10 per cent since December 2016 to £7.1 billion, in line with the Group’s deposit
strategy.

LLOYDS BANKING GROUP PLC 2017 HALF-YEAR RESULTS
Page 18 of 90
Performance summary Half-year Half-year Half-year to 30 June to 30 June to 31 Dec 20171 2016 Change 2016 Change £m £m % £m % Net interest income 1,041 994 5 947 10
Other income 755 658 15 680 11
Total income 1,796 1,652 9 1,627 10
Operating lease depreciation (449) (368) (22) (407) (10)
Net income 1,347 1,284 5 1,220 10
Operating costs (463) (466) 1 (473) 2
Impairment (125) (128) 2 (154) 19
Underlying profit 759 690 10 593 28 Banking net interest margin 5.58% 6.27% (69)bp 5.52% 6bp
Average interest-earning banking assets £37.9bn £32.9bn 15 £34.9bn 9
Asset quality ratio 0.67% 0.79% (12)bp 0.88% (21)bp
Impaired loans as % of closing advances 1.8% 2.3% (0.5)pp 2.1% (0.3)pp
Return on risk-weighted assets 4.36% 4.47% (11)bp 3.73% 63bp
1 Includes MBNA with effect from 1 June 2017 (total income £63 million; operating costs £21 million; impairment £14 million).
At 30 June At 31 Dec 2017 2016 Change £bn £bn % Loans and advances to customers 45.4 35.1 29
Operating lease assets 4.6 4.1 12
Total customer assets 50.0 39.2 28
Of which UK 42.7 32.8 30 Customer deposits 7.1 7.9 (10) Risk-weighted assets 40.0 32.1 25

LLOYDS BANKING GROUP PLC 2017 HALF-YEAR RESULTS
Page 19 of 90
INSURANCE
The Insurance division is committed to providing a range of trusted, value for money protection, general insurance,
pension and investment products to meet the needs of its customers. Scottish Widows, with customer funds under
management of £124 billion, together with the general insurance business help around 9 million customers to protect
what they value most and to plan financially for the future. Progress against strategic initiatives
The Group continues to invest in developing the Insurance business and seeks to grow in areas where it has competitive
advantage and is underrepresented, for the benefit of both customers and shareholders. Creating the best customer experience
Awarded ‘Pension Firm of the Year’ (FDs’ Excellence Awards), ‘Pensions Provider of the Year’ (Pensions Age
Awards) and ‘Risk Reduction Provider of the Year’ (UK Pensions Awards).
Helped almost 10,000 protection customers at the most difficult and challenging times of their lives. An improved
customer claim journey means that the percentage of new protection claims paid is one of the highest in the industry. Becoming simpler and more efficient
More than 40 per cent of corporate pension schemes are now using the digital service for employers, which has
significantly reduced processing times.
Launched a digital service for employees with workplace pensions enabling individuals to view their pension value
and contribution history, update personal details and access educational material on pension basics. Delivering sustainable growth
Collaborated with Commercial Banking to source lower risk, long-maturity assets to match growing annuitant
liabilities, providing finance to support two major UK infrastructure projects.
Annualised payments to annuity customers in retirement have reached £1 billion, reflecting robust growth in this
business.
Sums assured under Scottish Widows Protect have almost doubled to £4.7 billion since the end of 2016.
Continuing the progress made in 2016, five further bulk annuity transactions were successfully completed in the first
half of 2017.
Corporate pension, planning and retirement funds under management increased by 8 per cent to £38 billion reflecting
net inflows and positive market movements.
Longstanding life, pensions and investment (LP&I) funds under management remains stable. Financial performance
Underlying profit decreased by 9 per cent to £408 million as a result of lower bulk annuity transactions and increased
investment costs in the first half of 2017. Compared to the second half of 2016, underlying profit grew by 4 per cent.
Life and pensions sales increased by 4 per cent reflecting growth in corporate pensions, planning and retirement and
protection. Excluding bulk annuity deals, sales increased by 25 per cent.
General insurance underwritten new business household premiums have increased by 3 per cent, driven by the new
flexible online offering launched in 2016. However, total underwritten premiums have decreased by 13 per cent,
reflecting the continued competitiveness of the household market and the run off of legacy products.
Costs increased to £414 million reflecting higher investment expenditure with business as usual costs remaining
broadly flat. Capital
Paid an interim dividend of £75 million to the Group in July 2017, bringing total dividends paid since the formation of
the Group in 2009, to £7.2 billion.
The estimated post interim dividend Solvency II ratio of 152 per cent (31 December 2016 post dividend position:
147 per cent) represents the shareholder view of Solvency II surplus. The increase in the ratio primarily reflects
in year earnings and favourable market volatility, partly offset by capital invested in new business.

LLOYDS BANKING GROUP PLC 2017 HALF-YEAR RESULTS
Page 20 of 90
Performance summary Half-year Half-year Half-year to 30 June to 30 June to 31 Dec 2017 2016 Change 2016 Change £m £m % £m % Net interest income (50) (80) 38 (66) 24
Other income 872 921 (5) 834 5
Total income 822 841 (2) 768 7
Operating costs (414) (395) (5) (377) (10)
Underlying profit 408 446 (9) 391 4
Life and pensions sales (PVNBP)1 4,984 4,791 4 4,128 21
New business income 153 222 (31) 159 (4)
General insurance underwritten new GWP2 38 37 3 38 –
General insurance underwritten total GWP2 370 424 (13) 409 (10)
General insurance combined ratio 88% 89% (1)pp 85% 3pp
Solvency II ratio3 152% 144% 8pp 147% 5pp
1 Present value of new business premiums. 2 Gross written premiums. 3 On a post dividend shareholder basis. The equivalent regulatory view of the ratio (including With Profits funds) is 147 per cent at 30 June
2017 (31 December 2016: 143 per cent).
Income by product group Half-year to 30 June 2017 Half-year to 30 June 2016 New Existing New Existing Half-year business business Total business business Total to 31 Dec income income income income income income 2016 £m £m £m £m £m £m £m Corporate pensions 50 48 98 69 52 121 106
Bulk annuities 40 13 53 84 6 90 47
Planning and retirement 46 45 91 58 47 105 99
Protection 10 10 20 8 9 17 19
Longstanding LP&I 7 220 227 3 223 226 223
153 336 489 222 337 559 494
Life and pensions experience and other items 191 124 99General insurance 157 168 186
NII and free asset return (15) (10) (11)
Total income 822 841 768
Presentation of 2016 income by product group restated to be aligned with 2017 proposition groupings.
New business income has decreased by £69 million to £153 million, driven by the timing of bulk annuity transactions and
lower income from corporate pensions and planning and retirement. Existing business income is broadly flat. Compared
to the second half of 2016, new business income is stable.
Experience and other items contributed a net benefit of £191 million (2016: £124 million). This included £170 million from
the addition of a new death benefit to certain legacy pension contracts, aligning terms with other similar products. An
equivalent benefit of £184 million in the first half of 2016 was partly offset by the impact of reforms on activity within the
corporate pensions market.
General insurance income net of claims has decreased by £11 million reflecting the continued competitiveness of the
Home market and the run off of legacy products.

LLOYDS BANKING GROUP PLC 2017 HALF-YEAR RESULTS
Page 21 of 90
RUN-OFF AND CENTRAL ITEMS
RUN-OFF Half-year Half-year Half-year to 30 June to 30 June to 31 Dec 2017 2016 Change 2016 Change £m £m % £m %
Net interest income (48) (59) 19 (51) 6
Other income 45 78 (42) 42 7
Total income (3) 19 (9) 67
Operating lease depreciation (28) (8) (7)
Net income (31) 11 (16) (94)
Operating costs (23) (38) 39 (39) 41
Impairment release 14 10 40 16 (13)
Underlying loss (40) (17) (39) (3)
At 30 June At 31 Dec 2017 2016 Change £bn £bn % Loans and advances to customers 9.1 9.6 (5)
Total assets 10.7 11.3 (5)
Risk-weighted assets 8.1 8.5 (5)
The underlying loss increased to £40 million largely as a result of additional depreciation charges on certain leasing
assets.
Total run-off assets have reduced by a further 5 per cent since 31 December 2016.
CENTRAL ITEMS
Half-year Half-year Half-year to 30 June to 30 June to 31 Dec 2017 2016 2016 £m £m £m Total income 319 221 109
Costs 16 37 (35)
Impairment charge (5) – –
Underlying profit 330 258 74
Central items includes income and expenditure not attributed to divisions, including the costs of certain central and
head office functions.
Total income included the gain on sale of the Group’s interest in VocaLink of £146 million together with gains on
sales of liquid assets and other items.

LLOYDS BANKING GROUP PLC 2017 HALF-YEAR RESULTS
Page 22 of 90
ADDITIONAL INFORMATION
1. Reconciliation between statutory and underlying basis results
The tables below set out the reconciliation from the statutory results to the underlying basis results, the principles of
which are set out on the inside front cover.
Removal of: Lloyds Banking Volatility Other Group and other Insurance conduct Underlying statutory items1,4 gross up2 PPI provisions basisHalf-year to 30 June 2017 £m £m £m £m £m £m
Net interest income 5,202 115 608 – – 5,925
Other income, net of insurance claims 4,097 (89) (660) – – 3,348
Total income 9,299 26 (52) – – 9,273
Operating lease depreciation (495) – – – (495)
Net income 9,299 (469) (52) – – 8,778
Operating expenses3 (6,552) 892 52 1,050 540 (4,018)
Impairment (203) (65) – – – (268)
Profit before tax 2,544 358 – 1,050 540 4,492
Half-year to 30 June 2016 Net interest income 5,225 134 423 – – 5,782
Other income, net of insurance claims 3,095 502 (519) – 15 3,093
Total income 8,320 636 (96) – 15 8,875
Operating lease depreciation (428) – – – (428)
Net income 8,320 208 (96) – 15 8,447
Operating expenses3 (5,504) 922 96 – 445 (4,041)
Impairment (362) 117 – – – (245)
Profit before tax 2,454 1,247 – – 460 4,161
1 Half-year to 30 June 2017 comprises the effects of asset sales (gains of £6 million); volatile items (gains of £145 million); liability management (losses of £15 million); the amortisation of purchased intangibles (£38 million); restructuring costs (£321 million, comprising severance costs relating to the Simplification programme, the rationalisation of the non-branch property portfolio, the work on implementing the ring-fencing requirements and the integration of MBNA); and the fair value unwind and other items (losses of £135 million).
2 The Group’s insurance businesses’ income statements include income and expenditure which are attributable to the policyholders of the Group’s long-term assurance funds. These items have no impact in total upon the profit attributable to equity shareholders and, in order to provide a clearer representation of the underlying trends within the business, these items are shown net within the underlying results.
3 The statutory basis figure is the aggregate of operating costs and operating lease depreciation. 4 Half-year to 30 June 2016 comprises the write-off of the ECN embedded derivative and premium paid on redemption of the remaining
notes (losses of £790 million); the effects of asset sales (gains of £335 million); volatile items (losses of £353 million); liabilitymanagement (gains of £146 million); the amortisation of purchased intangibles (£168 million); restructuring costs (£307 million,principally comprising the severance related costs under phase II of the Simplification programme); and the fair value unwind (lossesof £110 million).

LLOYDS BANKING GROUP PLC 2017 HALF-YEAR RESULTS
Page 23 of 90
2. Banking net interest margin
The net interest margin is calculated by dividing underlying banking net interest income by average interest-earning
banking assets.
Non-banking net interest income largely comprises subordinated debt costs incurred by the Insurance business.
Non-banking assets largely comprise fee based loans and advances within Commercial Banking and loans sold by
Commercial Banking and Retail to Insurance to back annuitant liabilities.
The table below shows the reconciliation between statutory net interest income and underlying banking net interest.
Half-year Half-year Half-year to 30 June to 30 June to 31 Dec 2017 2016 2016 £m £m £m Group net interest income – statutory basis 5,202 5,225 4,049
Insurance gross up 608 423 1,475
Volatility and other items 115 134 129
Group net interest income – underlying basis 5,925 5,782 5,653
Non-banking net interest expense 96 173 218
Banking net interest income – underlying basis 6,021 5,955 5,871 Average interest-earning banking assets £430.9bn £436.9bn £434.9bn Banking net interest margin 2.82% 2.74% 2.69%
The table below shows a reconciliation between net loans and advances to customers and average interest-earning
banking assets.
Quarter Quarter Quarter Quarter Quarter ended ended ended ended ended 30 Jun 31 Mar 31 Dec 30 Sept 30 Jun 2017 2017 2016 2016 2016 £bn £bn £bn £bn £bn Net loans and advances to customers 453.2 444.7 449.7 451.7 453.0
Impairment provision and fair value adjustments 3.3 3.6 3.7 3.8 4.1Non-banking items:
Fee based loans and advances (7.4) (8.5) (9.4) (8.7) (9.1)
Sale of assets to Insurance (6.8) (6.6) (6.7) (6.2) (6.1)
Other non-banking (4.2) (3.4) (5.0) (5.5) (4.9)
Gross banking loans and advances 438.1 429.8 432.3 435.1 437.0
Averaging (7.1) 1.1 1.7 0.8 (1.4)
Average interest-earning banking assets (qtr) 431.0 430.9 434.0 435.9 435.6
Average interest-earning banking assets (year to date) 430.9 430.9 435.9 436.6 436.9

LLOYDS BANKING GROUP PLC 2017 HALF-YEAR RESULTS
Page 24 of 90
3. Volatility arising in insurance businesses
Volatility included in the Group’s statutory results before tax comprises the following:
Half-year Half-year Half-year to 30 June to 30 June to 31 Dec 2017 2016 2016 £m £m £m
Insurance volatility 74 (328) 176
Policyholder interests volatility 110 (10) 251
Total volatility 184 (338) 427
Insurance hedging arrangements (19) (34) (146)
Total 165 (372) 281
The Group’s insurance business has policyholder liabilities that are supported by substantial holdings of investments.
IFRS requires that the changes in both the value of the liabilities and investments are reflected within the income
statement. The value of the liabilities does not move exactly in line with changes in the value of the investments. As the
investments are substantial, movements in their value can have a significant impact on the profitability of the Group.
Management believes that it is appropriate to disclose the division’s results on the basis of an expected return in addition
to results based on the actual return. The impact of the actual return on these investments differing from the expected
return is included within insurance volatility.
4. Number of employees (full-time equivalent)
At 30 June At 31 Dec 2017 2016 Retail 29,109 29,926
Commercial Banking 5,567 5,755
Consumer Finance1 5,524 3,425
Insurance 1,870 1,939
Group operations and other 30,824 30,843
72,894 71,888
Agency staff, interns and scholars (2,639) (1,455)
Total number of employees 70,255 70,433
1 Includes MBNA at 30 June 2017.

LLOYDS BANKING GROUP PLC 2017 HALF-YEAR RESULTS
Page 25 of 90
5. Tangible net assets per share
The table below sets out a reconciliation of the Group’s shareholders’ equity to its tangible net assets.
At 30 June At 31 Dec 2017 2016 £m £m Shareholders’ equity 42,513 43,020
Goodwill (2,299) (2,016)
Intangible assets (2,536) (1,681)
Purchased value of in-force business (323) (340)
Other, including deferred tax effects 283 170
Tangible net assets 37,638 39,153 Ordinary shares in issue, excluding Own shares 71,871m 71,413m
Tangible net assets per share 52.4p 54.8p
6. Return on tangible equity
The Group’s return on tangible equity is calculated as follows:
Half-year Half-year Half-year to 30 June to 30 June to 31 Dec 2017 2016 2016 £bn £bn £bnUnderlying return on tangible equity Average shareholders’ equity 43.3 42.6 43.1
Average intangible assets (4.2) (4.0) (3.9)
Average tangible equity 39.1 38.6 39.2
Underlying profit after tax (£m) 3,301 3,032 2,700
Add back amortisation of intangible assets (post tax) (£m) 108 86 89
Less profit attributable to other equity holders (£m) (158) (163) (158)
Less profit attributable to non-controlling interests (£m) (41) (63) (38)
Adjusted underlying profit after tax (£m) 3,210 2,892 2,593
Underlying return on tangible equity 16.6% 15.1% 13.2% Statutory return on tangible equity
Group statutory profit after tax (£m) 1,639 1,857 657
Add back amortisation of intangible assets (post tax) (£m) 108 86 89
Add back amortisation of purchased intangible assets (post tax) (£m) 45 148 151Less profit attributable to other equity holders (£m) (158) (163) (158)
Less profit attributable to non-controlling interests (£m) (41) (63) (38)
Adjusted statutory profit after tax (£m) 1,593 1,865 701
Statutory return on tangible equity 8.2% 9.7% 3.6%

LLOYDS BANKING GROUP PLC 2017 HALF-YEAR RESULTS
Page 26 of 90
RISK MANAGEMENT
PRINCIPAL RISKS AND UNCERTAINTIES The significant risks faced by the Group which could impact the success of delivering against the Group’s long-term
strategic objectives and through which global macro-economic conditions, ongoing political uncertainty, regulatory
developments and market liquidity dynamics could manifest, are detailed below. Except where noted, there has been no
significant change to the description of these risks or key mitigating actions disclosed in the Group’s 2016 Annual Report
and Accounts, with any quantitative disclosures updated herein. The Group has already considered many of the potential implications following the UK’s vote to leave the European
Union and continues to manage related developments to assess, and if possible mitigate any impact to its customers,
colleagues and products − as well as all legal, regulatory, tax, finance and capital implications. Credit risk – The risk that customers and/or other counterparties whom the Group has either lent money to or entered
into a financial contract with, or other counterparties with whom the Group has contracted, fail to meet their financial
obligations, resulting in loss to the Group. Adverse changes in the economic and market environment the Group
operates in or the credit quality and/or behaviour of the Group’s customers and counterparties could reduce the value of
the Group’s assets and potentially increase the Group’s write downs and allowances for impairment losses, adversely
impacting profitability. Conduct risk – Conduct risk can arise from the failure to design products and services to ensure they are aligned to
customer needs and to design and execute sales processes to ensure products and services are offered only to those
customers who need and will benefit from them. Additionally, the failure to provide ongoing support and service to
customers and to recognise and respond to customer complaints, providing appropriate rectification in a timely manner.
Conduct risk can result from the failure to ensure that colleagues behave in line with conduct, regulatory and ethical
standards. Additionally, market conduct risks exist where actions taken can disrupt the fair and effective operation of a
market in which the Group is active. Market risk – The risk that the Group’s capital or earnings profile is affected by adverse market rates, in particular
interest rates and credit spreads in the Banking business, equity and credit spreads in the Insurance business, and credit
spreads in the Group’s Defined Benefit Pension Schemes. Operational risk – The Group faces significant operational risks, such as risk of cyber and terrorism, which may result in
financial loss, disruption of services to customers, and damage to its reputation. These include the availability, resilience
and security of the Group’s core IT systems and the potential for failings in the Group’s customer processes. Capital risk – The risk that the Group has a sub-optimal quantity or quality of capital or that capital is inefficiently
deployed across the Group. Funding and liquidity risk – The risk that the Group has insufficient financial resources to meet its commitments as
they fall due, or can only secure them at excessive cost. Regulatory and legal risk – The risks of changing legislation, regulation (including regulatory changes such as the
Second Payment Services Directive and Open Banking), policies, voluntary codes of practice and their interpretation in
the markets in which the Group operates can have a significant impact on the Group’s operations, business prospects,
structure, costs and/or capital requirements and ability to enforce contractual obligations. Governance risk – Against a background of increased regulatory focus on governance and risk management, the most
significant challenges arise from the requirement to improve the resolvability of the Group and to ring-fence core UK
financial services and activities from January 2019, and from the further development of the Senior Managers and
Certification Regime. People risk – Key people risks include the risk that the Group fails to maintain organisational skills, capability, resilience
and capacity levels in response to increasing volumes of organisational, political and external market change. Insurance risk – Key insurance risks within the Insurance business are longevity, persistency and property insurance.
Longevity risk is expected to increase as the Group’s presence in the bulk annuity market increases. Longevity is also
the key insurance risk in the Group’s Defined Benefit Pension Schemes.

LLOYDS BANKING GROUP PLC 2017 HALF-YEAR RESULTS
Page 27 of 90
CREDIT RISK PORTFOLIO
Overview
Asset quality remains strong with portfolios continuing to benefit from the Group’s proactive approach to risk
management, continued low interest rates, and a resilient UK economic environment.
Impaired loans as a percentage of closing loans and advances remained stable at 1.8 per cent, with impaired loans
reducing by £202 million to £8,293 million during the period, mainly due to a large disposal in Commercial Banking
during the first quarter and further reductions in Run-off.
The impairment charge increased by £23 million to £268 million in the first half. The increase was driven by lower
provision releases and write-backs which more than offset a reduction in gross impairment charges mainly in
Commercial Banking.
The asset quality ratio was 12 basis points (half-year to 30 June 2016: 11 basis points) with the gross asset quality
ratio (before releases and write-backs) falling 3 basis points compared with the same period in 2016 and remaining
stable compared with the first quarter of 2017.
The Group now expects the asset quality ratio for the year to be less than 20 basis points, including MBNA.
Low risk culture and prudent risk appetite
The Group continues to operate a prudent approach to credit risk, with the portfolios benefiting from the focus on
credit quality at origination and a prudent through the cycle approach to credit risk appetite. The Group’s portfolios
are well positioned against current economic concerns and market volatility.
The Group’s credit processes and controls ensure effective risk management, including early identification and
management of customers and counterparties who may be showing signs of distress.
The Group has delivered lending growth in key segments without relaxing credit criteria.
Sector concentrations within the lending portfolios are closely monitored and controlled, with mitigating actions taken
where appropriate. Sector and product caps limit exposure to certain higher risk and vulnerable sectors and asset
classes:
The average indexed LTV of the Retail UK Secured portfolio at 30 June 2017 was 43.0 per cent (31 December
2016: 44.0 per cent). The percentage of closing loans and advances with an indexed LTV greater than 100 per
cent was 0.7 per cent (31 December 2016: 0.7 per cent).
Robust indebtedness and affordability controls continue to ensure new unsecured lending is sustainable for
customers.
Total UK Direct Real Estate gross lending across the Group was £19.4 billion at 30 June 2017 (31 December
2016: £19.9 billion) and includes Core Commercial Banking lending of £18.1 billion, £0.5 billion booked in the
Islands Commercial business and £0.2 billion within Retail Business Banking (within Retail Division).
Run-off net external assets stood at £10,676 million at 30 June 2017, down from £11,336 million at 31 December
2016. The portfolio represents only 2.0 per cent of the overall Group’s loans and advances (31 December 2016:
2.1 per cent).

LLOYDS BANKING GROUP PLC 2017 HALF-YEAR RESULTS
Page 28 of 90
Impairment charge by division Half-year Half-year Half-year to 30 June to 30 June to 31 Dec 2017 2016 Change 2016 £m £m % £m Retail:
Secured 34 32 (6) 72
Overdrafts 94 120 22 121
Other 11 10 (10) 18
139 162 14 211
Commercial Banking:
SME 1 (5) (2)
Other 12 (30) 53
13 (35) 51
Consumer Finance:
Credit Cards 49 59 17 77
Loans 30 42 29 28
UK Motor Finance 45 28 (61) 47
Europe 1 (1) 2
125 128 2 154
Run-off:
Ireland retail 4 – (1)
Corporate real estate and other corporate (7) 9 (8)
Specialist finance (7) (13) (46) 11
Other (4) (6) (33) (18)
(14) (10) 40 (16)
Central items 5 – –
Total impairment charge 268 245 (9) 400 Asset quality ratio 0.12% 0.11% 1bp 0.18%
Gross asset quality ratio 0.23% 0.26% (3)bp 0.29%
Total impairment charge comprises:
Half-year Half-year Half-year to 30 June to 30 June to 31 Dec 2017 2016 Change 2016 £m £m % £m Loans and advances to customers 265 257 (3) 400
Debt securities classified as loans and receivables (4) – –
Available-for-sale financial assets 6 – –
Other credit risk provisions 1 (12) –
Total impairment charge 268 245 (9) 400

LLOYDS BANKING GROUP PLC 2017 HALF-YEAR RESULTS
Page 29 of 90
Group impaired loans and provisions Impairment Impaired provisions Loans and loans as % as % of advances to Impaired of closing Impairment impaired customers loans advances provisions1 loans2
At 30 June 2017 £m £m % £m % Retail:
Secured 292,602 4,175 1.4 1,514 36.3
Overdrafts 1,964 168 8.6 84 80.8
Other 3,002 69 2.3 36 66.7
297,568 4,412 1.5 1,634 37.7
Commercial Banking:
SME 30,387 898 3.0 160 17.8
Other 66,263 1,014 1.5 581 57.3
96,650 1,912 2.0 741 38.8
Consumer Finance:
Credit Cards 17,634 413 2.3 263 82.7
Loans 7,967 259 3.3 109 86.5
UK Motor Finance3 12,786 126 1.0 139 110.3
Europe4 7,198 43 0.6 23 53.5
45,585 841 1.8 534 87.1
Run-off:
Ireland retail 4,472 138 3.1 127 92.0
Corporate real estate and other corporate 1,151 885 76.9 364 41.1 Specialist finance 2,958 24 0.8 37 154.2
Other 1,092 81 7.4 29 35.8
9,673 1,128 11.7 557 49.4
Reverse repos and other items5 18,424
Total gross lending 467,900 8,293 1.8 3,466 43.4
Impairment provisions (3,466)
Fair value adjustments6 170
Total Group 464,604
1 Impairment provisions include collective unidentified impairment provisions. 2 Impairment provisions as a percentage of impaired loans are calculated excluding Retail and Consumer Finance loans in recoveries
(£64 million in Retail Overdrafts, £15 million in Retail Other, £95 million in Consumer Finance Credit Cards and £133 million in Consumer Finance Loans).
3 UK Motor Finance comprises the UK motor finance portfolios, principally Black Horse and Lex Autolease. 4 Europe comprises Netherlands mortgages and German Consumer Finance products. 5 Includes £6.8 billion of lower risk loans sold by Commercial Banking and Retail to Insurance to back annuitant liabilities. 6 The Group made adjustments to reflect the HBOS and MBNA loans and advances at fair value on acquisition. At 30 June 2017, the
remaining fair value adjustment was £170 million comprising a positive adjustment of £300 million in respect of the MBNA assets and a negative adjustment of £130 million in respect of the HBOS assets. The fair value unwind in respect of impairment losses for the six months ended 30 June 2017 was £42 million (30 June 2016: £27 million). The fair value unwind in respect of loans and advances will reduce to zero over time.

LLOYDS BANKING GROUP PLC 2017 HALF-YEAR RESULTS
Page 30 of 90
Impairment Impaired provisions Loans and loans as % as % of advances to Impaired of closing Impairment impaired customers loans advances provisions1 loans2
At 31 December 2016 £m £m % £m %
Retail:
Secured 294,503 4,104 1.4 1,503 36.6
Overdrafts 1,952 179 9.2 90 82.6
Other 3,038 71 2.3 37 67.3
299,493 4,354 1.5 1,630 38.2
Commercial Banking:
SME 29,959 923 3.1 173 18.7
Other 71,217 1,256 1.8 651 51.8
101,176 2,179 2.2 824 37.8
Consumer Finance:
Credit Cards 9,843 307 3.1 157 81.8
Loans 7,767 277 3.6 92 81.4
UK Motor Finance 11,555 120 1.0 127 105.8
Europe 6,329 41 0.6 20 48.8
35,494 745 2.1 396 85.0
Run-off:
Ireland retail 4,497 138 3.1 133 96.4
Corporate real estate and other corporate 1,190 896 75.3 399 44.5 Specialist finance 3,374 99 2.9 111 112.1
Other 1,198 84 7.0 39 46.4
10,259 1,217 11.9 682 56.0
Reverse repos and other items3 15,249
Total gross lending 461,671 8,495 1.8 3,532 43.4
Impairment provisions (3,532)
Fair value adjustments (181)
Total Group 457,958
1 Impairment provisions include collective unidentified impairment provisions. 2 Impairment provisions as a percentage of impaired loans are calculated excluding Retail and Consumer Finance loans in recoveries
(£70 million in Retail Overdrafts, £16 million in Retail Other, £115 million in Consumer Finance Credit Cards and £164 million in Consumer Finance Loans).
3 Includes £6.7 billion of lower risk loans sold by Commercial Banking and Retail to Insurance to back annuitant liabilities.
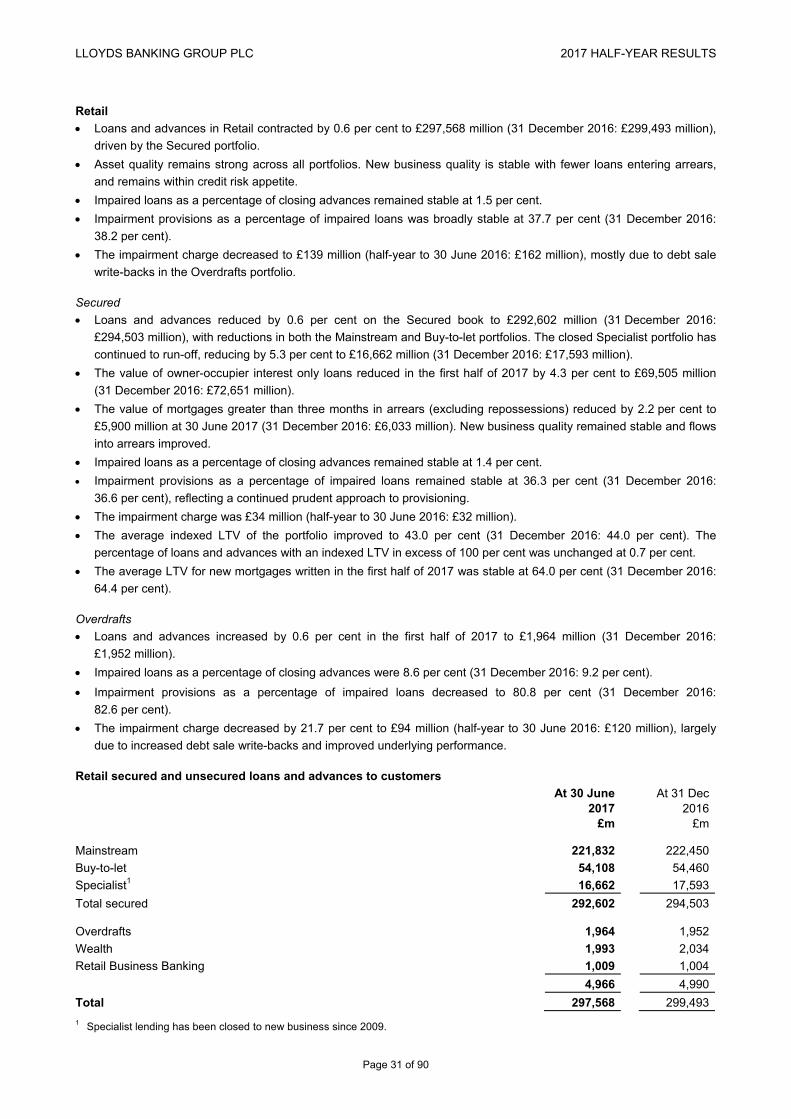
LLOYDS BANKING GROUP PLC 2017 HALF-YEAR RESULTS
Page 31 of 90
Retail
Loans and advances in Retail contracted by 0.6 per cent to £297,568 million (31 December 2016: £299,493 million),
driven by the Secured portfolio.
Asset quality remains strong across all portfolios. New business quality is stable with fewer loans entering arrears,
and remains within credit risk appetite.
Impaired loans as a percentage of closing advances remained stable at 1.5 per cent.
Impairment provisions as a percentage of impaired loans was broadly stable at 37.7 per cent (31 December 2016:
38.2 per cent).
The impairment charge decreased to £139 million (half-year to 30 June 2016: £162 million), mostly due to debt sale
write-backs in the Overdrafts portfolio. Secured
Loans and advances reduced by 0.6 per cent on the Secured book to £292,602 million (31 December 2016:
£294,503 million), with reductions in both the Mainstream and Buy-to-let portfolios. The closed Specialist portfolio has
continued to run-off, reducing by 5.3 per cent to £16,662 million (31 December 2016: £17,593 million).
The value of owner-occupier interest only loans reduced in the first half of 2017 by 4.3 per cent to £69,505 million
(31 December 2016: £72,651 million).
The value of mortgages greater than three months in arrears (excluding repossessions) reduced by 2.2 per cent to
£5,900 million at 30 June 2017 (31 December 2016: £6,033 million). New business quality remained stable and flows
into arrears improved.
Impaired loans as a percentage of closing advances remained stable at 1.4 per cent.
Impairment provisions as a percentage of impaired loans remained stable at 36.3 per cent (31 December 2016:
36.6 per cent), reflecting a continued prudent approach to provisioning.
The impairment charge was £34 million (half-year to 30 June 2016: £32 million).
The average indexed LTV of the portfolio improved to 43.0 per cent (31 December 2016: 44.0 per cent). The
percentage of loans and advances with an indexed LTV in excess of 100 per cent was unchanged at 0.7 per cent.
The average LTV for new mortgages written in the first half of 2017 was stable at 64.0 per cent (31 December 2016:
64.4 per cent). Overdrafts
Loans and advances increased by 0.6 per cent in the first half of 2017 to £1,964 million (31 December 2016:
£1,952 million).
Impaired loans as a percentage of closing advances were 8.6 per cent (31 December 2016: 9.2 per cent).
Impairment provisions as a percentage of impaired loans decreased to 80.8 per cent (31 December 2016:
82.6 per cent).
The impairment charge decreased by 21.7 per cent to £94 million (half-year to 30 June 2016: £120 million), largely
due to increased debt sale write-backs and improved underlying performance. Retail secured and unsecured loans and advances to customers
At 30 June At 31 Dec 2017 2016 £m £m Mainstream 221,832 222,450
Buy-to-let 54,108 54,460
Specialist1 16,662 17,593
Total secured 292,602 294,503 Overdrafts 1,964 1,952
Wealth 1,993 2,034
Retail Business Banking 1,009 1,004
4,966 4,990
Total 297,568 299,493
1 Specialist lending has been closed to new business since 2009.

LLOYDS BANKING GROUP PLC 2017 HALF-YEAR RESULTS
Page 32 of 90
Retail mortgages greater than three months in arrears (excluding repossessions)
Number of cases Total mortgage
accounts % Value of loans1 Total mortgage
balances % June Dec June Dec June Dec June Dec 2017 2016 2017 2016 2017 2016 2017 2016 Cases Cases % % £m £m % % Mainstream 34,919 35,254 1.7 1.7 3,809 3,865 1.7 1.7
Buy-to-let 5,106 5,324 1.1 1.1 633 660 1.2 1.2
Specialist 8,869 9,078 7.4 7.2 1,458 1,508 8.8 8.6
Total 48,894 49,656 1.8 1.8 5,900 6,033 2.0 2.0
1 Value of loans represents total gross book value of mortgages more than three months in arrears.
The stock of repossessions decreased to 595 cases at 30 June 2017 compared to 678 cases at 31 December 2016.
Period end and average LTVs across the Retail mortgage portfolios Mainstream Buy-to-let Specialist Total Unimpaired Impaired % % % % % % At 30 June 2017 Less than 60% 58.8 56.2 57.7 58.3 58.5 42.460% to 70% 17.0 24.0 17.4 18.3 18.3 17.870% to 80% 13.6 13.1 12.3 13.4 13.4 14.180% to 90% 8.1 4.5 6.9 7.4 7.4 10.490% to 100% 2.0 1.6 2.5 1.9 1.9 6.0Greater than 100% 0.5 0.6 3.2 0.7 0.5 9.3
Total 100.0 100.0 100.0 100.0 100.0 100.0
Outstanding loan value (£m) 221,832 54,108 16,662 292,602 288,427 4,175Average loan to value:1 Stock of residential mortgages 40.9 52.4 47.5 43.0 New residential lending 64.7 60.6 n/a 64.0 Impaired mortgages 50.7 69.2 61.4 54.9
Mainstream Buy-to-let Specialist Total Unimpaired Impaired % % % % % % At 31 December 2016 Less than 60% 56.8 52.0 53.8 55.8 56.0 38.3
60% to 70% 17.8 25.4 17.8 19.2 19.3 18.4
70% to 80% 14.0 14.4 13.6 14.0 14.0 15.3
80% to 90% 8.4 6.1 8.6 8.0 7.9 11.9
90% to 100% 2.4 1.5 3.1 2.3 2.2 6.8
Greater than 100% 0.6 0.6 3.1 0.7 0.6 9.3
Total 100.0 100.0 100.0 100.0 100.0 100.0
Outstanding loan value (£m) 222,450 54,460 17,593 294,503 290,399 4,104
Average loan to value:1
Stock of residential mortgages 41.8 53.7 49.2 44.0
New residential lending 65.0 61.9 n/a 64.4
Impaired mortgages 51.8 69.0 61.9 55.8
1 Average loan to value is calculated as total gross loans and advances as a percentage of the indexed total collateral of these loans and advances.

LLOYDS BANKING GROUP PLC 2017 HALF-YEAR RESULTS
Page 33 of 90
Commercial Banking
There was a net impairment charge of £13 million compared to a net release of £35 million in the first half of 2016,
primarily driven by a lower level of write-backs and provision releases, which more than offset a reduction in gross
charges. The portfolio continues to benefit from effective risk management, a relatively benign economic environment
and continued low interest rates.
Credit quality of the portfolio and new business remains good.
Impaired loans reduced by 12.3 per cent to £1,912 million compared with £2,179 million at 31 December 2016 and as
a percentage of loans and advances reduced to 2.0 per cent from 2.2 per cent at 31 December 2016.
Impairment provisions reduced to £741 million (31 December 2016: £824 million) and included collective unidentified
impairment provisions of £179 million (31 December 2016: £183 million). Provisions as a percentage of impaired
loans increased from 37.8 per cent to 38.8 per cent during the first half of 2017.
The UK faces a number of significant headwinds including the changing UK and global economic outlook and
uncertainty relating to EU exit negotiations which have the ability to impact the Commercial Banking portfolios.
Commercial Banking remains disciplined within its low risk appetite approach and credit risks continue to be
effectively managed. It manages and limits exposure to certain sectors and asset classes, and closely monitors credit
quality, sector and single name concentrations.
Internal and external key performance indicators continue to be monitored closely to help identify early signs of any
deterioration and portfolios remain subject to ongoing risk mitigation actions as appropriate.
Despite the uncertain economic headwinds, the portfolios are well positioned and the Group’s through the cycle risk
appetite approach is expected to remain unchanged. However, portfolios will not be immune and impairments are
likely to increase from their historic low levels, driven predominantly by lower levels of releases and write-backs.
Portfolios
The SME Banking portfolio continues to grow within prudent credit risk appetite parameters. Portfolio credit quality
has remained stable or improved across all key metrics.
The Mid Markets business remains UK-focused and performance generally reflects the underlying performance of the
UK economy. The first half of 2017 has seen a continuation of relatively benign credit conditions, underpinned by low
interest rates, GDP growth and low unemployment. Lower Sterling values have benefited exporters of goods and
services while placing pressure on margins in businesses reliant on imports for domestic consumption. This has not
resulted in material increases in stress across the bulk of the portfolio, with levels of default and impairment
remaining low by historic standards.
The Global Corporates business continues to have a predominance of investment grade clients and is performing
well, with limited downgrades occurring in the first half of 2017.
The commercial real estate business within the Group’s Mid Markets and Global Corporate portfolio is focused on
clients operating in the UK commercial property market ranging in size from medium-sized private real estate entities
up to publicly listed property companies. Despite political uncertainties and the potential impact of withdrawal from
the EU, the market for UK real estate has continued to be resilient, with appetite from a range of investors. UK real
estate continues to offer attractive yields compared to other asset classes and the fall in Sterling has boosted the
attractiveness to foreign investors. Credit quality remains good with minimal impairments/stressed loans. Recognising
this is a cyclical sector, appropriate caps are in place to control exposure and business propositions continue to be
written in line with a prudent, through the cycle risk appetite with conservative LTVs, strong quality of income and
proven management teams.
Financial Institutions serves predominantly investment grade counterparties with whom relationships are either client
focused or held to support the Group’s funding, liquidity or general hedging requirements. The portfolio continues to
be prudently managed within the Group’s conservative risk appetite and clearly defined sector strategies.
The Group continues to adopt a conservative stance across the Eurozone maintaining close portfolio scrutiny and
oversight particularly given the current macro environment and horizon risks.

LLOYDS BANKING GROUP PLC 2017 HALF-YEAR RESULTS
Page 34 of 90
Consumer Finance
Loans and advances in the Consumer Finance book grew by 28.4 per cent to £45,585 million (31 December 2016:
£35,494 million), mostly due to the acquisition of MBNA.
Asset quality remains strong. The quality of new business continues to be good, and remains within credit risk
appetite.
Robust indebtedness and affordability controls continue to ensure new lending is sustainable for customers and the
credit quality of the portfolio remains high.
Impaired loans grew by 12.9 per cent to £841 million (31 December 2016: £745 million) largely reflecting the
acquisition of MBNA. Impaired loans as a percentage of closing advances improved to 1.8 per cent (31 December
2016: 2.1 per cent) indicating an improvement in overall credit quality.
Impairment provisions as a percentage of impaired loans increased to 87.1 per cent (31 December 2016: 85.0 per
cent), due to a one-off change relating to the alignment of policy across brands in Loans, and growth in the UK Motor
Finance portfolio coupled with prudent provisioning on residual value exposures.
The impairment charge was £125 million (half-year to 30 June 2016: £128 million) with growth in UK Motor Finance,
offset by larger debt sale benefits in both the Cards and Loans portfolios compared to the first half of 2016.
Credit Cards
Loans and advances increased by 79.2 per cent to £17,634 million during the first half of 2017 (31 December 2016:
£9,843 million), due to the acquisition of MBNA.
Impaired loans increased by 34.5 per cent to £413 million (31 December 2016: £307 million), reflecting the
acquisition of MBNA. Impaired loans as a percentage of closing loans and advances improved to 2.3 per cent
(31 December 2016: 3.1 per cent), reflecting the continued sale of debt in recoveries and the good credit quality of
the portfolio.
Impairment provisions as a percentage of impaired loans remained broadly stable at 82.7 per cent (31 December
2016: 81.8 per cent).
The impairment charge decreased to £49 million (half-year to 30 June 2016: £59 million), driven by larger debt sale
benefits in the first half of 2017 compared to the first half of 2016.
Loans
Loans and advances increased by 2.6 per cent to £7,967 million in the first half of 2017 (31 December 2016:
£7,767 million) and credit quality remained strong.
Impaired loans decreased by 6.5 per cent to £259 million (31 December 2016: £277 million), largely due to the sale of
debt in recoveries. Impaired loans as a percentage of closing loans and advances improved to 3.3 per cent
(31 December 2016: 3.6 per cent).
Impairment provisions as a percentage of impaired loans increased to 86.5 per cent (31 December 2016: 81.4 per
cent), reflecting a one-off change relating to policy alignment across brands for franchised customers.
The impairment charge decreased to £30 million (half-year to 30 June 2016: £42 million), driven by larger debt sale
benefits in the first half of 2017 compared to the first half of 2016.
UK Motor Finance
Loans and advances increased by 10.7 per cent to £12,786 million during the first half of 2017 (31 December 2016:
£11,555 million), with £583 million (47.4 per cent) of the growth occurring in the Jaguar Land Rover partnership.
Impaired loans increased by 5.0 per cent to £126 million (31 December 2016: £120 million) driven by book growth.
Impaired loans as a percentage of closing loans and advances remained stable at 1.0 per cent.
Impairment provisions as a percentage of impaired loans increased to 110.3 per cent (31 December 2016: 105.8 per
cent), reflecting continued prudence in provisions against residual value exposures.
The impairment charge was £45 million (half-year to 30 June 2016: £28 million), driven by growth and seasoning in
the portfolio.

LLOYDS BANKING GROUP PLC 2017 HALF-YEAR RESULTS
Page 35 of 90
Forbearance
The Group operates a number of schemes to assist borrowers who are experiencing financial stress. Forbearance
policies are disclosed in the Risk Management section of the Group’s 2016 Annual Report and Accounts, pages 127 to
129. Retail forbearance
At 30 June 2017, UK Secured loans and advances currently or recently subject to forbearance improved to 0.6 per cent
(31 December 2016: 0.7 per cent) of total UK Secured loans and advances. Overdrafts loans and advances currently or
recently subject to forbearance were 4.1 per cent (31 December 2016: 4.0 per cent) of total overdrafts loans and
advances. Impairment provisions Total loans and Total forborne loans as % of loans and advances which are and advances which are advances which are forborne impaired forborne At June At Dec At June At Dec At June At Dec 2017 2016 2017 2016 2017 2016 £m £m £m £m % % UK Secured lending: Temporary forbearance arrangements
Reduced payment arrangements1 299 428 82 101 5.9 4.9 Permanent treatments
Repair and term extensions2 1,342 1,668 93 116 4.7 4.7
Total 1,641 2,096 175 217 4.9 4.7 Overdrafts3: 80 78 69 61 46.0 38.0
1 Includes customers who had an arrangement to pay less than the contractual amount at 30 June or where an arrangement ended within the previous three months.
2 Includes capitalisation of arrears and term extensions which commenced during the previous 24 months and where the borrowers remain as customers at 30 June.
3 Includes temporary treatments where the customer is currently benefiting from change or the treatment has ended within the last six months.
Commercial Banking forbearance
At 30 June 2017, £2,321 million (31 December 2016: £2,645 million) of total loans and advances were forborne of which
£1,912 million (31 December 2016: £2,179 million) were impaired. Impairment provisions as a percentage of forborne
loans and advances increased from 31.2 per cent at 31 December 2016 to 31.9 per cent at 30 June 2017. Unimpaired
forborne loans and advances were £409 million at 30 June 2017 (31 December 2016: £466 million).
The table below sets out the Group’s largest unimpaired forborne loans and advances to commercial customers
(exposures over £5 million) as at 30 June 2017 by type of forbearance: 30 June 31 Dec 2017 2016 £m £m Type of unimpaired forbearance: Exposures > £5m1
Covenants 122 153
Extensions/alterations – 7
Multiple 11 21
133 181
Exposures < £5m1 276 285
Total 409 466
1 Material portfolios only.

LLOYDS BANKING GROUP PLC 2017 HALF-YEAR RESULTS
Page 36 of 90
Consumer Finance forbearance
At 30 June 2017, total loans and advances currently or recently subject to forbearance as a percentage of total loans and
advances had reduced across the major Consumer Finance portfolios (30 June 2017: 1.3 per cent; 31 December 2016:
1.4 per cent), with decreases in Consumer Credit Cards (including MBNA) and Loans offset by an increase in UK Motor
Finance.
Total loans and advances which are
forborne
Total forborne loans and advances which
are impaired
Impairment provisions as % of
loans and advances which are forborne
30 June 31 Dec 30 June 31 Dec 30 June 31 Dec 2017 2016 2017 2016 2017 2016 £m £m £m £m % % Consumer Credit Cards1 302 212 194 119 34.7 29.0
Loans2 53 49 50 46 42.8 44.4
UK Motor Finance Retail2 109 117 50 62 23.2 27.0
1 Includes temporary treatments where the customer is currently benefiting from the change or the treatment has ended within the last
six months. Permanent changes, such as returning a Card account in arrears to an in-order status, which commenced during the last 24 months for existing customers as at 30 June are also included. 30 June 2017 balances include MBNA (forborne loans;£110 million; impaired loans: £86 million).
2 Includes temporary treatments where the customer is currently benefiting from the change or the treatment has ended within the last six months. Permanent changes, such as refinancing, for existing customers as at 30 June are also included.

LLOYDS BANKING GROUP PLC 2017 HALF-YEAR RESULTS
Page 37 of 90
FUNDING AND LIQUIDITY MANAGEMENT
During the first half of 2017 the Group has maintained its strong funding and liquidity position, with a loan to deposit ratio
of 109 per cent. The combination of a strong balance sheet and access to a range of funding markets, including
government and central bank schemes, provides the Group with a broad range of options with respect to funding the
balance sheet.
The Group ran a small excess liquidity position during the first half of 2017 in anticipation of the acquisition of MBNA.
Following completion of this acquisition, the excess liquidity position has reduced, although the Group continues to meet
the Liquidity Coverage Ratio (LCR) requirements, with a ratio in excess of 100 per cent.
Loans and advances to customers were £453.2 billion compared with £449.7 billion at 31 December 2016. Growth in
lending balances was primarily driven by the acquisition of MBNA in addition to continued growth in lending to Consumer
Finance and SME customers. Total customer deposits increased by £3.6 billion to £416.6 billion at 30 June 2017.
Wholesale funding has decreased by £8.5 billion to £102.3 billion; the amount with a residual maturity less than one year
fell to £30.4 billion (£35.1 billion at 31 December 2016). The Group’s term funding ratio (wholesale funding with a
remaining life of over one year as a percentage of total wholesale funding) has increased to 70 per cent (31 December
2016: 68 per cent). In the first half of 2017, the Group drew down £9 billion of funding from the Bank of England’s Term
Funding Scheme (TFS), which has contributed to the lower new issuance volumes seen in the last six months. As at
30 June 2017 the total amount outstanding under the Funding for Lending Scheme (FLS) was £30.1 billion and under the
TFS was £13.5 billion.
The credit ratings and outlook on Lloyds Bank were unchanged during the first half of 2017, and the median credit rating
among the three major credit rating agencies remains ‘A+’.

LLOYDS BANKING GROUP PLC 2017 HALF-YEAR RESULTS
Page 38 of 90
Group funding position At 30 June At 31 Dec 2017 2016 Change £bn £bn % Funding requirement
Loans and advances to customers1 453.2 449.7 1
Loans and advances to banks2 6.2 5.1 22
Debt securities 3.8 3.4 12
Reverse repurchase agreements 0.7 0.5 40
Available-for-sale financial assets – non-LCR eligible3 1.0 1.9 (47)
Cash and balances at central bank – non-LCR eligible4 3.8 4.8 (21)
Funded assets 468.7 465.4 1
Other assets5 244.5 249.9 (2)
713.2 715.3 –
On balance sheet LCR eligible liquidity assets
Reverse repurchase agreements 11.5 8.7 32
Cash and balances at central banks4 46.7 42.7 9
Available-for-sale financial assets 50.8 54.6 (7)
Trading and fair value through profit and loss (3.2) 1.8
Repurchase agreements (4.1) (5.3) (23)
101.7 102.5 (1)
Total Group assets 814.9 817.8 –
Less: other liabilities5 (247.7) (245.2) 1
Funding requirement 567.2 572.6 (1)
Funded by
Customer deposits6 416.6 413.0 1
Wholesale funding7 102.3 110.8 (8)
518.9 523.8 (1)
Total equity 48.3 48.8 (1)
Total funding 567.2 572.6 (1)
1 Excludes reverse repos of £11.4 billion (31 December 2016: £8.3 billion). 2 Excludes £1.9 billion (31 December 2016: £20.9 billion) of loans and advances to banks within the Insurance business and
£0.8 billion (31 December 2016: £0.9 billion) of reverse repurchase agreements. 3 Non-LCR eligible liquid assets comprise a diversified pool of highly rated unencumbered collateral (including retained issuance). 4 Cash and balances at central banks are combined in the Group’s balance sheet. 5 Other assets and other liabilities primarily include balances in the Group’s Insurance business and the fair value of derivative assets
and liabilities. 6 Excludes repos of £1.0 billion (31 December 2016: £2.5 billion). 7 The Group’s definition of wholesale funding aligns with that used by other international market participants; including interbank
deposits, debt securities in issue and subordinated liabilities.

LLOYDS BANKING GROUP PLC 2017 HALF-YEAR RESULTS
Page 39 of 90
Reconciliation of Group funding to the balance sheet Repos and cash Fair value Included in collateral and other funding received by accounting Balance analysis Insurance methods sheetAt 30 June 2017 £bn £bn £bn £bn Deposits from banks 7.0 17.5 0.4 24.9
Debt securities in issue 76.7 – (5.1) 71.6
Subordinated liabilities 18.6 – – 18.6
Total wholesale funding 102.3 17.5
Customer deposits 416.6 1.0 – 417.6
Total 518.9 18.5 At 31 December 2016 Deposits from banks 8.1 8.0 0.3 16.4
Debt securities in issue 83.0 – (6.7) 76.3
Subordinated liabilities 19.7 – 0.1 19.8
Total wholesale funding 110.8 8.0
Customer deposits 413.0 2.5 – 415.5
Total 523.8 10.5
Analysis of 2017 total wholesale funding by residual maturity
Less Nine More Total Total than One to Three Six to months One to Two to than at at one three to six nine to one two five five 30 June 31 Dec month months months months year years years years 2017 2016 £bn £bn £bn £bn £bn £bn £bn £bn £bn £bn Deposit from banks 6.2 0.7 0.1 – – – – – 7.0 8.1 Debt securities in issue:
Certificates of deposit 1.7 3.4 2.2 1.4 1.3 – – – 10.0 7.5 Commercial paper 1.8 1.6 0.3 – – – – – 3.7 3.2 Medium-term notes1 0.3 1.0 0.2 1.4 0.6 3.8 12.4 14.5 34.2 36.9 Covered bonds – – – 1.6 0.7 2.0 11.5 8.8 24.6 29.1
Securitisation 0.1 0.5 0.8 0.4 – 0.8 1.3 0.3 4.2 6.3
3.9 6.5 3.5 4.8 2.6 6.6 25.2 23.6 76.7 83.0
Subordinated liabilities – 0.4 – 0.2 1.5 0.8 3.5 12.2 18.6 19.7 Total wholesale funding2 10.1 7.6 3.6 5.0 4.1 7.4 28.7 35.8 102.3 110.8
Of which issued by Lloyds Banking Group plc3 – – – – – – 2.8 7.3 10.1 7.4
1 At 31 December 2016, medium term notes included £1.4 billion of funding from the National Loan Guarantee Scheme. This matured
in May 2017. 2 The Group’s definition of wholesale funding aligns with that used by other international market participants; including interbank
deposits, debt securities in issue and subordinated liabilities. 3 Consists of medium-term notes (30 June 2017: £5.4 billion, 31 December 2016: £2.5 billion) and subordinated liabilities (30 June
2017: £4.6 billion, 31 December 2016: £4.9 billion). These amounts excluded AT1 securities (30 June 2017: £5.4 billion, 31 December 2016: £5.4 billion).

LLOYDS BANKING GROUP PLC 2017 HALF-YEAR RESULTS
Page 40 of 90
Analysis of 2017 term issuance
Other Sterling US Dollar Euro currencies Total £bn £bn £bn £bn £bn Securitisation – – – – –
Medium-term notes – 2.2 0.9 – 3.1
Covered bonds 1.0 – – – 1.0
Private placements1 0.1 0.2 0.1 – 0.4
Subordinated liabilities – – – – –
Total issuance 1.1 2.4 1.0 – 4.5
Of which issued by Lloyds Banking Group plc2 – 2.2 0.9 – 3.1
1 Private placements include structured bonds and term repurchase agreements (repos). 2 Consists of medium-term notes.
Gross term issuance for the first half of 2017 totalled £4.5 billion. The Group continues to maintain a diversified approach
to funding markets with trades in public and private format, secured and unsecured products and a wide range of
currencies and markets. For 2017, the Group will continue to maintain this diversified approach to funding, including
capital and funding from the holding company, Lloyds Banking Group plc, as needed to transition towards final UK
Minimum Requirements for Own Funds and Eligible Liabilities (MREL). The maturities for the FLS and TFS are fully
factored into the Group’s funding plan.
Liquidity portfolio
At 30 June 2017, the Banking business had £122.3 billion of highly liquid unencumbered LCR eligible assets, of which
£121.7 billion is LCR level 1 eligible and £0.6 billion is LCR level 2 eligible. These assets are available to meet cash and
collateral outflows and PRA regulatory requirements. A separate liquidity portfolio to mitigate any insurance liquidity risk
is managed within the Insurance business. LCR eligible liquid assets represent over seven times the Group’s money
market funding less than one year maturity (excluding derivative collateral margins and settlement accounts) and exceed
total wholesale funding, and thus provides a substantial buffer in the event of continued market dislocation.
At 30 June At 31 Dec Average Average 2017 2016 Change 2017 2016 £bn £bn % £bn £bnLevel 1 Cash and central bank reserves 46.7 42.7 9 53.1 53.7
High quality government/MDB/agency bonds1 74.1 75.3 (2) 74.7 72.4High quality covered bonds 0.9 2.3 (61) 1.0 2.4
Total 121.7 120.3 1 128.8 128.5 Level 22 0.6 0.5 20 0.5 0.5
Total LCR eligible assets 122.3 120.8 1 129.3 129.0
1 Designated multilateral development bank (MDB). 2 Includes Level 2A and Level 2B.
The Banking business also had £102.1 billion of secondary, non-LCR eligible liquidity, the vast majority of which is
eligible for use in a range of central bank or similar facilities and the Group routinely makes use of as part of its normal
liquidity management practices. Future use of such facilities will be based on prudent liquidity management and
economic considerations, having regard for external market conditions.
The Group considers diversification across geography, currency, markets and tenor when assessing appropriate
holdings of liquid assets. This liquidity is managed as a single pool in the centre and is under the control of the function
charged with managing the liquidity of the Group. It is available for deployment at immediate notice, subject to complying
with regulatory requirements.

LLOYDS BANKING GROUP PLC 2017 HALF-YEAR RESULTS
Page 41 of 90
Encumbered assets
The Board and GALCO monitor and manage total balance sheet encumbrance using a number of risk appetite metrics.
At 30 June 2017, the Group had £79.1 billion (31 December 2016: £83.5 billion) of externally encumbered on balance
sheet assets with counterparties other than central banks. The decrease in encumbered assets was primarily driven by a
reduction in balances held within the Group’s issuance programmes.
The Group also had £586.5 billion (31 December 2016: £580.9 billion) of unencumbered on balance sheet assets, and
£149.3 billion (31 December 2016: £153.5 billion) of pre-positioned and encumbered assets held with central banks. The
Group encumbers mortgages, unsecured lending and credit card receivables through the issuance programmes and
tradable securities through securities financing activity. The Group mainly positions mortgage assets at central banks.
The 2016 Annual Report and Accounts includes further details on how the Group classifies assets for encumbrance
purposes.

LLOYDS BANKING GROUP PLC 2017 HALF-YEAR RESULTS
Page 42 of 90
CAPITAL MANAGEMENT
Analysis of capital position
Excluding the capital impact of the acquisition of MBNA Limited on 1 June 2017, the Group generated around 1.0 per
cent of CET1 capital on a pro forma basis (pre dividend) during the first half of 2017, primarily as a result of:
Strong underlying capital generation of 1.4 per cent, largely driven by underlying profits, offset by a reduction of
(0.8) per cent for conduct charges;
Other items, netting to 0.4 per cent, largely representing a pre MBNA reduction in risk-weighted assets through
active portfolio management, disposals, capital efficient securitisation activity, yield curve movements and foreign
exchange movements, partly offset by targeted growth in key customer segments.
In addition, the Group utilised the CET1 capital retained at 31 December 2016 to cover the acquisition of MBNA.
The combined effect of the capital generated during the period and the acquisition of MBNA resulted in a pre dividend
increase of around 0.2 per cent in the Group’s CET1 ratio from 13.8 per cent pro forma at 31 December 2016 to 14.0 per
cent on pro forma basis. After accruing for foreseeable dividends the Group’s CET1 ratio reduced by 0.5 per cent to
13.5 per cent on a pro forma basis.
The accrual for foreseeable dividends includes the declared interim ordinary dividend of 1.0 pence per ordinary share.
The transitional total capital ratio, after accruing for foreseeable dividends, reduced by 0.6 per cent to 20.8 per cent,
largely reflecting amortisation and foreign exchange movements on tier 2 instruments and the overall increase in
risk-weighted assets following the acquisition of MBNA.
In the first quarter of 2017, the Bank of England communicated indicative non-binding guidance to the Group on meeting
the Minimum Requirement for Own Funds and Eligible Liabilities (MREL), prior to the application of regulatory buffers, as
being the higher of:
6 per cent leverage exposure and 20.5 per cent of risk-weighted assets by 1 January 2020
6 per cent leverage exposure and 25.1 per cent of risk-weighted assets by 1 January 2022
During the first half of 2017 the Group issued £3.1 billion (sterling equivalent) of senior unsecured securities from Lloyds
Banking Group plc which, while not included in total capital, are eligible to meet MREL. Combined with previous
issuances made during 2016 the Group remains well positioned to meet MREL requirements from 2020 and, as at
30 June 2017, had a transitional MREL ratio of 22.7 per cent.
The leverage ratio, after accruing for foreseeable dividends, reduced from 5.0 per cent on a pro forma basis to 4.9 per
cent on a pro forma basis, largely reflecting the acquisition of MBNA.
An analysis of the Group’s capital position as at 30 June 2017 is presented in the following section on both a CRD IV
transitional arrangements basis and a CRD IV fully loaded basis.
The table below summarises the consolidated capital position of the Group.

LLOYDS BANKING GROUP PLC 2017 HALF-YEAR RESULTS
Page 43 of 90
Transitional Fully loaded At 30 June At 31 Dec At 30 June At 31 DecCapital resources 2017 2016 2017 2016 £m £m £m £mCommon equity tier 1 Shareholders’ equity per balance sheet 42,513 43,020 42,513 43,020
Adjustment to retained earnings for foreseeable dividends (1,080) (1,568) (1,080) (1,568)Deconsolidation adjustments1 1,688 1,342 1,688 1,342
Adjustment for own credit 119 87 119 87
Cash flow hedging reserve (1,703) (2,136) (1,703) (2,136)
Other adjustments (269) (276) (269) (276)
41,268 40,469 41,268 40,469less: deductions from common equity tier 1 Goodwill and other intangible assets (2,651) (1,623) (2,651) (1,623)
Prudent valuation adjustment (636) (630) (636) (630)
Excess of expected losses over impairment
provisions and value adjustments (551) (602) (551) (602)
Removal of defined benefit pension surplus (320) (267) (320) (267)
Securitisation deductions (198) (217) (198) (217)
Significant investments1 (4,279) (4,282) (4,279) (4,282)
Deferred tax assets (3,313) (3,564) (3,313) (3,564)
Common equity tier 1 capital 29,320 29,284 29,320 29,284
Additional tier 1
Other equity instruments 5,320 5,320 5,320 5,320
Preference shares and preferred securities2 4,639 4,998 – –
Transitional limit and other adjustments (1,884) (1,692) – –
8,075 8,626 5,320 5,320less: deductions from tier 1 Significant investments1 (1,292) (1,329) – –
Total tier 1 capital 36,103 36,581 34,640 34,604Tier 2 Other subordinated liabilities2 13,936 14,833 13,936 14,833
Deconsolidation of instruments issued by insurance entities1 (1,721) (1,810) (1,721) (1,810)Adjustments for transitional limit and non-eligible instruments 1,748 1,351 (1,444) (1,694)Amortisation and other adjustments (3,472) (3,447) (3,538) (3,597)
10,491 10,927 7,233 7,732
Eligible provisions 255 186 255 186less: deductions from tier 2 Significant investments1 (1,646) (1,571) (2,938) (2,900)
Total capital resources 45,203 46,123 39,190 39,622 Risk-weighted assets 217,787 215,534 217,787 215,534 Common equity tier 1 capital ratio3 13.5% 13.6% 13.5% 13.6%
Tier 1 capital ratio 16.6% 17.0% 15.9% 16.1%
Total capital ratio 20.8% 21.4% 18.0% 18.4%
1 For regulatory capital purposes the Group’s Insurance business is deconsolidated and replaced by the amount of the Group’s
investment in the business. A part of this amount is deducted from capital (shown as ‘significant investments’ in the table above) and the remaining amount is risk-weighted, forming part of threshold risk-weighted assets.
2 Preference shares, preferred securities and other subordinated liabilities are categorised as subordinated liabilities in the balance sheet.
3 The common equity tier 1 ratio at 30 June 2017 is 13.5 per cent on a pro forma basis upon recognition of the dividend paid by theInsurance business in July 2017 in relation to its 2017 interim earnings. At 31 December 2016 the ratio was 13.8 per cent on a pro forma basis upon recognition of the dividend paid by the Insurance business in February 2017 in relation to its 2016 full yearearnings.

LLOYDS BANKING GROUP PLC 2017 HALF-YEAR RESULTS
Page 44 of 90
The key difference between the transitional capital calculation as at 30 June 2017 and the fully loaded equivalent is
primarily related to capital securities that previously qualified as tier 1 or tier 2 capital, but that do not fully qualify under
CRD IV, which can be included in additional tier 1 (AT1) or tier 2 capital (as applicable) up to specified limits which
reduce by 10 per cent per annum until 2022.
The movements in the transitional CET1, AT1, tier 2 and total capital positions in the period are provided below.
Common Additional Total equity tier 1 tier 1 Tier 2 capital £m £m £m £m At 31 December 2016 29,284 7,297 9,542 46,123
Profit attributable to ordinary shareholders1 1,047 – – 1,047
Movement in foreseeable dividends2 488 – – 488
Dividends paid out on ordinary shares during the year (1,568) – – (1,568)Dividend in respect of 2016 earnings received from the Insurance business1 500 – – 500Movement in treasury shares and employee share schemes 40 – – 40Pension movements:
Removal of defined benefit pension surplus (53) – – (53)
Movement through other comprehensive income (105) – – (105)
Available-for-sale reserve 98 – – 98
Prudent valuation adjustment (6) – – (6)
Deferred tax asset 251 – – 251
Goodwill and other intangible assets (1,028) – – (1,028)
Excess of expected losses over impairment provisions and value adjustments 51 – – 51Significant investments 3 37 (75) (35)
Eligible provisions – – 69 69
Movements in subordinated debt:
Repurchases, redemptions and other – (551) (436) (987)
Issuances – – – –
Other movements 318 – – 318
At 30 June 2017 29,320 6,783 9,100 45,203
1 Under the regulatory framework, profits made by Insurance are removed from CET1 capital. However, when dividends are paid to the
Group by Insurance these are recognised through CET1 capital. 2 Includes the accrual for foreseeable 2017 ordinary dividends and the reversal of the accrual for foreseeable 2016 dividends which
have now been paid.
CET1 capital resources have increased by £36 million in the period, reflecting a combination of profit generation, the
receipt of the dividend paid by the Insurance business in February 2017 and a reduction in the deferred tax asset
deducted from capital, largely offset by the accrual for foreseeable dividends in respect of the first half of 2017,
movements in the defined benefit pension schemes and an increase in the deduction for goodwill and other intangible
assets following the acquisition of MBNA.
AT1 capital resources have reduced by £514 million in the period, primarily reflecting the annual reduction in the
transitional limit applied to grandfathered AT1 capital instruments.
Tier 2 capital resources have reduced by £442 million in the period largely reflecting the amortisation of dated tier 2
instruments and foreign exchange movements on subordinated debt, partly offset by the transitioning of grandfathered
AT1 instruments to tier 2.

LLOYDS BANKING GROUP PLC 2017 HALF-YEAR RESULTS
Page 45 of 90
Risk-weighted assets At 30 June At 31 Dec 2017 2016 £m £m Foundation Internal Ratings Based (IRB) Approach 61,115 64,907
Retail IRB Approach 65,331 64,970
Other IRB Approach 18,360 17,788
IRB Approach 144,806 147,665
Standardised (STA) Approach 24,794 18,956
Credit risk 169,600 166,621
Counterparty credit risk 7,188 8,419
Contributions to the default fund of a central counterparty 419 340
Credit valuation adjustment risk 735 864
Operational risk 26,222 25,292
Market risk 2,930 3,147
Underlying risk-weighted assets 207,094 204,683
Threshold risk-weighted assets1 10,693 10,851
Total risk-weighted assets 217,787 215,534
Risk-weighted asset movement by key driver Credit Credit Counterparty risk risk Credit credit Market Operational IRB STA risk2 risk3 risk risk Total £m £m £m £m £m £m £m Total risk-weighted assets as at 31 December 2016 215,534Less total threshold risk-weighted assets1 (10,851)
Risk-weighted assets as at 31 December 2016 147,665 18,956 166,621 9,623 3,147 25,292 204,683Asset size (1,269) (238) (1,507) (258) – – (1,765)
Asset quality (539) (92) (631) (661) – – (1,292)
Model updates 57 – 57 – – – 57
Methodology and policy (324) (74) (398) – – – (398)
Acquisitions and disposals (444) 6,351 5,907 (26) – 930 6,811
Movements in risk levels (market risk only) – – – – (217) – (217)Foreign exchange (340) (109) (449) (336) – – (785)
Risk-weighted assets as at 30 June 2017 144,806 24,794 169,600 8,342 2,930 26,222 207,094
Threshold risk-weighted assets1 10,693
Total risk-weighted assets as at 30 June 2017 217,787
1 Threshold risk-weighted assets reflect the element of significant investments and deferred tax assets that are permitted to be
risk-weighted instead of being deducted from CET1 capital. Significant investments primarily arise from investments in the Group’s Insurance business.
2 Credit risk includes securitisation risk-weighted assets. 3 Counterparty credit risk includes movements in contributions to the default fund of central counterparties and movements in credit
valuation adjustment risk.

LLOYDS BANKING GROUP PLC 2017 HALF-YEAR RESULTS
Page 46 of 90
The risk-weighted assets movement table provides analysis of the movements in risk-weighted assets in the period by
risk type and an insight into the key drivers of these movements. The key driver analysis is compiled on a monthly basis
through the identification and categorisation of risk-weighted asset movements and is subject to management judgment.
Key movements in credit risk, risk-weighted assets
Asset size movements. Credit risk-weighted assets decreased by £1.5 billion due to continued active portfolio
management partly offset by targeted growth in key customer segments.
Asset quality captures movements due to changes in borrower risk, including changes in the economic environment.
Net reductions of £0.6 billion primarily relate to a net change in credit quality and model calibrations.
Methodology and policy reductions of £0.4 billion relate to capital efficient securitisation activity.
Acquisitions and disposals; the acquisition of MBNA increased credit risk-weighted assets by £6.4 billion, partly offset
by the disposal of the Group’s interest in a strategic equity investment.
Foreign exchange movements reflect the appreciation of Sterling.
Counterparty credit risk and CVA risk-weighted asset reductions of £1.3 billion are driven mainly by yield curve
movements (included in asset quality) and foreign exchange movements.
Market risk, risk-weighted assets reduced by £0.2 billion largely due to a decrease in the exposure to long dated
inflation linked gilts and a decrease in interest rate exposure.
Operational risk, risk-weighted assets increase of £0.9 billion due to the acquisition of MBNA.

LLOYDS BANKING GROUP PLC 2017 HALF-YEAR RESULTS
Page 47 of 90
Leverage ratio Fully loaded At 30 June At 31 Dec 2017 2016 £m £mTotal tier 1 capital for leverage ratio
Common equity tier 1 capital 29,320 29,284
Additional tier 1 capital 5,320 5,320
Total tier 1 capital 34,640 34,604 Exposure measure
Statutory balance sheet assets
Derivative financial instruments 30,024 36,138
Securities financing transactions (SFTs) 41,477 42,285
Loans and advances and other assets 743,418 739,370
Total assets 814,919 817,793 Deconsolidation adjustments1
Derivative financial instruments (1,995) (2,403)
Securities financing transactions (SFTs) (122) 112
Loans and advances and other assets (138,780) (142,955)
Total deconsolidation adjustments (140,897) (145,246) Derivatives adjustments
Adjustments for regulatory netting (16,198) (20,490)
Adjustments for cash collateral (8,034) (8,432)
Net written credit protection 857 699
Regulatory potential future exposure 12,853 13,188
Total derivatives adjustments (10,522) (15,035) SFT adjustments (1,014) 39 Off-balance sheet items 59,060 58,685 Regulatory deductions and other adjustments (7,239) (9,128) Total exposure measure 714,307 707,108 Leverage ratio2,6 4.8% 4.9% Modified UK leverage exposure measure3 667,207 665,598
Average modified UK leverage exposure measure4 661,811 Modified UK leverage ratio3 5.2% 5.2%
Average modified UK leverage ratio5 5.4%
1 Deconsolidation adjustments relate to the deconsolidation of certain Group entities that fall outside the scope of the Group’s
regulatory capital consolidation, being primarily the Group’s Insurance business. 2 The countercyclical leverage ratio buffer is currently nil. 3 The Group’s leverage ratio on a modified basis, excluding qualifying central bank claims from the exposure measure in accordance
with the rule modification applied to the UK Leverage Ratio Framework by the PRA in 2016. 4 The average modified UK leverage exposure measure is based on the average of the month end modified exposure measures over
the quarter (1 April 2017 to 30 June 2017). 5 The average modified UK leverage ratio is based on the average of the month end tier 1 capital and modified exposure measures
over the quarter (1 April 2017 to 30 June 2017). The average of 5.4 per cent compares to 5.4 per cent at the start and 5.2 per cent atthe end of the quarter.
6 The leverage ratio at 30 June 2017 is 4.9 per cent on a pro forma basis upon recognition of the dividend paid by the Insurancebusiness in July 2017 in relation to its 2017 interim earnings. At 31 December 2016 the ratio was 5.0 per cent on a pro forma basis upon recognition of the dividend paid by the Insurance business in February 2017 in relation to its 2016 full year earnings.

LLOYDS BANKING GROUP PLC 2017 HALF-YEAR RESULTS
Page 48 of 90
Key movements
The leverage total exposure measure increased by £7.2 billion over the period primarily reflecting an increase in loans
and advances and off-balance sheet items following the acquisition of MBNA and an increase in central bank claims,
partly offset by a reduction in available-for-sale financial assets and reductions in both the derivatives and SFT exposure
measures.
The derivatives exposure measure, representing derivative financial instruments per the balance sheet net of
deconsolidation and derivatives adjustments, reduced by £1.2 billion over the period, primarily driven by market
movements.
The £2.1 billion reduction in the SFT exposure measure over the period, representing SFT assets per the balance sheet
net of deconsolidation and other SFT adjustments, reflected reduced trading volumes and an increase in eligible netting
adjustments, offset by an increase in customer volumes.
Off-balance sheet items increased by £0.4 billion over the period, primarily reflecting new residential mortgage offers
placed in addition to an increase in unconditionally cancellable credit card commitments following the acquisition of
MBNA, largely offset by a net reduction in securitisation financing facilities.
The average modified UK leverage ratio of 5.4 per cent over the quarter reflected both a strengthening tier 1 capital
position and a small reduction in the modified exposure measure during the first two months of the quarter, prior to the
acquisition of MBNA in June which, along with other movements, resulted in the reduction of the ratio at the end of the
quarter.
Individual capital guidance
The Group receives Pillar 2A Individual Capital Guidance (ICG) from the PRA. The ICG reflects a point in time estimate
by the PRA, which may change over time, of the minimum amount of capital that is needed in relation to risks not
covered by Pillar 1. During the period the Group’s ICG has not changed and at 30 June 2017 represented 4.5 per cent of
risk-weighted assets of which 2.5 per cent has to be covered by CET1 capital.
Stress testing
The Group undertakes a wide ranging programme of stress testing providing a comprehensive view of the potential
impacts arising from the risks to which the Group is exposed. One of the most important uses of stress testing is to
assess the resilience of the operational and strategic plans of the Group to adverse economic conditions and other key
vulnerabilities. As a part of that the Group participates in the UK-wide concurrent stress test run by the Bank of England.
The last such stress test was undertaken in 2016 and the Group comfortably exceeded the capital thresholds set by the
PRA and was not required to take any action as a result of this test. The Group has participated again this year, having
submitted its results to the Bank of England, and is awaiting the publication of the results of the test for the industry as a
whole.
Regulatory capital developments
The Basel Committee continues to finalise its reforms to the regulatory capital framework, with the overall aim of
addressing excessive variability in risk-weighted assets modelled by banks without a significant increase in overall capital
requirements across the industry. The Committee’s proposed revisions include changes to the standardised frameworks
for credit risk and operational risk, the application of parameter floors for internal models and the introduction of an
aggregate capital floor framework based upon the revised standardised approaches. The final Basel standards are
expected to be published in the second half of 2017, subject to approval from the Group of Governors and Heads of
Supervision. In addition the European Commission published a substantial package of draft reforms in November 2016
aimed at strengthening the resilience of banks across the EU – these reforms, which include revisions to the market risk,
counterparty credit risk and leverage frameworks, are currently under negotiation and expected to be implemented by
2020 at the earliest.

LLOYDS BANKING GROUP PLC 2017 HALF-YEAR RESULTS
Page 49 of 90
In the UK the Financial Policy Committee and Prudential Regulation Authority are currently consulting on revisions to the
UK Leverage Ratio Framework, including proposals to adjust for the impact of excluding qualifying central bank claims
from the leverage measure by increasing the minimum leverage ratio requirement to 3.25 per cent.
In addition the Financial Policy Committee has increased the UK countercyclical capital buffer rate from 0 per cent to
0.5 per cent with effect from 27 June 2018. The Committee expects to increase the rate to 1.0 per cent at its November
meeting with effect from November 2018.
The Group continues to monitor these developments very closely, analysing the potential capital impacts to ensure that,
through organic capital generation, the Group continues to maintain a strong capital position that exceeds both the
minimum regulatory requirements and the Group’s risk appetite and is consistent with market expectations.
Half-year Pillar 3 disclosures
The Group will publish a condensed set of half-year Pillar 3 disclosures in August, prepared in accordance with the
revised European Banking Authority (EBA) guidelines on Pillar 3 disclosure formats and frequency that were issued in
December 2016.
A copy of the half-year Pillar 3 Report will be available to view at www.lloydsbankinggroup.com/investors/financial-
performance/other-disclosures.

LLOYDS BANKING GROUP PLC 2017 HALF-YEAR RESULTS
Page 50 of 90
STATUTORY INFORMATION
Page
Condensed consolidated half-year financial statements (unaudited)
Consolidated income statement 51
Consolidated statement of comprehensive income 52
Consolidated balance sheet 53
Consolidated statement of changes in equity 55
Consolidated cash flow statement 58
Notes
1 Accounting policies, presentation and estimates 59
2 Segmental analysis 60
3 Operating expenses 62
4 Impairment 63
5 Taxation 63
6 Earnings per share 64
7 Trading and other financial assets at fair value through profit or loss 64
8 Derivative financial instruments 64
9 Loans and advances to customers 65
10 Allowance for impairment losses on loans and receivables 65
11 Acquisition of MBNA 66
12 Debt securities in issue 67
13 Post-retirement defined benefit schemes 68
14 Provisions for liabilities and charges 69
15 Contingent liabilities and commitments 71
16 Fair values of financial assets and liabilities 74
17 Credit quality of loans and advances 81
18 Dividends on ordinary shares 82
19 Events since the balance sheet date 82
20 Future accounting developments 82
21 Other information 85

LLOYDS BANKING GROUP PLC 2017 HALF-YEAR RESULTS
Page 51 of 90
CONDENSED CONSOLIDATED HALF-YEAR FINANCIAL STATEMENTS (UNAUDITED)
CONSOLIDATED INCOME STATEMENT
Half-year to Half-year to Half-year to 30 June 30 June 31 Dec 2017 2016 2016 Note £ million £ million £ million
Interest and similar income 7,861 8,479 8,141
Interest and similar expense (2,659) (3,254) (4,092)
Net interest income 5,202 5,225 4,049
Fee and commission income 1,518 1,502 1,543
Fee and commission expense (670) (682) (674)
Net fee and commission income 848 820 869
Net trading income 5,843 7,180 11,365
Insurance premium income 4,099 4,212 3,856
Other operating income 1,283 993 1,042
Other income 12,073 13,205 17,132
Total income 17,275 18,430 21,181
Insurance claims (7,976) (10,110) (12,234)
Total income, net of insurance claims 9,299 8,320 8,947
Regulatory provisions (1,590) (445) (1,579)
Other operating expenses (4,962) (5,059) (5,194)
Total operating expenses 3 (6,552) (5,504) (6,773)
Trading surplus 2,747 2,816 2,174
Impairment 4 (203) (362) (390)
Profit before tax 2,544 2,454 1,784
Taxation 5 (905) (597) (1,127)
Profit for the period 1,639 1,857 657
Profit attributable to ordinary shareholders 1,389 1,590 411
Profit attributable to other equity holders1 209 204 208
Profit attributable to equity holders 1,598 1,794 619
Profit attributable to non-controlling interests 41 63 38
Profit for the period 1,639 1,857 657
Basic earnings per share 6 2.0p 2.3p 0.6p
Diluted earnings per share 6 2.0p 2.3p 0.6p 1 The profit after tax attributable to other equity holders of £209 million (half-year to 30 June 2016: £204 million; half-year to
31 December 2016: £208 million) is offset in reserves by a tax credit attributable to ordinary shareholders of £51 million (half-year to 30 June 2016: £41 million; half-year to 31 December 2016: £50 million).

LLOYDS BANKING GROUP PLC 2017 HALF-YEAR RESULTS
Page 52 of 90
CONSOLIDATED STATEMENT OF COMPREHENSIVE INCOME Half-year to Half-year to Half-year to 30 June 30 June 31 Dec 2017 2016 2016 £ million £ million £ million
Profit for the period 1,639 1,857 657
Other comprehensive income
Items that will not subsequently be reclassified to profit or loss:
Post-retirement defined benefit scheme remeasurements (note 13):
Remeasurements before taxation (124) (267) (1,081)
Taxation 32 40 280
(92) (227) (801)
Gains and losses attributable to own credit risk
Losses before taxation (44) – –
Taxation 12 – –
(32) – –
Items that may subsequently be reclassified to profit or loss:
Movements in revaluation reserve in respect of available-for-sale financial assets:
Adjustment on transfer from held-to-maturity portfolio – – 1,544
Change in fair value 455 184 172
Income statement transfers in respect of disposals (315) (574) (1)
Income statement transfers in respect of impairment 6 146 27
Taxation (48) 152 (453)
98 (92) 1,289
Movements in cash flow hedging reserve:
Effective portion of changes in fair value (267) 3,040 (608)
Net income statement transfers (317) (206) (351)
Taxation 151 (752) 286
(433) 2,082 (673)
Currency translation differences (tax: nil) (7) (20) 16
Other comprehensive income for the period, net of tax (466) 1,743 (169)
Total comprehensive income for the period 1,173 3,600 488
Total comprehensive income attributable to ordinary shareholders 923 3,333 242
Total comprehensive income attributable to other equity holders 209 204 208
Total comprehensive income attributable to equity holders 1,132 3,537 450
Total comprehensive income attributable to non-controlling interests 41 63 38
Total comprehensive income for the period 1,173 3,600 488

LLOYDS BANKING GROUP PLC 2017 HALF-YEAR RESULTS
Page 53 of 90
CONSOLIDATED BALANCE SHEET
At 30 June At 31 Dec 2017 2016 Note £ million £ million Assets
Cash and balances at central banks 50,491 47,452
Items in course of collection from banks 855 706
Trading and other financial assets at fair value through profit or loss 7 161,970 151,174
Derivative financial instruments 8 30,024 36,138
Loans and receivables:
Loans and advances to banks 8,865 26,902
Loans and advances to customers 9 464,604 457,958
Debt securities 3,841 3,397
477,310 488,257
Available-for-sale financial assets 51,803 56,524
Goodwill 2,299 2,016
Value of in-force business 5,153 5,042
Other intangible assets 2,536 1,681
Property, plant and equipment 12,990 12,972
Current tax recoverable 16 28
Deferred tax assets 2,422 2,706
Retirement benefit assets 13 410 342
Other assets 16,640 12,755
Total assets 814,919 817,793

LLOYDS BANKING GROUP PLC 2017 HALF-YEAR RESULTS
Page 54 of 90
CONSOLIDATED BALANCE SHEET (continued) At 30 June At 31 Dec 2017 2016 Note £ million £ million
Equity and liabilities
Liabilities
Deposits from banks 24,879 16,384
Customer deposits 417,617 415,460
Items in course of transmission to banks 944 548
Trading and other financial liabilities at fair value through profit or loss 55,671 54,504
Derivative financial instruments 8 29,190 34,924
Notes in circulation 1,317 1,402
Debt securities in issue 12 71,557 76,314
Liabilities arising from insurance contracts and participating investment
contracts 101,318 94,390
Liabilities arising from non-participating investment contracts 15,652 20,112
Other liabilities 22,226 29,193
Retirement benefit obligations 13 905 822
Current tax liabilities 416 226
Other provisions 6,306 4,868
Subordinated liabilities 18,575 19,831
Total liabilities 766,573 768,978
Equity
Share capital 7,191 7,146
Share premium account 17,624 17,622
Other reserves 14,310 14,652
Retained profits 3,388 3,600
Shareholders’ equity 42,513 43,020
Other equity instruments 5,355 5,355
Total equity excluding non-controlling interests 47,868 48,375
Non-controlling interests 478 440
Total equity 48,346 48,815
Total equity and liabilities 814,919 817,793

LLOYDS BANKING GROUP PLC 2017 HALF-YEAR RESULTS
Page 55 of 90
CONSOLIDATED STATEMENT OF CHANGES IN EQUITY
Attributable to equity shareholders Share capital Other Non- and Other Retained equity controlling premium reserves profits Total instruments interests Total £ million £ million £ million £ million £ million £ million £ million Balance at 1 January 2017 24,768 14,652 3,600 43,020 5,355 440 48,815
Comprehensive income
Profit for the period – – 1,598 1,598 – 41 1,639
Other comprehensive income
Post-retirement defined benefit scheme remeasurements, net of tax – – (92) (92) – – (92)Movements in revaluation reserve in respect of available-for-sale financial assets, net of tax – 98 – 98 – – 98 Gains and losses attributable to own credit risk, net of tax – – (32) (32) – – (32)Movements in cash flow hedging reserve, net of tax – (433) – (433) – – (433)Currency translation differences (tax: nil) – (7) – (7) – – (7)Total other comprehensive income – (342) (124) (466) – – (466)
Total comprehensive income – (342) 1,474 1,132 – 41 1,173
Transactions with owners
Dividends – – (1,568) (1,568) – – (1,568)
Distributions on other equity instruments, net of tax – – (158) (158) – – (158)Issue of ordinary shares1 47 – – 47 – – 47
Movement in treasury shares – – (154) (154) – – (154)
Value of employee services:
Share option schemes – – 45 45 – – 45
Other employee award schemes – – 149 149 – – 149
Changes in non-controlling interests – – – – – (3) (3)Total transactions with owners 47 – (1,686) (1,639) – (3) (1,642)
Balance at 30 June 2017 24,815 14,310 3,388 42,513 5,355 478 48,346
1 During the half-year to 30 June 2017, 452 million shares were issued in respect of employee share schemes.

LLOYDS BANKING GROUP PLC 2017 HALF-YEAR RESULTS
Page 56 of 90
CONSOLIDATED STATEMENT OF CHANGES IN EQUITY (continued)
Attributable to equity shareholders Share capital Other Non- and Other Retained equity controlling premium reserves profits Total instruments interests Total £ million £ million £ million £ million £ million £ million £ million Balance at 1 January 2016 24,558 12,260 4,416 41,234 5,355 391 46,980
Comprehensive income
Profit for the period – – 1,794 1,794 – 63 1,857
Other comprehensive income
Post-retirement defined benefit scheme remeasurements, net of tax – – (227) (227) – – (227)
Movements in revaluation reserve in respect of available-for-sale financial assets, net of tax – (92) – (92) – – (92) Movements in cash flow hedging reserve, net of tax – 2,082 – 2,082 – – 2,082 Currency translation differences (tax: nil) – (20) – (20) – – (20)
Total other comprehensive income – 1,970 (227) 1,743 – – 1,743
Total comprehensive income – 1,970 1,567 3,537 – 63 3,600
Transactions with owners
Dividends – – (1,427) (1,427) – (2) (1,429)
Distributions on other equity instruments, net of tax – – (163) (163) – – (163) Movement in treasury shares – – (147) (147) – – (147)
Value of employee services: –
Share option schemes – – 35 35 – – 35
Other employee award schemes – – 82 82 – – 82
Changes in non-controlling interests – – – – – (20) (20)
Total transactions with owners – – (1,620) (1,620) – (22) (1,642)
Balance at 30 June 2016 24,558 14,230 4,363 43,151 5,355 432 48,938

LLOYDS BANKING GROUP PLC 2017 HALF-YEAR RESULTS
Page 57 of 90
CONSOLIDATED STATEMENT OF CHANGES IN EQUITY (continued)
Attributable to equity shareholders Share capital Other Non- and Other Retained equity controlling premium reserves profits Total instruments interests Total £ million £ million £ million £ million £ million £ million £ million
Balance at 1 July 2016 24,558 14,230 4,363 43,151 5,355 432 48,938
Comprehensive income
Profit for the period – – 619 619 – 38 657
Other comprehensive income
Post-retirement defined benefit scheme remeasurements, net of tax – – (801) (801) – – (801)
Movements in revaluation reserve in respect of available-for-sale financial assets, net of tax – 1,289 – 1,289 – – 1,289 Movements in cash flow hedging reserve, net of tax – (673) – (673) – – (673) Currency translation differences (tax: nil) – 16 – 16 – – 16
Total other comprehensive income – 632 (801) (169) – – (169)
Total comprehensive income – 632 (182) 450 – 38 488
Transactions with owners
Dividends – – (587) (587) – (27) (614)
Distributions on other equity instruments, net of tax – – (158) (158) – – (158) Redemption of preference shares 210 (210) – – – – –
Movement in treasury shares – – (28) (28) – – (28)
Value of employee services:
Share option schemes – – 106 106 – – 106
Other employee award schemes – – 86 86 – – 86
Changes in non-controlling interests – – – – – (3) (3)
Total transactions with owners 210 (210) (581) (581) – (30) (611)
Balance at 31 December 2016 24,768 14,652 3,600 43,020 5,355 440 48,815

LLOYDS BANKING GROUP PLC 2017 HALF-YEAR RESULTS
Page 58 of 90
CONSOLIDATED CASH FLOW STATEMENT
Half-year to Half-year to Half-year to 30 June 30 June 31 Dec 2017 2016 2016 £ million £ million £ million
Profit before tax 2,544 2,454 1,784
Adjustments for:
Change in operating assets (14,961) (18,311) 6,093
Change in operating liabilities (769) 31,794 (34,453)
Non-cash and other items 8,870 6,929 6,606
Tax paid (367) (262) (560)
Net cash provided by operating activities (4,683) 22,604 (20,530)
Cash flows from investing activities
Purchase of financial assets (1,847) (3,441) (1,489)
Proceeds from sale and maturity of financial assets 5,276 2,729 3,606
Purchase of fixed assets (1,960) (1,820) (1,940)
Proceeds from sale of fixed assets 763 909 775
Acquisition of businesses, net of cash acquired (1,909) (6) (14)
Disposal of businesses, net of cash disposed 26 5 –
Net cash used in investing activities 349 (1,624) 938
Cash flows from financing activities
Dividends paid to ordinary shareholders (1,568) (1,427) (587)
Distributions on other equity instruments (209) (204) (208)
Dividends paid to non-controlling interests – (2) (27)
Interest paid on subordinated liabilities (780) (946) (741)
Proceeds from issue of subordinated liabilities – 1,061 –
Repayment of subordinated liabilities (636) (4,678) (3,207)
Changes in non-controlling interests (3) (5) (3)
Net cash used in financing activities (3,196) (6,201) (4,773)
Effects of exchange rate changes on cash and cash equivalents – 15 6
Change in cash and cash equivalents (7,530) 14,794 (24,359)
Cash and cash equivalents at beginning of period 62,388 71,953 86,747
Cash and cash equivalents at end of period 54,858 86,747 62,388
Cash and cash equivalents comprise cash and balances at central banks (excluding mandatory deposits) and amounts
due from banks with a maturity of less than three months. Included within cash and cash equivalents at 30 June 2017 is
£2,579 million (30 June 2016: £12,613 million; 31 December 2016: £14,475 million) held within the Group’s life funds,
which is not immediately available for use in the business.

LLOYDS BANKING GROUP PLC 2017 HALF-YEAR RESULTS
Page 59 of 90
NOTES TO THE CONSOLIDATED FINANCIAL STATEMENTS
1. Accounting policies, presentation and estimates
These condensed consolidated half-year financial statements as at and for the period to 30 June 2017 have been
prepared in accordance with the Disclosure Guidance and Transparency Rules of the Financial Conduct Authority (FCA)
and with International Accounting Standard 34 (IAS 34), Interim Financial Reporting as adopted by the European Union
and comprise the results of Lloyds Banking Group plc (the Company) together with its subsidiaries (the Group). They do
not include all of the information required for full annual financial statements and should be read in conjunction with the
Group’s consolidated financial statements as at and for the year ended 31 December 2016 which were prepared in
accordance with International Financial Reporting Standards (IFRS) as adopted by the European Union. Copies of the
2016 Annual Report and Accounts are available on the Group’s website and are available upon request from Investor
Relations, Lloyds Banking Group plc, 25 Gresham Street, London EC2V 7HN.
The UK Finance Code for Financial Reporting Disclosure (the Disclosure Code) sets out disclosure principles together
with supporting guidance in respect of the financial statements of UK banks. The Group has adopted the Disclosure
Code and these condensed consolidated half-year financial statements have been prepared in compliance with the
Disclosure Code’s principles. Terminology used in these condensed consolidated half-year financial statements is
consistent with that used in the Group’s 2016 Annual Report and Accounts where a glossary of terms can be found.
The directors consider that it is appropriate to continue to adopt the going concern basis in preparing the condensed
consolidated half-year financial statements. In reaching this assessment, the directors have considered projections for
the Group’s capital and funding position and have had regard to the factors set out in Risk management: Principal risks
and uncertainties on page 26.
Except as noted below, the accounting policies are consistent with those applied by the Group in its 2016 Annual Report
and Accounts.
With effect from 1 January 2017 the Group has elected to early adopt the provision in IFRS 9 for gains and losses
attributable to changes in own credit risk on financial liabilities designated at fair value through profit or loss to be
presented in other comprehensive income. The impact has been to increase profit after tax and reduce other
comprehensive income by £32 million in the six months to 30 June 2017; there is no impact on total liabilities or
shareholders’ equity. Comparatives have not been restated.
The Group has had no material or unusual related party transactions during the six months to 30 June 2017. Related
party transactions for the six months to 30 June 2017 are similar in nature to those for the year ended 31 December
2016. Full details of the Group’s related party transactions for the year to 31 December 2016 can be found in the Group’s
2016 Annual Report and Accounts.
Future accounting developments
Details of those IFRS pronouncements which will be relevant to the Group but which will not be effective at 31 December
2017 and which have not been applied in preparing these financial statements are set out in note 20.
Critical accounting estimates and judgements
The preparation of the Group’s financial statements requires management to make judgements, estimates and
assumptions that impact the application of accounting policies and the reported amounts of assets, liabilities, income and
expenses. Due to the inherent uncertainty in making estimates, actual results reported in future periods may include
amounts which differ from those estimates. Estimates, judgements and assumptions are continually evaluated and are
based on historical experience and other factors, including expectations of future events that are believed to be
reasonable under the circumstances. There have been no significant changes in the basis upon which estimates have
been determined, compared to that applied at 31 December 2016.

LLOYDS BANKING GROUP PLC 2017 HALF-YEAR RESULTS
Page 60 of 90
2. Segmental analysis
Lloyds Banking Group provides a wide range of banking and financial services in the UK and in certain locations
overseas. The Group Executive Committee (GEC) remains the chief operating decision maker for the Group.
The segmental results and comparatives are presented on an underlying basis, the basis reviewed by the chief operating
decision maker. The effects of the redemption of the Group’s Enhanced Capital Notes, asset sales, volatile items, the
insurance grossing adjustment, liability management, restructuring costs, conduct provisions, the amortisation of
purchased intangible assets and the unwind of acquisition-related fair value adjustments are excluded in arriving at
underlying profit.
The Group’s activities are organised into four financial reporting segments: Retail; Commercial Banking; Consumer
Finance and Insurance. There has been no change to the descriptions of these segments as provided in note 4 to the
Group’s financial statements for the year ended 31 December 2016.
There has been no change to the Group’s segmental accounting for internal segment services or derivatives entered into
by units for risk management purposes since 31 December 2016.
Other Total income, income, Net net of net of Profit Inter- interest insurance insurance (loss) External segment income claims claims before tax revenue revenueHalf-year to 30 June 2017 £m £m £m £m £m £m Underlying basis Retail 3,337 477 3,814 1,598 4,177 (363)
Commercial Banking 1,425 1,100 2,525 1,437 1,703 822
Consumer Finance 1,041 755 1,796 759 2,082 (286)
Insurance (50) 872 822 408 1,036 (214)
Other 172 144 316 290 275 41
Group 5,925 3,348 9,273 4,492 9,273 –Reconciling items: Insurance grossing adjustment (608) 660 52 –
Market volatility and asset sales1 20 96 116 136
Amortisation of purchased intangibles – – – (38)
Restructuring costs2 – – – (321)
Fair value unwind and other items (135) (7) (142) (135)
Payment protection insurance provision – – – (1,050)
Other conduct provisions – – – (540)
Group − statutory 5,202 4,097 9,299 2,544
1 Comprises (i) gains on disposals of assets which are not part of normal business operations (£6 million); (ii) the net effect of banking
volatility and net derivative valuation adjustments (losses of £20 million); (iii) volatility relating to the insurance business (gains of £165 million); and (iv) the results of liability management exercises (losses of £15 million).
2 Comprises severance related costs relating to the Simplification programme, the costs of implementing regulatory reform andring-fencing, the rationalisation of the non-branch property portfolio and the integration of MBNA.

LLOYDS BANKING GROUP PLC 2017 HALF-YEAR RESULTS
Page 61 of 90
2. Segmental analysis (continued) Other Total income, income, Net net of net of Profit Inter- interest insurance insurance (loss) External segment income claims claims before tax revenue revenueHalf-year to 30 June 2016 £m £m £m £m £m £m Underlying basis Retail 3,296 558 3,854 1,548 4,333 (479)
Commercial Banking 1,306 982 2,288 1,236 2,137 151
Consumer Finance 994 658 1,652 690 1,942 (290)
Insurance (80) 921 841 446 300 541
Other 266 (26) 240 241 163 77
Group 5,782 3,093 8,875 4,161 8,875 –
Reconciling items:
Insurance grossing adjustment (423) 519 96 –
Enhanced Capital Notes1 – (790) (790) (790)
Market volatility and asset sales2 20 252 272 128
Amortisation of purchased intangibles – – – (168)
Restructuring costs3 – – – (307)
Fair value unwind (154) 36 (118) (110)
Other conduct provisions – (15) (15) (460)
Group − statutory 5,225 3,095 8,320 2,454
1 The loss relating to the ECNs was £790 million, representing the write-off of the embedded derivative and the premium paid on
redemption of the remaining notes. 2 Comprises (i) gains on disposals of assets which are not part of normal business operations (£335 million); (ii) the net effect of
banking volatility and net derivative valuation adjustments (gains of £19 million); (iii) volatility relating to the insurance business (losses of £372 million); and (iv) the results of liability management exercises (gains of £146 million).
3 Principally comprises the severance costs related to phase II of the Simplification programme.
Other Total income, income, Net net of net of Profit Inter- interest insurance insurance (loss) External segment income claims claims before tax revenue revenueHalf-year to 31 December 2016 £m £m £m £m £m £m Underlying basis Retail 3,201 495 3,696 1,455 4,127 (431)
Commercial Banking 1,429 1,005 2,434 1,232 1,531 903
Consumer Finance 947 680 1,627 593 1,943 (316)
Insurance (66) 834 768 391 1,011 (243)
Other 142 (42) 100 35 13 87
Group 5,653 2,972 8,625 3,706 8,625 –
Reconciling items:
Insurance grossing adjustment (1,475) 1,591 116 –
Market volatility and asset sales1 13 379 392 311
Amortisation of purchased intangibles – – – (172)
Restructuring costs – – – (315)
Fair value unwind and other items (142) 2 (140) (121)
Payment protection insurance provision – – – (1,000)
Other conduct provisions – (46) (46) (625)
Group − statutory 4,049 4,898 8,947 1,784
1 Comprises (i) losses on disposals of assets which are not part of normal business operations (£118 million); (ii) the net effect of
banking volatility and net derivative valuation adjustments (gains of £171 million); (iii) volatility relating to the insurance business (gains of £281 million); and (iv) the results of liability management exercises (losses of £23 million).

LLOYDS BANKING GROUP PLC 2017 HALF-YEAR RESULTS
Page 62 of 90
2. Segmental analysis (continued)
Segment external Segment customer Segment external
assets deposits liabilities At 30 June At 31 Dec At 30 June At 31 Dec At 30 June At 31 Dec 2017 2016 2017 2016 2017 2016 £m £m £m £m £m £m
Retail 297,958 300,085 269,405 271,005 272,870 275,006
Commercial Banking 181,962 188,296 138,764 132,628 226,383 221,395
Consumer Finance 52,540 40,992 7,134 7,920 11,028 12,494
Insurance 149,287 153,936 – – 142,529 146,836
Other 133,172 134,484 2,314 3,907 113,763 113,247
Total Group 814,919 817,793 417,617 415,460 766,573 768,978
3. Operating expenses
Half-year to Half-year to Half-year to 30 June 30 June 31 Dec 2017 2016 2016 £ million £ million £ million Administrative expenses
Staff costs:
Salaries and social security costs 1,769 1,782 1,806
Pensions and other post-retirement benefit schemes (note 13) 302 268 287
Restructuring and other staff costs 291 412 262
2,362 2,462 2,355
Premises and equipment 399 353 319
Other expenses:
Communications and data processing 415 403 445
UK bank levy – – 200
Other 655 675 661
1,070 1,078 1,306
3,831 3,893 3,980
Depreciation and amortisation 1,131 1,166 1,214
Total operating expenses, excluding regulatory provisions 4,962 5,059 5,194
Regulatory provisions:
Payment protection insurance provision (note 14) 1,050 – 1,000
Other regulatory provisions1 (note 14) 540 445 579
1,590 445 1,579
Total operating expenses 6,552 5,504 6,773
1 In addition, regulatory provisions of £15 million in the half-year to 30 June 2016 and £46 million in the half-year to 31 December 2016
were charged against income.

LLOYDS BANKING GROUP PLC 2017 HALF-YEAR RESULTS
Page 63 of 90
4. Impairment Half-year to Half-year to Half-year to 30 June 30 June 31 Dec 2017 2016 2016 £m £m £m Impairment losses on loans and receivables:
Loans and advances to customers 200 229 363
Debt securities classified as loans and receivables (4) – –
Impairment losses on loans and receivables (note 10) 196 229 363
Impairment of available-for-sale financial assets 6 146 27
Other credit risk provisions 1 (13) –
Total impairment charged to the income statement 203 362 390
5. Taxation
In accordance with IAS 34, the Group’s income tax expense for the half-year to 30 June 2017 is based on the best
estimate of the weighted-average annual income tax rate expected for the full financial year. The tax effects of one-off
items are not included in the weighted-average annual income tax rate, but are recognised in the relevant period.
An explanation of the relationship between tax expense and accounting profit is set out below:
Half-year to Half-year to Half-year to 30 June 30 June 31 Dec 2017 2016 2016 £m £m £m
Profit before tax 2,544 2,454 1,784 Tax thereon at UK corporation tax rate of 19.25 per cent (2016: 20 per cent) (490) (491) (357)Impact of bank surcharge (231) (59) (207)
Impact of changes in UK corporation tax rates (35) (3) (198)
Disallowed items1 (274) (122) (272)
Non-taxable items 55 47 28
Overseas tax rate differences 1 (6) 16
Gains exempted 69 8 11
Policyholder tax2 (37) (34) (207)
Tax losses not previously recognised 9 49 10
Adjustments in respect of previous years 26 10 54
Effect of results of joint ventures and associates 1 – (1)
Other items 1 4 (4)
Tax expense (905) (597) (1,127)
1 The Finance (No.2) Act 2015 introduced restrictions on the tax deductibility of provisions for conduct charges arising on or after 8 July
2015. This has resulted in tax of £237 million (half-year to 30 June 2016: £81 million; half-year to 31 December 2016: £138 million). 2 In the half-year to 31 December 2016 this included a £231 million write down of the deferred tax asset held within the life business,
reflecting the Group’s utilisation estimate which has been restricted by the current economic environment.
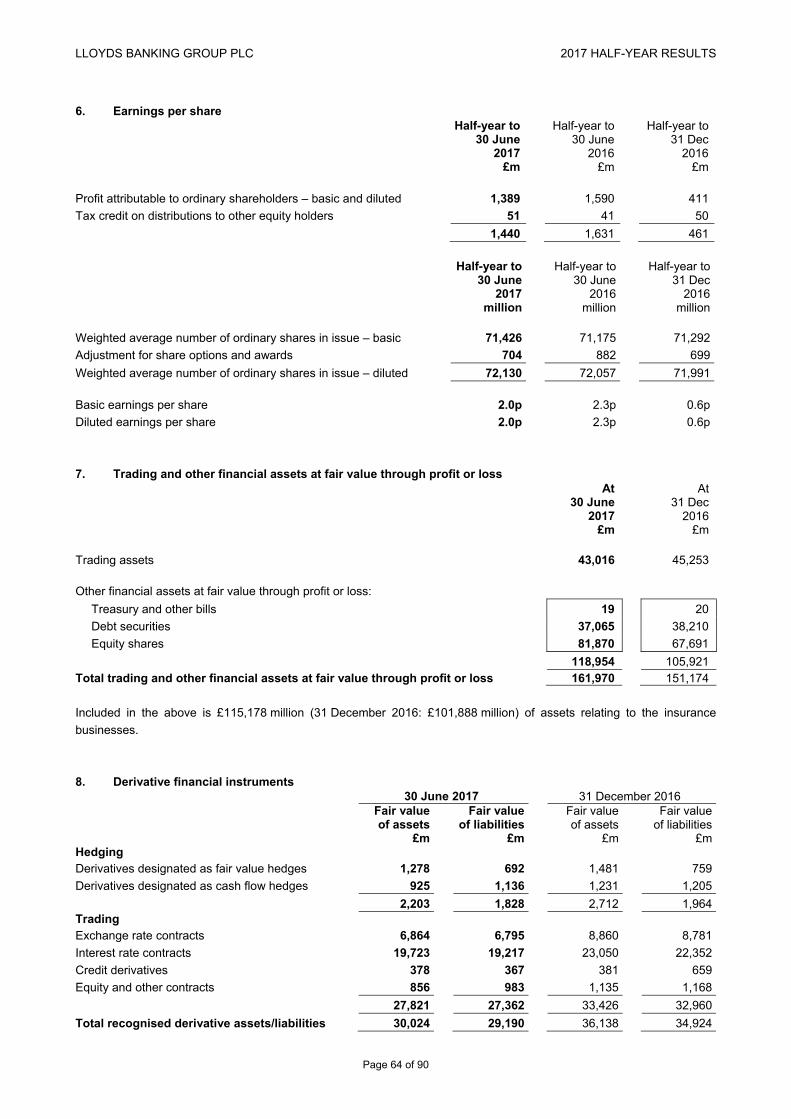
LLOYDS BANKING GROUP PLC 2017 HALF-YEAR RESULTS
Page 64 of 90
6. Earnings per share Half-year to Half-year to Half-year to 30 June 30 June 31 Dec 2017 2016 2016 £m £m £m Profit attributable to ordinary shareholders – basic and diluted 1,389 1,590 411
Tax credit on distributions to other equity holders 51 41 50
1,440 1,631 461
Half-year to Half-year to Half-year to 30 June 30 June 31 Dec 2017 2016 2016 million million million
Weighted average number of ordinary shares in issue – basic 71,426 71,175 71,292
Adjustment for share options and awards 704 882 699
Weighted average number of ordinary shares in issue – diluted 72,130 72,057 71,991 Basic earnings per share 2.0p 2.3p 0.6p
Diluted earnings per share 2.0p 2.3p 0.6p
7. Trading and other financial assets at fair value through profit or loss At At 30 June 31 Dec 2017 2016 £m £m Trading assets 43,016 45,253 Other financial assets at fair value through profit or loss:
Treasury and other bills 19 20
Debt securities 37,065 38,210
Equity shares 81,870 67,691
118,954 105,921 Total trading and other financial assets at fair value through profit or loss 161,970 151,174
Included in the above is £115,178 million (31 December 2016: £101,888 million) of assets relating to the insurance
businesses.
8. Derivative financial instruments 30 June 2017 31 December 2016 Fair value Fair value Fair value Fair value of assets of liabilities of assets of liabilities £m £m £m £mHedging Derivatives designated as fair value hedges 1,278 692 1,481 759
Derivatives designated as cash flow hedges 925 1,136 1,231 1,205
2,203 1,828 2,712 1,964Trading Exchange rate contracts 6,864 6,795 8,860 8,781
Interest rate contracts 19,723 19,217 23,050 22,352
Credit derivatives 378 367 381 659
Equity and other contracts 856 983 1,135 1,168
27,821 27,362 33,426 32,960
Total recognised derivative assets/liabilities 30,024 29,190 36,138 34,924
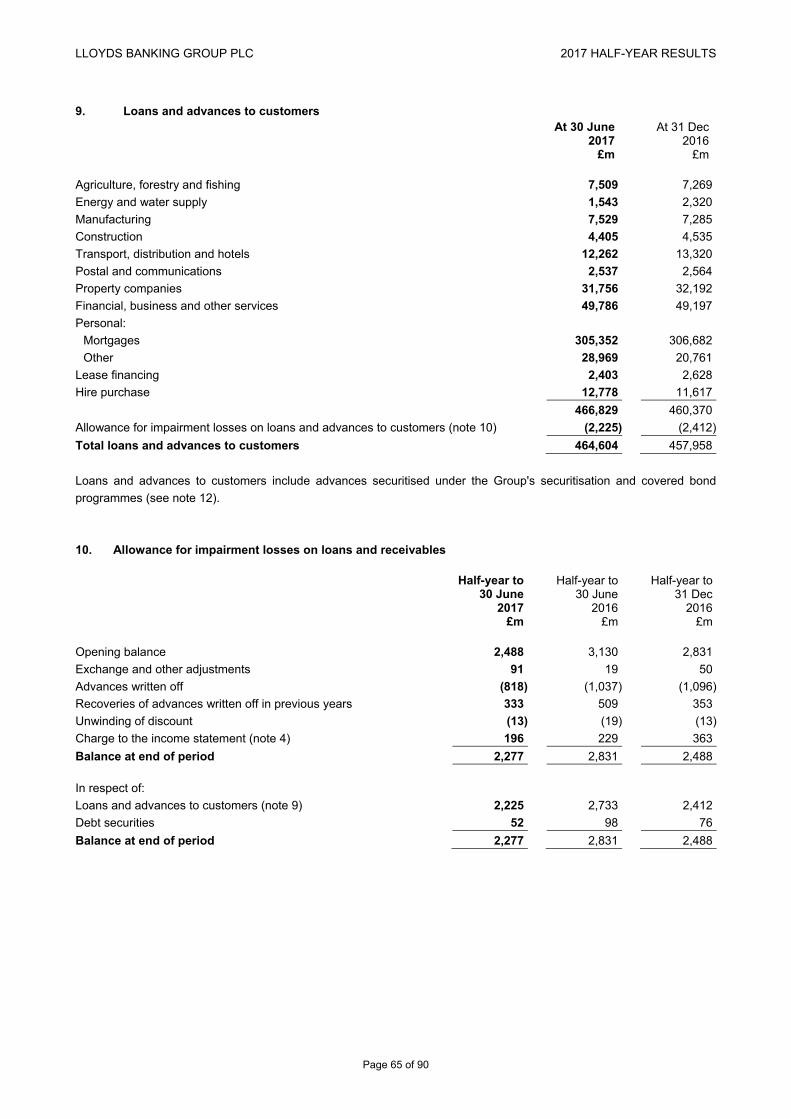
LLOYDS BANKING GROUP PLC 2017 HALF-YEAR RESULTS
Page 65 of 90
9. Loans and advances to customers At 30 June At 31 Dec 2017 2016 £m £m Agriculture, forestry and fishing 7,509 7,269
Energy and water supply 1,543 2,320
Manufacturing 7,529 7,285
Construction 4,405 4,535
Transport, distribution and hotels 12,262 13,320
Postal and communications 2,537 2,564
Property companies 31,756 32,192
Financial, business and other services 49,786 49,197
Personal:
Mortgages 305,352 306,682
Other 28,969 20,761
Lease financing 2,403 2,628
Hire purchase 12,778 11,617
466,829 460,370
Allowance for impairment losses on loans and advances to customers (note 10) (2,225) (2,412)
Total loans and advances to customers 464,604 457,958
Loans and advances to customers include advances securitised under the Group's securitisation and covered bond
programmes (see note 12).
10. Allowance for impairment losses on loans and receivables Half-year to Half-year to Half-year to 30 June 30 June 31 Dec 2017 2016 2016 £m £m £m Opening balance 2,488 3,130 2,831
Exchange and other adjustments 91 19 50
Advances written off (818) (1,037) (1,096)
Recoveries of advances written off in previous years 333 509 353
Unwinding of discount (13) (19) (13)
Charge to the income statement (note 4) 196 229 363
Balance at end of period 2,277 2,831 2,488 In respect of:
Loans and advances to customers (note 9) 2,225 2,733 2,412
Debt securities 52 98 76
Balance at end of period 2,277 2,831 2,488

LLOYDS BANKING GROUP PLC 2017 HALF-YEAR RESULTS
Page 66 of 90
11. Acquisition of MBNA
On 1 June 2017, following the receipt of competition and regulatory approval, the Group acquired 100 per cent of the
ordinary share capital of MBNA Limited (MBNA), which together with its subsidiaries undertakes a UK consumer credit
card business, from FIA Jersey Holdings Limited, a wholly-owned subsidiary of Bank of America. The total fair value of
the purchase consideration was £2,016 million, settled in cash.
The table below sets out the fair value of the identifiable assets and liabilities acquired. The initial accounting for the
acquisition has been determined provisionally because of its complexity and the limited time available between the
acquisition date and the preparation of these condensed consolidated interim financial statements.
Book value Provisional Fair value as at 1 June fair value as at 1 June 2017 adjustments 2017 £m £m £m Assets Loans and advances to customers 7,466 345 7,811
Available-for-sale financial assets 16 – 16
Other intangible assets – 702 702
Other assets 217 345 562
Total assets 7,699 1,392 9,091 Liabilities Deposits from banks1 6,431 – 6,431
Other liabilities 115 184 299
Other provisions 233 395 628
Total liabilities 6,779 579 7,358 Provisional fair value of net assets acquired 920 813 1,733 Goodwill arising on acquisition 283
Total consideration 2,016 1 Upon acquisition, the funding of MBNA was assumed by Lloyds Bank plc.
The post-acquisition profit before tax of MBNA covering the period from 1 June 2017 to 30 June 2017, which is included
in the Group statutory consolidated income statement for the half-year to 30 June 2017, is £18 million.
Had the acquisition date of MBNA been 1 January 2017, the Group’s consolidated total income would have been
£329 million higher at £17,604 million and the Group’s consolidated profit before tax would have been £112 million higher
at £2,656 million.

LLOYDS BANKING GROUP PLC 2017 HALF-YEAR RESULTS
Page 67 of 90
12. Debt securities in issue
30 June 2017 31 December 2016
At fair value
At fair value
through At through At profit or amortised profit or amortised loss cost Total loss cost Total £m £m £m £m £m £m Medium-term notes issued 8,223 25,741 33,964 9,423 27,182 36,605
Covered bonds – 25,937 25,937 – 30,521 30,521
Certificates of deposit – 10,994 10,994 – 8,077 8,077
Securitisation notes – 5,105 5,105 – 7,253 7,253
Commercial paper – 3,780 3,780 – 3,281 3,281
8,223 71,557 79,780 9,423 76,314 85,737
The notes issued by the Group’s securitisation and covered bond programmes are held by external parties and by
subsidiaries of the Group.
Securitisation programmes
At 30 June 2017, external parties held £5,105 million (31 December 2016: £7,253 million) and the Group’s subsidiaries
held £25,244 million (31 December 2016: £26,435 million) of total securitisation notes in issue of £30,349 million
(31 December 2016: £33,688 million). The notes are secured on loans and advances to customers and debt securities
classified as loans and receivables amounting to £49,284 million (31 December 2016: £52,184 million), the majority of
which have been sold by subsidiary companies to bankruptcy remote structured entities. The structured entities are
consolidated fully and all of these loans are retained on the Group's balance sheet.
Covered bond programmes
At 30 June 2017, external parties held £25,937 million (31 December 2016: £30,521 million) and the Group’s subsidiaries
held £700 million (31 December 2016: £700 million) of total covered bonds in issue of £26,637 million (31 December
2016: £31,221 million). The bonds are secured on certain loans and advances to customers amounting to
£33,170 million (31 December 2016: £35,968 million) that have been assigned to bankruptcy remote limited liability
partnerships. These loans are retained on the Group's balance sheet.
Cash deposits of £5,065 million (31 December 2016: £9,018 million) which support the debt securities issued by the
structured entities, the term advances related to covered bonds and other legal obligations are held by the Group.

LLOYDS BANKING GROUP PLC 2017 HALF-YEAR RESULTS
Page 68 of 90
13. Post-retirement defined benefit schemes
The Group’s post-retirement defined benefit scheme obligations are comprised as follows:
At At 30 June 31 Dec 2017 2016 £m £mDefined benefit pension schemes:
- Fair value of scheme assets 44,721 45,578
- Present value of funded obligations (44,980) (45,822)
Net pension scheme liability (259) (244)
Other post-retirement schemes (236) (236)
Net retirement benefit liability (495) (480)
Recognised on the balance sheet as:
Retirement benefit assets 410 342
Retirement benefit obligations (905) (822)
Net retirement benefit liability (495) (480)
The movement in the Group’s net post-retirement defined benefit scheme liability during the period was as follows:
£m Liability at 1 January 2017 (480)
Income statement charge (181)
Employer contributions 290
Remeasurement (124)
Liability at 30 June 2017 (495)
The charge to the income statement in respect of pensions and other post-retirement benefit schemes is comprised as
follows: Half-year to Half-year to Half-year to 30 June 30 June 31 Dec 2017 2016 2016 £m £m £m Defined benefit pension schemes 181 136 151
Defined contribution schemes 121 132 136
Total charge to the income statement (note 3) 302 268 287
The principal assumptions used in the valuations of the defined benefit pension schemes were as follows:
At At 30 June 31 Dec 2017 2016 % % Discount rate 2.71 2.76Rate of inflation:
Retail Prices Index 3.18 3.23
Consumer Price Index 2.13 2.18
Rate of salary increases 0.00 0.00
Weighted-average rate of increase for pensions in payment 2.71 2.74

LLOYDS BANKING GROUP PLC 2017 HALF-YEAR RESULTS
Page 69 of 90
14. Provisions for liabilities and charges
Payment protection insurance (excluding MBNA)
The Group increased the provision for PPI costs by a further £1,050 million in the half-year to 30 June 2017, of which
£700 million was in the second quarter, bringing the total amount provided to £18,075 million.
The charge in the second quarter is largely driven by a potentially higher total volume of complaints and associated
operating costs due to higher reactive complaint volumes received over the past three quarters, which have averaged
approximately 9,000 per week. As previously announced, £350 million was taken in the first quarter to reflect the impact
of the Financial Conduct Authority’s (FCA) rules and guidance published on 2 March 2017 (Policy Statement 17/3), which
confirmed a two month extension to the time bar to the end of August 2019.
At 30 June 2017 a provision of £2,647 million remained unutilised relating to complaints and associated administration
costs. The provision is consistent with total expected complaint volumes of 5.3 million (including complaints falling under
the Plevin rules and guidance) with approximately 1.2 million still expected to be received including approximately
9,000 reactive complaints per week through to August 2019. Total cash payments were £661 million during the half-year
to 30 June 2017.
Sensitivities
The Group estimates that it has sold approximately 16 million PPI policies since 2000. These include policies that were
not mis-sold and those that have been successfully claimed upon. Since the commencement of the PPI redress
programme in 2011 the Group estimates that it has contacted, settled or provided for approximately 52 per cent of the
policies sold since 2000.
The total amount provided for PPI represents the Group’s best estimate of the likely future cost. However a number of
risks and uncertainties remain in particular with respect to future volumes. The cost could differ from the Group’s
estimates and the assumptions underpinning them, and could result in a further provision being required. There is
significant uncertainty around the impact of the regulatory changes, FCA media campaign and Claims Management
Companies and customer activity.
Key metrics and sensitivities are highlighted in the table below:
Sensitivities
(exclude claims where no PPI policy was held) Actuals to date Anticipated future2 Sensitivity2,3
Customer initiated complaints since origination (m)1 4.1 1.2 0.1 = £215m
Administrative expenses (£m) 3,350 525 1 case = £450
1 Sensitivity includes complaint handling costs. 2 Anticipated future and sensitivities are impacted by a proportion of complaints and re-complaints falling under the Plevin rules and
guidance in light of the FCA Policy Statement PS 17/3. 3 Average redress and uphold rates remain stable.
Payment protection insurance (MBNA)
With regard to MBNA, as announced in December 2016, the Group’s exposure is capped at £240 million through an
indemnity received from Bank of America.

LLOYDS BANKING GROUP PLC 2017 HALF-YEAR RESULTS
Page 70 of 90
14. Provisions for liabilities and charges (continued)
Other provisions for legal actions and regulatory matters
Packaged bank accounts
In the half-year to 30 June 2017 the Group has provided an additional £95 million in respect of complaints relating to
alleged mis-selling of packaged bank accounts raising the total amount provided to £600 million. As at 30 June 2017,
£182 million of the provision remained unutilised. The total amount provided represents the Group’s best estimate of the
likely future cost, however a number of risks and uncertainties remain in particular with respect to future volumes.
Arrears handling related activities
The Group has provided an additional £155 million in the half-year to 30 June 2017 (bringing the total provision to £552 million), for the costs of identifying and rectifying certain arrears management fees and activities. Following a review of the Group’s arrears handling activities, the Group has put in place a number of actions to improve further its handling of customers in these areas and the Group is reimbursing mortgage arrears fees to around 590,000 customers. As at 30 June 2017, the unutilised provision was £518 million.
Customer claims in relation to insurance branch business in Germany
The Group continues to receive claims in Germany from customers relating to policies issued by Clerical Medical
Investment Group Limited (subsequently renamed Scottish Widows Limited). The German industry-wide issue regarding
notification of contractual ‘cooling off’ periods continued to lead to an increasing number of claims in 2016. Up to
31 December 2016 the Group had provided a total of £639 million, no further amounts have been provided in the
half-year to 30 June 2017. The remaining unutilised provision as at 30 June 2017 was £156 million (31 December 2016
is £168 million). The validity of the claims facing the Group depends upon the facts and circumstances in respect of each
claim. As a result the ultimate financial effect, which could be significantly different from the current provision, will be
known only once all relevant claims have been resolved.
HBOS Reading – customer review
The Group has commenced a review into a number of customer cases from the former HBOS Impaired Assets Office
based in Reading. This review follows the conclusion of a criminal trial in which a number of individuals, including two
former HBOS employees, were convicted of conspiracy to corrupt, fraudulent trading and associated money laundering
offences which occurred prior to the acquisition of HBOS by the Group in 2009. The review is ongoing, the Group has
provided £100 million in the half-year to 30 June 2017 and is in the process of paying compensation to the victims of the
fraud for economic losses, ex-gratia payments and awards for distress and inconvenience.
Other legal actions and regulatory matters
In the course of its business, the Group is engaged in discussions with the PRA, FCA and other UK and overseas
regulators and other governmental authorities on a range of matters. The Group also receives complaints and claims
from customers in connection with its past conduct and, where significant, provisions are held against the costs expected
to be incurred as a result of the conclusions reached. In the half-year to 30 June 2017, the Group charged an additional
£190 million in respect of matters across all divisions. At 30 June 2017, the Group held unutilised provisions totalling
£589 million for these other legal actions and regulatory matters.

LLOYDS BANKING GROUP PLC 2017 HALF-YEAR RESULTS
Page 71 of 90
15. Contingent liabilities and commitments
Interchange fees
With respect to multi-lateral interchange fees (MIFs), the Group is not directly involved in the ongoing investigations and
litigation (as described below) which involve card schemes such as Visa and MasterCard. However, the Group is a
member of Visa and MasterCard and other card schemes.
The European Commission continues to pursue certain competition investigations into MasterCard and Visa probing,
amongst other things, MIFs paid in respect of cards issued outside the EEA;
Litigation continues in the English Courts against both Visa and MasterCard. This litigation has been brought by
several retailers who are seeking damages for allegedly ‘overpaid’ MIFs. From publicly available information, it is
understood these damages claims are running to different timescales with respect to the litigation process. It is also
possible that new claims may be issued.
Any ultimate impact on the Group of the above investigations and the litigation against Visa and MasterCard remains
uncertain at this time.
Visa Inc completed its acquisition of Visa Europe on 21 June 2016. The Group’s share of the sale proceeds comprised
cash consideration of approximately £330 million (of which approximately £300 million was received on completion of the
sale and £30 million is deferred for three years) and preferred stock, which the Group measures at fair value. The
preferred stock is convertible into Class A Common Stock of Visa Inc or its equivalent upon the occurrence of certain
events. As part of this transaction, the Group and certain other UK banks also entered into a Loss Sharing Agreement
(LSA) with Visa Inc, which clarifies the allocation of liabilities between the parties should the litigation referred to above
result in Visa Inc being liable for damages payable by Visa Europe. The maximum amount of liability to which the Group
may be subject under the LSA is capped at the cash consideration which was received by the Group at completion. Visa
Inc may also have recourse to a general indemnity, previously in place under Visa Europe’s Operating Regulations, for
damages claims concerning inter or intra-regional MIF setting activities.
LIBOR and other trading rates
In July 2014, the Group announced that it had reached settlements totalling £217 million (at 30 June 2014 exchange
rates) to resolve with UK and US federal authorities legacy issues regarding the manipulation several years ago of Group
companies’ submissions to the British Bankers’ Association (BBA) London Interbank Offered Rate (LIBOR) and Sterling
Repo Rate. The Group continues to cooperate with various other government and regulatory authorities, including the
Serious Fraud Office, the Swiss Competition Commission, and a number of US State Attorneys General, in conjunction
with their investigations into submissions made by panel members to the bodies that set LIBOR and various other
interbank offered rates.
Certain Group companies, together with other panel banks, have also been named as defendants in private lawsuits,
including purported class action suits, in the US in connection with their roles as panel banks contributing to the setting of
US Dollar, Japanese Yen and Sterling LIBOR and the Australian BBSW Reference Rate. The lawsuits, which contain
broadly similar allegations, allege violations of the Sherman Antitrust Act, the Racketeer Influenced and Corrupt
Organizations Act and the Commodity Exchange Act, as well as various state statutes and common law doctrines.
Certain of the plaintiffs’ claims, including those in connection with USD and JPY LIBOR, have been dismissed by the US
Federal Court for Southern District of New York. Appeals remain possible.
Certain Group companies are also named as defendants in UK based claims raising LIBOR manipulation allegations.
It is currently not possible to predict the scope and ultimate outcome on the Group of the various outstanding regulatory
investigations not encompassed by the settlements, any private lawsuits or any related challenges to the interpretation or
validity of any of the Group’s contractual arrangements, including their timing and scale.

LLOYDS BANKING GROUP PLC 2017 HALF-YEAR RESULTS
Page 72 of 90
15. Contingent liabilities and commitments (continued)
UK shareholder litigation
In August 2014, the Group and a number of former directors were named as defendants in a claim filed in the English
High Court by a number of claimants who held shares in Lloyds TSB Group plc (LTSB) prior to the acquisition of HBOS
plc, alleging breaches of duties in relation to information provided to shareholders in connection with the acquisition and
the recapitalisation of LTSB. It is currently not possible to determine the ultimate impact on the Group (if any), but the
Group intends to defend the claim vigorously.
Financial Services Compensation Scheme
Following the default of a number of deposit takers in 2008, the Financial Services Compensation Scheme (FSCS)
borrowed funds from HM Treasury to meet the compensation costs for customers of those firms. In June 2017, the FSCS
announced that following the sale of certain Bradford & Bingley mortgage assets, the principal balance outstanding on
these loans was £4,678 million (31 December 2016: £15,655 million). Although it is anticipated that the substantial
majority of this loan will be repaid from funds the FSCS receives from asset sales, surplus cash flow or other recoveries
in relation to the assets of the firms that defaulted, any shortfall will be funded by deposit-taking participants, including
the Group, of the FSCS. The amount of future levies payable by the Group depends on a number of factors, principally,
the amounts recovered by the FSCS from asset sales.
Tax authorities
The Group has an open matter in relation to a claim for group relief of losses incurred in its former Irish banking
subsidiary, which ceased trading on 31 December 2010. In 2013 HMRC informed the Group that their interpretation of
the UK rules which allow the offset of such losses denies the claim. If HMRC’s position is found to be correct
management estimate that this would result in an increase in current tax liabilities of approximately £650 million and a
reduction in the Group’s deferred tax asset of approximately £350 million. The Group does not agree with HMRC's
position and, having taken appropriate advice, does not consider that this is a case where additional tax will ultimately fall
due. There are a number of other open matters on which the Group is in discussion with HMRC (including the tax
treatment of certain costs arising from the divestment of TSB Banking Group plc), none of which is expected to have a
material impact on the financial position of the Group.
Residential mortgage repossessions
In August 2014, the Northern Ireland High Court handed down judgment in favour of the borrowers in relation to three
residential mortgage test cases concerning certain aspects of the Group’s practice with respect to the recalculation of
contractual monthly instalments of customers in arrears. The FCA is actively engaged with the industry in relation to
these considerations and has recently published Guidance on the treatment of customers with mortgage payment
shortfalls. The Guidance covers remediation for mortgage customers who may have been affected by the way firms
calculate these customers’ monthly mortgage instalments. The Group is now determining its detailed approach to
implementation of the Guidance and will contact affected customers next year.
Update following the Financial Conduct Authority’s publication of Policy Statement 17/3
On 2 August 2016, the Financial Conduct Authority (FCA) published a further consultation paper (CP16/20: Rules and
guidance on payment protection insurance complaints: feedback on CP15/39 and further consultation), following on from
the original consultation published in November 2015.
On 2 March 2017 the FCA confirmed that the deadline by which consumers would need to make their PPI complaints
would be 29 August 2019, and new rules with respect to the UK Supreme Court’s decision in Plevin v Paragon Personal
Finance Limited [2014] UKSC 61 would come into force on 29 August 2017.

LLOYDS BANKING GROUP PLC 2017 HALF-YEAR RESULTS
Page 73 of 90
15. Contingent liabilities and commitments (continued)
On 31 May 2017 an application for judicial review of Policy Statement 17/3 was filed in the High Court of England and
Wales, which subject to the Court’s determination may have an impact on the implementation of the FCA’s rules and
guidance in Policy Statement 17/3.
Mortgage arrears handling activities
On 26 May 2016, the Group was informed that an enforcement team at the FCA had commenced an investigation in
connection with the Group’s mortgage arrears handling activities. This investigation is ongoing and it is currently not
possible to make a reliable assessment of the liability, if any, that may result from the investigation.
Other legal actions and regulatory matters
In addition, during the ordinary course of business the Group is subject to other complaints and threatened or actual legal
proceedings (including class or group action claims) brought by or on behalf of current or former employees, customers,
investors or other third parties, as well as legal and regulatory reviews, challenges, investigations and enforcement
actions, both in the UK and overseas. All such material matters are periodically reassessed, with the assistance of
external professional advisers where appropriate, to determine the likelihood of the Group incurring a liability. In those
instances where it is concluded that it is more likely than not that a payment will be made, a provision is established to
management's best estimate of the amount required at the relevant balance sheet date. In some cases it will not be
possible to form a view, for example because the facts are unclear or because further time is needed properly to assess
the merits of the case, and no provisions are held in relation to such matters. In these circumstances, specific disclosure
in relation to a contingent liability will be made where material. However the Group does not currently expect the final
outcome of any such case to have a material adverse effect on its financial position, operations or cash flows.
Contingent liabilities and commitments arising from the banking business At 30 June At 31 Dec 2017 2016 £m £m Contingent liabilities
Acceptances and endorsements 29 21
Other:
Other items serving as direct credit substitutes 600 779
Performance bonds and other transaction-related contingencies 2,227 2,237
2,827 3,016
Total contingent liabilities 2,856 3,037 Commitments
Documentary credits and other short-term trade-related transactions 1 –
Forward asset purchases and forward deposits placed 365 648 Undrawn formal standby facilities, credit lines and other commitments to lend:
Less than 1 year original maturity:
Mortgage offers made 12,014 10,749
Other commitments 84,432 62,697
96,446 73,446
1 year or over original maturity 36,838 40,074
Total commitments 133,650 114,168
Of the amounts shown above in respect of undrawn formal standby facilities, credit lines and other commitments to lend,
£61,921 million (31 December 2016: £63,203 million) was irrevocable.

LLOYDS BANKING GROUP PLC 2017 HALF-YEAR RESULTS
Page 74 of 90
16. Fair values of financial assets and liabilities
The valuations of financial instruments have been classified into three levels according to the quality and reliability of
information used to determine those fair values. Note 49 to the Group’s 2016 financial statements describes the
definitions of the three levels in the fair value hierarchy.
Valuation control framework
Key elements of the valuation control framework, which covers processes for all levels in the fair value hierarchy
including level 3 portfolios, include model validation (incorporating pre-trade and post-trade testing), product
implementation review and independent price verification. Formal committees meet quarterly to discuss and approve
valuations in more judgemental areas.
Transfers into and out of level 3 portfolios
Transfers out of level 3 portfolios arise when inputs that could have a significant impact on the instrument’s valuation
become market observable; conversely, transfers into the portfolios arise when consistent sources of data cease to be
available.
Valuation methodology
For level 2 and level 3 portfolios, there is no significant change to what was disclosed in the Group’s 2016 Annual Report
and Accounts in respect of the valuation methodology (techniques and inputs) applied to such portfolios.
The table below summarises the carrying values of financial assets and liabilities presented on the Group’s balance
sheet. The fair values presented in the table are at a specific date and may be significantly different from the amounts
which will actually be paid or received on the maturity or settlement date.
30 June 2017 31 December 2016 Carrying Fair Carrying Fair value value value value £m £m £m £mFinancial assets
Trading and other financial assets at fair value through
profit or loss 161,970 161,970 151,174 151,174
Derivative financial instruments 30,024 30,024 36,138 36,138
Loans and receivables:
Loans and advances to banks 8,865 8,852 26,902 26,812
Loans and advances to customers 464,604 464,629 457,958 457,461
Debt securities 3,841 3,774 3,397 3,303
Available-for-sale financial instruments 51,803 51,803 56,524 56,524
Financial liabilities
Deposits from banks 24,879 24,855 16,384 16,395
Customer deposits 417,617 418,050 415,460 416,490
Trading and other financial liabilities at fair value through
profit or loss 55,671 55,671 54,504 54,504
Derivative financial instruments 29,190 29,190 34,924 34,924
Debt securities in issue 71,557 74,707 76,314 79,650
Liabilities arising from non-participating investment contracts 15,652 15,652 20,112 20,112
Subordinated liabilities 18,575 22,032 19,831 22,395
The carrying amount of the following financial instruments is a reasonable approximation of fair value: cash and balances
at central banks, items in the course of collection from banks, items in course of transmission to banks and notes in
circulation.
The Group manages valuation adjustments for its derivative exposures on a net basis; the Group determines their fair
values on the basis of their net exposures. In all other cases, fair values of financial assets and liabilities measured at fair
value are determined on the basis of their gross exposures.

LLOYDS BANKING GROUP PLC 2017 HALF-YEAR RESULTS
Page 75 of 90
16. Fair values of financial assets and liabilities (continued)
The following tables provide an analysis of the financial assets and liabilities of the Group that are carried at fair value in
the Group’s consolidated balance sheet, grouped into levels 1 to 3 based on the degree to which the fair value is
observable.
Financial assets Level 1 Level 2 Level 3 Total £m £m £m £mAt 30 June 2017
Trading and other financial assets at fair value through profit or loss: Loans and advances to customers – 27,839 – 27,839
Loans and advances to banks – 1,446 – 1,446
Debt securities 25,768 22,897 2,126 50,791
Equity shares 80,252 31 1,592 81,875
Treasury and other bills 19 – – 19
Total trading and other financial assets at fair value through profit or loss 106,039 52,213 3,718 161,970
Available-for-sale financial assets:
Debt securities 44,717 5,865 114 50,696
Equity shares 527 34 546 1,107
Total available-for-sale financial assets 45,244 5,899 660 51,803
Derivative financial instruments 123 28,789 1,112 30,024
Total financial assets carried at fair value 151,406 86,901 5,490 243,797 At 31 December 2016
Trading and other financial assets at fair value
through profit or loss:
Loans and advances to customers – 30,473 – 30,473
Loans and advances to banks – 2,606 – 2,606
Debt securities 25,075 23,010 2,293 50,378
Equity shares 66,147 37 1,513 67,697
Treasury and other bills 20 – – 20
Total trading and other financial assets at fair value through profit or loss 91,242 56,126 3,806 151,174
Available-for-sale financial assets:
Debt securities 48,649 6,529 133 55,311
Equity shares 435 17 761 1,213
Total available-for-sale financial assets 49,084 6,546 894 56,524
Derivative financial instruments 270 34,469 1,399 36,138
Total financial assets carried at fair value 140,596 97,141 6,099 243,836

LLOYDS BANKING GROUP PLC 2017 HALF-YEAR RESULTS
Page 76 of 90
16. Fair values of financial assets and liabilities (continued)
Financial liabilities Level 1 Level 2 Level 3 Total £m £m £m £m At 30 June 2017
Trading and other financial liabilities at fair value through profit or loss: Liabilities held at fair value through profit or loss – 8,223 – 8,223
Trading liabilities 2,375 45,073 – 47,448
Total trading and other financial liabilities at fair value through profit or loss 2,375 53,296 – 55,671
Derivative financial instruments 360 28,070 760 29,190
Total financial liabilities carried at fair value 2,735 81,366 760 84,861 At 31 December 2016
Trading and other financial liabilities at fair value
through profit or loss:
Liabilities held at fair value through profit or loss – 9,423 2 9,425
Trading liabilities 2,417 42,662 – 45,079
Total trading and other financial liabilities at fair value through profit or loss 2,417 52,085 2 54,504
Derivative financial instruments 358 33,606 960 34,924
Total financial liabilities carried at fair value 2,775 85,691 962 89,428
Financial guarantees are recognised at fair value on initial recognition and are classified as level 3; the balance is not
material.

LLOYDS BANKING GROUP PLC 2017 HALF-YEAR RESULTS
Page 77 of 90
16. Fair values of financial assets and liabilities (continued)
Movements in level 3 portfolio
The tables below analyse movements in the level 3 financial assets portfolio.
Trading and other Total financial Available- financial assets at fair for-sale assets value through financial Derivative carried at profit or loss assets assets fair value £m £m £m £m At 1 January 2017 3,806 894 1,399 6,099
Exchange and other adjustments (4) (15) 18 (1)
Gains (losses) recognised in the income statement within other income 11 – (226) (215)
Gains (losses) recognised in other comprehensive income within the revaluation reserve in respect of available-for-sale financial assets – (199) – (199)Purchases 303 24 5 332
Sales (331) (23) (40) (394)
Transfers into the level 3 portfolio 56 – – 56
Transfers out of the level 3 portfolio (123) (21) (44) (188)
At 30 June 2017 3,718 660 1,112 5,490
Gains (losses) recognised in the income statement within other income relating to those assets held at 30 June 2017 234 – (227) 7 Trading and other Total financial Available- financial assets at fair for-sale assets value through financial Derivative carried at profit or loss assets assets fair value £m £m £m £m At 1 January 2016 5,116 684 1,469 7,269Exchange and other adjustments 6 1 61 68
Gains recognised in the income statement within other income 317 – 478 795
Gains recognised in other comprehensive income within the revaluation reserve in respect of available-for-sale financial assets – 248 – 248Purchases 335 204 6 545Sales (2,031) (494) (35) (2,560)
Derecognised pursuant to tender offers and redemptions in respect of Enhanced Capital Notes – – (476) (476)Transfers into the level 3 portfolio 187 136 45 368Transfers out of the level 3 portfolio (159) – (3) (162)
At 30 June 2016 3,771 779 1,545 6,095
Gains recognised in the income statement within other income relating to those assets held at 30 June 2016 373 – 635 1,008

LLOYDS BANKING GROUP PLC 2017 HALF-YEAR RESULTS
Page 78 of 90
16. Fair values of financial assets and liabilities (continued)
The tables below analyse movements in the level 3 financial liabilities portfolio.
Trading and other financial Total liabilities at financial fair value liabilities through Derivative carried at profit or loss liabilities fair value £m £m £m
At 1 January 2017 2 960 962
Exchange and other adjustments – 14 14Gains recognised in the income statement within other income (2) (207) (209)Additions – 19 19
Redemptions – (26) (26)
Transfers into the level 3 portfolio – – –
Transfers out of the level 3 portfolio – – –
At 30 June 2017 – 760 760
Gains recognised in the income statement within other income relating to those liabilities held at 30 June 2017 – (209) (209)
Trading and other financial Total liabilities at financial fair value liabilities through Derivative carried at profit or loss liabilities fair value £m £m £m
At 1 January 2016 1 723 724
Exchange and other adjustments – 43 43
Losses recognised in the income statement within other income 1 606 607
Additions – 10 10
Redemptions – (52) (52)
At 30 June 2016 2 1,330 1,332
Losses recognised in the income statement within other income relating to those liabilities held at 30 June 2016 1 592 593

LLOYDS BANKING GROUP PLC 2017 HALF-YEAR RESULTS
Page 79 of 90
16. Fair values of financial assets and liabilities (continued)
The tables below set out the effects of reasonably possible alternative assumptions for categories of level 3 financial
assets and financial liabilities which have an aggregated carrying value greater than £500 million.
At 30 June 2017 Effect of reasonably possible alternative assumptions1
Significant Valuation unobservable Carrying Favourable Unfavourable technique(s) inputs Range2 value changes changes £m £m £mTrading and other financial assets at fair value through profit or loss: Equity and venture capital investments
Market approach Earnings multiple 0.9/18.0 2,136 69 (69)
Unlisted equities and debt securities, property partnerships in the life funds
Underlying asset/net asset value (incl. property prices)3
n/a
n/a
1,458 − (84)Other 124
3,718
Available-for-sale financial assets 660 52 (52)
Derivative financial assets: Interest rate derivatives Option pricing
model Interest rate volatility 0%/136% 1,112 11 (4)
1,112
Financial assets carried at fair value 5,490 Trading and other financial liabilities at fair value through profit or loss − − − Derivative financial
liabilities:
Interest rate derivatives Option pricing
model Interest rate volatility 0%/136% 760 − −
760
Financial liabilities carried at fair value 760
1 Where the exposure to an unobservable input is managed on a net basis, only the net impact is shown in the table. 2 The range represents the highest and lowest inputs used in the level 3 valuations. 3 Underlying asset/net asset values represent fair value.

LLOYDS BANKING GROUP PLC 2017 HALF-YEAR RESULTS
Page 80 of 90
16. Fair values of financial assets and liabilities (continued)
At 31 December 2016 Effect of reasonably possible alternative assumptions1 Significant Valuation unobservable Carrying Favourable Unfavourable technique(s) inputs Range2 value changes changes £m £m £mTrading and other financial assets at fair value through profit or loss: Equity and venture capital investments
Market approach Earnings multiple 0.9/10.0 2,163 63 (68)
Unlisted equities and debt securities, property partnerships in the life funds
Underlying asset/net asset value (incl. property prices)3
n/a
n/a
1,501 − (32)Other 142
3,806
Available-for-sale financial assets 894 48 (53)
Derivative financial assets: Interest rate derivatives Option pricing
model Interest rate volatility 0%/115% 1,399 (3) (19)
1,399
Financial assets carried at fair value 6,099 Trading and other financial liabilities at fair value through profit or loss 2 − − Derivative financial liabilities: Interest rate derivatives Option pricing
model Interest rate volatility 0%/115% 960 − −
960
Financial liabilities carried at fair value 962 1 Where the exposure to an unobservable input is managed on a net basis, only the net impact is shown in the table. 2 The range represents the highest and lowest inputs used in the level 3 valuations. 3 Underlying asset/net asset values represent fair value.
Unobservable inputs
Significant unobservable inputs affecting the valuation of debt securities, unlisted equity investments and derivatives are
unchanged from those described in the Group’s 2016 financial statements.
Reasonably possible alternative assumptions
Valuation techniques applied to many of the Group’s level 3 instruments often involve the use of two or more inputs
whose relationship is interdependent. The calculation of the effect of reasonably possible alternative assumptions
included in the table above reflects such relationships and are unchanged from those described in the Group’s 2016
financial statements.

LLOYDS BANKING GROUP PLC 2017 HALF-YEAR RESULTS
Page 81 of 90
17. Credit quality of loans and advances
The table below sets out those loans that are (i) neither past due nor impaired, (ii) past due but not impaired,
(iii) impaired, not requiring a provision and (iv) impaired requiring a provision.
The disclosures in the table below are produced under the underlying basis used for the Group’s segmental reporting.
The Group believes that, for reporting periods following a significant acquisition such as the acquisition of HBOS in 2009,
this underlying basis, which includes the allowance for loan losses at the acquisition date on a gross basis, more fairly
reflects the underlying provisioning status of the loans.
The analysis of lending between retail and commercial has been prepared based upon the type of exposure and not the
business segment in which the exposure is recorded. Included within retail are exposures to personal customers and
small businesses, whilst included within commercial are exposures to corporate customers and other large institutions.
Designated
at fairvalue
Customers through Retail – Retail – profit orLoans and advances Banks mortgages other Commercial Total loss
£m £m £m £m £m £mAt 30 June 2017 Good quality 8,749 294,700 41,668 72,008 29,243
Satisfactory quality 45 836 5,530 29,887 42
Lower quality 34 38 482 6,144 –
Below standard, but not impaired − 163 655 346 –
Neither past due nor impaired1 8,828 295,737 48,335 108,385 452,457 29,285
0-30 days 8 3,065 311 166 3,542 –
30-60 days – 1,334 95 67 1,496 –
60-90 days – 863 8 34 905 –
90-180 days – 1,143 5 14 1,162 –
Over 180 days – – 16 29 45 –
Past due but not impaired2 8 6,405 435 310 7,150 –
Impaired – no provision required 29 821 319 761 1,901 −
– provision held – 3,636 1,080 1,676 6,392 −
Gross lending 8,865 306,599 50,169 111,132 467,900 29,285
At 31 December 2016 Good quality 26,745 295,286 34,195 72,083 33,049
Satisfactory quality 87 814 4,479 30,433 30
Lower quality 3 39 387 6,433 –
Below standard, but not impaired 53 164 417 415 –
Neither past due nor impaired1 26,888 296,303 39,478 109,364 445,145 33,079
0-30 days 14 3,547 285 157 3,989 –
30-60 days – 1,573 75 37 1,685 –
60-90 days – 985 2 74 1,061 –
90-180 days – 1,235 6 14 1,255 –
Over 180 days – – 18 23 41 –
Past due but not impaired2 14 7,340 386 305 8,031 –
Impaired – no provision required – 784 392 689 1,865 –
– provision held – 3,536 1,038 2,056 6,630 –
Gross lending 26,902 307,963 41,294 112,414 461,671 33,079 1 The definitions of good quality, satisfactory quality, lower quality and below standard, but not impaired applying to retail and
commercial are not the same, reflecting the different characteristics of these exposures and the way they are managed internally, and consequently totals are not provided. Commercial lending has been classified using internal probability of default rating models mapped so that they are comparable to external credit ratings. Good quality lending comprises the lower assessed defaultprobabilities, with other classifications reflecting progressively higher default risk. Classifications of retail lending incorporate expected recovery levels for mortgages, as well as probabilities of default assessed using internal rating models.
2 A financial asset is ‘past due’ if a counterparty has failed to make a payment when contractually due.

LLOYDS BANKING GROUP PLC 2017 HALF-YEAR RESULTS
Page 82 of 90
18. Dividends on ordinary shares
An interim dividend for 2017 of 1.0 pence per ordinary share (half-year to 30 June 2016: 0.85 pence) will be paid on
27 September 2017. The total amount of this dividend is £720 million (half-year to 30 June 2016: £607 million).
Shareholders who have already joined the dividend reinvestment plan will automatically receive shares instead of the
cash dividend. Key dates for the payment of the dividends are:
Shares quoted ex-dividend 10 August 2017
Record date 11 August 2017
Final date for joining or leaving the dividend reinvestment plan 30 August 2017
Interim dividend paid 27 September 2017
On 16 May 2017, a final dividend in respect of 2016 of 1.7 pence per share, totalling £1,212 million, and a special
dividend of 0.5 pence per share, totalling £356 million, were paid to shareholders.
19. Events since the balance sheet date
At the annual general meeting on 11 May 2017, the Company’s shareholders approved the redesignation of the
80,921,051 limited voting ordinary shares of 10 pence each that the Company had in issue as ordinary shares of
10 pence each. The redesignation took effect on 1 July 2017 and the redesignated shares now rank equally with the
existing issued ordinary shares of the Company. There is no impact on the Company’s total share capital in issue or
equity.
20. Future accounting developments
The following pronouncements are not applicable for the year ending 31 December 2017 and have not been applied in
preparing these interim financial statements. Save as disclosed below, the impact of these accounting changes is still
being assessed by the Group and reliable estimates cannot be made at this stage.
With the exception of IFRS 9 ‘Financial Instruments’, and IFRS 15 ‘Revenue from Contracts with Customers’, as at
26 July 2017 these pronouncements are awaiting EU endorsement.
IFRS 9 Financial Instruments
IFRS 9 replaces IAS 39 ‘Financial Instruments: Recognition and Measurement’ and is effective for annual periods
beginning on or after 1 January 2018.
The Group has an established IFRS 9 programme to ensure a high quality implementation in compliance with the
standard and additional regulatory guidance that has been issued. The programme involves Finance and Risk functions
across the Group with Divisional and Group steering committees providing oversight. The key responsibilities of the
programme include defining IFRS 9 methodology and accounting policy, development of Expected Credit Loss (ECL)
models, identifying and implementing data and system requirements, and establishing an appropriate operating model
and governance framework.
The programme is progressing in line with delivery plans and is currently completing credit risk model development and
embedding the IFRS 9 operating model into the business. All core models are expected to be operational by September
2017 and outputs will be reviewed and validated ahead of implementation.

LLOYDS BANKING GROUP PLC 2017 HALF-YEAR RESULTS
Page 83 of 90
20. Future accounting developments (continued)
Classification and measurement
IFRS 9 requires financial assets to be classified into one of three measurement categories, fair value through profit or
loss, fair value through other comprehensive income or amortised cost. Financial assets will be measured at amortised
cost if they are held within a business model the objective of which is to hold financial assets in order to collect
contractual cash flows, and their contractual cash flows represent solely payments of principal and interest. Financial
assets will be measured at fair value through other comprehensive income if they are held within a business model the
objective of which is achieved by both collecting contractual cash flows and selling financial assets and their contractual
cash flows represent solely payments of principal and interest. Financial assets not meeting either of these two business
models; and all equity instruments (unless designated at inception to fair value through other comprehensive income);
and all derivatives are measured at fair value through profit or loss. An entity may, at initial recognition, designate a
financial asset as measured at fair value through profit or loss if doing so eliminates or significantly reduces an
accounting mismatch.
The Group has undertaken an assessment of the classification and measurement of financial assets and, whilst certain
portfolios will need to be reclassified, including from amortised cost to fair value through profit or loss, the overall impact
on the Group is not expected to be significant.
IFRS 9 retains most of the existing requirements for financial liabilities. However, for financial liabilities designated at fair
value through profit or loss, gains or losses attributable to changes in own credit risk may be presented in other
comprehensive income. The Group has elected to early adopt this presentation of gains and losses on financial liabilities
from 1 January 2017.
Impairment
The IFRS 9 impairment model will be applicable to all financial assets at amortised cost, debt instruments measured at
fair value through other comprehensive income, lease receivables, loan commitments and financial guarantees not
measured at fair value through profit or loss.
IFRS 9 replaces the existing ‘incurred loss’ impairment approach with an expected credit loss model, resulting in earlier
recognition of credit losses compared with IAS 39. Expected credit losses are the unbiased probability weighted average
credit losses determined by evaluating a range of possible outcomes and future economic conditions.
The ECL model has three stages. Entities are required to recognise a 12 month expected loss allowance on initial
recognition (stage 1) and a lifetime expected loss allowance when there has been a significant increase in credit risk
since initial recognition (stage 2). Stage 3 requires objective evidence that an asset is credit-impaired, which is similar to
the guidance on incurred losses in IAS 39.
IFRS 9 requires the use of more forward looking information including reasonable and supportable forecasts of future
economic conditions. The need to consider a range of economic scenarios and how they could impact the loss allowance
is a subjective feature of the IFRS 9 ECL model. The Group has developed the capability to model a number of
economic scenarios and capture the impact on credit losses to ensure the overall ECL reflects an appropriate distribution
of economic outcomes.
For all material portfolios, IFRS 9 ECL calculation will leverage the systems, data and methodology used to calculate
regulatory ‘expected losses’. The definition of default for IFRS 9 purposes will be aligned to the Basel definition of default
to ensure consistency across the Group. IFRS 9 models will use three key input parameters for the computation of
expected loss, being probability of default (‘PD’), loss given default (‘LGD’) and exposure at default (‘EAD’). However,
given the conservatism inherent in the regulatory expected losses calculation and some differences in the period over
which risk parameters are measured, some adjustments to these components have been made to ensure compliance
with IFRS 9.

LLOYDS BANKING GROUP PLC 2017 HALF-YEAR RESULTS
Page 84 of 90
20. Future accounting developments (continued)
The new impairment requirements will result in an increase in the Group’s balance sheet provisions for credit losses and
may have a negative impact on the Group’s regulatory capital position. The extent of any increase in provisions will
depend upon a number of factors including the composition of the Group’s lending portfolios and forecast economic
conditions at the date of implementation. It is not possible to conclude on the capital impact as the interaction with
IFRS 9 and the capital rules, including possible transitional arrangements, is still being finalised.
Whilst the Group is still running and testing the new credit risk models, it is not possible to provide a reliable estimate of
the increase in impairment provisions on 1 January 2018. The ongoing impact on the financial results will only become
clearer after running the IFRS 9 models over a period of time and under different economic environments, however, it
could result in impairment charges being more volatile when compared to the current IAS 39 impairment model, due to
the forward looking nature of expected credit losses.
Hedge accounting
The hedge accounting requirements of IFRS 9 are more closely aligned with risk management practices and follow a
more principle-based approach than IAS 39. The standard does not address macro hedge accounting, which is being
considered in a separate IASB project. There is an option to retain the existing IAS 39 hedge accounting requirements
until the IASB completes its project on macro hedging. The Group expects to continue applying IAS 39 hedge accounting
in accordance with this accounting policy choice.
IFRS 15 Revenue from Contracts with Customers
IFRS 15 replaces IAS 18 ‘Revenue’ and IAS 11 ‘Construction Contracts’ and is effective for annual periods beginning on
or after 1 January 2018.
The core principle of IFRS 15 is that revenue reflects the transfer of goods or services to customers in an amount that
reflects the consideration to which an entity expects to be entitled. The recognition of such revenue is in accordance with
five steps to: identify the contract; identify the performance obligations; determine the transaction price; allocate the
transaction price to the performance obligations; and recognise revenue when the performance obligations are satisfied.
Revenue relating to financial instruments, leases and insurance contracts are out of scope, however, the Group does
recognise fee income that is within scope, for example on added value accounts, interchange and service fees, certain
mortgage fees, factoring and commitment fees. A substantial proportion of the current revenue recognition policy for fee
and commission income is not expected to change. The standard is therefore not expected to have a significant impact
on the Group’s profitability.
Upon transition, any adjustments can be recognised either retrospectively to each prior reporting period presented, or
retrospectively with the cumulative effect of initially applying the standard recognised at the date of initial application as
an adjustment to the opening balance retained earnings. The Group anticipates adopting the second approach to
transition.
IFRS 16 Leases
IFRS 16 replaces IAS 17 ‘Leases’ and is effective for annual periods beginning on or after 1 January 2019.
IFRS 16 requires lessees to recognise a right of use asset and a liability for future payments arising from a lease
contract. Lessees will recognise a finance charge on the liability and a depreciation charge on the asset which could
affect the timing of the recognition of expenses on leased assets. This change will mainly impact the properties that the
Group currently accounts for as operating leases. Finance systems will need to be changed to reflect the new accounting
rules and disclosures. Lessor accounting requirements remain aligned to the current approach under IAS 17.

LLOYDS BANKING GROUP PLC 2017 HALF-YEAR RESULTS
Page 85 of 90
20. Future accounting developments (continued)
IFRS 17 Insurance Contracts
IFRS 17 replaces IFRS 4 ‘Insurance Contracts’ and is effective for annual periods beginning on or after 1 January 2021.
IFRS 17 requires insurance contracts and participating investment contracts to be measured on the balance sheet as the
total of the fulfilment cash flows and the contractual service margin. Changes to estimates of future cash flows from one
reporting date to another are recognised either as an amount in profit or loss or as an adjustment to the expected profit
for providing insurance coverage, depending on the type of change and the reason for it. The effects of some changes in
discount rates can either be recognised in profit or loss or in other comprehensive income as an accounting policy
choice. The risk adjustment is released to profit and loss as an insurer’s risk reduces. Profits which are currently
recognised through a Value in Force asset, will no longer be recognised at inception of an insurance contract. Instead,
the expected profit for providing insurance coverage is recognised in profit or loss over time as the insurance coverage is
provided.
The standard will have a significant impact on the accounting for the insurance and participating investment contracts
issued by the Insurance Division.
Minor amendments to other accounting standards
The IASB has issued a number of minor amendments to IFRSs effective 1 January 2018 (including IFRS 2 Share-based
Payment and IAS 40 Investment Property) and IFRIC 23 Uncertainty over Income Tax Treatments effective 1 January
2019. These revised requirements are not expected to have a significant impact on the Group.
21. Other information
The financial information included in this news release does not constitute statutory accounts within the meaning of
section 434 of the Companies Act 2006. Statutory accounts for the year ended 31 December 2016 were approved by the
directors on 21 February 2017 and were delivered to the Registrar of Companies on 12 April 2017. The auditors’ report
on those accounts was unqualified and did not include a statement under sections 498(2) (accounting records or returns
inadequate or accounts not agreeing with records and returns) or 498(3) (failure to obtain necessary information and
explanations) of the Companies Act 2006.

LLOYDS BANKING GROUP PLC 2017 HALF-YEAR RESULTS
Page 86 of 90
STATEMENT OF DIRECTORS’ RESPONSIBILITIES
The directors listed below (being all the directors of Lloyds Banking Group plc) confirm that to the best of their knowledge
these condensed consolidated half-year financial statements have been prepared in accordance with International
Accounting Standard 34, Interim Financial Reporting, as adopted by the European Union, and that the half-year
management report herein includes a fair review of the information required by DTR 4.2.7R and DTR 4.2.8R, namely:
an indication of important events that have occurred during the six months ended 30 June 2017 and their impact on
the condensed consolidated half-year financial statements, and a description of the principal risks and uncertainties
for the remaining six months of the financial year; and
material related party transactions in the six months ended 30 June 2017 and any material changes in the related
party transactions described in the last annual report.
Signed on behalf of the board by
António Horta-Osório
Group Chief Executive
26 July 2017
Lloyds Banking Group plc board of directors:
Executive directors:
António Horta-Osório (Group Chief Executive)
George Culmer (Chief Financial Officer)
Juan Colombás (Chief Risk Officer)
Non-executive directors:
Lord Blackwell (Chairman)
Anita Frew (Deputy Chairman)
Alan Dickinson
Simon Henry
Lord Lupton CBE
Deborah McWhinney
Nicholas Prettejohn
Stuart Sinclair
Sara Weller CBE

LLOYDS BANKING GROUP PLC 2017 HALF-YEAR RESULTS
Page 87 of 90
INDEPENDENT REVIEW REPORT TO LLOYDS BANKING GROUP PLC
Report on the condensed consolidated half-year financial statements
Our conclusion
We have reviewed Lloyds Banking Group plc’s condensed consolidated half-year financial statements (the ‘interim
financial statements’) in the 2017 half-year results of Lloyds Banking Group plc for the six month period ended 30 June
2017. Based on our review, nothing has come to our attention that causes us to believe that the interim financial
statements are not prepared, in all material respects, in accordance with International Accounting Standard 34, ‘Interim
Financial Reporting’, as adopted by the European Union and the Disclosure Guidance and Transparency Rules
sourcebook of the United Kingdom’s Financial Conduct Authority.
What we have reviewed
The interim financial statements comprise:
the consolidated balance sheet as at 30 June 2017;
the consolidated income statement for the period then ended;
the consolidated statement of comprehensive income for the period then ended;
the consolidated cash flow statement for period then ended;
the consolidated statement of changes in equity for the period then ended; and
the explanatory notes to the interim financial statements.
The interim financial statements included in the 2017 half-year results have been prepared in accordance with
International Accounting Standard 34, ‘Interim Financial Reporting’, as adopted by the European Union and the
Disclosure Guidance and Transparency Rules sourcebook of the United Kingdom’s Financial Conduct Authority.
As disclosed in note 1 to the interim financial statements, the financial reporting framework that has been applied in the
preparation of the full annual financial statements of the Group is applicable law and International Financial Reporting
Standards (IFRSs) as adopted by the European Union.
Responsibilities for the interim financial statements and the review
Our responsibilities and those of the directors
The 2017 half-year results, including the interim financial statements, are the responsibility of, and have been approved
by, the directors. The directors are responsible for preparing the 2017 half-year results in accordance with the Disclosure
Guidance and Transparency Rules of sourcebook the United Kingdom’s Financial Conduct Authority.
Our responsibility is to express a conclusion on the interim financial statements in the 2017 half-year results based on
our review. This report, including the conclusion, has been prepared for and only for the Company for the purpose of
complying with the Disclosure Guidance and Transparency Rules sourcebook of the United Kingdom’s Financial Conduct
Authority and for no other purpose. We do not, in giving this conclusion, accept or assume responsibility for any other
purpose or to any other person to whom this report is shown or into whose hands it may come save where expressly
agreed by our prior consent in writing.

LLOYDS BANKING GROUP PLC 2017 HALF-YEAR RESULTS
Page 88 of 90
What a review of interim financial statements involves
We conducted our review in accordance with International Standard on Review Engagements (UK and Ireland) 2410,
‘Review of Interim Financial Information Performed by the Independent Auditor of the Entity’ issued by the Auditing
Practices Board for use in the United Kingdom. A review of interim financial information consists of making enquiries,
primarily of persons responsible for financial and accounting matters, and applying analytical and other review
procedures.
A review is substantially less in scope than an audit conducted in accordance with International Standards on Auditing
(UK and Ireland) and, consequently, does not enable us to obtain assurance that we would become aware of all
significant matters that might be identified in an audit. Accordingly, we do not express an audit opinion.
We have read the other information contained in the 2017 half-year results and considered whether it contains any
apparent misstatements or material inconsistencies with the information in the interim financial statements.
PricewaterhouseCoopers LLP
Chartered Accountants
London
26 July 2017
Notes:
(a) The maintenance and integrity of the Lloyds Banking Group plc website is the responsibility of the directors; the work carried out
by the auditors does not involve consideration of these matters and, accordingly, the auditors accept no responsibility for any changes that may have occurred to the interim financial statements since they were initially presented on the website.
(b) Legislation in the United Kingdom governing the preparation and dissemination of financial statements may differ from legislation in other jurisdictions.

LLOYDS BANKING GROUP PLC 2017 HALF-YEAR RESULTS
Page 89 of 90
SUMMARY OF ALTERNATIVE PERFORMANCE MEASURES
As described in the basis of preparation, the Group analyses its performance on an underlying basis. The Group also
calculates a number of metrics that are used throughout the banking and insurance industries on an underlying basis as
these provide management with a relevant and consistent view of these measures from period to period. A description of
the Group’s alternative performance measures and their calculation is set out below.
Asset quality ratio The underlying impairment charge for the period (on an annualised basis) in respect of loans and advances to customers after releases and write-backs, expressed as a percentage of average gross loans and advances to customers for the period
Banking net interest margin
Banking net interest income on customer and product balances in the banking businesses as a percentage of average gross banking interest-earning assets for the period
Cost:income ratio Operating costs as a percentage of net income calculated on an underlying basis
Gross asset quality ratio
The underlying impairment charge for the period (on an annualised basis) in respect of loans and advances to customers before releases and write-backs expressed as a percentage of average gross loans and advances to customers for the period
Impaired loans as a percentage of closing advances
Impaired loans and advances to customers adjusted to exclude Retail and Consumer Finance loans in recoveries expressed as a percentage of closing gross loans and advances to customers
Loan to deposit ratio The ratio of loans and advances to customers net of allowance for impairment losses and excluding reverse repurchase agreements divided by customer deposits excluding repurchase agreements
Operating jaws The difference between the period on period percentage change in net income and the period on period change in operating costs calculated on an underlying basis
Present value of new business premium
The total single premium sales received in the period (on an annualised basis) plus the discounted value of premiums expected to be received over the term of the new regular premium contracts
Return on risk-weighted assets
Underlying profit before tax divided by average risk-weighted assets
Return on tangible equity
Statutory profit after tax adjusted to add back amortisation of intangible assets, and to deduct profit attributable to non-controlling interests and other equity holders, divided by average tangible net assets
Tangible net assets per share
Net assets excluding intangible assets such as goodwill and acquisition-related intangibles divided by the weighted average number of ordinary shares in issue
Underlying profit Statutory profit adjusted for certain items as detailed in the Basis of Preparation
Underlying return on tangible equity
Underlying profit after tax at the standard UK corporation tax rate adjusted to add back amortisation of intangible assets, and to deduct profit attributable to non-controlling interests and other equity holders, divided by average tangible net assets

LLOYDS BANKING GROUP PLC 2017 HALF-YEAR RESULTS
Page 90 of 90
CONTACTS
For further information please contact:
INVESTORS AND ANALYSTS
Douglas Radcliffe
Group Investor Relations Director
020 7356 1571
Andrew Downey
Director of Investor Relations
020 7356 2334
Edward Sands
Director of Investor Relations
020 7356 1585
CORPORATE AFFAIRS
Fiona Laffan
Group Corporate Communications Director
020 7356 2081
Matt Smith
Head of Corporate Media
020 7356 3522
Copies of this news release may be obtained from:
Investor Relations, Lloyds Banking Group plc, 25 Gresham Street, London EC2V 7HN
The full news release can also be found on the Group’s website – www.lloydsbankinggroup.com
Registered office: Lloyds Banking Group plc, The Mound, Edinburgh, EH1 1YZ
Registered in Scotland No. SC95000