2017 - hill & smith/media/files/h/hill-and-smith/reports-presentations/...year of progress in...
TRANSCRIPT
Annual Report for the year ended 31 December 2017
Stock Code HILS
2017

Contents
Strategic Report
1 Group Highlights 2 Group at a Glance4 Chairman’s Statement6 Business Model and Strategy8 Our Strategy in Action13 Operational and Financial Review24 Measuring Our Performance26 Risk Management and Assurance28 Principal Risks and Uncertainties32 Corporate Responsibility
Governance Report
43 Chairman’s Introduction to Governance44 Board of Directors46 Governance Report55 Nomination Committee Report56 Audit Committee Report62 Remuneration Committee Report63 Directors’ Remuneration Report77 Directors’ Report (other statutory information)80 Statement of Directors’ Responsibilities
Financial Statements
82 Independent Auditor’s Report87 Group Financial Statements134 Company Financial Statements146 Five Year Summary
Shareholder Information
148 Financial Calendar149 Shareholder Information150 Principal Group Businesses153 Directors, Contacts and Advisors
Hill & Smith Holdings PLC Annual Report for the year ended 31 December 2017
Cover Images
Top – Cryogenic pipe supports awaiting inspection at Bergen Pipe Supports India.
Middle – Bristorm Zero HVM Perimeter Fence – Kingdom of Saudi Arabia.
Bottom – Galvanized product at Joseph Ash Ltd.
Below – Brifen N2W4 wire rope VRS installed on the A11 Thetford bypass.
Mission Statement“To deliver sustainable profitable growth through the supply of Infrastructure Products and Galvanizing Services.”

Strategic Report
www.hsholdings.com | Stock Code HILS
1
2016
£540
.1m
Group Highlights
• Record revenue and underlying earnings performance.
• Improved returns driven by strong end markets and active portfolio management.
• Underlying profit before taxation up 15% to £78.5m.
• Two acquisitions completed during the year, both in the US.
• Strong cash generation performance with net debt at £99.0m.
• Proposed 15% increase in final dividend of 20.6p, giving a full year dividend of 30.0p, up 14%.
*All underlying measures exclude certain non-underlying items, which are as defined in note 3 on page 100 to the Financial Statements and described in the Operating and Financial Review. References to an underlying profit measure throughout this report are made on this basis and, in the opinion of the Directors, aid the understanding of the underlying business performance as they exclude items that are either unlikely to recur in future periods or represent non-cash items that distort the underlying performance of the business. Underlying measures are presented on a consistent basis over time to assist in comparison of performance.
Where we make reference to constant currency amounts, these are prepared using exchange rates which prevailed in the current year rather than the actual exchange rates that applied in the prior year. Where we make reference to organic measures we exclude the impact of currency translation movements, acquisitions, disposals and closures of subsidiary businesses. In respect of acquisitions, the amounts referred to represent the amounts for the period in the current year that the business was not held in the prior year. In respect of disposals and closures of subsidiary businesses, the amounts referred to represent the amounts for the period in the prior year that the business was not held in the current year.
31 December 2017
31 December 2016 Change %
Revenue £585.1m £540.1m +8
Underlying*:
Operating profit £81.3m £70.6m +15
Operating margin 13.9% 13.1% +80bps
Profit before taxation £78.5m £68.0m +15
Earnings per share 75.9p 65.9p +15
Statutory:
Operating profit £74.1m £51.8m +43
Profit before taxation £70.2m £48.3m +45
Basic earnings per share 68.6p 43.0p +60
Dividend per share 30.0p 26.4p +14
Net debt £99.0m £112.0m
£81.3m up 15%
Underlying operating profit
2013
£44.
5m
2014
£49.
2m
2015
£56.
0m
2016
£70.
6m
2017
£81.
3m
30.0p up 14%
Dividend per share(proposed)
2013
16.0
p
2014
18.0
p
2015
20.7
p
2016
26.4
p
2017
30.0
p
£585.1m up 8%
Revenue
2013
£444
.5m
2014
£454
.7m
2015
£467
.5m
2017
£585
.1m
75.9p up 15%
Underlying earnings per share
2013
40.4
p
2014
45.0
p
2015
51.7
p
2016
65.9
p
2017
75.9
p

2 Strategic Report
www.hsholdings.com | Stock Code HILS
Infrastructure Products – RoadsOur Roads segment designs, manufactures and installs temporary and permanent safety products for the roads market together with intelligent transport systems which provide information to road users. We principally serve the UK market, with an international presence in selected geographies.For more information see page 13.
Revenue: £187.1m
Underlying Operating Profit: £23.6m
No. of Employees: 816
Revenue by Geography Employees by Geography (Numbers)
Infrastructure Products – UtilitiesOur Utilities segment provides industrial flooring, plastic drainage pipes, security fencing, steel and composite products for a wide range of infrastructure markets including energy creation and distribution, rail, water and house building.For more information see page 16.
Revenue: £215.7m
Underlying Operating Profit: £16.8m
No. of Employees: 1,784
Revenue by Geography Employees by Geography (Numbers)
Galvanizing Services
The Galvanizing Services division offers corrosion protection services to the steel fabrication industry with multi-plant facilities in the UK, France and the USA.For more information see page 17.
Revenue: £182.3m
Underlying Operating Profit: £40.9m
No. of Employees: 1,543
Revenue by Geography Employees by Geography (Numbers)
Supplying to and located in global markets, the Group serves customers from facilities in Australia, France, India, Scandinavia, the UK and the USA, building an increasing presence in international markets, where countries are upgrading or improving their infrastructure as their economies grow. A key feature of the Group’s chosen markets is the influence of heightened levels of regulation and health and safety considerations on development and growth. All our products are designed to strict specifications and tested according to applicable standards.
Group at a Glance
UK – 66%
International – 34%
UK – 45%
USA – 36%
RoW – 19%
UK – 43%
USA – 26%
France – 31%
UK – 546
International – 270
UK – 808
USA – 646
RoW – 330
UK – 670
USA – 395
France – 478

Strategic Report
www.hsholdings.com | Stock Code HILS
3
Percentage of 2017 underlying operating profit £81.3m shown by location of the operating site
UK – 42%
USA – 43%
Europe and ROW – 15%
USA – our V&S galvanizing and utilities plants are situated on the east coast along with the Bergen and Carpenter & Paterson pipe supports businesses and the glass reinforced composite profiles businesses, Creative Pultrusions, Kenway and Tower Tech.
France – the base of France Galva and Conimast where we have ten galvanizing plants and a lighting column business.
UK – head office and various locations covering our main infrastructure products businesses and a network of UK galvanizing plants.
Norway – a division of ATA, the road safety barrier and signage business.
Sweden – location of ATA and FMK, the road safety barrier and signage business.
India – manufacturing facilities for pipe supports.
Australia – office in Queensland for the development of our wire rope and safety barrier products.
Percentage of 2017 revenue £585.1m shown by end market geography
UK – 49%
USA – 29%
Europe and ROW – 22%

4 Strategic Report
www.hsholdings.com | Stock Code HILS
Jock LennoxChairman
OverviewIn my first statement as Chairman, I am delighted to report another year of progress in 2017. Our focused strategy of developing businesses with market leading positions in international growth markets continues to deliver good organic revenue and profit progression and improved capital returns.
In 2017, organic revenue growth of 4% helped lift our total revenue by 8% to £585.1m (2016: £540.1m). Underlying operating profit increased by 15% to £81.3m (2016: £70.6m), or 12% at constant currency. Underlying operating margin improved by 80 basis points to 13.9% (2016: 13.1%). Underlying earnings per share of 75.9p were 15% higher (2016: 65.9p). Reported operating profit increased by 43% to £74.1m, resulting in a reported operating margin of 12.7% (2016: 9.6%). Basic earnings per share of 68.6p were 60% higher than the prior year (2016: 43.0p). Return on invested capital was 20.2% (2016: 19.4%).
Continuation of our proven strategy of active portfolio management resulted in us completing two acquisitions, one disposal and the closure of one non-core business during 2017:
› In March, we completed the acquisition of the trade and assets of Kenway Corporation (‘Kenway’) for an aggregate cash consideration of £6.1m. Kenway is a specialist in technologically advanced composite design, manufacturing and field service work across a broad range of industries including marine, power, pulp and paper, transportation and renewable energy. Integrated into our existing composite business, Creative Pultrusions, Kenway is trading in line with our expectations.
› In August, we completed the acquisition of the trade and assets of Tower Tech Inc. (‘Tower Tech’), a manufacturer of modular build, high efficiency composite cooling towers which offer ease of installation, low operating costs and longevity. Cash consideration of £2.4m was paid at completion. Tower Tech is performing as expected and is being integrated into our composites business, a long time supplier to Tower Tech. The acquisition furthers our strategy of enhancing our product offering to end users within infrastructure markets.
› In April, we completed the disposal of CA Traffic Limited, a non-core traffic data collection business, to TagMaster AB for a net consideration of £2.5m.
› In December 2016, following a review of the returns available, we announced a plan to close and exit our roads business in India. Following the execution of a licensing agreement with a local manufacturer, the closure process was completed in the third quarter of 2017.
After the year end, on 1 January 2018, we completed the small bolt-on acquisition of D Gibson Road & Quarry Services Limited for a cash consideration of £0.3m. Supplying road signs and ancillary products into UK contractors, the business has been absorbed into our existing Mallatite operation.
We welcome the employees of the acquired companies, which provide exciting growth opportunities for the Group.
DividendsIn view of the strong performance the Board is recommending an increase of 15% in the final dividend to 20.6p per share (2016: 17.9p per share) making a total dividend for the year of 30.0p per share (2016: 26.4p per share), an increase of 14% on the prior year. Underlying dividend cover remains a healthy 2.5 times (2016: 2.5 times). Reported dividend cover is 2.3 times (2016: 1.6 times).
Our performance gives us confidence to maintain a progressive dividend policy which has resulted in fifteen years of uninterrupted dividend growth. The final dividend, if approved, will be paid on 2 July 2018 to those shareholders on the register at the close of business on 25 May 2018.
Governance and the BoardHonest, open and accountable management of our businesses is key to the effective governance of the Group, which underpins our strategy and the sustainability of our performance.
In this year’s Annual Report we set out explanations of our business model, strategy, viability statement, risk management and activities of the Board and its Committees. We also discuss within our Corporate Responsibility report how our businesses are encouraged to contribute within the communities in which they operate.
It is the responsibility of every Board to ensure that there is an appropriate succession planning process in place across the business, including the Board of Directors. During the year, both the Board and the Nomination Committee reviewed their plans for succession planning. As previously announced, in May 2017, Bill Whiteley retired and I was appointed as your Chairman. On 3 October 2017, Alan Giddins joined the Board as a Non-executive Director and became the Group’s Senior Independent Director. With significant board experience he is already providing a valuable and additional perspective to the Board.
Chairman’s Statement
I am delighted to report another year of progress in 2017.“ “

Strategic Report
www.hsholdings.com | Stock Code HILS
5
BrexitIt remains too early to assess with any certainty the impact of the decision by the United Kingdom to leave the European Union. We have not experienced any material positive or negative impact since the referendum result and we are confident that our strategy of international diversification along with market leading positions in key infrastructure investment markets will help limit any potential negative impact on the Group. However, we are not complacent, remain vigilant and will react with our customary speed as necessary.
AGMWe will hold our AGM on 17 May 2018 and it is an excellent opportunity for shareholders to meet the Board and certain senior executives of the Group. If you can attend, my colleagues and I will be delighted to see you.
PeopleGood results can only be delivered through the efforts and dedication of a loyal and strong workforce. In my time on the Board, and latterly as Chairman, I have been immensely impressed by the skill and dedication of all our employees. On behalf of the Board, I would like to thank them for their continued hard work and for rising to the opportunities and challenges they meet.
OutlookThe industrial and geographical spread of the Group’s markets and businesses not only provide a resilient base, but also opportunities for growth. With 80% of revenue and 85% of underlying operating profit deriving from its UK and US activities, the Group mainly operates in niche infrastructure markets with positive outlooks.
In Utilities, our UK and US activities continue to benefit from the significant investment in replacing ageing infrastructure and new infrastructure projects in those countries. In Galvanizing, wider
market conditions remain favourable and we expect our businesses to consolidate their strong market positions and continue to take advantage of opportunities.
In the UK, the implementation of the Department of Transport’s Road Investment Strategy is entering the fourth year of the initial five year plan, which provides certainty of funding through to 2019/20. We are encouraged that recent announcements by Highways England indicate further investment plans through into 2025 are under discussion. We therefore have confidence the Group’s road product portfolio will continue to benefit from increased investment in the UK’s road infrastructure.
In the US, the administration has prioritised spending on US infrastructure, including building and repairing roads and bridges, and our businesses are well positioned to benefit from any increased investment.
Overall, despite political and macro-economic uncertainties, we remain well positioned to again deliver another year of progress.
Jock Lennox Chairman
7 March 2018
Culvert Structure and VSoL Walls spanning the River Carron on a residential development for Stewart Milne Homes (North), Carron Den, Stonehaven, Aberdeenshire.

6 Strategic Report
www.hsholdings.com | Stock Code HILS
Our Business Model and Strategy
Hill & Smith Holdings PLC seeks to deliver superior shareholder returns by holding leading positions in the niche markets of infrastructure products and galvanizing services, diversified over different geographies.
GovernanceHill & Smith Holdings PLC is led by an experienced management team which has a strong record in successfully implementing the Company’s strategy. The Board is collectively responsible for upholding high standards of corporate governance and leadership, ensuring that the Company continues to deliver value creation for our shareholders. See pages 43 to 79 for more details.
Aligned InterestsThe Hill & Smith Holdings PLC executive directors are subject to minimum shareholding requirements and also participate in long-term incentive arrangements which link remuneration to shareholder return, ensuring their interests are aligned directly with shareholders. See page 68 for more details.
Entrepreneurial ManagementGroup senior management encourages an entrepreneurial culture at business unit level, ensuring businesses are agile, responsive and competitive. See our strategy in action on page 8. Our businesses employ people local to their communities, and the success of each business is reliant on the quality of management and employees. We aim to ensure that each business is resourced with a capable, engaged and productive workforce.
Geographical DiversificationWhilst continually driving our existing businesses we seek to supplement this organic growth by acquiring sustainable businesses around the world in niche markets that complement our existing activities. A key feature of the Group’s chosen markets is the influence of heightened levels of regulation and health and safety considerations on development and growth. All our products are developed and designed to strict specifications and tested according to applicable country standards. See our strategy in action on page 8.
Business Principles

Strategic Report
www.hsholdings.com | Stock Code HILS
7
Our Markets Our businesses provide services and products to the world’s utilities and power generation industries and to international businesses within the infrastructure of roads and rail, together with corrosion protection services in the form of zinc and other coatings, to these and other industries.
Hill & Smith Holdings PLC generating sustainable profitable growth and shareholder return. See pages 10 and 11 for more details.
Portfolio ManagementWe continually seek organic growth from our existing operations and monitor our lower performing Group businesses to ensure overall growth targets are maintained. All our subsidiaries are tasked with achieving an acceptable operating margin. Businesses that fail to achieve this margin are given a period of grace to develop a plan for margin improvement to the targeted level. See our strategy in action on page 9.
Revenue growth and targeted returnsBy targeting returns at each individual business unit the Board ensures that revenue growth is achieved which flows through to sustainable profitable growth. See our strategy in action on page 9.
Risk ManagementEffective risk management is critical to the achievement of our strategic objectives, and the Group-wide risk identification, articulation and mitigation processes followed by our subsidiaries are integrated into their daily business activities. See pages 26 to 30 for more details.
PeopleThe Group is committed to ensuring its businesses provide the right environment in which to work. We insist that people connected with the Group are trained correctly, behave in the right way, work safely and comply with all local legal and regulatory requirements, thus ensuring the sustainability of the business as well as the environment. We do this by implementing the correct policies and procedures relating to our people and the environment, by successfully delivering an effective health and safety system and encouraging our business to interact with their local communities. See pages 32 to 37 for more details.
Key Performance Indicators (‘KPIs’)The Board has adopted certain financial and non-financial KPIs. See pages 24 to 25 for more details.

8 Strategic Report
www.hsholdings.com | Stock Code HILS
Our Strategy in Action
Geographical diversificationOur acquisition strategy is to buy and develop businesses in markets we understand through our existing activities. Our objective is to identify opportunities in our major developed markets of the UK, France and USA, whilst recognising that there is further potential in emerging markets. Our overall geographic mix will be dictated by developing these opportunities together with the performance of our businesses in emerging markets.
Key activitiesThe majority of our acquisition targets are likely to be privately owned. We also look at acquiring distressed businesses in the UK which complement our existing operations and therefore enable us to consolidate our market position. This in turn will allow us, in some instances, to develop our smaller business units into larger and more effective businesses within their markets. Overseas acquisitions must have a high quality management team in place and a proven earnings stream as it is more demanding to manage businesses from a distance effectively.
Key events in 2017 › Purchase of Kenway Composites, Inc. (24 March 2017).
› Purchase of Tower Tech, Inc. (15 August 2017).
Entrepreneurial managementWe encourage an entrepreneurial culture in our businesses through a decentralised management structure. We provide our management teams the freedom to run and grow their own businesses, supported by the resources available through being part of a larger group, whilst adhering to the levels of governance and controls appropriate for a quoted company.
Key activitiesEach subsidiary is managed by its local board of directors who are all empowered to operate their businesses in accordance with Group-approved policies and delegated authorities. This management culture ensures that decisions are made close to the market and that our businesses are agile and responsive to changes in their competitive environment and, through the international spread of the businesses, opportunities are identified and taken through Group collaboration.
Key events in 2017 › Organic revenue growth of 4.5%
› Integration of Kenway Composites, Inc. and Tower Tech, Inc. into Creative Pultrusions.
› Bergen Pipe Supports India developed into a site of manufacturing excellence.
MASS Siteguard installed around the American Embassy, London, UK.

Strategic Report
www.hsholdings.com | Stock Code HILS
9
Portfolio managementOur objective is to achieve at least mid single-digit organic revenue growth by developing substantial businesses in each of our chosen sectors through both organic and acquisitive revenue growth. Consequently, this leads us to continually examine the smaller and lower performing units within the portfolio, along with rationalisation of production facilities and business transfers.
Key activitiesWe continue to actively manage our corporate portfolio and dispose of or rationalise operations that are non-core to our market strategy, incapable of achieving our target returns, or insufficiently cash generative.
Key events in 2017 › Establishment of Carpenter & Paterson’s Eastern Region Service Centre (‘ERSC’).
› Rationalisation of the Variable Message Signs business, from three sites to one manufacturing facility in the North East of England.
› Closure of Indian roads business.
› Sale of C.A Traffic Ltd.
› Successful integration of Mallatite Ltd’s five sites into three – Chesterfield, Oldbury and Inchinnan.
Revenue growth and targeted returnsCapturing sustainable profitable growth through the supply of infrastructure products and galvanizing services from business units that are focused on profitable growth. Operating margins are an integral measure of the Group’s success and one which we continue to drive for improvement through product mix and value-added customer-focused solutions, as well as high levels of operational efficiency. Our objective is to operate with an efficient balance sheet by maintaining debt at between 1.5 and 2.0 times
EBITDA, which in turn allows us to complement balanced organic growth with value-enhancing acquisitions.
Key activitiesAt a Group level capital returns are assessed by measuring Return on Invested Capital (‘ROIC’), where invested capital includes acquired goodwill and intangible assets in order to take into account the amounts invested in acquired businesses. The Group’s target ROIC is 20%.
Key events in 2017
Underlying operating margins 2017 Target range % ROIC 2017
Infrastructure Products 10.0% 8 – 11 Infrastructure Products 19.9%
Utilities 7.8% 7 – 10 Utilities 17.5%
Roads 12.6% 10 – 14 Roads 22.0%
Galvanizing 22.4% 18 – 21 Galvanizing 20.4%
Group 13.9% 12 – 15 Group 20.2%
Data centre protection utilising Barkers Engineering’s StronGuard RCS Pallisade.
10 Strategic Report
www.hsholdings.com | Stock Code HILS
Our Strategy in ActionSustainable Profitable Growth - Value Creation
Strategic focusTo create long-term sustainable profitable growth and through this growth create value for all stakeholders.
We aim to combine organic revenue growth with selective acquisitions, thereby delivering growth in earnings per share. A strong focus on cash generation supports this growth strategy and enables a progressive dividend policy.
Key activitiesWe address long-term markets by focusing on markets driven by Government spend on infrastructure, particularly with strong regulatory and health and safety dynamics, and by growing demand for power generation in emerging markets and the replacement of ageing power infrastructure in developed economies. By encouraging a decentralised management structure we incentivise and enable the operators of our businesses to respond to opportunities and challenges in their markets supported by the resources of a larger group. In order to be truly sustainable we must grow revenues and profits, whilst focusing on customer service, margins, product development, and enhancing our relationships with other stakeholders, including our employees, our suppliers and the communities in which we operate. At the same time we must be cognisant of the effect our operations have on the environment. More details can be found in our Corporate Responsibility Report on pages 32 to 39.
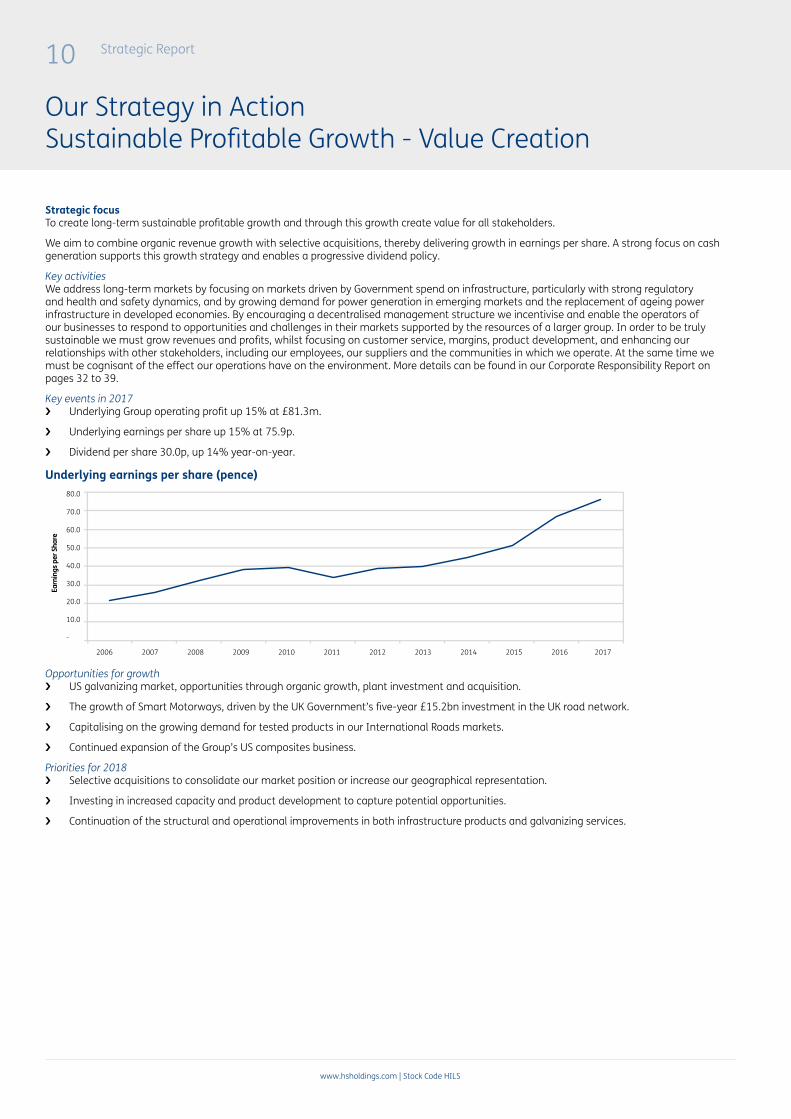
Key events in 2017 › Underlying Group operating profit up 15% at £81.3m.
› Underlying earnings per share up 15% at 75.9p.
› Dividend per share 30.0p, up 14% year-on-year.
Underlying earnings per share (pence)
Opportunities for growth › US galvanizing market, opportunities through organic growth, plant investment and acquisition.
› The growth of Smart Motorways, driven by the UK Government’s five-year £15.2bn investment in the UK road network.
› Capitalising on the growing demand for tested products in our International Roads markets.
› Continued expansion of the Group’s US composites business.
Priorities for 2018 › Selective acquisitions to consolidate our market position or increase our geographical representation.
› Investing in increased capacity and product development to capture potential opportunities.
› Continuation of the structural and operational improvements in both infrastructure products and galvanizing services.
2006
80.0
70.0
60.0
50.0
40.0
30.0
20.0
10.0
-
2007 2008 2009 2010 2011 2012 2013 2014 2015 2016 2017
Earn
ings
per
Sha
re

Strategic Report
www.hsholdings.com | Stock Code HILS
11
Our Strategy in ActionOur Investment Proposition
We believe in providing superior shareholder returns by doing business in the right way in markets where we have global expertise.
We are an international group with leading positions in the supply of infrastructure products and galvanizing services and we aim to deliver strong returns and sustainable value through a focus on strong positions in niche markets.
Investment Proposition KPIs
A Globally Organised GroupWe have leading positions in the niche markets of infrastructure products and galvanizing services, diversified over different geographies with a focus on service, margins and innovative product development.*as at the date of this report.
7 countries*
59 sites
Organic & Acquisitive GrowthWe aim to deliver consistent organic growth complemented by regular, value-enhancing acquisitions in markets that supplement or complement our existing operations.
4% organic revenue growth2 US acquisitions
Strong Operating Cash FlowWe focus on underlying cash conversion and a disciplined approach to each business unit’s return on capital employed. Over the past nine years the Group has achieved an average underlying cash conversion rate of over 90% (the ratio of underlying operating cash less capital expenditure to underlying operating profit).*87% excluding the impact of zinc price rises during the year.
2017: 78%*
2016: 93%
Progressive DividendWe have increased dividend payments by a compound annual growth rate of 13.2% since 2008.
Divi
dend
35.00
30.00
25.00
20.00
15.00
10.00
5.00
-2008 2009 2010 2011 2012 2013 2014 2015 2016 2017
Increased Shareholder ValueSince 2010 our total shareholder return has regularly outperformed the FTSE All Share.
Hill & Smith FTSE 250 FTSE SmallCap FTSE All Share
Jan 09 Jan 10 Jan 11 Jan 12 Jan 13 Jan 14 Jan 15 Jan 16 Jan 17 Jan 18
1200
1000
800
600
400
200
0
Tota
l Sha
reho
lder
Ret
urn
(reb
ased
to 1
00)

12 Strategic Report
www.hsholdings.com | Stock Code HILS
Asset International Structures (a division of Hill & Smith Ltd) provides a fully engineered design and manufacture service for construction, highways and rail clients and has an international reputation for providing bespoke designs that address all specific project requirements.
The Kilrenny Bridge in Anstruther, Fife, Scotland, was found to be weak during a programme of bridge assessments by Fife Council. The reinforced concrete bridge was built in 1937 over the top of the original, narrower arch bridge. With a 17-tonne weight restriction applied a traffic light controlled single lane operation was also imposed in 1995 to ease the stress on the structure.
The original project to replace the bridge involved the removal of the whole structure and replacing it with a small culvert and the formation of embankments.
Fife Council, faced with a cost of more than £1million brought in a new project team in 2015 charged with a radical rethink and review of the scheme in its entirety. With an alternative solution in mind the Fife Council team approached Asset International Structures to design and supply a lightweight lining system that could be built in situ to accommodate the constraints at the site.
Using Asset Liner Plate system as an alternative to rebuilding resulted in a 40% cost savingIn 2017 Asset International Structures supplied and designed a lightweight Liner Plate solution that involved building a steel arch under the existing bridge and infilling between the two structures with concrete. This meant the concrete bridge could be left in place but would become structurally redundant. The abutment walls from the old masonry arch also remained in place, with minor adjustments, avoiding the need to divert Kilrenny Burn. The voussoirs (external facing stones) from the old masonry arch, which had been stored when it was demolished, were used in facing the new steel arch and the remainder of the external faces would be clad in natural stone.
By Fife Council adopting the Liner Plate solution substantial cost savings (approximately £400k) were achieved. The works were completed with only three nights of roads closures, and significantly less disruption to the traffic and the local community.
The bridge is now open to two-way traffic, has one footway and is wide enough to accommodate a potential cycleway extension in the future.
Case Study
Images
Top – Kilrenny bridge before.
Bottom – Kilrenny bridge after completion of works.
Find out more about the company at www.assetint.co.uk
Kilrenny Bridge Strengthening

Strategic Report
www.hsholdings.com | Stock Code HILS
13
Derek MuirGroup Chief Executive
Mark PeglerGroup Finance Director
and MD, UK Utilities Group
Operational and Financial Review
2017 overviewHill & Smith delivered a record trading performance in the twelve months to 31 December 2017. Infrastructure investment in our key UK and US markets remained strong which, combined with our focused active portfolio management strategy, resulted in our highest ever revenue, profitability and operating margin.
Our performance remains underpinned by our proven strategy of international diversity combined with the leading positions our businesses hold in their respective markets. Our US and UK operations benefitted from rising spending on infrastructure in our chosen end markets, and together they represented 80% of revenue and 85% of underlying operating profit. Organic profit growth was supported by targeted bolt-on acquisitions and the restructuring of underperforming assets to improve overall returns and shareholder value. Prospects in our core US and UK infrastructure markets as well as the other geographies in which we operate continue to be positive for 2018 and beyond.
Change %
2017 2016 ReportedConstant currency
Revenue £585.1m £540.1m + 8 + 5
Underlying(1):
Operating profit £81.3m £70.6m + 15 + 12
Profit before tax £78.5m £68.0m + 15 + 12
Earnings per share
75.9p 65.9p + 15 + 12
Reported:
Operating profit £74.1m £51.8m + 43
Profit before tax £70.2m £48.3m + 45
Basic earnings per share
68.6p 43.0p + 60
(1) Underlying measures exclude certain non-underlying items, which are detailed in note 3 to the Financial Statements.
Annual revenue increased by 8% to £585.1m (2016: £540.1m), of which translational currency benefits contributed £14.4m or 3%. After adjusting for additional revenue of £23.6m from acquisitions, reduced revenue from the prior year restructuring of the non-US Pipe Supports businesses of £14.8m and disposals of £2.5m, organic revenue growth was £24.3m or 4%. Underlying operating profit improved by 15% to £81.3m (2016: £70.6m), including a positive currency translation of £2.1m. Acquisitions contributed £2.3m and the benefit of the non-US Pipe Supports restructuring actions a further £1.0m. The organic improvement in underlying operating profit was 7%. Underlying operating margin improved by 80bps to
13.9% (2016: 13.1%) despite absorbing significantly higher zinc raw material costs. Underlying profit before taxation was 15% higher at £78.5m (2016: £68.0m). Reported operating profit was £74.1m (2016: £51.8m), an increase of 43% on the prior year. Reported profit before tax was £70.2m (2016: £48.3m).
Infrastructure Products
£m+/-%
Constant Currency
%2017 2016
Revenue 402.8 375.7 + 7 + 5
Underlying operating profit 40.4 32.6 +24 +22
Underlying operating margin % 10.0 8.7
Reported operating profit 34.4 14.9
The division supplies engineered products to the roads and utilities markets in geographies where there is sustained long term investment in infrastructure. In 2017 the division accounted for 69% (2016: 70%) of the Group’s revenue and 50% (2016: 46%) of the Group’s underlying operating profit. Revenues increased 7% to £402.8m (2016: £375.7m) including an £8.1m positive impact from exchange rate movements. Acquisitions and disposals contributed a net £21.1m and there was £14.8m of lower revenue from the restructured non-US Pipe Supports operations. Organic revenue growth was £12.7m, or 3%. Underlying operating profit was £40.4m (2016: £32.6m), an increase of £7.8m, with a positive currency translation benefit of £0.6m. Acquisitions contributed £2.3m and the non-US Pipe Supports restructuring an additional £1.0m. Underlying operating margin improved to 10.0% (2016: 8.7%). Reported operating profit was £34.4m (2016: £14.9m) and included costs of £2.8m (2016: £10.5m) relating to restructuring actions taken during the year.
Roads
£m+/-%
Constant Currency
%2017 2016
Revenue 187.1 168.1 +11 + 9
Underlying operating profit 23.6 19.6 +20 +20
Underlying operating margin % 12.6 11.7
Reported operating profit 20.9 10.9
Our Roads segment designs, manufactures and installs temporary and permanent safety products for the roads market. We principally serve the UK market, with an international presence in selected geographies where there is a growing demand for innovative tested safety products. Roads represented 29% (2016: 28%) of the Group’s

14 Strategic Report
www.hsholdings.com | Stock Code HILSThe ‘Crowned Stag’ – a majestic, galvanized, steel sculpture on the Beaulieu housing development, Chelmsford, Essex. Galvanized by Joseph Ash Ltd.
14

Strategic Report
www.hsholdings.com | Stock Code HILS
15
underlying operating profit and 32% (2016: 31%) of revenue in 2017. Revenues increased by 11% to £187.1m (2016: £168.1m), an organic increase of 6% after a currency benefit of £3.3m, contribution from acquisitions of £8.1m less the impact of disposals of £2.5m. Underlying operating profit of £23.6m was £4.0m higher than the prior year (2016: £19.6m), including £0.1m from positive currency translations and £1.0m from acquisitions.
Reconciliation of Reported to Underlying operating profit
£m
2017 2016
Reported operating profit 20.9 10.9
Restructuring actions 1.8 2.7
Impairment charges - 4.1
Profit on disposal of subsidiary (0.6) -
Acquisition costs and amortisation 1.5 1.9
Underlying operating profit 23.6 19.6
UKThe Government’s Road Investment Strategy (‘RIS’) is entering its fourth year of an initial five-year plan. The RIS aims to provide certainty of investment funding for the period 2015/16 to 2019/20, improve the connectivity and condition of the existing road network and, importantly, increase capacity, with projects that will deliver 1,300 additional lane miles. Core to the drive to add capacity will be additional ‘Smart’, or managed motorways, which are at the heart of the Group’s product offering in the UK. We are encouraged that in December 2017 Highways England published its Strategic Road Network Initial Report (‘SRNIR’) setting out its vision and priorities for the second road investment period, covering 2020-2025. Subject now to public consultation, the SRNIR reaffirms the priority on building a Smart Motorway spine across the UK, connecting major cities in the most cost-efficient manner. Acceleration of the roll-out of expressways also remains a focus. The publication of RIS 2 covering investment spending across 2020-2025 is due in 2019.
Demand for our rental temporary safety barrier was good in the first half of the year as three Smart Motorways were in construction. Utilisation in the second half was lower, in line with expectations and as previously flagged, as the start of the next significant phase of Smart Motorways was delayed into 2018. We anticipate a significant improvement in the utilisation of our rental fleet as we progress throughout the first half of the current year and for the second half to be stronger year on year. We are also experiencing growing interest from UK and International third parties in purchasing our proven safety product for road and hostile vehicle mitigation applications.
The increased threat of terrorism in the UK has intensified the demand for deployment of our range of hostile vehicle mitigation products, including temporary and permanent, steel and concrete applications in key locations across the country. With a market leading range of solutions, and the ability to respond swiftly, we have completed projects to protect bridges in London, as well as sports and other high profile events. Discussions are being held with security agencies outside the UK and we expect this market to continue to grow.
In line with our expectations, as the initial phase of Smart Motorways nears completion, demand for our permanent safety barrier has been stronger year on year. The wider road improvement programme outside the core Smart Motorway work was also much improved towards the end of the year and we anticipate a stronger start to 2018. The market for bridge parapets remains positive as local authorities and Network Rail upgrade ageing bridge infrastructure
to protect the rail and road network from potential hostile and accidental vehicle damage. Exports of Brifen, our wire rope safety barrier system, and Bristorm, our high containment anti-terrorist perimeter barrier, experienced strong volumes in the second half of the year and, although lower than the record prior year, both revenue and profitability remained strong. Bristorm remains the product of choice for protecting many power, desalination and chemical plants in the Middle East.
Our Variable Message Sign (‘VMS’) business performed well in the year with strong sales of new Remotely Operable Temporary Traffic Management (‘ROTTM’) signs, which Highways England are deploying to improve road worker safety where no hard shoulder exists on Smart Motorways. The higher sales of ROTTM more than offset lower revenue from maintenance activities as a historic ten-year ‘supply and maintain’ contract with Highways England completed. In June we announced a proposal to commence the rationalisation of the VMS business that will result in the closure of two UK sites and consolidation into our existing facility in the north east. The restructuring is progressing to plan with completion expected in the first half of 2018 at a cost of £1.4m.
On 27 April 2017, we completed the disposal of CA Traffic Limited, a traffic data collection business, to TagMaster AB for a net consideration of £2.5m. Non-core, and unable to deliver the returns that we target from our businesses, in the year to 31 December 2016 CA Traffic Limited reported revenue of £3.9m and an operating loss of £0.2m.
Operating with a lower cost base following the rationalisation completed at the end of 2016, our lighting column business continues to perform well, supplying aluminium and passive safety products to projects such as the M8/M74 upgrade in Scotland and the Manchester M60 Smart Motorway. With its enhanced product offering following the acquisition of Signature last year, the business is capitalising on cross selling opportunities into the local authority and contractor markets.
Non-UKIn Scandinavia, our Swedish and Norwegian operations both performed well, particularly in the second half of the year. Recent investment in the temporary safety barrier rental fleet is paying dividends and utilisation was high. Major upgrades to the wider road network in both geographies are ongoing and further opportunities remain.
In France, our lighting column business operates in a competitive market which was also impacted negatively by disruption due to the national Presidential election in the first half of the year. Profitability improved in the second half of the year, but overall fell short of the prior year performance.
Employing both a rental and a direct sales approach, exciting progress continues to be made in promoting our temporary safety barrier in both the USA and Australia. In the USA, acceptance of our temporary steel barrier, Zoneguard, as an alternative to concrete is now well established in a number of States and continues to gain recognition elsewhere, including Canada where we have appointed a local distributor to drive sales. A record volume of safety barriers were sold during the year. In Australia, revenue rose to a record level as we delivered 16km of Zoneguard and 8km of ancillary products for a road project in Queensland. We also secured a 12km Zoneguard project for supply into New Zealand in the first half of 2018. Both the USA and Australia improved profitability against the same period prior year, establishing new benchmarks for each business.
In December 2016, following an assessment of the local market and outlook, we announced a plan to close and exit our manufacturing

16 Strategic Report
www.hsholdings.com | Stock Code HILS
Operational and Financial Review (continued)
and sales facility in India. Following the execution of a licensing agreement with a local manufacturer, the closure process was completed in the third quarter of 2017.
Utilities
£m+/-%
Constant Currency
%2017 2016
Revenue 215.7 207.6 + 4 + 2
Underlying operating profit 16.8 13.0 +29 +24
Underlying operating margin % 7.8 6.3
Reported operating profit 13.5 4.0
Our Utilities segment provides industrial flooring, plastic drainage pipes, security fencing, steel and composite products for a wide range of infrastructure markets including energy creation and distribution, rail, water and house building. The requirements for new power generation in emerging economies and replacement of ageing infrastructure in developed countries provide excellent opportunities for the Group’s utilities businesses. Revenues increased by 4% to £215.7m (2016: £207.6m). Benefits from currency translation of £4.8m and a £15.5m contribution from recent acquisitions were partly offset by the prior year restructuring and closure programme of our non-US Pipe Supports business (£14.8m lower revenue year on year). Organically, revenue was 1% higher than the prior year. Underlying operating profit was £16.8m (2016: £13.0m) including a positive currency impact of £0.5m, first time contribution from acquisitions of £1.3m and a £1.0m benefit from the non-US Pipe Supports restructuring.
Reconciliation of Reported to Underlying operating profit
£m
2017 2016
Reported operating profit 13.5 4.0
Restructuring actions 1.0 7.8
Impairment charges 0.4 -
Acquisition costs and amortisation 1.9 1.2
Underlying operating profit 16.8 13.0
In the US, our power transmission substation business performed well but fell short of the prior year’s strong comparatives. Day to day, the packaging together of structural steel with electrical components through framework agreements with key US utilities remains strong but an absence of larger contracts, notably in the first half of the year, reduced revenue and profitability. As expected, the second half of the year experienced improved order intake and we carry a higher order book into 2018. Investment in US electricity distribution looks set to continue over the medium term and opportunities for growth remain.
Following a subdued first half performance, our composite materials business delivered a much stronger second half, delivering larger projects into OEM customers which had been absent in the previous year. Consequently, the business performed well with revenue and profitability ahead of the prior year. Development of new products direct to end users within infrastructure markets continues to be the focus. On 24 March 2017, we completed the acquisition of the trade and assets of Kenway Corporation (‘Kenway’), a specialist in technologically advanced composite design, manufacturing and field service work across a broad range of industries including marine, power, pulp and paper, transportation and renewable energy. Cash consideration of £5.5m was paid at acquisition with a further £0.6m due in 2018. On 15 August, we completed the acquisition of the
trade and assets of Tower Tech Inc. (‘Tower Tech’), a manufacturer of modular build, high efficiency composite cooling towers which offer ease of installation, low operating costs and longevity. Cash consideration of £2.4m was paid at completion. Kenway has been, and Tower Tech is being, integrated into our Creative Pultrusions business, a long time supplier to Tower Tech, furthering our strategy of enhancing our product offering to end users within infrastructure markets.
The market for engineered pipe supports in the US remains robust and we completed projects with EPC contractors supplying a new build natural gas power plant and bio-solid water treatment plant, as well as the modernisation of petrochemical facilities. Following the restructuring and consolidation of the branch network serving the north east market in the middle of the year, our industrial hangers business benefitted from a lower cost base. The market remains competitive but the benefits of a more focused, efficient operation assisted in improving profitability and margin year on year despite lower revenue.
In India we successfully completed the expansion of our pipe supports facility and the business performed ahead of our expectations. The increased capacity enables us to service our international customers, with global supply agreements for the supply of engineered pipe supports into major power projects in geographies such as Japan, Malaysia and Egypt, as well as our domestic customers in the Indian market. Our strategic partnership with a Saudi Arabian manufacturer enables us to have local manufactured content when supplying pipe supports projects in the Middle East. We are encouraged by the market outlook in India and the Far East, both of which remain strong with a large programme to build both coal and gas fired power stations, petrochemical plants and LNG terminals.
UKIn the UK the performance of our utilities businesses was mixed and, overall, results were below the prior year. Our plastic pipe business benefited from a strong UK housing market where flood alleviation on new build sites remains a key focus. Continual delays in the Asset Management Period 6 (‘AMP6’) order cycle continued to frustrate the business in the first half of the year. Order intake increased in the second half of the year with projects focussing on improvements to the quality of drinking water as well as foul water management. The industry’s current focus on off-site build and modular construction plays well into the strengths of the business and significant opportunities remain.
The industrial flooring business completed a wide array of infrastructure projects including rail maintenance depots, energy from waste plants, rail platforms and wind farms, utilising both steel and composite material. Oil and gas activity remains subdued but day to day business was much improved on the back of increased UK infrastructure investment.
Despite the delays in the AMP6 programme, our security access covers business enjoyed a strong first half of the year. Order intake slowed in the third quarter before steadily improving towards the end of the year and overall results were in line with expectations. With just two years remaining on the AMP6 cycle, and much of the investment programme still to be carried out, further progress is expected.
The protection of critical infrastructure sites continues to produce good volumes for our security fencing operation with a wide range of installations including protection of data centres, power generation sites and the UK rail network.
Demand for solar frames was materially lower than the record

Strategic Report
www.hsholdings.com | Stock Code HILS
17
performance last year, as developers adapt their return model away from reliance on the now removed tax credits under the UK Renewable Obligation Scheme to one of battery storage and timed release of the stored power into the national grid. Once technology is proven and sold to investors we expect further orders to recommence.
A strong UK housing market aided our building products business and demand for composite residential doors, steel lintels and builders‘ metalwork reached record levels. Supplying national and independent housebuilders, in addition to national merchants, minimises geographical risks in demand patterns whilst maximising our exposure to both retail and social housing sectors.
Galvanizing Services
£m+/-%
Constant Currency
%2017 2016
Revenue 182.3 164.4 +11 + 7
Underlying operating profit 40.9 38.0 + 8 + 4
Underlying operating margin % 22.4 23.1
Reported operating profit 39.7 36.9
The Galvanizing Services division offers corrosion protection services to the steel fabrication industry with multi-plant facilities in the USA, France and the UK. The division accounts for 31% (2016: 30%) of the Group’s revenue and 50% (2016: 54%) of the Group’s underlying operating profit. Revenue increased by 11% to £182.3m (2016: £164.4m) including positive currency translation of £6.3m. Organic revenue growth was 7%. Underlying operating profit of £40.9m (2016: £38.0m) included a £1.5m currency benefit. The organic improvement in profitability was £1.4m. Underlying operating margin was 22.4%, marginally below the prior year record of 23.1%.
Reconciliation of Reported to Underlying operating profit
£m
2017 2016
Reported operating profit 39.7 36.9
Acquisition amortisation 1.2 1.3
Other items - (0.2)
Underlying operating profit 40.9 38.0
USALocated in the north east of the country, Voigt & Schweitzer is the market leader with seven plants offering local services and extensive support to fabricators and product manufacturers involved in highways, construction, utilities and transportation.
As expected, and against strong comparatives, volumes were 9% below the prior year, principally due to a large LNG project which ran throughout the first three quarters of 2016. Alternative energy demand was also materially lower year on year, particularly with respect to solar frames as the industry awaited a clear direction with regard to US energy policy and import tariffs. Day to day infrastructure demand remains strong and despite first half volumes being similar to the prior year, second half volumes increased by 8% against the same period the year before with strong contributions from utility, bridge & highway and OEM manufacturers. Continued focus on smaller, higher margin infrastructure jobs together with operational excellence and customer service once again resulted in record profitability despite the lower volumes. Operating margins were similar to the prior year despite significantly higher zinc input
costs. Recent US administration pronouncements on the strategic importance of additional investment in US infrastructure, including building and repairing roads and bridges, are supportive to the galvanizing industry and we are well positioned to benefit should this increased spend materialise.
FranceFrance Galva has ten strategically located galvanizing plants each serving a local market. We act as a key part of the manufacturing supply chain in those markets and have delivered a high level of service and quality to maintain our position as market leaders.
Overall volumes were 1% ahead of the prior year. In the first half the disruption of the national Presidential elections inevitably impacted the wider environment and volumes were 2% down year on year. Normality and confidence increasingly returned throughout the second half of the year and volumes were a creditable 5% ahead of the same period prior year and whilst competition remains strong, the business delivered improved profitability at similar margins despite significantly higher zinc input costs.
UKOur galvanizing businesses are located on ten sites, four of which are strategically adjacent to our Infrastructure Products manufacturing facilities.
Overall volumes were 4% higher year on year. Internal or ‘own work’ volumes from our UK Utilities business and road safety barrier were similar to the prior year. Despite continued low levels of larger structural steel projects, ongoing general infrastructure investment remains strong across a wide, and growing, customer base. Our strategy of focusing on lower volume, higher margin work in addition to investment in our key galvanizing facilities resulted in record profitability. Operating margin was broadly similar to the record prior year despite significantly higher zinc input costs.

18 Strategic Report
www.hsholdings.com | Stock Code HILS
18
Tower Tech Modular Cooling towers installed at a NetApp Data Center.

Strategic Report
www.hsholdings.com | Stock Code HILS
19
Financial reviewIncome statement phasing
First half
Second half
Full year
2017Revenue £m 291.8 293.3 585.1Underlying operating profit £m 38.8 42.5 81.3Underlying operating margin % 13.3 14.5 13.9Reported operating profit £m 35.4 38.7 74.12016
Revenue £m 259.3 280.8 540.1
Underlying operating profit £m 32.0 38.6 70.6
Underlying operating margin % 12.3 13.7 13.1
Reported operating profit £m 21.2 30.6 51.8
The phasing of revenue and to a greater extent underlying operating profit was marginally second half weighted in 2017, principally reflecting strength in the Group’s US operations and the impact of acquisitions together with a normal degree of seasonality across the Group’s portfolio of businesses.
Reported revenue of £585.1m was 8% ahead of the prior year. The acquisitions and disposals completed during both the current and prior year resulted in a net revenue increase of £21.1m and a £2.3m benefit to underlying operating profit, while the prior year restructuring of the Group’s non-US Pipe Supports businesses reduced current year revenues by £14.8m, but delivered an improvement in underlying operating profit of £1.0m. The translation impact arising from changes in exchange rates, principally the US Dollar and Euro, increased revenue by £14.4m and underlying operating profit by £2.1m. Organic revenue improvement was £24.3m and underlying operating profit growth was £5.3m, or 4% and 7% respectively. Further details of the performance of the Group are provided in the Operational Review.
£m RevenueUnderlying
operating profit
2016 540.1 70.6
Acquisitions & disposals 21.1 2.3
Restructuring actions (14.8) 1.0
Currency 14.4 2.1
Organic growth 24.3 5.3
2017 585.1 81.3
Cash generation and financingThe Group once again demonstrated its cash generating abilities with strong operating cash flow of £76.5m (2016: £78.2m).
The increase in working capital in the year was £19.1m (2016: increase of £0.1m), including an increase in inventories of £13.8m. The increase in inventories includes £6.7m in relation to zinc held by the Group’s galvanizing operations, resulting from a c.20% rise in zinc commodity prices during 2017, and £6.1m of additional inventory build in anticipation of projects to be delivered in Q1 2018. Working capital as a percentage of annualised sales increased to 17.4% at 31 December 2017 (2016: 14.2%), however excluding the impact of the zinc price increases the ratio is 16.2%. Debtor days were in line with the prior year at 61 days.
Capital expenditure at £20.7m (2016: £21.7m) represents a multiple of depreciation and amortisation of 1.1 times (2016: 1.2 times). Significant items of expenditure in the current year included £2.9m of Zoneguard temporary safety barrier investment to meet demand in our US, Australian and Scandinavian operations, £1.1m investment in further expansion of manufacturing facilities at our Pipe Supports centre in India, and £1.3m of product development spend reflecting the continued innovation within the Group’s suite of products, particularly for the roads markets. The Group continues to invest in organic growth opportunities where returns exceed internal benchmarks and its cost of capital.
The Group measures its operating cash flow performance based on its underlying cash conversion rate, defined as the ratio of underlying operating cash flow less capital expenditure to underlying operating profit. In 2017 the Group achieved an underlying cash conversion rate of 78% (2016: 93%), or 87% excluding the impact of zinc prices rises during the year. Over the past nine years the Group has achieved an average rate of 90%.
Reported£m
Pensions & provisions
£m
Non-underlying
items£m
Underlying£m
Operating profit 74.1 - 7.2 81.3
Non-cash items 24.7 - (3.7) 21.0
Change in:
Working capital (19.1) - - (19.1)
Pensions/provisions (3.2) 3.2 - -
Cash generated by operations
76.5 3.2 3.5 83.2
Capital expenditure (20.7) - - (20.7)
Asset sale proceeds 2.3 - (1.1) 1.2
Adjusted cash flow 58.1 3.2 2.4 63.7
Operating profit 74.1 - 7.2 81.3
Cash conversion % 78% 78%
The Group’s strong operating cash flow provides the funds to invest in growth, both organic and acquisitive, to restructure underperforming businesses where appropriate, to service debt, pension and tax obligations and to maintain a growing dividend stream, while a sound balance sheet provides a platform to take advantage of future growth opportunities.
Group net debt at 31 December 2017 was £99.0m, representing a year on year reduction of £13.0m including favourable exchange rate movements of £3.3m principally reflecting the strengthening in Sterling against the US Dollar towards the end of the year. The Group’s net debt includes 41% denominated in US Dollars and 8% denominated in Euros, which act as a hedge against the net asset investments in overseas businesses.

20 Strategic Report
www.hsholdings.com | Stock Code HILS
Change in net debt2017
£m2016
£m
Operating profit 74.1 51.8
Depreciation and amortisation* 23.2 21.0
Working capital movement (19.1) (0.1)
Pensions and provisions (3.2) -
Other items 1.5 5.5
Operating cash flow 76.5 78.2
Tax paid (16.7) (15.7)
Interest paid (net) (2.8) (2.8)
Capital expenditure (20.7) (21.7)
Sale of fixed assets 2.3 3.6
Free cash flow 38.6 41.6
Dividends (20.7) (16.2)
Acquisitions & disposals (5.8) (37.4)
Amortisation of refinancing costs (0.4) (0.4)
Net issue of shares (2.0) (1.2)
Change in net debt 9.7 (13.6)
Opening net debt (112.0) (91.5)
Exchange 3.3 (6.9)
Closing net debt (99.0) (112.0)
* includes £4.0m (2016: £2.6m) in respect of acquisition intangibles.
The Group’s principal debt facility consists of a headline £210m multicurrency revolving credit agreement maturing in April 2021, providing the Group with significant headroom against its expected future funding requirements.
Maturity profile of debt facilities
2017 2016
On demand £9.5m On demand £12.2m
2018-2020 £0.7m 2017-2020 £0.6m
2021 £227.1m 2021 £234.3m
At the year end the Group had committed debt facilities available of £227.8m and a further £9.5m in overdrafts and other on-demand facilities.
The principal debt facility is subject to covenants which are tested biannually on 30 June and 31 December. The covenants require that the ratio of EBITDA (adjusted profit before interest, tax, depreciation and amortisation as defined in the facility agreement) to net interest costs exceeds four times and require the ratio of net debt to EBITDA to be no more than three times.
The results of the covenant calculations at 31 December 2017 were:
Actual CovenantInterest Cover 37.1 times > 4.0 timesNet debt to EBITDA 1.0 times < 3.0 times
Appropriate monitoring procedures are in place to ensure continuing compliance with banking covenants and, based on our current estimates, we expect to comply with the covenants for the foreseeable future.
Net finance costs2017
£m2016
£m
Underlying net cash interest:
Bank loans/overdrafts 2.8 2.6
Non underlying:
Net pension interest 0.7 0.5
Costs of refinancing 0.4 1.1 0.4 0.9
3.9 3.5
Net financing costs in the year were £3.9m (2016: £3.5m). The net cost from pension fund financing under IAS19 was £0.7m (2016: £0.5m) which, given its non-cash nature, continues to be treated as ‘non-underlying’ in the Consolidated Income Statement. Non-underlying financing costs also include £0.4m relating to the Group’s amendments of the terms of its principal banking facilities in 2014 and 2016, reflecting the amortisation of the costs capitalised against the loans in accordance with IAS39. The underlying cash element of net financing costs increased by £0.2m to £2.8m (2016: £2.6m), the marginal change reflecting interest rate rises in the UK and US during 2017. Underlying operating profit covered net cash interest 29.0 times (2016: 27.2 times). Reported operating profit covered total reported interest 19.0 times (2016: 14.8 times).
Return on invested capital (‘ROIC’)The Group aims to maintain ROIC above its pre-tax weighted average cost of capital (currently c.11%), with a target return of 20%. In 2017, ROIC increased to 20.2% (2016: 19.4%) largely as a result of improvements in underlying operating margins, tight control over capital investment outflows and active management of the portfolio. The Group measures ROIC as the ratio of underlying operating profit to average invested capital. Invested capital is defined as net assets excluding current and deferred tax, net debt, provisions, retirement benefit obligations and derivative financial instruments, and therefore includes goodwill and other acquired intangible assets. On a reported basis, ROIC was 18.4% (2016: 14.3%).
Group ROIC Reported ROICOperating profit (£m) 81.3 74.1Average invested capital (£m) 403.1 403.1 ROIC % 20.2% 18.4%
Exchange ratesGiven its international operations and markets the Group is exposed to movements in exchange rates when translating the results of international operations into Sterling. Retranslating 2016 revenue and underlying operating profit using 2017 average exchange rates would have increased the prior year revenue by £14.4m and increased underlying operating profit by £2.1m, the movements primarily reflecting the impact of Sterling’s depreciation against the US Dollar compared with the prior year. Exchange rates continue to move in line with worldwide events and currency flows and hence are inherently difficult to predict, but will continue to have an impact on the translation of overseas earnings in 2018. Retranslating 2017 revenue and underlying operating profit using exchange rates at 23 February 2018 (inter alia £1 = $1.40 and £1 = €1.14) would reduce the revenue and underlying operating profit by £15.6m (3%) and £3.3m (4%) respectively. For the US Dollar, a 1 cent movement results in a £1.3m adjustment to revenue and a £0.3m adjustment to underlying operating profit, while the equivalent impacts for a 1 cent movement in the Euro are £0.6m and £0.1m respectively.
Operational and Financial Review (continued)

Strategic Report
www.hsholdings.com | Stock Code HILS
21
Non-underlying itemsThe total non-underlying items charged to operating profit in the Consolidated Income Statement amounted to £7.2m (2016: £18.8m) and were made up of the following:
Income statement
charge£m
Cash in the year
£m
Future cash
£m
Non-cash
£m
Business reorganisation costs (2.8) (0.1) (1.8) (0.9)
Impairment of assets held for sale (0.4) - - (0.4)
Amortisation of acquisition intangibles (4.0) - - (4.0)
Acquisition expenses (0.6) (0.6) - -
Profit on disposal of subsidiary
0.6 2.5 - (1.9)
(7.2) 1.8 (1.8) (7.2)
› Business reorganisation costs relate to a number of restructuring actions taken by the Group during the current and prior year.
– In June 2017 the Group initiated a rationalisation of its Variable Message Signs business that will result in the closure of two of its operating sites and the consolidation of activities into the remaining site in Hebburn, UK. The business has been operating across three sites since the acquisitions of VMS and Tegrel in 2014/15 and expects to take advantage of cost savings and efficiencies as a result. The anticipated cost of the rationalisation is £1.4m and the relocation is expected to be completed in the first half of 2018.
– Following a strategic review of the US Pipe Supports business, in March 2017 the Group completed a rationalisation of its branch structure resulting in the closure of three of the seven existing branches and the consolidation of their operations into one strategically located service centre between New York and Philadelphia, serving the eastern region. The cost of this programme was £0.4m.
– Following the acquisition of Tower Tech in August 2017, the Group has commenced a programme to close Tower Tech’s existing facility in Oklahoma and relocate the business to our Creative Pultrusions site in Pennsylvania. The cost of this programme, which is expected to be completed in the second half of 2018, is £0.4m.
– In December 2016, having reassessed the prospects in the market, the Group announced the closure of its roads business in India. Total costs of £2.3m include a further £0.4m charge in 2017.
– In March 2016 the Group announced the closure of its non-US Pipe Supports operations. Whilst substantially completed in the prior year, additional costs of £0.2m have been incurred in the current year on finalisation of the closure.
› In April 2017 the Group sold its traffic data collection business, CA Traffic Limited, to TagMaster AB for a consideration of £2.6m (after costs). Net assets disposed were £2.0m resulting in a profit on disposal of £0.6m.
› Non-cash amortisation of acquired intangible fixed assets was £4.0m (2016: £2.6m), the increase reflecting the acquisitions made by the Group during the current and prior year.
› Acquisition related expenses of £0.6m (2016: £1.8m) reflect costs associated with acquisitions expensed to the Consolidated Income Statement in accordance with IFRS3 (Revised).
› An impairment charge of £0.4m (2016: £nil) has been recognised in respect of a property reported within assets held for sale, reflecting a reassessment of its likely realisable value.
The net cash impact of the above items was an inflow of £1.8m in the year, a £1.8m outflow expected in 2018 and a non-cash element therefore amounting to £7.2m. The Directors continue to believe that the classification of these items as ‘non-underlying’ aids the understanding of the underlying business performance.
TaxThe Group’s tax charge for the year was £16.3m (2016: £14.5m). The underlying effective tax rate for the Group was 24.0% (2016: 24.0%), which is lower than the weighted average mix of tax rates in the jurisdictions in which the Group operates as a result of the benefit of tax efficient financing arrangements, the successful conclusion of tax uncertainties related to prior years and the impact on the Group’s deferred tax liabilities of forthcoming reductions in tax rates contained in the US Tax Cuts and Jobs Act passed in December 2017. Cash tax paid was £16.7m (2016: £15.7m), with the increased spend reflecting the growth in the Group’s profits. Tax paid was broadly in line with the current tax charge for the year of £18.2m.
The Group’s net deferred tax liability is £5.6m (2016: £7.8m). Following the enactment of changes to US tax legislation, deferred tax balances relating to the Group’s US businesses as at 31 December 2017 have been recalculated based on the revised US tax rates resulting in a £1.9m reduction in the Group’s net deferred tax liability. A £6.7m (2016: £8.9m) deferred tax liability is provided in respect of brand names, customer relationships and other contractual arrangements acquired, while a further £0.9m (2016: £1.1m) is provided on the fair value revaluation of French properties acquired as part of the Zinkinvent acquisition in 2007. These liabilities do not represent future cash tax payments and will unwind as the brand names, customer relationships, contractual arrangements and properties are amortised.
The Group expects that the significant tax reforms contained in the US Tax Cuts and Jobs Act will benefit its future post tax earnings. Although partly offset by an adverse impact from other changes, it is expected that the future reduction in the US corporate income tax rate from 35% to 21% will reduce the Group’s future overall effective percentage tax rate by around 1-2 percentage points.
Earnings per shareThe Board believes that underlying earnings per share (‘UEPS’) gives the best reflection of performance in the year as it strips out the impact of non-underlying items (as described in note 3). UEPS for the period under review increased by 15% to 75.9p (2016: 65.9p), driven by organic revenue growth in the Group’s core markets, continuing improvements in underlying operating margins, currency translation benefits and the impact of active management of the Group’s portfolio. The diluted UEPS was 74.8p (2016: 65.1p). Basic earnings per share was 68.6p (2016: 43.0p). The weighted average number of shares in issue was 78.6m (2016: 78.5m) with the diluted number of shares at 79.6m (2016: 79.3m) adjusted for the outstanding number of dilutive share options.

22 Strategic Report
www.hsholdings.com | Stock Code HILS
Bus ma volores sincte net poreiuntur minte dolupiet, alitium, ad earchitatius volorib uscius exerovideri blaborem. Itaqui ratur aut optam, nulpa con rem sitem a consecero dolendi assitatur? Secatio rempost, tem nam, si
Lupta pore latur aut et es rem erumenduci si accuptam quo occupta quae lautem quunto modis nis millore scipsam fugia que di cus etur rehenderit, qui te volorempore nonserrovit magnis quia coruntem.
“
“
Find out more about the company at xxxxxxxxxxxxxxxxxxxxxxxxxxxxx
Title
Case Study
Find out more about the company at: www.josephash.co.uk
Joseph Ash - Revolutionising UK racehorse pre-trainingIn the picturesque and quiet village of Lambourn, West Berkshire, a revolutionary development has been taking place at the Kingwood Stud, a premier horse training facility owned by racehorse owner and breeder Mehmet Kurt.
Kingwood Stud is set to open the new Kurtsystems – a £20m pre-training system designed to provide controlled and synchronised exercise for young racehorses, to develop stronger bones, cartilages, muscles and tendons before they enter a traditional training regime.
A Joseph Ash Galvanizing client has been one of the contractors on the project, and Joseph Ash Chesterfield galvanized approximately 411 tons of structural steel.
Horses are trained on an artificial surface training circuit, without jockeys, by being harnessed into specially designed ‘cabins’ which travel along an overhead rail track at set speeds. The speeds are managed by a computer controlled unit at the back of the cabins. The horses carry specialist saddles to replicate the weight of a jockey.
It is a mile-long circuit which can train up to 12 horses at a time. It can also be used to rehabilitate injured horses.
The galvanizing of the steel ensures the facilities’ longevity.
Images
Top and Bottom – Horses at work in the new ‘Kurtsystems’ training system at Kingwood stud.

Strategic Report
www.hsholdings.com | Stock Code HILS
23
DividendsDividends paid in the year were £20.7m. The proposed final dividend is 20.6p per share (2016: 17.9p per share) resulting in a total dividend for the year of 30.0p per share (2016: 26.4p per share), a 14% increase on the prior year. Underlying dividend cover remains at 2.5 times (2016: 2.5 times).
The Board is committed to a long-term sustainable dividend policy. Ordinary dividends will grow broadly in line with underlying earnings, targeting dividend cover of between 2x and 2.5x underlying earnings per share over the medium term.
PensionsThe Group operates a number of defined contribution and defined benefit pension plans both in the UK and overseas. The IAS19 deficit of the defined benefit plans as at 31 December 2017 was £25.6m, marginally lower than the £27.3m reported at 31 December 2016. The reduction in the overall deficit relates principally to the UK scheme and was largely driven by a strong asset performance and deficit recovery payments made during the year, offsetting the impact of a 20 basis point reduction in the discount rate in line with movements in corporate bond yields.
The Group’s UK defined benefit pension scheme, The Hill & Smith 2016 Pension Scheme (the ‘Scheme’), remains the largest employee benefit obligation within the Group. In common with many other UK companies, the Scheme is mature having significantly more pensioners and deferred pensioners than active participating members and is closed to new members. The IAS19 deficit of the Scheme as at 31 December 2017 was £20.8m (2016: £22.4m). The gross assets and liabilities of the Scheme were each reduced by £10.0m during the year as a result of transfer values taken by a number of members.
The Group remains actively engaged in dialogue with the Scheme’s Trustees with regard to management, funding and investment strategy and, in May 2017, an update to the investment strategy was agreed. A formal actuarial valuation of the Scheme as at April 2016 was also finalised during the year, following which the Group agreed a deficit recovery plan with the Trustees that requires cash contributions amounting to £2.5m per annum until September 2027.
AcquisitionsIn March 2017 the Group completed the acquisition of the trade and assets of Kenway Corporation, a specialist in technologically advanced composite design, manufacturing and field service work across a broad range of industries including marine, power, pulp & paper, transportation and renewable energy. Consideration for the acquisition was £6.1m and intangible assets arising amounted to £5.1m, comprising goodwill of £3.7m, customer relationships of £0.7m and brand valuation of £0.7m. The acquired business has been integrated into Creative Pultrusions, our existing US composites operation.
In August 2017 the Group acquired the trade and assets of Tower Tech, Inc., a US manufacturer of modular build, high efficiency composite cooling towers for a net cash consideration of £2.4m, resulting in goodwill of £0.4m. In 2018 the acquired business will be relocated from its current facility in Oklahoma to our Creative Pultrusions facility in Pennsylvania.
On 1 January 2018 we acquired the trade and assets of D. Gibson Road & Quarry Services Limited for a cash consideration of £0.3m. Based in Scotland, the business will be integrated with Mallatite Limited, our UK lighting column and traffic signage business, further expanding our product offering in that market.
The level of headroom that the Group maintains in its principal banking facilities enables us to continue to seek opportunities for
acquisitive growth where potential returns exceed the Group’s benchmark performance targets.
Treasury management
All treasury activities are co-ordinated through a central treasury function, the purpose of which is to manage the financial risks of the Group and to secure short and long term funding at the minimum cost to the Group. It operates within a framework of clearly defined Board-approved policies and procedures, including permissible funding and hedging instruments, exposure limits and a system of authorities for the approval and execution of transactions. It operates on a cost centre basis and is not permitted to make use of financial instruments or other derivatives other than to hedge identified exposures of the Group. Speculative use of such instruments or derivatives is not permitted. Liquidity, interest rate, currency and other financial risk exposures are monitored weekly. The overall indebtedness of the Group is reported on a daily basis to the Group Finance Director.
Derek Muir Mark PeglerGroup Chief Executive Group Finance Director
7 March 2018
Operational and Financial Review (continued)

24 Strategic Report
www.hsholdings.com | Stock Code HILS
Measuring Our Performance
The Board has adopted certain financial and non-financial key performance indicators (‘KPIs’). Other similar performance indicators are used at subsidiary business level and adapted to suit the diversity and variety of the Group’s operations.
The Group uses a number of performance indicators to measure operational and financial activity in the business. Most of these are monitored and reviewed on a weekly or monthly basis. A comprehensive monthly management accounts pack, including profit and loss statements and key ratios, is prepared for each business. In addition, every Managing Director in the Group submits a monthly report which is the basis of regular operational meetings.
The KPIs below are used as measures of the longer-term health of the business and for monitoring progress in the implementation of the Group’s strategy.
KPIs Total revenue growth
Underlying operating profit margin
Underlying earnings per share (‘UEPS’) growth
Link to our strategy
The Group’s core strategy is to deliver sustainable profitable growth. This is achieved with the target of mid-single digit organic revenue growth and selective acquisitions.
In line with its strategy of delivering balanced profitable growth, the Group reviews underlying operating margins to assess returns achieved on revenues.
The Group considers UEPS growth to be its key indicator of the profitable growth of the Group. Achieving UEPS growth enables the Group to maintain its progressive dividend policy.
KPI definition Annual % growth in total revenue.Annual % organic growth in revenue.
Underlying operating profit as a % of total revenue.
Underlying profit after tax for the year divided by weighted average number of ordinary shares.
2017 performance
Comment Organic revenue growth in 2017 was 4.5%, largely driven by the Group’s Galvanizing and international Roads businesses where we experienced increased demand through the year. Total growth was higher at 8% as a result of acquisitions made during the current/prior year and currency translation benefits.
The Group’s underlying operating profit of £81.3m represents a 13.9% return on sales, an 80bps improvement on the prior year. The increase reflects a combination of strength in our core markets, currency translation impacts and the benefits of active management of the Group’s portfolio.
The Group’s UEPS for 2017 is 75.9p, an increase of 15% compared with 2016. Key factors were the contribution from organic revenue growth, the increase in underlying operating margins, acquisitions completed during the current/prior year and currency translation benefits. There were no significant interest or tax impacts year on year.
2016 2017
4.5%4.
6%
Organic growth Up 80bps
2016 2017
13.9
%
13.1
%
15% growth
2016 2017
75.9
p
65.9
p
Total growth
2016 2017
8.3%
15.5
%

Strategic Report
www.hsholdings.com | Stock Code HILS
25
Free cash flow Return on invested capital (‘ROIC’) Health and safety CO2e emissions
The Group monitors free cash flow performance to ensure that its profits generate sufficient cash to support its acquisition strategy and to maintain progressive dividend payments.
The Group targets ROIC to ensure it maintains an efficient balance sheet and that its operations, both existing and acquired, enhance shareholder value.
The health and safety performance of each subsidiary is key to our management of the Group as a responsible employer and to our reputation in the markets in which we operate.
Cost reductions and greater efficiency, improve not only our operating margins but also the sustainability of our operations.
Underlying free cash flow divided by underlying operating profit.Underlying free cash flow is defined as underlying operating cash flow less capital expenditure.
Underlying operating profit divided by average invested capital.Invested capital is defined as net assets excluding current and deferred tax, net debt, provisions, retirement benefit obligations and derivative financial instruments.
Number of accidents, including minor injuries.Number of lost time accidents.Audit scores and benchmarkings.
Carbon usage comparison year on year and over a three year programme.
The Group achieved an underlying cash conversion rate of 78% in 2017 (2016: 93%). The reduction reflects a working capital increased of £19.1m in the year, which includes a £6.7m impact from rising zinc raw material prices. Capital expenditure at £20.7m represented a multiple of depreciation and amortisation of 1.1 times (2016: 1.2 times).
The Group aims to achieve ROIC that exceeds its weighted average cost of capital (currently c.11% on a pre-tax basis), with a target return of 20%. In 2017 the Group achieved ROIC of 20.2% (2016: 19.4%), the improvement largely reflecting further increases in underlying operating margins during the year and the benefits of strategic actions taken.
The focus during 2017 remained the desire to raise the awareness of minor injury and near-miss reporting and improve the culture within our businesses, thereby helping our employees to better understand the inherent benefits from having a safe place to work.
Reported injuries are consistent with 2016 on a like-for-like basis with 503 reported (2016: 509). However lost-time injuries fell 31% from 178 to 123.
The Group has continued to focus on energy saving opportunities identified from the ESOS audits and during 2017 the Energy Forum met twice to discuss shared opportunities and best practices. On the basis of these initiatives actual CO2e used in 2017 remained at the levels used in 2016, even though Group revenues increased. The intensity ratio fell by 8%.
Down 15ppts
2016 2017
78%
93%
Up 80bps
2016 2017
20.2
%
19.4
%
Down 1%
2016 2017
503
509
IR down 8%
2016 2017
68,1
26
68,1
67
2016 2017
0.11
6
0.12
6
CO2e IR

26 Strategic Report
www.hsholdings.com | Stock Code HILS
Risk Management and AssuranceRisk Management and Assurance
Effective risk management is critical to the achievement of our strategic objectives of geographical diversification, entrepreneurial management, portfolio management, and targeted growth returns. All our subsidiaries hold leading positions in the provision of galvanizing services or the design, manufacture and supply of infrastructure products and the Group benefits from a risk management system that is integrated into the daily business activities of these subsidiaries.
Whilst the Board has delegated the risk discussion to the Audit Committee, the Board is responsible for the overall stewardship of our system of risk management and internal control. It has established the level of risk that is appropriate for our business and acceptable in the pursuit of our strategic objectives. It has also set delegated authority levels to provide the framework for assessing risks and ensuring that they are escalated to the appropriate levels of management, including up to the Board where appropriate, for consideration and approval.
As part of this process, the Risk Committee receives reports from the subsidiaries on their individual risks. The Committee met formally five times during the year and comprises the Group Financial Controller, the Group Company Secretary, the Assistant Company Secretary, the Group Internal Audit Manager and the Group’s Corporate Development Director. Subsidiary Managing Directors are invited to attend on a rotational basis.
The Committee reviews and validates the subsidiary reports, before presenting a Group-wide report to the Audit Committee for discussion on both subsidiary risk and Group risk. Challenging feedback is provided by the Audit Committee to further question the validity and mitigations of the risks presented and to identify others not already considered.
This process ensures that risks are not just the product of a bottom-up approach but are also examined from a top-down perspective via an integrated senior management approach, which is closely aligned with the Group’s strategy. In order to enhance the Group’s approach to risk generally in 2017 we:
› Delivered in-depth face-to-face training to the senior managers of our largest subsidiaries internationally to equip them with the latest insight into risk management techniques and emerging risk themes;
› Developed a risk ‘manual’ for all subsidiaries to refer to when holding strategic risk meetings, which allows the subsidiaries
autonomy in identifying and scoring risks particular to their business, but also enables the Group Board more consistent comparison between different businesses;
› Expanded the composition of the Risk Committee to increase the pool of knowledge and experience;
› Increased the best practice sharing and resources available for the subsidiaries to manage risks;
› Continuously worked to improve Board reporting, developing reporting tools for our subsidiaries to help them embed risk identification and articulation into their business processes; and
› Introduced a Risk Management Framework across the Group, clarifying how risk is to be managed in a way which satisfies the autonomous operating model of the Group and, in particular, roles and responsibilities at each level, (see below).
This approach, enhanced throughout 2017, has allowed the Board to carry out a robust assessment of the principal risks and uncertainties that might threaten the Group’s business model, future performance, solvency and liquidity which can be found on pages 28 to 30.
Key focus for 2018:
› Continued assessment of the principal risks facing the Group and subsidiaries including those that might threaten the Group’s business model, future performance, solvency and liquidity;
› Further work to mature the risk management processes with our subsidiaries, particularly by increasing the range of methods used to assess the effectiveness of risk mitigations;
› Continued development of best practice resources available to subsidiaries;
› To work with the recently appointed Group Internal Audit Manager to further develop the risk-based approach to internal audit; and
› Assessment of new methods in risk management and internal controls to ensure that our approach remains up-to-date and appropriate for a quoted company.
Risk Management FrameworkThe Group operates a tiered approach to risk management, with risk registers at each level linked to the appropriate objectives and flows of appetite, information and assurance as outlined in Figure 1.
Level 3 Risks(Trading divisions)
Level 2 Risks(Subsidiaries)
Principal Risks (PLC)
Identified against Corporate Goals & Objectives
Reported to investors
Used to set risk appetite for the Group
Identified against Subsidiary Goals & Objectives
Key risks and assurance escalated upwards
Identified against Trading divisional Goals & Objectives
Key risks and assurance escalated upwards
Figure 1
Approach to risk management
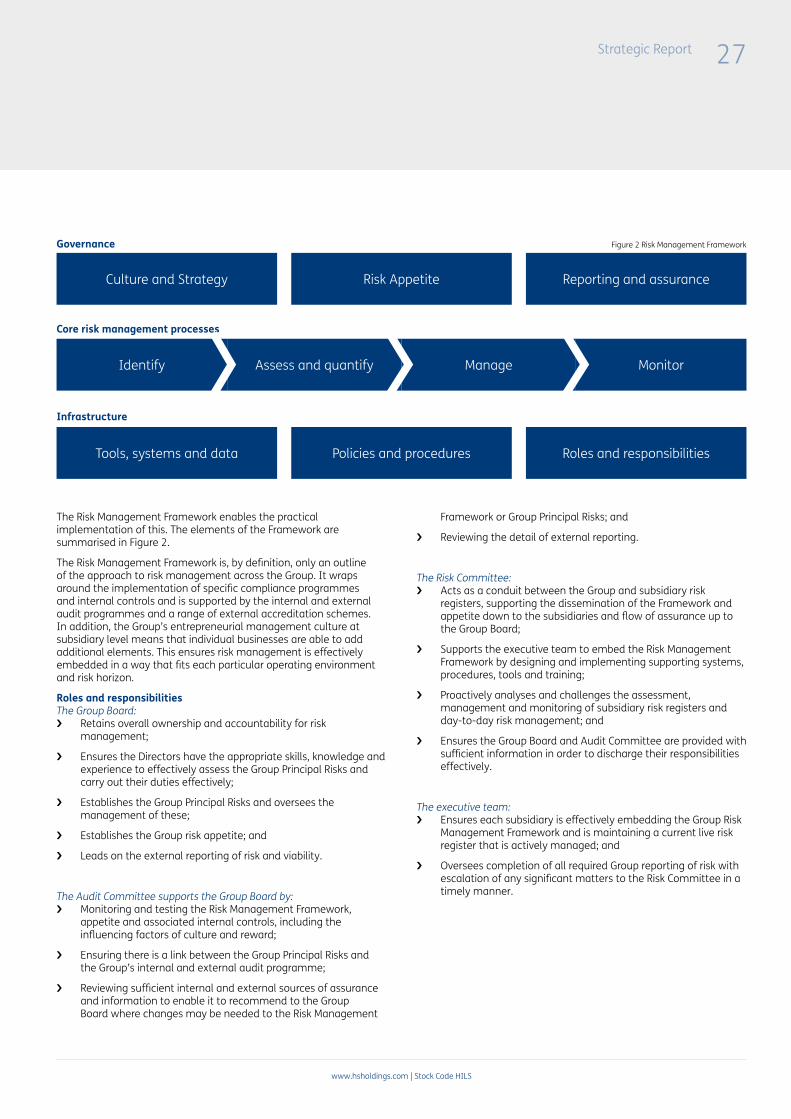
Strategic Report
www.hsholdings.com | Stock Code HILS
27
The Risk Management Framework enables the practical implementation of this. The elements of the Framework are summarised in Figure 2.
The Risk Management Framework is, by definition, only an outline of the approach to risk management across the Group. It wraps around the implementation of specific compliance programmes and internal controls and is supported by the internal and external audit programmes and a range of external accreditation schemes. In addition, the Group’s entrepreneurial management culture at subsidiary level means that individual businesses are able to add additional elements. This ensures risk management is effectively embedded in a way that fits each particular operating environment and risk horizon.
Roles and responsibilitiesThe Group Board:
› Retains overall ownership and accountability for risk management;
› Ensures the Directors have the appropriate skills, knowledge and experience to effectively assess the Group Principal Risks and carry out their duties effectively;
› Establishes the Group Principal Risks and oversees the management of these;
› Establishes the Group risk appetite; and
› Leads on the external reporting of risk and viability.
The Audit Committee supports the Group Board by: › Monitoring and testing the Risk Management Framework,
appetite and associated internal controls, including the influencing factors of culture and reward;
› Ensuring there is a link between the Group Principal Risks and the Group’s internal and external audit programme;
› Reviewing sufficient internal and external sources of assurance and information to enable it to recommend to the Group Board where changes may be needed to the Risk Management
Framework or Group Principal Risks; and
› Reviewing the detail of external reporting.
The Risk Committee: › Acts as a conduit between the Group and subsidiary risk
registers, supporting the dissemination of the Framework and appetite down to the subsidiaries and flow of assurance up to the Group Board;
› Supports the executive team to embed the Risk Management Framework by designing and implementing supporting systems, procedures, tools and training;
› Proactively analyses and challenges the assessment, management and monitoring of subsidiary risk registers and day-to-day risk management; and
› Ensures the Group Board and Audit Committee are provided with sufficient information in order to discharge their responsibilities effectively.
The executive team: › Ensures each subsidiary is effectively embedding the Group Risk
Management Framework and is maintaining a current live risk register that is actively managed; and
› Oversees completion of all required Group reporting of risk with escalation of any significant matters to the Risk Committee in a timely manner.
Figure 2 Risk Management Framework
Culture and Strategy
Tools, systems and data
Identify
Risk Appetite
Policies and procedures
Assess and quantify
Reporting and assurance
Roles and responsibilities
Manage Monitor
Governance
Infrastructure
Core risk management processes

28 Strategic Report
www.hsholdings.com | Stock Code HILS
Principal Risks and Uncertainties
Economic
Risk: Changes in government spending plans
TrendNo change
Link to strategy
Description and potential impactThe Group generates the majority of its revenues from its operations located in the UK and the USA.A reduction in UK or US government infrastructure spending, particularly in relation to national roads infrastructure in the UK, could reduce demand for our products and services. The financial burden on the governments of both jurisdictions from economic downturn may lead to reduced spending in the principal markets in which the Group operates.
MitigationOur existing entity portfolio contains diversity of product, market and territory and we will continue with this approach as we review potential acquisitions.Market development initiatives.Product development initiatives.Co-operation between Group businesses, leveraging the Group’s size/international footprint and exploiting synergies.
Risk: Changes in global outlook and geopolitical environment
TrendNo change
Link to strategy
Description and potential impactThe Group operates in a range of end-user markets around the world and may be affected by political, economic or regulatory developments in any of these countries.Material adverse changes in the political and economic environments in the countries in which we operate have the potential to put at risk our ability to execute our strategy.
MitigationThe Group has a diverse portfolio of businesses with exposure to a range of markets and geographies, limiting exposure to any one country or market sector.Current and future financial performance is continuously monitored, facilitating rapid response to changes in market conditions.Entrepreneurial culture established through a decentralised management structure, ensuring that Group businesses are agile and responsive to changes in their competitive environments.Hedging mechanisms used to limit potential effects of economic volatility on forecasted revenue.
Commercial & Financial
Risk: Product failure
TrendNo change
Link to strategy
Description and potential impactThe Group operates in infrastructure markets where it is critical that its products meet customer and legislative requirements and where the consequences of product failure are potentially serious.Significant product failure arising from component defects or warranty issues may require remediation including the replacement of defective components or complete products, resulting in direct financial costs to the Group and/or wider reputational risk.
MitigationProducts tested, approved and accredited by regulatory bodies.Quality control protocols fully implemented and continuously monitored.Contractual controls in place to minimise economic impacts.Insurance cover maintained globally with insurance partners.Litigation supported/managed by external legal specialists.
Risk: Contractual arrangements
TrendNo change
Link to strategy
Description and potential impactThe Group delivers its commitments to its customers through a variety of contractual arrangements of both a short and medium term nature.Weaknesses in the contract tendering process, inappropriate pricing, misalignment of contract terms, ineffective contract management or failure to comply with contractual conditions could result in loss of revenues, pressure on operating margins and wider reputational damage to the Group.
MitigationGroup material contract review process ensures specialist central oversight of key contractual arrangements.Contracts training for key staff.Dedicated quantity surveyors and contracts managers embedded in subsidiary management structures to control projects.Litigation supported/managed by external legal specialists.Insurance cover maintained globally with insurance partners

Strategic Report
www.hsholdings.com | Stock Code HILS
29
Operational
Risk: Supply chain deficiency
TrendNo change
Link to strategy
Description and potential impactThe Group’s businesses depend on the availability and timely delivery of raw materials and purchased components, which could be affected by disruption in its supply chain.Supply chain failures as a result of performance, cost, quality and/or insolvency may have an adverse impact on the Group’s production capacity and lead to an inability to meet customer requirements, resulting in reduction in revenues, potential loss of market share and possible reputational damage.
MitigationGroup procurement standards in place, including robust due diligence of supply chain partners and requiring dual sourcing where available.Maintenance of relationships with key suppliers through regular interaction and assessment of performance/ financial status.Central oversight of material procurement contracts ensuring robust contractual protections.Goods inwards and stock management processes in place to reduce the likelihood of defects in or shortage of raw materials.Raw material hedging.
Risk: Weaknesses in IT systems
TrendHigher
Link to strategy
Description and potential impactThe Group relies on the information technology systems used in the daily operations of its subsidiaries.A failure or impairment of those systems or any inability to effectively implement new systems could cause a loss of business and/or damage to the reputation of the Group, together with significant remedial costs.
MitigationExternal specialist support with the development and oversight of IT system change programmes.Disaster recovery plans documented, tested and monitored by Group businesses.The Group’s Policy Manual incorporates IT policies in respect of system back-up procedures and hardware/software protection.External GDPR and cyber risk reviews commissioned in 2017 and reviewed by the Board in 2018 – Management responses are being prepared.
Risk: Acquisition strategy failure
TrendNo change
Link to strategy
Description and potential impactThe Group’s growth strategies include the acquisition of businesses around the world that complement or supplement its existing activities.Failure to execute an effective acquisition and integration programme would have a significant impact on the Group’s ability to generate long term value growth for shareholders.
MitigationOur strategic planning process supports our M&A planning.Board approval required for Group acquisitions, in line with the Group Board’s Schedule of Matters Reserved.Due diligence protocols deployed in relation to assessment of target businesses, including financial, commercial, legal and others where appropriate.Contractual protections and assurances sought from sellers to mitigate subsequent identification of risks.‘100 Day’ post-acquisition integration plan established for all material acquisitions with regular performance monitoring and reporting to the Board.
Risk: Lack of product development and innovation
TrendNo change
Link to strategy
Description and potential impactThe Group operates in global infrastructure markets where continuous innovation is integral to the Group’s product offering and where a failure to innovate could result in product obsolescence, the entry of new competitors and/or loss of market share.The development of new products and technologies carries risk including failure to develop a commercially viable offering within an acceptable timeframe.
MitigationEntrepreneurial culture established through a decentralised management structure, ensuring that Group businesses are agile and responsive to changes in their competitive environments. The Group actively encourages and supports research and development programmes at subsidiary level where knowledge of the market and the needs of our customers are greatest.Executive Board approval of product development proposals within the Group’s capital spend approval policies.Active Intellectual Property management.Dedicated quality compliance resources in place across Group businesses, ensuring responsiveness to regulator and/or customer approval requirements.Board monitoring of emerging risks alongside external specialist support, where both the risks identified and the potential opportunities arising are considered.
Portfolio management Geographic diversification Target returns and leverage Entrepreneurial culture

30 Strategic Report
www.hsholdings.com | Stock Code HILS
Human Resources
Risk: Failure to recruit and retain key employees
TrendSlightly higher
Link to strategy
Description and potential impactThe Group encourages an entrepreneurial culture through a decentralised management structure.An inability to attract, develop and retain high-quality individuals in key management positions could severely affect the long term success of the Group.
MitigationSuccession planning model driven by the Group Chief Executive and overseen by the Board.Implementation of contractual protections and retentions in employment contracts of senior management and other key employees.Competitive remuneration, benefits and incentive plans offered to employees and regularly benchmarked.Recruitment process developed to include competency requirements and skills gap analysis.Training and development of employees, which includes a programme of IOD and ILM courses for senior management and identified potential successors, and apprenticeship and other vocational courses for specialist and technical roles.
Principal Risks and Uncertainties (continued)
Legal & Regulatory
Risk: Failure to comply with applicable health and safety legislation
TrendNo change
Link to strategy
Description and potential impactThe Group operates a number of manufacturing facilities around the world.A failure in the Group’s health and safety procedures could lead to environmental damage or to injury to or death of employees or third parties, with a consequential impact on operations and the increased risk of regulatory or legal action being taken against the Group. Any such action could result in both financial damages and damage to reputation.
MitigationRegular health and safety monitoring, supported by an external independent health, safety and environmental consultant and utilizing a ‘safety cloud’ online reporting framework.Group Health and Safety Forum established to monitor performance and share best practice.Culture of zero tolerance in respect of health and safety violations promoted by the Board and disseminated throughout Group businesses supported with appropriate HR policies and the Business Code of Conduct.Open relationships maintained with regulatory bodies.External health and safety accreditations.Health and safety required as a priority area of focus for new acquisitions.
Risk: Violation of applicable laws and regulations
TrendSlightly higher
Link to strategy
Description and potential impactThe Group’s global operations must comply with a range of national and international laws and regulations including those related to anti-bribery and corruption, human rights and employment, trade/ export compliance and competition/anti-trust.A failure to comply with any applicable laws and regulations could result in civil or criminal liabilities and/or individual or corporate fines and could also result in debarment from government-related contracts, restrictions on ability to trade or rejection by financial counterparties as well as reputational damage.
MitigationGroup Code of Conduct sets out required approach for all staff.Staff training provided on Anti-Bribery and Corruption and Competition Compliance.Competition compliance manual implemented by each Group business.Programme of audits undertaken on a cyclical basis to review subsidiary compliance with regulatory requirements, including for example simulated ‘dawn raids’.Software solutions implemented globally to ensure compliance with trade and export legislation.Externally hosted whistleblowing hotline available to all employees to allow them to raise concerns in confidence or anonymously, if preferred.Modern Slavery compliance programme continued through 2017.
Portfolio management Geographic diversification Target returns and leverage Entrepreneurial culture

Strategic Report
www.hsholdings.com | Stock Code HILS
3131
Top: Varioguard protection barriers in place on Blackfriars Bridge, London.
Bottom: Galvanized bridge on the Island of Kauai in Hawaii

32 Strategic Report
www.hsholdings.com | Stock Code HILS
Corporate Responsibility
We recognise that to be successful in achieving our strategy of sustainable profitable growth it is essential that we act responsibly in all our businesses and towards all people who are stakeholders in them: our employees, our customers and suppliers and the communities in which we operate.
The Group is committed to implementing the correct policies and procedures relating to the sustainability of the environment and to the successful delivery of an effective health and safety system, as well as ensuring that the people connected with the Group behave in the right way, complying with all local legal and regulatory requirements.
Board level responsibilityDerek Muir, the Chief Executive, is the Director responsible for the Corporate Responsibility (‘CR’) performance of the Group and is supported by the operating Directors in achieving compliance with the Group’s policies, primarily through:
› Communication across the businesses;
› Implementation of supporting principles; and
› Monitoring performance and improvements.
Our operating Directors are supported in this by the Group’s employees, who are encouraged to contribute positively to the communities and environment in which we do business.
Our peopleThe Group recognises the need for successful businesses to deliver a good service and product and this can only be done by developing, supporting and maintaining the right staff to provide this. Appropriate resources and support to maintain the required standards of performance and conduct expected of employees are provided. This is only achieved through the provision of training and career development opportunities, promoting a forward thinking, proactive and creative working environment to engage and motivate employees. Investing in our people development framework helps ensure we create a skilled and motivated workforce that will positively impact on our future success.
Succession planning and talent managementIn 2015 we commenced our Succession Planning and Talent Management (‘SPTM’) programme for managers across all subsidiaries, to nurture the talent within the Group and ensure we are retaining and developing our leaders of the future and this has developed over the last two years. Part of this process, in 2017, was for all Subsidiary Boards to identify the senior managers within the Group who would succeed them on their subsidiary board as directors.
UK subsidiaries have also engaged positively with the SPTM process and recognise the need to address succession considerations, talent management and staff development to enable ongoing corporate success. The SPTM programme has supplemented and/or formalised existing arrangements for some companies; for others it has introduced a new approach to explore succession planning and learning and development more generally; whilst others are still relatively recently adopting the process as a result of ongoing expansion and restructuring. A number of management and leadership programmes have been co-ordinated since the SPTM launch – an executive level development programme, culminating in the IOD Corporate Director qualification; a senior management leadership programme and a first line management development programme sponsored by the Institute of Leadership and management (‘ILM’). All these programmes additionally enable managers to undertake recognised management qualifications as part of their studies. These management programmes are
underpinned by Group-wide programmes at supervisory and team leader level. Our aim is to continually develop our Group leadership and management capabilities across all levels of the organisation, enabling all our managers to effectively motivate and co-ordinate the teams in their business. Work has commenced with non UK-based subsidiaries to develop the same kind of SPTM programmes.
Group learning and development – strengthening our talent pipelineAlongside these management development programmes, individuals are encouraged to undertake appropriate specialist/technical and personal development opportunities appropriate to their roles and aspirations and in line with organisational strategy.
At a local level, individuals also undertake specialist/technical skills development, pertinent to their roles – including qualifications in health and safety, project management, finance and accountancy, construction and engineering.
Engagement and opportunity is also provided through:
› Offering share ownership within the Group through the employee Sharesave Schemes, which currently have circa 700 employees participating;
› Support with education, leading to recognised professional and academic qualifications;
› Health and safety training;
› Anti-bribery, international competition, Modern Slavery and the Group’s Code of Business Conduct (‘CBC’) training;
› Opportunities to enhance individual knowledge and skill required for the employee’s position, which includes new procedures and policies; and
› Communication through the Group’s website and intranet site.
Diversity and inclusionThe Group is committed to equal opportunities and fairness and to policies, practices and regulations for promotion of equal opportunities in recruitment, training and career development. As the Group has a global presence, these are appropriate for the local areas of operation. This includes a zero tolerance approach to discrimination, bullying and harassment. All our policies promote the principles of fairness and equal opportunities.
The current policy on diversity can be found on the CR section of the website.
As at 31 December 2017, the Group-wide split of male and female employees is shown in the charts opposite.
Gender PayGender pay reporting legislation requires employers with 250 or more employees to publish statutory calculations every year showing how large the pay gap is between their male and female employees. This legislation affects three of our UK Subsidiaries: Birtley Group Ltd, a galvanizer and construction business; Joseph Ash Ltd, a galvanizing business; and Hill & Smith Ltd, a roads barrier manufacturer.
The gender pay gap data, which can be found on each company’s website via http://www.hsholdings.co.uk/, shows the difference in the average pay between all men and women in a workforce and is different to any equality of pay, which deals with the pay differences between men and women who carry out the same jobs, similar jobs or work of equal value.

Strategic Report
www.hsholdings.com | Stock Code HILS
33
Number of PLC Board Directors:Male & Female split
Male 5
Female 1
Number of senior managers in the Group: Male & Female split
Male 182
Female 19
Total number of employees in the Group: Male & Female split
Male 3,538
Female 346
Number of other Directors: Male & Female split
Male 71
Female 3
Behaving correctlyThe Group is committed to conducting its business activities responsibly, ethically and in accordance with the laws and regulations applicable to the jurisdictions in which we operate. The Board has introduced training and education programmes for employees, relating to compliance including export controls and economic sanctions and competition/antitrust legislation. Our CBC sets down the guidelines by which we expect our business to be conducted and this is supported by a set of global policies issued through the Group intranet and internal communications.
The CBC covers areas such as health and safety, fair honest and ethical business practice, gifts and entertainment, conducting international business, protection of individuals, resources and assets and at a high level summarises the Group’s legal and compliance responsibilities in areas such as anti-bribery and corruption, export laws and regulations and international fair and open competition. The CBC also extends to the handling and minimisation of conflicts of interest and the protection of the Group’s valuable intellectual property rights.
The Group’s written policy states that if any employee has reasonable grounds to believe that the Group’s CBC policy or internal Group policy is not being adhered to by any person or group of people, he or she is able to contact Senior Management within their business or, if necessary, the Group Company Secretary or the Chairman of the Audit Committee. Should individuals wish to raise concerns or adverse behaviours anonymously they are able to do so via an externally-hosted whistleblowing facility (the ‘Reporting System’).
The Reporting System is operated in conjunction with a whistleblowing policy annually approved by the Audit Committee and comprises both an online web-based reporting module as well as a phone line option in the language of the individual raising the concern. The policy gives assurance that issues will be investigated and resolved in accordance with the principles of the CBC.
The CBC is designed to ensure that as a Group, all subsidiary companies act ethically, honestly, with integrity in their business activities as well as in a legally compliant manner, and applies to everyone who is engaged by the Group anywhere in the world, whether they are employees or third parties. Consequently, the Group has implemented a set of procurement standards, which seeks to ensure that the Group and its subsidiaries mitigate any risk stemming from its supply chain and is able to leverage the economies of scale a group of its size, composition and structure can hope to expect.
However, the CBC is not designed to supersede detailed Group policies but rather to supplement and summarise the Group’s compliance initiatives, its behavioural and ethical standards, as well as to give the relevant assurances in respect of the Group’s key corporate, legal and social responsibilities.
As in previous years, each business is required to certify its compliance with the policies issued by the Group during the year and in particular with the CBC.

34 Strategic Report
www.hsholdings.com | Stock Code HILS
Case Study
On 4th June 2017 the Metropolitan Police requested that Hardstaff Barriers Ltd supply and install Hostile Vehicle Mitigation (‘HVM’) barrier systems to protect eight Thames Bridges with immediate effect. Barriers were delivered into London on that same evening. This project was delivered through the National Barrier Asset Framework where Hardstaff Barriers operate as one of two HVM contractors.
Over the following week HVM products were installed on London bridges over the Thames at Westminster Bridge; Vauxhall Bridge; Lambeth Bridge; Waterloo Bridge; Blackfriars Bridge; Southwark Bridge; Tower Bridge and London Bridge to protect and keep people safe.
The rapid delivery of these key installations across London within a short timeframe astonished many stakeholders and exceeded expectations.
Find out more about the company at www.hardstaffbarriers.com
Hostile Vehicle Mitigation deployment on London Bridge
Images
Top – Hostile Vehicle Mitigation products installed on Vauxhall Bridge, London.
Bottom – Varioguard barrier installed on Blackfriars Bridge, London.
Strategic Report
www.hsholdings.com | Stock Code HILS
35
Human rightsThe Group is committed to treating all people, whether employed directly by the Group or its subsidiaries or employed in its supply chain, fairly and equitably and we are committed to upholding their human rights. The Group recognises all individuals’ basic human rights and is committed to respecting the Universal Declaration for Human Rights in the design of diversity practice and its ethical approach to employees, suppliers and customers. The Group and all its worldwide subsidiaries respect the human rights of all those working for or with us, and of the people in the communities where we operate. We will not knowingly do business with companies, organisations or individuals that we believe are not working to at least basic human rights standards. Our Group companies will also comply with all applicable wage and working-time laws and other laws or regulations affecting the employer/employee relationship and the workplace.
We oppose the exploitation of all workers, particularly children and young people and we will not tolerate forced labour, or labour which involves physical, verbal or psychological harassment or intimidation of any kind and we will not employ child labour in any of our operations. Nor will we permit the exploitation of, or discrimination against, any vulnerable group. We support fair and reasonable rewards for workers, with wages reflecting local norms and they must meet or exceed any legal minimum wage levels.
The Board is committed to the Modern Slavery Act 2015 and has continued to support a number of policies and initiatives commenced during 2016 to supplement the Group’s existing compliance controls in respect of anti-slavery and human trafficking. The Group has adopted a zero-tolerance approach to modern slavery and human trafficking and, in conjunction with strengthening our supplier due diligence activities and human resources procedures, in 2017 the Group requested ‘Hope for Justice’, a charity dealing with the effects of human slavery, to conduct a survey of some of our UK subsidiaries in order to assess the potential of exposure to modern slavery. Pleasingly the companies audited were assessed as low risk. In January 2018 we also undertook an internal audit of our Bergen Pipe Supports business in India and concluded that there were no issues that should concern the Group.
The Group is also committed to maintaining a safe and productive environment, free from harassment in which all individuals are treated with respect and dignity and we expect all our employees and individuals that work on our sites to follow our health and safety policies and procedures and be free from substance abuse at all times.
Regulatory complianceThe Group deploys an Anti-Bribery & Corruption Programme which includes policies, training and due diligence of all third parties with whom the Group engages. The provision and receipt of gifts and entertainment is tolerated within considered parameters which align with the Group’s legal obligations. Procedures and controls are deployed to monitor such activity across the Group.
The Group benefits from a Competition Law compliance programme which includes a manual, on-line training and auditing via simulated dawn raids, to which the whole Group is subject. The programme is based on requirements of UK law with local variations applied to non-UK businesses.
The Group continues to operate a Sanctioned Countries Policy in line with its legal and financial obligations using restricted party screening software. Additional protocols have also been provided to certain subsidiaries to ensure they meet all international obligations when trading in sensitive geographical areas.
Procurement controlsThe Group is further developing its procurement systems to enhance and embed best practices in purchasing activity and during the year continued to look at how the Modern Slavery Act impacts upon its supply chain.
Health and safetyMinimising the risks to our workers remains a key commitment across the Group. To protect the health, safety and welfare of everyone, the Group continues to adopt various measures to maintain a safe working environment, to ensure work related risks are effectively identified/controlled, that our monitoring regimes for health and safety help to spot issues at the earliest opportunity and that lessons are learnt from any events that do occur.
The importance of safety culture, personal responsibility and keeping an eye out for anything ‘dangerous’ forms a key part of our Group objectives. Sites continue to work alongside our external health and safety consultant to assist the Group in achieving its objectives around health and safety.
Our systems for controlling occupational health and safety risks continue to be focussed on: third-party support including a programme of external audits, a compliance based software solution and in the UK, the quarterly safety forum meetings.
The UK safety forums, which are attended by dedicated health and safety representatives for each site, are continuing to ensure that best practice is shared, that practical solutions to common issues are evaluated and that overall sites are working to a set of common standards. This successful forum approach of sharing best practice is being extended to our US operations in 2018.
The ‘Safety Cloud’ compliance tool continues to assist in the reporting of incidents, tracking of actions from third party audits, close out of safety related inspections/audits and sharing of information through the dissemination of safety alerts and bulletins.
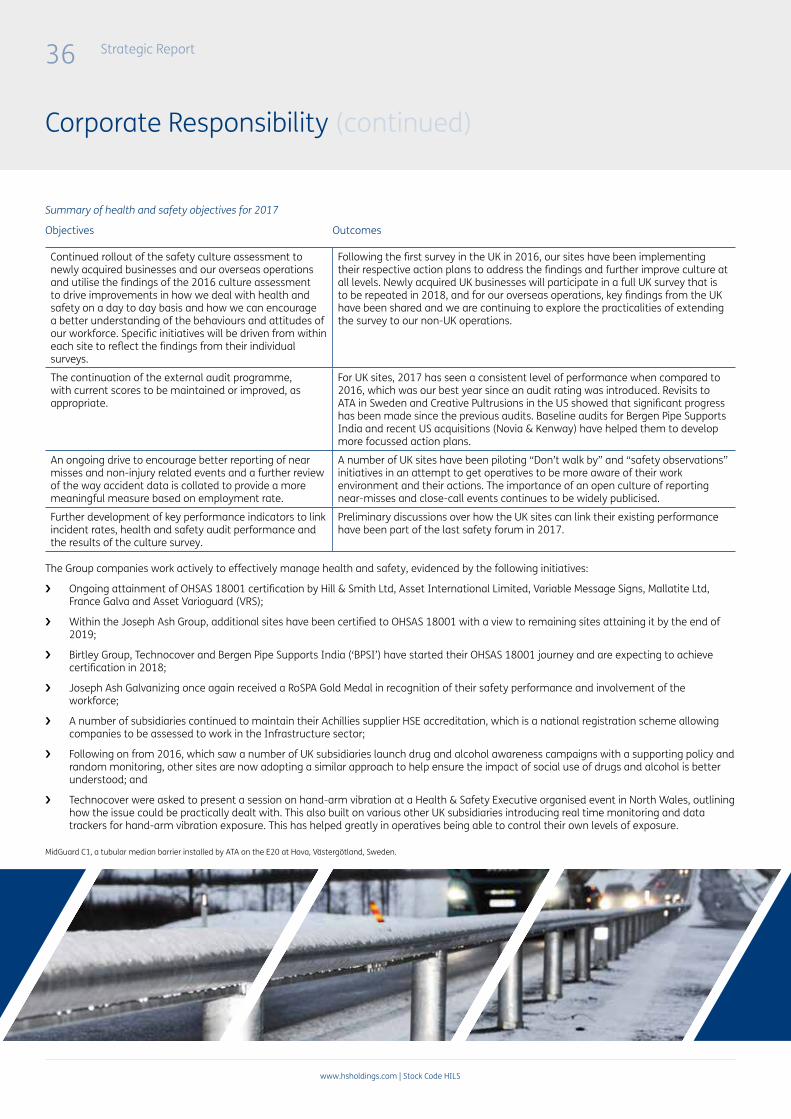
36 Strategic Report
www.hsholdings.com | Stock Code HILS
Corporate Responsibility (continued)
Summary of health and safety objectives for 2017
Objectives Outcomes
Continued rollout of the safety culture assessment to newly acquired businesses and our overseas operations and utilise the findings of the 2016 culture assessment to drive improvements in how we deal with health and safety on a day to day basis and how we can encourage a better understanding of the behaviours and attitudes of our workforce. Specific initiatives will be driven from within each site to reflect the findings from their individual surveys.
Following the first survey in the UK in 2016, our sites have been implementing their respective action plans to address the findings and further improve culture at all levels. Newly acquired UK businesses will participate in a full UK survey that is to be repeated in 2018, and for our overseas operations, key findings from the UK have been shared and we are continuing to explore the practicalities of extending the survey to our non-UK operations.
The continuation of the external audit programme, with current scores to be maintained or improved, as appropriate.
For UK sites, 2017 has seen a consistent level of performance when compared to 2016, which was our best year since an audit rating was introduced. Revisits to ATA in Sweden and Creative Pultrusions in the US showed that significant progress has been made since the previous audits. Baseline audits for Bergen Pipe Supports India and recent US acquisitions (Novia & Kenway) have helped them to develop more focussed action plans.
An ongoing drive to encourage better reporting of near misses and non-injury related events and a further review of the way accident data is collated to provide a more meaningful measure based on employment rate.
A number of UK sites have been piloting “Don’t walk by” and “safety observations” initiatives in an attempt to get operatives to be more aware of their work environment and their actions. The importance of an open culture of reporting near-misses and close-call events continues to be widely publicised.
Further development of key performance indicators to link incident rates, health and safety audit performance and the results of the culture survey.
Preliminary discussions over how the UK sites can link their existing performance have been part of the last safety forum in 2017.
The Group companies work actively to effectively manage health and safety, evidenced by the following initiatives:
› Ongoing attainment of OHSAS 18001 certification by Hill & Smith Ltd, Asset International Limited, Variable Message Signs, Mallatite Ltd, France Galva and Asset Varioguard (VRS);
› Within the Joseph Ash Group, additional sites have been certified to OHSAS 18001 with a view to remaining sites attaining it by the end of 2019;
› Birtley Group, Technocover and Bergen Pipe Supports India (‘BPSI’) have started their OHSAS 18001 journey and are expecting to achieve certification in 2018;
› Joseph Ash Galvanizing once again received a RoSPA Gold Medal in recognition of their safety performance and involvement of the workforce;
› A number of subsidiaries continued to maintain their Achillies supplier HSE accreditation, which is a national registration scheme allowing companies to be assessed to work in the Infrastructure sector;
› Following on from 2016, which saw a number of UK subsidiaries launch drug and alcohol awareness campaigns with a supporting policy and random monitoring, other sites are now adopting a similar approach to help ensure the impact of social use of drugs and alcohol is better understood; and
› Technocover were asked to present a session on hand-arm vibration at a Health & Safety Executive organised event in North Wales, outlining how the issue could be practically dealt with. This also built on various other UK subsidiaries introducing real time monitoring and data trackers for hand-arm vibration exposure. This has helped greatly in operatives being able to control their own levels of exposure.
MidGuard C1, a tubular median barrier installed by ATA on the E20 at Hova, Västergötland, Sweden.

Strategic Report
www.hsholdings.com | Stock Code HILS
37
IncidentsEncouraging the open reporting of accidents and incidents continues to be a prime objective. In the UK, more effective near-miss reporting is leading to a much better appreciation of working safely and keeping work areas clean and tidy. We intend to undertake further work in this area to ensure a more open and active reporting culture around close-call and near-miss events.
For 2017 the Group received, on a like-for-like basis, 503 accident reports, (2016:509). Allowing for acquisitions which have now been included in the Group’s health & safety regime the injury rate per 100,000 employees remains unchanged; however days lost due to accidents fell from 178 in 2016 to 123 in 2017.
AuditsThe externally managed health and safety audit programme continues to show that sites are demonstrating a high level of health and safety management and adherence to safe working practices. In the UK for 2017 this showed that existing sites were maintaining a good level of performance and newly acquired sites had improved their rating by more than 50%.
Those overseas subsidiaries that were audited, also showed a good level for performance and improvements being made year on year, both in terms of general working conditions risk management and specific safety initiatives.
2018 health and safety objectivesIn the forthcoming year our efforts in promoting a safe and secure workplace will continue with specific focus on:
› In the UK, the safety culture assessment tool will be re-run to provide us with a comparison on how the safety culture across the businesses is improving.
› In the US, an inaugural Safety Forum will be held, in April 2018, bringing together, for the first time, key health and safety teams from across our US subsidiaries who will be sharing best practice, discussing common issues and agreeing the way forward for safety performance and auditing.
› The continuation of the external audit programme, with current levels to be maintained or improved, as appropriate.
› An ongoing drive to encourage better reporting of near misses and non-injury related events and a further review in the way accident data is collated to provide a more meaningful measure based on employment rate.
Sustainability and the environmentThe Group places a high priority on meeting its environmental sustainability responsibilities within the geographies in which it operates. Each business has an appointed ‘Energy Champion’ who is responsible for ensuring that the Group’s policies on energy and the environment are promoted throughout its operations. All employees are encouraged to report energy savings and recycling ideas to their local energy champion, and the Group contributes information and data to the Carbon Development Project, a programme designed to tackle climate change.
In 2017, the Group continued to measure its water and energy usage and monitor the disposal of its waste products, paying particular attention to the recycling of materials. Different geographies have different attitudes to waste disposal and recycling and the Group is committed to
A permanent installation of ZoneGuard/Fonocon, installed by ATA, on the E18 outside of Karlstad, Sweden, at a police and customs vehicle inspection site.
A collection of safety signs displayed at BPSI, Andhra Pradesh, India.

38 Strategic Report
www.hsholdings.com | Stock Code HILS
seeking ways to motivate its businesses to adopt an environmentally-friendly approach to these activities. We utilise the services of CMR Consultants (‘CMR’), an independent energy management consultancy who liaise with all our subsidiaries to collect, collate and verify this data.
A programme of environmental audits is carried out on a regular cycle, by an independent third party, to monitor individual company performance and to assist the Group in reducing its environmental impact on an ongoing basis. In addition, during the year our UK-based Group companies conducted energy audits at their premises, in accordance with the Energy Saving Opportunities Scheme.
Recommendations were made following these audits and these were discussed at the Company’s inaugural Energy Forum meeting in November 2016, where the subsidiary Energy Champions shared experiences and best practice, and discussed actions to identify energy savings opportunities, how to drive forward their implementation, and whether such plans should be developed on a local basis or sponsored by the Group. These meetings have continued in 2017, where discussions have also centred on the best way to share knowledge and information.
Our UK operations are also committed to working towards compliance with the ISO 14002:2004 standard, which is awarded to companies that operate to an accepted environmental government standard. A programme of audits has been agreed for our UK businesses, with companies monitoring their environmental impact on a day-to-day basis.
Greenhouse gas (‘GHG’) emissionsThe Group’s GHG emissions continue to be constantly monitored, so that we can improve upon our use of energy, water, recyclable and non-recyclable resources, ensuring long-term environmental and business sustainability and creating long-term value for shareholders and other stakeholders.
We recognise that our business can have a direct and indirect effect upon the environment. The data provided below illustrates how our carbon footprint is created by our businesses, allowing us to monitor the impact of our operations on the environment and make improvements where feasible.
Group total emissions by scope Group emissions
2017Group emissions
2016Group emissions
2015
Gas and oil usage 34,468.28 37,061.92 33,557.46
Commercial and business miles driven 10,611.17 8,284.80 7,104.59
Purchased electricity 22,574.98 21,950.87 23,146.75
Water and waste 472.20 869.10 466.07
Total tCO2e 68,126.63 68,166.69 64,274.87
Total turnover £585.1m £540.1m £467.5m
Intensity Ratio 0.116 0.126 0.137
For the UK and overseas data, the Group has decided to measure the GHG emissions using the Group total turnover, as the intensity ratio (‘IR’). The IR is measured as the total tonnage of emissions, stated as carbon dioxide equivalent (‘CO2e’) per £1,000 turnover.
Water consumptionAfter a few years of reported reduction in water consumption, the Group’s consumption in 2016 rose by 13.6%, but pleasingly the Group has responded to this increase and in 2017 water consumption fell by 7.4%. When measured against Group revenues in much the same way as CO2e emissions the water consumption ratio fell by 14.7%.
Group water usage2017 volume 2016 volume
UK water usage 36,001 m3 39,737 m3
Overseas water usage 55,475 m3 59,034 m3
Total usage 91,476 m3 98,771 m3
Ratio per £1,000 of Group turnover 0.156 0.183
Waste management During the year the Group significantly improved its management and reporting of waste disposal at its UK sites, particularly at Medway Galvanizing where, data had previously been misinterpreted. The information received will be reviewed to determine how waste output can be reduced or recycled and to identify new opportunities to improve our manufacturing processes.
This collation of data has not only enabled us to improve the recycling opportunities presented to the Group, but also to lower waste output.
Corporate Responsibility (continued)

Strategic Report
www.hsholdings.com | Stock Code HILS
39
Waste quantities
Commodity UK volume (‘00s ltrs) Overseas volume
(‘00s ltrs)
Liquid waste 12,663 3,417
Acidic waste (like-for-like) 5,257 5,218Commodity UK tonnes Overseas tonnes
Waste to landfill 1,793 2,611
Recycled waste 8,320 12,416
Total waste (inc. landfill) 10,113 15,027
The Group discourages waste to landfill, using expert waste disposal companies to dispose of such waste and to recycle it wherever possible. For example, some of our plastic waste is recycled into new products and alternative bio-energy sources and a large proportion of our waste acid is reprocessed and recycled into other waste treatment processes.
Within the UK, the Group complies with the Producer Obligations (Packaging Waste) Regulations 2007 (as amended) in compliance with the European Union Directive. The Group provides evidence to Wastepack, an organisation that provides confirmation to the UK government that the Group is continuing to meet UK recycling and recovery standards set by Defra.
CommunityAlthough the Group does not have a Group-wide programme in place to support specific charities or communities, it remains committed to encouraging its subsidiary companies to fully engage with their local communities. The Group values its relationship with the local stakeholders and the support it receives from them.
In the UK, Asset International Ltd contributed to the delivery of a ‘Sensory Room’ for autistic children at a local primary school, (see page 40), whilst Joseph Ash Ltd galvanized a series of signpost (interpretation) panels to be situated amongst Folkestone Warren to highlight points of interest for visitors to the trails. The Warren is an area of outstanding natural beauty along the Kent coastline. Visitors to the area can enjoy the stunning beach and the majestic views of the White Cliffs, as well as walks through woodland and fields, passing interesting sites such as Napoleonic Martello Towers and the ruins of a Roman villa. An intrepid band of Technocover employees ran the Lake Vyrnwy Half Marathon in September 2017. On the wet and windy Sunday afternoon the team set off to raise money for Hope House Children’s Hospices, a charity that cares for children with serious health conditions across Shropshire, Cheshire, North and Mid Wales and a charity that has long been supported by Technocover. Hill & Smith Ltd supports a number of charity events throughout the year, including Red Nose Day; the British Heart Foundation’s WEAR IT. BEAT IT; Macmillan’s World’s Biggest Coffee Morning.
In the US our colleagues at Creative Pultrusions participated in an annual Softball Tournament held in August of each year to raise funds for ‘We CARE Foundation’. This foundation assists programmes in Blair County, Pennsylvania that focus on therapy services for children between the ages of 0 to 21 years old, including Occupational Therapy, Physical Therapy, and Speech and Language Therapy. The We CARE Foundation is also supporting adult programmes that offer therapy services to patients with symptoms of Stroke, Parkinson’s Disease, Multiple Sclerosis, brain injury and other neurological conditions. 100% of all funds raised are directed to these children and adults that live in and around Blair County.

40 Strategic Report
www.hsholdings.com | Stock Code HILS
Asset International Ltd, a subsidiary based in Newport, South Wales, is the UK’s leading manufacturer of large diameter plastic pipe solutions. Using Weholite, a large diameter gravity/low pressure structured wall pipe made from high density polyethylene (HDPE) resin, the company utilises advanced product technology to create lightweight engineered pipes with superior loading capacity that are used extensively throughout the water industry, in flood defence and sewerage projects, and more recently, in the renewable energy sector, providing pipework for air-ground heat exchangers and large scale anaerobic digestion chambers for the biogas industry.
In 2017 the company engaged on a project with a difference!
During the year the company designed and built a unique project using state-of-the-art technology usually used for underground water pipes. Using their 3.5m diameter Weholite pipe they helped to build and subsequently donate a sensory den to Machen Primary School in Caerphilly after being moved by the fundraising efforts of a parent of one of the autistic children at the school.
Neil Bryan, Finance Director at Asset International, whose children also study at Machen Primary school, said: “On hearing about the incredible achievement and perseverance towards fundraising, we were keen to support the project in whatever way we could. Given
Case Study
Find out more about the company at: www.weholite.co.uk
Sensory den for autistic primary school pupils
the nature of our work, we were well placed to deliver the project, which we created in collaboration with the school to ensure the den was effectively designed with the children who would be using it firmly in mind.”
The new den, named the Cwtsh, will combine a range of stimuli, including different lights, colours, sounds and textures to provide children with additional educational needs within a safe and comforting environment to explore their senses and build up their confidence and abilities. It is hoped that regular access to the Cwtsh will enhance pupils’ concentration and focus, improve alertness and social communication skills, as well as providing a calming effect to enable them to thrive both in and out of the classroom.
Asset International worked with other local companies to fit out and deliver the den, which was officially opened in September 2017.
Image
Sensory den at Machen Primary School made from Weholite 3.5m polyethylene pipe.

Strategic Report
www.hsholdings.com | Stock Code HILS
41
Governance Report
See further information at hsholdings.com
43 Chairman’s Introduction to Governance44 Board of Directors46 Governance Report55 Nomination Committee Report56 Audit Committee Report62 Remuneration Committee Report63 Directors’ Remuneration Report77 Directors’ Report (other statutory information)80 Statement of Directors’ Responsibilities
Bristorm Zero Hostile Vehicle Mitigation (HVM) perimeter fence – Maaden Phosphate Plant, Umm Wu’al.
41
Governance Report
41
Governance Report

42 Governance Report
www.hsholdings.com | Stock Code HILS
42
Tower Tech cooling towers being installed on the roof of 340 On The Park, the second tallest all-residential tower in Chicago, Illinois.

Governance Report
www.hsholdings.com | Stock Code HILS
43
Chairman’s Introduction to Governance
Dear Shareholder,
Welcome to our Corporate Governance Report. As your new Chairman, I wish to share with you how the Board ensures strong corporate governance to underpin the delivery of our strategy, and how I plan to lead the continued development of our approach.
The Board has ultimate responsibility for the Group’s strategic delivery and for the management of risk. The Board discusses the Company’s Strategic plans at each Board meeting and is resolved to continue with its current strategy, which has proven successful in delivering value to shareholders over the last few years and maintaining our strategic direction will be our focus in 2018. This will be complemented by our continuous improvements in risk management and internal controls. Our approach to risk management was set out in our Strategic Report on pages 26 to 30 and Mark Reckitt, Chair of the Audit Committee, gives more insight into our internal control environment in his report at pages 56 to 60.
In order to fulfil our role, I am committed to ensuring that we have an effective Board. To support this, the Board commissioned an external review of Board effectiveness in 2017 and we are considering various responses to its recommendations, including reviewing the composition of the Board in the light of FRC’s review of the UK Corporate Governance Code which is likely to be released in the summer of 2018. More detail on Board composition changes and Board effectiveness can be found in the Governance Report on pages 50 and 51 and my report on behalf of the Nomination Committee on page 55.
The Board leads the business in a way that is honest, transparent and accountable. This transparency is key to the delivery of the Group’s strategy and value creation for our shareholders. Our approach to shareholder and other stakeholder engagement is set out in the Governance Report on page 46 and I would encourage you to attend our Annual General Meeting on Thursday 17 May 2018.
In order to promote the long-term success of our business and support an appropriate internal culture, the Board has given robust consideration to executive remuneration and Annette Kelleher, Chair of the Remuneration Committee, explains further in her report on pages 62 to 71.
Finally, I would like to thank my Board colleagues and all employees for their commitment and focus in 2017.
Jock Lennox Chairman
7 March 2018
Jock LennoxChairman
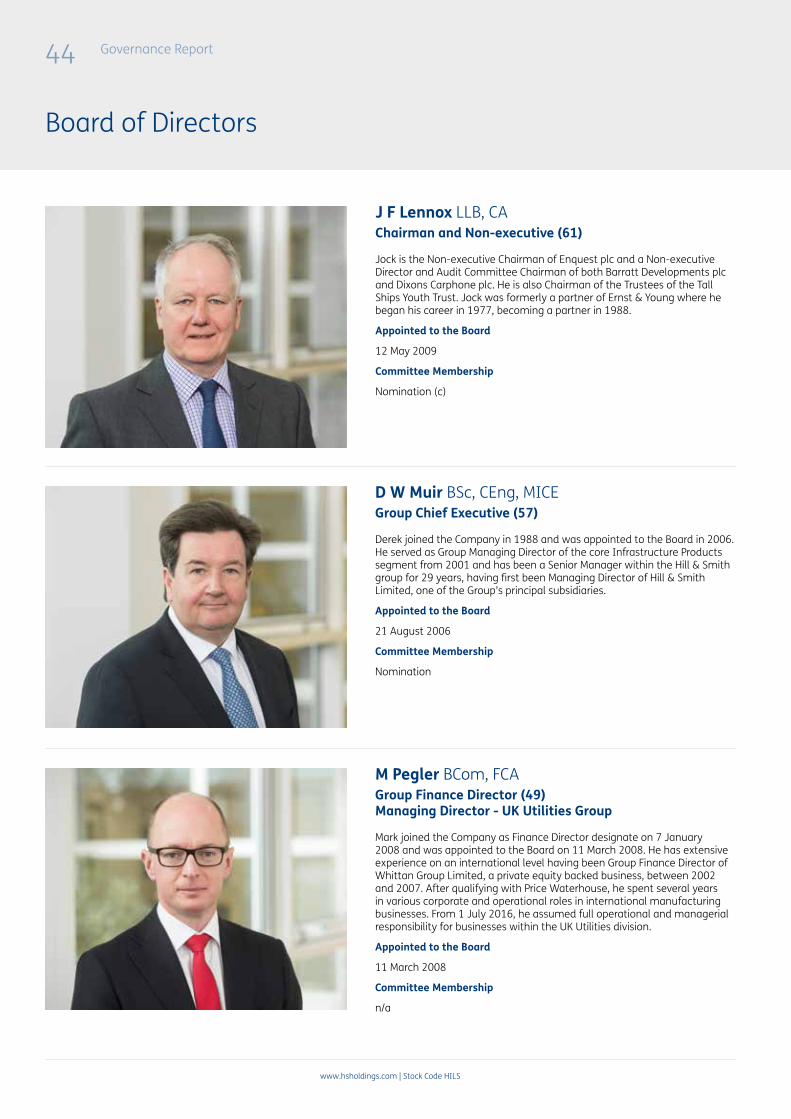
44 Governance Report
www.hsholdings.com | Stock Code HILS
Board of Directors
D W Muir BSc, CEng, MICEGroup Chief Executive (57)
Derek joined the Company in 1988 and was appointed to the Board in 2006. He served as Group Managing Director of the core Infrastructure Products segment from 2001 and has been a Senior Manager within the Hill & Smith group for 29 years, having first been Managing Director of Hill & Smith Limited, one of the Group’s principal subsidiaries.
Appointed to the Board
21 August 2006
Committee Membership
Nomination
M Pegler BCom, FCAGroup Finance Director (49) Managing Director - UK Utilities Group
Mark joined the Company as Finance Director designate on 7 January 2008 and was appointed to the Board on 11 March 2008. He has extensive experience on an international level having been Group Finance Director of Whittan Group Limited, a private equity backed business, between 2002 and 2007. After qualifying with Price Waterhouse, he spent several years in various corporate and operational roles in international manufacturing businesses. From 1 July 2016, he assumed full operational and managerial responsibility for businesses within the UK Utilities division.
Appointed to the Board
11 March 2008
Committee Membership
n/a
J F Lennox LLB, CAChairman and Non-executive (61)
Jock is the Non-executive Chairman of Enquest plc and a Non-executive Director and Audit Committee Chairman of both Barratt Developments plc and Dixons Carphone plc. He is also Chairman of the Trustees of the Tall Ships Youth Trust. Jock was formerly a partner of Ernst & Young where he began his career in 1977, becoming a partner in 1988.
Appointed to the Board
12 May 2009
Committee Membership
Nomination (c)

Governance Report
www.hsholdings.com | Stock Code HILS
45
A C B Giddins FCASenior Independent Non-executive (52)
Alan is a Managing Partner and co-head of Private Equity at 3i Group plc (‘3i’), and a member of its Executive Committee. He has extensive experience of sitting on the boards of international businesses, and is currently a Non-executive Director of two companies in which 3i has invested, JMJ Associates, a leading transformational consultancy focused on safety and Audley Travel, a market leader in tailor-made experiential travel. Prior to joining 3i in 2005, he spent 13 years in investment banking advising a broad range of quoted companies. He qualified as a chartered accountant at KPMG in 1990 and has a degree in economics.
Appointed to the Board
3 October 2017
Committee Membership
Audit, Remuneration, Nomination
A M Kelleher MSc, BAIndependent Non-executive (51)
Annette has broad senior management experience in the international industrials sector and is currently Group Human Resources Director of Johnson Matthey PLC, as well as a Trustee of the Johnson Matthey Pension Scheme. Prior to joining Johnson Matthey PLC, she held a number of senior human resource roles in Pilkington and NSG Group. From 2006 to 2009, Annette was an independent director of Tribunal Services, part of the UK’s Ministry of Justice.
Appointed to the Board
1 December 2014
Committee Membership
Audit, Remuneration (c), Nomination
M J Reckitt BCom, CAIndependent Non-executive (59)
Mark is a chartered accountant and was Group Strategy Director of Smiths Group plc from February 2011 to April 2014, and Divisional President, Smiths Interconnect from October 2012 to April 2014. Prior to joining Smiths, Mark was interim Managing Director of Green & Black’s Chocolate and before that he held a number of finance and strategy roles at Cadbury plc before being appointed its Chief Strategy Officer from 2004 to 2010. He is a Non-executive Director and Chairman of the Audit Committee at both Mitie Group PLC and Cranswick plc, and he is also a member of the Nomination and Remuneration Committees at Cranswick plc.
Appointed to the Board
1 June 2016
Committee Membership
Audit (c), Remuneration, Nomination
46 Governance Report
www.hsholdings.com | Stock Code HILS
Leadership frameworkThe Hill & Smith Holdings PLC Group consists of the Company and the principal subsidiary companies, listed on pages 150 to 152, and during 2017 operated in seven different countries. The Group’s businesses are directly supervised by local operating boards and performance is monitored at individual operating company and divisional levels. Details of the Group’s business model and strategy can be found on pages 6 to 11.
The Group’s subsidiary companies hold monthly board meetings, regularly attended by the Executive Directors and there is liaison across divisions to ensure, where appropriate, the consistent application of governance, operational procedures and Group policies and practices. The two Executive Directors are accountable to the Board for the operational application of these controls.
The Board is collectively responsible for ensuring that the business acts in the best interests of its shareholders and ensures that the Group delivers sustainable profitable growth through the supply of infrastructure products and galvanizing services; generating sustainable value for shareholders, whilst preserving the interests of its customers, employees and other stakeholders. The main facets of this responsibility comprise: consideration of the long-term direction and strategy of the Company; the values and standards within the business; subsidiary company management performance; resources; health and safety; risk management; and internal controls.
The Board has established processes designed to help maximise its performance. These processes operate from within the following framework:
Operation of the Board
› Board meetings are scheduled to ensure adequate time for discussion of each agenda item. › Board discussions are held allowing for questions, scrutiny and constructive challenge where appropriate. › Full debate allows decisions to be taken by consensus (although any dissenting views would be minuted accordingly).
› Other members of senior group management regularly attend and give presentations at Board meetings.› Local managers may also attend when matters of particular significance or country relevance are proposed or are
being reviewed.
Strategic focus
› The development of strategy is led by the Chief Executive Officer together with the Group Finance Director, and with input, challenge, examination and ongoing testing from the Non-executive Directors.
› Group strategy is regularly addressed by the Board, with strategic matters being reviewed and updated as appropriate at each main meeting. In addition, the Board holds at least one annual strategy meeting. The Board has particular responsibility for ensuring that the business strategies proposed are fully discussed and critically reviewed.
› The Executive Directors and members of the senior management team draw on the collective experience of the Board.
Board information
› Comprehensive reporting packs are provided to the Board, which are designed to be clear, accurate and analytical, whilst avoiding excessive and unnecessary information.
› Reporting packs are normally distributed electronically five days in advance of Board meetings, enabling them to be as up-to-date as possible, whilst allowing sufficient time for their review and consideration in advance of the meeting.
› Clarification or amplification of reports or proposals are sought in advance of, or at, meetings as appropriate. › Management accounts with commentary are distributed to the Board on a monthly basis.
Board knowledge
› The Board regularly reviews its appetite for, and the management of, risk in the context of the strategy and the periodic review of the Group risk register.
› The Chief Executive Officer and Group Finance Director have a programme of visits to the Group’s business locations to review the operational performance and to engage and support local management.
› In the financial year, at least one Hill & Smith Holdings PLC Board meeting is held at the operational site of a subsidiary. › All Directors have open access to the Group’s key advisors, senior management and the Company Secretary.
Statement of compliance with UK Corporate Governance Code Hill & Smith Holdings PLC is a premium listed issuer on the London Stock Exchange. In accordance with the listing rules, during 2017 the company applied the main principles of the UK Corporate Governance Code 2016 (the ‘Code’): leadership, effectiveness, accountability, remuneration and relations with shareholders. In doing so, the organisation has complied with all provisions of the Code, except during a period of 5 months, whilst recruitment for a new Non-executive Director extended for longer than predicted, see page 49 for more details. The search began in March 2017 and a candidate of suitable calibre was identified and appointed in October 2017. Application of the principles was still maintained during this period and more detail can be found on our compliance in the sections below.
Governance Report
Governance Report
www.hsholdings.com | Stock Code HILS
47
A. LeadershipThe Role of the BoardThe Board is collectively responsible for the long-term success of the Company and is focused on ensuring its own effectiveness.
The Board manages the overall control of the Group’s affairs with reference to a formal schedule of matters reserved for the Board for decision; in particular the Board takes decisions on and reviews:
› Group strategy and operating plans;
› Business development, including acquisitions and divestments, major investments and disposals;
› Risk management;
› Financial reporting and audit, including announcements for year end and interim results and trading updates;
› Financing, treasury and taxation;
› Corporate governance;
› Compliance with laws, regulations and the Company’s Code of Business Conduct;
› Corporate sustainability and responsibility, ethics, health and safety, the environment; and
› Pension benefits and liabilities.
In addition to its normal business, the Board received, reviewed and approved various matters, during 2017 and up to the date of this report:
› Regular updates on the reorganisation of VMS Group;
› The schedule of matters reserved for the Board and all Committee terms of reference;
› Acquisition integration plans;
› Conclusion of the external review of board effectiveness;
› Succession planning and talent management updates;
› Goodwill and Intangible Asset carrying values;
› Pension scheme master trust arrangements and trustee reports;
› Viability Statement; and
› Corporate activity including the acquisitions of Kenway Corporation and Tower Tech and the sale of CA Traffic.
The Board also received budget presentations from the management of Creative Pultrusions, Carpenter & Paterson, the V&S Group, Hill & Smith Ltd and Joseph Ash Ltd.
These budget presentations are initially challenged by the Executive Directors before being presented to the Board which approves the businesses’ individual budgets, having reviewed and discussed the plans submitted. Where appropriate the Board offers additional challenges in order that the final budgets are a realistic representation of the expected financial performance of the businesses taking onto account historical performance and future economic conditions.

48 Governance Report
www.hsholdings.com | Stock Code HILS
Governance Report (continued)
Board structureDuring 2017 the Board constituted the individuals listed below and these Directors made up three Board committees as described below. Each Committee reports to the Board.
J F Lennox - Chairman (appt 11 May 2017 previously Senior Independent Director)
W H Whiteley - Chairman (retired 11 May 2017)
D W Muir - Group Chief Executive
M Pegler - Group Finance Director & MD, UK Utilities Group
A C B Giddins – Senior Independent Director (appt 3 October 2017)
A M Kelleher - Non-executive Director
M J Reckitt - Non-executive Director
C A Henderson - Company Secretary
Audit Committee
The Audit Committee has responsibility for planning and reviewing the Company’s interim and preliminary reports and accounts, and its internal controls and risk management systems.
Remuneration Committee
The Remuneration Committee is responsible for creation, approval and implementation of the Company’s Remuneration Policy in respect of Executive Directors, Company Secretary and senior executives.
Nomination Committee
The Nomination Committee has responsibility for assisting the Board with succession planning and with the selection of a new Executive Director, Non-executive Director or Chairman.
ChairmanA M Kelleher
Other membersM J ReckittA C B Giddins (appt 3 October 2017)J F Lennox (resigned 11 May 2017)
SecretaryC A Henderson
ChairmanJ F Lennox
Other membersD W MuirA M KelleherM J ReckittA C B Giddins (appt 3 October 2017)W H Whiteley (resigned as Committee Chairman 11 May 2017)
SecretaryC A Henderson
ChairmanM J Reckitt
Other membersA M KelleherA C B Giddins (appt 3 October 2017)J F Lennox (resigned 11 May 2017)
SecretaryC A Henderson
Board meeting attendanceDuring the year attendance by Directors at Board and Committee meetings was as follows:
Board Audit Nomination RemunerationJock Lennox 9 3* 3 2*
Derek Muir 9 3* 3 1*(1)
Mark Pegler 9 3* - -
Mark Reckitt 9 3 3 3
Alan Giddins(2) 2 0 1 1
Annette Kelleher 9 3 3 3
Bill Whiteley(3) 2 1* 1 1*
Total meetings held 9 3 3 3
*indicates attendance of whole or part of the meeting by invitation. (1) The Executive Directors were not present when elements of their remuneration were discussed. (2) A C B Giddins attended all meetings he was eligible to attend. (3) W H Whiteley retired from the Board on the 11 May 2017.

Governance Report
www.hsholdings.com | Stock Code HILS
49
All Directors of the Board except A C B Giddins attended the AGM on 11 May 2017; A C B Giddins was not appointed to the Board until 3 October 2017.
The Chief Executive maintains a programme of visits to the Group’s subsidiary businesses, throughout the world. The Group Finance Director, regularly visits the US and France and in 2017 also visited Australia, Sweden and India.
Chairman and Chief ExecutiveThere is a clear division of responsibilities between the Chairman and the Chief Executive which is set out in writing and available at www.hsholdings.com. The Chairman is responsible for the leadership and effective working of the Board. The small size of the Board ensures all Directors contribute fully to the discussions and decisions. The Chairman drives the Board agenda and determines how the Board should use the time available to it during Board meetings. The Chief Executive is responsible for the management of the Company, executing the Group’s strategy and development, meeting financial objectives, implementing policies and maintaining controls. The Executive Directors provide information to the Board via their regular written reports and the presentation of proposals for Board approval.
The Chairman met the independence criteria set out in the Code on appointment and was not previously the Chief Executive.
Non-executive DirectorsThe Non-executive Directors take an active role in challenging strategy and monitoring the performance of the Company. J F Lennox was the Senior Independent Director at the start of 2017 until he became Chairman in May 2017. A C B Giddins was appointed as Senior Independent Director in October 2017. During the intervening period, the recruitment (which had been started in advance of J F Lennox becoming Chairman) of a new Non-executive Director who would also be appointed as the Senior Independent Director was continuing. Code provision A.4.1. was not complied with during this period as the Board considered that it was appropriate to wait for a candidate of suitable skill and experience to be identified. However, Code principle A.4. was still applied as the Company ensured that it maintained support for the Chairman and a route of resolution for shareholders through the Company Secretary and other Non-executive Directors.
The Non-executive Directors meet independently without the Chairman present and also meet with the Chairman, independent of management.
No concerns regarding the running of the company or any proposed action were received or recorded from Directors.
B. EffectivenessComposition of the BoardThe Directors are experienced and influential individuals from varied commercial industries, professional backgrounds and international involvement. Their diverse and balanced mix of skills and business experience (see opposite), are key elements to the effective functioning of the Board and its Committees, ensuring matters are fully and effectively debated and challenged and no individual or group dominates the Board’s decision-making processes.
Taking into account the provisions of the Code, the Board has determined that during the year under review none of the Non-executive Directors had any relationship or circumstance which would affect their performance and the Board considers all of the Non-executive Directors to be independent in character and judgement. Half of the Board consists of independent Non-executive Directors.
The biographies of the Directors of the Board are shown on pages 44 and 45, along with any significant other commitments and appointments they may have.
Skills and business experience
Strategy (5)
Leadership (6)
Operating performance &
delivery (6)
Mergers & Acquisitions
(6)
Financial Planning
(6)
International markets
(6)
Business integration
(6)
Supply chain
(4)
Marketing(5)
Risk management
and assurance(6)
Digital (2)
Health & Safety(6)
Human Resources
(5)
Culture & Ethics
(6)
ConflictsThe Companies Act 2006 sets out Directors’ general duties concerning conflicts of interest and related matters. The Board has agreed an approach and adopted guidelines for dealing with conflicts. The Board confirmed that it was not aware of any situations that conflicted with the interests of the Company, other than those that may arise from Directors’ other appointments, as disclosed in their biographies on pages 44 and 45. In accordance with the Articles, the Board authorised the Company Secretary to receive notifications of conflicts of interest on behalf of the Board and to make recommendations as to whether the relevant matters should be authorised by the Board. The Company has complied with these procedures.
Nomination CommitteeThe Board has appointed a Nomination Committee, composed of a majority of independent Non-executive Directors. In addition to leading the process of Board appointments, the Nomination Committee supports the Board in succession planning for the Board and senior management. The terms of reference of the Nomination Committee can be found at www.hsholdings.com and more information on the work of the Committee can be found in the Committee Chairman’s report at page 55.
Appointments to the BoardAlan Giddins was appointed as Non-executive Director and Senior Independent Director on 3 October 2017. Korn Ferry (who have no other connection with the Company) were engaged by the Company to conduct a search for a suitable candidate based on the description of the required capabilities prepared by the Nomination Committee and in April a list of prospective candidates was drawn up. Following this the Nomination Committee met to discuss the skills and experiences of the potential candidates and their relevance to the Group’s business model, strategy and the requirement to balance the long-term sustainability of the business with the expectations of shareholders.
50 Governance Report
www.hsholdings.com | Stock Code HILS
Governance Report (continued)
Image: Hill & Smith Ltd’s QUEST-GEN crash cushion installed on the A90 near Forfar, Fife.
Following further meetings with a shortlist of candidates the Nomination Committee subsequently met to discuss the potential appointment. The Committee, in considering the existing balance of skills, knowledge and experience on the Board, the merit and capabilities of the candidates and the time they were able to devote to the role in order to promote the success of the Company, recommended the appointment of Alan Giddins to the Board.
The service agreements and terms of appointment for the Executive Directors and Non-executive Directors respectively, are discussed on pages 68 and 71 of the Directors’ Remuneration Report. Appropriate directors’ insurance cover is kept by the Company.
Board DevelopmentThe Chairman has overseen the induction of Alan Giddins, which was full, formal and tailored. Following his appointment Alan met with the Executive Directors, the Group Company Secretary and the Group Financial Controller and visited major companies within the Group’s UK-based Roads and Galvanizing businesses, as well as speaking to the Group’s External Auditors.
The Chairman has discussed training and development needs with all Board members, as part of individual performance evaluations. All Directors are provided with the opportunity and are encouraged to attend regular training to ensure they are kept up-to-date on relevant legal developments or changes, best practice and changes to commercial and financial risks. Typical training experiences for Directors includes attendance at seminars, forums, conferences and working groups, as well as the provision of information from the Company Secretary.
Board supportThe Board is supported by the Company Secretary who, under the direction of the Chairman, ensures that communication and information flows between Board members. The Company Secretary is also responsible for assisting the Chairman in all matters relating to corporate governance, including the Board evaluation process. All Directors have access to the advice and services of the Company
Secretary and are able to take independent professional advice, when necessary, at the Company’s expense.
From time to time, other members of the management team attend Board meetings to present annual budgets, updates and proposals relating to their areas of responsibility and reporting on regulatory compliance, risk management and internal controls.
The Directors and management of the Group businesses are also supported by the central function which includes compliance, risk management, internal audit, treasury, taxation, acquisitions and corporate development.
Evaluation of the performance of the Board
The Board recognises that a performance evaluation is important to optimise Board effectiveness and that the evaluation should be appropriate to both the size of the Board and the Company.
The results of the 2016 internal Board evaluation concluded:
› An increased proportion of Board time should be focused on future strategy and direction;
› The formality of succession planning and Board oversight on this topic should be increased;
› Board discussions could benefit from an improved balance of detailed information and subsidiary specific KPIs; and
› The continuous improvement around risk and internal audit should be maintained.
The Board has responded to these matters by:
› Altering Board agendas to ensure strategic focus and increasing the number of Board meetings with a specific strategic remit;
› Increasing Board reporting on succession planning progress, supported by the work of the Nomination Committee;
› Refreshed the KPI report to the Board; and
Governance Report
www.hsholdings.com | Stock Code HILS
51
› Continued to improve the risk management framework and system of internal control, more detail of which can be found on pages 26 to 30.
In 2017 the Board commissioned an external Board Effectiveness evaluation, facilitated by Colin Mayer CBE FBA, Professor of Management Studies at Saïd Business School, University of Oxford, who has no other connection to the Company. The evaluation centred around the requirements of the Code and with particular focus on the following:
› Board composition;
› The Chairman and Non-executive Directors;
› Board processes; and
› Communication with investors.
The evaluation process concluded,
“The Company comfortably satisfies the requirements of the Corporate Governance Code.”
and commented further on:
› Leadership – A highly effective board that is collegiate and works as a team;
› Effectiveness – Board members are highly experienced and knowledgeable, with a good spread of skills that cover its main requirements;
› Accountability – Financial performance is extensively reviewed, there is central oversight of controls and risk management has recently been strengthened;
› Remuneration – A well run committee, that sets the Company’s remuneration policy and considers the remuneration of senior executives;
› Investor Relations – The arrangements whereby the Group
CEO and Group Finance Director undertake meetings with shareholders work well.
In the context of the Company’s successful strategy and its growth in recent years the Report made recommendations in the following areas:
› The Board should continue to focus on the Group’s strategic and long-term sustainability;
› Existing work around succession planning should be extended further;
› The Board should build on existing mechanisms to further embed culture and values; and
› Improvements could be made to the presentation and format of board packs.
Following this evaluation, the Chairman met with all Board members, individually, in February 2018, to discuss the Evaluation Report and to determine what actions should be considered in response and we will report on these steps in next year’s Annual Report.
Following these meetings Alan Giddins, as Senior Independent Director met with his Board colleagues to discuss the performance of the Chairman and the Chairman met with the Non-executive Directors, in the absence of the Executive Directors, to discuss the performance of the Executive Directors.
Annual re-election of DirectorsIn compliance with the Code and the Company’s Articles of Association, Directors retire at every AGM and, if deemed appropriate by the Board, Directors are proposed for re-appointment by shareholders at the forthcoming AGM. In reaching its decision to propose re-election, the Board acts on the advice of the Nomination Committee, taking account of the results of the Board evaluation referred to above.
52 Governance Report
www.hsholdings.com | Stock Code HILS
Governance Report (continued)
Following the formal evaluation of the performance of the Board, Alan Giddins is being proposed for election and the remaining Directors for re-election at the 2018 AGM. The biographies of the Directors of the Board are shown on pages 44 and 45.
C. AccountabilityFinancial and business reportingThe respective responsibilities of the Directors and External Auditor in connection with the Financial Statements are explained in the Statement of Directors’ Responsibilities on page 80 and the Independent Auditor’s Report on pages 82 to 86.
Fair, balanced and understandableThe Directors consider that the Annual Report, taken as a whole, is fair, balanced and understandable, and provides the information necessary for shareholders to assess the Group’s performance, business model and strategy. More information can be found on page 60 of the Audit Committee Report.
Going concernThe Directors have assessed the future funding requirements of the Group and the Company and compared them to the level of committed available borrowing facilities. The assessment included a review of both divisional and Group financial forecasts, financial instruments and hedging arrangements, for the 15 months from the Balance Sheet date. Major assumptions have been compared to external reference points such as infrastructure spend forecasts across our chosen market sectors, government spending plans on road infrastructure, zinc and steel prices and economic growth forecasts. The forecasts show that the Group will have sufficient headroom in the foreseeable future and the likelihood of breaching banking covenants in this period is considered to be remote.
Having undertaken this work, the Directors are of the opinion that the Group has adequate committed resources to fund its operations for the foreseeable future and so determine that it is appropriate for the Financial Statements to be prepared on a going concern basis.
Viability statementIn preparing this statement of viability, the Directors have considered the prospects of the Group over the three-year period immediately following the 2017 financial year. This longer-term assessment process supports the Board’s statements on both viability, as set out below, and going concern, above. A three year period was determined as the most appropriate as it is the period covered by the Group’s annual strategic planning process, which sets the long-term direction of the Group and is reviewed at least annually by the Directors. The Board concluded that a period of longer than three years would not be meaningful for the purpose of concluding on longer-term viability.
The strategic planning process considered metrics which enable assessment of the Group’s key performance indicators (see pages 24 and 25) in addition to net debt, liquidity and financing requirements.
In conducting the review of the Group’s prospects the Directors assessed the three-year plan alongside the Group’s current financial position, the Group’s strategy and the principal risks facing the Group (all of which are detailed in the Strategic Report on pages 1 to 40). This robust assessment considered the impact of the principal risks on the business model and on future performance, liquidity and solvency. Stress tests were applied to the Group’s three-year plan, whereby risks associated with the economic risks faced by the Group were applied to the plan in a number of diverging scenarios. The developed scenarios were designed to be plausible, yet severe:
› A decrease in the UK Government’s road infrastructure spend;
› A fall in galvanizing volumes across all geographies; and
› A reduction in revenues in the Group’s Utilities businesses in the UK and USA.
In making this viability statement the Directors considered the mitigating actions that would be taken by the Group in the event that the principal risks of the Company become realised. The Directors also took into consideration the Group’s financial position at 31 December 2017 with an undrawn committed facility headroom of £111.4m and a history of strong cash generation, and noted that the Company’s principal financing facilities are committed until April 2021 thus covering the period of review.
The Directors have assessed the viability of the Group and, based on the procedures outlined above in addition to activities undertaken by the Board in its normal course of business, confirm that they have a reasonable expectation that the Group will be able to continue in operation and meet its liabilities as they fall due over the period to 31 December 2020.
Risk Management and Internal ControlOverall responsibility for ensuring that there is a process to identify, evaluate and manage any significant risks that may affect the achievement of the Group’s strategic objectives and for internal control, and reviewing the effectiveness of these processes, lies with the Board.
The process has been in place throughout 2017, and up to the date of approving the Annual Report and Financial Statements. The key elements of this process are:
› A comprehensive system of monthly reporting from key executives, identifying performance against budgets and forecasts;
› Analysis of variances, major business issues, key performance indicators and regular forecasting;
› Well-defined policies governing appraisal and approval of capital expenditure and treasury operations;
› Regular meetings to identify and discuss key risks and mitigations with a broad sample of the senior management team and the Executive Directors;
› Review of the corporate risk register in terms of completeness and accuracy with the senior management team and the Executive Directors;
› Audit Committee discussion of the corporate risk register and the risk management system with subsequent reports to the Board;
› The use of a Risk Committee to monitor, validate and report on the Group-wide risk assessment process; and
› The introduction of a senior management top-down approach to complement the work of the Risk Committee.
More information on the Group’s key risks and uncertainties is shown on pages 28 to 30.
The Board and the Audit Committee have reviewed the effectiveness of the Group’s risk management and internal control systems in accordance with the Code for the period ended 31 December 2017, and up to the date of approving the Annual Report and Financial Statements. The risk management and internal control system is designed to manage, rather than eliminate, the risk of failing to achieve business objectives and can provide only reasonable, and not absolute, assurance against material misstatement or loss. The assessment and control of risk are considered by the Board to be fundamental to achieving corporate objectives.

Governance Report
www.hsholdings.com | Stock Code HILS
53
Asset International Structures provides a solution to the Rail Industry using the Asset BaFix 70 Ballast Retention System.
An ongoing process for identifying, evaluating and managing the significant risks faced by the Group and assessing the effectiveness of related controls has been established by the Board to ensure an acceptable risk/reward profile across the Group. This routinely identifies areas for improvement, but the Board has neither identified nor been advised of any failings or weaknesses which it has determined to be material or significant.
Audit CommitteeThe Board has appointed an Audit Committee, which at the beginning and end of the year composed of three independent Non-executive Directors. However there was a period of 5 months, incorporating one meeting where the committee comprised of only two independent Non-executive Directors whilst the process of recruiting a new Non-executive Director was completed, see page 49 for details. The terms of reference of the Audit Committee can be found at www.hsholdings.com and includes the main responsibilities as outlined in the Code. More information on the work of the Committee can be found in the Committee Chairman’s report on pages 56 to 60.
D. RemunerationRemuneration CommitteeThe Board has appointed a Remuneration Committee, which at the beginning and end of the year composed of three independent Non-executive Directors. However there was a period of 5 months, in which there were no Remuneration Committee meetings, where the committee comprised of only two independent Non-executive Directors whilst the process of recruiting a new Non-executive Director was completed, see page 49 for details. The terms of reference of the Remuneration Committee can be found at www.hsholdings.com. The Remuneration Committee Report on pages 62 to 71 explains how the Company applies the Code principles relating to remuneration.
E. Relations with shareholdersThe Board is managing the Group ultimately on behalf of its shareholders and it undertakes this responsibility in such a way as to maximise shareholder value over the long-term and to advance the interests of all of the Group’s stakeholders. In this respect:
› During the year the Chief Executive Officer and Group Finance Director regularly meet with institutional shareholder representatives both in the UK and USA, as well as hosting a site visit at Hill & Smith Limited, Bilston, UK.
› The Chairman met directly with institutional shareholder representatives, and plans to continue this annually;
› The Board regularly receives reports from the Company’s brokers and financial public relations agency on feedback from institutional shareholders following the Executive Directors’ presentations.
› The Company’s Annual Report and Notice of AGM are published as soon as the time required for their printing allows, to provide the maximum time in advance of the AGM for feedback, which is shared with the Board of Directors.
› A presentation is given to shareholders attending the Company’s AGM at which shareholder participation is encouraged. All Directors are present and questions and feedback are invited.
› The Secretary engages with shareholders and the investor community as and when required.
› Proxy votes of shareholders for the AGM are tabulated independently by the Company’s registrars, provided at the AGM and published on the website shortly after the conclusion of that meeting.
› No concerns regarding the running of the company or any proposed action were received or recorded from shareholders.
All Directors are available to meet with shareholders to discuss matters and can be contacted through the Company Secretary. The Chairman and Senior Independent Director are available to meet with shareholders concerning corporate governance issues, if so required.
Copies of all trading updates and Interim and Annual Reports are posted on the Company’s website, together with details of key financial and shareholder information, governance statements, Group policies and corporate and organisational structure.
On behalf of the Board
Jock Lennox
7 March 2018

54 Governance Report
www.hsholdings.com | Stock Code HILS
54
Adaptation and modification of existing rail depot facilities, by Lionweld Kennedy, for Eurostar maintenance within the Temple Mills International Rail Depot.

Governance Report
www.hsholdings.com | Stock Code HILS
55
Nomination Committee compositionDuring the year the Committee comprised myself as the Group’s Chairman, having been appointed as such on 11 May 2017, the Non-executive Directors Annette Kelleher, Mark Reckitt and Alan Giddins (appointed 3 October 2017), and the Group Chief Executive, Derek Muir. Prior to resigning on 11 May 2017, the Company’s previous Chairman, Bill Whiteley also served on the Committee. The Committee met three times in the financial period under review with all eligible members of the Committee being present on each occasion.
Chairman successionDuring the year I took over as Chairman of the Company from Bill Whiteley. Bill had been Chairman since January 2010 in which time the business has experienced strong growth under his leadership and I feel privileged to be given this opportunity and look forward to working with management and the Board as part of Hill & Smith’s exciting future.
Other principal activitiesDuring the year, and the period up to the date of this report, the Committee also considered:
› Board succession and diversity – recognising the desire to maintain the right balance of expertise both at Executive Director and Non-executive Director level, the Committee discussed and planned for any other forthcoming changes.
› Non-Executive appointments and changes in roles and responsibilities on the Board.
› Board evaluation – the Board commissioned Professor Colin Mayer of Saïd Business School at the University of Oxford to facilitate an external Board Effectiveness evaluation and his findings were discussed at the Board’s meeting in January 2018, a summary of which is contained on page 50.
› The appointment of Alan Giddins as a Non-executive Director and Senior Independent Director (see page 51).
The role of the Nomination Committee is to assist the Board in the key areas of Board composition, performance, succession planning and recruitment. Having the appropriate range of high calibre Directors on our Board is key to determining and achieving the Group’s strategic objectives and ensuring that success is sustained over the long-term.
The Committee will consider candidates on merit and against objective criteria and with due regard for the benefits of diversity on the Board, including gender, taking care that appointees have enough time available to devote to the position.
All Non-executive Directors, as well as the Chairman and the Group Finance Director, were selected through externally facilitated
recruitments. All Non-executive Directors are independent, as is the Chairman on appointment (although not counted as such under the Code following appointment). The Board believes this has created an effective group of Executive and Non-executive Directors able to provide the required range of skills, knowledge and experience (see page 49) to ensure development of the Group, implementation of its strategy and sound governance. The Committee will continue to monitor any need to make any further changes to the composition of the Board, in the context of the Company’s strategy.
Following an initial three-year term, the terms of Non-executive Directors are reviewed annually, in line with their annual retirement at the AGM. The letters of appointment for the Non-executive Directors are available for inspection at the Company’s registered office and the AGM.
Date of Appointment Length of service at 31 December 2017
Jock Lennox 12 May 2009 8 years 7 months
(as Chairman 11 May 2017 7 months)
Annette Kelleher 1 December 2014 3 years 1 month
Mark Reckitt 1 June 2016 1 year 7 months
Alan Giddins 3 October 2017 3 months
Non-executive Directors’ letters of appointment set out the time commitments normally required. Such time commitments can involve peaks of activity at particular times and all Directors are expected to be flexible in managing these. Any significant changes to their other commitments are notified to the Board before they arise. The Board remains satisfied as to the time availability and commitment of the Non-executive Directors.
More information on the Nomination Committee’s terms of reference can be found on the Company’s website.
On behalf of the Board
Jock Lennox Chairman, Nomination Committee
7 March 2018
Nomination Committee Report
Jock LennoxChairman, Nomination Committee
56 Governance Report
www.hsholdings.com | Stock Code HILS
Mark ReckittChairman, Audit Committee
Dear Shareholder
It is a pleasure to make my report as the Audit Committee Chairman of Hill & Smith Holdings PLC. I currently hold similar positions at Mitie Group PLC and Cranswick plc. I look forward to working with my fellow committee members and the Company’s senior management team as we continue to develop and enhance our risk management processes and internal audit programmes.
During the year the Committee considered the increased scale of Hill & Smith and asked for a Group Internal Audit Manager to be appointed. This new role, commencing September 2017, was considered by the Committee to be instrumental in ensuring an effective capability to review the Group’s internal control and risk management systems. The Committee also approved an internal audit plan for 2018, put forward by the Group Internal Audit Manager, that focuses on Group-wide thematic reviews, risk mitigation reviews and Group policy compliance, and engaged with third-party advisors to provide assessment of the extent to which subsidiary businesses are at risk from cyber-based attacks.
As reported on last year, the executive team, with the support of the Audit Committee, has continued to build upon the risk assessment methodology which was implemented across the Group in which training sessions on risk identification and definition were delivered to all senior executives across the Group. The subsidiaries have access to an online reporting tool to enable the production of business unit specific risk registers in a consistent format for review and challenge by the Group Risk Committee. During the year the Committee comprised the Group Company Secretary, the Group Financial Controller, the Group Assistant Company Secretary, the Group Internal Audit Manager and the Group’s Director of Corporate
Development. As part of the continual improvement process, senior operational management also provided the Risk Committee information on risks that were apparent across all subsidiaries and that might affect the Group’s ability to deliver its strategic plan.
This Audit Committee report explains how the Committee has discharged its responsibilities, and takes into account the specific areas of:
› Primary areas of judgement considered by the Committee in relation to the 2017 accounts;
› Internal controls;
› Risk assessment, management and mitigation;
› Assessment of effectiveness of external audit; and
› Whistleblowing.
I trust you find this report helpful as an insight into the activities undertaken on your behalf. I should be delighted to answer any questions you might have and I look forward to seeing you at our AGM in May 2018.
Mark ReckittChairman, Audit Committee
7 March 2018
Audit Committee Report

Governance Report
www.hsholdings.com | Stock Code HILS
57
Roles and composition of the CommitteeThe Audit Committee reviews the Group’s accounting policies and procedures, its Annual and Interim Financial Statements before submission to the Board and its compliance with statutory requirements.
The Committee monitors the integrity of the Group’s Financial Statements and announcements relating to financial performance and reviews the significant reporting judgements contained therein. It also reviews the scope, remit and effectiveness of the risk management and internal control systems and internal audit function.
At different times during the year the Audit Committee consisted of Mark Reckitt, Alan Giddins, Annette Kelleher and Jock Lennox.1 January 2017 – 11 May 2017: Mark Reckitt (Chairman); Annette Kelleher; and Jock Lennox.12 May 2017 – 2 October 2017: Mark Reckitt (Chairman); Annette Kelleher.3 October 2017 – 31 December 2017: Mark Reckitt (Chairman); Annette Kelleher; and Alan Giddins (who was appointed to committee on 3 October 2017)
Mark Reckitt, having held the position of Group Strategy Director at Smiths Group plc from February 2011 to April 2014 and Chief Strategy Officer at Cadbury plc from 2004 to 2010 as well as being the current Audit Committee Chairman at Mitie Group PLC and Cranswick plc, has been specifically identified, in keeping with the provisions of the UK Corporate Governance Code, as the Committee member having recent and relevant financial experience.
The Committee’s terms of reference can be found on the Company’s website.
MeetingsThe Committee meets according to the requirements of the Company’s financial calendar and during 2017 met on three occasions; in March to consider the Annual Report together with the external audit findings, in August to review the interim results report and in September to approve the external auditors’ plan and approve their fees. A meeting held in January 2018 reviewed the Subsidiaries’ Risk Registers, and internal audit activities and approved the internal audit plan for the year ahead. Reports on the Group’s principal risks and uncertainties, including updates on the risk management process, were reviewed at each of the meetings.
Attendees at each of the meetings are the Committee’s members as well as, by invitation, the Chairman, the Group Chief Executive, the Group Finance Director, the Group Financial Controller, the recently appointed Group Internal Audit Manager and, where appropriate, the external auditor, KPMG. A record of the meeting attendance by Committee members is set out on page 48.
Time is allowed for the Committee to speak with the external auditor and the Group Internal Audit Manager without the presence of the Executive management.
As Audit Committee Chairman, Mark Reckitt has maintained regular contact with the external audit partner and the Group Internal Audit Manager outside Committee meetings and without the management of the business present. In these meetings a wide range of matters are discussed, including the change in financial reporting and governance landscape, the Company’s readiness to accommodate these developments, the approach to auditing activities, especially outside the UK, and the robustness of our assurance approach generally.
ResponsibilitiesTo ensure governance and control over the Group’s financial reporting and risk management processes with assurance provided by internal activities and external auditors. During the year and to the date of this report the Committee considered the following items:
Financial Statements and Reports Risk Management Internal Audit External Audit and non-Audit Work
› Reviewed the 2017 Annual Report, the 2017 Interim Report and other trading updates issued during the year.
› Reviewed the effectiveness of the Group’s risk management and internal controls and disclosures made in the 2017 Annual Report.
› Advised the Board on whether it is appropriate to adopt the going concern basis of accounting in preparing the Group’s Financial Statements (see page 52).
› Advised the Board on whether the Annual Report and Financial Statements, taken as a whole, are fair, balanced and understandable (see page 60).
› Reviewed areas of the accounts which require particular judgement including the carrying value of goodwill and indefinite life assets; the defined benefit pension scheme valuation; and taxation (see page 58).
› Reviewed the outputs from the Group’s risk management process to ensure that subsidiaries were identifying, articulating, evaluating and mitigating risks and considered changes to encourage both bottom-up and top-down risk assessments.
› Reviewed proposals to enhance the Group’s whistleblowing policy and process and implemented an externally managed reporting facility for employees.
› Reviewed the Group’s proposed approach to compliance with the requirements of the Modern Slavery Act.
› Advised the Board on whether, given an assessment of the Company’s current and forecast position and principal risks, the Board can approve its viability statement (see page 52).
› Assessed the adequacy of the internal control environment and the processes in place to monitor this, including reviewing the performance of the internal audit activity.
› Recommended the appointment of a Group Internal Audit Manager reporting to the Group Finance Director and the Audit Committee Chairman.
› Evaluated the Internal Audit Plan for 2018 that was submitted with reference to the risk management reporting process.
› Considered, along with the external auditor, the significant risks to the audit and their approach to these risks – risk of fraud in revenue recognition; fraud risk from management override of controls; valuation of goodwill in relation to France Galva S.A.; provisions for uncertain income tax positions; and UK post-retirement benefits obligations.
› Reviewed, considered and agreed the methodology of the 2017 audit work to be undertaken by the external auditor.
› Oversaw the relationship with the external auditors, reviewing their performance and advising the Board on their appointment and remuneration;.
› Evaluated the independence and objectivity of the external auditor.
› Reviewed the level and nature of non-audit services provided by the external auditor.
› Reviewed and approved updates to the non-audit services policy.

58 Governance Report
www.hsholdings.com | Stock Code HILS
Primary areas of judgement considered by the Committee in relation to the 2017 accountsIn order to discharge its responsibility to consider accounting and financial reporting integrity, the Committee carefully considers key judgements applied in the preparation of the Consolidated Financial Statements which are set out on pages 87 to 131. The Committee’s review included consideration of the following key accounting judgements:
Valuation of goodwill and indefinite life assetsThe value of goodwill and indefinite life assets amounts to £132.3m at 31 December 2017. The review of such assets is based on a calculation of value in use, using cash flow projections based on financial budgets and strategic plans prepared by senior management and approved by the Board of Directors. The uncertain economic conditions around the world increase the risk of impairment and the Committee addresses this by receiving reports from management outlining the basis for the assumptions used for cash generating units. The Committee also considers and challenges management’s assessment of the sensitivities to these assumptions and the impact that those sensitivities may have, and further considers the disclosures made in respect of sensitivities, in particular in respect of France Galva SA, in note 10 to the Financial Statements on page 105 to 112. Business plans are signed off by the Board and assessment models are reviewed and challenged as part of the audit, for which the external auditor, KPMG, provides reporting to the Committee.
Defined benefit pension scheme valuationNet defined benefit pension obligations under IAS19 amount to £25.6m at 31 December 2017. The Committee reviews benchmarks and assumptions that are provided by the Group’s actuaries and used to value the pension liabilities for the Group’s defined benefit schemes. The underlying assumptions based on market conditions and the characteristics of the schemes are reviewed by management and the external auditors and reported on to the Committee.
TaxationAssessment of judgements made in relation to uncertain tax positions, regarding the outcome of negotiations with and enquiries from HM Revenue & Customs and other tax authorities in other jurisdictions. Judgements have been made by management following discussion with the Group’s tax advisors and internal review. The Committee has reviewed the analysis behind these judgements and confirms its agreement that the Group’s tax provisions are adequate.
Internal auditDuring the year the Audit Committee reviewed the arrangements for internal audit and, having regard for the increased scale of the Group, decided that the effectiveness of Internal Audit would be further improved by the appointment of a Group Internal Audit Manager. This role was effective from September 2017 and was responsible for preparing the annual audit plan for 2018, in conjunction with the Group’s Risk Committee, for approval by the Audit Committee. This ensures that the annual audit plan is a risk-based programme concentrating on reviewing the Group’s assurances and controls over its principal risks. The Group Internal Audit Manager may also perform special investigations and ad hoc reviews, as directed by the Audit Committee, or requested by Executive Management and approved by the Audit Committee. Once approved, the Group Internal Audit Manager implements the plan and reports back to the Audit Committee on the outcomes of the individual audits carried out;
› identifying improvements that can be made to internal controls, risk management and governance processes;
› verifying that such improvements are implemented within a reasonable timeframe;
› providing regular reports to the Audit Committee summarising its work and progress with the Internal Audit Plan; and
› providing an annual report to the Audit Committee summarising the themes arising from work performed during the year, and assessing the level of Internal Audit resource and access to information.
The Audit Committee and Hill & Smith executive management ensure that the Group Internal Audit Manager has free access to the businesses, information and management within the Group and remains free from inappropriate management influence or other restrictions on their ability to perform their work in an objective and effective manner.
Internal controlsThe Committee continued to review a more risk-based approach to the internal control environment and expanded its coverage of the Group’s subsidiaries. As part of the plan to continue to focus on the most appropriate areas, the Group Company Secretary was asked to take responsibility for the Group’s Risk Committee, which also included on a regular basis the Group Financial Controller, the Group Internal Audit Manager and the Group Corporate Development Director together with annual attendance of the Executive Directors. The Risk Committee reviewed the work undertaken, supported by external risk specialists during the course of 2017. This work examined all areas of the business from Board governance to subsidiaries’ day-to-day business activities and included Board policies, contract and project management, procurement and supply chain management, sales and credit management, compliance and financial reporting. Subsidiary businesses were re-familiarised with the risk management cycle and required to identify, define and formalise their mitigation controls as well as self-assess their compliance with Group-wide policies. The reports generated by the subsidiaries and validated by the Risk Committee were reviewed and discussed at the Audit Committee, which concluded that the reports, collectively, provided a balanced overview across the Group, taking into account the level of risk and previous coverage.
At meetings throughout the year, progress against the annual internal audit plan was reviewed and additional areas of concern as determined by the Risk Committee were added to the plan as required. Any changes to the approved audit plan were agreed by the Committee. The Committee received an update from the Group Financial Controller and/or the Group Internal Audit Manager at each meeting summarising the findings of the internal audits undertaken and the progress made against actions agreed from previous audits as well as progress made in the assessment and management of risk both at Group and subsidiary level.
Detailed updates on specific areas were provided at the request of the Committee and for the period covered by this report the following were considered:
› Cyber risk;
› Modern slavery;
› Appropriateness of the carrying value of goodwill and intangible assets of France Galva, SA; and
› Third-party whistleblowing hotlines.
In addition the Audit Committee considered the effectiveness of controls relating to payments due from customers, those due to suppliers, the suitability of suppliers and the adherence to Hill & Smith policies and practices by recently acquired businesses. A review of Cyber Risk was commissioned during the course of 2017 and during 2018 the Audit Committee will review and advise the Board on the implementation of agreed recommendations from
Audit Committee Report (continued)

Governance Report
www.hsholdings.com | Stock Code HILS
59
this review. For 2018 the Committee is continuing to develop with the Group Internal Audit Manager and the Group’s Risk Committee an enhanced and expanded internal audit plan that aligns with the Group’s identification of risks and mitigating activities; assurances and controls, and also assesses conformance against the compliance and policy initiatives that the Group has issued.
Risk managementThe risk management process is continually reviewed throughout the year to ensure that it is set up to deliver appropriate risk management across the Group. Every year the Committee seeks to improve the Group’s risk management processes to ensure that the Group’s principal risks and uncertainties are correctly identified by virtue of a top-down/bottom-up approach utilising the experiences of the Audit Committee and the Group’s 29 subsidiaries. This led in 2016 to the approval of a model for consideration of principal risks that included the implementation of a Group-wide risk assessment process across all subsidiaries. During 2017 this risk assessment and management process, which focused on risk assessment and mitigation within the subsidiaries, was further developed with a programme of training for senior management across the Group; delivered through face-to-face seminars in the UK, USA and Sweden and through a training manual to the other international jurisdictions. Almost 100 senior managers attended the seminars which gave both a refresher of the theory of risk and the Group’s framework as well as practical exercises. These sessions were led by members of the Risk Committee with support from third-party risk professionals and will continue throughout 2018. The Committee believes that these improvements will further strengthen the way that the business understands and manages risk.
During 2017, subsidiaries have been required to identify, articulate and report into an online database the risks to their individual strategies – these are aligned with the Audit Committee’s review of the Group’s principal risks and uncertainties and reviewed, validated and filtered by the Risk Committee to ensure that appropriate subsidiary risk matters are escalated to the Board and Audit Committee. Any risks submitted by subsidiaries that do not align with the Group’s principal risks are individually reviewed and taken into account in current and subsequent reviews of the Group principal risks. The Audit Committee has monitored the resultant key risks on the corporate risk register and during the year received reports and minutes from the Risk Committee, detailing the Group-wide risk assessment process and the movements in major risks and provided updates on risk mitigation activity undertaken in relation to those risks. A summary of the principal risks and uncertainties to which the business is exposed, can be found on pages 28 to 30.
Assessment of effectiveness of external auditThere are a number of areas that the Committee considers in relation to the external auditor: performance in discharging the audit and interim review of the financial statements; independence and objectivity; and reappointment and remuneration.
External auditor performanceThe external auditor, KPMG, provided the Committee with their plan for undertaking the 2017 year-end audit during the Committee meeting in September 2017. This highlighted the proposed approach and scope of the audit and identified the key issues in detail, being the risk of fraud in revenue recognition; fraud risk from management override of controls; valuation of goodwill in relation to France Galva S.A; provisions for uncertain income tax positions and UK post-retirement benefits obligations. The Committee debated, and appropriately challenged, the basis for these areas before agreeing the proposed approach and scope of the external audit.
In January 2018 the Committee considered a report from the Group Finance Director on the effectiveness of the performance of the external auditor. This report included a detailed assessment compiled from the individual businesses and head office finance team feedback and covered, amongst other things:
› The calibre of the external auditor including size, resources, geographical representation and reputation;
› The external audit team in terms of the requisite skills, professional and industry knowledge;
› The scope of the external audit to adequately address the financial reporting risks facing the Company and its key operations;
› The approach taken in assessing the adequacy of management representations; and
› Communication and interface with internal audit activities and the Audit Committee on matters affecting critical accounting policies and treatment, governance and risk management.
The Committee reviewed this feedback together with the 2016/17 Audit Quality Inspection review undertaken by the FRC on KPMG, and discussed the broader topic of the perceived quality and effectiveness of external audits generally. Following this discussion the Committee concluded that KPMG had continued to deliver an effective external audit of the Group’s financial controls, performance reporting and risk identification and management.
The external auditor prepared a detailed report of their findings in respect of the 2017 audit. The Committee discussed the issues raised in the report, particularly in relation to the areas highlighted, at their meeting in February 2018. A similar discussion of the external auditor’s report, following their review, is undertaken by the Committee at the half year. As part of this review the Committee questions and challenges the work undertaken, the findings and the key assumptions made, with particular attention to the areas of audit risk identified.
Auditor independence and rotationThe external auditor confirmed its policies on ensuring auditor independence and provided the Committee with a report on their own audit and quality procedures. This report was reviewed during the period under review and the Committee remained satisfied of the auditor’s independence and with the rotation of the external audit personnel, which complied with the professional guidelines.
To maintain auditor independence the Group has a policy whereby, before any former employee of the external auditor may be employed by the Group, careful consideration is given to whether the independence of the auditor will be adversely affected and approval of the Audit Committee is required.
KPMG have been the Group’s auditors since 1999, having been appointed following a competitive tender process. The external auditors are required to rotate the lead partner every five years. Such changes are carefully planned to ensure business continuity without undue risk or inefficiency. The last partner rotation occurred in December 2016 when Darren Turner, recommended by KPMG and approved by the Audit Committee took over for the 31 December 2016 year-end audit. This year’s audit will be his second.
Following the EU Audit Directive which took effect from June 2016, the Group has adopted a policy that no external auditor appointed after June 2016 can remain in post for longer than twenty years and there will be a tendering process every ten years, and that KPMG, as the currently appointed external auditor, may remain so until the completion of the 2023 annual audit. However the Committee will

60 Governance Report
www.hsholdings.com | Stock Code HILS
continue to consider annually the need to tender the audit for audit quality or independence reasons and may seek to tender the audit at any time prior to the next partner rotation in 2021. There are no contractual obligations in place that restrict our choice of statutory auditor. The Committee also reviewed its ‘Non-Audit Services’ policy in January 2018 to ensure it meets the detailed requirements of the EU Audit legislation, which restricts the use of the external auditor for activities including compiling accounting records, certain aspects of internal audit, IT consultancy, tax services except in exceptional circumstances, and advice to the Remuneration Committee.
For any non-audit services (which are not excluded under the policy), the policy provides for approval, by the Group Finance Director, of expenditure below £50,000, and above that level by the full Audit Committee. A report is also submitted to the Audit Committee of any non-audit services carried out by the external auditor, irrespective of value to ensure that the aggregated spend with the external auditor will not exceed 70% of the audit fee.
Where the Committee believes it is cost effective for non-audit services to be provided by the external auditor, such as those relating to acquisition due diligence work, it will consider the engagement of the external auditor, subject to application of the principles of the policy, including the financial limits.
During 2017, there were fees of £122,600 (2016: £343,100) paid to the auditor for non-audit services. The fees paid covered due diligence on acquired businesses and aborted acquisition costs £92,400 (2016: £241,500), pension advice £Nil (2016: £45,000), assurance reviews £13,500 (2016: £40,100) and restructuring work £16,700 (2016: £16,300). Audit fees for 2017 were £793,000, representing a 1:6 ratio between non-audit and audit fees (2016: 1:2). Further details of these amounts are included in note 6 of the accounts on page 102.
WhistleblowingThe Group has a written policy which states that if any employee in the Group has reasonable grounds to believe that the Group’s Code of Business Conduct is being breached by any person or group of people, they are able to report such incidents through a third party provided whistleblowing hotline or if necessary, to the Company Secretary or the Chairman of the Audit Committee.
During the year the Committee received reports from the Group Company Secretary on matters reported under the Group’s whistleblowing policy, which supports the provision of an externally-hosted internet and telephone based whistleblowing hotline. Any incidents reported whether through the whistleblowing hotline or direct to the Company Secretary or any other member of Group-level management are investigated under the supervision of the Company Secretary and resolved appropriately.
Fair, balanced and understandable The Committee examined the 2017 Annual Report and was specifically tasked by the Board to advise it on whether the 2017 Annual Report is fair, balanced and understandable. Prior to recommending to the Board that they were able to sign the Annual Report and Accounts the Committee reviewed a report received from the management responsible for the preparation of the Annual Report detailing how the report had been compiled.
The Committee considered the information laid out in the Annual Report and concluded:
› That the process by which the allocation of responsibility for the preparation of certain sections of the Annual Report to individuals in the head office team and their review by external advisors was fit for purpose;
› That the information given represented the whole story of the business’ performance in 2017 and did not mislead the reader by excluding appropriate bad news. That the disclosures of the Group’s business segments and key messages are consistently delivered throughout the document, KPIs are clear and appropriate and linked to both the Group’s strategy and remuneration incentives;
› That it was a suitable document to inform both existing and prospective shareholders about the financial and non-financial performance of the business, with the messages delivered in the Directors’ Report, including the Operating and Financial Review and the Financial Statements being balanced and consistent and that the report set out a detailed and fair representation of the Group’s activities and performance and that certain matters have been identified and discussed between management, the Audit Committee and KPMG in order to correctly disclose the performance, controls and prospects of the Group; and
› That the document allowed shareholders to follow the whole story of the Group’s financial and non-financial performance in 2017 giving them a clear and understandable picture of the Group’s business model, key drivers and commercial operations.
Following the review, the Committee confirmed that the Annual Report was fair, balanced and understandable and reported to the Board accordingly.
SummaryWe aim to continue to develop responsibilities for financial reporting and the related governance and assurance and we will continue to make improvements to our risk management processes and approach to our internal control environment.
Mark ReckittChairman, Audit Committee
7 March 2018
Audit Committee Report (continued)

Governance Report
www.hsholdings.com | Stock Code HILS
61
Top: ZoneGuard installed on E4 at Häggvik north of Stockholm, at the start of the new Stockholm ring road. Below: Single-sided Varioguard installed on the Clyesdale Expressway, Glasgow.
61

62 Governance Report
www.hsholdings.com | Stock Code HILS
Remuneration Committee Report
Annette KelleherChair, Remuneration Committee
Dear Shareholder,
I am pleased to present our Directors’ Remuneration Report for 2017. Our Directors’ Remuneration Policy was approved at our AGM in May 2017 and you will find a summary of the policy on pages 72 to 76.
This Policy was strongly supported by shareholders, with more than 93% of the votes in favour of it.
Our revised Directors’ Remuneration PolicyWhen reviewing our policy, prior to the AGM in May 2017, we considered and reviewed a number of items, including the Company’s short and long-term strategy, its overall performance and the remuneration arrangements already in place. We were also mindful of general guidance from shareholders and good remuneration practice.
On balance, we took the view that the existing remuneration framework continued to effectively support the delivery of the business strategy and the ongoing creation of shareholder value. Therefore, we did not make any structural changes to our Policy, but we chose to modify some elements of the Policy to support the business performance and succession planning over the next three years.
However, we did recognise both the growth of the Group over the last few years, as well as certain shareholder expectations of us as a FTSE 250 company. Reflecting the significant increase in scale and complexity of the Company, both in the UK and internationally over the last few years the overall maximum annual bonus opportunity was increased from 100% to 125% of base salary under the new Policy in 2017. Given the continued strong performance of the business, the maximum bonus opportunity for the Executive Directors in 2018 will be 125% of base salary with up to 20% of the bonus earned being delivered in the form of shares that are deferred for two years.
Further recognising the Company’s growth and success, the Policy permits the Committee to grant LTIP awards of up to 150% of base salary. However, 2018 LTIP awards for the Executive Directors will continue to be 125% of base salary and will be subject to a further two year holding period after vesting.
In addition, we also increased shareholding requirements significantly for our Executive Directors, from 100% to 200% of base salary to contribute further to robust shareholder alignment. We also formally introduced malus and clawback into both the annual bonus and long term incentive plans.
2017 performance and remuneration
Against a backdrop of uncertain political and macro-economic conditions the Company has recorded excellent results. More details about the Company’s operational and financial performance can be found on pages 13 to 23.
This very strong performance is reflected in the incentive remuneration outturns for 2017. In summary, the Executive Directors earned bonuses of 94% of salary. More information in relation to the detail of the 2017 annual bonus is included on page 65.
The performance period for LTIP awards granted in 2015 ended on 31 December 2017. Two criteria were applied to these awards, 50% being a performance condition based on TSR growth compared to the FTSE SmallCap and 50% being growth in UEPS. Following an assessment of the performance conditions, the awards vested at 100% – more information is given on page 66.
2018 base salary and feesOur usual practice is to review Executive Directors’ salaries on an annual basis, with increases typically in line with the increases awarded to the wider workforce. For 2018, we are following this principle and our Executive Director salary increases of 3% are in line with our wider workforce. Full details can be found on pages 69 and 70.
The Non-executive director fees have been increased by approximately 3% with effect from 1 January 2018. Following a review which indicated that the Chairman’s fee was positioned below the market competitive range and taking into account the increase in the scale and complexity of the business and the scope of the role for a FTSE 250 business, the Board approved an increase in the Chairman’s fee from £147,500 to £165,000 in line with the lower end of the market range. Details on other Non-executive fees are set out on pages 68 and 71.
Annette Kelleher
Chair, Remuneration Committee 7 March 2018

Governance Report
www.hsholdings.com | Stock Code HILS
63
Policy and strategyThe Company’s strategy is explained in detail on pages 6 to 11. The Company’s Remuneration Policy was approved by shareholders at the Annual General Meeting (‘AGM’) on 11 May 2017 with 93.44% of all votes cast in favour. The full policy can be found in complete form on the Company’s website. The Remuneration Policy Table and accompanying notes to the Policy have been provided on pages 72 to 76 as it is considered these would be helpful for shareholders to have them repeated in this year’s report. However, to aid reading in relation to the application of the Remuneration Policy in 2018, certain date references have been updated.
The Policy permits the payment of base salary, benefits and pension in order to recruit and retain Executive Directors. Additional variable amounts of pay in respect of annual bonuses and Long-Term Incentive Plans (‘LTIP’) are made to reward achievement of the annual financial and/or strategic business objectives and the achievement of higher returns for shareholders in the longer term. The table below sets out how variable remuneration is linked to the Company’s strategic drivers and business objectives.
Strategic drivers Measured by annual bonus targets of: Leads to:Measured by Long-Term Incentive Plan targets of:
Organic revenue growth
Our objective is to achieve at least mid-single digit organic revenue growth, which combined with selective acquisitions, will deliver growth in earnings per share.
Operating margins are an integral measure of the Group’s success. Our target operating margin for a business unit is 10%, although a lower margin profile may be acceptable if the business’ return on capital employed is above 20%.
UEPSROICOperating margins
Shareholder value
50% of any award is based on growth in the absolute UEPS, over the three-year performance period;
and
50% of the award is based on TSR performance over the three-year performance period relative to an appropriate comparator group.
Geographical diversification
The international diversity of the markets in which we operate continues to underpin our performance.
Budgeted profit
Entrepreneurial culture
We encourage an entrepreneurial culture in our businesses ensuring that they are agile and responsive to changes in their competitive environment.
Budgeted profit ROICOperating margins
Active portfolio management
Our strategic objective is to develop more sustainable businesses in each of our chosen sectors through organic and acquisitive growth.
Budgeted profitROICOperating margins
Sustainable profitable growth
Our objective is to deliver balanced profitable growth through both organic growth and acquisition opportunities.
UEPS
The extent to which payments and awards have been made under the Annual Bonus and LTIP arrangements can be found on page 65.
Committee activityThe CommitteeDuring the year, and the period to the date of this report, the Remuneration Committee (the ‘Committee’) consisted of Annette Kelleher, Chairman, together with Jock Lennox, Mark Reckitt and Alan Giddins. For more details see below.
1 January 2017- 11 May 2017: Annette Kelleher (Chairman); Mark Reckitt; and Jock Lennox.12 May 2017- 2 October 2017: Annette Kelleher (Chairman); Mark Reckitt.3 October 2017 - 31 December 2017: Annette Kelleher (Chairman); Mark Reckitt; and Alan Giddins (who was appointed to committee on 3 October 2017).All members of the Committee are Non-executive Directors of the Company and are regarded as independent. They do not participate in any form of performance related pay or pension arrangements.During this time the Committee:
› Approved the annual bonus calculation and payment for the financial years 2016 and 2017 – further information is given on page 65;
› Measured the performance conditions of the Company’s LTIP in respect of awards granted in 2014, confirming that 100.0% of the TSR portion and 100.0% of the UEPS portion of the original award vested;
› Approved grants under the Company’s LTIP;
› Following the review of the Remuneration Policy during 2016, the Company introduced a new Remuneration Policy that was put before members at the Company’s AGM in May 2017 and approved by 93.44% of shareholders;
› Measured the performance conditions of the Company’s LTIP in respect of awards granted in 2015, confirming that 100% of both the Total Shareholder Return (‘TSR’) portion and the UEPS portion of the original award would vest – further information is given on page 66;
› Approved the award of a new SAYE scheme, to run from December 2017 for a three or five year period. Options to be awarded with the maximum discount of 20% allowable under HMRC rules;
Directors’ Remuneration Report

64 Governance Report
www.hsholdings.com | Stock Code HILS
› Reviewed the base salaries of the Executive Directors and approved a 3% increase, with effect from 1 January 2018, in line with the increases awarded to the wider workforce;
› Approved the annual bonus performance measures and targets for 2018;
› Reviewed reports on the Group’s approach to the National Minimum Wage and the Gender Pay Gap in UK subsidiaries where this was appropriate. Approving the Gender Pay statement for inclusion on the relevant websites;
› Reviewed and approved the Company’s Annual Remuneration Report for inclusion in the Company’s 2017 Annual Report and Accounts; and
› Considered and approved the Committee’s terms of reference.
The terms of reference for the Remuneration Committee can be found at the Group’s website www.hsholdings.com.
AdvisorsDeloitte LLP is retained to provide independent advice to the Remuneration Committee as required. Deloitte is a member of the Remuneration Consultants Group and, as such, voluntarily operates under the Code of Conduct in relation to executive remuneration consulting in the UK. Deloitte were appointed by the Committee and provided remuneration advice, share scheme advice, pension advice and corporation tax advice to the Group. Their fees for providing remuneration advice to the Committee amounted to £10,950 for the year ended 31 December 2017. The Committee assesses from time to time whether this appointment remains appropriate or should be put out to tender and takes into account the Remuneration Consultants Group Code of Conduct when reviewing Deloitte’s ongoing appointment. The Chief Executive Officer also attends Remuneration Committee meetings to provide advice and respond to specific questions, but he is not in attendance when his own remuneration is discussed, nor is the Group Finance Director. The Company Secretary acts as Secretary to the Remuneration Committee.
Statement of voting at the last AGMThe Group remains committed to ongoing shareholder dialogue and takes an active interest in voting outcomes. Both the Company’s Remuneration Policy and Remuneration Report were put before members at our AGM in May 2017 and were approved by 93.44% and 97.27% of shareholders respectively, see below.
% of votes For Against Withheld votes
Remuneration Policy Report 93.44% 6.56% 826,027 votes were withheld in relation to this resolution (<0.5%)
% of votes For Against Withheld votes
Annual Remuneration Report 97.27% 2.73% 48,419 votes were withheld in relation to this resolution (<0.5%)
The following parts of the Remuneration Report are subject to audit other than elements explaining the application of the 2018 policy.How the Remuneration Policy was implemented in 2017 – Executive DirectorsSingle remuneration figure for 2017
Base Salary(1) Taxable Benefits(2) Annual Bonus(3)
LTIP (vested in respect of performance period
ended 2017)(4) Pension
Total ‘Single
Figure’ 2017
D W Muir 493,000 50,465 463,421 954,463 123,250 2,084,599
M Pegler 345,100 22,279 324,394 610,703 86,275 1,388,751
Total 838,100 72,744 787,815 1,565,266 209,525 3,473,350
Single remuneration figure for 2016
Base Salary(1) Taxable Benefits(2) Annual Bonus(3)
LTIP (vested in respect of performance period
ended 2016) Pension
Total ‘Single
Figure’ 2016
D W Muir 478,500 49,457 478,500 1,008,377 119,625 2,134,459
M Pegler 320,500 21,630 320,500 645,051 80,125 1,387,806
Total 799,000 71,087 799,000 1,653,428 199,750 3,522,265
(1) The amount of base salary received in the year.
(2) The taxable value of benefits that can be received in the year: membership of the Company’s healthcare scheme, income protection scheme, personal accident insurance, car (or cash allowance), ill health and life assurance. A total of £20,989 (2016: £20,898) was paid to D W Muir in the form of subsistence which is subject to PAYE and NIC deduction.
(3) Annual Bonus is the value of the bonus earned in respect of the financial period under review. A description of how the bonus pay out was determined can be found on page 65.
(4) LTIP is the value of LTIPs vested in respect of a performance period ended in 2017. A description of the basis on which awards vested and the value can be found on page 66.
SalaryBasic salaries for Executive Directors are reviewed by the Committee on an annual basis or when a material change of responsibility occurs. The Remuneration Committee does not have a formal positioning policy for base salary as it is acutely aware of the issues around setting pay solely by reference to a benchmark reference point.
Directors’ Remuneration Report (continued)

Governance Report
www.hsholdings.com | Stock Code HILS
65
During the period under review the Committee reviewed the salaries of the Executive Directors and other senior executives, in the context of reports received from the Committee’s remuneration consultants, the current performance of the Company and the levels of pay increases applied throughout the Group’s UK and international businesses. This approach is consistent with previous years.
BenefitsThe taxable value of benefits that can be received during the year are: membership of the Company’s healthcare scheme, income protection scheme, personal accident insurance, car (or cash allowance), ill health and life assurance. D W Muir receives an amount for subsistence which is subject to PAYE and NIC deductions.
2017 annual bonusEach Executive Director was eligible to earn a bonus for 2017 of up to 100% of his base salary. The extent to which the bonus was earned is summarised below. As in previous years, the Committee is disclosing the bonus outturns, and will disclose further details as to the range of performance targets (i.e. as shown below in relation to the 2016 bonus) in next year’s report, provided those performance targets are no longer considered commercially sensitive.
Maximum pay out per performance measure Actual performance
Actual pay out per performance measure
Growth in UEPS 25% 15% 25%
Underlying profit before tax (at budgeted exchange rates) 25% £77.8m 23%
Underlying operating margins 25% 13.9% 25%
Achievement of budgeted internal ROIC 25% 20.2% 21%
Total 100% 94%
2016 annual bonusThe performance conditions for the year ended 31 December 2016 applied in equal measure and the targets, performance levels achieved and bonuses earned by reference to that performance are shown below:
Target performance Stretch performance
Maximum pay out per
performance measure
(% of base salary)
2016 on target performance
Bonus payable for on target performance
(% of base salary)
2016 stretch performance
Bonus payable for stretch
performance (% of base
salary) Actual performance (1)
Actual pay out per performance
measure (% of base salary)
Growth in UEPS 25% 2% 15% 7% 25% 22% 25%
Underlying profit before tax 25% £58.7m 15% £61.6m 25% £64.8m 25%
Underlying operating margins 25% 13.2% 15% 13.4% 25% 13.6% 25%
The delivery of specific strategic objectives related to non-US Pipe Supports business
25%
Performance assessment
by the Remuneration
Committee 15%
Performance assessment
by the Remuneration
Committee 25%
Completed ahead of target timeframe and budgeted costs 25%
Total 100% 60% 100% 100%
(1) The strategic objectives related to the restructuring of the non-US Pipe Supports businesses and the actual financial performance detailed above excludes the restructured Pipe Supports business.
LTIP awards vesting in respect of 2017Each Executive Director was granted an LTIP award on 13 March 2015 which vested subject to the achievement of performance conditions based on absolute UEPS growth over the three year performance period ended 31 December 2017 (as regards 50% of the award) and TSR relative to the FTSE SmallCap excluding investment trusts (as regards 50% of the award). The extent to which the awards vested and the value included in the single figure of remuneration table as a result is set out below.

66 Governance Report
www.hsholdings.com | Stock Code HILS
Directors’ Remuneration Report (continued)
Performance targets VestingActual performance Actual vesting
Shares subject to award Vesting shares Vested value *
Threshold15% UEPS growth 25% UEPS growth
of 67%UEPS: 100%
of maximum D W Muir 72,805 72,805 891,133Median TSR 25%
Maximum30% UEPS growth 100% TSR ranked 10
(out of 127)TSR: 100% of
maximum M Pegler 46,583 46,583 570,176Upper Quartile 100%
* The value of shares is calculated by reference to the share price on 1 March 2018, being £12.24. In accordance with the rules of the LTIP, each of Messers Muir and Pegler is entitled to a further benefit by reference to the dividends paid over the period from grant to vesting, amounting to £63,330 in the case of D W Muir and £40,527 in the case of M Pegler.
Total pension entitlementsD W Muir was a member of the Hill & Smith 2016 Pension Scheme (‘the Scheme’), the Group’s defined benefit pension plan, until 22 June 2017. On 22 June 2017, he took a cash equivalent transfer value from the Scheme. This transfer value was for £4,534,510 and he now has no entitlement in the Scheme. Movements in the year are shown below.
Accrued pension at 31 December 2016 (no revaluation) £126,297
Transfer value of accrued pension at 22 June 2017 £4,534,510
Accrued pension at 31 December 2017 (no revaluation) -
Normal retirement date 06/07/2020
As noted last year for the 2016 year end accounts, D W Muir had ceased benefit accrual in 2011 and had then received a cash supplement amount in lieu of company pension contributions. As such, he has not had any further benefit accrual within the Scheme from 2011. Any inflationary increases that have occurred are in line with statutory requirements.
In addition, there is a requirement to provide information on the aggregate pension input amount across all pension schemes in which the director accrues benefits, calculated using a specific method, broadly in line with Section 229 of the Finance Act 2004 (a) for the last 5 financial years (ultimately increasing to the last 10 years). The figures are:
Year ending Pension input amount
31/12/2009 £66,666
31/12/2010 £25,640
31/12/2011 £99,467
31/12/2012 £nil
31/12/2013 £nil
31/12/2014 £nil
31/12/2015 £nil
31/12/2016 £nil
31/12/2017 £nil
*As D W Muir ceased accrual in the Scheme during 2011, the pension input amounts in respect of the Scheme for the years ending 31 December 2012 to 31 December 2017 (inclusive) are £nil.
Pension contributionsD W Muir receives a cash payment in lieu of any pension contribution, equal to 25% of his base salary amounting to £123,250 for the year ended 31 December 2017 (2016: £119,625).
M Pegler receives a cash payment in lieu of any pension contribution, equal to 25% of his base salary amounting to £86,275 for the year ended 31 December 2017 (2016: £80,125).
Other than as stated above, there are no other pension arrangements in place for Executive Directors.
The Remuneration Committee intends to operate the same pension provision for 2018 that was operated in 2017.
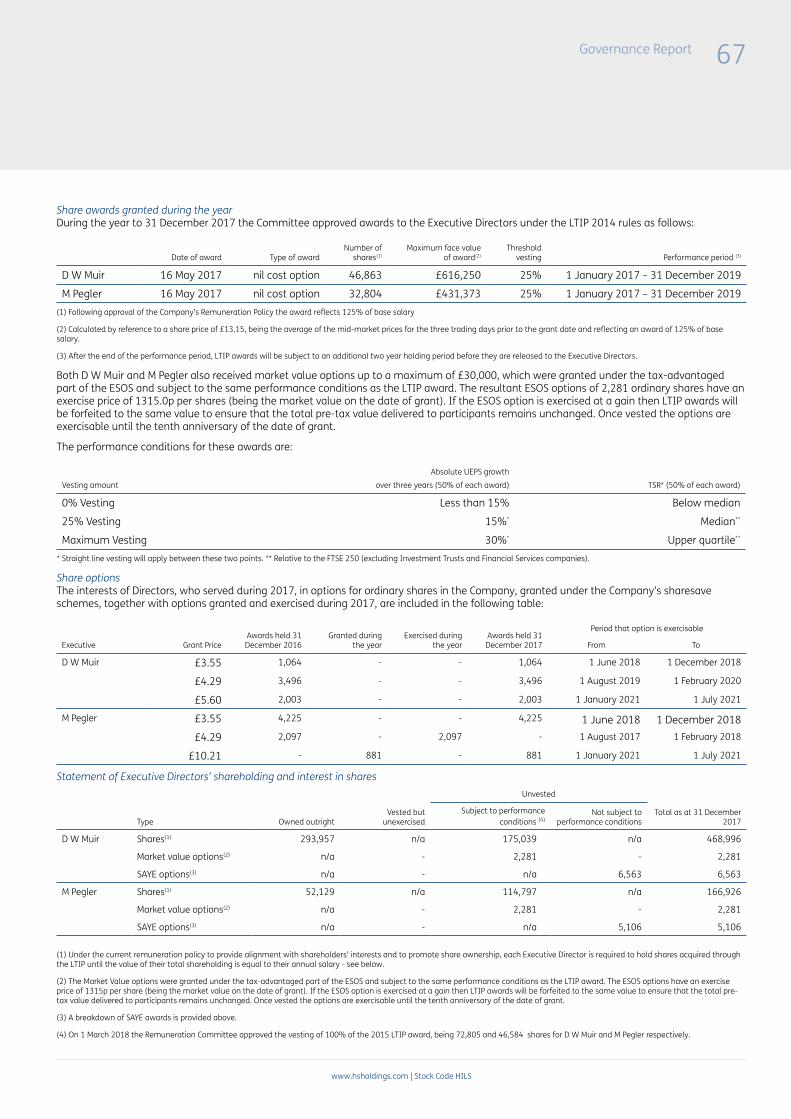
Governance Report
www.hsholdings.com | Stock Code HILS
67
Share awards granted during the yearDuring the year to 31 December 2017 the Committee approved awards to the Executive Directors under the LTIP 2014 rules as follows:
Date of award Type of awardNumber of
shares(1)Maximum face value
of award(2)Threshold
vesting Performance period (3)
D W Muir 16 May 2017 nil cost option 46,863 £616,250 25% 1 January 2017 – 31 December 2019
M Pegler 16 May 2017 nil cost option 32,804 £431,373 25% 1 January 2017 – 31 December 2019
(1) Following approval of the Company’s Remuneration Policy the award reflects 125% of base salary
(2) Calculated by reference to a share price of £13.15, being the average of the mid-market prices for the three trading days prior to the grant date and reflecting an award of 125% of base salary.
(3) After the end of the performance period, LTIP awards will be subject to an additional two year holding period before they are released to the Executive Directors.
Both D W Muir and M Pegler also received market value options up to a maximum of £30,000, which were granted under the tax-advantaged part of the ESOS and subject to the same performance conditions as the LTIP award. The resultant ESOS options of 2,281 ordinary shares have an exercise price of 1315.0p per shares (being the market value on the date of grant). If the ESOS option is exercised at a gain then LTIP awards will be forfeited to the same value to ensure that the total pre-tax value delivered to participants remains unchanged. Once vested the options are exercisable until the tenth anniversary of the date of grant.
The performance conditions for these awards are:
Vesting amount
Absolute UEPS growth
over three years (50% of each award) TSR* (50% of each award)
0% Vesting Less than 15% Below median
25% Vesting 15%* Median**
Maximum Vesting 30%* Upper quartile**
* Straight line vesting will apply between these two points. ** Relative to the FTSE 250 (excluding Investment Trusts and Financial Services companies).
Share optionsThe interests of Directors, who served during 2017, in options for ordinary shares in the Company, granted under the Company’s sharesave schemes, together with options granted and exercised during 2017, are included in the following table:
Executive Grant PriceAwards held 31 December 2016
Granted during the year
Exercised during the year
Awards held 31 December 2017
Period that option is exercisable
From To
D W Muir £3.55 1,064 - - 1,064 1 June 2018 1 December 2018
£4.29 3,496 - - 3,496 1 August 2019 1 February 2020
£5.60 2,003 - - 2,003 1 January 2021 1 July 2021
M Pegler £3.55 4,225 - - 4,225 1 June 2018 1 December 2018
£4.29 2,097 - 2,097 - 1 August 2017 1 February 2018
£10.21 - 881 - 881 1 January 2021 1 July 2021
Statement of Executive Directors’ shareholding and interest in sharesUnvested
Type Owned outrightVested but
unexercisedSubject to performance
conditions (4)Not subject to
performance conditionsTotal as at 31 December
2017
D W Muir Shares(1) 293,957 n/a 175,039 n/a 468,996
Market value options(2) n/a - 2,281 - 2,281
SAYE options(3) n/a - n/a 6,563 6,563
M Pegler Shares(1) 52,129 n/a 114,797 n/a 166,926
Market value options(2) n/a - 2,281 - 2,281
SAYE options(3) n/a - n/a 5,106 5,106
(1) Under the current remuneration policy to provide alignment with shareholders’ interests and to promote share ownership, each Executive Director is required to hold shares acquired through the LTIP until the value of their total shareholding is equal to their annual salary - see below.
(2) The Market Value options were granted under the tax-advantaged part of the ESOS and subject to the same performance conditions as the LTIP award. The ESOS options have an exercise price of 1315p per share (being the market value on the date of grant). If the ESOS option is exercised at a gain then LTIP awards will be forfeited to the same value to ensure that the total pre-tax value delivered to participants remains unchanged. Once vested the options are exercisable until the tenth anniversary of the date of grant.
(3) A breakdown of SAYE awards is provided above.
(4) On 1 March 2018 the Remuneration Committee approved the vesting of 100% of the 2015 LTIP award, being 72,805 and 46,584 shares for D W Muir and M Pegler respectively.

68 Governance Report
www.hsholdings.com | Stock Code HILS
Directors’ Remuneration Report (continued)
Shareholding guidelines
D W Muir M Pegler
Shareholding requirement 200% 200%
Current shareholding as at 31 December 2017 293,957 52,129
Current value (based on share price on 31 December 2017 of £13.39)
£3,936,084 £698,007
Current % of salary 798% 202%
These figures include those of their spouse or civil partner and infant children, or stepchildren. At the date of this report, D W Muir and M Pegler are interested in an additional 41,329 and 26,444 shares respectively, being the net amount of those shares vested on 1 March 2018 in respect of the 2015 LTIP award and D W Muir held an extra 399 shares received on 5 January 2018 through the Company’s Dividend Re-Investment Plan (‘DRIP’).
Non-executive Director shareholdingDirector 2017 2016
J F Lennox 7,500 5,000
A C B Giddins 4,500 -
A M Kelleher 2,164 2,164
M J Reckitt 4,000 4,000
These figures include those of their spouses, civil partners and infant children, or stepchildren. There was no change in these beneficial interests between 31 December 2017 and 7 March 2018. The Non-executive Directors do not hold any share awards or share options.
Non-executive Directors do not have a shareholding guideline but they are encouraged to buy shares in the Company.
Loss of office payments and payments to former directorsThere were no loss of office payments or payments made to past Directors during the year ended 31 December 2017.
Transactions with DirectorsThere were no material transactions between the Group and the Directors during 2017.
How the Remuneration Policy was implemented in 2017 – Non-executive DirectorsNon-executive Director single figure comparison
Director Role Board Fees Other FeesTaxable Benefits
Annual Bonus LTIP Pension
Total ‘Single Figure’ 2017
Total ‘Single Figure’ 2016
W H Whiteley(1) Chairman 54,272 - - - - - 54,272 143,170
J F Lennox(2) Chairman & Senior Independent Director 114,577 - - - - - 114,577 52,899
A C B Giddins(3) Senior Independent Director 13,609 - - - - - 13,609 -
A M Kelleher Remuneration Committee Chairman 55,000 - - - - - 55,000 49,161
M J Reckitt Audit Committee Chairman 55,000 - - - - - 55,000 26,917
Total 292,458 - - - - - 292,458 272,147
(1 )W H Whiteley resigned as Chairman of the Company on 11 May 2017.
(2) J F Lennox, who served as Senior Independent Director from 1 January 2016 until 11 May 2017 received a base fee of £18,438 plus an additional £2,911 as Senior Independent Director. On 11 May 2017, he was appointed Chairman of the Company and received an annual fee of £147,500 prorated over the year.
(3) A C B Giddins was appointed to the Board as Senior Independent Director on 3 October 2017 and received a base fee of £11,753 and an additional fee as £1,856 for Senior Independent Director for the period in which he served as a non-executive director.
The Non-executive Directors do not have service contracts, only letters of appointment, and fees for Non-executive Directors are determined by the Executive Directors in light of market best practice and with reference to the time commitment and responsibilities associated with the role. The Non-executive Directors do not participate in any decision in relation to the determination of their fees and are not eligible for performance related bonuses or the grant of awards under any Group incentive scheme. No pension contributions are made on their behalf.

Governance Report
www.hsholdings.com | Stock Code HILS
69
The following parts of the Remuneration Report are not subject to auditTSR performance graphThe following graphs show the TSR performance of the Company since January 2015 against the FTSE SmallCap index and the FTSE 250. TSR was calculated by reference to the growth in share price, as adjusted for reinvested dividends.
Changes in remuneration of the Chief Executive Officer compared to the wider workforceThe table below sets out in relation to salary, taxable benefits and annual bonus the percentage increase in pay for D W Muir compared to the wider workforce between 2016 and 2017.
Percentage increase Chief Executive Officer Wider workforce
Salary 3% 2% - 5%
Taxable benefits 2% -
Annual bonus -3% -3%
For salary purposes the ‘wider workforce’ comparator group looked at the increases awarded across the UK subsidiaries at all levels of the workforce and found that pay awards across these businesses ranged from between 2% and 5%, with the average being 3.72%. Additional increases were also made to take into account structural changes within the wider pay environment. The bonus figures were taken from those senior executives operating on similar incentivised arrangements to the CEO and capable of influencing the Group’s performance, as well as their own individual businesses’ performance.
Relative importance of spend on pay2017 2016 % change
Dividends in respect of the financial year £23.8m £20.7m 15.0%
Overall spend on pay £148.7m £140.6m 5.8%(1)
(1) This includes a 2.6% increase in the average number of people employed by the Group. See note 4 to the accounts on page 101.
0
50
100
150
200
250
300
Jan 15 Jan 16 Jan 17
Tota
l Sha
reho
lder
Ret
urn
(reb
ased
to 1
00)
Hill & Smith FTSE 250
0
50
100
150
200
250
300
Jan 15 Jan 16 Jan 17
Tota
l Sha
reho
lder
Ret
urn
(reb
ased
to 1
00)
Hill & Smith FTSE SmallCap
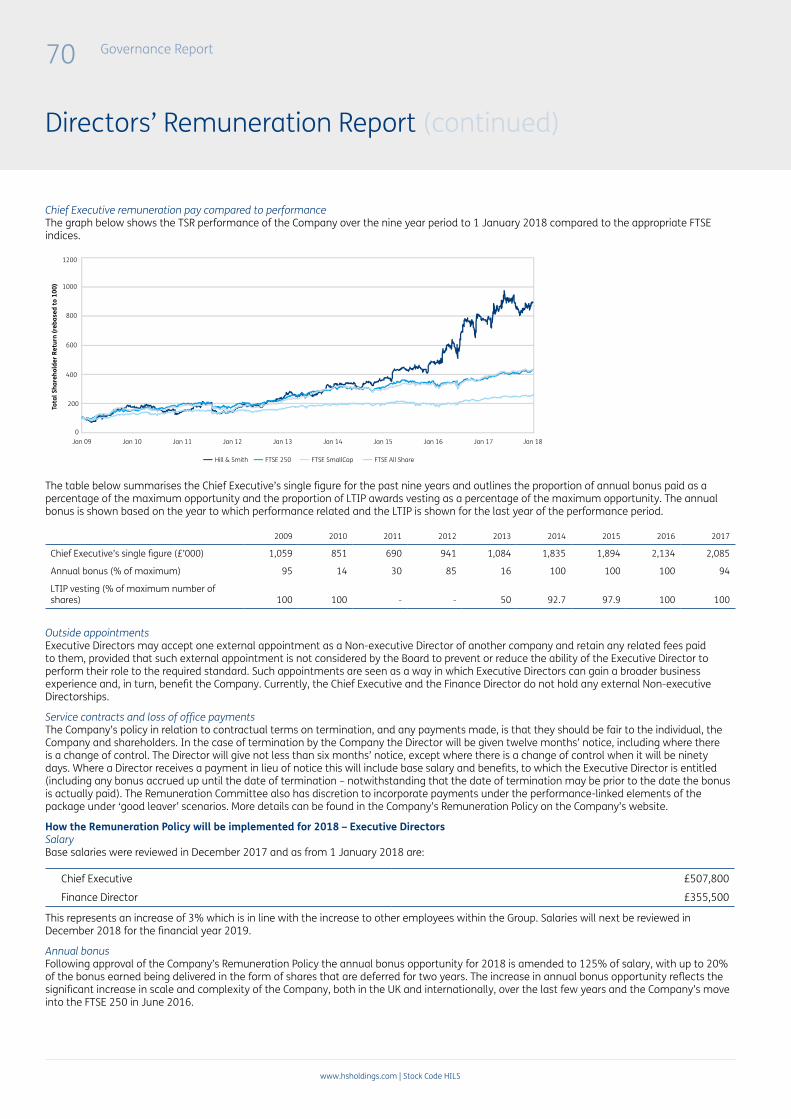
70 Governance Report
www.hsholdings.com | Stock Code HILS
Directors’ Remuneration Report (continued)
Chief Executive remuneration pay compared to performanceThe graph below shows the TSR performance of the Company over the nine year period to 1 January 2018 compared to the appropriate FTSE indices.
The table below summarises the Chief Executive’s single figure for the past nine years and outlines the proportion of annual bonus paid as a percentage of the maximum opportunity and the proportion of LTIP awards vesting as a percentage of the maximum opportunity. The annual bonus is shown based on the year to which performance related and the LTIP is shown for the last year of the performance period.
2009 2010 2011 2012 2013 2014 2015 2016 2017
Chief Executive’s single figure (£’000) 1,059 851 690 941 1,084 1,835 1,894 2,134 2,085
Annual bonus (% of maximum) 95 14 30 85 16 100 100 100 94
LTIP vesting (% of maximum number of shares) 100 100 - - 50 92.7 97.9 100 100
Outside appointmentsExecutive Directors may accept one external appointment as a Non-executive Director of another company and retain any related fees paid to them, provided that such external appointment is not considered by the Board to prevent or reduce the ability of the Executive Director to perform their role to the required standard. Such appointments are seen as a way in which Executive Directors can gain a broader business experience and, in turn, benefit the Company. Currently, the Chief Executive and the Finance Director do not hold any external Non-executive Directorships.
Service contracts and loss of office paymentsThe Company’s policy in relation to contractual terms on termination, and any payments made, is that they should be fair to the individual, the Company and shareholders. In the case of termination by the Company the Director will be given twelve months’ notice, including where there is a change of control. The Director will give not less than six months’ notice, except where there is a change of control when it will be ninety days. Where a Director receives a payment in lieu of notice this will include base salary and benefits, to which the Executive Director is entitled (including any bonus accrued up until the date of termination – notwithstanding that the date of termination may be prior to the date the bonus is actually paid). The Remuneration Committee also has discretion to incorporate payments under the performance-linked elements of the package under ‘good leaver’ scenarios. More details can be found in the Company’s Remuneration Policy on the Company’s website.
How the Remuneration Policy will be implemented for 2018 – Executive DirectorsSalaryBase salaries were reviewed in December 2017 and as from 1 January 2018 are:
Chief Executive £507,800
Finance Director £355,500
This represents an increase of 3% which is in line with the increase to other employees within the Group. Salaries will next be reviewed in December 2018 for the financial year 2019.
Annual bonusFollowing approval of the Company’s Remuneration Policy the annual bonus opportunity for 2018 is amended to 125% of salary, with up to 20% of the bonus earned being delivered in the form of shares that are deferred for two years. The increase in annual bonus opportunity reflects the significant increase in scale and complexity of the Company, both in the UK and internationally, over the last few years and the Company’s move into the FTSE 250 in June 2016.
Hill & Smith FTSE 250 FTSE SmallCap FTSE All Share
Jan 09 Jan 10 Jan 11 Jan 12 Jan 13 Jan 14 Jan 15 Jan 16 Jan 17 Jan 18
1200
1000
800
600
400
200
0
Tota
l Sha
reho
lder
Ret
urn
(reb
ased
to 1
00)

Governance Report
www.hsholdings.com | Stock Code HILS
71
Chief Executive › Maximum opportunity of 125% of base salary › 80% Paid in cash › 20% Delivered in shares vesting after two years
Finance Director › Maximum opportunity of 125% of base salary › 80% Paid in cash › 20% Delivered in shares vesting after two years
The Committee can disclose that for the 2018 financial year the annual bonus targets will be equally weighted towards:
› Growth in UEPS; › Budgeted profit; › Operating margins; and › Achievement of budgeted internal ROIC (at budgeted exchange rates).
The Remuneration Committee will determine an appropriate performance range for each measure used.
The Committee considers that the performance targets are commercially sensitive and so will not be disclosed prospectively. However the Committee will disclose performance against these measures and their targets retrospectively in future reports on a similar basis to the disclosures on page 65.
Share plansThe Remuneration Policy approved by members at the Company’s AGM in May 2017, permits the Committee to grant awards under the LTIP up to a maximum of 150% of base salary. However the Committee intends to make an award in 2018 in respect of the performance period 1 January 2018 – 31 December 2020, of 125% of base salary, subject to the following performance conditions:
Vesting amount Absolute UEPS growth over three years (50% of the award) TSR* (50% of the award)
0% Vesting Less than 15% Below median
25% Vesting 15%* Median**
Maximum vesting 30%* Upper quartile**
* Straight line vesting will apply between these two points.
** Relative to the FTSE 250 (excluding investment trusts and financial services companies).
After the end of the performance period, LTIP awards will be subject to an additional two year holding period before they are released to the Executive Directors.
BenefitsThe Company will continue to provide benefits of membership of the Company’s healthcare scheme, income protection scheme, personal accident insurance, car (or cash allowance), ill health and life assurance.
PensionsThe Company will continue to make a cash payment to D W Muir and M Pegler in lieu of pension contributions, equal to 25% of their base salary.
How the Remuneration Policy will be implemented for 2018 – Non-executive Directors
FeesThe fees of Non-executive Directors are reviewed regularly to ensure they are in line with the market and so the Company can attract and retain individuals of the highest calibre. Any change to these fees will be approved by the Board as a whole, following a recommendation from the Chief Executive. In December 2017, the Board approved a 3% increase in the base fees as from 1 January 2018 for all Non-executive Director fees and following a review which indicated that the Chairman’s fees was positioned below the market competitive range, given the Company’s position in the FTSE 250, the Board approved an increase in the Chairman’s fees to £165,000 in line with the lower end of the market range.
2018 2017
Chairman £165,000 £147,500
Non-executive Director £48,900 £47,500
Senior Independent Director £7,750 £7,500
Audit Committee Chairman £7,750 £7,500
Remuneration Committee Chairman £7,750 £7,500
Annette KelleherChairman, Remuneration Committee
7 March 2018

72 Governance Report
www.hsholdings.com | Stock Code HILS
Directors’ remuneration policy report
The Company’s Directors’ Remuneration Policy was approved at the 2017 AGM (with over 93% votes in favour of the policy) and took effect from the close of that meeting and is summarised below. It does not form part of the Annual Remumeration Report and will not be subject to a vote at the Company’s AGM on 17 May 2018.
Policy table for Directors
Purpose and link to strategy
Operation Maximum opportunity Performance metrics
Base salary To recruit and retain Executive Directors.Provides fixed remuneration for the Executive Directors, which reflects the individual’s experience and the size and scope of the Executive’s responsibilities.
Normally reviewed annually and fixed for twelve months. Salaries are determined by the Remuneration Committee taking into account a range of factors, which may include but are not limited to:
› the size and scope of the role; › individual and Group performance; › the range of salary increases (in percentage
terms) applied to the wider workforce; › total organisational salary budgets; and › pay levels for comparable roles in companies
of a similar size and complexity.Any salary increases may be implemented over such time as the Remuneration Committee deems appropriate.
Ordinarily salary increases will not exceed the range of salary increases awarded to other employees in the Group (in percentage of salary terms). However, salary increases may be above this level in certain circumstances as required, for example to reflect:
› increase in scope or responsibility; › performance in role; or › an Executive Director being moved
to market positioning over time.No maximum salary opportunity has been set out in this policy report to avoid setting expectations for Executive Directors.
Not applicable.
Benefits To recruit and retain Executive Directors.Ensures the overall package is competitive.Participation in the SAYE promotes staff alignment with the Group and a sense of ownership.
Executive Directors are entitled to various benefits, including but not limited to, membership of the Group’s healthcare scheme, personal accident insurance, ill health, life assurance and car (or equivalent cash allowance).Other benefits may be provided based on individual circumstances. Such benefits may include but are not limited to expatriate, housing, relocation allowances or overseas tax support.The SAYE is a HM Revenue & Customs approved monthly savings scheme facilitating the purchase of shares at a discount as permitted by the applicable legislation (currently up to a maximum discount of 20%). SAYE options may be exercised in the event of a change of control to the extent permitted by the rules of the scheme, which do not provide discretion for the Remuneration Committee in respect of the treatment on change of control.
Whilst the Remuneration Committee has not set an absolute maximum on the level of benefits Executive Directors receive, the value of benefits is set at a level which the Remuneration Committee considers is appropriately positioned against companies of a similar size and complexity in the relevant market and at rates competitive in the area of life, accident and health insurance.SAYE scheme contribution as permitted in accordance with the relevant tax legislation.
Not applicable.
Pension To recruit and retain Executive Directors.To provide post-retirement benefits and reward sustained, long-term contribution to the performance of the Group.
The Group may make payment either into a defined contribution plan or as a separate cash allowance.Group contributions or cash allowances are determined as a percentage of base salary and set at a level which the Remuneration Committee considers to be appropriately positioned against comparable roles in companies of a similar size and complexity.
Contribution rates (or cash allowance) are up to a maximum of 25% of base salary for current Executive Directors.For any newly appointed executive director, the maximum contribution rate (or cash allowance) would be up to a maximum 20% of base salary.The Company closed, with effect from October 2011, its defined benefits pension scheme to future accrual. D W Muir who is a deferred member will continue to receive benefits only in accordance with the terms of this scheme.
Not applicable.
Directors’ Remuneration Report (continued)

Governance Report
www.hsholdings.com | Stock Code HILS
73
Purpose and link to strategy
Operation Maximum opportunity Performance metrics
Annual bonus Rewards the achievement of annual financial targets and/or the delivery of strategic/ individual objectives.
Performance measures and targets are reviewed and set annually by the Remuneration Committee.Bonus pay out is determined by the Remuneration Committee after the year end, based on audited performance, where appropriate, against those targets.The Remuneration Committee has the discretion to amend the bonus pay out should any formulaic outputs not produce an appropriate result for either the Executive Directors or the Company, taking account of overall business performance. Where an annual bonus opportunity of more than 100% of base salary applies, up to 20% of the bonus earned will be delivered in the form of shares in the Company, deferred for a period of two years. Deferral of any bonus is subject to a de minimis limit of £5,000. At its discretion, the Remuneration Committee may award dividend equivalents to reflect dividends that would have been paid over the deferral period on shares subject to deferred bonuses. These dividend equivalents may be paid in cash or shares and may assume the reinvestment of dividends.Deferred bonus awards will vest in the event of a change of control. Malus and clawback provisions apply to the annual bonus as described below this table.
The maximum bonus opportunity is up to 125% of base salary.However, for 2017, the maximum opportunity will be 100% of base salary.
The bonus will be based on the achievement of targets related to key business objectives, with the performance measures and respective weightings each year dependent on the Group’s strategic priorities.Financial performance measures may include, for example:
› measures based on underlying earnings per share;
› budgeted profit; › operating margins; or › return on capital.
At least 50% of bonus will be based on financial measures. No more than 25% of the bonus opportunity will be based on individual objectives. The Remuneration Committee will determine an appropriate vesting schedule for each measure used. For financial measures, up to 60% of the maximum opportunity will be earned for target performance and 100% for maximum performance. There is usually straight line vesting between these performance points. For strategic and individual performance measures, bonus will be earned between 0% and 100% of the opportunity based on the Remuneration Committee’s assessment of the extent to which the relevant measure has been achieved.

74 Governance Report
www.hsholdings.com | Stock Code HILS
Directors’ Remuneration Report (continued)
Purpose and link to strategy
Operation Maximum opportunity Performance metrics
Long-Term Incentive Plan (‘LTIP’)
Incentivises Executive Directors to achieve higher returns for shareholders over a longer time frame.A clawback applies to unvested awards enabling the Company to mitigate risk.
LTIP awards are granted under the 2014 Long Term Incentive Plan approved by shareholders at the 2014 AGM. The Remuneration Committee may grant awards as conditional share awards, nil cost share options or forfeitable shares or such other form as has the same economic effect. Awards are typically granted annually and vesting is subject to achievement of performance measures normally over at least three years. Where an award is granted in excess of 100% of salary, vested shares are ordinarily subject to an additional two year holding period before they are released to the Executive Directors (so that they can exercise the award and acquire them). Unvested LTIP awards will vest and be released early on a change of control (or other relevant events), taking into account the extent to which the performance conditions have been satisfied and pro-rating to reflect the proportion of the performance period that has elapsed, although the Remuneration Committee has discretion not to apply time pro-rating. Vested LTIP awards which are subject to a holding period are released, to the extent vested, in the event of a change of control. LTIP awards may also vest and be released early in ‘good leaver’ circumstances.At its discretion the Remuneration Committee may award dividend equivalents to reflect dividends that would have been paid over the vesting period (and, if relevant, holding period) on shares that vest. These dividend equivalents may be paid in cash or shares and may assume the reinvestment of dividends.Malus and clawback provisions apply to the LTIP as described below this table. The Remuneration Committee may, at its discretion, structure awards as approved LTIP awards comprising both approved tax qualifying options granted under the Executive Share Option Scheme (‘ESOS’) and an LTIP award. Approved LTIP awards enable the participant and the Company to benefit from tax qualifying option treatment in respect of part of the award, without increasing the pre-tax value delivered to the participant. The approved LTIP awards consist of a tax qualifying option and an LTIP award with the vesting of the LTIP award scaled back to take account of any gain made on exercise of the tax qualifying option. Other than to enable the grant of £30,000 in value of HMRC approved options as part of an approved LTIP award, the Company will not grant awards to Executive Directors under the ESOS.
The annual LTIP maximum opportunity is 150% of base salary in respect of any financial year.However, for 2017, the maximum opportunity will be 125% of base salary. Shares subject to a tax qualifying option granted as part of an approved LTIP award are not taken into account for the purposes of this limit because, as referred to in the column under the heading ‘Operation’, the unapproved LTIP option is scaled back to reflect the gain made on the exercise of the option.
Awards vest subject to the achievement of performance measures assessed over the performance period (normally three financial years). The performance measures are reviewed annually to ensure they remain relevant and aligned to the Group’s strategy.Performance measures will be based on financial metrics, and/or share price growth related metrics, and/or strategic metrics. For 2017, the performance measures and weightings will be:
› 50% based on UEPS performance; and
› 50% based on relative total shareholder return (‘TSR’).
For achievement of the threshold level of performance (the minimum level of performance for vesting to occur) up to 25% of the maximum opportunity will vest for each element. For achievement of maximum performance (which is the highest level of performance that results in any vesting) 100% of the maximum opportunity will vest; there is usually straight line vesting between these performance points.Where an option under the ESOS is granted as part of an Approved LTIP award, the same performance condition applies to the ESOS option as applies to the LTIP award.

Governance Report
www.hsholdings.com | Stock Code HILS
75
Purpose and link to strategy
Operation Maximum opportunity Performance metrics
Shareholding guidelines
Promotes alignment to shareholders’ interests and share ownership.
Each Executive Director is required to hold shares acquired through the LTIP (after sales to cover tax) until the value of their total shareholding is equal to 200% of their annual base salary. Vested shares subject to awards under the LTIP which are subject to a holding period count towards the shareholding requirement on a net of assumed tax basis. Shares subject to LTIP awards and deferred bonus awards which are capable of exercise count towards the limit on a net of assumed tax basis.
Not applicable. Not applicable.
Chairman and Non-executive Director fees
Fees are set at a level that reflects market conditions and are sufficient to attract individuals with appropriate knowledge and experience.
Fees are reviewed periodically and are determined by the Board. The fee structure is as follows:
› the Chairman is paid a single consolidated fee;
› the Non-executive Directors are paid a basic fee plus additional fees for Chairmanship of a Committee;
› the Senior Independent Director also receives an additional fee in respect of this role; and
› fees may be paid wholly or partly in shares.The Non-executive Directors do not participate in any of the Group’s share incentive plans nor do they receive any pension contributions. Non-executive Directors may be eligible to benefits such as the use of secretarial support, travel costs or other benefits that may be appropriate.
Fees are subject to an overall cap as set out in the Company’s Articles of Association from time to time.Fees are based on the time commitment and responsibilities of the role.Fees are appropriately positioned against comparable roles in companies of a similar size and complexity in the relevant market.
Not applicable.
Recovery provisionsAnnual bonus and LTIP awards are subject to malus and clawback provisions as set out below.
For up to two years following the determination of an annual bonus, the Remuneration Committee may require a participant to repay any cash bonus paid and/or may reduce or cancel any deferred bonus award granted in the event of: (i) a material misstatement in the Group’s financial results; or (ii) the Remuneration Committee reasonably determining that the participant has been guilty of gross misconduct.
Before the vesting of an LTIP award, the Remuneration Committee may decide to reduce or cancel the award in the event of: (i) a material error in or misstatement of the Group’s results; (ii) information coming to light which, had it been known, would have affected the award or vesting decision; or (iii) reputational damage to the Group. For up to two years following the vesting of an LTIP award the Remuneration Committee may reduce or cancel the award (for example if it remains unexercised and subject to a holding period) or require a repayment in respect of shares acquired in the event of: (i) a material misstatement in the Group’s financial results for any year in the performance period for the relevant award; or (ii) the Remuneration Committee reasonably determining that the participant has been guilty of gross misconduct.
Explanation of chosen performance measures and how targets are setPerformance measures have been selected that reflect the Group’s strategy. Stretching performance targets are set each year for the annual bonus and LTIP awards. In setting these stretching performance targets the Remuneration Committee will take into account a number of different reference points such as the Group’s business plans and strategy.
The Remuneration Committee considers that underlying EPS and profit before tax are closely aligned to the Group’s key performance metrics and, in conjunction with the other annual bonus performance metrics, provide a balanced measurement of performance that encourages sustainable growth.
The UEPS and TSR performance conditions attaching to the LTIP align management’s objectives to those of shareholders and reward the delivery of year on year growth and delivery of value to shareholders. For the relative TSR performance condition there will be no vesting for performance below median compared to the comparator group.
The Remuneration Committee retains the discretion to adjust the performance targets and measures where it considers it appropriate to do so. For example, to reflect changes in the strategy or structure of the business or in prevailing market conditions and to assess performance on a fair and consistent basis from year to year.
Operation of share plansThe Remuneration Committee retains discretion to operate the Company’s share plans in accordance with their rules, including the ability to adjust awards in the event of a variation of capital or other relevant corporate event, and settle awards in cash.
76 Governance Report
www.hsholdings.com | Stock Code HILS
Directors’ Remuneration Report (continued)
Differences in the Group’s policy for the remuneration of employees generally The Group aims to provide a remuneration package that is market competitive in the employee’s jurisdiction of employment and which:
› is appropriate to attract, retain, motivate and reward, without paying more than necessary;
› is fairly and consistently applied; and
› includes an element of incentive to share in the financial success of the Group through: annual bonuses, based upon the performance of individual business units, executive share options and a UK SAYE scheme, all of which are aligned to the strategic objectives and performance of the Group.

Governance Report
www.hsholdings.com | Stock Code HILS
77
Directors’ Report (other statutory information)
Principal activities and strategic reportThe Company acts as a holding company to all the Group’s subsidiaries.
During 2017 the principal activities of the Group comprised the manufacture and supply of:
› Infrastructure Products
- Roads; and
- Utilities
› Galvanizing Services
Pages 1 to 39 contain further details of these areas of the business and the principal subsidiaries operating within them are set out on pages 150 to 152.
The Chairman’s Statement and the Directors’ Strategic Report include:
› An analysis of the development and performance of the Company’s business during the financial year; › Key performance indicators used to measure the Group’s performance; › The position of the Company’s business at the end of the financial year; › A description of the principal risks and uncertainties faced by the Group; and › Main trends and factors likely to affect the future development, performance and position of the Company’s business.
Future developmentAn indication of likely future developments in the Group is given in the Strategic Report on pages 1 to 40.
Statement on corporate governanceThe Directors’ Report for the year ended 31 December 2017 comprises sections of the Annual Report referred to under ‘Strategic Report’, and ‘Governance Report’, which are incorporated into the Directors’ Report by reference.
ResultsThe Group profit before taxation for the year amounted to £70.2m (2016: £48.3m). Group revenue at £585.1m was 8% higher than the prior year. Operating profit at £74.1m was 43% higher than for the previous year (2016: £51.8m).
Share capital summaryExchange trade The Company’s ordinary shares are listed on the Main Market of the London Stock Exchange
Class Single class of ordinary shares of 25p each
Issued share capital 1 January 2016 78,542,591
Total new ordinary shares issued during the year 154,512
Issued share capital 31 December 2016 78,697,103
Rights and obligations All issued shares rank equally. Rights and obligations attaching to the Company’s shares are set out in the Company’s Articles of Association
Further details can be found in note 21 on pages 122 and 123 of the Group Financial Statements.
Details of the results for the year are shown on the Consolidated Income Statement on page 87 and the business segment information is given on pages 98 and 99.
DividendsThe Directors recommend the payment of a final dividend of 20.6p per ordinary share (2016: 17.9p per ordinary share) which, together with the interim dividend of 9.4p per ordinary share (2016: 8.5p per ordinary share) paid on 5 January 2018, makes a total distribution for the year of 30.0p per ordinary share (2016: 26.4p per ordinary share). Subject to shareholders approving this recommendation at the AGM, the final dividend will be paid on 2 July 2018 to shareholders on the register at the close of business on 25 May 2018. The latest date for receipt of Dividend Re-investment Plan elections is 11 June 2018.
Share capitalThere are no restrictions on the transfer of shares in the Company provided they are fully paid up and the Company does not hold any lien over them and as the shares rank equally none of them carry any special rights with regards to control of the Company. Such equal rights apply to shares acquired through any of the Company’s employee share schemes and those shares so acquired carry no lesser or greater rights than shares acquired in the Company in any other way. Accordingly there are no restrictions on voting rights attaching to any shares, whether relating to the level of shareholding or otherwise.
The Company is not aware of any arrangements between shareholders of the Company that may result in restrictions on the transfer of ordinary shares or voting rights.
In relation to the purchase by the Company of its own shares the rules relating thereto are set out in the Company’s Articles of Association which state that the Directors’ powers to authorise such purchase by the Company are subject to the provisions of the relevant statutes and also the UK Listing Authority requirements, as the Company’s shares are listed on the London Stock Exchange. No shares were held in treasury.

78 Governance Report
www.hsholdings.com | Stock Code HILS
Directors’ Report (other statutory information) (continued)
Articles of AssociationThe rules relating to amendment of the Company’s Articles of Association are that any change must be authorised by a special resolution of the Company in a general meeting.
Accordingly the following resolutions are to be put to the members of the Company at the Company’s AGM each year:
› The authority for making market purchases of shares greater than 5% of the Company’s then issued share capital is limited by the resolution of the 2017 AGM and will be limited by the resolution to be put to the 2018 AGM. The prices to be paid for such purchases must be a minimum price of 25 pence per ordinary share (the nominal value) and a maximum price of 5% above the average of the middle market quotations for ordinary shares derived from the London Stock Exchange Daily Official List for the five business days immediately preceding the day on which any such purchase takes place.
› The Companies (Shareholders’ Rights) Regulations 2009 provide that a company can reduce the notice period for calling meetings to the shorter period of 14 clear days on two conditions: firstly that the company offers a facility for shareholders to vote by electronic means and secondly that there is an annual resolution of shareholders approving such reduction in the required minimum notice period. Approval to the calling of general meetings other than AGM’s on 14 clear days’ notice was approved at the AGM on 11 May 2017 to assist the Company in conducting its business and subject to any necessary matters being put to shareholders promptly. This approval remains effective until the earlier of the Company’s next following AGM or 11 August 2018.
Substantial shareholdingsAs at 21 February 2018, the Company had been notified in accordance with Rule 5 of the Disclosure and Transparency Rules of the Financial Conduct Authority of the following voting rights of the Company:
Shareholder Number of ordinary shares % of issued share capital
Aberdeen Standard Investments (Standard Life) 4,561,670 5.80
Hargreave Hale 3,284,198 4.17
Charles Stanley 2,942,072 3.74
BlackRock Investment Management 2,778,048 3.53
DirectorsThe names of the Directors of the Company who served throughout the year, including brief biographies, are set out on pages 44 and 45.
Directors’ interestsThe interests of the Directors in the share capital of Hill & Smith Holdings PLC as at 31 December 2017 are set out on page 68.
Appointment and replacement of DirectorsThe appointment and replacement of Directors of the Company is governed by its Articles of Association, the UK Corporate Governance Code, the Companies Acts and related legislation. Directors can be appointed by ordinary resolution at a general meeting or by the Board. If a Director is appointed by the Board, such Director will hold office until the next AGM and shall then be eligible for election at that meeting.
ConflictsUnder the Companies Act 2006 and the provisions of the Company’s Articles of Association, the Board is required to consider potential conflicts of interest. The Company has established formal procedures for the disclosure and review of any conflicts, or potential conflicts, of interest which the Directors may have and for the authorisation of such conflict matters by the Board. To this end the Board considers and, if appropriate, authorises any conflicts, or potential conflicts, of interest as they arise and reviews any such authorisation annually. New Directors are required to declare any conflicts, or potential conflicts, of interest to the Board at the first Board meeting after his or her appointment. The Board believes that the procedures established to deal with conflicts of interests are operating effectively.
Directors’ and officers’ liabilityThe Company maintains an appropriate level of Directors’ and Officers’ insurance whereby Directors are indemnified against liabilities to third parties to the extent permitted by the Companies Act 2006.
Financial instrumentsThe financial risk management objectives and policies are detailed in note 20 on pages 117 to 121.
Research and developmentDuring the year, the Group spent a total of £1.6m (2016: £2.0m) on research and development.
Political and charitable donationsCharitable donations amounting to £34,000 (2016: £42,000) were made in the year principally to local charities serving the communities in which the Group operates. There were no political contributions.
Employment policiesDetails of the Group’s employment policies are available on the Company’s website.

Governance Report
www.hsholdings.com | Stock Code HILS
79
Change of control/significant agreementsThere are no agreements between the Group and its Directors or employees providing for compensation for loss of office or employment that occurs because of a change of control, other than revised notice periods and termination payments for D W Muir and M Pegler set out in the Directors’ Remuneration Report on page 70.
The Group has a multi-currency revolving credit facility which includes a change of control provision. Under this provision, a change in ownership/control of the Company could result in withdrawal of these facilities.
All of the Company’s share schemes contain provisions relating to a change in control. Outstanding options and awards normally vest and become exercisable on a change of control subject to the satisfaction of any performance conditions at that time.
The Directors consider that there are no contractual or other arrangements, such as those with major suppliers, which are likely to materially influence, directly or indirectly, the performance of the business and its values. Furthermore, there are no contracts of significance subsisting during the financial year between any Group undertaking and a controlling shareholder or in which a Director is or was materially interested.
Disclosure of information to auditorThe Directors who held office at the date of approval of this Directors’ Report confirm that, so far as they are each aware: there is no relevant audit information of which the Company’s auditor is unaware; each Director has taken all the steps that he ought to have taken as a Director to make themselves aware of any relevant audit information and has established that the Company’s auditor is aware of that information.
Events since 31 December 2017There were no significant post-Balance Sheet events.
Annual General MeetingThe Annual General Meeting of the Company will be held at 11.00 a.m. on Thursday 17 May 2018 at The Village Hotel, The Green Business Park, Shirley, Solihull, B90 4GW. Notice is sent to shareholders separately with this Report, together with an explanation of the special business to be considered at the meeting and is also available on the Company’s website at www.hsholdings.com.
Other important dates can be found in the Financial Calendar on page 148.
By order of the Board
Alex Henderson Company Secretary
7 March 2018
80 Governance Report
www.hsholdings.com | Stock Code HILS
Statement of Directors’ ResponsibilitiesIn respect of the Annual Report and the Financial Statements
The directors are responsible for preparing the Annual Report and the Group and parent Company financial statements in accordance with applicable law and regulations.
Company law requires the directors to prepare Group and parent Company financial statements for each financial year. Under that law they are required to prepare the Group financial statements in accordance with International Financial Reporting Standards as adopted by the European Union (IFRSs as adopted by the EU) and applicable law and have elected to prepare the parent Company financial statements in accordance with UK accounting standards, including FRS 101 Reduced Disclosure Framework.
Under company law the directors must not approve the financial statements unless they are satisfied that they give a true and fair view of the state of affairs of the Group and parent Company and of their profit or loss for that period. In preparing each of the Group and parent Company financial statements, the directors are required to:
› select suitable accounting policies and then apply them consistently;
› make judgements and estimates that are reasonable, relevant, reliable and prudent;
› for the Group financial statements, state whether they have been prepared in accordance with IFRSs as adopted by the EU;
› for the Parent Company financial statements, state whether applicable UK Accounting Standards have been followed, subject to any material departures disclosed and explained in the Parent Company financial statements;
› assess the Group and parent Company’s ability to continue as a going concern, disclosing, as applicable, matters related to going concern; and
› use the going concern basis of accounting unless they either intend to liquidate the Group or the parent Company or to cease operations, or have no realistic alternative but to do so.
The directors are responsible for keeping adequate accounting records that are sufficient to show and explain the parent Company’s transactions and disclose with reasonable accuracy at any time the financial position of the parent Company and enable them to ensure that its financial statements comply with the Companies Act 2006. They are responsible for such internal control as they determine is necessary to enable the preparation of financial statements that are free from material misstatement, whether due to fraud or error, and have general responsibility for taking such steps as are reasonably open to them to safeguard the assets of the Group and to prevent and detect fraud and other irregularities.
Under applicable law and regulations, the directors are also responsible for preparing a Strategic Report, Directors’ Report, Directors’ Remuneration Report and Corporate Governance Statement that complies with that law and those regulations.
The directors are responsible for the maintenance and integrity of the corporate and financial information included on the company’s website. Legislation in the UK governing the preparation and dissemination of financial statements may differ from legislation in other jurisdictions.
Responsibility statement of the Directors in respect of the Annual Financial Report
We confirm that to the best of our knowledge:
› the financial statements, prepared in accordance with the applicable set of accounting standards, give a true and fair view of the assets, liabilities, financial position and profit or loss of the company and the undertakings included in the consolidation taken as a whole; and
› the strategic report includes a fair review of the development and performance of the business and the position of the issuer and the undertakings included in the consolidation taken as a whole, together with a description of the principal risks and uncertainties that they face.
We consider the annual report and accounts, taken as a whole, is fair, balanced and understandable and provides the information necessary for shareholders to assess the group’s position and performance, business model and strategy.
By order of the Board
Alex Henderson Company Secretary
7 March 2018
Financial Statements
See further information at hsholdings.com
8181818181
Financial Statements
82 Independent Auditor’s Report87 Group Financial Statements134 Company Financial Statements146 Five Year Summary
Galvanized stand at Maidstone FC, galvanized at the Chesterfield plant of Joseph Ash Ltd.

82 Financial Statements
www.hsholdings.com | Stock Code HILS
Independent Auditor’s ReportTo the members of Hill & Smith Holdings PLC
1. Our opinion is unmodifiedWe have audited the financial statements of Hill & Smith Holdings PLC (“the Company”) for the year ended 31 December 2017 which comprise the Consolidated Income Statement, Consolidated Statement of Comprehensive Income, Consolidated Statement of Financial Position, Consolidated Statement of Changes in Equity, Consolidated Statement of Cash Flows, Company Balance Sheet, Company Statement of Changes in Equity, Company Statement of Cash Flows, and the related notes, including the accounting policies on page 87 to 145.
In our opinion:
› the financial statements give a true and fair view of the state of the Group’s and of the parent Company’s affairs as at 31 December 2017 and of the Group’s profit for the year then ended;
› the Group financial statements have been properly prepared in accordance with International Financial Reporting Standards as adopted by the European Union;
› the parent Company financial statements have been properly prepared in accordance with UK accounting standards, including FRS 101 Reduced Disclosure Framework; and
› the financial statements have been prepared in accordance with the requirements of the Companies Act 2006 and, as regards the Group financial statements, Article 4 of the IAS Regulation.
Basis for opinion
We conducted our audit in accordance with International Standards on Auditing (UK) (“ISAs (UK)”) and applicable law. Our responsibilities are described below. We believe that the audit evidence we have obtained is a sufficient and appropriate basis for our opinion. Our audit opinion is consistent with our report to the audit committee.
We were appointed as auditor by the shareholders on 19 March 1999. The period of total uninterrupted engagement is for the 19 financial years ended 31 December 2017. We have fulfilled our ethical responsibilities under, and we remain independent of the Group in accordance with, UK ethical requirements including the FRC Ethical Standard as applied to listed public interest entities. No non-audit services prohibited by that standard were provided.
OverviewMateriality: Group financial statements as a whole
£3.25m (2016:£2.9m)
4.4% (2016: 4.5%) of Total profits and losses that made up normalised Group profit before tax
Coverage 95% (2016: 89%) of Total profits and losses that made up normalised Group profit before tax
Risks of material misstatement vs 2016Recurring risks Valuation of goodwill in relation to
France Galva S.A.Provisions for uncertain income tax positionsUK post retirement benefits obligation
2. Key audit matters: our assessment of risks of material misstatement
Key audit matters are those matters that, in our professional judgment, were of most significance in the audit of the financial statements and include the most significant assessed risks of material misstatement (whether or not due to fraud) identified by us, including those which had the greatest effect on: the overall audit strategy; the allocation of resources in the audit; and directing the efforts of the engagement team. We summarise below the key audit matters, in decreasing order of audit significance, in arriving at our audit opinion above, together with our key audit procedures to address those matters and, as required for public interest entities, our results from those procedures. These matters were addressed, and our results are based on procedures undertaken, in the context of, and solely for the purpose of, our audit of the financial statements as a whole, and in forming our opinion thereon, and consequently are incidental to that opinion, and we do not provide a separate opinion on these matters.
Valuation of goodwill in relation to France Galva S.A. (£29.7 million; 2016: £28.8 million)Refer to page 58 (Audit Committee Report), page 93 and 95 (accounting policy) and pages 105 to 112 (financial disclosures).
The riskForecast based valuation
Market conditions in France have been challenging and as a result there is limited headroom when testing France Galva S.A. for impairment. As explained in note 10, there are inherent uncertainties involved in forecasting and discounting future cash flows and relatively small changes in these assumptions could give rise to material changes in the assessment of the carrying value of goodwill.
Our responseOur procedures included:
› Sector knowledge: Assessed, through inquiry with management, review of interim financial information whether any trigger events have arisen which would indicate a possible impairment based on our knowledge of current market conditions;
› Benchmarking assumptions: Comparing the group’s assumptions to externally derived data in relation to key inputs such as projected growth and discount rates;
› Our sector experience: Evaluated the appropriateness and year on year consistency of underlying assumptions in determining the cash flows including considering the appropriateness of the growth assumption applied, comparison of forecast cash flows to those achieved during the financial year ended 31 December 2017 and challenging management if such future cash flows do not reflect known or probable changes in the business environment. Challenged, assisted by our own valuation specialists, the key inputs used in the calculation of the discount rate by comparing it against external data sources and comparator group data;
› Sensitivity analysis: Performed our own sensitivity analysis on the assumptions noted above;
› Assessing transparency: Assessed whether the Group’s disclosures about the sensitivity of the outcome of the impairment assessment to changes in key assumptions reflected the risks inherent in the valuation of goodwill in relation to France Galva S.A..
Financial Statements
www.hsholdings.com | Stock Code HILS
83
Our resultsWe found the resulting estimate of the recoverable amount of goodwill in relation to France Galva S.A. to be acceptable.
We continue to perform procedures over the valuation of goodwill and other indefinite life intangible assets (excluding France Galva S.A.). However, due to the impairment headroom on these assets, we have not assessed this as one of the most significant risks in our current year audit and, therefore, it is not separately identified in our report this year.
Provisions for uncertain income tax positions(£7.8 million; 2016: £6.9 million)Refer to page 58 (Audit Committee Report), page 97 (accounting policy) and pages 103 and 131 (financial disclosures).
The riskSubjective estimate
The Group’s international operations result in transactions that impact multiple tax jurisdictions. This activity has led to the existence of a number of uncertain tax positions for which the Group makes a provision based on its best estimate of the amount of tax payable. The provisions for these estimates often require judgement as to the interpretation of specific tax law. In addition there is a risk of an error in estimating the provision.
Our responseOur procedures included:
› Our tax expertise: With the assistance of our own tax specialist, we:
– Assessed the Group’s tax positions, its correspondence with the relevant tax authorities, and analysed and challenged the assumptions used to determine tax provisions based on our knowledge and experiences of the application of the international and local legislation by the relevant authorities and courts;
– Assessed the tax implications of the intragroup refinancing exercise undertaken in the year;
– Inspected Board minutes for reference to tax matters;
– Challenged as to why the provisions for uncertain income tax positions represent management’s best estimate;
› Assessing transparency: Assessed that the tax accounting and disclosures complied with the requirements of IAS 12 ‘Income Taxes’.
Our resultsWe found the level of provisions for uncertain income tax positions to be acceptable.
UK post retirement benefits obligation(£81.9 million; 2016: £90.9 million)Refer to page 58 (Audit Committee Report), page 96 (accounting policy) and pages 124 to 130 (financial disclosures).
The riskSubjective valuation
The valuation of the UK post retirement benefits obligation involves the selection of appropriate actuarial assumptions, most notably the discount rate applied to the scheme liabilities, inflation rates and mortality rates. The selection of these assumptions is inherently subjective and small changes in the assumptions and estimates used to value the Group’s pension obligation could have a significant effect on the financial position of the Group.
Our responseOur procedures included:
› Benchmarking assumptions: Challenging, with the support of our own actuarial specialists, the key assumptions applied, being the discount rate, inflation rate and mortality/life expectancy against externally derived data;
› Assessing transparency: Considered the adequacy of the Group’s disclosures in respect of the sensitivity of the deficit to these assumptions.
Our resultsWe found the valuation of the UK post retirement benefits obligation to be acceptable.
Recoverability of parent company investments in subsidiaries (£324.9 million; 2016: £330.9 million)Refer to page 137 (accounting policy) and page 140 (financial disclosures).
The riskLow risk/ high value (Parent Company key audit matter)
Investment in subsidiaries represents 81% of the Company’s total assets. Their recoverability is not at a high risk of significant misstatement or subject to significant judgement. However, due to their materiality in the context of the parent Company financial statements, this is considered to be the area that had the greatest effect on our overall parent Company audit.
Our responseOur procedures included:
› Tests of detail: We compared the net asset value and forecast income of the subsidiaries to the investment in subsidiary undertakings and assessed whether there is sufficient headroom for each of the investments;
› Assessing subsidiary audits: Assessing the work performed on the subsidiary audits for a sample of subsidiaries and considering the results of that work, on those subsidiaries’ profits and net assets.
Our resultsWe found the resulting estimate of the recoverable amount of investment in subsidiaries to be acceptable.
3. Our application of materiality and an overview of the scope of our audit
Materiality for the Group financial statements as a whole was set at £3.25m, determined with reference to a benchmark of total profits and losses that made up Group profit before tax, normalised to exclude net costs in respect of business reorganisations, acquisition costs, profit on disposals of businesses, impairment of assets held for sale, an impairment charge of goodwill, settlement of certain defined benefit pension obligations and acquired intangible assets as disclosed in note 3. Total profits and losses that made up normalised Group profit before tax is calculated as £73.4m (2016: £64.5m), of which materiality represents 4.4% (2016: 4.5%).
Materiality for the parent Company financial statements as a whole was set at £2.4m (2016: £2.2m), determined with reference to a benchmark of Company total assets, of which it represents 0.6% (2016: 0.5%).
We agreed to report to the Audit Committee any corrected or uncorrected identified misstatements exceeding £162,500, in addition to other identified misstatements that warranted reporting on qualitative grounds.

84 Financial Statements
www.hsholdings.com | Stock Code HILS
Of the Group’s 57 (2016: 57) reporting components, we subjected 27 (2016: 38) to full scope audits for Group purposes.
The components within the scope of our work accounted for the percentages illustrated opposite.
The remaining 4% of total Group revenue, 5% of total profits and losses that made up Group profit before tax, 6% of total Group assets and 5% of total profits and losses that made up normalised Group profit before tax is represented by 30 reporting components, none of which individually represented more than 2% of any of total Group revenue, total profits and losses that made up Group profit before tax, total Group assets or total profits and losses that made up normalised Group before tax. For these residual components, we performed analysis at an aggregated Group level to re-examine our assessment that there were no significant risks of material misstatement within these.
The Group team instructed component auditors as to the significant areas to be covered, including the relevant risks detailed above and the information to be reported back. The Group team approved the component materialities, which ranged from £0.1m to £2.4m, having regard to the mix of size and risk profile of the Group across the components. The work on 5 of the 27 components (2016: 5 of the 57 components) was performed by component auditors and the rest, including the audit of the parent Company, was performed by the Group team. The Group team performed procedures on the items excluded from normalised Group profit before tax.
The Group team visited 1 (2016: 1) component in the United States of America, the component in France (2016: no visit) to confirm appropriate execution of the audit plan & strategy and inspect their findings. Telephone conference meetings were also held with these component auditors and all other components that were not physically visited. At these visits and meetings, the findings reported to the Group team were discussed in more detail, and any further work required by the Group team was then performed by the component auditor.
Total profits and losses that made up normalised Group profit before tax £73.4m (2016: £64.5m)
Group Materiality £3.25m (2016: £2.9m)
Total profits and losses that made up normalised Group before tax Group Materiality
£3.25mWhole financial statements materiality (2016: £2.9m)
£162,500Misstatements reported to the audit committee (2016: £145,000)
£2.4mRange of materiality at 56 components (£0.1m to £2.4m) (2016: £0.1m to £2.2m)
85
8
Group revenue
Group total assets
Total profits and losses that made up Group profit before tax
Total profits and losses that made up normalised Group profit before tax
96%(2016 85%)
94%(2016 89%)
95%(2016 90%)
95%(2016 89%)
Full scope for Group audit purposes 2017Full scope for Group audit purposes 2016Specified risk-focused audit procedures 2016Residual components
90
1
96
89
1
89
1
Independent Auditor’s Report (continued)
96
96 94
Financial Statements
www.hsholdings.com | Stock Code HILS
85
4. We have nothing to report on going concern We are required to report to you if:
› we have anything material to add or draw attention to in relation to the directors’ statement in the Group accounting policies to the financial statements on the use of the going concern basis of accounting with no material uncertainties that may cast significant doubt over the Group and Company’s use of that basis for a period of at least twelve months from the date of approval of the financial statements; or
› if the related statement under the Listing Rules set out on page 80 is materially inconsistent with our audit knowledge.
We have nothing to report in these respects.
5. We have nothing to report on the other information in the Annual Report
The directors are responsible for the other information presented in the Annual Report together with the financial statements. Our opinion on the financial statements does not cover the other information and, accordingly, we do not express an audit opinion or, except as explicitly stated below, any form of assurance conclusion thereon.
Our responsibility is to read the other information and, in doing so, consider whether, based on our financial statements audit work, the information therein is materially misstated or inconsistent with the financial statements or our audit knowledge. Based solely on that work we have not identified material misstatements in the other information.
Strategic report and directors’ report Based solely on our work on the other information:
› we have not identified material misstatements in the strategic report and the directors’ report;
› in our opinion the information given in those reports for the financial year is consistent with the financial statements; and
› in our opinion those reports have been prepared in accordance with the Companies Act 2006.
Directors’ remuneration report In our opinion the part of the Directors’ Remuneration Report to be audited has been properly prepared in accordance with the Companies Act 2006.
Disclosures of principal risks and longer-term viability Based on the knowledge we acquired during our financial statements audit, we have nothing material to add or draw attention to in relation to:
› the directors’ confirmation within the viability statement on page 52 that they have carried out a robust assessment of the principal risks facing the Group, including those that would threaten its business model, future performance, solvency and liquidity;
› the Principal Risks disclosures describing these risks and explaining how they are being managed and mitigated; and
› the directors’ explanation in the viability statement of how they have assessed the prospects of the Group, over what period they have done so and why they considered that period to be appropriate, and their statement as to whether they have a reasonable expectation that the Group will be able to continue in operation and meet its liabilities as they fall due over the period of their assessment, including any related disclosures drawing attention to any necessary qualifications or assumptions.
Under the Listing Rules we are required to review the viability statement. We have nothing to report in this respect.
Corporate governance disclosures We are required to report to you if:
› we have identified material inconsistencies between the knowledge we acquired during our financial statements audit and the directors’ statement that they consider that the annual report and financial statements taken as a whole is fair, balanced and understandable and provides the information necessary for shareholders to assess the Group’s position and performance, business model and strategy; or
› the section of the annual report describing the work of the Audit Committee does not appropriately address matters communicated by us to the Audit Committee.
We are required to report to you if the Corporate Governance Statement does not properly disclose a departure from the eleven provisions of the UK Corporate Governance Code specified by the Listing Rules for our review.
We have nothing to report in these respects.
6. We have nothing to report on the other matters on which we are required to report by exception
Under the Companies Act 2006, we are required to report to you if, in our opinion:
› adequate accounting records have not been kept by the parent Company, or returns adequate for our audit have not been received from branches not visited by us; or
› the parent Company financial statements and the part of the Directors’ Remuneration Report to be audited are not in agreement with the accounting records and returns; or
› certain disclosures of directors’ remuneration specified by law are not made; or
› we have not received all the information and explanations we require for our audit.
We have nothing to report in these respects.
7. Respective responsibilities Directors’ responsibilities As explained more fully in their statement set out on page 80, the directors are responsible for: the preparation of the financial statements including being satisfied that they give a true and fair view; such internal control as they determine is necessary to enable the preparation of financial statements that are free from material misstatement, whether due to fraud or error; assessing the Group and parent Company’s ability to continue as a going concern, disclosing, as applicable, matters related to going concern; and using the going concern basis of accounting unless they either intend to liquidate the Group or the parent Company or to cease operations, or have no realistic alternative but to do so.
Auditor’s responsibilities Our objectives are to obtain reasonable assurance about whether the financial statements as a whole are free from material misstatement, whether due to fraud or other irregularities (see below), or error, and to issue our opinion in an auditor’s report. Reasonable assurance is a high level of assurance, but does not guarantee that an audit conducted in accordance with ISAs (UK) will always detect a material misstatement when it exists. Misstatements can arise from fraud, other irregularities or error and are considered material if, individually or in aggregate, they could reasonably be expected to influence the economic decisions of users taken on the basis of the financial

86 Financial Statements
www.hsholdings.com | Stock Code HILS
statements.
A fuller description of our responsibilities is provided on the FRC’s website at www.frc.org.uk/auditorsresponsibilities.
Irregularities – ability to detectWe identified areas of laws and regulations that could reasonably be expected to have a material effect on the financial statements from our sector experience, through discussion with the directors and other management (as required by auditing standards).
We had regard to laws and regulations in areas that directly affect the financial statements including financial reporting (including related company legislation) and taxation legislation. We considered the extent of compliance with those laws and regulations as part of our procedures on the related annual accounts items.
As with any audit, there remained a higher risk of non-detection of non-compliance with relevant laws and regulations (irregularities), as these may involve collusion, forgery, intentional omissions, misrepresentations, or the override of internal controls.
8. The purpose of our audit work and to whom we owe our responsibilities
This report is made solely to the Company’s members, as a body, in accordance with Chapter 3 of Part 16 of the Companies Act 2006. Our audit work has been undertaken so that we might state to the Company’s members those matters we are required to state to them in an auditor’s report and for no other purpose. To the fullest extent permitted by law, we do not accept or assume responsibility to anyone other than the Company and the Company’s members, as a body, for our audit work, for this report, or for the opinions we have formed.
Darren Turner (Senior Statutory Auditor) for and on behalf of KPMG LLP, Statutory Auditor
Chartered Accountants One Snowhill Snow Hill Queensway Birmingham B4 6GH
7 March 2018
Independent Auditor’s Report (continued)

Financial Statements
www.hsholdings.com | Stock Code HILS
87
Consolidated Income StatementYear ended 31 December 2017
2017 2016
NotesUnderlying
£m
Non- underlying*
£mTotal
£mUnderlying
£m
Non-underlying*
£mTotal
£m
Revenue 1, 2 585.1 - 585.1 540.1 - 540.1
Trading profit 81.3 - 81.3 70.6 - 70.6
Amortisation of acquisition intangibles 3 - (4.0) (4.0) - (2.6) (2.6)
Business reorganisation costs 3 - (2.8) (2.8) - (10.5) (10.5)
Pension settlement gains 3 - - - - 0.2 0.2
Impairment of assets 3, 12 - (0.4) (0.4) - (4.1) (4.1)
Acquisition costs 3 - (0.6) (0.6) - (1.8) (1.8)
Profit on disposal of subsidiary 3 - 0.6 0.6 - - -
Operating profit 1, 2 81.3 (7.2) 74.1 70.6 (18.8) 51.8
Financial income 5 0.6 - 0.6 0.4 - 0.4
Financial expense 5 (3.4) (1.1) (4.5) (3.0) (0.9) (3.9)
Profit before taxation 78.5 (8.3) 70.2 68.0 (19.7) 48.3
Taxation 7 (18.9) 2.6 (16.3) (16.3) 1.8 (14.5)
Profit for the year attributable to owners of the parent 59.6 (5.7) 53.9 51.7 (17.9) 33.8
Basic earnings per share 8 75.9p 68.6p 65.9p 43.0p
Diluted earnings per share 8 74.8p 67.7p 65.1p 42.5p
Dividend per share – Interim 9 9.4p 8.5p
Dividend per share – Final proposed 9 20.6p 17.9p
Total 30.0p 26.4p
* The Group’s definition of non-underlying items is included in the Group Accounting Policies on page 100.

88 Financial Statements
www.hsholdings.com | Stock Code HILS
Consolidated Statement of Comprehensive Income
Notes2017
£m2016
£m
Profit for the year 53.9 33.8
Items that may be reclassified subsequently to profit or lossExchange differences on translation of overseas operations (11.3) 36.5
Exchange differences on foreign currency borrowings denominated as net investment hedges 4.9 (9.5)
Transfers to the income statement on cash flow hedges - 0.2
Taxation on items that may be reclassified to profit or loss - -
Items that will not be reclassified subsequently to profit or lossActuarial loss on defined benefit pension schemes 23 - (14.1)
Taxation on items that will not be reclassified to profit or loss 7 (0.2) 2.1
Other comprehensive (expense)/income for the year (6.6) 15.2
Total comprehensive income for the year attributable to owners of the parent 47.3 49.0
Year ended 31 December 2017

Financial Statements
www.hsholdings.com | Stock Code HILS
89
Approved by the Board of Directors on 7 March 2018 and signed on its behalf by:
D W Muir M Pegler Director Director Company Number: 671474
Notes2017
£m2016
£m
Non-current assetsIntangible assets 10 163.9 166.5
Property, plant and equipment 11 145.1 149.7
309.0 316.2
Current assetsAssets held for sale 12 0.7 1.1
Inventories 14 84.6 71.6
Trade and other receivables 15 116.5 112.9
Cash and cash equivalents 16 16.4 15.6
218.2 201.2
Total assets 1 527.2 517.4
Current liabilitiesTrade and other liabilities 17 (104.8) (105.1)
Current tax liabilities (11.7) (11.2)
Provisions for liabilities and charges 19 (2.1) (2.6)
Interest bearing borrowings 17 (0.3) (0.3)
(118.9) (119.2)
Net current assets 99.3 82.0
Non-current liabilitiesOther liabilities 18 (0.5) (0.4)
Provisions for liabilities and charges 19 (2.9) (3.2)
Deferred tax liability 13 (5.6) (7.8)
Retirement benefit obligation 23 (25.6) (27.3)
Interest bearing borrowings 18 (115.1) (127.3)
(149.7) (166.0)
Total liabilities (268.6) (285.2)
Net assets 258.6 232.2
EquityShare capital 21 19.7 19.7
Share premium 34.1 33.5
Other reserves 4.9 4.8
Translation reserve 22.9 29.3
Retained earnings 177.0 144.9
Total equity 258.6 232.2
Consolidated Statement of Financial PositionYear ended 31 December 2017
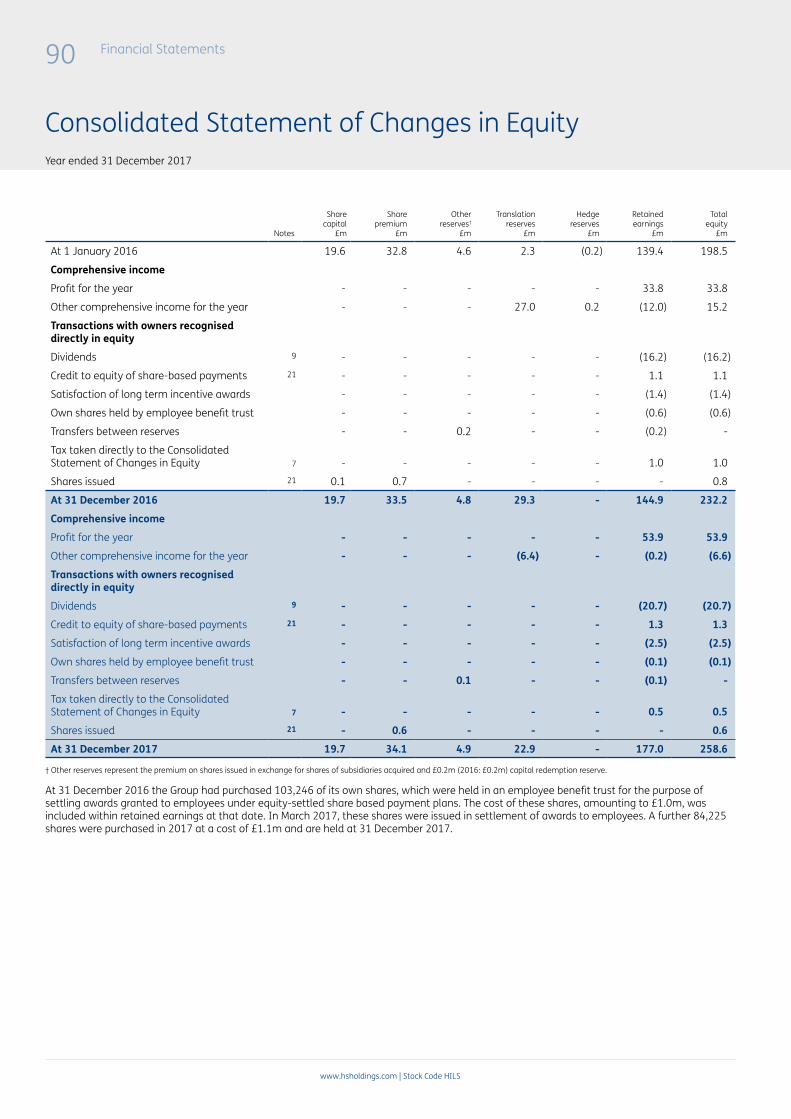
90 Financial Statements
www.hsholdings.com | Stock Code HILS
Consolidated Statement of Changes in EquityYear ended 31 December 2017
Notes
Share capital
£m
Share premium
£m
Otherreserves†
£m
Translation reserves
£m
Hedge reserves
£m
Retained earnings
£m
Totalequity
£m
At 1 January 2016 19.6 32.8 4.6 2.3 (0.2) 139.4 198.5
Comprehensive incomeProfit for the year - - - - - 33.8 33.8
Other comprehensive income for the year - - - 27.0 0.2 (12.0) 15.2
Transactions with owners recognised directly in equityDividends 9 - - - - - (16.2) (16.2)
Credit to equity of share-based payments 21 - - - - - 1.1 1.1
Satisfaction of long term incentive awards - - - - - (1.4) (1.4)
Own shares held by employee benefit trust - - - - - (0.6) (0.6)
Transfers between reserves - - 0.2 - - (0.2) -
Tax taken directly to the Consolidated Statement of Changes in Equity 7 - - - - - 1.0 1.0
Shares issued 21 0.1 0.7 - - - - 0.8
At 31 December 2016 19.7 33.5 4.8 29.3 - 144.9 232.2Comprehensive incomeProfit for the year - - - - - 53.9 53.9Other comprehensive income for the year - - - (6.4) - (0.2) (6.6)Transactions with owners recognised directly in equityDividends 9 - - - - - (20.7) (20.7)Credit to equity of share-based payments 21 - - - - - 1.3 1.3Satisfaction of long term incentive awards - - - - - (2.5) (2.5)Own shares held by employee benefit trust - - - - - (0.1) (0.1)Transfers between reserves - - 0.1 - - (0.1) -Tax taken directly to the Consolidated Statement of Changes in Equity 7 - - - - - 0.5 0.5Shares issued 21 - 0.6 - - - - 0.6At 31 December 2017 19.7 34.1 4.9 22.9 - 177.0 258.6
† Other reserves represent the premium on shares issued in exchange for shares of subsidiaries acquired and £0.2m (2016: £0.2m) capital redemption reserve.
At 31 December 2016 the Group had purchased 103,246 of its own shares, which were held in an employee benefit trust for the purpose of settling awards granted to employees under equity-settled share based payment plans. The cost of these shares, amounting to £1.0m, was included within retained earnings at that date. In March 2017, these shares were issued in settlement of awards to employees. A further 84,225 shares were purchased in 2017 at a cost of £1.1m and are held at 31 December 2017.
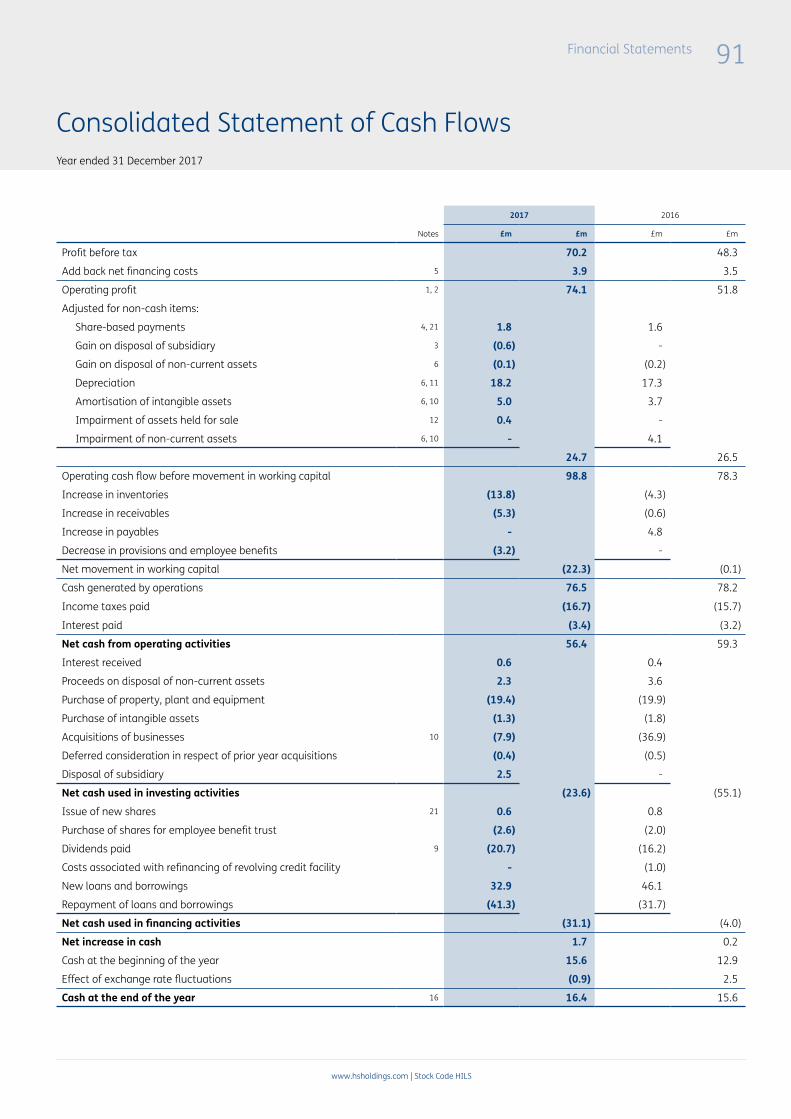
Financial Statements
www.hsholdings.com | Stock Code HILS
91
Consolidated Statement of Cash FlowsYear ended 31 December 2017
2017 2016
Notes £m £m £m £m
Profit before tax 70.2 48.3
Add back net financing costs 5 3.9 3.5
Operating profit 1, 2 74.1 51.8
Adjusted for non-cash items:
Share-based payments 4, 21 1.8 1.6
Gain on disposal of subsidiary 3 (0.6) -
Gain on disposal of non-current assets 6 (0.1) (0.2)
Depreciation 6, 11 18.2 17.3
Amortisation of intangible assets 6, 10 5.0 3.7
Impairment of assets held for sale 12 0.4 -
Impairment of non-current assets 6, 10 - 4.1
24.7 26.5
Operating cash flow before movement in working capital 98.8 78.3
Increase in inventories (13.8) (4.3)
Increase in receivables (5.3) (0.6)
Increase in payables - 4.8
Decrease in provisions and employee benefits (3.2) -
Net movement in working capital (22.3) (0.1)
Cash generated by operations 76.5 78.2
Income taxes paid (16.7) (15.7)
Interest paid (3.4) (3.2)
Net cash from operating activities 56.4 59.3
Interest received 0.6 0.4
Proceeds on disposal of non-current assets 2.3 3.6
Purchase of property, plant and equipment (19.4) (19.9)
Purchase of intangible assets (1.3) (1.8)
Acquisitions of businesses 10 (7.9) (36.9)
Deferred consideration in respect of prior year acquisitions (0.4) (0.5)
Disposal of subsidiary 2.5 -
Net cash used in investing activities (23.6) (55.1)
Issue of new shares 21 0.6 0.8
Purchase of shares for employee benefit trust (2.6) (2.0)
Dividends paid 9 (20.7) (16.2)
Costs associated with refinancing of revolving credit facility - (1.0)
New loans and borrowings 32.9 46.1
Repayment of loans and borrowings (41.3) (31.7)
Net cash used in financing activities (31.1) (4.0)
Net increase in cash 1.7 0.2
Cash at the beginning of the year 15.6 12.9
Effect of exchange rate fluctuations (0.9) 2.5
Cash at the end of the year 16 16.4 15.6

92 Financial Statements
www.hsholdings.com | Stock Code HILS
Group Accounting Policies
Hill & Smith Holdings PLC is a company incorporated in the UK.
Subsidiaries are entities controlled by the Group. The Group controls an entity when it is exposed to, or has rights to, variable returns from its involvement with the entity and has the ability to affect those returns through its power over the entity. In assessing control, the Group takes into consideration potential voting rights that are currently exercisable. The acquisition date is the date on which control is transferred to the acquirer. The financial statements of subsidiaries are included in the Group Financial Statements from the date that control commences until the date that control ceases.
The Group Financial Statements have been prepared and approved by the Directors in accordance with International Financial Reporting Standards, as adopted by the EU (‘Adopted IFRSs’). The Company has elected to prepare its Parent Company Financial Statements in accordance with FRS 101; these are presented on pages 134 to 145.
The Accounting Policies set out below have, unless otherwise stated, been applied consistently in all periods presented in these Group Financial Statements.
Judgements made by the Directors in the application of these Accounting Policies that have a significant effect on the Group Financial Statements and estimates with a significant risk of material adjustment in the next year are discussed in note 24.
Going concern and liquidity riskThe Group’s business activities, together with the factors likely to affect its future development, performance and position are set out in the Strategic Report on pages 13 to 23. The financial position of the Group, its cash flows, liquidity position and borrowing facilities are described in the Strategic Report on pages 19 to 23. In addition, note 20 to the Group Financial Statements includes the Group’s objectives, policies and processes for managing its capital; its financial risk management objectives; details of its financial instruments and hedging activities; and its exposures to credit risk and liquidity risk.
The businesses of the Group have long established relationships with customers and suppliers which, together with the Group’s current financial strength, provide a solid foundation. The Group’s forecasts and projections, taking account of reasonably possible changes in trading performance, show that the Group should be able to operate within the level of its current bank facilities, of which the Group’s principal debt facility is a multi-currency agreement with a value of £225.5m at 31 December 2017, expiring in April 2021. As a consequence, the Directors believe that the Group is well placed to manage its business risks successfully despite the current uncertain economic outlook.
After making enquiries, the Directors have a reasonable expectation that the Company and its subsidiaries have adequate resources to continue in operational existence for the foreseeable future. For this reason, they continue to adopt the going concern basis in preparing the Annual Report and Financial Statements.
New IFRS standards and interpretations adopted during 2017In 2017 the following amendments had been endorsed by the EU, became effective and therefore were adopted by the Group:
› Recognition of Deferred Tax Assets for Unrealised Losses – Amendments to IAS 12
› Disclosure Initiative – Amendments to IAS7
› Annual Improvements to IFRSs – 2014-2016 Cycle.
The adoption of these standards and amendments has not had a material impact on the Group’s Financial Statements.
The following standards and interpretations which are not yet effective or endorsed by the EU and have not been early adopted by the Group will be adopted in future accounting periods:
› IFRS 15 ‘Revenue from Contracts with Customers’ (effective 1 January 2018).
› IFRS 9 ‘Financial Instruments’ (effective 1 January 2018).
› IFRS 16 ‘Leases’ (effective 1 January 2019).
IFRS 16 replaces IAS 17 ‘Leases’ and requires lessees to recognise a lease liability reflecting the future lease payments and a right-of-use asset for all lease contracts. Upon adoption of IFRS 16, the most significant impact will be the present value of the operating lease commitments (£36.6m at 31 December 2017, as detailed in Note 22) being shown as a liability in the statement of financial position together with a right of use asset, which are unwound and amortised to the income statement over the life of the lease. There will be no impact on cash flows although the presentation of the cash flow statement will change. Management is currently working on the new processes and systems that will be required to comply with this accounting standard.
None of the other standards or amendments above are expected to have a material impact on the Group.
Financial Statements
www.hsholdings.com | Stock Code HILS
93
Measurement conventionThe Group Financial Statements are prepared on the historical cost basis except where the measurement of balances at fair value is required as explained below.
Intangible assetsIFRS3 was revised in 2010 such that acquisition costs cannot be capitalised for investments made on or after 1 January 2010. Acquisitions prior to this date have had these costs included with the purchase consideration and as such the goodwill on acquisition of subsidiaries comprises the excess of this fair value of the purchase consideration over the Group’s share of the fair value of the identifiable assets and liabilities acquired. On an ongoing basis the goodwill is measured at cost less impairment losses (see accounting policy ‘Impairment of assets’). Fair value adjustments are always considered to be provisional at the first year end date after the acquisition to allow the maximum time to elapse for management to make a reliable estimate.
Goodwill prior to 1 October 1998 was written off to reserves. Goodwill from 1 October 1998 to 31 December 2003 was amortised in line with UK GAAP. From 1 January 2004 this goodwill is subject to annual impairment testing. Gains and losses on the disposal of an entity include the carrying amount of goodwill relating to the entity sold.
Brands and customer lists that are acquired by the Group as part of a business combination are stated at cost less accumulated amortisation and impairment losses (see accounting policy ‘Impairment of assets’). Cost reflects management’s judgement of the fair value of the individual intangible asset calculated by reference to the net present value of future benefits accruing to the Group from the utilisation of the asset, discounted at an appropriate discount rate.
Certain US brands are considered to have an indefinite life and therefore are subject to annual impairment testing (see accounting policy ‘Impairment of assets’). For other brands and customer lists, amortisation is provided equally over the estimated useful economic life of the assets concerned, currently up to 20 years.
Expenditure on development activities is capitalised if the product or process is considered to be technically and commercially viable and the Group has sufficient resources to complete development. The expenditure capitalised includes the cost of materials, direct labour and an appropriate proportion of overheads. Other development expenditure is recognised in the Consolidated Income Statement as an expense as incurred. Capitalised development expenditure is stated at cost less accumulated amortisation and impairment losses. Amortisation is provided equally over the estimated useful economic life of the assets concerned, currently up to seven years.
Trade licences are amortised over the specific term granted to each individual licence.
Property, plant, equipment and depreciationDepreciation is provided to write off the cost or deemed cost less the estimated residual value of property, plant and equipment by equal instalments over their estimated useful economic lives as follows:
Freehold buildings 5 to 50 yearsLeasehold buildings life of the leasePlant, machinery and vehicles 4 to 20 years
No depreciation is provided on freehold land.
The Group has chosen to take the first time adoption exemption available under IFRS1 to use a previous revaluation for certain land and buildings as its deemed cost at the transition date. All other items of property, plant and equipment are stated at cost unless it is felt that this value should be impaired.
Assets held for saleA non-current asset is classified as held for sale if its carrying amount will be recovered principally through sale rather than through continuing use, it is available for immediate sale and sale is highly probable within one year. On initial classification as held for sale, non-current assets and disposal groups are measured at the lower of previous carrying amount and fair value less costs to sell with any adjustments taken to the income statement. The same applies to gains and losses on subsequent remeasurement.
94 Financial Statements
www.hsholdings.com | Stock Code HILS
Financial instrumentsFinancial assets and liabilities are recognised on the Group’s Consolidated Statement of Financial Position when the Group becomes party to the contractual provisions of the instrument.
The Group’s investments in equity securities and certain debt securities are classified as available for sale financial assets. Subsequent to initial recognition, they are measured at fair value and changes therein, other than impairment losses and foreign exchange gains and losses on available for sale monetary items, are recognised directly in equity. When an investment is derecognised, the cumulative gain or loss in equity is transferred to profit or loss.
Trade receivables and trade payables are initially measured at fair value. Subsequent to initial recognition, they are carried at amortised cost using the effective interest method, less any impairment losses.
Derivative financial instruments of the Group are used to hedge its exposure to interest rate and foreign currency risks arising from operational, financing and investment activities.
In accordance with its treasury policy, the Group does not hold or issue derivative financial instruments for trading purposes. However, derivatives that do not qualify for hedge accounting are accounted for as trading instruments, as follows:
› Derivative financial instruments are stated at fair value. The unhedged gain or loss on remeasurement to fair value is recognised immediately in the Consolidated Income Statement.
› The fair value of interest rate swaps is the estimated amount that the Group would receive or pay to terminate the swap at the year end date, taking into account current interest rates and the current creditworthiness of the swap counterparties.
› The fair value of foreign exchange contracts is the estimated amount that the Group would receive or pay to terminate such contracts at the year end date, taking into account the forward exchange rates prevailing at that date.
Where derivative financial instruments are used to hedge cash flow risk, such as interest rate swaps, the effective part of any gain or loss on the fair value of cash flow hedges is recognised in the Consolidated Statement of Comprehensive Income and in the hedge reserve, while any ineffective part is recognised immediately in the Consolidated Income Statement. Amounts recorded in the hedge reserve are subsequently reclassified to the Consolidated Income Statement when the interest expense is actually recognised.
To qualify for hedge accounting the hedging relationship must meet several conditions with respect to documentation, probability of occurrence, hedge effectiveness and reliability of measurement. At the inception of the transaction, the Group documents the relationship between hedging instruments and hedged items, as well as its risk management objective and strategy for undertaking the hedge transaction. This process includes linking all derivatives designated as hedges to specific assets and liabilities or to specific firm commitments or forecast transactions. The Group also documents its assessment, at hedge inception and on a half yearly basis, as to whether the derivatives that are used in hedging transactions have been, and are likely to continue to be, effective in offsetting changes in fair value or cash flows of hedged items.
Interest bearing borrowings are recognised initially at fair value. Subsequent to initial recognition, interest bearing borrowings are stated at amortised cost with any difference between cost and redemption value being recognised in the Consolidated Income Statement over the period of the borrowings on an effective interest basis.
Cash and cash equivalentsCash and cash equivalents comprise cash balances and call deposits. Bank overdrafts that are repayable on demand and form an integral part of the Group’s cash management are included as a component of cash and cash equivalents for the purpose of the Consolidated Statement of Cash Flows.
Foreign currenciesTransactions in foreign currencies are recorded using the rate of exchange ruling at the date of the transaction. Any gain or loss on translation of monetary foreign currency assets and liabilities arising from a movement in exchange rates subsequent to initial measurement is included as an exchange gain or loss in the Consolidated Income Statement.
The assets and liabilities of overseas subsidiary undertakings, including goodwill and fair value adjustments arising on acquisition, are translated at the closing exchange rate. Income statements and cash flows of such undertakings are translated into Sterling at weighted average rates of exchange, other than substantial transactions that are translated at the rate on the date of the transaction. The adjustments to period end rates are taken to the cumulative translation reserve in equity and reported in the Consolidated Statement of Comprehensive Income. When an overseas operation is disposed of, in part or in full, the relevant amount in the translation reserve is transferred to profit or loss.
Foreign currency differences arising on the retranslation of a financial liability designated as a hedge of a net investment in a foreign operation are recognised directly in equity and reported in the Consolidated Statement of Comprehensive Income, to the extent that the hedge is effective. To the extent that the hedge is ineffective, such differences are recognised in profit or loss. When the hedged part of a net investment is disposed of, the associated cumulative amount in the translation reserve is transferred to profit or loss as an adjustment to the profit or loss on disposal.
Group Accounting Policies (continued)

Financial Statements
www.hsholdings.com | Stock Code HILS
95
The principal exchange rates used were as follows:
2017 2016
Average Closing Average Closing
Sterling to Euro (£1 = EUR) 1.14 1.13 1.22 1.17
Sterling to US Dollar (£1 = USD) 1.29 1.35 1.35 1.23
Sterling to Swedish Krona (£1 = SEK) 11.00 11.08 11.57 11.14
Sterling to Indian Rupee (£1 = INR) 83.90 86.30 90.96 83.48
Sterling to Australian Dollar (£1 = AUD) 1.68 1.73 1.82 1.70
InventoriesInventories are stated at the lower of cost and net realisable value. In determining the cost of raw materials, consumables and goods purchased for resale, the FIFO or average cost method is used. Cost for work in progress and finished goods comprises direct materials, direct labour and an appropriate proportion of attributable overheads.
ProvisionsA provision is recognised in the Consolidated Statement of Financial Position when the Group has a present legal or constructive obligation as a result of a past event and it is probable that an outflow of economic benefits will be required to settle the obligation. If the effect is material, provisions are determined by discounting the expected future cash flows at a pre tax rate that reflects current market assessments of the time value of money and, when appropriate, the risks specific to the liability.
A provision for restructuring is recognised when the Group has approved a detailed and formal restructuring plan, and the restructuring either has commenced or has been announced publicly. Future operating costs are not provided for.
In accordance with the Group’s environmental policy and applicable legal requirements, a provision for site restoration in respect of contaminated land is recognised as an obligation arises.
The estimated cost of returning properties held under leases to their original condition in accordance with the terms of specific lease contracts is recognised as soon as such costs are able to be reliably estimated.
Impairment of assetsThe carrying amounts of the Group’s non-financial assets, other than inventories (see accounting policy ‘Inventories’) and deferred tax balances (see accounting policy ‘Deferred taxation’), are reviewed at each year end date to determine whether there is an indication of impairment. Impairment reviews are undertaken at the level of each significant cash generating unit, which are no larger than operating segments as defined in IFRS8 – Segmental reporting. If such an indication exists, the relevant asset’s recoverable amount is estimated. An impairment loss is recognised whenever the carrying amount of the asset or its cash generating unit exceeds its recoverable amount.
For goodwill and intangible assets that have an indefinite life, the recoverable amount is assessed at each year end date and an impairment loss is recognised for the amount by which the asset’s carrying amount exceeds its recoverable amount.
The recoverable amount of an asset or cash generating unit is the greater of its value in use and its fair value less costs to sell. In assessing value in use, the estimated future cash flows are discounted to their present value using a pre tax discount rate that reflects current market assessments of the time value of money and the risks specific to the asset.
LeasesLeases for which the Group assumes substantially all the risks and rewards of ownership are classified as finance leases. Upon initial recognition the leased asset is measured at an amount equal to the lower of its fair value and the present value of the minimum lease payments. Subsequent to initial recognition, the asset is accounted for in accordance with the accounting policy applicable to that asset.
Other leases are classified as operating leases and the leased assets are not recognised on the Group’s Consolidated Statement of Financial Position. Payments made under operating leases are recognised in the Consolidated Income Statement on a straight line basis over the term of the lease. Lease incentives received are recognised as an integral part of the total lease expense, over the term of the lease.
Minimum lease payments made under finance leases are apportioned between the finance expense and the reduction of the outstanding liability. The finance expense is allocated to each period during the lease term so as to produce a constant periodic rate of interest on the remaining balance of the liability.
Rental income from operating leases is recognised as revenue in the Consolidated Income Statement on an accruals basis.

96 Financial Statements
www.hsholdings.com | Stock Code HILS
RevenueRevenue from the sale of goods and services represents the amount (excluding sales taxes) invoiced to third party customers, net of returns, trade discounts and volume rebates. Revenue is recognised when the significant risks and rewards of ownership have been transferred to the buyer and the amount of revenue can be measured reliably. In the Galvanizing Services segment this is generally considered to be on completion of the galvanizing process when products are made available for customer collection. In the Infrastructure Products segments products are often bespoke although customer contracts are generally relatively simple. There are a number of conditions which must be satisfied before revenue can be recognised. These can include: legal, contractual ownership; passing internal quality control testing; dispatch from manufacturing sites; installation at customer sites; customer inspection both before and after installation; and/or, ultimately, customer acceptance. Given these conditions, a greater degree of consideration is given as to whether the terms of sale have been met and whether revenue can be recognised for each product.
Government grantsGovernment grants are recognised as a liability in the Consolidated Statement of Financial Position and credited to operating profit over the estimated useful economic life of the relevant assets or the length of employment specified in the grant.
GuaranteesThe Group’s policy is to not give external guarantees.
Retirement benefitsThe Group operates pension schemes under which contributions by employees and by the sponsoring companies are held in trust funds separated from the Group’s finances.
Obligations for contributions to defined contribution pension schemes are recognised as an expense in the Consolidated Income Statement as incurred.
The Group’s net obligation in respect of defined benefit pension schemes is calculated separately for each scheme by estimating the amount of future benefit that employees have earned in return for their service in the current and prior periods. This benefit is discounted to determine its present value, and the fair value of any scheme assets is deducted. The discount rate is the yield at the year end date on AA rated bonds that have maturity dates approximating to the terms of the Group’s obligations. The calculation is performed by a qualified actuary using the projected unit method. Scheme assets are valued at bid price.
In the Consolidated Income Statement current and past service costs are recognised in operating profit and the interest cost on the net defined benefit obligations is included in financial expense.
All actuarial gains and losses in calculating the Group’s obligation in respect of defined benefit schemes are recognised annually in reserves and reported in the Consolidated Statement of Comprehensive Income.
Share-based payment transactionsThe fair value of shares/options granted is recognised as an employee expense, with a corresponding increase in equity reserves. The fair value is calculated at the grant date and spread over the period during which the employees become unconditionally entitled to the shares/options. The Black–Scholes model has been adopted as the method of evaluating the fair value of the options where vesting is based on non-market conditions, while a Monte Carlo Simulation is used where vesting is based on market conditions. The amount recognised as an expense is adjusted to reflect the actual number of awards for which the related service and non-market vesting conditions are expected to be met, such that the amount ultimately recognised as an expense is based on the number of awards that do meet the related service and non-market performance conditions at the vesting date. For share-based payment awards with non-vesting conditions, the grant date fair value of the share-based payment is measured to reflect such conditions and there is no adjustment for differences between expected and actual outcomes.
The fair value of amounts payable to employees in respect of share appreciation rights settled in cash is recognised as an employee expense and corresponding increase in liabilities. The fair value of the liability is remeasured at each reporting date and spread over the period during which employees become unconditionally entitled to the payment.
Financial income and expenseFinancial income comprises interest income on funds invested and gains on the fair value of financial assets and liabilities at fair value through profit or loss. Interest income is recognised as it accrues in the Consolidated Income Statement using the effective interest method.
Financial expense comprises interest expense on borrowings, interest cost on net pension scheme obligations, unwinding of discounts, losses on the fair value of financial assets and liabilities at fair value through profit or loss, the interest expense component of finance lease payments and financial expenses related to refinancing. All borrowing costs are recognised in the Consolidated Income Statement using the effective interest method with the exception of those meeting the criteria for capitalisation set out in IAS 23.
Group Accounting Policies (continued)
Financial Statements
www.hsholdings.com | Stock Code HILS
97
Non-underlying itemsNon-underlying items are disclosed separately in the Consolidated Income Statement where the quantum, nature or volatility of such items would otherwise distort the underlying trading performance of the Group. The following are included by the Group in its assessment of non-underlying items:
› Gains or losses arising on disposal, closure, restructuring or reorganisation of businesses that do not meet the definition of discontinued operations.
› Amortisation of intangible fixed assets arising on acquisitions.
› Expenses associated with acquisitions.
› Impairment charges in respect of tangible or intangible fixed assets.
› Changes in the fair value of derivative financial instruments.
› Significant past service items or curtailments and settlements relating to defined benefit pension obligations resulting from material changes in the terms of the schemes.
› Net financing costs or returns on defined benefit pension obligations.
› Costs incurred as part of significant refinancing activities.
The tax effect of the above is also included.
Details in respect of the non-underlying items recognised in the current and prior year are set out in note 3 to the Financial Statements.
Income taxIncome tax on the profit or loss for the year represents the sum of the tax currently payable and deferred tax. Income tax is recognised in the Consolidated Income Statement except to the extent that it relates to items either recognised in Other Comprehensive Income or directly in equity.
Current tax is the expected tax payable on the taxable profit for the year. Taxable profit differs from net profit as reported in the Consolidated Income Statement because it excludes items of income or expense that are not taxable or deductible. The Group’s liability for current tax is calculated using tax rates enacted or substantively enacted at the year end date, and any adjustments to tax payable in respect of previous years.
Deferred taxationDeferred tax is provided in full using the Consolidated Statement of Financial Position liability method and represents the tax expected to be payable or recoverable on the temporary differences between the carrying amounts of assets and liabilities for financial reporting purposes and the amounts used for taxation purposes. The following temporary differences are not provided for: goodwill not deductible for tax purposes, the initial recognition of assets and liabilities not resulting from a business combination that affects neither accounting or taxable profit, and differences relating to investments in subsidiaries to the extent that they will not reverse in the foreseeable future. The amount of deferred tax provided is based on the expected manner of realisation or settlement of the carrying amount of assets and liabilities, using tax rates enacted or substantively enacted at the year end date.
A deferred tax asset is recognised only to the extent that it is probable that future taxable profits will be available against which the asset can be utilised. The carrying amount of deferred tax assets is reviewed at each year end date and reduced to the extent that it is no longer probable that sufficient taxable profit will be available to allow all or part of the asset to be recovered.
Deferred tax assets and liabilities are offset when they relate to income taxes levied by the same taxation authority and the Group intends to settle its current tax assets and liabilities on a net basis.
Ordinary dividendsDividends are recognised as a liability in the period in which they are approved by the Company’s shareholders.
Own shares held by Employee Benefit Trust (‘EBT’)Transactions of the Group-sponsored EBT are included in the Group Financial Statements. In particular, the Trust’s purchases of shares in the Company are debited directly to equity.
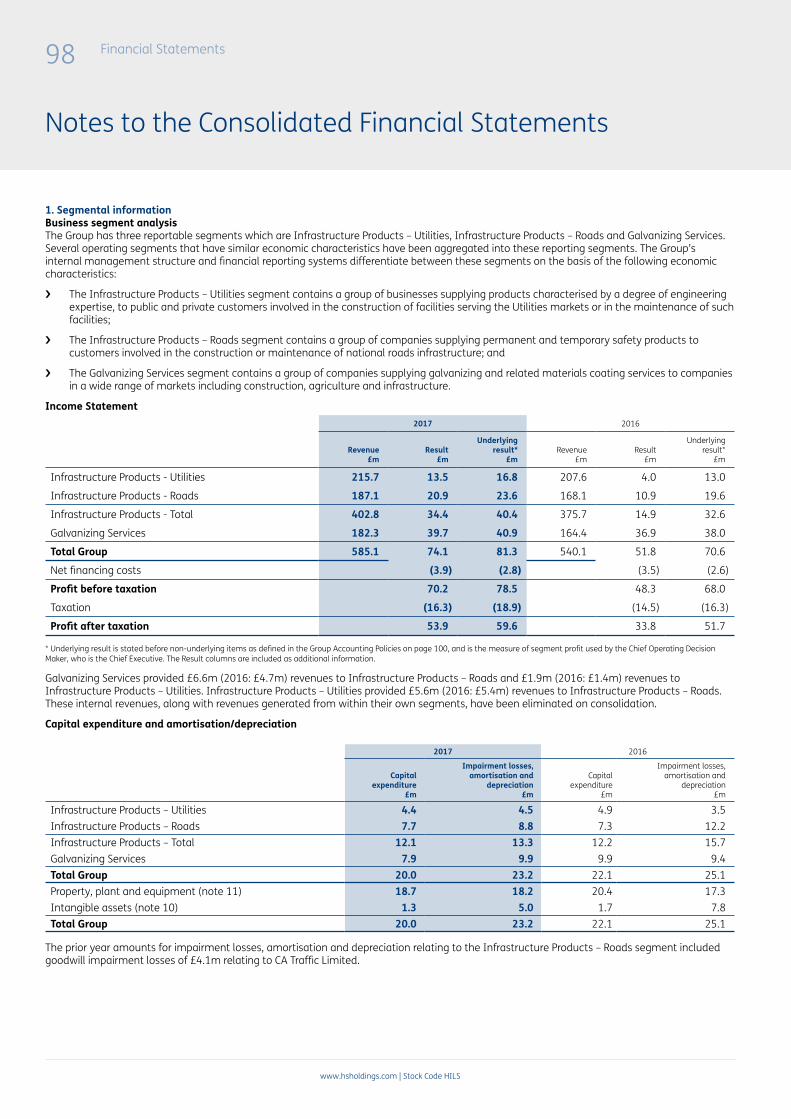
98 Financial Statements
www.hsholdings.com | Stock Code HILS
Notes to the Consolidated Financial Statements
1. Segmental informationBusiness segment analysisThe Group has three reportable segments which are Infrastructure Products – Utilities, Infrastructure Products – Roads and Galvanizing Services. Several operating segments that have similar economic characteristics have been aggregated into these reporting segments. The Group’s internal management structure and financial reporting systems differentiate between these segments on the basis of the following economic characteristics:
› The Infrastructure Products – Utilities segment contains a group of businesses supplying products characterised by a degree of engineering expertise, to public and private customers involved in the construction of facilities serving the Utilities markets or in the maintenance of such facilities;
› The Infrastructure Products – Roads segment contains a group of companies supplying permanent and temporary safety products to customers involved in the construction or maintenance of national roads infrastructure; and
› The Galvanizing Services segment contains a group of companies supplying galvanizing and related materials coating services to companies in a wide range of markets including construction, agriculture and infrastructure.
Income Statement2017 2016
Revenue £m
Result £m
Underlyingresult*
£mRevenue
£mResult
£m
Underlyingresult*
£m
Infrastructure Products - Utilities 215.7 13.5 16.8 207.6 4.0 13.0
Infrastructure Products - Roads 187.1 20.9 23.6 168.1 10.9 19.6
Infrastructure Products - Total 402.8 34.4 40.4 375.7 14.9 32.6
Galvanizing Services 182.3 39.7 40.9 164.4 36.9 38.0
Total Group 585.1 74.1 81.3 540.1 51.8 70.6
Net financing costs (3.9) (2.8) (3.5) (2.6)
Profit before taxation 70.2 78.5 48.3 68.0
Taxation (16.3) (18.9) (14.5) (16.3)
Profit after taxation 53.9 59.6 33.8 51.7
* Underlying result is stated before non-underlying items as defined in the Group Accounting Policies on page 100, and is the measure of segment profit used by the Chief Operating Decision Maker, who is the Chief Executive. The Result columns are included as additional information.
Galvanizing Services provided £6.6m (2016: £4.7m) revenues to Infrastructure Products – Roads and £1.9m (2016: £1.4m) revenues to Infrastructure Products – Utilities. Infrastructure Products – Utilities provided £5.6m (2016: £5.4m) revenues to Infrastructure Products – Roads. These internal revenues, along with revenues generated from within their own segments, have been eliminated on consolidation.
Capital expenditure and amortisation/depreciation
2017 2016
Capitalexpenditure
£m
Impairment losses,amortisation and
depreciation£m
Capitalexpenditure
£m
Impairment losses,amortisation and
depreciation£m
Infrastructure Products – Utilities 4.4 4.5 4.9 3.5Infrastructure Products – Roads 7.7 8.8 7.3 12.2Infrastructure Products – Total 12.1 13.3 12.2 15.7Galvanizing Services 7.9 9.9 9.9 9.4Total Group 20.0 23.2 22.1 25.1Property, plant and equipment (note 11) 18.7 18.2 20.4 17.3Intangible assets (note 10) 1.3 5.0 1.7 7.8Total Group 20.0 23.2 22.1 25.1
The prior year amounts for impairment losses, amortisation and depreciation relating to the Infrastructure Products – Roads segment included goodwill impairment losses of £4.1m relating to CA Traffic Limited.
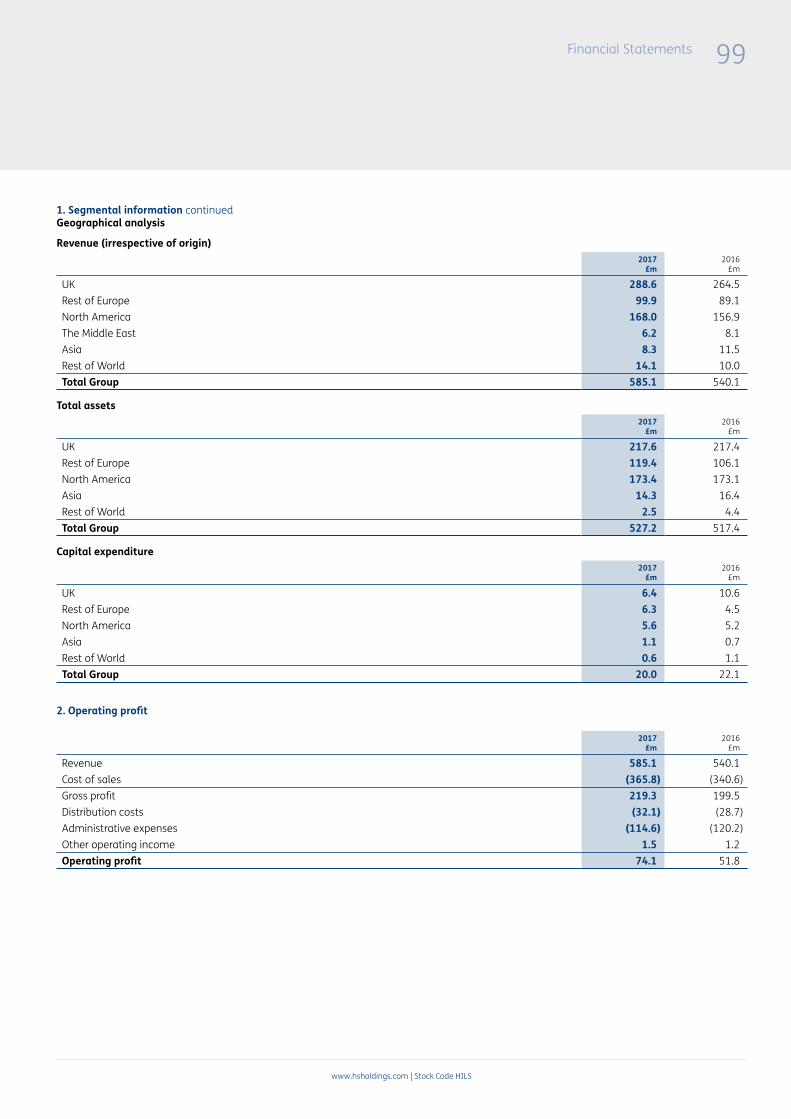
Financial Statements
www.hsholdings.com | Stock Code HILS
99
1. Segmental information continuedGeographical analysis
Revenue (irrespective of origin)2017
£m 2016
£m
UK 288.6 264.5Rest of Europe 99.9 89.1North America 168.0 156.9The Middle East 6.2 8.1Asia 8.3 11.5Rest of World 14.1 10.0Total Group 585.1 540.1
Total assets2017
£m 2016
£m
UK 217.6 217.4Rest of Europe 119.4 106.1North America 173.4 173.1Asia 14.3 16.4Rest of World 2.5 4.4Total Group 527.2 517.4
Capital expenditure2017
£m 2016
£m
UK 6.4 10.6Rest of Europe 6.3 4.5North America 5.6 5.2Asia 1.1 0.7Rest of World 0.6 1.1Total Group 20.0 22.1
2. Operating profit
2017£m
2016£m
Revenue 585.1 540.1Cost of sales (365.8) (340.6)Gross profit 219.3 199.5Distribution costs (32.1) (28.7)Administrative expenses (114.6) (120.2)Other operating income 1.5 1.2Operating profit 74.1 51.8

100 Financial Statements
www.hsholdings.com | Stock Code HILS
3. Non-underlying items
Non-underlying items included in operating profit comprise the following:
› Business reorganisation costs of £2.8m (2016: £10.5m) relating to various restructuring actions taken by the Group during the current and prior year.
• In June 2017, the Group initiated a rationalisation of its Variable Message Signs business that will result in the closure of two of its operating sites and the consolidation of activities into the remaining site in Hebburn, UK. The business had been operating across three sites since the acquisitions of VMS and Tegrel in 2014/15 and expects to take advantage of cost savings and efficiencies as a result of the rationalisation. The anticipated cost of the exercise is £1.4m.
• Following a strategic review of the US Pipe Supports business, in March 2017 the Group completed a rationalisation of its branch structure resulting in the closure of three of the seven existing branches and the consolidation of their operations into one strategically located service centre between New York and Philadelphia, serving the eastern region. The cost of this programme was £0.4m.
• Following the acquisition of Tower Tech in August 2017, the Group has commenced a programme to close Tower Tech’s existing facility in Oklahoma City and relocate the business to our Creative Pultrusions site in Pennsylvania. The cost of this programme, which is expected to be completed in 2018, is £0.4m.
• In December 2016 the Group announced the closure of its roads business in India having reassessed the prospects in that market. The prior year results included a charge of £1.9m in respect of the closure. A further charge of £0.4m has been recognised in 2017 representing additional closure costs that have been incurred.
• In March 2016 the Group announced the closure of its non-US Pipe Supports operations. Whilst substantially completed in the prior year, additional costs of £0.2m have been incurred in the current year on completion of the closure.
› Amortisation of acquired intangible fixed assets of £4.0m (2016: £2.6m).
› Acquisition expenses of £0.6m (2016: £1.8m) relating to the two acquisitions completed during the year.
› An impairment charge of £0.4m in respect of assets held for sale (note 12), reflecting a reduction in the expected realisable value of that property.
› In April 2017 the Group sold its traffic data collection business, CA Traffic Limited, to TagMaster AB for net consideration of £2.6m. Net assets disposed were £2.0m resulting in a profit on disposal of £0.6m. The detail of the disposal is set out below:
£m
Capitalised development costs 0.6Inventories 1.4Current assets 0.8Cash and cash equivalents 0.1Current liabilities (0.8)Deferred tax (0.1)Net assets 2.0Consideration 2.8Less costs of disposal (0.2)Gain on disposal 0.6
Cash flow effectConsideration less costs of disposal 2.6Cash and cash equivalents disposed of (0.1)Net cash received shown in the Consolidated Statement of Cash Flows 2.5
Non-underlying items included in financial expense represent the net financing cost on pension obligations of £0.7m (2016: £0.5m) and a £0.4m (2016: £0.4m) charge in respect of amortisation of costs associated with refinancing.
Notes to the Consolidated Financial Statements (continued)

Financial Statements
www.hsholdings.com | Stock Code HILS
101
4. Employees
2017No.
2016No.
The average number of people employed by the Group during the yearInfrastructure Products – Utilities 1,739 1,688Infrastructure Products – Roads 833 783Infrastructure Products – Total 2,572 2,471Galvanizing Services 1,459 1,459Total Group 4,031 3,930
£m £m
The aggregate remuneration for the yearWages and salaries 123.1 117.3Share-based payments 1.8 1.6Social security costs 20.9 19.2Pension costs 2.9 2.5
148.7 140.6
Details of the Directors’ remuneration and share interests are given in the Directors’ Remuneration Report on pages 62 to 71.
5. Net financing costs
Underlying£m
Non-underlying
£m2017
£mUnderlying
£m
Non-underlying
£m2016
£m
Interest on bank deposits 0.6 - 0.6 0.4 - 0.4Financial income 0.6 - 0.6 0.4 - 0.4Interest on bank loans and overdrafts 3.4 - 3.4 3.0 - 3.0Total interest expense 3.4 - 3.4 3.0 - 3.0Financial expenses related to refinancing - 0.4 0.4 - 0.4 0.4Interest cost on net pension scheme deficit (note 23) - 0.7 0.7 - 0.5 0.5Financial expense 3.4 1.1 4.5 3.0 0.9 3.9Net financing costs 2.8 1.1 3.9 2.6 0.9 3.5

102 Financial Statements
www.hsholdings.com | Stock Code HILS
6. Expenses and auditor’s remuneration
2017£m
2016 £m
Income statement chargesDepreciation of property, plant and equipment:
Owned 18.2 17.3Leased - -
Operating lease rentals:Plant and machinery 3.3 2.3Other 3.7 3.7
Research and development expenditure 0.3 0.5Amortisation of acquisition intangibles 4.0 2.6Amortisation of development costs 0.9 0.9Amortisation of other intangible assets 0.1 0.2Impairment losses 0.4 4.1Foreign exchange loss 0.1 -
Income statement creditsProfit on disposal of non-current assets 0.1 0.2Rental income 9.8 11.7
A detailed analysis of the Auditor’s Remuneration worldwide is as follows:
£m £m
Hill & Smith Holdings PLCAudit of the Company’s Annual Accounts 0.1 0.1
Audit of the Company’s subsidiaries 0.7 0.6
Other assurance services - 0.1
Services relating to corporate finance transactions 0.1 0.2
0.9 1.0
A description of the work of the Audit Committee is set out in the Audit Committee report on pages 56 to 60 and includes an explanation of how auditor objectivity and independence is safeguarded when non audit services are provided by the auditor.
Notes to the Consolidated Financial Statements (continued)
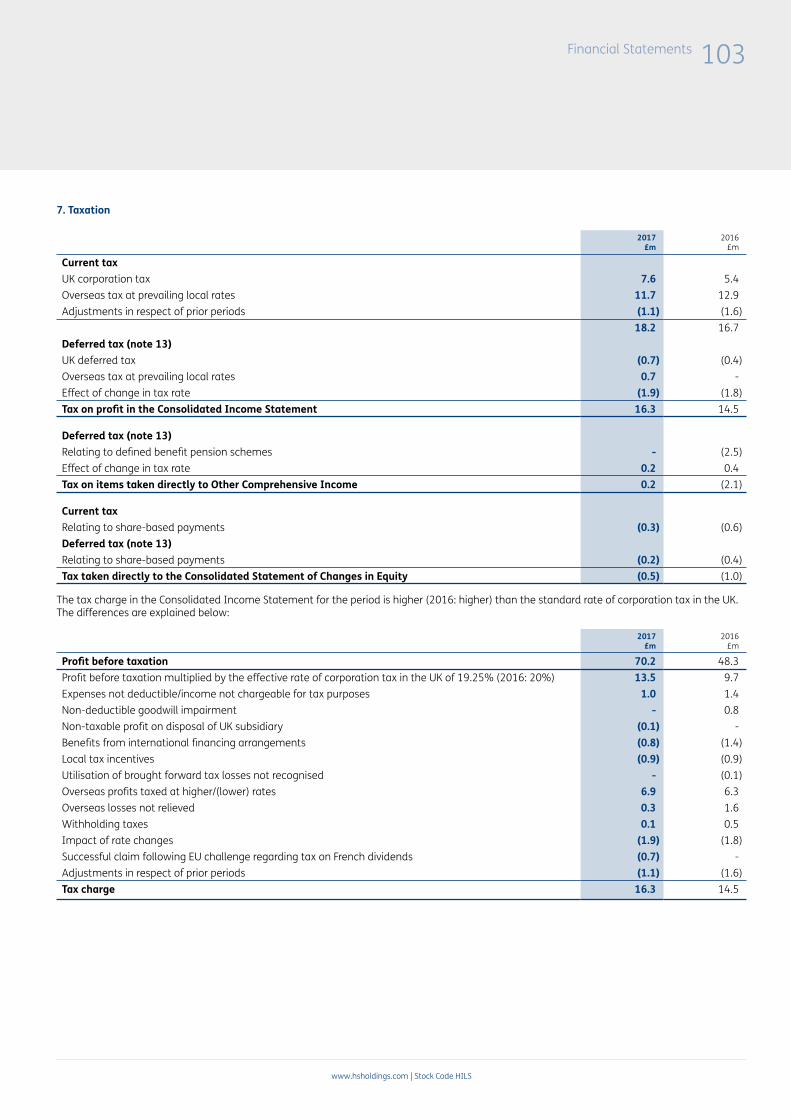
Financial Statements
www.hsholdings.com | Stock Code HILS
103
7. Taxation
2017£m
2016 £m
Current taxUK corporation tax 7.6 5.4Overseas tax at prevailing local rates 11.7 12.9Adjustments in respect of prior periods (1.1) (1.6)
18.2 16.7Deferred tax (note 13)UK deferred tax (0.7) (0.4)Overseas tax at prevailing local rates 0.7 -Effect of change in tax rate (1.9) (1.8)Tax on profit in the Consolidated Income Statement 16.3 14.5
Deferred tax (note 13)Relating to defined benefit pension schemes - (2.5)Effect of change in tax rate 0.2 0.4Tax on items taken directly to Other Comprehensive Income 0.2 (2.1)
Current taxRelating to share-based payments (0.3) (0.6)Deferred tax (note 13)Relating to share-based payments (0.2) (0.4)Tax taken directly to the Consolidated Statement of Changes in Equity (0.5) (1.0)
The tax charge in the Consolidated Income Statement for the period is higher (2016: higher) than the standard rate of corporation tax in the UK. The differences are explained below:
2017£m
2016 £m
Profit before taxation 70.2 48.3Profit before taxation multiplied by the effective rate of corporation tax in the UK of 19.25% (2016: 20%) 13.5 9.7Expenses not deductible/income not chargeable for tax purposes 1.0 1.4Non-deductible goodwill impairment - 0.8Non-taxable profit on disposal of UK subsidiary (0.1) -Benefits from international financing arrangements (0.8) (1.4)Local tax incentives (0.9) (0.9)Utilisation of brought forward tax losses not recognised - (0.1)Overseas profits taxed at higher/(lower) rates 6.9 6.3Overseas losses not relieved 0.3 1.6Withholding taxes 0.1 0.5Impact of rate changes (1.9) (1.8)Successful claim following EU challenge regarding tax on French dividends (0.7) -Adjustments in respect of prior periods (1.1) (1.6)Tax charge 16.3 14.5

104 Financial Statements
www.hsholdings.com | Stock Code HILS
8. Earnings per shareThe weighted average number of ordinary shares in issue during the year was 78.6m (2016: 78.5m), diluted for the effects of the outstanding dilutive share options 79.6m (2016: 79.3m). Underlying earnings per share have been shown because the Directors consider that this provides valuable additional information about the underlying performance of the Group.
2017 2016
Penceper share £m
Penceper share £m
Basic earnings 68.6 53.9 43.0 33.8
Non-underlying items* 7.3 5.7 22.9 17.9
Underlying earnings 75.9 59.6 65.9 51.7
Diluted earnings 67.7 53.9 42.5 33.8
Non-underlying items* 7.1 5.7 22.6 17.9
Underlying diluted earnings 74.8 59.6 65.1 51.7
* Non-underlying items as detailed in note 3.
9. DividendsDividends paid in the year were the prior year’s interim dividend of £6.7m (2016: £5.5m) and the final dividend of £14.0m (2016: £10.7m). Dividends declared after the year end date are not recognised as a liability, in accordance with IAS10. The Directors have proposed the following interim dividend and final dividend for the current year, subject to shareholder approval:
2017 2016
Penceper share £m
Penceper share £m
Equity sharesInterim 9.4 7.4 8.5 6.7Final 20.6 16.4 17.9 14.1Total 30.0 23.8 26.4 20.8
Notes to the Consolidated Financial Statements (continued)

Financial Statements
www.hsholdings.com | Stock Code HILS
105
10. Intangible assets
Goodwill£m
Brands£m
Customer lists£m
Capitaliseddevelopment
costs£m
Contracts,licences and other assets
£mTotal
£m
CostAt 1 January 2016 109.2 20.9 20.8 13.0 2.0 165.9
Exchange adjustments 12.9 3.6 2.3 - 0.3 19.1
Acquisitions 15.8 0.8 11.3 - 4.9 32.8
Additions - - - 1.5 0.2 1.7
At 31 December 2016 137.9 25.3 34.4 14.5 7.4 219.5Exchange adjustments (4.1) (1.4) (0.9) - (0.1) (6.5)Acquisitions 4.4 0.7 0.7 - - 5.8Additions - - - 1.3 - 1.3Disposal of subsidiary (4.3) - - (2.0) - (6.3)At 31 December 2017 133.9 24.6 34.2 13.8 7.3 213.8Amortisation and impairment lossesAt 1 January 2016 8.5 8.7 11.1 9.4 1.8 39.5
Exchange adjustments 1.7 1.7 2.0 - 0.3 5.7
Impairment losses 4.1 - - - - 4.1
Amortisation charge for the year - 0.6 1.8 0.9 0.4 3.7
At 31 December 2016 14.3 11.0 14.9 10.3 2.5 53.0Exchange adjustments (0.9) (0.6) (0.9) - - (2.4)Amortisation charge for the year - 0.7 2.6 0.9 0.8 5.0Disposal of subsidiary (4.3) - - (1.4) - (5.7)At 31 December 2017 9.1 11.1 16.6 9.8 3.3 49.9Carrying valuesAt 1 January 2016 100.7 12.2 9.7 3.6 0.2 126.4
At 31 December 2016 123.6 14.3 19.5 4.2 4.9 166.5
At 31 December 2017 124.8 13.5 17.6 4.0 4.0 163.9
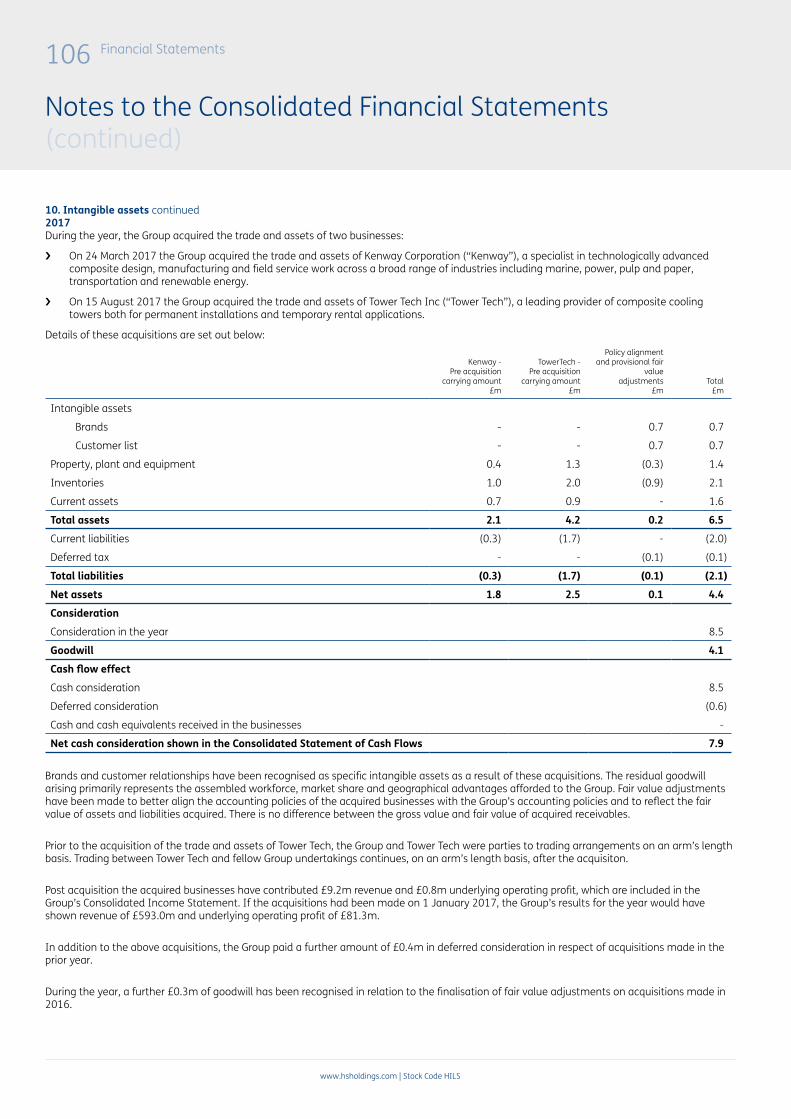
106 Financial Statements
www.hsholdings.com | Stock Code HILS
10. Intangible assets continued2017During the year, the Group acquired the trade and assets of two businesses:
› On 24 March 2017 the Group acquired the trade and assets of Kenway Corporation (“Kenway”), a specialist in technologically advanced composite design, manufacturing and field service work across a broad range of industries including marine, power, pulp and paper, transportation and renewable energy.
› On 15 August 2017 the Group acquired the trade and assets of Tower Tech Inc (“Tower Tech”), a leading provider of composite cooling towers both for permanent installations and temporary rental applications.
Details of these acquisitions are set out below:
Kenway - Pre acquisition
carrying amount£m
TowerTech - Pre acquisition
carrying amount£m
Policy alignment and provisional fair
value adjustments
£mTotal
£m
Intangible assets
Brands - - 0.7 0.7
Customer list - - 0.7 0.7
Property, plant and equipment 0.4 1.3 (0.3) 1.4
Inventories 1.0 2.0 (0.9) 2.1
Current assets 0.7 0.9 - 1.6
Total assets 2.1 4.2 0.2 6.5Current liabilities (0.3) (1.7) - (2.0)
Deferred tax - - (0.1) (0.1)
Total liabilities (0.3) (1.7) (0.1) (2.1)Net assets 1.8 2.5 0.1 4.4ConsiderationConsideration in the year 8.5
Goodwill 4.1Cash flow effectCash consideration 8.5
Deferred consideration (0.6)
Cash and cash equivalents received in the businesses -
Net cash consideration shown in the Consolidated Statement of Cash Flows 7.9
Brands and customer relationships have been recognised as specific intangible assets as a result of these acquisitions. The residual goodwill arising primarily represents the assembled workforce, market share and geographical advantages afforded to the Group. Fair value adjustments have been made to better align the accounting policies of the acquired businesses with the Group’s accounting policies and to reflect the fair value of assets and liabilities acquired. There is no difference between the gross value and fair value of acquired receivables.
Prior to the acquisition of the trade and assets of Tower Tech, the Group and Tower Tech were parties to trading arrangements on an arm’s length basis. Trading between Tower Tech and fellow Group undertakings continues, on an arm’s length basis, after the acquisiton.
Post acquisition the acquired businesses have contributed £9.2m revenue and £0.8m underlying operating profit, which are included in the Group’s Consolidated Income Statement. If the acquisitions had been made on 1 January 2017, the Group’s results for the year would have shown revenue of £593.0m and underlying operating profit of £81.3m.
In addition to the above acquisitions, the Group paid a further amount of £0.4m in deferred consideration in respect of acquisitions made in the prior year.
During the year, a further £0.3m of goodwill has been recognised in relation to the finalisation of fair value adjustments on acquisitions made in 2016.
Notes to the Consolidated Financial Statements (continued)

Financial Statements
www.hsholdings.com | Stock Code HILS
107
10. Intangible assets continued2016On 13 May 2016 the Group acquired the share capital of Safety and Security Barrier Holdings Limited, the parent company of Hardstaff Barriers Limited. Details of this acquisition were as follows:
Safety and Security Barrier Holdings Limited
Pre acquisition carrying amount
£m
Policy alignment and fair value adjustments
£mTotal
£m
Intangible assets - 4.4 4.4
Property, plant and equipment 1.9 (0.7) 1.2
Inventories 0.2 - 0.2
Current assets 0.7 - 0.7
Cash and cash equivalents 0.3 - 0.3
Total assets 3.1 3.7 6.8Current trade and other liabilities (0.8) (0.2) (1.0)
Current tax liabilities (0.2) (0.8) (1.0)
Deferred tax liabilities (0.3) (0.6) (0.9)
Total liabilities (1.3) (1.6) (2.9)Net assets 1.8 2.1 3.9ConsiderationConsideration in the year 10.7
Goodwill 6.8Cash flow effectConsideration 10.7
Cash and cash equivalents acquired with the business (0.3)
Net cash consideration shown in the Consolidated Statement of Cash Flows 10.4
Contractual and customer relationships were recognised as specific intangible assets as a result of the acquisition. The residual goodwill arising primarily represents the assembled workforce, market share and geographical advantages afforded to the Group. Fair value adjustments were made to better align the accounting policies of the acquired business with the Group’s accounting policies and to reflect the fair value of assets and liabilities acquired.

108 Financial Statements
www.hsholdings.com | Stock Code HILS
10. Intangible assets continued2016On 13 July 2016 the Group acquired the share capital of Technocover Limited. Details of this acquisition were as follows:
Technocover LimitedPre acquisition
carrying amount£m
Policy alignment and fair value adjustments
£mTotal
£m
Intangible assets 0.1 5.9 6.0
Property, plant and equipment 2.4 (0.1) 2.3
Inventories 0.5 - 0.5
Current assets 1.7 - 1.7
Cash and cash equivalents 1.0 - 1.0
Total assets 5.7 5.8 11.5Current trade and other liabilities (1.7) - (1.7)
Current tax liabilities (0.2) - (0.2)
Deferred tax liabilities (0.1) (1.1) (1.2)
Total liabilities (2.0) (1.1) (3.1)Net assets 3.7 4.7 8.4ConsiderationConsideration in the year 10.2
Goodwill 1.8Cash flow effectConsideration 10.2
Cash and cash equivalents acquired with the business (1.0)
Net cash consideration shown in the Consolidated Statement of Cash Flows 9.2
Brands, contractual and customer relationships were recognised as specific intangible assets as a result of the acquisition. The residual goodwill arising primarily represents the assembled workforce, market share and geographical advantages afforded to the Group. Fair value adjustments were made to better align the accounting policies of the acquired business with the Group’s accounting policies and to reflect the fair value of assets and liabilities acquired.
Notes to the Consolidated Financial Statements (continued)

Financial Statements
www.hsholdings.com | Stock Code HILS
109
10. Intangible assets continued2016On 3 August 2016 the Group acquired the share capital of Signature Limited. Details of this acquisition were as follows:
Signature LimitedPre acquisition
carrying amount£m
Policy alignment and fair value adjustments
£mTotal
£m
Intangible assets - 6.6 6.6
Property, plant and equipment 3.5 (0.1) 3.4
Inventories 1.7 (0.2) 1.5
Current assets 2.5 (0.1) 2.4
Cash and cash equivalents - - -
Total assets 7.7 6.2 13.9Current interest bearing liabilities (0.2) - (0.2)
Current trade and other liabilities (3.2) (0.2) (3.4)
Current tax liabilities (0.2) - (0.2)
Deferred tax liabilities - (1.1) (1.1)
Total liabilities (3.6) (1.3) (4.9)Net assets 4.1 4.9 9.0ConsiderationConsideration in the year 12.0
Goodwill 3.0Cash flow effectConsideration 12.0
Refund of consideration due 0.4
Net overdraft acquired with the business 0.2
Net cash consideration shown in the Consolidated Statement of Cash Flows 12.6
Brands, contractual and customer relationships were recognised as specific intangible assets as a result of the acquisition. The residual goodwill arising primarily represents the assembled workforce, market share and geographical advantages afforded to the Group. Fair value adjustments were made to better align the accounting policies of the acquired business with the Group’s accounting policies and to reflect the fair value of assets and liabilities acquired.

110 Financial Statements
www.hsholdings.com | Stock Code HILS
10. Intangible assets continued2016The Group also made two other smaller acquisitions during the prior year:
› The trade and certain assets of E.T. Techtonics, Inc. (‘ETT’), acquired in January 2016; and
› The share capital of FMK Trafikprodukter AB (‘FMK’) , acquired in April 2016.
Details of these acquisitions are set out below:
ETTPre acquisition
carrying amount
£m
FMKPre acquisition
carrying amount
£m
Policy alignment and
fair value adjustments
£mTotal
£m
Intangible assets - - - -
Property, plant and equipment - - - -
Inventories - 1.3 (0.1) 1.2
Current assets 0.1 0.2 - 0.3
Cash and cash equivalents - - - -
Total assets 0.1 1.5 (0.1) 1.5Current trade and other liabilities - (0.2) - (0.2)
Deferred tax liabilities - - - -
Total liabilities - (0.2) - (0.2)Net assets 0.1 1.3 (0.1) 1.3ConsiderationConsideration in the year 5.5
Goodwill 4.2Cash flow effectConsideration 5.5
Contingent consideration (0.8)
Cash and cash equivalents acquired with the business -
Net cash consideration shown in the Consolidated Statement of Cash Flows 4.7
The goodwill arising primarily represents the market share and know-how afforded to the Group. Fair value adjustments were made to better align the accounting policies of the acquired businesses with the Group’s accounting policies and to reflect the fair value of assets and liabilities acquired. Contingent consideration relates to the acquisition of FMK and is the maximum amount payable dependent on the achievement of performance and product development targets.
Notes to the Consolidated Financial Statements (continued)

Financial Statements
www.hsholdings.com | Stock Code HILS
111
10. Intangible assets continuedCash generating units with significant amounts of goodwill
2017£m
2016£m
Infrastructure Products - UtilitiesUS Composites 12.1 9.1
Others <£5m individually 10.5 10.9
Infrastructure Products - RoadsHardstaff Barriers 6.8 6.8
ATA 6.3 6.3
Mallatite 5.6 5.3
Others <£5m individually 4.0 4.0
Galvanizing ServicesFrance Galva SA 29.7 28.8
USA 25.0 27.6
UK 24.8 24.8
124.8 123.6
Goodwill impairment reviews have been carried out at an operating segment level on all cash generating units to which goodwill is allocated.
Impairment tests on the carrying values of goodwill and certain US Galvanizing brand names of £7.5m (2016: £8.2m), which are the Group’s only other indefinite life intangible assets, are performed by analysing the carrying value allocated to each significant cash generating unit against its value in use. All goodwill is allocated to specific cash generating units which are in all cases no larger than operating segments. Value in use is calculated for each cash generating unit as the net present value of that unit’s discounted future cash flows. These cash flows are based on budget cash flow information for a period of one year, and an average growth rate of 3% applied subsequently based on management’s estimate for revenue and associated cost growth. Budgets and strategic plans are prepared taking into account a range of factors including past experience, the forecast future trading environment and macroeconomic conditions in the Group’s key markets. The long-term growth rate assumption reflects the historical long-term growth rates of the developed economies in which the Group principally operates.
These assumptions are applied to all CGU’s with the exception of the France Galva SA CGU, further details of which are set out below.
The calculated headroom between value in use and carrying value of each of the cash generating units with significant amounts of goodwill, together with the pre-tax discount rates applied, is set out below.
2017 2016
Goodwill£m
Headroom£m
Discountrate
Goodwill£m
Headroom£m
Discount rate
US Composites 12.1 40.4 11.3% 9.1 42.8 11.8%
Hardstaff Barriers 6.8 8.9 10.7% 6.8 * *
ATA 6.3 12.2 11.3% 6.3 16.1 12.7%
Mallatite 5.6 22.4 9.8% 5.3 28.2 11.0%
France Galva SA 29.7 21.3 11.3% 28.8 4.1 13.7%
Galvanizing Services - USA 25.0 266.4 10.9% 27.6 233.6 12.1%
Galvanizing Services - UK 24.8 98.5 10.1% 24.8 63.8 11.0%
*Hardstaff Barriers was excluded from this table in the prior year as the CGU was acquired in May 2016.
The pre-tax discount rates detailed above are derived from a market participant’s cost of capital and risk adjusted for individual cash generating units’ circumstances. Similar discount rates are applied in determining the recoverable amounts of other cash generating units.
The Group has applied sensitivities to assess whether any reasonable possible changes in assumptions could cause an impairment that would be material to these Consolidated Financial Statements. The sensitivity analysis did not identify any material impairments with the exception of the goodwill attributed to France Galva SA.

112 Financial Statements
www.hsholdings.com | Stock Code HILS
10. Intangible assets continuedFrance Galva SAThe France Galva SA impairment review was prepared based on the following key assumptions:
› Budgeted cash flows for 2018, which assume a 1% increase in galvanizing volumes compared with 2017, consistent with the recent growth trends and the gradual improvement in economic conditions in France.
› For the period 2019-2022 the calculations assume annual growth in galvanizing volumes of 1%. This assumption is considered appropriate as, in the Group’s experience, galvanizing volumes are closely linked to growth in activity in industrial markets, itself closely linked to country GDP growth. The current GDP growth projections for France issued by the IMF exceed 1%.
› For the period from 2023 onwards the calculations assume annual growth in cash flows of 3%, consistent with the historical long-term growth rates in France.
› A discount rate of 11.3%.
Galvanizing volumes, future cash flows and the discount rate are the key assumptions on which the goodwill impairment review is most sensitive. The following table summarises the impacts on calculated headroom of changes in each of these key assumptions:
Input Sensitivity applied Sensitised headroom £mChange in 2018 volumes -5% 4.5Volume growth 2019-2022 0% 9.9Cash flow growth 2023 onwards 1% 4.2Change in discount rate +1% 8.8
11. Property, plant and equipmentLand and buildings £m Plant, machinery and vehicles £m Total £m
CostAt 1 January 2016 83.0 160.2 243.2Exchange adjustments 12.3 11.4 23.7Acquisitions 4.5 2.4 6.9Additions 4.7 15.7 20.4Reclassification 0.8 (0.8) -Transfers to assets held for sale (1.9) - (1.9)Disposals (2.4) (8.5) (10.9)At 31 December 2016 101.0 180.4 281.4Exchange adjustments (3.5) (2.9) (6.4)Acquisitions - 1.4 1.4Additions 4.9 13.8 18.7Reclassification 0.1 (0.1) -Disposal of subsidiary - (0.3) (0.3)Disposals (1.5) (5.5) (7.0)At 31 December 2017 101.0 186.8 287.8Depreciation and impairment lossesAt 1 January 2016 20.1 93.9 114.0Exchange adjustments 3.3 5.4 8.7Disposals (0.7) (6.8) (7.5)Reclassification 0.7 (0.7) -Transfers to assets held for sale (0.8) - (0.8)Charge for the year 3.5 13.8 17.3At 31 December 2016 26.1 105.6 131.7Exchange adjustments (0.5) (1.6) (2.1)Disposals (0.5) (4.3) (4.8)Disposal of subsidiary - (0.3) (0.3)Charge for the year 3.9 14.3 18.2At 31 December 2017 29.0 113.7 142.7Carrying valuesAt 1 January 2016 62.9 66.3 129.2At 31 December 2016 74.9 74.8 149.7At 31 December 2017 72.0 73.1 145.1
The gross book value of land and buildings includes freehold land of £18.4m (2016: £18.6m). Included in the carrying value of plant, machinery and vehicles is £nil (2016: £nil) in respect of assets held under finance lease and hire purchase contracts. Included within plant, machinery and vehicles are assets held for hire with a cost of £40.1m (2016: £40.4m) and accumulated depreciation of £27.5m (2016: £25.2m).
Notes to the Consolidated Financial Statements (continued)

Financial Statements
www.hsholdings.com | Stock Code HILS
113
12. Assets held for sale
2017£m
2016£m
Land and buildings 0.7 1.1
During the year, an impairment charge of £0.4m has been recorded reflecting a reduction in the expected realisable value of the property.
13. Deferred taxationIntangible
assets£m
Property, plantand equipment
£mInventories
£m
Retirementobligation
£m
Other timingdifferences
£mTotal
£m
At 1 January 2016 (7.0) (6.1) 1.2 3.2 0.8 (7.9)
Exchange adjustments (0.9) (1.2) - 0.2 0.5 (1.4)
Acquisitions of businesses (3.0) (0.3) - - 0.1 (3.2)
Credited/(charged) for the year in the Consolidated Income Statement (note 7) 1.1 1.1 (0.3) (0.2) 0.5 2.2
Credited for the year in the Consolidated Statement of Comprehensive Income (note 7) - - - 2.1 - 2.1
Credited for the year in the Consolidated Statement of Changes in Equity (note 7) - - - - 0.4 0.4
At 31 December 2016 (9.8) (6.5) 0.9 5.3 2.3 (7.8)Exchange adjustments 0.3 0.2 - (0.1) (0.1) 0.3Acquisitions of businesses (0.5) 0.1 0.3 - - (0.1)Disposal of subsidiary 0.1 - - - - 0.1Credited /(charged) for the year in the Consolidated Income Statement (note 7) 2.0 1.3 (1.0) (0.3) (0.1) 1.9Charged for the year in the Consolidated Statement of Comprehensive Income (note 7) - - - (0.2) - (0.2)Credited for the year in the Consolidated Statement of Changes in Equity (note 7) - - - - 0.2 0.2At 31 December 2017 (7.9) (4.9) 0.2 4.7 2.3 (5.6)
2017£m
2016£m
Deferred tax assets 0.9 0.1
Deferred tax liabilities (6.5) (7.9)
Deferred tax liability (5.6) (7.8)
No deferred tax asset has been recognised in respect of tax losses of £10.5m (2016: £10.9m) as their future use is uncertain. There is no time limit on the carrying forward of the losses.
The UK Budget on 16 March 2016 included a rate reduction to 17% from 1 April 2020 which was enacted during the prior year. The deferred tax balance in respect of UK entities has therefore been calculated at 17% (2016: 17%) on the basis that these balances will materially reverse after 1 April 2020. A reduction in the French corporation tax rate to 25% by 2022 was enacted in December 2017. The deferred tax balance in respect of French entities has therefore been mainly calculated at 25% (2016: 28%) on the basis that the majority of the balances will reverse after 2022. On 22 December 2017 there was a significant change in the US tax legislation, which included a reduction in the main rate of corporation tax from 35% to 21% with effect from 1 January 2018. The deferred tax balance in relation to US entities has therefore been restated to reflect this reduction in the tax rate.
14. Inventories2017
£m 2016
£m Raw materials and consumables 44.1 38.2Work in progress 9.2 8.4Finished goods and goods for resale 31.3 25.0
84.6 71.6
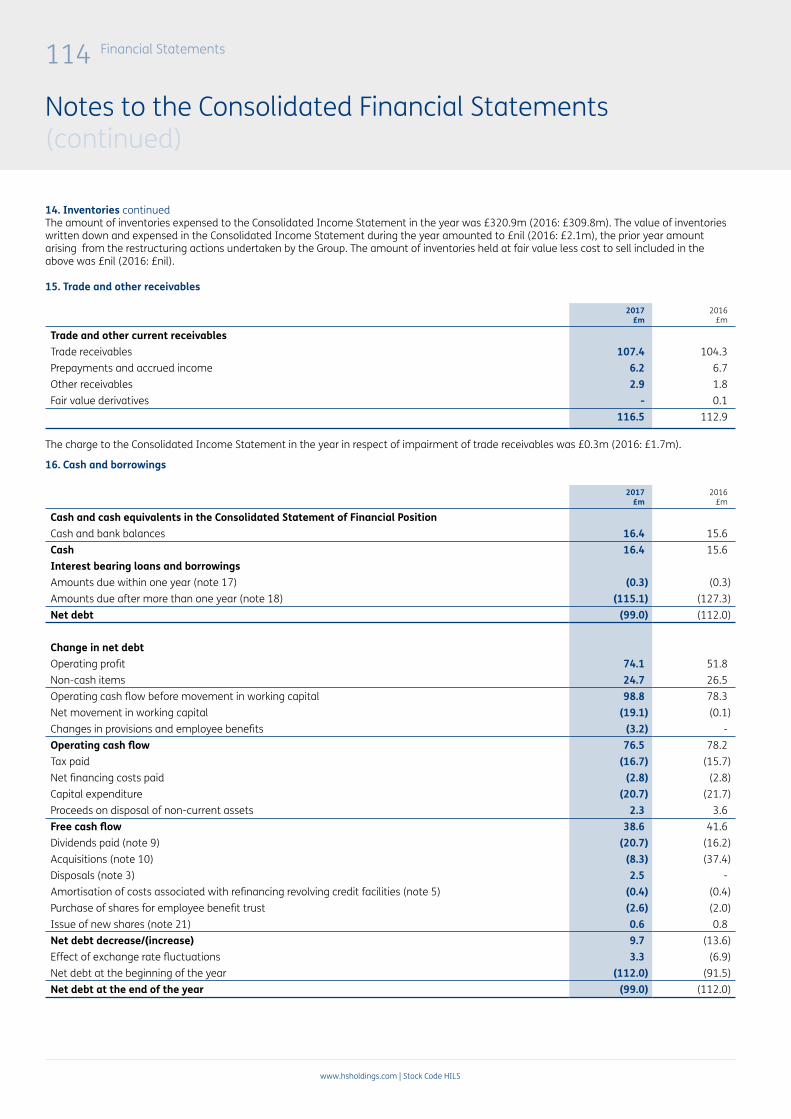
114 Financial Statements
www.hsholdings.com | Stock Code HILS
14. Inventories continuedThe amount of inventories expensed to the Consolidated Income Statement in the year was £320.9m (2016: £309.8m). The value of inventories written down and expensed in the Consolidated Income Statement during the year amounted to £nil (2016: £2.1m), the prior year amount arising from the restructuring actions undertaken by the Group. The amount of inventories held at fair value less cost to sell included in the above was £nil (2016: £nil).
15. Trade and other receivables
2017£m
2016 £m
Trade and other current receivablesTrade receivables 107.4 104.3Prepayments and accrued income 6.2 6.7Other receivables 2.9 1.8Fair value derivatives - 0.1
116.5 112.9
The charge to the Consolidated Income Statement in the year in respect of impairment of trade receivables was £0.3m (2016: £1.7m).
16. Cash and borrowings
2017£m
2016 £m
Cash and cash equivalents in the Consolidated Statement of Financial PositionCash and bank balances 16.4 15.6Cash 16.4 15.6Interest bearing loans and borrowingsAmounts due within one year (note 17) (0.3) (0.3)Amounts due after more than one year (note 18) (115.1) (127.3)Net debt (99.0) (112.0)
Change in net debtOperating profit 74.1 51.8Non-cash items 24.7 26.5Operating cash flow before movement in working capital 98.8 78.3Net movement in working capital (19.1) (0.1)Changes in provisions and employee benefits (3.2) -Operating cash flow 76.5 78.2Tax paid (16.7) (15.7)Net financing costs paid (2.8) (2.8)Capital expenditure (20.7) (21.7)Proceeds on disposal of non-current assets 2.3 3.6Free cash flow 38.6 41.6Dividends paid (note 9) (20.7) (16.2)Acquisitions (note 10) (8.3) (37.4)Disposals (note 3) 2.5 -Amortisation of costs associated with refinancing revolving credit facilities (note 5) (0.4) (0.4)Purchase of shares for employee benefit trust (2.6) (2.0)Issue of new shares (note 21) 0.6 0.8Net debt decrease/(increase) 9.7 (13.6)Effect of exchange rate fluctuations 3.3 (6.9)Net debt at the beginning of the year (112.0) (91.5)Net debt at the end of the year (99.0) (112.0)
Notes to the Consolidated Financial Statements (continued)

Financial Statements
www.hsholdings.com | Stock Code HILS
115
16. Cash and borrowings continued
Reconciliation of movements in financial liabilities to cash flows arising from financing activities
2017£m
2016 £m
Interest bearing loans and borrowingsAt 1 January 127.6 104.4
New loans and borrowings 32.9 46.1Repayments of loans and borrowings (41.3) (31.7)Costs associated with refinancing of revolving credit facility - (1.0)Cash flows from financing activities (8.4) 13.4Other changesEffect of exchange rate fluctuations (4.2) 9.4Amortisation of costs associated with refinancing of revolving credit facility 0.4 0.4At 31 December 115.4 127.6
17. Current liabilities2017
£m 2016
£m
Interest bearing loans and borrowingsCurrent portion of long term borrowings 0.3 0.3Finance lease and hire purchase obligations - -
0.3 0.3Trade and other current liabilitiesTrade payables 59.5 59.1Other taxation and social security 10.8 10.8Accrued expenses and deferred income 29.0 27.8Fair value derivatives 0.1 -Other payables 5.4 7.4
104.8 105.1
18. Non-current liabilities2017
£m 2016
£m
Interest bearing loans and borrowingsLong term borrowings 115.1 127.3Finance lease and hire purchase obligations - -
115.1 127.3Other non-current liabilitiesDeferred government grants 0.5 0.4
The unsecured bank borrowings carry a rate of interest of 1.05% above LIBOR/EURIBOR/US LIBOR subject to a ratchet as defined in the facility agreement. In the USA, borrowings that are not fixed carry a rate of interest of US LIBOR +1.5% and are secured against substantially all of the assets of V&S LLC and its subsidiaries. Obligations under finance leases and hire purchase obligations are secured on the relevant assets.
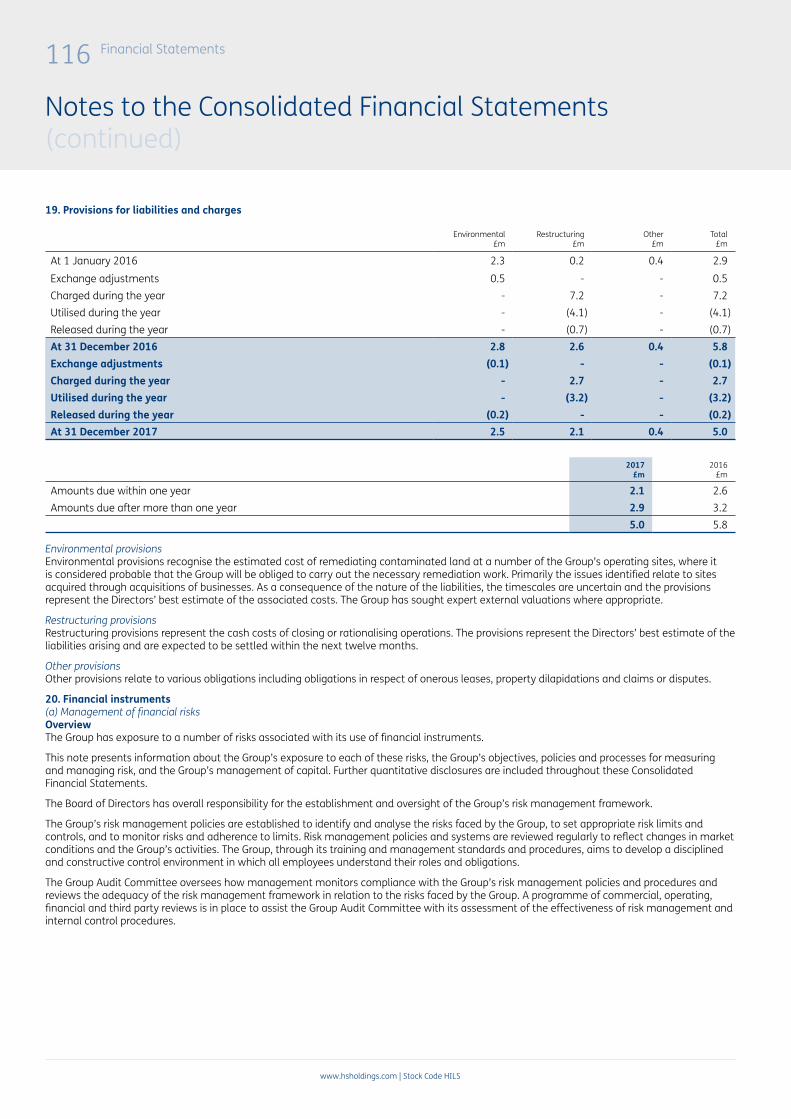
116 Financial Statements
www.hsholdings.com | Stock Code HILS
19. Provisions for liabilities and charges
Environmental£m
Restructuring£m
Other£m
Total£m
At 1 January 2016 2.3 0.2 0.4 2.9
Exchange adjustments 0.5 - - 0.5Charged during the year - 7.2 - 7.2Utilised during the year - (4.1) - (4.1)Released during the year - (0.7) - (0.7)At 31 December 2016 2.8 2.6 0.4 5.8Exchange adjustments (0.1) - - (0.1)Charged during the year - 2.7 - 2.7Utilised during the year - (3.2) - (3.2)Released during the year (0.2) - - (0.2)At 31 December 2017 2.5 2.1 0.4 5.0
2017£m
2016 £m
Amounts due within one year 2.1 2.6Amounts due after more than one year 2.9 3.2
5.0 5.8
Environmental provisionsEnvironmental provisions recognise the estimated cost of remediating contaminated land at a number of the Group’s operating sites, where it is considered probable that the Group will be obliged to carry out the necessary remediation work. Primarily the issues identified relate to sites acquired through acquisitions of businesses. As a consequence of the nature of the liabilities, the timescales are uncertain and the provisions represent the Directors’ best estimate of the associated costs. The Group has sought expert external valuations where appropriate.
Restructuring provisionsRestructuring provisions represent the cash costs of closing or rationalising operations. The provisions represent the Directors’ best estimate of the liabilities arising and are expected to be settled within the next twelve months.
Other provisionsOther provisions relate to various obligations including obligations in respect of onerous leases, property dilapidations and claims or disputes.
20. Financial instruments (a) Management of financial risks OverviewThe Group has exposure to a number of risks associated with its use of financial instruments.
This note presents information about the Group’s exposure to each of these risks, the Group’s objectives, policies and processes for measuring and managing risk, and the Group’s management of capital. Further quantitative disclosures are included throughout these Consolidated Financial Statements.
The Board of Directors has overall responsibility for the establishment and oversight of the Group’s risk management framework.
The Group’s risk management policies are established to identify and analyse the risks faced by the Group, to set appropriate risk limits and controls, and to monitor risks and adherence to limits. Risk management policies and systems are reviewed regularly to reflect changes in market conditions and the Group’s activities. The Group, through its training and management standards and procedures, aims to develop a disciplined and constructive control environment in which all employees understand their roles and obligations.
The Group Audit Committee oversees how management monitors compliance with the Group’s risk management policies and procedures and reviews the adequacy of the risk management framework in relation to the risks faced by the Group. A programme of commercial, operating, financial and third party reviews is in place to assist the Group Audit Committee with its assessment of the effectiveness of risk management and internal control procedures.
Notes to the Consolidated Financial Statements (continued)

Financial Statements
www.hsholdings.com | Stock Code HILS
117
20. Financial instruments continuedCredit riskCredit risk is the risk of financial loss to the Group if a customer or counterparty to a financial instrument fails to meet its contractual obligations, and arises from cash and cash equivalents, derivative financial instruments and principally from the Group’s receivables from customers. The maximum exposure to credit risk for receivables and other financial assets is represented by their carrying amount.
It is the Group’s policy to insure a substantial part of the Group’s trade receivables. Any residual risk is spread across a significant number of customers. As such the impairment losses are not significant. Purchase limits are established for each customer, which represent the maximum open amount without requiring approval from the Board and are reviewed regularly. Customers that fail to meet the Group’s benchmark creditworthiness may transact with the Group only on a prepayment basis. The Group’s UK companies represent the majority of the trade receivable at 31 December 2017 with 56% (2016: 57%) and currently the only geographical region that does not generally insure trade receivables is North America, which represents 23% (2016: 21%) of the Group’s trade receivables. Subsidiaries in North America have a policy of taking out trade references before granting credit limits and selectively insuring where it is deemed necessary by management.
Liquidity riskLiquidity risk is the risk that the Group will not be able to meet its financial obligations as they fall due. The Group’s approach to managing liquidity is to ensure, as far as possible, that it will always have sufficient liquidity to meet its liabilities when due, under both normal and stressed conditions, without incurring unacceptable losses or risking damage to the Group’s reputation.
It is the Group’s policy to minimise its liquidity risk in terms of limiting the amounts of borrowings maturing within the next 12 months. As at 31 December 2017 all such debt was covered by cash and cash equivalents netting to £16.1m positive current liquidity (2016: £15.3m).
The Group’s principal UK revolving credit facility is a multicurrency agreement with a maturity date of April 2021 and a value at 31 December 2017 of £225.5m (2016: £232.3m), based on year end exchange rates. Along with various other on demand lines of credit, including bank overdrafts and finance leases, the Group has access to facilities of £237.3m (2016: £247.1m).
Market riskMarket risk is the risk that changes in market prices, such as foreign exchange rates, interest rates and commodity prices will affect the Group’s income or the value of its holdings of financial instruments. The objective of market risk management is to manage and control market risk exposures within acceptable parameters, while optimising the return on risk. The Group buys and sells derivatives in the ordinary course of business, and also incurs financial liabilities, in order to manage market risks. All such transactions are carried out within the guidelines set by the Board.
Counterparty riskA group of relationship banks provides the bulk of the banking services, with pre-approved credit limits set for each institution. Financial derivatives are entered into with these core banks and the underlying credit exposure to these instruments is included when considering the credit exposure to the counterparties. At the end of 2017 credit exposure including cash deposited did not exceed £4.8m with any single institution (2016: £3.6m).
Currency riskThe Group publishes its Consolidated Financial Statements in Sterling, but conducts business in several foreign currencies, including significant operations based in Continental Europe and North America. This results in foreign currency exchange risk due to exchange rate movements which will affect the Group’s transaction costs and the translation of the results and net assets of its foreign operations.
The trading currency of each operation is predominantly in the same denomination, however, the Group uses forward exchange contracts to hedge the majority of exposures that do exist. The Group does not apply hedge accounting to these derivative financial instruments.
The Group has hedged its investment in US and European operations by way of financing the acquisitions through like denominations of its multi-currency banking facility. The Group’s investments in other subsidiaries are not hedged because fluctuations on translation of their assets into Sterling are not significant to the Group.
Interest rate riskThe Group adopts interest rate swaps when engaging in long-term specific investments or contracts in order to more reliably assess the financial implications of these procurements. However, the Group currently feels that using fixed interest rates for short-term day-to-day trading is not appropriate.
The Group’s policy is to enter into interest rate swaps in order to fix interest rates on up to 40% of its outstanding gross borrowings. At 31 December 2017 the proportion of gross borrowings subject to fixed interest rate swaps was 0% (2016: 0%).
InsuranceThe Group purchases insurance for commercial, legal and contractual reasons. The Group retains insurable risk where external insurance is not commercially viable.

118 Financial Statements
www.hsholdings.com | Stock Code HILS
20. Financial instruments continuedCapital managementThe Board maintains a strong capital base so as to maintain investor, creditor and market confidence and to sustain future development of the business. The Board monitors both the demographic spread of shareholders, as well as the return on capital, which the Group defines as total shareholders’ equity and the level of dividends to ordinary shareholders.
The Board seeks to maintain a balance between the higher returns that might be possible with higher levels of borrowings and the advantages and security afforded by a sound capital position.
There are financial covenants associated with the Group’s borrowings, which are interest cover and EBITDA to net debt. The Group comfortably complied with these covenants in 2017 and 2016, as set out in the Operational and Financial Review on page 20.
There were no changes in the Group’s approach to capital management during the year.
(b) Total financial assets and liabilitiesThe table below sets out the Group’s accounting classification of its financial assets and liabilities and their fair values as at 31 December. The fair values of all financial assets and liabilities are not materially different to the carrying values.
Designated at fair value£m
Amortised cost£m
Total carrying value£m
Fair value£m
Cash and cash equivalents - 16.4 16.4 16.4Interest bearing loans due within one year - (0.3) (0.3) (0.3)Interest bearing loans due after more than one year - (115.1) (115.1) (115.1)Derivative assets - - - -Derivative liabilities (0.1) - (0.1) (0.1)Other assets - 110.3 110.3 110.3Other liabilities - (93.9) (93.9) (93.9)Total at 31 December 2017 (0.1) (82.6) (82.7) (82.7)
Cash and cash equivalents - 15.6 15.6 15.6Interest bearing loans due within one year - (0.3) (0.3) (0.3)Interest bearing loans due after more than one year - (127.3) (127.3) (127.3)Derivative assets 0.1 - 0.1 0.1Derivative liabilities - - - -Other assets - 106.1 106.1 106.1Other liabilities - (94.3) (94.3) (94.3)Total at 31 December 2016 0.1 (100.2) (100.1) (100.1)
Fair value hierarchyThe table below analyses financial instruments carried at fair value, by valuation method. The different levels have been defined as follows:
› Level 1: unadjusted quoted prices in active markets for identical assets or liabilities.
› Level 2: inputs other than quoted prices included within Level 1 that are observable for the asset or liability, either as a direct price or indirectly derived from prices.
› Level 3: inputs for the asset or liability that are not based on observable market data.
Level 1£m
Level 2£m
Level 3£m
Total£m
Derivative financial assets - - - -Derivative financial liabilities - (0.1) - (0.1)Total at 31 December 2017 - (0.1) - (0.1)Derivative financial assets - 0.1 - 0.1Derivative financial liabilities - - - -Total at 31 December 2016 - 0.1 - 0.1
Notes to the Consolidated Financial Statements (continued)

Financial Statements
www.hsholdings.com | Stock Code HILS
119
20. Financial instruments continued
At 31 December 2017 the Group did not have any liabilities classified at Level 1 or Level 3 in the fair value hierarchy. There have been no transfers in any direction in the year.
The Group’s financial assets, excluding short term receivables, consist mainly of cash and call deposit accounts.
Where cash surpluses arise in the short term, interest is earned based on a floating rate related to bank base rate or LIBOR/EURIBOR/US LIBOR. Where the Group’s funding requirements allow longer term investment of surplus cash, management will review available options to obtain the best possible return whilst maintaining an appropriate degree of access to the funds.
The Group’s financial liabilities, excluding short term creditors, are set out below. Fixed rate financial liabilities comprise Sterling denominated finance leases. Floating rate financial liabilities comprise Sterling, Euro and US Dollar bank loans and overdrafts, and Sterling finance leases and hire purchase agreements. The floating rate financial liabilities bear interest at rates related to bank base rates or LIBOR/EURIBOR/US LIBOR.
Each subsidiary has financial assets and liabilities which are predominantly in the same denomination as that subsidiary’s functional currency. Excluding the UK Parent Company, the financial assets and liabilities not denominated in the functional currency of these entities are insignificant to the Group.
The UK Parent Company and certain of its UK subsidiaries hold Euro £10.7m (2016: £11.1m) and US Dollar £49.6m (2016: £53.6m) denominated interest bearing loans, which are predominantly used to fund the Group’s European and United States operations and include £60.3m (2016: £64.7m) designated as a hedge of the net investment in a foreign operation. The foreign currency gain of £4.9m (2016: loss of £9.5m) for the effective portion was recognised directly in equity netted against exchange differences on translation of foreign operations. Any ineffective portion recognised in the Consolidated Income Statement is insignificant.
Fixed rate financial liabilitiesWeighted average
interest rate%
Weighted average period forwhich rate is fixed
Years
Sterling at 31 December 2017 6.5 1.1Sterling at 31 December 2016 6.2 1.7
(c) Maturity profile The table below sets out the contractual cash flows associated with the Group’s financial liabilities, including estimated interest payments, analysed by maturity:
Carryingamounts
£m
Contractualcash flows
£m
Due withinone year
£m
Due betweenone and
two years£m
Due betweentwo and
five years£m
Due aftermore thanfive years
£m
Secured bank borrowings 2.0 (2.0) (0.3) (0.3) (1.1) (0.3)Unsecured bank borrowings 113.4 (121.2) (2.2) (2.2) (116.6) (0.2)Finance lease obligations - - - - - -Other liabilities 93.9 (93.9) (93.9) - - -Derivative liabilities 0.1 (0.1) (0.1) - - -Total at 31 December 2017 209.4 (217.2) (96.5) (2.5) (117.7) (0.5)Secured bank borrowings 2.5 (2.5) (0.3) (0.3) (1.6) (0.3)
Unsecured bank borrowings 125.1 (130.9) (1.9) (1.9) (127.1) -
Finance lease obligations - - - - - -
Other liabilities 94.3 (94.3) (94.3) - - -
Derivative liabilities - - - - - -
Total at 31 December 2016 221.9 (227.7) (96.5) (2.2) (128.7) (0.3)
The Group had the following undrawn committed facilities at 31 December, in respect of which all conditions precedent had been met:
2017£m
2016 £m
Undrawn committed borrowing facilitiesExpiring after more than one year 111.4 105.8

120 Financial Statements
www.hsholdings.com | Stock Code HILS
20. Financial instruments continued(d) Fair valuesThe gain in the prior year on the interest rate swaps held by the UK Group was £0.2m which was recognised in the Statement of Comprehensive Income as these instruments were accounted for as cash flow hedges. Any ineffective portion of these hedges was taken to the Consolidated Income Statement and was insignificant. The fair value of forward currency exchange contracts realised in the Consolidated Income Statement as part of fair value derivatives amounted to £nil (2016: nil). The fair values of the Group’s other financial instruments at 31 December 2017 and 2016 were not materially different to their carrying value. Fair values were calculated using market rates where available, otherwise cash flows were discounted at prevailing rates.
Impairment charges of £0.4m were recognised in respect of the asset held for sale, as detailed in note 12. In the prior year, impairment charges of £4.1m were recognised in respect of the carrying values of non-current assets.
(e) Credit riskExposure to credit riskThe exposure to credit risk is substantially mitigated by the credit insurance employed by the Group. In the absence of this insurance the maximum credit exposure on the carrying value of financial assets at the reporting date was:
Carrying amount
2017£m
2016 £m
Loans and receivables 110.3 106.1Cash at the end of the year 16.4 15.6Total 126.7 121.7
At the reporting date the maximum exposure to credit risk for trade receivables, ignoring credit insurance was:
Carrying value of trade receivables by geography2017
£m 2016
£m
UK 60.2 59.7Rest of Europe 19.0 16.3North America 24.3 21.9Rest of World 3.9 6.4Total 107.4 104.3
Carrying value of trade receivables by business segment2017
£m 2016
£m
Infrastructure Products - Utilities 32.3 33.2Infrastructure Products - Roads 43.1 41.6Infrastructure Products - Total 75.4 74.8Galvanizing Services 32.0 29.5Total 107.4 104.3
Notes to the Consolidated Financial Statements (continued)

Financial Statements
www.hsholdings.com | Stock Code HILS
121
20. Financial instruments continued
Impairment lossesThe Group maintains a substantial level of credit insurance covering the majority of its trade receivables which mitigates against possible impairment losses, therefore such impairment losses are not significant.
The ageing of trade receivables at the reporting date was:2017 2016
Gross£m
Provisions£m
Net£m
Gross£m
Provisions£m
Net£m
Not past due 76.7 (0.1) 76.6 75.3 (0.1) 75.2Past due 1–30 days 20.2 - 20.2 20.7 - 20.7Past due 31–120 days 8.6 (0.3) 8.3 7.0 (0.2) 6.8Past due more than 120 days 4.7 (2.4) 2.3 4.8 (3.2) 1.6Total 110.2 (2.8) 107.4 107.8 (3.5) 104.3
The movements in provisions for impairment of trade receivables are as follows:
£m
At 1 January 2016 2.8Exchange adjustments 0.2Acquisitions of subsidiaries 0.3Charged in the year 1.7Utilised during the year (1.5)At 31 December 2016 3.5Exchange adjustments (0.1)Acquisitions of subsidiaries -Charged in the year 0.3Utilised during the year (0.9)At 31 December 2017 2.8
(f) Sensitivity analysisIn managing interest rate and currency risks the Group aims to reduce the impact of short term fluctuations on the Group’s earnings. Over the longer term, however, permanent changes in foreign exchange and interest rates may have an impact on consolidated earnings. At the end of the reporting periods, the effects of hypothetical changes in interest and currency rates are as follows:
› Based on average month end net debt balances, if interest rates had varied throughout the year by 1% the positive or negative variation on the year’s result would have been £1.4m (2016: £1.4m), which would directly impact on the Consolidated Income Statement.
› Based on a 10% weakening in Sterling against all currencies throughout the year, the impact on the Consolidated Income Statement would have been a gain of £3.9m (2016: £3.4m) and the impact on equity would have been a gain of £19.3m (2016: £18.9m).
› Based on a 10% strengthening in Sterling against all currencies throughout the year, the impact on the Consolidated Income Statement would have been a loss of £3.2m (2016: £2.8m) and the impact on equity would have been a loss of £16.4m (2016: £15.5m).

122 Financial Statements
www.hsholdings.com | Stock Code HILS
21. Called up share capital2017
£m 2016
£m
Allotted, called up and fully paid78.7m ordinary shares of 25p each (2016: 78.5m) 19.7 19.7
In 2017 the Company issued 0.2m shares under its various share option schemes (2016: 0.3m), realising £0.6m (2016: £0.8m).
Options outstanding over the Company’s shares
Numberof shares
2017Option
price (p)Number
of shares
2016Option
price (p) Date first exercisable Expiry date
2014 LTIP Award (granted May 2017)*¥ 103,925 - - - § §2014 LTIP Award (granted March 2016)* 116,563 - 116,563 - § §2014 LTIP Award (granted March 2015)* 153,290 - 153,290 - § §2014 LTIP Award (granted May 2014)*¥ - - 186,121 - § §2007 grant of 2005 Approved Executive Share Option Scheme (granted April 2007)* - - 17,146 350 13 April 2010 13 April 20172007 grant of 2005 Unapproved Executive Share Option Scheme (granted April 2007)* - - 2,854 350 13 April 2010 13 April 20172012 grant of 2005 Approved Executive Share Option Scheme (granted April 2012)* 3,586 316 3,586 316 19 April 2015 19 April 20222012 grant of 2005 Unapproved Executive Share Option Scheme (granted April 2012)* 10,514 316 10,514 316 19 April 2015 19 April 20222015 grant of 2014 Approved Executive Share Option Scheme (granted August 2015)* 126,991 685 126,991 685 12 August 2018 12 August 20252015 grant of 2014 Unapproved Executive Share Option Scheme (granted August 2015)* 238,009 685 238,009 685 12 August 2018 12 August 20252013 grant of 2005 Savings Related Share Option Scheme (granted April 2013)*† 216,920 355 233,904 355 1 June 2018 1 December 20182014 grant of 2014 Savings Related Share Option Scheme (granted July 2014)*† 1,257 429 125,291 429 1 August 2017 1 February 20182014 grant of 2014 Savings Related Share Option Scheme (granted July 2014)*† 122,557 429 124,793 429 1 August 2019 1 February 20202015 grant of 2014 Savings Related Share Option Scheme (granted October 2015)*† 145,821 560 153,526 560 1 January 2019 1 July 20192015 grant of 2014 Savings Related Share Option Scheme (granted October 2015)*† 140,807 560 144,929 560 1 January 2021 1 July 20212016 grant of 2014 Savings Related Share Option Scheme (granted October 2016)*† 117,543 963 133,959 963 1 January 2020 1 July 20202016 grant of 2014 Savings Related Share Option Scheme (granted October 2016)*† 60,328 963 71,283 963 1 January 2022 1 July 20222017 grant of 2014 Savings Related Share Option Scheme (granted October 2017)*† 123,784 1,021 - - 1 January 2021 1 July 20212017 grant of 2014 Savings Related Share Option Scheme (granted October 2017)*† 54,879 1,021 - - 1 January 2023 1 July 2023Outstanding at the end of the year 1,736,774 1,842,759Exercisable at the year end 15,357 34,100Not exercisable at the year end 1,721,417 1,808,659Outstanding at the end of the year 1,736,774 1,842,759
* Subject to share-based payments under IFRS2 (see below).
† Options may be exercised early under the terms of this scheme if employees meet the criteria of ‘good leaver’, which encompasses circumstances such as retirement or redundancy.
§ Awards lapse on the earlier of the award holder ceasing their employment or the applicable performance conditions not being met. The earliest possible date for award is 1 January 2018 for the 2015 grant, 1 January 2019 for the 2016 grant and 1 January 2020 for the 2017 grant.
¥ The 2014 LTIP award granted in May 2014 includes 16,113 shares under the Group’s 2014 Executive Share Option Scheme that may be awarded to participants in the Long-Term Incentive Plan. Similarly, the 2017 LTIP award granted in May 2017 includes 6,843 shares under the Group’s 2014 Executive Share Option Scheme.
The remaining weighted average life of the outstanding share options is 3 years 3 months (2016: 3 years 6 months).
Notes to the Consolidated Financial Statements (continued)
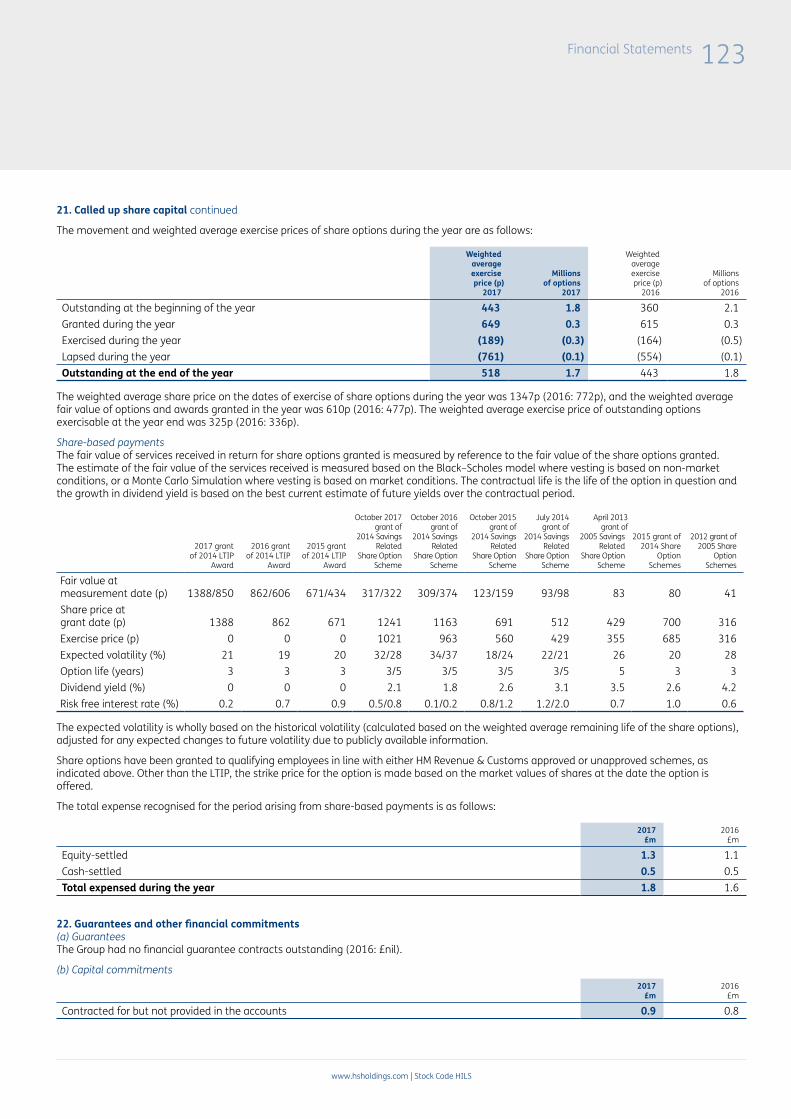
Financial Statements
www.hsholdings.com | Stock Code HILS
123
21. Called up share capital continued
The movement and weighted average exercise prices of share options during the year are as follows:
Weightedaverageexerciseprice (p)
2017
Millionsof options
2017
Weightedaverageexerciseprice (p)
2016
Millionsof options
2016
Outstanding at the beginning of the year 443 1.8 360 2.1Granted during the year 649 0.3 615 0.3Exercised during the year (189) (0.3) (164) (0.5)Lapsed during the year (761) (0.1) (554) (0.1)Outstanding at the end of the year 518 1.7 443 1.8
The weighted average share price on the dates of exercise of share options during the year was 1347p (2016: 772p), and the weighted average fair value of options and awards granted in the year was 610p (2016: 477p). The weighted average exercise price of outstanding options exercisable at the year end was 325p (2016: 336p).
Share-based paymentsThe fair value of services received in return for share options granted is measured by reference to the fair value of the share options granted. The estimate of the fair value of the services received is measured based on the Black–Scholes model where vesting is based on non-market conditions, or a Monte Carlo Simulation where vesting is based on market conditions. The contractual life is the life of the option in question and the growth in dividend yield is based on the best current estimate of future yields over the contractual period.
2017 grantof 2014 LTIP
Award
2016 grantof 2014 LTIP
Award
2015 grantof 2014 LTIP
Award
October 2017 grant of
2014 SavingsRelated
Share OptionScheme
October 2016 grant of
2014 SavingsRelated
Share OptionScheme
October 2015 grant of
2014 Savings Related
Share Option Scheme
July 2014 grant of
2014 SavingsRelated
Share OptionScheme
April 2013 grant of
2005 SavingsRelated
Share OptionScheme
2015 grant of 2014 Share
OptionSchemes
2012 grant of2005 Share
OptionSchemes
Fair value at measurement date (p) 1388/850 862/606 671/434 317/322 309/374 123/159 93/98 83 80 41Share price at grant date (p) 1388 862 671 1241 1163 691 512 429 700 316Exercise price (p) 0 0 0 1021 963 560 429 355 685 316Expected volatility (%) 21 19 20 32/28 34/37 18/24 22/21 26 20 28Option life (years) 3 3 3 3/5 3/5 3/5 3/5 5 3 3Dividend yield (%) 0 0 0 2.1 1.8 2.6 3.1 3.5 2.6 4.2Risk free interest rate (%) 0.2 0.7 0.9 0.5/0.8 0.1/0.2 0.8/1.2 1.2/2.0 0.7 1.0 0.6
The expected volatility is wholly based on the historical volatility (calculated based on the weighted average remaining life of the share options), adjusted for any expected changes to future volatility due to publicly available information.
Share options have been granted to qualifying employees in line with either HM Revenue & Customs approved or unapproved schemes, as indicated above. Other than the LTIP, the strike price for the option is made based on the market values of shares at the date the option is offered.
The total expense recognised for the period arising from share-based payments is as follows:
2017£m
2016£m
Equity-settled 1.3 1.1Cash-settled 0.5 0.5Total expensed during the year 1.8 1.6
22. Guarantees and other financial commitments(a) GuaranteesThe Group had no financial guarantee contracts outstanding (2016: £nil).
(b) Capital commitments2017
£m 2016
£m
Contracted for but not provided in the accounts 0.9 0.8
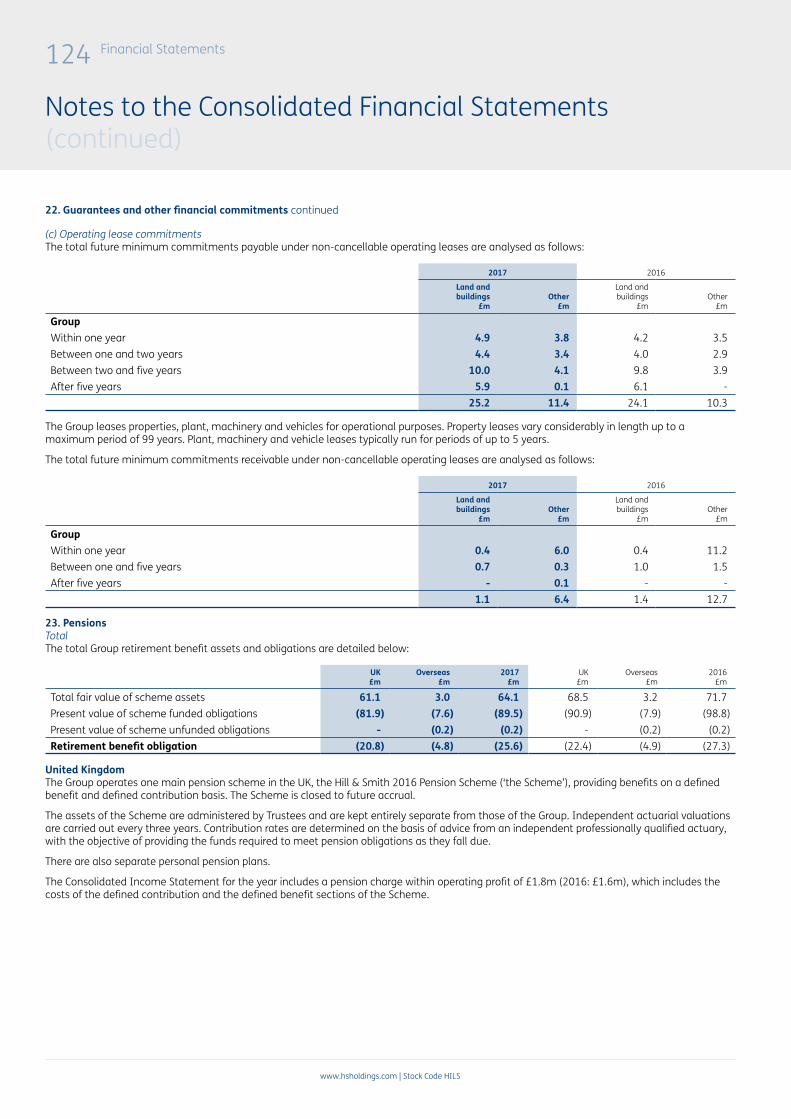
124 Financial Statements
www.hsholdings.com | Stock Code HILS
22. Guarantees and other financial commitments continued
(c) Operating lease commitmentsThe total future minimum commitments payable under non-cancellable operating leases are analysed as follows:
2017 2016
Land andbuildings
£mOther
£m
Land andbuildings
£mOther
£m
GroupWithin one year 4.9 3.8 4.2 3.5Between one and two years 4.4 3.4 4.0 2.9Between two and five years 10.0 4.1 9.8 3.9After five years 5.9 0.1 6.1 -
25.2 11.4 24.1 10.3
The Group leases properties, plant, machinery and vehicles for operational purposes. Property leases vary considerably in length up to a maximum period of 99 years. Plant, machinery and vehicle leases typically run for periods of up to 5 years.
The total future minimum commitments receivable under non-cancellable operating leases are analysed as follows:
2017 2016
Land andbuildings
£mOther
£m
Land andbuildings
£mOther
£m
GroupWithin one year 0.4 6.0 0.4 11.2Between one and five years 0.7 0.3 1.0 1.5After five years - 0.1 - -
1.1 6.4 1.4 12.7
23. PensionsTotalThe total Group retirement benefit assets and obligations are detailed below:
UK£m
Overseas£m
2017£m
UK£m
Overseas£m
2016£m
Total fair value of scheme assets 61.1 3.0 64.1 68.5 3.2 71.7Present value of scheme funded obligations (81.9) (7.6) (89.5) (90.9) (7.9) (98.8)Present value of scheme unfunded obligations - (0.2) (0.2) - (0.2) (0.2)Retirement benefit obligation (20.8) (4.8) (25.6) (22.4) (4.9) (27.3)
United KingdomThe Group operates one main pension scheme in the UK, the Hill & Smith 2016 Pension Scheme (‘the Scheme’), providing benefits on a defined benefit and defined contribution basis. The Scheme is closed to future accrual.
The assets of the Scheme are administered by Trustees and are kept entirely separate from those of the Group. Independent actuarial valuations are carried out every three years. Contribution rates are determined on the basis of advice from an independent professionally qualified actuary, with the objective of providing the funds required to meet pension obligations as they fall due.
There are also separate personal pension plans.
The Consolidated Income Statement for the year includes a pension charge within operating profit of £1.8m (2016: £1.6m), which includes the costs of the defined contribution and the defined benefit sections of the Scheme.
Notes to the Consolidated Financial Statements (continued)

Financial Statements
www.hsholdings.com | Stock Code HILS
125
23. Pensions continued The Scheme exposes the Group to a number of risks, the most significant being:
Risk Description
Volatile asset returns The defined benefit obligation is calculated using a discount rate set with reference to high quality corporate bond yields. If assets underperform against this discount rate, this will create a plan deficit. The Scheme holds a proportion of its assets in hedge funds and other growth assets which are expected to outperform corporate bonds in the long term. However, returns are likely to be volatile in the short term, potentially resulting in short term cash requirements and an increase in the defined benefit obligation recorded on the Consolidated Statement of Financial Position. The allocation to growth assets is monitored to ensure it remains appropriate given the Scheme’s long term objectives.
Changes in bond yields A decrease in corporate bond yields will increase the funding and accounting liabilities, although this will be partially offset by an increase in the value of the Scheme’s investments in corporate and government bonds.
Inflation risk A significant proportion of the defined benefit obligation is indexed in line with price inflation, with higher inflation leading to higher liabilities.
Life expectancy The majority of the Scheme’s obligations are to provide a pension for the life of each of the members, so increases in life expectancy will result in an increase in the liabilities.
A full actuarial valuation of the Scheme was last carried out as at 5 April 2016 and was updated to 31 December 2017 by a qualified actuary. All actuarial gains and losses are recognised immediately in the Consolidated Statement of Comprehensive Income.
The principal assumptions used by the actuary
2017 2016 2015 2014 2013
Rate of increase in salaries n/a n/a n/a n/a n/aRate of increase in pensions payment 3.1% 3.20% 3.00% 2.90% 3.20%Discount rate 2.4% 2.60% 3.80% 3.50% 4.30%Inflation - RPI 3.2% 3.40% 3.10% 3.0% 3.40%Inflation - CPI 2.2% 2.40% 2.10% 2.0% 2.40%Mortality table 105%102% 116%120% 116%120% 116%120% 116%120%
S2PACM12016 (1.25%) S2PACM12015 1% S1PACM12015 1% S1PACM12014 1% S1PACMI2013 1%
The mortality assumptions imply the following expected future lifetimes from age 65:
2017 2016 2015 2014 2013
Males currently aged 45 23.0 years 21.8 years 21.7 years 21.9 years 21.7 yearsFemales currently aged 45 25.2 years 24.0 years 23.9 years 24.4 years 24.1 yearsMales currently aged 65 21.9 years 20.8 years 20.7 years 20.9 years 20.7 yearsFemales currently aged 65 23.8 years 22.7 years 22.7 years 23.1 years 22.9 years
The assumptions have been chosen by the Directors from a range of possible actuarial assumptions which, due to the timescales covered, may not be borne out in practice. The Group takes advice from an independent actuary regarding the appropriateness of the assumptions used.
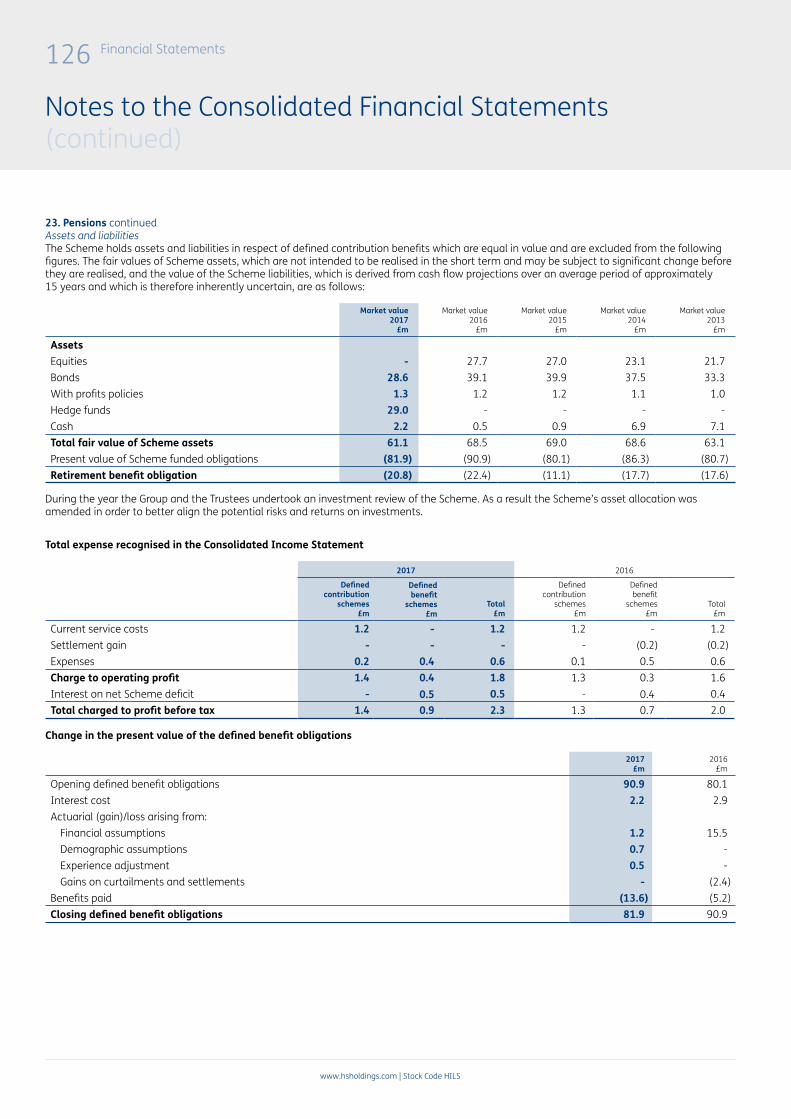
126 Financial Statements
www.hsholdings.com | Stock Code HILS
23. Pensions continuedAssets and liabilitiesThe Scheme holds assets and liabilities in respect of defined contribution benefits which are equal in value and are excluded from the following figures. The fair values of Scheme assets, which are not intended to be realised in the short term and may be subject to significant change before they are realised, and the value of the Scheme liabilities, which is derived from cash flow projections over an average period of approximately 15 years and which is therefore inherently uncertain, are as follows:
Market value2017
£m
Market value2016
£m
Market value2015
£m
Market value2014
£m
Market value2013
£m
AssetsEquities - 27.7 27.0 23.1 21.7Bonds 28.6 39.1 39.9 37.5 33.3With profits policies 1.3 1.2 1.2 1.1 1.0Hedge funds 29.0 - - - -Cash 2.2 0.5 0.9 6.9 7.1Total fair value of Scheme assets 61.1 68.5 69.0 68.6 63.1Present value of Scheme funded obligations (81.9) (90.9) (80.1) (86.3) (80.7)Retirement benefit obligation (20.8) (22.4) (11.1) (17.7) (17.6)
During the year the Group and the Trustees undertook an investment review of the Scheme. As a result the Scheme’s asset allocation was amended in order to better align the potential risks and returns on investments.
Total expense recognised in the Consolidated Income Statement
2017 2016
Definedcontribution
schemes£m
Definedbenefit
schemes£m
Total£m
Definedcontribution
schemes£m
Definedbenefit
schemes£m
Total£m
Current service costs 1.2 - 1.2 1.2 - 1.2Settlement gain - - - - (0.2) (0.2)Expenses 0.2 0.4 0.6 0.1 0.5 0.6Charge to operating profit 1.4 0.4 1.8 1.3 0.3 1.6Interest on net Scheme deficit - 0.5 0.5 - 0.4 0.4Total charged to profit before tax 1.4 0.9 2.3 1.3 0.7 2.0
Change in the present value of the defined benefit obligations
2017£m
2016£m
Opening defined benefit obligations 90.9 80.1Interest cost 2.2 2.9Actuarial (gain)/loss arising from:
Financial assumptions 1.2 15.5Demographic assumptions 0.7 -Experience adjustment 0.5 -Gains on curtailments and settlements - (2.4)
Benefits paid (13.6) (5.2)Closing defined benefit obligations 81.9 90.9
Notes to the Consolidated Financial Statements (continued)

Financial Statements
www.hsholdings.com | Stock Code HILS
127
23. Pensions continuedChanges in fair values of Scheme assets
2017£m
2016£m
Opening fair value of assets 68.5 69.0Interest income 1.7 2.5Return on plan assets excluding interest income 1.9 2.0Employer contributions 2.6 2.4Loss on curtailments and settlements - (2.2)Benefits paid (13.6) (5.2)Closing fair value of assets 61.1 68.5Actual return on Scheme assets 3.6 4.5Expected employer contributions in the following yearDefined benefit Scheme 2.9 2.9Defined contribution schemes 1.0 1.1
Amounts recognised in the Consolidated Statement of Comprehensive Income
% of Schemeassets/
liabilities %2017
£m
% of Schemeassets/
liabilities %2016
£m
% of Schemeassets/
liabilities %2015
£m
Return on plan assets excluding interest income 3 1.9 3 2.0 (1) (0.4)Experience gain on Scheme obligations (1) (0.5) - - 3 2.2Changes in assumptions underlying the present value of Scheme obligations (2) (1.9) (17) (15.5) 1 3.2Annual amount recognised (1) (0.5) (14) (13.5) 6 5.0Total amount recognised (43.0) (42.5) (29.0)
% of Schemeassets/
liabilities %2014
£m
% of Schemeassets/
liabilities %2013
£m
Return on plan assets excluding interest income 4 3.1 (2) (0.6)Experience loss on Scheme obligations - - (1) (1.0)Changes in assumptions underlying the present value of Scheme obligations (7) (6.1) (5) (4.2)Annual amount recognised (3) (3.0) (8) (5.8)Total amount recognised (34.0) (31.0)
The table below shows the sensitivity of the Consolidated Statement of Financial Position to certain changes in the significant pension assumptions:
Balance at 31 December 2017
Discount rate (-0.1% p.a.)
£m
Inflation rate(+0.1% p.a.)
£m
Life expectancy(+1 year)
£m
Value of funded obligations (81.9) (83.1) (82.7) (85.5)Fair value of plan assets 61.1 61.1 61.1 61.1Deficit (20.8) (22.0) (21.6) (24.4)
A formal actuarial valuation of the Scheme as at April 2016 was finalised during the year, following which the Group agreed a deficit recovery plan with the Trustees that requires cash contributions amounting to £2.5m per annum until September 2027.
The Group has considered the requirements of IFRIC 14. The terms of the Scheme give the Group the right to recover any surplus assets in the Scheme upon wind up and therefore management have concluded that there is no impact on the amounts recognised in respect of retirement benefit obligations.
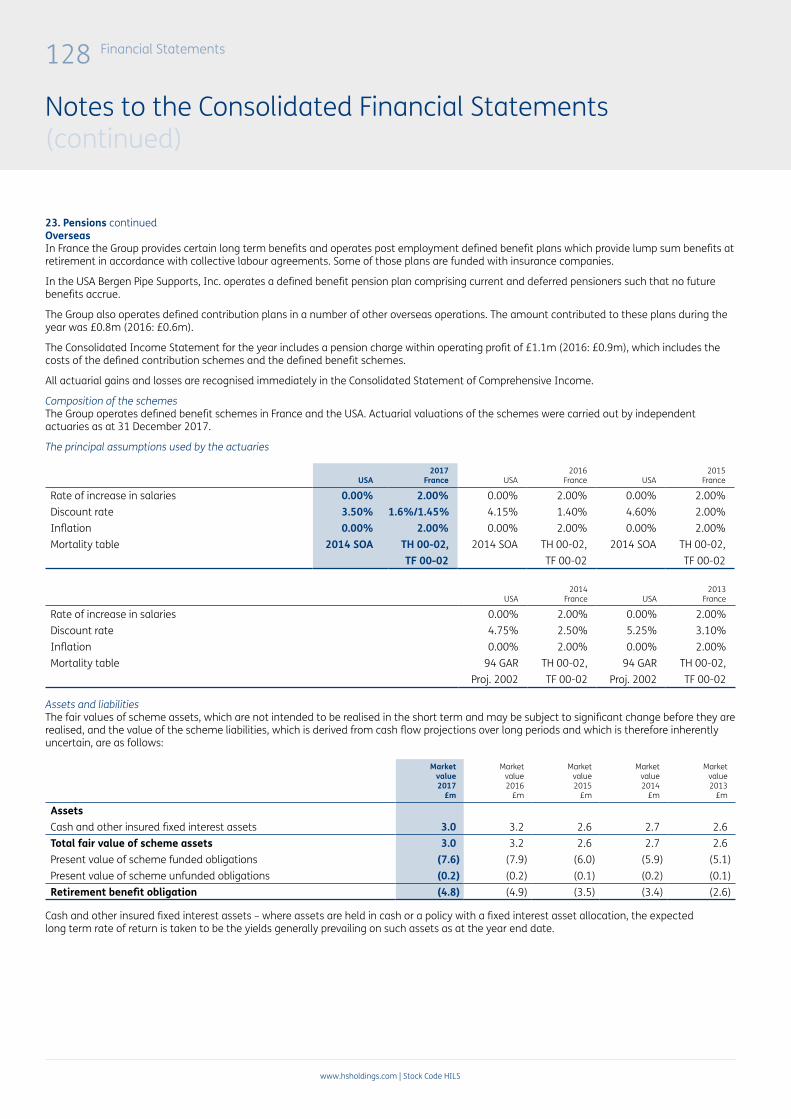
128 Financial Statements
www.hsholdings.com | Stock Code HILS
23. Pensions continued OverseasIn France the Group provides certain long term benefits and operates post employment defined benefit plans which provide lump sum benefits at retirement in accordance with collective labour agreements. Some of those plans are funded with insurance companies.
In the USA Bergen Pipe Supports, Inc. operates a defined benefit pension plan comprising current and deferred pensioners such that no future benefits accrue.
The Group also operates defined contribution plans in a number of other overseas operations. The amount contributed to these plans during the year was £0.8m (2016: £0.6m).
The Consolidated Income Statement for the year includes a pension charge within operating profit of £1.1m (2016: £0.9m), which includes the costs of the defined contribution schemes and the defined benefit schemes.
All actuarial gains and losses are recognised immediately in the Consolidated Statement of Comprehensive Income.
Composition of the schemesThe Group operates defined benefit schemes in France and the USA. Actuarial valuations of the schemes were carried out by independent actuaries as at 31 December 2017.
The principal assumptions used by the actuaries
USA2017
France USA2016
France USA2015
France
Rate of increase in salaries 0.00% 2.00% 0.00% 2.00% 0.00% 2.00%Discount rate 3.50% 1.6%/1.45% 4.15% 1.40% 4.60% 2.00%Inflation 0.00% 2.00% 0.00% 2.00% 0.00% 2.00%Mortality table 2014 SOA TH 00-02, 2014 SOA TH 00-02, 2014 SOA TH 00-02,
TF 00-02 TF 00-02 TF 00-02
USA2014
France USA2013
France
Rate of increase in salaries 0.00% 2.00% 0.00% 2.00%Discount rate 4.75% 2.50% 5.25% 3.10%Inflation 0.00% 2.00% 0.00% 2.00%Mortality table 94 GAR TH 00-02, 94 GAR TH 00-02,
Proj. 2002 TF 00-02 Proj. 2002 TF 00-02
Assets and liabilitiesThe fair values of scheme assets, which are not intended to be realised in the short term and may be subject to significant change before they are realised, and the value of the scheme liabilities, which is derived from cash flow projections over long periods and which is therefore inherently uncertain, are as follows:
Market value2017
£m
Market value2016
£m
Market value2015
£m
Market value2014
£m
Market value2013
£m
AssetsCash and other insured fixed interest assets 3.0 3.2 2.6 2.7 2.6Total fair value of scheme assets 3.0 3.2 2.6 2.7 2.6Present value of scheme funded obligations (7.6) (7.9) (6.0) (5.9) (5.1)Present value of scheme unfunded obligations (0.2) (0.2) (0.1) (0.2) (0.1)Retirement benefit obligation (4.8) (4.9) (3.5) (3.4) (2.6)
Cash and other insured fixed interest assets – where assets are held in cash or a policy with a fixed interest asset allocation, the expected long term rate of return is taken to be the yields generally prevailing on such assets as at the year end date.
Notes to the Consolidated Financial Statements (continued)

Financial Statements
www.hsholdings.com | Stock Code HILS
129
23. Pensions continuedTotal expense recognised in the Consolidated Income Statement
2017 2016
Definedcontribution
schemes£m
Definedbenefit
schemes£m
Total£m
Definedcontribution
schemes£m
Definedbenefit
schemes£m
Total£m
Current service cost 0.8 0.3 1.1 0.6 0.3 0.9Charge to operating profit 0.8 0.3 1.1 0.6 0.3 0.9Interest on net pension scheme deficit - 0.2 0.2 - 0.1 0.1Total charged to profit before tax 0.8 0.5 1.3 0.6 0.4 1.0
Change in the present value of the defined benefit obligation
2017£m
2016£m
Opening defined benefit obligation 8.1 6.1Current service costs 0.3 0.3Interest cost on scheme obligations 0.3 0.2Actuarial (gains)/losses arising from:
Financial assumptions (0.2) 0.6Experience adjustments - -
Benefits paid (0.3) (0.3)Exchange adjustments (0.4) 1.2Closing defined benefit obligation 7.8 8.1
Changes in fair values of scheme assets
2017£m
2016£m
Opening fair value of assets 3.2 2.6Return on plan assets excluding interest income 0.3 -Interest on plan assets 0.1 0.1Admin expenses (0.1) -Benefits paid (0.2) (0.1)Exchange adjustments (0.3) 0.6Closing fair value of assets 3.0 3.2Actual return on scheme assets 0.4 0.1Expected employer contributions in the following yearDefined benefit schemes - -Defined contribution schemes 0.8 0.6

130 Financial Statements
www.hsholdings.com | Stock Code HILS
23. Pensions continuedAmounts recognised in the Consolidated Statement of Comprehensive Income
% of schemeassets/
liabilities%
2017£m
% of schemeassets/
liabilities%
2016£m
% of schemeassets/
liabilities%
2015£m
Experience gain/(loss) on scheme obligations 5 0.4 (2) (0.2) 4 0.2Return on plan assets excluding interest income 10 0.3 - - 0 -Changes in assumptions underlying thepresent value of scheme obligations (1) (0.1) (5) (0.4) (4) (0.2)Exchange rate adjustment on assets andliabilities (2) (0.1) (12) (0.6) 0 -Amount recognised in the period 6 0.5 (15) (1.2) - -Total amount recognised (2.3) (2.8) (1.6)
% of schemeassets/
liabilities%
2014£m
% of schemeassets/
liabilities%
2013£m
Experience loss on scheme obligations 0 - 0 -Return on plan assets excluding interest income 0 - 7 0.2Changes in assumptions underlying the present value of scheme obligations (10) (0.6) (4) (0.2)Exchange rate adjustment on assets and liabilities 0 - n/a -Amount recognised in the period (10) (0.6) - -Total amount recognised (1.6) (1.0)
The Group considers that any reasonable sensitivities applied to the overseas scheme assumptions would not have a material impact on the Consolidated Statement of Financial Position.
24. Accounting judgements, estimates and assumptionsThe principal accounting judgements, estimates and related assumptions employed in the preparation of these Consolidated Group Financial Statements which could affect the carrying amounts of assets and liabilities at the year end date are set out below.
Actuarial assumptions on pension obligationsEstimatesIn determining the valuation of the defined benefit pension deficit, certain estimates and assumptions about the scheme have been made, notably the expected return on assets, inflation, discount rates, mortality and pension increases. The factors affecting these assumptions are influenced by wider macro-economic factors that are largely outside of the Group’s control. A sensitivity analysis of the impact of changes in key assumptions is set out in note 23.
Impairment of goodwillEstimatesThe determination of whether goodwill and other indefinite life intangible assets should be impaired requires the estimation of future cash flows and growth factors adopted by each cash generating unit. Furthermore, discount rates applied to these cash flows are determined by reference to the markets in which they operate and are risk adjusted to reflect risks and opportunities existing for each cash generating unit. These factors are all affected by prevailing market and economic factors outside the Group’s control. Further information on this issue, including sensitivity analysis, is included in note 10.
Environmental and dilapidation provisionsJudgementsGiven the nature of the Group’s operations there is a risk that its activities result in an obligation to rectify contaminated land or similar environmental issues at its operating sites, particularly those acquired through acquisitions of subsidiaries. Management is required to make judgements as to whether an obligation has arisen, whether it is probable that an outflow of economic value will arise as a result, and if so the expected timing of such outflows.
EstimatesThe amounts of the provisions recognised in respect of environmental and dilapidation obligations reflect cost estimates that have been derived on the basis of the most recent assessments of the likely cost. Certain factors concerning these costs are outside the Group’s control. In making this assessment the Group has sought the aid of independent experts where appropriate. Further information is included in note 19. The Group does not consider that there are any key sources of estimation uncertainty in the reporting period that may have a significant risk of causing a material adjustment to the carrying amounts of assets and liabilities within the next financial year.
Notes to the Consolidated Financial Statements (continued)

Financial Statements
www.hsholdings.com | Stock Code HILS
131
24. Accounting judgements, estimates and assumptions continued Valuation of intangible assetsJudgementsWhere an acquisition is of a significant size, it is reviewed by independent experts to judge the specific intangibles arising from the acquisition. Brands, contractual arrangements and customer lists have been identified as part of this process and are disclosed in note 10. The reasons for the residual excess of consideration over net asset value are then determined to identify the reasons for goodwill arising, which in the case of recent acquisitions, has resulted mainly from the assembled workforce, technical expertise, know-how, market share and geographical advantages.
EstimatesBrands have been valued based on estimated royalty rates discounted over their useful lives, which is normally 20 years, but considered indefinite for the US Voigt & Schweitzer brand which has been successfully trading for over 50 years. Customer relationships have been valued based on discounted forecast revenues and have been deemed to have useful economic lives of between five and ten years based upon the average expected length of relationships with customers. Other contractual arrangements have been valued based on either replacement cost or an income approach utilising ‘with or without’ methodology and have been deemed to have estimated useful economic lives of between 8 and 10 years. The Group does not consider that there are any key sources of estimation uncertainty in the reporting period that may have a significant risk of causing a material adjustment to the carrying amounts of assets and liabilities within the next financial year.
TaxationJudgementsLiabilities for uncertain tax positions require management judgements in respect of tax audit issues and exposures in each of the jurisdictions in which the Group operates. Where management judges that a tax position is uncertain, a current tax liability is held for anticipated taxes that are considered to be probable based on the information available. The key judgement area for the Group is the pricing of intercompany goods and services between subsidiaries in different countries.
Estimates Management is required to make an estimate of the current tax liability together with an assessment of the temporary differences which arise as a consequence of different accounting and tax treatments. Liabilities for uncertain tax positions also require management estimates in respect of the amount of tax that may become payable. Management engages with professional advisors in making its assessment and, if appropriate, will liaise with the relevant taxation authorities to resolve the matter. The tax liability is reassessed in each period to reflect management’s best estimate in light of the information available. Included in the current tax payable is a liability of £7.8m (2016: £6.9m) for uncertain tax positions.
The liability includes an amount of £4.2m relating to the pricing of intercompany goods and services between subsidiaries in different countries. Depending on the conclusions of any tax audits conducted by the tax authorities in the various jurisdictions in which the Group operates, management estimate the range of possible outcomes to be between £nil and £7.7m and therefore it is possible that, if the outcomes are different to those estimated by management, the difference may materially impact the income tax charge / (credit) in the year in which the matter is concluded. Management does not believe that the range of possible outcomes for the other items included in the liability for uncertain tax positions could have a material effect on the financial statements in the next 12 months. Further information is set out in note 7 and note 13.
25. Related party transactionsThe key management are considered to be the Board of Directors of Hill & Smith Holdings PLC, whose remuneration can be seen in the Directors’ Remuneration Report on pages 62 to 71. The compensation in total for each category required by IAS24 is as follows:
2017£m
2016£m
Salaries and short term employee benefits 1.7 1.6Non-executive Directors’ fees 0.3 0.3Pension costs 0.2 0.2Share-based payments 0.7 0.7
2.9 2.8

132 Financial Statements
www.hsholdings.com | Stock Code HILS
Lupta pore latur aut et es rem erumenduci si accuptam quo occupta quae lautem quunto modis nis millore scipsam fugia que di cus etur rehenderit, qui te volorempore nonserrovit magnis quia coruntem.
“
“Technocover’s UltraSecure Kiosk and Access Cover Solution for New UV Treatment Scheme at Water Treatment and Pumping Works
Completed in 2017, this Technocover kiosk and access cover solution was purpose designed, in close partnership with the UV technology supplier and client, to facilitate the installation of a new ultra-violet (UV) water treatment facility at their water treatment works – now one of the largest UV water treatment plants in the UK.
The project, that converted two underground wet contact tanks into dry chambers to house a new state of the art facility with more than 120 valves and four UV reactors, each containing 30 quartz tubes, was completed in just ten months primarily due to the strong working relationships within the partnership and with the wider supply chain. The client had to work within considerable technical constraints to a very demanding timetable but used these challenges as an opportunity to be innovative and flexible in their approach, including how they worked with their suppliers.
The end result meant water supply to customers was not interrupted during construction and objectives were delivered on all targets.
Find out more about the company at: www.technocover.co.uk
Images
Top & Bottom – Combined access covers and modular building structure, manufactured and installed by Technocover at a Ultaraviolet (‘UV’) Water Treatment Facility at South Staffs Water Plc, Seedy Mill Treatment Works near Lichfield.
Case Study

Financial Statements
www.hsholdings.com | Stock Code HILS
133133
Top: Hostile Vehicle Mitigation barges in Hyde Park London – Keeping Pedestrians Safe
Bottom: VGAH 2000 Aluminium H2 Parapet, by Varley & Gulliver Ltd, installed at Bicester Village. The first time H2 Aluminium parapet has been used in the UK.

134 Financial Statements
www.hsholdings.com | Stock Code HILS
Notes2017
£m2016
£m
Fixed assetsTangible assets 3 0.1 0.1
Investments 4 324.9 353.4
325.0 353.5
Current assetsDebtors 5 77.8 84.8
Cash and cash equivalents - 0.8
77.8 85.6
Creditors: amounts falling due within one yearBank loans and overdrafts 6, 7 (6.9) (9.6)
Other creditors 6 (57.6) (81.2)
(64.5) (90.8)
Net current assets/(liabilities) 13.3 (5.2)
Total assets less current liabilities 338.3 348.3
Creditors: amounts falling due after more than one year 7 (44.0) (51.6)
Provisions for liabilities and chargesPension liabilities 9 (0.4) (0.5)
Other provisions (0.1) (0.2)
Net assets 293.8 296.0
Share capital and reservesCalled up share capital 10 19.7 19.7
Share premium 34.1 33.5
Capital redemption reserve 0.2 0.2
Profit and loss account 239.8 242.6
Equity shareholders’ funds 293.8 296.0
Approved by the Board of Directors on 7 March 2018 and signed on its behalf by:
D W Muir M Pegler Director Director Company Number: 671474
Company Balance SheetYear ended 31 December 2017

Financial Statements
www.hsholdings.com | Stock Code HILS
135
Company Statement of Changes in EquityYear ended 31 December 2017
Called upshare capital
£m
Share premium
account £m
Capitalredemption
reserve£m
Retainedearnings
£m
Totalequity
£m
Balance at 1 January 2016 19.6 32.8 0.2 210.1 262.7
Comprehensive incomeProfit for the year - - - 49.4 49.4
Other comprehensive income for the year - - - (0.2) (0.2)
Transactions with owners recognised directly in equityDividends - - - (16.2) (16.2)
Credit to equity of share-based payments - - - 1.1 1.1
Tax taken directly to the Statement of Changes in Equity - - - 0.4 0.4
Satisfaction of long term incentive awards - - - (1.4) (1.4)
Own shares acquired by employee benefit trust - - - (0.6) (0.6)
Issue of shares 0.1 0.7 - - 0.8
At 31 December 2016 19.7 33.5 0.2 242.6 296.0Comprehensive incomeProfit for the year - - - 19.2 19.2Other comprehensive income for the year - - - 0.1 0.1Transactions with owners recognised directly in equityDividends - - - (20.7) (20.7)Credit to equity of share-based payments - - - 1.3 1.3Tax taken directly to the Statement of Changes in Equity - - - (0.1) (0.1)Satisfaction of long term incentive awards - - - (2.5) (2.5)Own shares held by employee benefit trust - - - (0.1) (0.1)Shares issued - 0.6 - - 0.6At 31 December 2017 19.7 34.1 0.2 239.8 293.8
Details of share options and related share-based payments are contained in note 21 to the Group Financial Statements.
Transactions of the Group sponsored Employee Benefit Trust (‘EBT’) are included in the Company Financial Statements. In particular, the EBT’s purchase of shares in the Company to satisfy shares awarded under the Long-Term Incentive Plan is debited directly to equity.
Distributable reserves
The Company maintains distributable reserves of a minimum of two times the current annual dividend payment. Total external dividends declared in 2017, which will be paid in 2018, amounted to £23.8m. When required the Company can receive dividends from its subsidiaries to further increase distributable reserves.

136 Financial Statements
www.hsholdings.com | Stock Code HILS
2017 2016
Notes £m £m £m £m
Loss before tax (4.7) (8.0)
Add back net financing costs 1.6 2.0
Operating loss (3.1) (6.0)
Adjusted for non-cash items:
Share-based payments 1.3 1.1
Depreciation - -
Loss on disposal of subsidiary 2.8 -
Impairment of investments 0.7 -
4.8 1.1
Operating cash flow before movement in working capital 1.7 (4.9)
Decrease/(increase) in receivables 0.8 (0.5)
Increase in payables 1.0 0.7
(Decrease)/increase in provisions (0.1) 0.2
Change in amounts due to/from Group undertakings 9.0 (31.4)
Net movement in working capital 10.7 (31.0)
Cash generated from/(used in) operations 12.4 (35.9)
Income taxes paid (3.3) (3.5)
Interest paid (1.6) (1.7)
Net cash generated from/(used in) operating activities 7.5 (41.1)
Interest received - -
Dividends received 22.5 55.7
Disposal of subsidiaries 2.5 -
Investments in subsidiaries - -
Net cash from investing activities 25.0 55.7
Issue of new shares 10 0.6 0.8
Purchase of shares for employee benefit trust (2.6) (2.0)
Dividends paid 2 (20.7) (16.2)
Costs associated with refinancing of revolving credit facility - (1.0)
New loans and borrowings 26.0 21.0
Repayment of loans and borrowings (34.0) (23.0)
Net cash used in financing activities (30.7) (20.4)
Net increase/(decrease) in cash 1.8 (5.8)
Cash at the beginning of the year (8.7) (2.9)
Cash at the end of the year (6.9) (8.7)
Company Statement of Cash Flows

Financial Statements
www.hsholdings.com | Stock Code HILS
137
Company Principal Accounting Policies
The following accounting policies have been applied consistently in dealing with items which are considered material in relation to the Company’s Financial Statements, except as noted below.
Basis of preparationThese Financial Statements were prepared in accordance with Financial Reporting Standard 101 Reduced Disclosure Framework (‘FRS 101’).
In preparing these Financial Statements, the Company applies the recognition, measurement and disclosure requirements of International Financial Reporting Standards as adopted by the EU (‘Adopted IFRSs’), but makes amendments where necessary in order to comply with Companies Act 2006 and has set out below where advantage of the FRS 101 disclosure exemptions has been taken.
Under section s408 of the Companies Act 2006 the Company is exempt from the requirement to present its own Profit and Loss Account.
As the Consolidated Financial Statements include the equivalent disclosures, the Company has taken the exemptions under FRS 101 available in respect of the following disclosures:
› IFRS 2 Share Based Payments in respect of Group settled share based payments; and
› The effects of new but not yet effective IFRSs.
The Accounting Policies set out on pages 137 to 139 have, unless otherwise stated, been applied consistently to all periods presented in these Financial Statements.
Measurement conventionThe Financial Statements are prepared on the historical cost basis except that the following assets and liabilities are stated at their fair value: derivative financial instruments, financial instruments classified as fair value through profit or loss or as available-for-sale, investment property and liabilities for cash-settled share-based payments. Non-current assets and disposal groups held for sale are stated at the lower of previous carrying amount and fair value less costs to sell.
Investments in subsidiary undertakingsIn the Company’s Financial Statements, investments in subsidiary undertakings are carried at cost, less impairment.
Foreign currenciesTransactions in foreign currencies are translated to the Company’s functional currency at the foreign exchange rate ruling at the date of the transaction. Monetary assets and liabilities denominated in foreign currencies at the balance sheet date are retranslated to the functional currency at the foreign exchange rate ruling at that date. Non-monetary assets and liabilities that are measured in terms of historical cost in a foreign currency are translated using the exchange rate at the date of the transaction. Non-monetary assets and liabilities denominated in foreign currencies that are stated at fair value are retranslated to the functional currency at foreign exchange rates ruling at the dates the fair value was determined. Foreign exchange differences arising on translation are recognised in the Profit and Loss Account except for differences arising on the retranslation of qualifying cash flow hedges, which are recognised in other comprehensive income.
Financial instrumentsTrade and other debtors Trade and other debtors are recognised initially at fair value. Subsequent to initial recognition they are measured at amortised cost using the effective interest method, less any impairment losses.
Trade and other creditorsTrade and other creditors are recognised initially at fair value. Subsequent to initial recognition they are measured at amortised cost using the effective interest method.
Interest-bearing borrowingsInterest-bearing borrowings are recognised initially at fair value less attributable transaction costs. Subsequent to initial recognition, interest-bearing borrowings are stated at amortised cost using the effective interest method, less any impairment losses.
Derivative financial instrumentsDerivative financial instruments are recognised at fair value. The gain or loss on remeasurement to fair value is recognised immediately in profit or loss. However, where derivatives qualify for hedge accounting, recognition of any resultant gain or loss depends on the nature of the item being hedged.
Fair value hedgesWhere a derivative financial instrument is designated as a hedge of the variability in fair value of a recognised asset or liability or an unrecognised firm commitment, all changes in the fair value of the derivative are recognised immediately in the Profit and Loss Account. The carrying value of the hedged item is adjusted by the change in fair value that is attributable to the risk being hedged (even if it is normally carried at cost or amortised cost) and any gains or losses on remeasurement are recognised immediately in the profit and loss account (even if those gains would normally be recognised directly in reserves).

138 Financial Statements
www.hsholdings.com | Stock Code HILS
ProvisionsA provision is recognised in the Balance Sheet when the Company has a present legal or constructive obligation as a result of a past event, that can be reliably measured and it is probable that an outflow of economic benefits will be required to settle the obligation. Provisions are determined by discounting the expected future cash flows at a pre-tax rate that reflects risks specific to the liability.
Tangible fixed assets and depreciationTangible fixed assets are stated at cost less accumulated depreciation and accumulated impairment losses.
Where parts of an item of tangible fixed assets have different useful lives, they are accounted for as separate items of tangible fixed assets.
Leases in which the Company assumes substantially all the risks and rewards of ownership of the leased asset are classified as finance leases. Where land and buildings are held under leases the accounting treatment of the land is considered separately from that of the buildings. Leased assets acquired by way of finance lease are stated at an amount equal to the lower of their fair value and the present value of the minimum lease payments at inception of the lease, less accumulated depreciation and less accumulated impairment losses. Lease payments are accounted for as described below.
Depreciation is charged to the Profit and Loss Account on a straight-line basis over the estimated useful lives of each part of an item of tangible fixed assets. Land is not depreciated. The estimated useful lives are as follows:
Leasehold improvements life of the leasePlant, machinery and vehicles 4 to 20 years
Depreciation methods, useful lives and residual values are reviewed at each Balance Sheet date.
LeasesOperating lease paymentsPayments (excluding costs for services and insurance) made under operating leases are recognised in the Profit and Loss Account on a straight-line basis over the term of the lease. Lease incentives received are recognised in the Profit and Loss Account as an integral part of the total lease expense.
Finance lease paymentsMinimum lease payments are apportioned between the finance charge and the reduction of the outstanding liability. The finance charge is allocated to each period during the lease term so as to produce a constant periodic rate of interest on the remaining balance of the liability. Contingent rents are charged as expenses in the periods in which they are incurred.
Pension scheme arrangementsDefined benefit plansA defined benefit plan is a post-employment benefit plan other than a defined contribution plan. The Company’s net obligation in respect of defined benefit pension plans is calculated separately for each plan by estimating the amount of future benefit that employees have earned in return for their service in the current and prior periods; that benefit is discounted to determine its present value, and the fair values of any plan assets (at bid price) are deducted. The Company determines the net interest on the net defined benefit liability/(asset) for the period by applying the discount rate used to measure the defined benefit obligation at the beginning of the annual period to the net defined benefit liability/(asset).
The discount rate is the yield at the reporting date on bonds that have a credit rating of at least AA that have maturity dates approximating to the terms of the Company’s obligations and that are denominated in the currency in which the benefits are expected to be paid.
Remeasurements arising from defined benefit plans comprise actuarial gains and losses, the return on plan assets (excluding interest) and the effect of the asset ceiling (if any, excluding interest). The Company recognises them immediately in other comprehensive income and all other expenses related to defined benefit plans in employee benefit expenses in profit or loss.
Certain of the Company’s employees are members of Group-wide defined benefit schemes. The net defined benefit cost of the plans is allocated to participating entities based on the contracting entity of the participating employees of the scheme. The contributions payable by the participating entities are determined on the same basis.
Company Principal Accounting Policies (continued)

Financial Statements
www.hsholdings.com | Stock Code HILS
139
Share-based paymentsShare-based payment arrangements in which the Company receives goods or services as consideration for its own equity instruments are accounted for as equity-settled share-based payment transactions, regardless of how the equity instruments are obtained by the Company.
The grant date fair value of share-based payments awards granted to employees is recognised as an employee expense, with a corresponding increase in equity, over the period in which the employees become unconditionally entitled to the awards. The fair value of the awards granted is measured using an option valuation model, taking into account the terms and conditions upon which the awards were granted. The amount recognised as an expense is adjusted to reflect the actual number of awards for which the related service and non-market vesting conditions are expected to be met, such that the amount ultimately recognised as an expense is based on the number of awards that do meet the related service and non-market performance conditions at the vesting date. For share-based payment awards with non-vesting conditions, the grant date fair value of the share-based payment is measured to reflect such conditions and there is no true-up for differences between expected and actual outcomes.
Share-based payment transactions in which the Company receives goods or services by incurring a liability to transfer cash or other assets that is based on the price of the Company’s equity instruments are accounted for as cash-settled share-based payments. The fair value of the amount payable to employees is recognised as an expense, with a corresponding increase in liabilities, over the period in which the employees become unconditionally entitled to payment. The liability is remeasured at each Balance Sheet date and at settlement date. Any changes in the fair value of the liability are recognised as personnel expense in profit or loss.
TaxationTax on the profit or loss for the year comprises current and deferred tax. Tax is recognised in the profit and loss account except to the extent that it relates to items recognised directly in equity or other comprehensive income, in which case it is recognised directly in equity or other comprehensive income.
Current tax is the expected tax payable or receivable on the taxable income or loss for the year, using tax rates enacted or substantively enacted at the Balance Sheet date, and any adjustment to tax payable in respect of previous years.
Deferred tax is provided on temporary differences between the carrying amounts of assets and liabilities for financial reporting purposes and the amounts used for taxation purposes. The following temporary differences are not provided for: the initial recognition of goodwill; the initial recognition of assets or liabilities that affect neither accounting nor taxable profit other than in a business combination, and differences relating to investments in subsidiaries to the extent that they will probably not reverse in the foreseeable future. The amount of deferred tax provided is based on the expected manner of realisation or settlement of the carrying amount of assets and liabilities, using tax rates enacted or substantively enacted at the Balance Sheet date.
A deferred tax asset is recognised only to the extent that it is probable that future taxable profits will be available against which the temporary difference can be utilised.
Ordinary dividendsDividends payable are recognised as a liability in the period in which they are approved by the Company’s shareholders. Dividends receivable are accounted for on a cash accounting basis.
Financial guarantee contractsWhere the Company enters into financial guarantee contracts to guarantee the indebtedness of subsidiary companies, the Company considers these to be insurance contracts and treats the guarantee contract as a contingent liability until such time as it becomes probable that the Company will be required to make a payment under the guarantee.

140 Financial Statements
www.hsholdings.com | Stock Code HILS
1. Profit on ordinary activities before taxation2017
£m2016
£m
The profit on ordinary activities is stated after charging:Operating lease rentals – land and buildings 0.1 0.1
Fees paid to KPMG LLP and its associates for audit and non-audit services to the Company itself are not disclosed in the individual Financial Statements of Hill & Smith Holdings PLC because the Group Financial Statements are required to disclose such fees on a consolidated basis.
2. DividendsDividends paid in the year were the prior year’s interim dividend of £6.7m (2016: £5.5m) and the final dividend of £14.0m (2016: £10.7m). Dividends declared after the year end date are not recognised as a liability. The Directors have proposed a final dividend for the current year, subject to shareholder approval, as shown below:
2017 2016
Penceper share £m
Penceper share £m
Equity sharesInterim 9.4 7.4 8.5 6.7Final 20.6 16.4 17.9 14.1Total 30.0 23.8 26.4 20.8
3. Tangible fixed assets
Short leaseholdproperties
£m
Plant, machineryand vehicles
£mTotal
£m
Cost or valuationAt 31 December 2016 0.1 0.4 0.5Additions - - -At 31 December 2017 0.1 0.4 0.5DepreciationAt 31 December 2016 - 0.4 0.4Charge for the year - - -At 31 December 2017 - 0.4 0.4Net book valueAt 31 December 2017 0.1 - 0.1At 31 December 2016 0.1 - 0.1
4. Fixed asset investmentsShares in
subsidiaryundertakings
£m
Loans tosubsidiary
undertakings£m
Tradeinvestments
£mTotal
£m
CostAt 31 December 2016 343.0 23.8 0.8 367.6Reclassification to amounts owed to subsidiary undertakings - (23.8) - (23.8)Disposals - - (0.8) (0.8)Disposal of subsidiary (5.3) - - (5.3)At 31 December 2017 337.7 - - 337.7ProvisionsAt 31 December 2016 12.1 1.3 0.8 14.2Reclassification to amounts owed to subsidary undertakings - (1.3) - (1.3)Disposals - - (0.8) (0.8)Impairment 0.7 - - 0.7At 31 December 2017 12.8 - - 12.8Net book valueAt 31 December 2017 324.9 - - 324.9At 31 December 2016 330.9 22.5 - 353.4
Notes to the Company Financial Statements

Financial Statements
www.hsholdings.com | Stock Code HILS
141
4. Fixed asset investments continued
A list of the businesses owned by the Company is given in note 13. All of the Company’s subsidiaries are wholly owned.
5. Debtors
2017£m
2016£m
Amounts owed by subsidiary undertakings 72.5 79.7Corporation tax 4.0 3.1Deferred tax (note 8) 0.7 0.8Other debtors 0.4 1.0Prepayments and accrued income 0.2 0.2
77.8 84.8
6. Creditors: amounts falling due within one year2017
£m2016
£m
Bank loans and overdrafts (note 7)Bank overdrafts 6.9 9.6
6.9 9.6Other creditorsTrade creditors 1.8 2.1Other taxation and social security 0.1 0.1Accruals and deferred income 4.7 2.9Other creditors 0.6 1.1Amounts owed to subsidiary undertakings 50.4 75.0
57.6 81.2
7. Creditors: amounts falling due after more than one yearThe Company’s interest bearing loans and borrowings are detailed below. Further information on the Company’s exposure to interest rate and foreign currency risk is provided in note 20 of the Group Financial Statements.
2017£m
2016£m
Long term bank loans 44.0 51.644.0 51.6
The Company’s bank loans and borrowings are also analysed below into the periods in which they mature:
2017£m
2016£m
Bank loans and overdraftAmounts due within one year (note 6) 6.9 9.6Amounts due after more than one year:
Between one and two years - -Between two and five years 44.0 51.6
44.0 51.650.9 61.2
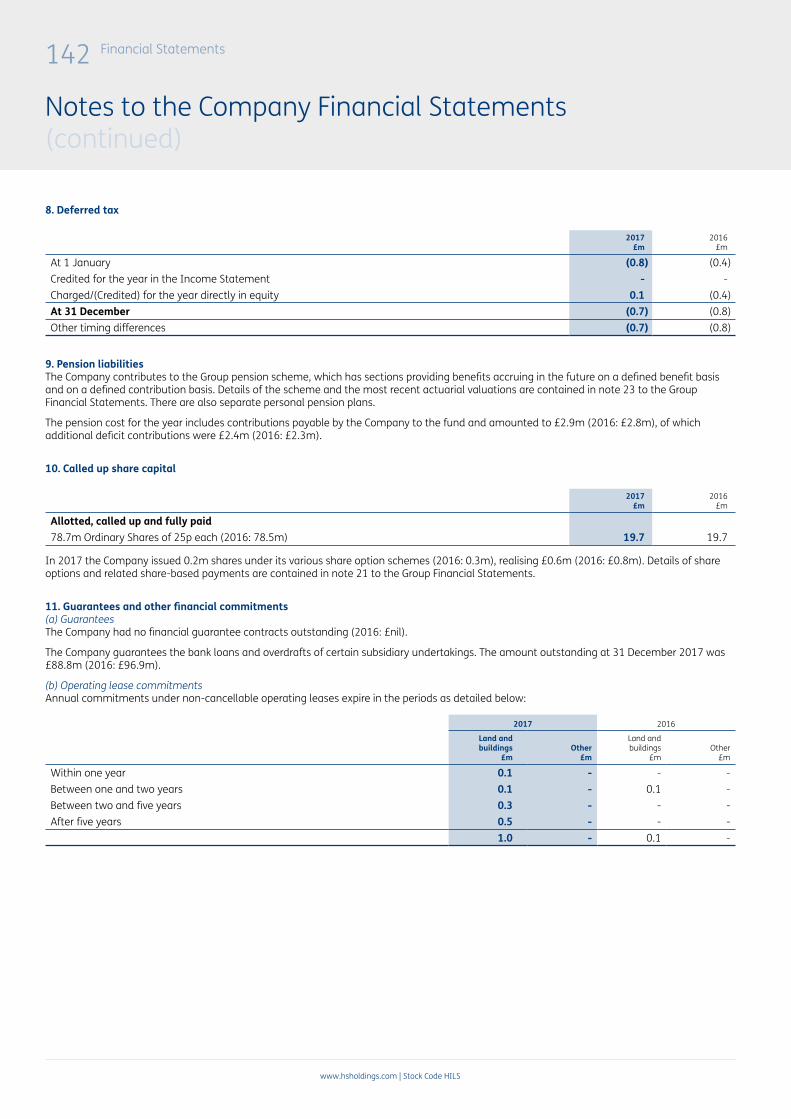
142 Financial Statements
www.hsholdings.com | Stock Code HILS
8. Deferred tax
2017£m
2016£m
At 1 January (0.8) (0.4)Credited for the year in the Income Statement - -Charged/(Credited) for the year directly in equity 0.1 (0.4)At 31 December (0.7) (0.8)Other timing differences (0.7) (0.8)
9. Pension liabilitiesThe Company contributes to the Group pension scheme, which has sections providing benefits accruing in the future on a defined benefit basis and on a defined contribution basis. Details of the scheme and the most recent actuarial valuations are contained in note 23 to the Group Financial Statements. There are also separate personal pension plans.
The pension cost for the year includes contributions payable by the Company to the fund and amounted to £2.9m (2016: £2.8m), of which additional deficit contributions were £2.4m (2016: £2.3m).
10. Called up share capital
2017£m
2016£m
Allotted, called up and fully paid78.7m Ordinary Shares of 25p each (2016: 78.5m) 19.7 19.7
In 2017 the Company issued 0.2m shares under its various share option schemes (2016: 0.3m), realising £0.6m (2016: £0.8m). Details of share options and related share-based payments are contained in note 21 to the Group Financial Statements.
11. Guarantees and other financial commitments(a) GuaranteesThe Company had no financial guarantee contracts outstanding (2016: £nil).
The Company guarantees the bank loans and overdrafts of certain subsidiary undertakings. The amount outstanding at 31 December 2017 was £88.8m (2016: £96.9m).
(b) Operating lease commitmentsAnnual commitments under non-cancellable operating leases expire in the periods as detailed below:
2017 2016
Land andbuildings
£mOther
£m
Land andbuildings
£mOther
£m
Within one year 0.1 - - -Between one and two years 0.1 - 0.1 -Between two and five years 0.3 - - -After five years 0.5 - - -
1.0 - 0.1 -
Notes to the Company Financial Statements (continued)

Financial Statements
www.hsholdings.com | Stock Code HILS
143
12. Related party transactionsThe Company has related party relationships with its key management personnel and with its subsidiaries (either directly or indirectly controlled).
The related party transactions with key management personnel are considered by the Company to be the same as those of the Group and are set out in note 25 to the Group Financial Statements.
The transactions with subsidiaries are summarised below.
Transactions with other Group companiesHighest during
the year£m
Balance at 31 December 2017
£m
Highest during the year
£m
Balance at 31 December 2016
£m
Amounts due from subsidiaries 77.3 72.5 79.7 79.7Amounts due to subsidiaries (75.0) (50.4) (94.5) (75.0)
Transactions with other Group companies typically comprise management and interest charges, dividend receipts and other recharges of administrative expenses.
The disclosure of the year end balance and the highest balance during the year is considered to provide a meaningful representation of transactions between the Company and fellow Group undertakings during the year. The highest balance due is generally at the end of each financial year as this is the time at which the Company levies its management and interest charges.
Related party transactions reported in the Income Statement2017
£m2016
£m
Dividends received 22.5 55.7Recharge of operating expenses 7.5 5.9Net interest income 0.3 -

144 Financial Statements
www.hsholdings.com | Stock Code HILS
13. SubsidiariesIncorporated in the UKAMF Galvanisers Limited (D)
Access Design & Engineering Limited (D)
ALSIPI Limited (D)
Ash & Lacy Limited (H)*Ash & Lacy Manufacturing Limited (H)
Ash & Lacy Overseas (Holdings) Limited (D)
Ash & Lacy Services Limited (H)
Ash Plastic Products Limited (D)
Asset International Limited (U)*A W Thorne Limited (D)*Bainbridge Engineering Limited (D)*Barkers Engineering Limited (U, G)
Bergen Pipe Supports Group Limited (U)*Bergen Pipe Supports Limited (H)
Berry Safety Systems Limited (D)*Bettles and Company Limited (D)
Bipel Group plc (D)
Bipel Ltd (D)
Birtley Group Limited (U, G)
Bowater Doors Limited (U)
British Industrial Engineering Co. (Staffs) Limited (D)
Bromford Reinforcements Limited (D)
Bromford Steel Limited (D)
Brownhills Galvanizing Limited (D)
Bytec Limited (D)
C.I.C. Ralphs Limited (D)
C I Pension Trustees Limited (D)
C. I. Properties Limited (D)
C.I.C. Engineering (Finance) Limited (D)
Carrington Packaging Limited (D)
Cooper Securities (Dudley) Limited (D)
Cooper Securities Limited (D)
Dee Organ Limited (D)
Eurogrid Limited (D)
Expamet Building Products Limited (D)
Expamet Limited (D)
Foremost Moulding Limited (D)
Gem (Ashfix) Limited (D)
Hawkshead Properties Limited (H)
Hardstaff Barriers Limited (R)
Hill & Smith (Americas) Limited (H)
Hill & Smith (Americas) 2 Limited Hill & Smith (France) Limited (H)*Hill & Smith (Treasury) Limited (H)*Hill & Smith (USA) Limited (H)
Hill & Smith Galvanized Products Limited (H)
Hill & Smith Holdings PLC (H)
Hill & Smith Infrastructure Products Group Limited (D)
Hill & Smith Limited (R, U)*Hill & Smith Overseas Limited (H)*Hill & Smith Pension Trustees Limited (D)
H2S2 Limited (R) **
IMAS Technology Limited (D)
J. & F. Pool Limited (D)
Jevons Tools Limited (D)
Joliso Limited (D)
Jones of Oswestry Limited (D)
Joseph Ash Limited (G)
Kinclear Limited (D)
Lamben Galvanizers 85 Limited (D)
(U) Utilities (D) Dormant ** 50% owned Joint Venture(R) Roads (H) Holding company(G) Galvanizing * Directly held by Hill & Smith Holdings PLC
Leech, Brain and Co Limited (D)
Lenchs (Birmingham) Limited (D)
Lionweld Kennedy Flooring Limited (U)*London Galvanizers Limited (D)
Mallatite Limited (R)*MB Tech Limited (D)
Meads Cooper Limited (D)
Medway Galvanising Company Limited (G)
Optimum Barrier Systems Limited (D)
Pipe Supports Overseas Limited (H)*Post & Column Limited (D)
Premier Galvanizing Limited (G)
RBM Reinforcements Limited (D)*Redman Architectural Metalwork Limited (D)
Redman Fisher Engineering Limited (U)
Royston Steel Fencing Limited (D)
Safety and Security Barrier Holdings Limited (H) Seniors Reinforcement (Northern) Limited (D)*Seniors Reinforcement Limited (D)*Signature Limited (D)
Smeaton Lime Works Limited (D)
Technocover Limited (U)
Tegrel Limited (R)
Telford Galvanizers Limited (D)
The Albion Galvanizing Company Limited (D)
The Birmingham Galvanizing Company Limited (D)
The Globe Tank and Foundry (Wolverhampton) Limited (D)
Theta Systems Limited (D)
Variable Message Signs Limited (D)
Varley & Gulliver Limited (R)*Vista Galvanizing (UK) Ltd (D)
Walkers Galvanizers Limited (D)
Western Galvanizers Limited (D)
Wombwell Foundry Limited (D)
Zonestar Limited (D)
All of the above subsidiaries have a year end date of 31 December and are included in the consolidated results of the Group. The Company holds 100% of the share capital of all businesses, either directly or indirectly, unless otherwise stated. All of the above subsidiaries have a registered office address at Westhaven House, Arleston Way, Shirley, Solihull, B90 4LH, England.

Financial Statements
www.hsholdings.com | Stock Code HILS
145
Incorporated in NorwayATA Hill & Smith AS (R)
Jacob Borchsgate 6, 3012 Drammen
Incorporated in SwedenATA Hill & Smith AB (R)
Hill & Smith Sweden AB (H)
FMK Trafikprodukter AB (D)
Box 7051, 192 78, Sollentuna, Stockholms län
Incorporated in ThailandBergen Pipe Supports Asia Limited (U)
26/5 Moo. 9, Soi Rattanaraj, Bangna-Trad Road, Km 18.2, Bangchalong, Bangplee, Samut Prakarn, 10540
Incorporated in the USABergen Pipe Supports, Inc (U)
Carpenter & Paterson, Inc. (U)
Creative Pultrusions, Inc (U)
CPK Manufacturing LLC (U) Hill & Smith Group Holdings, Inc (H)
Hill & Smith Holdings LLC (H)
Hill & Smith, Inc. (R)
Voigt & Schweitzer LLC (H)
c/o The Corporation Trust Company, Corporation Trust Centre, 1209 Orange Street, Wilmington, Delaware 19801
V&S Amboy Galvanizing LLC (G)
V&S Columbus Galvanizing LLC (G)
V&S Delaware Galvanizing LLC (G)
V&S Detroit Galvanizing LLC (G)
V&S Lebanon Galvanizing LLC (G)
V&S Memphis Galvanizing LLC (G)
V&S Schuler Engineering, Inc. (U)
V&S Schuler Tubular Products LLC (U)
V&S Taunton Galvanizing, LLC (G)
987 Buckeye Park Road, Columbus, Ohio, 43207
All of the above subsidiaries have a year end date of 31 December, with the exception of Bergen Pipe Supports (India) Private Limited and Hill & Smith Infrastructure Products India Private Limited, which each have a year end of 31 March. All of the subsidiaries listed above are included in the consolidated results of the Group. The Company holds 100% of the share capital of all businesses, either directly or indirectly.
13. Subsidiaries continued
Incorporated in AustraliaHill & Smith Pty Limited (R)
Suite 12, Level 12, 37 Bligh Street, Sydney, New South Wales 2000
Incorporated in BelgiumVista BVBA (H)
Louizalaan, 331-333, 1050 Brussels
Incorporated in CanadaProcess Pipe Supports, Inc (U)
921 Barton Street, Unit #3, Stoney Creek, Ontario, L8E 5P5
Incorporated in FranceConimast International SAS (R)
ZI la Saunière, - BP70, 89600, Saint-Florentin
Européenne de Galvanisation SAS (G)
10 Route de Merviller, 54120, Baccarat
France Galva SA (G)
ZI la Saunière - BP70, 89600, Saint-Florentin
France Galva Lorraine SAS (G)
ZI due Lavoisier, 57340, Morhange
Galvacier SAS (G)
ZI des Terres Noires, 81370, Saint Sulpice
Galva Gaillard SAS (G)
801 rue de la Rive, 42320 La Grand Croix
Galvalandes SAS (G)
3031 route de Mont-de-Marsan, CS 50007, 40120, Sarbazan
Galvanisation de l’Artois SAS (G)
437 Chemin de Noyelles, 62110, Henin-Beaumont
Galvanisation du Cambrésis SAS (G)
Champ de la Cheminée, 59980, Honnechy
Galvamed SAS (G)
1447 avenue des Verges, ZI du Pont, 13750, Plan D’orgon
Société Nantaise de Galvanisation SAS (G)
ZI - 4 rue de l’Europe, 44470, Carquefou
Incorporated in IndiaBergen Pipe Supports (India) Private Limited (U)
Plot No 12, Ground Floor, ‘RADHA’, Mangala Nagar Main Road, Porur, Chennai, 60016
Hill & Smith Infrastructure Products India Private Limited (D)
574, 3rd Floor, Main Road, Chirag Delhi, New Delhi, 110017
Incorporated in IrelandRedman Fisher Limited (U)
Naas Industrial Estate, Naas, Co Kildare, 496407
Hill & Smith (Ireland) Unlimited CompanyCustom House Plaza, block 6International Financial Services CentreDublin

146 Financial Statements
www.hsholdings.com | Stock Code HILS
Five Year Summary
2017£m
2016£m
2015£m
2014£m
2013£m
Revenue 585.1 540.1 467.5 454.7 444.5
Underlying operating profit 81.3 70.6 56.0 49.2 44.5
Underlying profit before taxation 78.5 68.0 53.0 46.0 41.2
Shareholders’ funds 258.6 232.2 198.2 181.5 169.1
Pence Pence Pence Pence Pence
Underlying earnings per share 75.9 65.9 51.7 45.0 40.4
Proposed dividends per share 30.0 26.4 20.7 18.0 16.0

Shareholder Information
See further information at hsholdings.com
148 Financial Calendar149 Shareholder Information150 Principal Group Businesses153 Directors, Contacts and Advisors
Image
Berry Systems rigid post and Berry Beam VRS installed at the Birmingham New Street station multi-storey car park.
Shareholder Information
147

148 Shareholder Information
www.hsholdings.com | Stock Code HILS
Annual General Meeting 2018 17 May 2018
Trading Update 17 May 2018
Ex-dividend date for 2017 final dividend 24 May 2018
Record date 2017 final dividend 25 May 2018
Dividend Reinvestment Plan – last date for election 11 June 2018
Final 2017 ordinary dividend payable 2 July 2018
Announcement of 2018 interim results 8 August 2018
Trading Update 22 November 2018
Payment of 2018 interim dividend 4 January 2019
Financial Calendar
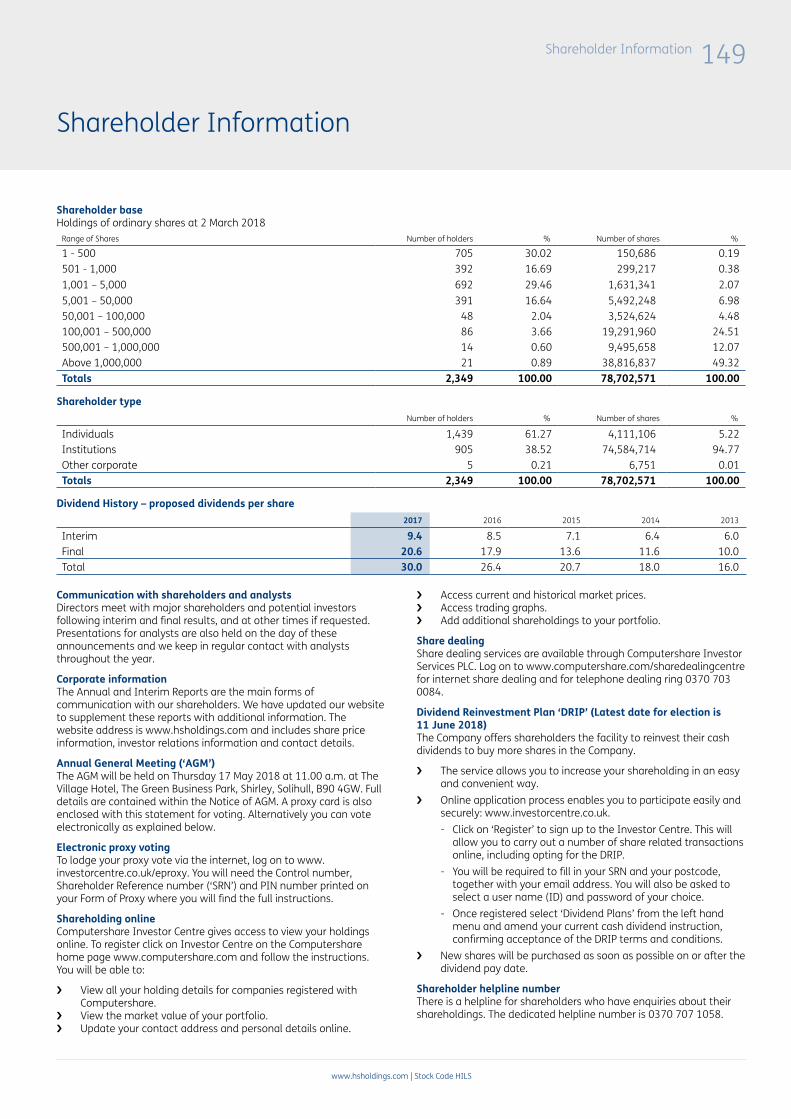
Shareholder Information
www.hsholdings.com | Stock Code HILS
149
Shareholder Information
Shareholder base Holdings of ordinary shares at 2 March 2018
Range of Shares Number of holders % Number of shares %
1 - 500 705 30.02 150,686 0.19501 - 1,000 392 16.69 299,217 0.381,001 – 5,000 692 29.46 1,631,341 2.075,001 – 50,000 391 16.64 5,492,248 6.9850,001 – 100,000 48 2.04 3,524,624 4.48100,001 – 500,000 86 3.66 19,291,960 24.51500,001 – 1,000,000 14 0.60 9,495,658 12.07Above 1,000,000 21 0.89 38,816,837 49.32Totals 2,349 100.00 78,702,571 100.00
Shareholder typeNumber of holders % Number of shares %
Individuals 1,439 61.27 4,111,106 5.22Institutions 905 38.52 74,584,714 94.77Other corporate 5 0.21 6,751 0.01Totals 2,349 100.00 78,702,571 100.00
Dividend History – proposed dividends per share2017 2016 2015 2014 2013
Interim 9.4 8.5 7.1 6.4 6.0Final 20.6 17.9 13.6 11.6 10.0Total 30.0 26.4 20.7 18.0 16.0
Communication with shareholders and analystsDirectors meet with major shareholders and potential investors following interim and final results, and at other times if requested. Presentations for analysts are also held on the day of these announcements and we keep in regular contact with analysts throughout the year.
Corporate informationThe Annual and Interim Reports are the main forms of communication with our shareholders. We have updated our website to supplement these reports with additional information. The website address is www.hsholdings.com and includes share price information, investor relations information and contact details.
Annual General Meeting (‘AGM’)The AGM will be held on Thursday 17 May 2018 at 11.00 a.m. at The Village Hotel, The Green Business Park, Shirley, Solihull, B90 4GW. Full details are contained within the Notice of AGM. A proxy card is also enclosed with this statement for voting. Alternatively you can vote electronically as explained below.
Electronic proxy votingTo lodge your proxy vote via the internet, log on to www.investorcentre.co.uk/eproxy. You will need the Control number, Shareholder Reference number (‘SRN’) and PIN number printed on your Form of Proxy where you will find the full instructions.
Shareholding onlineComputershare Investor Centre gives access to view your holdings online. To register click on Investor Centre on the Computershare home page www.computershare.com and follow the instructions. You will be able to:
› View all your holding details for companies registered with Computershare.
› View the market value of your portfolio. › Update your contact address and personal details online.
› Access current and historical market prices. › Access trading graphs. › Add additional shareholdings to your portfolio.
Share dealingShare dealing services are available through Computershare Investor Services PLC. Log on to www.computershare.com/sharedealingcentre for internet share dealing and for telephone dealing ring 0370 703 0084.
Dividend Reinvestment Plan ‘DRIP’ (Latest date for election is 11 June 2018)The Company offers shareholders the facility to reinvest their cash dividends to buy more shares in the Company.
› The service allows you to increase your shareholding in an easy and convenient way.
› Online application process enables you to participate easily and securely: www.investorcentre.co.uk.- Click on ‘Register’ to sign up to the Investor Centre. This will
allow you to carry out a number of share related transactions online, including opting for the DRIP.
- You will be required to fill in your SRN and your postcode, together with your email address. You will also be asked to select a user name (ID) and password of your choice.
- Once registered select ‘Dividend Plans’ from the left hand menu and amend your current cash dividend instruction, confirming acceptance of the DRIP terms and conditions.
› New shares will be purchased as soon as possible on or after the dividend pay date.
Shareholder helpline numberThere is a helpline for shareholders who have enquiries about their shareholdings. The dedicated helpline number is 0370 707 1058.

150 Shareholder Information
www.hsholdings.com | Stock Code HILS
Principal Group Businesses
Notes:The above lists the Company’s subsidiary undertakings, except for some intermediate holding companies and certain other undertakings of minor importance. Except where indicated, the undertakings are subsidiaries incorporated in Great Britain and the share capital consists of ordinary shares only.* The Company’s effective interest is held indirectly for these undertakings.(D) Operating division only, not a limited company.
Infrastructure Products - Roads
United KingdomHill & Smith LtdHighway and off-highway safety barriersSpringvale Business and Industrial Park,Bilston, Wolverhampton, WV14 0QLTel: +44 (0) 1902 499400Fax: +44 (0) 1902 [email protected]
Asset International Structures (D)Manufacturer of structural solutions including corrugated steel Multiplate, Stren-Cor, Precast arches & VSoL retained earth systems for Highway & Rail construction sectorswww.assetint.co.uk
Asset VRS (D)Permanent and temporary solutionsfor vehicle restraintswww.asset-vrs.co.uk
Berry Systems (D)Car park and industrial barriers, spring steel barriers, protection bollards, speed ramps, handrail panelswww.berrysystems.co.uk
Brifen (D)Wire rope safety fence vehiclerestraints and hostile vehicle mitigation products.www.hill-smith.co.uk
Tegrel (D)Design and manufacture of bespoke metal fabrications and enclosureswww.tegrel.co.uk
Variable Message Signs (D)Design, manufacture and installation of LED based light technology solutionswww.vmstech.co.uk
Hardstaff Barriers Ltd*Temporary and permanent road safety barriersHillside, Gotham Road, Kingston-on-Soar, Nottingham, NG11 0DFTel: +44 (0) 115 983 [email protected]
Mallatite LtdManufacture of lighting columns, bespokesupport structures, traffic sign columns,posts and associated lighting productsHolmewood Industrial Estate, HardwickView Road, Holmewood, Chesterfield,Derbyshire, S42 5SATel: +44 (0) 1246 593280Fax: +44 (0) 1246 [email protected]
Varley & Gulliver LtdVehicle and pedestrian parapets, and passive sign supports57-70 Alfred Street, Sparkbrook, Birmingham, B12 8JRTel: +44 (0) 121 773 2441Fax: +44 (0) 121 766 [email protected]
Rest of the WorldATA Hill & Smith AB*Road safety barriers, road signage and traffic safety solutionsIncorporated in SwedenStaffans väg 7, 192 78, Sollentuna, SwedenTel: +46 (0) 8 98 80 70Fax: +46 (0) 8 29 25 [email protected]
ATA Hill & Smith AS* Road safety barriers, road signage and traffic safety solutions Incorporated in NorwayJacob Borchs Gate 63012 DrammenTel: +47 (0) 32 26 93 [email protected]
Conimast International SAS*Specialist steel lighting columns, galvanizing and steel powder coatingIncorporated in FranceZ.I. La Sauniere BP70, 89600,Saint Florentin, FranceTel: +33 (0) 3 86 43 82 00Fax: +33 (0) 3 86 43 41 [email protected]
Hill & Smith, Inc.*Temporary road barrier solutions for workzone protectionIncorporated in the USA987 Buckeye Park Road, Columbus,Ohio, 43207, USATel: +1 (614) 340 6294Fax: +1 (614) 340 [email protected]
Hill & Smith Pty Ltd*Wire rope and temporary safety barriersIncorporated in AustraliaUnit 1, 242 New Cleveland Road,Tingalpa, QLD 4173, AustraliaTel: +61 (0) 7 3162 6078www.hsroads.com.au

Shareholder Information
www.hsholdings.com | Stock Code HILS
151
Notes:The above lists the Company’s subsidiary undertakings, except for some intermediate holding companies and certain other undertakings of minor importance. Except where indicated, the undertakings are subsidiaries incorporated in Great Britain and the share capital consists of ordinary shares only.* The Company’s effective interest is held indirectly for these undertakings.** Trading name for V&S Schuler Engineering Inc and V&S Schuler Tubular Products LLC, both are indirectly held, wholly owned and incorporated in the USA.
Infrastructure Products - UtilitiesUnited KingdomAsset International LtdWeholite HDPE structured wall, large diameter pipes, for use in the water and construction sectorsStephenson Street, Newport,South Wales, NP19 4XHTel: +44 (0) 1633 273081Fax: +44 (0) 1633 [email protected]
Barkers Engineering Ltd*Perimeter security solutions and fastenersDuke Street, Fenton, Stoke-on-Trent,Staffordshire, ST4 3NSTel: +44 (0) 1782 319264Fax: +44 (0) 1782 [email protected]
Birtley Group Ltd*Galvanized lintels, construction fittings, composite doors, Expamet builders metalwork & plasterers accessoriesMary Avenue, Birtley, County Durham,DH3 1JFTel: +44 (0) 191 410 6631Fax: +44 (0) 191 410 [email protected]
Lionweld Kennedy Flooring LtdOpen steel flooring, handrailing andancillary productsMarsh Road, Middlesbrough, TS1 5JSTel: +44 (0) 1642 245151Fax: +44 (0) 1642 [email protected]
Technocover Ltd*Steel security solutionsHenfaes Lane, Welshpool, Powys, SY21 7BETel: +44 (0) 1938 555511Fax: +44 (0) 1938 [email protected]
United States of America Creative Pultrusions, Inc.*Manufacture of fibre reinforced polymer (FRP) compositeprofiles214 Industrial Lane, Alum Bank,Pennsylvania, 15521, USATel: +1 (814) 839 4186Toll-free: # 888-CPI-PULL (274-7855)Fax: +1 (814) 839 [email protected]
E.T. Techtonics (D)Design and construction of fiberglass bridge and boardwalk systemswww.ettechtonics.com
Kenway Corp. (D)Specialises in custom composite manufacturing and field servicewww.kenway.com
Tower Tech (D)Manufacturer of composite cooling towerswww.towertechinc.com
V&S Utilities**Fabrication of electrical transmission and substation structures and supplier of substation packaging services987 Buckeye Park Road, Columbus, Ohio, 43207, USATel: +1 (614) 449 8281Fax: +1 (614) 449 [email protected]
Bergen Pipe Supports, Inc.*Manufacture and supply of pipe supports solutions, including constant and variable effort supports484 Galiffa Drive, Donora, Pennsylvania, 15033, USATel: +1 (724) 379 5212 Fax: +1 (724) 379 9363 www.pipesupports.com
Carpenter & Paterson, Inc.*Industrial pipe hangers, metal framing channel and fasteners 434 Latigue RoadWaggamanLA 70094, USATel: +1 504 431 7722Fax: +4 504 431 7900www.pipehangers.com
Novia Associates (D)Vibration and seismic control manufacturerwww.cp-novia.com
Pipe SupportsBergen Pipe Supports India Private Ltd*Incorporated in IndiaPlot No.12, Ground Floor, “RADHA”, Mangala Nagar Main Road, Porur, Chennai, 600116Tel: +91 8576 305 [email protected]

152 Shareholder Information
www.hsholdings.com | Stock Code HILS
Notes:The above lists the Company’s subsidiary undertakings, except for some intermediate holding companies and certain other undertakings of minor importance. Except where indicated, the undertakings are subsidiaries incorporated in Great Britain and the share capital consists of ordinary shares only.* The Company’s effective interest is held indirectly for these undertakings.
Principal Group Businesses (continued)
Galvanizing Services
United KingdomJoseph Ash Ltd*Galvanizing servicesAlcora Building 2, Mucklow HillHalesowen, West Midlands, B62 8DGTel: +44 (0) 121 504 2560Fax: +44 (0) 121 504 [email protected]
Medway Galvanising Company Ltd*Galvanizing, shotblasting and powder coating services together with monohinge gatesCastle Road, Eurolink Industrial Centre, Sittingbourne, Kent, ME10 3RNTel: +44 (0) 1795 479489Fax: +44 (0) 1795 477598 [email protected]/location/medway
Premier Galvanizing Ltd*Galvanizing and powder coating servicesUnit 25, Stoneferry Business ParkFoster Street, East Riding of Yorkshire, HU8 8BTTel: +44 (0) 1482 587587Fax: +44 (0) 1482 [email protected]
Barkers Engineering Ltd*Galvanizing and powder coating servicesDuke Street, Fenton, Stoke-on-Trent,Staffordshire, ST4 3NSTel: +44 (0) 1782 343811Fax: +44 (0) 1782 [email protected]
Birtley Group Ltd*Galvanizing servicesMary Avenue, Birtley, County Durham,DH3 1JFTel: +44 (0) 191 410 4421Fax: +44 (0) 191 492 [email protected]
United States of America Voigt & Schweitzer LLC*Galvanizing services987 Buckeye Park Road, ColumbusOhio, 43207, USATel: +1 (614) 449 8281Fax: +1 (614) 449 [email protected]
FranceFrance Galva SA*Galvanizing and powder coaters of steelZ.I. La Saunière BP70, 89600Saint Florentin, FranceTel: +33 (0) 3 86 43 82 30Fax: +33 (0) 3 86 43 82 [email protected]

Shareholder Information
www.hsholdings.com | Stock Code HILS
153
Directors
J F Lennox LLB, CA(Chairman and Non-executive)
D W Muir BSc, CEng, MICE(Group Chief Executive)
M Pegler BCom, FCA(Group Finance Director and Managing Director - UK Utilities division)
A C B Giddins FCA(Senior Independent Non-executive)
A M Kelleher MSc, BA(Independent Non-executive)
M J Reckitt BCom, CA(Independent Non-executive)
Contacts
Hill & Smith Holdings PLCRegistered OfficeWesthaven HouseArleston WayShirley, SolihullWest MidlandsB90 4LH
Tel: +44 (0) 121 704 7430Fax: +44 (0) 121 704 7439
Registration DetailsRegistered in England and WalesCompany Number: 671474
Company Websitewww.hsholdings.com
Company SecretaryAlex Henderson FCIS
Professional Advisors
AuditorsKPMG LLP1 SnowhillSnow Hill QueenswayBirminghamB4 6GH
Brokers and Financial AdvisorsInvestec Investment Banking2 Gresham StreetLondonEC2V 7QP
Principal BankersBarclays Bank PlcMidlands Corporate Banking CentrePO Box 33331 SnowhillSnow Hill QueenswayBirminghamB3 2WN
LawyersGowling WLGTwo SnowhillBirminghamB4 6WR
Silks SolicitorsBarclays Bank ChambersBirmingham StreetOldburyB69 4EZ
Financial Public RelationsMHP Communications6 Agar Street London WC2N 4HN
Directors, Contacts & Advisors

Hill & Smith Holdings PLCWesthaven House, Arleston Way, Shirley, Solihull, B90 4LH, United Kingdom
Tel: +44 (0) 121 704 7430Fax: +44 (0) 121 704 7439
www.hsholdings.com

Annual Report 2017Hill & Sm
ith Holdings PLC