2017 in-house creative industry report · art direction and design: josh cancel, art director, the...
TRANSCRIPT


2017 In-House Creative Industry Report
Lead Analyst and Author: Cindy Ponce, Practice Lead, CellaArt Direction and Design: Josh Cancel, Art Director, The BOSS GroupProject Lead: Veronica Vannoy, Director of Marketing, The BOSS GroupCopy Editor, Proofreader: Maria Elharaoui, The BOSS Group

12017 In-House Creative Industry Report
Our goal is to benchmark the operations of in-house creative services groups to gain insights into industry standards and best practices that will support you in driving your business decisions and validate the direction of your department to upper management. We encourage you to share the findings among your colleagues and industry peers.
We ask that you cite the source as:The BOSS Group and Cella Consulting, LLC. 2017 In-House Creative Industry Report, May 2017.
TABLE OF CONTENTS
INTRODUCTION
About the Report ............................................................................................................................................................. 2
Executive Summary ..........................................................................................................................................................3
HIGHLIGHTS FROM THE 2017 REPORT ......................................................................................................................... 4
Perspective from the Field: Tectonic Shifts and the New Paradigm .................................................................... 6
SURVEY RESULTS
Department Organization .............................................................................................................................................. 8
Department Funding....................................................................................................................................................... 13
Department Resourcing ................................................................................................................................................21
Perspective from the Field: Becoming a Strategic Partner and AOR for a Line of Business .......................26
Service Offerings ........................................................................................................................................................... 27
Perspective from the Field: The Perpetual Evolution of a Digital Design Team ..............................................35
Partnerships ....................................................................................................................................................................36
Global Operations ..........................................................................................................................................................39
Perspective from the Field: The Impact of Process Improvement ......................................................................41
Processes .........................................................................................................................................................................42
Technology ......................................................................................................................................................................45
Values & Challenges of In-House Teams ...................................................................................................................49
Creative Leader Job Market ........................................................................................................................................52
APPENDIX
Survey Participant Demographics .............................................................................................................................56
Industries Represented ................................................................................................................................................ 57

About the ReportThe BOSS Group and Cella are thrilled to bring you the 2017 In-House Creative Industry Report, which benchmarks the in-house creative community and reports on strategies that leaders can use to guide the path of their departments/agencies. Benchmarking will help identify gaps in an organization and generate potential paths and solutions, but personal, innovative thinking and institutional knowledge should not be eliminated from the process.
We hope the data and insights included in this report continue to provide a source of validation and direction, contributing to a more effective and efficient operating model. The report is published annually, and we welcome your insights and ideas to help us continually improve the report.
The In-House Creative Industry Report was first published in 2010 following a collaboration between InSource and Cella based on the shared goals of providing in-house creative leaders with a resource to support and inform their decision making, as well as tracking and reporting industry trends.
Survey RespondentsMore than 375 leaders from in-house creative departments responded to our survey conducted in January 2017. These leaders represent Fortune 1000 companies, as well as middle market and not-for-profit organizations and span multiple industries including, but not limited to, banking/financial services, consumer products, education, health care, manufacturing and not-for-profit. More information about the demographics of our survey respondents is available in the Appendix.
Perspectives from the FieldIncluded in this report are four Perspectives from the Field articles written by in-house creative leaders on shared challenges and goals across the industry. We asked these leaders to share their stories across topics covering the new paradigm shift of in-house creative teams managing outside creative agencies, becoming a strategic partner and AOR, consolidating and evolving a large digital design team and the impact of process improvement. www.cellaconsulting.com/Content-and-Community/Perspectives-From-the-Field/
Resource Links
New Resource Links for 2017 Previous Resource Links
© 2017 The BOSS Group and Cella Consulting, LLC. All Rights Reserved.
* The opinions expressed in these articles are those of the writers and do not necessarily reflect the views of The BOSS Group or Cella.
2 2017 In-House Creative Industry Report
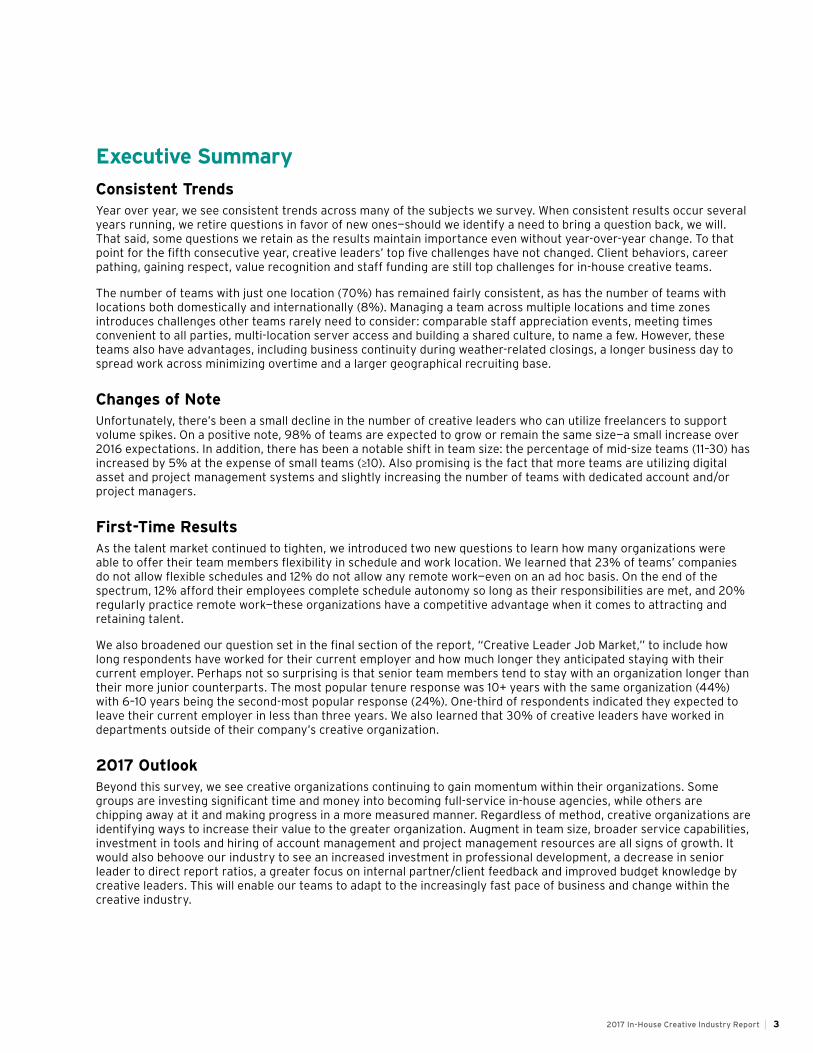
Executive Summary
Consistent TrendsYear over year, we see consistent trends across many of the subjects we survey. When consistent results occur several years running, we retire questions in favor of new ones—should we identify a need to bring a question back, we will. That said, some questions we retain as the results maintain importance even without year-over-year change. To that point for the fifth consecutive year, creative leaders’ top five challenges have not changed. Client behaviors, career pathing, gaining respect, value recognition and staff funding are still top challenges for in-house creative teams.
The number of teams with just one location (70%) has remained fairly consistent, as has the number of teams with locations both domestically and internationally (8%). Managing a team across multiple locations and time zones introduces challenges other teams rarely need to consider: comparable staff appreciation events, meeting times convenient to all parties, multi-location server access and building a shared culture, to name a few. However, these teams also have advantages, including business continuity during weather-related closings, a longer business day to spread work across minimizing overtime and a larger geographical recruiting base.
Changes of NoteUnfortunately, there’s been a small decline in the number of creative leaders who can utilize freelancers to support volume spikes. On a positive note, 98% of teams are expected to grow or remain the same size—a small increase over 2016 expectations. In addition, there has been a notable shift in team size: the percentage of mid-size teams (11–30) has increased by 5% at the expense of small teams (≥10). Also promising is the fact that more teams are utilizing digital asset and project management systems and slightly increasing the number of teams with dedicated account and/or project managers.
First-Time ResultsAs the talent market continued to tighten, we introduced two new questions to learn how many organizations were able to offer their team members flexibility in schedule and work location. We learned that 23% of teams’ companies do not allow flexible schedules and 12% do not allow any remote work—even on an ad hoc basis. On the end of the spectrum, 12% afford their employees complete schedule autonomy so long as their responsibilities are met, and 20% regularly practice remote work—these organizations have a competitive advantage when it comes to attracting and retaining talent.
We also broadened our question set in the final section of the report, “Creative Leader Job Market,” to include how long respondents have worked for their current employer and how much longer they anticipated staying with their current employer. Perhaps not so surprising is that senior team members tend to stay with an organization longer than their more junior counterparts. The most popular tenure response was 10+ years with the same organization (44%) with 6–10 years being the second-most popular response (24%). One-third of respondents indicated they expected to leave their current employer in less than three years. We also learned that 30% of creative leaders have worked in departments outside of their company’s creative organization.
2017 OutlookBeyond this survey, we see creative organizations continuing to gain momentum within their organizations. Some groups are investing significant time and money into becoming full-service in-house agencies, while others are chipping away at it and making progress in a more measured manner. Regardless of method, creative organizations are identifying ways to increase their value to the greater organization. Augment in team size, broader service capabilities, investment in tools and hiring of account management and project management resources are all signs of growth. It would also behoove our industry to see an increased investment in professional development, a decrease in senior leader to direct report ratios, a greater focus on internal partner/client feedback and improved budget knowledge by creative leaders. This will enable our teams to adapt to the increasingly fast pace of business and change within the creative industry.
32017 In-House Creative Industry Report
460+540=
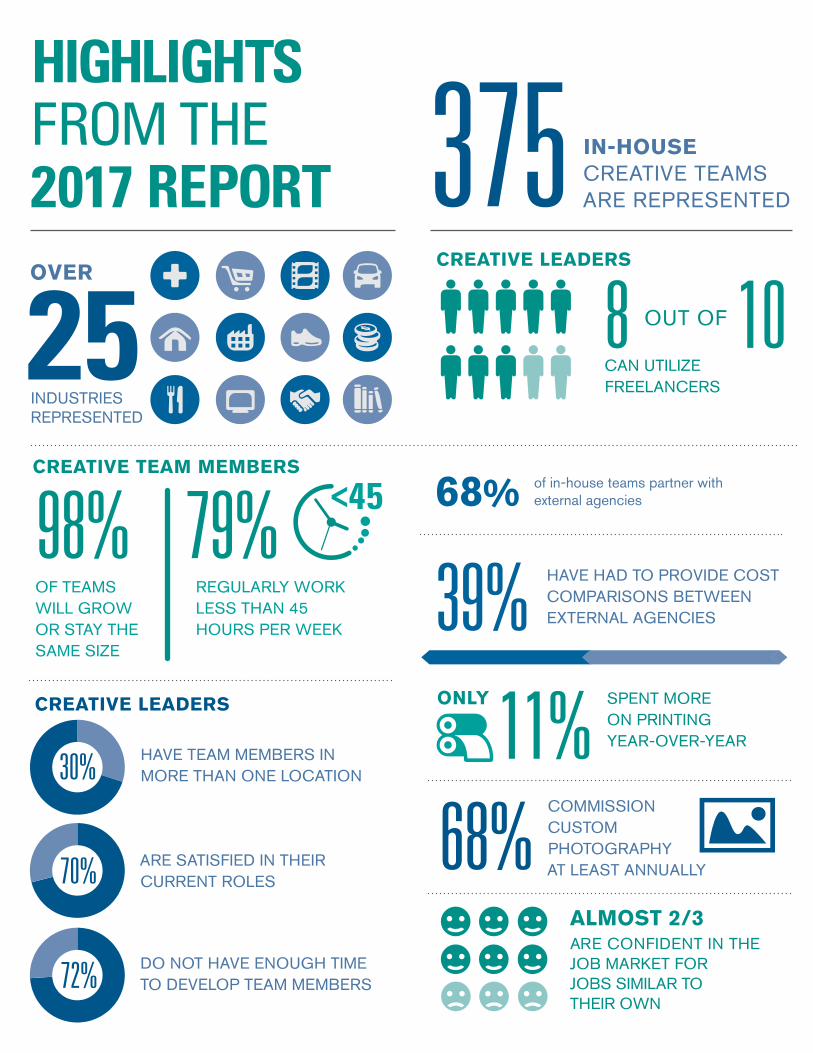
HIGHLIGHTSFROM THE 2017 REPORT
IN-HOUSE CREATIVE TEAMS ARE REPRESENTED
INDUSTRIES REPRESENTED
CREATIVE LEADERS
CAN UTILIZEFREELANCERS
ONLY
OVER
375
39%
11%
25
68%
8 10OUT OF
ALMOST 2/3ARE CONFIDENT IN THEJOB MARKET FOR JOBS SIMILAR TOTHEIR OWN
COMMISSION CUSTOM PHOTOGRAPHY AT LEAST ANNUALLY
HAVE TEAM MEMBERS IN MORE THAN ONE LOCATION30+70+A30%
ARE SATISFIED IN THEIR CURRENT ROLES71+29+A70%
DO NOT HAVE ENOUGH TIME TO DEVELOP TEAM MEMBERS74+26+A72%
HAVE HAD TO PROVIDE COST COMPARISONS BETWEEN EXTERNAL AGENCIES
SPENT MORE ON PRINTING YEAR-OVER-YEAR
68% of in-house teams partner with external agencies
CREATIVE TEAM MEMBERS
79%98%OF TEAMS WILL GROW OR STAY THE SAME SIZE
REGULARLY WORK LESS THAN 45 HOURS PER WEEK
<45
CREATIVE LEADERS

600+400= 880+120=
245+255= 335+165=
OF THE FORTUNE 500 PARTICIPATED
IDENTIFY BRAND KNOWLEDGE AS PART OF THEIR VALUE PROPOSITION19%
63%
Do you have a dedicated resource managing your project management tool?
Do you have a dedicated resource managing your DAM system?
have a dedicated or hybrid project management tool administrator role
have some level of processes documented
have dedicated account and/or project managers
have a hybrid role with other
functional responsibilities
have a tool administrator
have a hybrid role with other
functional responsibilities
have a dedicated or hybrid DAM librarian role
have a DAM librarian
Video EditingLocation Videography
Webcasting2-D Video GraphicsStudio Videography3-D Video Graphics
PROVIDE VIDEO PRODUCTION SERVICES
19% 48%56%
51% $81-100MOST COMMON BLENDED CHARGEBACK RATE
84%
20%75% 68%
87%PRIMARILY USE HD RESOLUTION TO SHOOT AND EDIT IN 1920x1080
1280x720
93%
DIGITAL ASSET
How many utilize management systems?
PROJECT MANAGEMENT
54%850+150=
OF IN-HOUSE TEAMS SUPPORT ADVERTISING
PROVIDE GRAPHIC CONTENT FOR SOCIAL MEDIA
84%
99%74%
6 2017 In-House Creative Industry Report
PERSPECTIVE FROM THE FIELD
Tectonic Shifts and The New Paradigm
There is no more exciting time to be a creative professional than now. If you haven’t noticed yet, we are in the midst of a paradigm shift in the creative industry. Some of the best creative work in design, advertising, photography and video has been coming from in-house teams for many years now. This has only escalated the shift of corporations leveraging in-house talent more than I can ever remember in my 25-year career. Those of us who are in-house, or serve the in-house community, have been saying it for longer than the seven years this report has been produced — in-house is growing. From my perspective, in-house is really just coming of age. We’re finding our stride, and the rest of the industry is settling into a new operating model.
When we say “in-house is growing,” we don’t just mean that in-house teams are growing per-se. In fact, many teams are about the same size now as they have been for the last few years. No, when we say “in-house is growing” we mean to say that our accountability to the companies we work for, and the responsibility to the brands we serve, is greater now – and increasing – more than ever before. More accountability naturally means more projects of all kinds are coming our way, but without increased headcount, how is it going to get done? We’re going to have to send it out.
That’s not really new information to us, but the real shift we are seeing is this: Outside agencies were once managed by marketing without the involvement of
in-house creative counterparts. Now, thanks to years of sweat equity and proving themselves, in-house creative groups are tasked with managing those same outside agency relationships. The very same agencies we used to view as our competitors are now under our management. In this new era, we see the in-house creative leader partnering with the outside agency creative leader more often than they ever did in the past. And the work is better for it.
What’s more, the shift in accountability to in-house teams also brings a shift in the division of labor. As more in-house teams increase their project management – or should we say creative operations - capabilities, they find that it is often more effective (and less costly) to assign work out to smaller, specialized, nimble studios and freelance resources. As such, agencies are finding the need to change their models too in order to better support and partner with their in-house counterpart/clients.
Yes, it’s a brave new world. And any agency – in-house or outside – that isn’t adapting to the new model our industry appears to be settling into is going to find themselves facing greater challenges. It’s no longer us vs. them, in-house vs. outside agencies. No, the brands that win will have in-house and outside creative partnerships. And the work, and creative opportunities, will be better for it.
ABOUT
THE
AUTHOR
ANDY BRENITSAndy is the President of InSource, the professional association for in-house creative leadership and management. He is an experienced branding and creative strategist with extensive in-house leadership experience. He has built and led several creative teams for major brands such as Banana Republic, The Gap, National Football League, KPMG, and Arizona Public Service. He is also an advisor to the HOW Design Live conference who speaks, writes and consults on creative management issues.

72017 In-House Creative Industry Report
Survey
Results

8 2017 In-House Creative Industry Report
Department OrganizationSeventy-four percent of responding creative leaders indicated their department reported through a strategic, value-adding department such as marketing, communications, advertising, brand or some combination of those divisions. When the creative team is positioned within one of these divisions, the organization is more likely to be considered strategic and value-adding. In contrast, when a creative team reports through a shared-services division, the department is often viewed as a commodity, which makes it more difficult to succeed in becoming a strategic partner. It is possible to overcome the disadvantage of not being aligned with the marketing (or a like) department; it just requires the creative team to create a brand for itself outside of its “home.”
Leaders of in-house groups regularly face ongoing competing priorities, leaving them without adequate time to develop their leadership teams. It is important that leaders prioritize professional development for themselves and their direct reports to ensure the ongoing growth and success of the team members and group. 8
+2+2+1+1+11+44+12+11+8+

*NOTE: PERCENTAGES MAY NOT EQUAL 100% DUE TO ROUNDING.
92017 In-House Creative Industry Report
DEPARTMENT ORGANIZATION
8+2+2+1+1+11+44+12+11+8+Q: Into which division does your creative services department report?
1 Hybrid of two or more: Advertising, Brand, Marketing, Communications and/or Sales
2 Other includes advertising, brand and public affairs
3 Other includes but is not limited to: legal, finance, misc. executive
n=376
RELATED RESOURCES
The Missions of In-House Creative Teams bit.ly/2p17IPB
What it Means to be a Creative Center of Excellence bit.ly/2p0XNJv
Where Should the Creative Department Reside?bit.ly/ZwAaFR
Our Invisible and Sometimes Forgotten Clients bit.ly/24rPcvE
44%marketing
12%hybrid1
11%communications
7%other2
7%operations
12%other3
2%information technology
2%business
development sales
1%print production
services
1%human
resources
74% strategicdivisions
25% nonstrategic
divisions

*NOTE: PERCENTAGES MAY NOT EQUAL 100% DUE TO ROUNDING.
10 2017 In-House Creative Industry Report
DEPARTMENT ORGANIZATION41+10+10+7+6+5+4+4+3+2+2+2+2+1+1+1+
37+36+20+3+2+1+1+
Q: To which senior executive does your division report?
n=353
n=353
41%
10%
10%
7%
6%
5%
4%
4%
3%
2%
2%
2%
2%
1%
1%
1%
Chief Marketing Officer
Chief Executive Officer
Chief Communications Officer
Chief Operating Officer
Head of Shared Services
Unspecified VP, SVP, EVP or President
General Manager
Sales & Marketing
None of the above, we are a Higher Ed group
Chief Technology Officer
Other C-Level
Chief Financial Officer
Other
Chief Information Officer
Marketing & Communications
Human Resources
Q: Which best describes your in-house agency model?
37%full-time
staff
36%full-time staff + contingent labor
20%full-time staff +
contingent labor + partial outsourcing
3%Managed in-house
agency
1%full-time staff
managing outside agencies
1%Outsourced
2%full-time staff +
contingent labor + partial managed
services
28+8+64

*NOTE: PERCENTAGES MAY NOT EQUAL 100% DUE TO ROUNDING.
112017 In-House Creative Industry Report
DEPARTMENT ORGANIZATION
28+8+64
6+67+15+1220+13+34+24+9
Q: How many direct reports does the senior-most creative leader have?
n=341
n=343
20%> 10
13%7-9
34%4-6
24%2-3
9%1
¬ While there is not an overwhelming majority response to the number of direct reports per role, there is a strong correlation between seniority and number of direct reports.
Q: Do you have adequate time to provide your team coaching and development?
64%not enough time
28% adequate time
8% no time
at all
9+37+39+11+4Q: On average, how many direct reports do first
front-line managers have?
n=339
n=352
37%4-6
39%2-3
9%7-9
11%1
Q: How is your team organized?
67%by functional area (Account Services,
Design, Copywriting, etc.)
12%
15%
4%> 10
by line of business (LOB)
(dedicated cross-functional teams to a LOB)
by functional area with specific
resources aligned by line of business
6%other
¬ 7 or more direct reports is simply too many for the head of creative as his/her responsibilities are typically broad and strategic in nature; a high number of direct reports distracts from his/her core responsibilities.
*NOTE: PERCENTAGES MAY NOT EQUAL 100% DUE TO ROUNDING.
12 2017 In-House Creative Industry Report
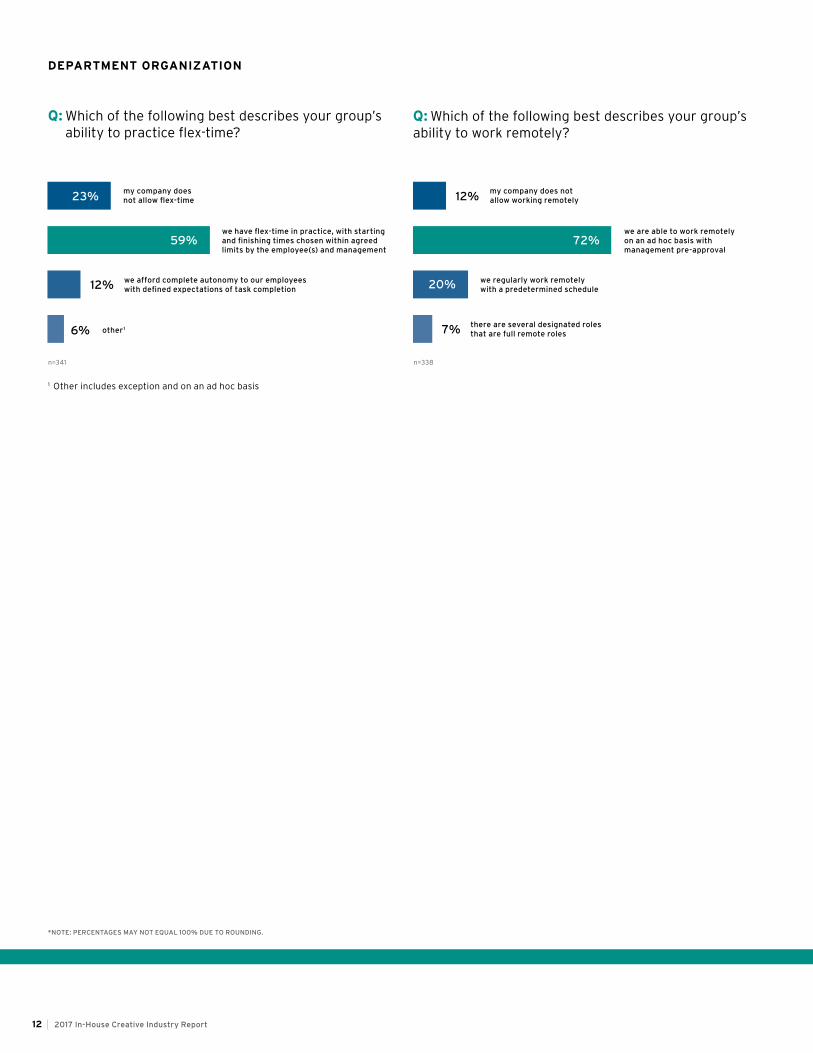
23+59+12+6+ 12+72+20+7+Q: Which of the following best describes your group’s
ability to practice flex-time?
n=341 n=338
12%
6% 7%
23% 12%
59% 72%
20%
Q: Which of the following best describes your group’s ability to work remotely?
1 Other includes exception and on an ad hoc basis
my company does not allow flex-time
my company does not allow working remotely
we have flex-time in practice, with starting and finishing times chosen within agreed limits by the employee(s) and management
we are able to work remotely on an ad hoc basis with management pre-approval
we afford complete autonomy to our employees with defined expectations of task completion
we regularly work remotely with a predetermined schedule
other1there are several designated roles that are full remote roles
DEPARTMENT ORGANIZATION
132017 In-House Creative Industry Report
Department FundingRegardless of an in-house agency’s financial model, proving the group’s value is a constant expectation. Tangible results stem from managing your group’s budget and demonstrating cost savings against external agencies.
Funding Models
Instituting a chargeback funding model is a natural evolution for an internal creative services organization and an important step in eliminating a number of challenges common to “free” creative services. Typically, this shift is due to several factors, including department size, project volume/workload, resourcing and competition with outside agencies. This evolution requires many organizational changes that include standardization of processes and procedures, internal marketing activities, realignment of resources and improved project management. Moving to a chargeback model signals the team will operate more like a creative agency in both business operations and creative direction.
Being a cost center (non-chargeback department) can be a great thing — the creative leader can focus on the value of the creative that his or her team is creating and won’t be burdened by financial pressures. However, the most significant challenges for non-chargeback departments still remains affecting client behaviors.
Non-Personnel Budget
Outside of labor, creative leaders’ budget items typically fall into three main categories: technology, professional development and supplies. Most tellingly, 35% of creative leaders have very limited funding for training — the most critical component of a creative department’s non-personnel budget, as our team members must continue to develop their skills in order to meet expectations in the changing communications environment.

70+23+768+17+15
30+13+12+21+13+4+1+3+3*NOTE: PERCENTAGES MAY NOT EQUAL 100% DUE TO ROUNDING.
14 2017 In-House Creative Industry Report
How to Calculate Cost Savingsbit.ly/1n1kAzi
Challenges to Cost Savings Metricbit.ly/1QBAN5N
The Appeal of a Hybrid Funding Modelbit.ly/15JDtfy
DEPARTMENT FUNDING
Q: Which of the following best describes ownership of your department’s overall budget?
n=334
13%
13%
12%
4%
1%
3%
3%
RELATED RESOURCES
Q: Does your creative group work with an aligned procurement partner who specializes in optimizing your company’s creative/marketing spend?
7%I’m not
sure
70%no
23%yes
¬ The smaller a creative services team, the more likely they are to not charge back. Case in point: only 26% of departments with fewer than 30 team members charge back, whereas 48% of teams with 30+ members do.
Q: Have you ever been asked to provide a cost comparison between your in-house team and comparable external agencies?
61+3961%no
39%yes
n=334
n=335
Q: Is your department a chargeback organization for creative services projects (not including any pass through costs)?
n=335
68%no, we are not a
chargeback organization
17%yes, we charge back
15%yes, for specific clients and/or
services
I create and manage my team’s personnel and operating budget
I manage my team’s personnel and operating budget and have significant input into the creation of the budget
I have input but do not manage our team’s budget
I manage my team’s personnel and operating budget and have limited input into the creation of the budget
I am not privy to it
I manage my team’s personnel and operating budget but have no input into the creation of the budget
I am not privy to my team’s budget outside of headcount allowances
I am not privy to my team’s budget outside of headcount allowances and a few other buckets of spending (e.g., training and contractors)
other
21%
30% 35+14+16+3+3+5+6+1+11+6

*NOTE: PERCENTAGES MAY NOT EQUAL 100% DUE TO ROUNDING.
152017 In-House Creative Industry Report
Building a Chargeback Model bit.ly/2oikZPI
Determining Your Chargeback Ratebit.ly/10DrrDy
DEPARTMENT FUNDING35+14+16+3+3+5+6+1+11+648+29+9+14 70+25+5+¬ Almost half of creative leaders are working without a goal or
substantiated goal; if you fall in this category, make it a priority to change this in the beginning of your next fiscal year.
¬ Cost savings is becoming one of the most prolific metrics in the industry. If not currently tracked, consider implementing in 2017.
Q: What costs are you required to recover through your chargebacks?
n=100
Q: What is the most common method used to charge clients?
Q: Which most accurately describes your chargeback model?
48%blended hourly rate 70%
subsidized chargeback
29%service-specific
hourly rate
9%flat project rate
14%other
25%full-cost recovery
¬ Three-quarters of chargeback teams recover through an hourly model.
n=100 n=101
5%profit requirement
35%
14%
16%
3%
3%
5%
6%
6%
11%
1%
there is no specific recovery goal
a flat number provided by finance/other that is not substantiated to us
a flat number or % of operating costs provided by finance/other
total personnel costs + a portion of direct operating expenses
total personnel costs + total direct operating expenses
all costs plus profit
ALL COSTS: total personnel costs + total direct operating expenses + total overhead
total personnel costs + total direct operating expenses + a portion of overhead (rent, utilities)
personnel salaries only
total personnel costs (salary, benefits, taxes, etc.)
RELATED RESOURCES

*NOTE: PERCENTAGES MAY NOT EQUAL 100% DUE TO ROUNDING.
16 2017 In-House Creative Industry Report
DEPARTMENT FUNDING
Q: What is your blended hourly rate for creative services?
Q: What is your hourly rate for the following services?
NOTE: ADDITIONAL RESPONDENTS CHOSE “WE DO NOT PROVIDE THIS SERVICE;” THOSE RESPONSES WERE ELIMINATED TO FOCUS THE RESULTS ON RATES.
ANSWER OPTIONSWe don’t charge for this
<$50 $51–$65 $66–$80 $81–$100 $101–$120 $121–$140 $141–$160 >$160 n=
Account management 43% 21% 0% 21% 7% 0% 0% 7% 0% 14
Project management 36% 18% 9% 23% 9% 0% 5% 0% 0% 22
Production design 8% 28% 16% 32% 8% 0% 8% 0% 0% 25
Graphic design 4% 20% 20% 32% 12% 0% 12% 0% 0% 25
Web/Multimedia design 8% 13% 13% 29% 21% 8% 8% 0% 0% 24
Creative direction 28% 4% 12% 8% 12% 24% 12% 0% 0% 25
Copywriting 31% 13% 13% 19% 6% 13% 6% 0% 0% 16
Copyediting 28% 17% 11% 22% 17% 6% 0% 0% 0% 18
Proofreading 42% 11% 16% 26% 0% 5% 0% 0% 0% 19
Print procurement services 40% 5% 25% 20% 5% 5% 0% 0% 0% 20
Video production 13% 6% 6% 6% 31% 25% 13% 0% 0% 16
ANSWER OPTIONS <$50 $51–$65 $66–$80 $81–$100 $101–$120 $121–$140 $141–$160 >$160 n=
Blended Hourly Rate 23% 10% 15% 28% 8% 6% 8% 2% 48
¬ While the $81-$100/hr was the most frequently selected response, almost half of respondents indicated a chargeback rate below that range. Of the teams charging less, almost 90% are subsidized chargeback teams.
65+64+63+58+56+54+47+43+32+27+8

*NOTE: PERCENTAGES MAY NOT EQUAL 100% DUE TO ROUNDING.
172017 In-House Creative Industry Report
Chargebacks: A Double-Edged Swordbit.ly/17Zf4C2
DEPARTMENT FUNDING51+51+50+48+31+28+22+17+965+64+63+58+56+54+47+43+32+27+8
Q: What are the key BENEFITS your department experiences as a result of charging your clients for services?
Q: What are the key DRAWBACKS that your department is experiencing as a result of charging your clients for services?
n=89
encourages efficient use of time and resources by the clients
allows departments to provide fair and balanced support to a variety of clients
clear value recognition as compared to using similar services on the outside
clients recognize the value of creative services
allows for adjustment to corporate and economic changes
allows for the funding of innovation-based activities
I see no benefits in our charge system
allows for resource flexibility
encourages efficient use of time and resources by the creative department
n=88
promotes accountability and transparency into the financial management of the department
positions team as a vendor instead of a partner and colleague
clients find cheap or free alternatives for creative communication to avoid the charge for services
too much time and money spent on administrative requirements of the charge system
clients feel rates are too expensive
funding for the department is not secure
increased and unnecessary scrutiny into the operation by management and/or finance
Stifles the quality of creative
The associated polices and procedures are difficult to mandate in the creative department
I see no drawbacks in our charge system
65% 51%
51%
50%
48%
31%
28%
22%
17%
9%
64%
63%
58%
56%
54%
47%
43%
32%
27%
8%
provides metrics needed to make sound operations and staffing-related decisions
RELATED RESOURCES

*NOTE: PERCENTAGES MAY NOT EQUAL 100% DUE TO ROUNDING.
18 2017 In-House Creative Industry Report
DEPARTMENT FUNDING: NON-CHARGEBACK MODEL59+55+50+31+31+13+7+677+69+59+57+50+49+48+25+24+4
minimal reporting requirementsclient behaviors are difficult to manage because there is no implication to misuse/abuse
projects with questionable impact/value
difficulty justifying value in a quantitative manner
adding new headcount
clients don’t highly value our services because “free” is inferior/lower perceived value
too high of demand
projects that don’t reach completion regardless of effort exerted
bringing on temporary/freelance staff to support peak periods
limited or no increases to funding for non-personnel costs
I see no challenges in not charging clients
plentiful business due to lack of direct costs
no financial pressures
relatively easy to add freelancers/temps to team when demand dictates
technology is upgraded within reasonable periods of time
budget is increased annually to support growth for non-personnel costs
relatively easy to add new headcount to team (throughout and/or in new budget year)
I see no benefits in not charging clients
59% 77%
69%
59%
57%
50%
49%
48%
25%
24%
4%
55%
50%
31%
31%
7%
6%
13%
Q: What are the key BENEFITS your department experiences as a result of NOT charging your clients for services?
Q: What are the key CHALLENGES that your department experiences as a result of NOT charging your clients for services?
n=223
n=228
67+65+64+63+63+49+43+32+23+22+17+6

*NOTE: PERCENTAGES MAY NOT EQUAL 100% DUE TO ROUNDING.
192017 In-House Creative Industry Report
67+65+64+63+63+49+43+32+23+22+17+6
Q: How do you use your non-personnel/direct operating budget?
¬ 4 out of 10 creative leaders find their non-personnel budgets to be inadequate.
n=312
Q: Does your team have an established training budget each year?
35+26+18+17+4n=313
35%yes
26%no, funding for
training is limited and approved individually
18%no, but most
requests are approved
17%yes, but I am not privy to the amount
industry events and conferences
software and related upgrades
online training (e.g., lynda.com)
stock art
hardware and related upgrades
team outings for morale and bonding purposes (lunches, dinners)
travel/transportation
soft skills training/coaching (leadership, project management, negotiation)
software training led by live instructor
team outings for creative enrichment purposes (museums, studio tours)
consulting services
other (please specify)
67%
65%
64%
63%
63%
49%
43%
32%
23%
22%
17%
6%
4%other
DEPARTMENT FUNDING: NON-PERSONNEL BUDGET

*NOTE: PERCENTAGES MAY NOT EQUAL 100% DUE TO ROUNDING.
20 2017 In-House Creative Industry Report
Get Serious About Professional Development bit.ly/1kdgXRO
Developing Your Professional Development Program bit.ly/1C9b8Po
How To Learn Just-In-Time: Cultivating Talent and Bridging Skill Gaps bit.ly/2nJp6b4
Avoid Extinction: Keep Your Skills and Your Team’s Skills Sharpbit.ly/avoidextinction
DEPARTMENT FUNDING: NON-PERSONNEL BUDGET
4+25+60+10+124+25+9+15+27
¬ 7% of teams have an offset press in house.
¬ In line with the continued reduction of printing, 1/3 of creative leaders, again, reported an increase in the size of their digital staff.
Q: What is your annual training budget per individual?
¬ Training budgets do not vary greatly based on team size. However, on average, creative teams from the not-for-profit, government and education sectors have lower budgets.
n=276
Q: How has your total spend on printing changed in the past year?
n=253
9%$501-$750
24%< $200
25%$200–$500
27%> $1,000
15%$751–$1,000
decreased by more than 50%
increased by 10%–50%
increased by more than 50%
decreased by 10%–50%
pretty much the same, plus or minus 10%
4%
10%
1%
25%
60%
RELATED RESOURCES

212017 In-House Creative Industry Report
Department ResourcingCreative leaders must be careful in demonstrating a desire to grow their team. Too often a desire to grow a team can be viewed as “empire building;” leaders must be prepared to substantiate headcount requests based on business need. In addition, leaders need to be prepared to promote the adoption of new processes and tools to support the growth in order to grow in a mature, scalable manner.
Ensuring you’re appropriately staffed is a constant balancing act creative leaders face on a day-to-day basis. Flexible staffing models and principal partnership agencies continue to provide creative services teams support during peak periods without increasing staff size. Including a budget that allows for flexibility is critical — in fact, your budget may be better spent in not hiring an FTE and instead using the same funds to pay several temporary workers during peak periods.

3+30+25+0+20+8+0+6+0+3+2+24+23+25+0+24+9+0+7+0+3+2+3
*NOTE: PERCENTAGES MAY NOT EQUAL 100% DUE TO ROUNDING.
22 2017 In-House Creative Industry Report
Developing the Right Resourcing Strategy to Support your Organizational Model bit.ly/2oDCWeq
Drivers to Rethinking a Creative Team’s Make-Upbit.ly/1S5QQOB
Don’t Let Growth Become Your Kryptonitebit.ly/QdmCw6
The Practical Tactical Side of Growth bit.ly/1hGtjwG
Mananging People in a Growing Organization bit.ly/1KQ7wbH
5+6+0+4+4+0+7+9+0+13+15+0+21+22+0+48+44
Q: How large is your creative services team? (combined FTEs and contingent workers)
1
2–5
6–10
11–20
21–30
31–50
51–75
76–100
101+
1
2–5
6–10
11–20
21–30
31–50
51–75
76–100
101+
2016 2017
SMALL TEAMS58%
SMALL TEAMS52%
MID-SIZE TEAMS28%
MID-SIZE TEAMS33%
MEGA TEAMS7%
MEGA TEAMS8%
n=370 n=310
Q: What percentage of your full-time team members are FTEs of your company? (versus sourced staff)
¬ 56% of teams utilize contingent workers to comprise their full-time team.
n=368
n=310
5% 6% 4% 4% 7% 9% 13% 15% 21% 22% 48% 44%
≤24% 25–49% 50–74% 75–89% 90–99% 100%
2016
2017
DEPARTMENT RESOURCING
3% 4%
3% 3%
2% 2%
2% 3%
30% 23%
25% 25%
20% 24%
8% 9%
6% 7%
RELATED RESOURCES
LARGE TEAMS6%
LARGE TEAMS7%
6% 7%

3+30+25+0+20+8+0+6+0+3+2+24+23+25+0+24+9+0+7+0+3+2+3 36+62+248+37+15
*NOTE: PERCENTAGES MAY NOT EQUAL 100% DUE TO ROUNDING.
232017 In-House Creative Industry Report
Make Your Group a Destination
bit.ly/1NPeE65
“It’s Impossible to Fire Anyone Here”bit.ly/1VILsA1
Creating Positive Permalancer Experiencesbit.ly/17ZT6yF
Increasing Your Quality Hiresbit.ly/17iPFBR
Attracting Top-Tier Talentbit.ly/17iRkYg
Q: What are your full-time hiring plans for 2017?
n=308
36%increase
current FTE headcount
decrease current FTE headcount2%
maintain current FTE headcount
62%
Q: How did your full-time team size change between 2015 and 2016?
n=309
48%remained flat
37%increased
15%decreased
¬ Consistent with 2015, 85% of teams stayed flat or grew in size in 2016.
RELATED RESOURCES
¬ 63% of teams experienced an attrition rate of 5% or less; depending on team size this may be too low for teams hoping to bring in new skill sets, experience and/or styles.
Q: What is your perception of the available talent in the marketplace right now?
¬ Survey respondents have indicated that, across the board, there are qualified candidates available; this may be due to the low number of openings per the low attrition.
WHEN RESPONSES WITHIN MULTIPLE CATEGORIES WERE CLOSE, MULTIPLE RESPONSES WERE IDENTIFIED AS A MAJORITY RESPONSE. n=301
Answer Options There’s an abundance of highly qualified talent
There’s enough qualified talent to choose from
There’s limited qualified talent
Having trouble identifying qualified
talent
Response count
Graphic design 23% 49% 23% 6% 301
Digital design 14% 48% 28% 9% 288
Mobile design 10% 34% 46% 11% 274
Developers 10% 42% 34% 15% 268
Account management 12% 53% 29% 6% 264
Copywriting 11% 46% 35% 7% 279
Editing/proofreading 11% 55% 29% 5% 274
Project management 13% 53% 30% 4% 272
Traffic coordination 9% 50% 36% 5% 273
DEPARTMENT RESOURCING

*NOTE: PERCENTAGES MAY NOT EQUAL 100% DUE TO ROUNDING.
24 2017 In-House Creative Industry Report
52+27+16+3+1+1DEPARTMENT RESOURCING
49+51Q: Is there a DEDICATED operational role? (dedicated to focusing on the department’s process, systems
and technology, vendor management, financial management and reporting)
¬ The larger a creative services team, the more likely it is to have a dedicated operational role. Case in point: 83% of departments with more than 30 team members have this role.
n=308
49%yes
51%no
Q: How many hours per week does your staff work on average?
¬ While approximately 80% of creative leaders estimated their team members work less than 45 hours per week, only 56% of creative leaders indicated their team was appropriately staffed when considering full-time and contingent staff.
¬ Overtime continues to be attributed to temporary spikes in volume and deadlines.
n=310
1%56–60 hours
1%>60 hours
16%46-50 hours
3%51-55 hours
52%41-45 hours
27%≤40 hours
RELATED RESOURCES

*NOTE: PERCENTAGES MAY NOT EQUAL 100% DUE TO ROUNDING.
252017 In-House Creative Industry Report
Thank you Microsoft... Term Limits & the Creative Leader bit.ly/1Qi4OMj
The “New Normal” in Staffing Strategies: Contingent Workers bit.ly/1WNODGY
Effectively Managing Just-In-Time Creative Resourcesbit.ly/10Aiivy
Don’t Let MSP or VMS Programs Obstruct Your Access to Great Talentbit.ly/ZNrwOu
DEPARTMENT RESOURCING
43+43+14 14+57+29+59+26+2+9+2+244+41+8+7
Q: What are the freelancer/temp hiring plans for 2017?
Q: Are you able to use flexible staffing options such as freelancers and temporary/contract workers during periods of peak demand?
Q: What are your company’s term limits for contractors?
Q: Are you able to directly contact staffing firms for your creative staffing needs?
¬ 86% of creative leaders are able to use freelancers.
n=191
43%sometimes
26%12 months
or less
8%
2%13-18 months
2%more than 24 months
41%no, I must
go through my HR
department
9%19-24 months
7%no
43%yes
59%there are no term limits
29%increase
total spend
57%maintain
total spend
14%decrease
total spend
44%yes
14%no
n=225
n=206n=221
¬ Typically we see wild swings in freelancer spending plans year-over-year; however 2017 plans are consistent with 2016 indicating that teams may have identified a steady state spend strategy for freelancers.
no, I must use an enterprise technology tool such as a VMS (Vendor Management System)
RELATED RESOURCES
2%other

26 2017 In-House Creative Industry Report
PERSPECTIVE FROM THE FIELD
Becoming a Strategic Partner and AOR for a Line of Business
As a 17-year veteran of account management for pharmaceutical advertising, I have learned that your ability to think strategically is key to being successful. The number of creative concepts presented, or the analysis and understanding of the science behind a brand, is what will secure the business. While these contribute to the success of the account and the team, the relationship and ability to connect on a personal level is what really seals the deal.
Having your team embedded in the business you support, fully understanding the company your clients work for and their mission and goals, living that mission and supporting those goals yourself are all invaluable to an in-house team. Being where your clients are when they need you is an essential advantage for an in-house team. After all, you are not a vendor, but a colleague.
Merck Creative Studios (MCS) was recently named “Lead Creative Agency” for a group of brands that are part of the Merck Animal Health division. Recently, colleagues have asked, “What did you do? How did you get the coveted ‘seat at the table?’ What ‘s the secret?”
This win came about through being on location and it took time, more than four years, to be honest. It has taken determination, hard work, time and being present. A little over a year ago, I was in the office and a client asked me to introduce myself to one of her colleagues. I stopped by his office and, to his amazement, said I was part of MCS, the in-house agency team. He said, “I knew it! There had to be an in-house team here!”
As he (and almost his entire team) was new to the organization, being there that day made something easier for him. I gave him the elevator speech about what MCS could do, scheduled a capabilities presentation for his team of 10 the following week and walked out of his office with our first job. Fast-forward 10 months or so, and we’ve provided flawless customer service and quality work, but more importantly, we’ve been there. The clients saw my face and those of my team regularly and stopped us in the hallway to chat, ask for help or request work.
Additionally, a client we had been working with on a limited basis had begun to realize the benefit of working with our team and requested a capabilities presentation. She had had a rough year with her AOR and wanted to know if MCS could take on the lead role. That conversation, which happened when I “stopped by,” lead to MCS being appointed the new lead agency for her brands. The ability to make their office your office and their business your business is where relationships start. Being a part of their everyday lives and seeing the faces of your team builds relationships. Never underestimate the power of “stopping by.”
ABOUT
THE
AUTHOR
JENNIFER MANS
Jennifer is an account lead for Merck Creative Studios and has been with the company for five years. Jennifer currently supports the Merck Animal Health division and leads a dedicated team of project managers and creatives. Prior to joining Merck, Jennifer spent 12 years in pharmaceutical advertising working at Torre Lazur McCann and Ogilvy CommonHealth.

272017 In-House Creative Industry Report
Service OfferingsThe number of projects creative services teams produce annually is loosely linked to their size. While it’s interesting to discuss volume in terms of number of projects, it’s not an apples-to-apples comparison across organizations. Service offerings continue to evolve and expand, providing growth for in-house creative teams. However, the new complexities require specific expertise and skill sets. Volume in its truest form should be discussed in terms of the number of “billable” or “utilized” hours per year. In addition, the various complexities in the work itself are not captured under project count and are better evaluated with hours in assessing the level of effort put into the project.
Core Competencies
Staying current with, let alone ahead of, the growing complexities of our ever-evolving service offerings opportunities is no easy feat. Determining which service offerings to expand into is a process, and you shouldn’t set your team’s goal to “be everything to everyone.” Be selective in your core competencies and stick to them, regularly reevaluate them and adjust as needed. Don’t be afraid to identify work to be outsourced to third parties. There is still value in your team art directing and project managing projects; creative execution of all media types doesn’t have to be within your core competencies.

*NOTE: PERCENTAGES MAY NOT EQUAL 100% DUE TO ROUNDING.
28 2017 In-House Creative Industry Report
SERVICE OFFERINGS28+28+27+8+5+1+1+1+0+1 8+18+35+20+13+3+0+1+0+2 5+0+35+35+5+0+15+0+0+5 13+4+20+13+8+13+8+4+0+17Q: How many projects did your team work on in 2016?
< 500
500–999
1000–1999
2000–2999
3000–3999
4000–4999
5000–5999
6000–6999
7000–7999
8000+
SMALL TEAMS10_<
n=154
28% 8%
18%
35% 35%
13%
20%
13%
13%
17%
35%
15%
20%
13%
28%
27%
5%
8%
1% 3%
5%
4%
4%
8%
8%
0%
5%
5%
1%
2%
0%
0%
0%
0%
0%
0%
1%
1%
1%
0%
MID–SIZE TEAMS11–30
n=102
MEGA TEAMS> 50
n=24n=20
LARGE TEAMS31–50
Q: What is the proportion of team hours spent on digital projects vs. print projects?
¬ Responses to this question were broad with no prevailing trend. The key takeaway is that 80% of creative teams are spending at least 30% of their time on digital projects.56+44n=301
57%print projects
44%digital projects
99+89+84+75+74+74+71+66+66+64+63+63+62+33+33+30+25+3
*NOTE: PERCENTAGES MAY NOT EQUAL 100% DUE TO ROUNDING.
292017 In-House Creative Industry Report
Speaking in Code bit.ly/2paVQKv
Don’t Undervalue Digital Expertisebit.ly/1kBboiO
Top 10 Signs that You May Need A QA Program bit.ly/1LJNWIM
5+0+35+35+5+0+15+0+0+5 13+4+20+13+8+13+8+4+0+17
SERVICE OFFERINGS99+89+84+75+74+74+71+66+66+64+63+63+62+33+33+30+25+384+68+55+48+47+46+44+22+14+12+6+3+2
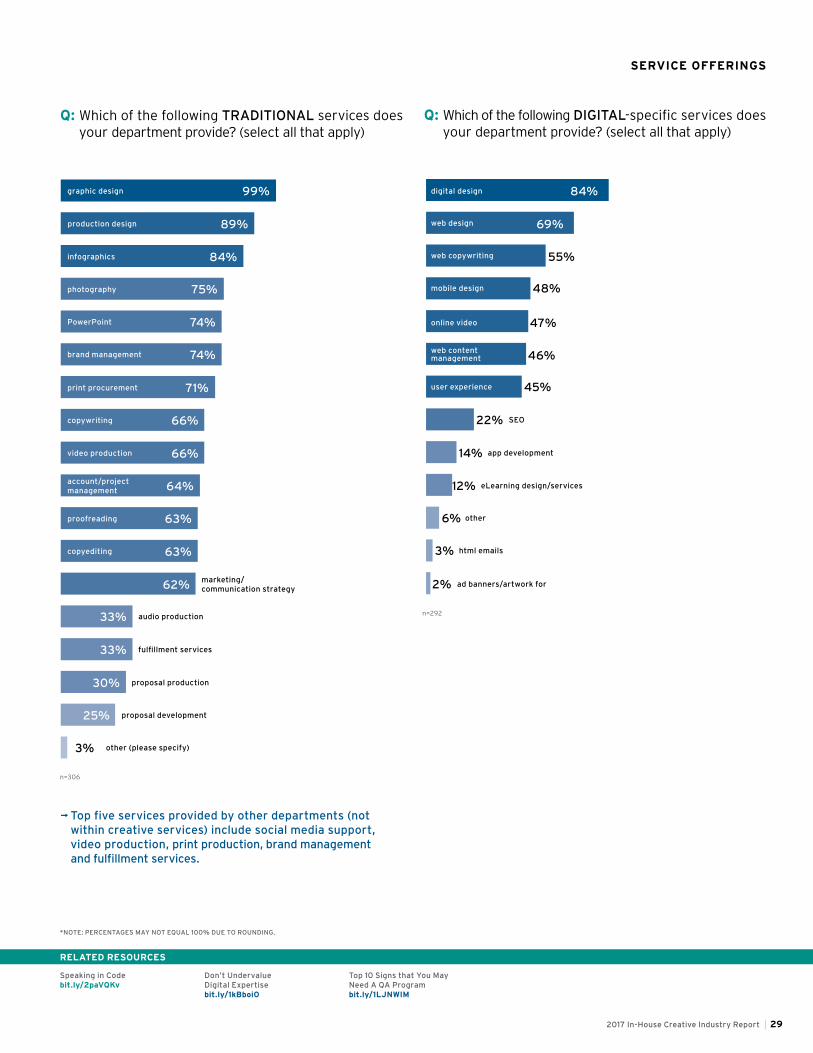
Q: Which of the following TRADITIONAL services does your department provide? (select all that apply)
Q: Which of the following DIGITAL-specific services does your department provide? (select all that apply)
n=306
¬ Top five services provided by other departments (not within creative services) include social media support, video production, print production, brand management and fulfillment services.
83%
n=292
graphic design digital design
web design
web copywriting
mobile design
online video
web content management
user experience
SEO
app development
eLearning design/services
other
html emails
ad banners/artwork for
infographics
photography
print procurement
video production
proofreading
copyediting
marketing/ communication strategy
audio production
fulfillment services
proposal production
proposal development
other (please specify)
account/project management
copywriting
production design
PowerPoint
brand management
99% 84%
69%
55%
48%
47%
46%
45%
22%
14%
12%
6%
3%
2%
89%
84%
75%
74%
74%
71%
66%
66%
64%
63%
63%
62%
33%
33%
30%
25%
3%
RELATED RESOURCES

*NOTE: PERCENTAGES MAY NOT EQUAL 100% DUE TO ROUNDING.
30 2017 In-House Creative Industry Report
What Does Social Media Mean for Marketing Infrastructure?bit.ly/1mdfWgc
SERVICE OFFERINGS
Q: For which audience does your team create the MAJORITY of their work?
12+62+26n=293
62%external audience
26%equal to internal and external audiences
12%internal
audience39+57+4Q: What is your group’s PRIMARY scope of work?
n=293
39%Tier 1:
creative development (conceptual work)57%
Tier 2: design production
(execution of previous work across
deliverables)
4%Tier 3:
pure production (edits/revisions/templated work)
99+40+27+19+18+2Q: What social media services does the creative
services team support? (select all that apply)
n=25643+28+17+8+4Q: Where does social media CONTENT reside within
your company’s organization?
n=304
43%marketing
28%communications
17%in-house creative
services group
4%lines of
business8%
other or shared responsibility
verbal content
graphic content
publishing
listening
response
other
99%
40%
27%
19%
18%
2%
RELATED RESOURCES

*NOTE: PERCENTAGES MAY NOT EQUAL 100% DUE TO ROUNDING.
312017 In-House Creative Industry Report
SERVICE OFFERINGS
45+25+30Q: For which audience does your team create the
MAJORITY of their video work?
n=189
n=189
45%external audience
25%internal audience
services group
30%more or less equal
between internal and external audiences
41+20+11+13+8+4+3Q: How many dedicated team members support
video services?
41%one
20%two
11%three
4%>–11-15
3%16+
8%6-10
13%4-5
Q: Do you have dedicated video producer roles?35+50+15 35%
yes, though our video producers are a hybrid of directors, videographers,
editors and writers
50%no
15%yes
37+63Q: Do you provide video production services?
n=305
n=184
37%no
63%yes
Starting a Video Teambit.ly/1QkJWk9
The Level of AWESOMEbit.ly/1Qi9Vw3
RELATED RESOURCES
¬ 39% of teams are supporting video with 3 or more team members.

*NOTE: PERCENTAGES MAY NOT EQUAL 100% DUE TO ROUNDING.
32 2017 In-House Creative Industry Report
SERVICE OFFERINGS
82+41+8+3Q: What software solutions do you use to edit video? (select all that apply)
n=185
¬ 87% of creative services groups use Macs to edit.
Q: Do you shoot video with conventional or DSLR cameras?
¬ 87% of creative groups primarily use HD resolution to shoot and edit in.
48+43+6+3n=185
48%we use both
conventional and DSLR cameras43%
DSLR cameras
3%other6%
conventional cameras
24+33+25+25+25+26+49+14
Q: Which of the following are FTE roles? (select all that apply)
n=174
94+84+73+65+33+30+4Q: Which of the following VIDEO PRODUCTION-
SPECIFIC services does your department provide? (select all that apply)
n=189
director video editing
Adobe Premiere or Premiere Pro
Final Cut Pro
Avid Media Composer
other
location videography
studio videography
2-D video graphics
3-D video graphics
webcasting
other (please specify)
producers
editors
combined producer/editor (“preditor”)
video graphic specialist
videographers (“shooter”)
hybrid of producer, editor or videographer
more than one of the above and/or other
24% 94%
82%
41%
8%
3%
84%
73%
65%
33%
30%
4%
33%
25%
25%
25%
26%
49%
14%
39+38+33+26+20+19+13+13+4
*NOTE: PERCENTAGES MAY NOT EQUAL 100% DUE TO ROUNDING.
332017 In-House Creative Industry Report
Evolving Your Department’s Service Offerings—The Talent Question bit.ly/11FZgRb
Launch That New Service… Under the Radarbit.ly/ZnJif0
Content Strategybit.ly/CScontentstrategy
SERVICE OFFERINGS39+38+33+26+20+19+13+13+4
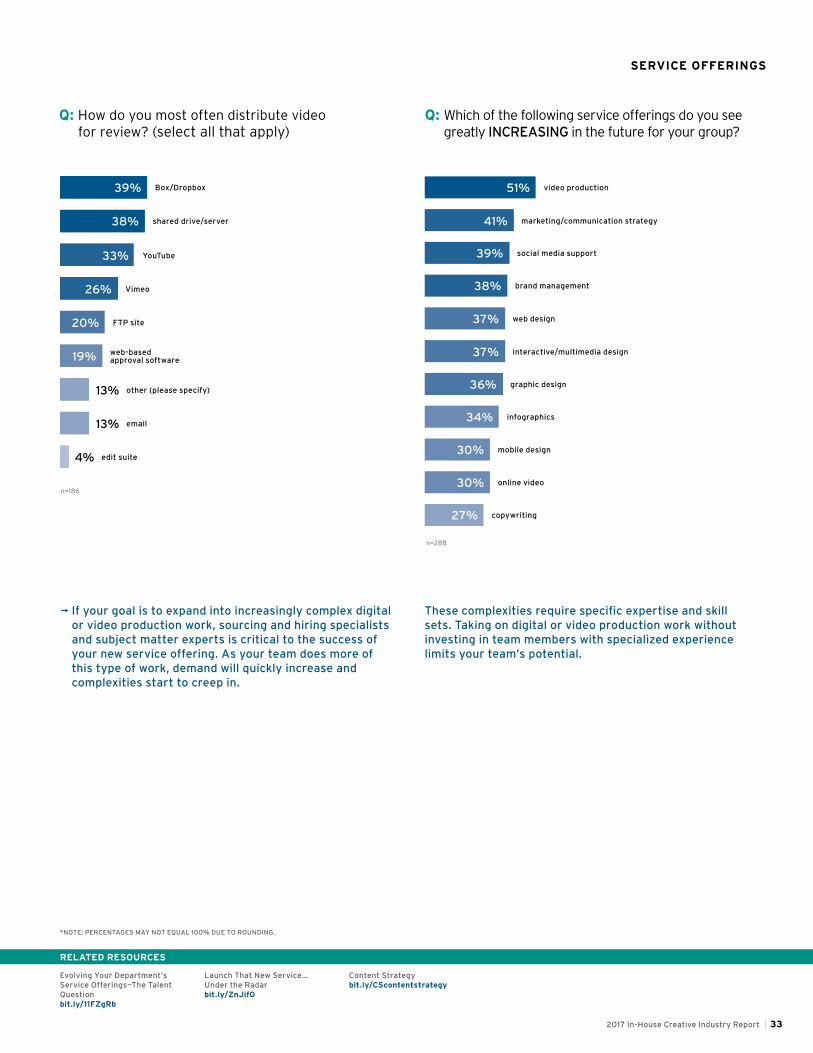
Q: How do you most often distribute video for review? (select all that apply)
n=186
¬ If your goal is to expand into increasingly complex digital or video production work, sourcing and hiring specialists and subject matter experts is critical to the success of your new service offering. As your team does more of this type of work, demand will quickly increase and complexities start to creep in.
These complexities require specific expertise and skill sets. Taking on digital or video production work without investing in team members with specialized experience limits your team’s potential.
51+41+39+38+37+37+36+34+30+30+27Q: Which of the following service offerings do you see
greatly INCREASING in the future for your group?
n=288
Box/Dropbox video production
marketing/communication strategy
social media support
brand management
web design
interactive/multimedia design
graphic design
infographics
mobile design
online video
copywriting
shared drive/server
YouTube
Vimeo
FTP site
web-based approval software
other (please specify)
edit suite
39% 51%
41%
39%
38%
37%
37%
36%
34%
30%
30%
27%
38%
33%
26%
20%
19%
13%
13%
4%
RELATED RESOURCES

*NOTE: PERCENTAGES MAY NOT EQUAL 100% DUE TO ROUNDING.
34 2017 In-House Creative Industry Report
Is PMP Certification Beneficial for In-House Creative Project Managers? bit.ly/2o9RU8N
Benefits of Instituting Project Management bit.ly/2ornUGk
World-Class Creative Services Teams Include Account Management bit.ly/2p11sHq
SERVICE OFFERINGS
49+22+15+7+7¬ Only 14% of creative teams have dedicated digital
project manager roles such as web producer.
Q: Does your team provide DEDICATED account management services to your clients?
22%yes, though our
account managers are hybrid account managers/project
managers
15%yes, we have
project managers
yes, we have account managers
7%
yes, we have both project and
account managers
7%
49%no
n=291
27+60+55+48+16Q: What type of advertising does your group support? (select all that apply)
n=293
¬ 84% of creative teams support external advertising of some sort.
48+12+8+4+16+9+3Q: How often does your company commission custom
photography?
n=293
48%3 or more
times a year
16%rarely
12%2 times per year8%
1 time per year
9%never
4%every few years
3%do not know
regional advertising
national advertising
local advertising
global advertising
we don’t support advertising
55%
60%
48%
27%
16%
RELATED RESOURCES

352017 In-House Creative Industry Report
PERSPECTIVE FROM THE FIELD
The Perpetual Evolution of a Digital Design Team
The digital media landscape is evolving at an incredibly rapid pace. It’s more complex today than ever before with an endless stream of new platforms, devices and screen sizes, and new ways to consume content are being added every day. To keep up, you and your team need to evolve right along with it or be left in the digital dust.
Evolution Needs to be Part of the Culture The digital media design team at A+E Networks has been rapidly transforming along with the industry over the past few years. We have changed our process, structure and tools. We are constantly building upon our skill sets and have transitioned to a (rapid and lean) product design mindset with the user at the core of it all.
Why change everything? Because everything around us was changing. To be successful, we needed to be able to respond to changing user behaviors, new consumption patterns (aka binge watching) and be able to iterate and improve upon our products based on new insights and data.
From Waterfall to Agile In order to keep up with the pace of a rapidly changing landscape, as well as stakeholder and user needs, we changed our process to allow for constant feedback, assessment and iteration. We have introduced the Agile framework and use Scrum to deliver value across our portfolio of digital products to tens of millions of people. We are now launching minimal viable products and iterating on them versus launching two-year-old ideas that may or may not be useful to our users.
From Brand Teams to Product Teams Gone are the days a designer was assigned to work on one thing (like designing a website) for one brand. We have created multi-disciplinary product teams consisting of a product owner, scrum master, UX/UI designers and developers who work across various brands.
Designers are embedded within the teams and collaborate directly with all team members on a daily basis. This allows them to be a part of every phase of the product lifecycle - from early research and discovery, to product release, to iteration.
From Comps to Prototypes The days of using Photoshop to create a static comp seem like ancient history. I still love Photoshop, don’t get me wrong, but the toolkit we are using has expanded drastically. We have moved to Creative Cloud which gives us access to Adobe’s new Experience Design app, but we have also added a bunch of new tools to the mix.
Sketch seems to dominate every designer’s monitor - I couldn’t tear it away from the team if I tried. We have also incorporated prototyping and collaboration tools like InVision, Zeplin, Proto.io, Marvel, Framer, Atomic and a few others. The tool used depends on the designer’s preference or problem they are trying to solve.
The bottom line is that the expanded tool set allows us to get quick versions of ideas or prototypes in front of people to test our assumptions. They also allow us to work seamlessly with our developers every step of the way. And perhaps my favorite…they make the design process highly visible to everyone involved.
From Designers to Product Designers I am a huge supporter of professional development, and this fast-paced digital world we have chosen to design in requires everyone on the team to continuously evolve their skills. The entire team is becoming more well-rounded, and the lines between disciplines like UX designers and visual designers (or UI designers) are becoming increasingly blurred.
UX and UI designers are coding, UX designers are taking visual design classes, visual designers are taking UX classes, everyone is prototyping, everyone is involved in user testing, everyone is doing research and story mapping; it’s totally amazing. The end result is the emergence of the product designer.
Don’t Go It Alone All of this change has been crazy to navigate and difficult to manage at times. In the beginning, we were not good at many of the things mentioned above. Thank God we got some help. We brought in an Agile coach and a Discovery coach to help us apply the practice, adopt the changes and get better at building products.
ABOUT
THE
AUTHOR
BOB CALVANO
Bob is currently the vice president of design at A+E Networks and oversees product design for A+E’s portfolio of properties, including History, A&E, Lifetime, LMN, FYI and more. Bob’s focus is on the digital media side of the business, which includes executions on desktop, tablet, smartphone and emerging platforms such as Apple TV, Roku, Amazon Fire TV and whatever comes next.
36 2017 In-House Creative Industry Report2017 In-House Creative Industry Report36
PartnershipsPartnering with agencies is often in the best interest of the business or organization and your internal team. So as a leader you must work to take away the fear of bringing in outside expertise and embrace the possibilities. It is difficult to do everything on your own. Beyond simply sharing the workload, there are other key reasons to further agency relationships, including keeping up with a dynamic business environment, “integrated” creative excellence, career development for your team and efficient delivery.

*NOTE: PERCENTAGES MAY NOT EQUAL 100% DUE TO ROUNDING.
372017 In-House Creative Industry Report
External Agencies Are Not Your Enemy bit.ly/2or5qpO
Principal Partnership Agencies (“PPAs”) bit.ly/2ow8Wk5
Cracking the Offshoring Nut bit.ly/1hGtsjG
Outsourcing Approaches bit.ly/1n11PKc
PARTNERSHIPS
32+68¬ The five most common services agencies provide are
campaign strategy & design, creative strategy, design execution, video and copywriting.
Q: Does your in-house creative team partner with external agencies?
32%no
68%yes
n=293
23+77¬ These creative teams are leveraging offshore/offsite
creative and production services providers for both digital and traditional services across the spectrum of production through conceptual work.
¬ 61% of in-house creative leaders are satisfied with the quality of work from their offshore/offsite partner.
Q: Does your group partner with offshore/offsite creative and production services providers?
23%yes
77%no
n=292
Q: What is the nature of your in-house team’s working relationship with external agencies? (select all that apply)56+41+38+23+8
n=199
we use them for new ideas, special projects and skill sets
we use agencies for overflow, extra capacity
they handle Tier 1 strategy, we handle the execution
we have a clearly defined and complimentary scope to the agency’s scope
we compete head to head
56%
41%
38%
23%
8%
RELATED RESOURCES

*NOTE: PERCENTAGES MAY NOT EQUAL 100% DUE TO ROUNDING.
38 2017 In-House Creative Industry Report
PARTNERSHIPS
¬ Other includes: close to local regional offices, cultural knowledge and language familiarity
Q: What are the BENEFITS of working with your offshore/offsite partner? (select all that apply)58+45+43+38+11+11
n=65
Q: What are the DRAWBACKS of working with your offshore/offsite partner? (select all that apply)65+65+52+15+16
n=62
additional dedicated resources
specialized skill sets
reduced costs
more hours of business support (“follow the sun” approach)
miscommunication
lack of brand knowledge
poor attention to detail
missed deadlines
other
brand knowledge continuity
other
58%
45%
43%
38%
65%
65%
52%
15%
16%
11%
11%

392017 In-House Creative Industry Report
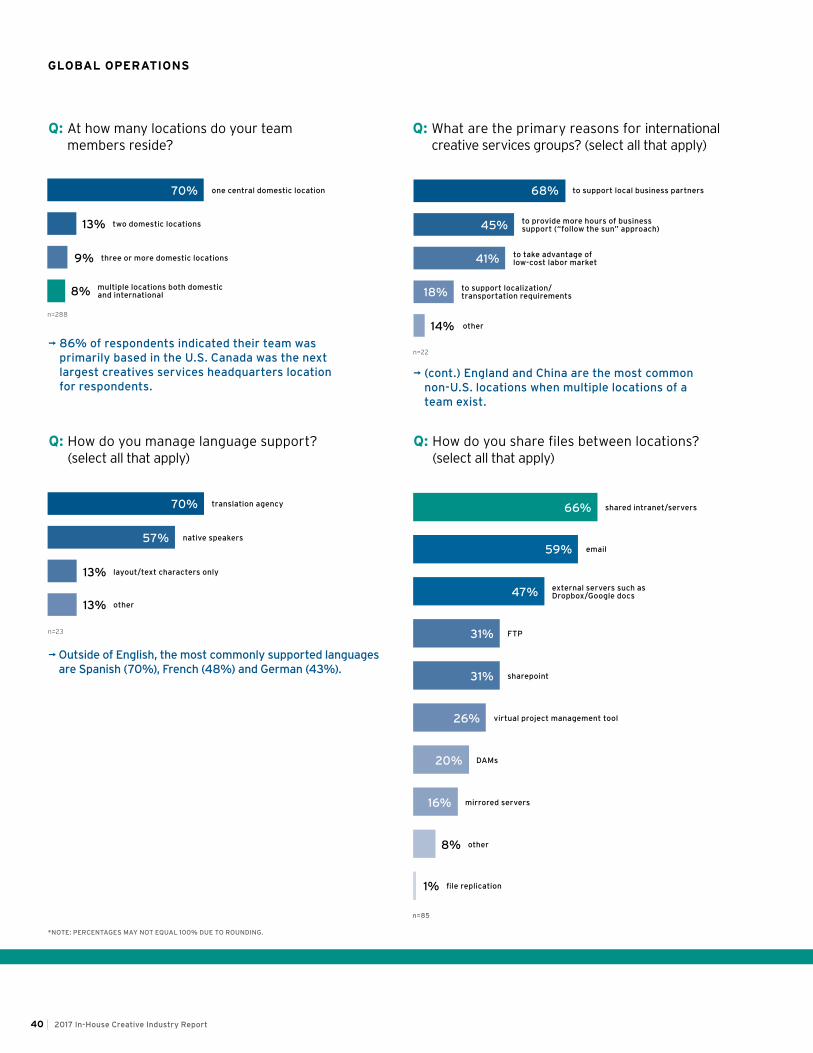
Global OperationsFirms are taking two approaches with global operations. Some teams are choosing to use a global approach in low-cost markets to take advantage of cost savings and offer a more “24/5” approach, while others are serving global creative needs by positioning their teams in global offices close to their customer base. For in-house groups with multiple locations, tactically evaluating the benefits and drawbacks of each location’s operations is critical. Most commonly you will find trends demonstrating a need for increased cost savings, which leads to shifting more capabilities and roles to a lower-cost labor market, either domestically or internationally. Following are challenges to prepare for with global operations:
Technology: Remote teams often experience slowness in the shared network, which is something that may not be able to be improved.
Process: There is a critical need for effective and efficient project hand-offs across locations. Communication of project details and creative direction is a constant challenge.
The clock: Depending on the global locations, short or nonexistent time zone overlaps create hurdles in connecting and clarifying, which in turn can negatively impact turnaround time.
*NOTE: PERCENTAGES MAY NOT EQUAL 100% DUE TO ROUNDING.
40 2017 In-House Creative Industry Report
70+13+9+870+57+13+13 66+59+47+31+31+26+20+16+8+1
68+45+41+18+5Q: At how many locations do your team members reside?
¬ 86% of respondents indicated their team was primarily based in the U.S. Canada was the next largest creatives services headquarters location for respondents.
n=288
Q: What are the primary reasons for international creative services groups? (select all that apply)
n=22
Q: How do you manage language support? (select all that apply)
¬ Outside of English, the most commonly supported languages are Spanish (70%), French (48%) and German (43%).
n=23
Q: How do you share files between locations? (select all that apply)
n=85
one central domestic location
translation agency shared intranet/servers
external servers such as Dropbox/Google docs
FTP
sharepoint
virtual project management tool
DAMs
mirrored servers
other
file replication
native speakers
layout/text characters only
other
to support local business partners
to provide more hours of business support (“follow the sun” approach)
to take advantage of low-cost labor market
to support localization/transportation requirements
other
two domestic locations
three or more domestic locations
multiple locations both domestic and international
70%
70% 66%
59%
47%
31%
31%
26%
20%
16%
8%
1%
57%
13%
13%
68%
45%
41%
18%
14%
13%
9%
8%
GLOBAL OPERATIONS
¬ (cont.) England and China are the most common non-U.S. locations when multiple locations of a team exist.

412017 In-House Creative Industry Report
PERSPECTIVE FROM THE FIELD
The Impact of Process ImprovementLife is a process, and just like life, our work too is a series of continuous, repeatable and sensible actions. By practicing and improving upon our processes in our daily work, we can become more successful. Over the past few years, as we have progressed and grown to a healthy team of over 150, we have learned that we must continually evolve our processes. With multiple specialized teams comprising our in-house department, working collaboratively has sometimes been quite challenging.
For many years, we never focused on operations. As a creative team, we thought that making things look pretty was good enough, but this in fact wasn’t the case. We needed to take a hard look at our systems and processes. After assessing the variety of projects we tackled every day, we realized that one defined process does not suit all. We engaged with Cella’s team of in-house agency consulting experts to kick start and solidify our momentum for change. With their help, our one original process became the foundation of many.
We customized our processes according to categories, creative needs, deliverables, timelines, etc. We also assessed the availability of our resources, the needs of our clients, the capability of our people—especially our leadership, and the vision of our company to come up with a few different, fluid processes. By improving our processes not only did our team’s morale increase, but we now produce more beautiful and higher quality end products.
Where did we see the biggest impact?
1. EFFICIENCY – We are no longer wasting time with redundancy. With new technological advancements and ever-changing trends and needs, we need not be stuck in the 1980s.
2. ACCOUNTABILITY – We are now more aware of expectations on every level. This limits frustrations and surprises on all sides and helps us know the quantity and capability of staff required to get the job done.
3. MORALE – We now take the time to stop and listen to what’s circulating on the floor. By listening, working towards efficiency and holding everyone accountable, we are challenging people, and they are rising to the challenge.
4. BETTER RESULTS – We are a creative department, which means beautiful visuals are our bread and butter. A good team with a good process in place works better together and creates a higher quality product.
5. BETTER CLIENT RELATIONS – We eliminated redundancies and improved communication, which led to faster turnaround times. Making our designers happier has also led to better quality products for our clients.
Process improvement does need to have limits. We cannot make hasty changes whenever something goes wrong. Instead, we must assess and patiently work out the kinks. Listen to your team; they are the cogs in the machine and live in the process every day. Process can become a double-edged sword, and we should be careful not to become its slave. Especially in the creative world, processes should be workable and continuously reevaluated, not rigidly adhered to.
Overall, the greatest impact I have seen is that we have grown tremendously as a department. We are in a much better place today than we have been in years, and our leadership team has gained a better perspective on how we can continue to grow.
Process improvement wasn’t an overnight fix. It has been a wonderful challenge for us, and we are so much stronger working as a whole rather than working individually. We continue to build trust and camaraderie each day.
ABOUT
THE
AUTHOR
CHEE WEI POTTER
Chee Wei is the executive director of the art/creative department for Hobby Lobby, the arts and crafts retail chain. Her team consists of over 150 talented graphic designers, crafters, photographers, writers and various management and support staff. With over 20 years of experience with Hobby Lobby, Chee Wei mentors and develops the team throughout the process of cultivating an extensive catalogue of exclusive designs for Hobby Lobby products, packaging and branding. She also leads strategic design teams concepting and producing customer inspiration across project sheets, video tutorials and inspirational photos for the web.

42 2017 In-House Creative Industry Report
ProcessesStandard operating procedures, workflows and systems are usually an afterthought and come into play when a creative services group’s volume of work is significantly increasing, and so is its size. But if implemented early, these tools provide transparency, clarity of roles and responsibilities, automated support and efficiencies, resulting in increased productivity — and a stronger foundation to support growth. 60+56+42+32+14+11

*NOTE: PERCENTAGES MAY NOT EQUAL 100% DUE TO ROUNDING.
432017 In-House Creative Industry Report
Use a Creative Brief or Risk Creative Grief bit.ly/2oDnMpu
What’s the Big Deal About Tiering? bit.ly/1kQDJNO
Getting From Process Definition to Efficient Process Executionbit.ly/1R7oPBx
PROCESSES
58+27+1560+56+42+32+14+1167+40+34+25+10+9
Q: Does your team use creative briefs?
n=288
Q: Who meets with the client to scope a new project? (select all that apply)
n=288 n=288
15%no
27%yes, for all projects
58%yes, for Tier 1 projects
(non-standard, non-iterative, highly conceptual projects)
Q: Who meets with the client to review iterations? (select all that apply)
¬ Most often 2-3 concepts are shared with clients.
creative director lead designer
project manager
creative director
account manager
editor
other
lead designer
project manager
account manager
other
editor
60% 67%
40%
34%
25%
10%
9%
56%
42%
32%
14%
11%
RELATED RESOURCES

*NOTE: PERCENTAGES MAY NOT EQUAL 100% DUE TO ROUNDING.
44 2017 In-House Creative Industry Report
Process Documentation— More Than Just Pretty Picturesbit.ly/1i8zwpJ
Getting Started With Process Documentationbit.ly/1gi2VNA
5 High Impact Hacks to Immediately Increase Efficiencies bit.ly/2pdogjR
How do your clients really view your in-house creative team? bit.ly/2nJ9swq
PROCESSES
46+44+10 44+40+16 53+23+9+6+5+3
Q: Are your workflow processes documented?
Q: Do you have a fast-track process in place to accommodate quick-turn projects?
Q: How often do you survey your clients?
Q: What are the most important criteria considered to prioritize your group’s assignments?
(average score on a 0–5 scale, in which 0 is not important and 5 is extremely important)
n=286
16%few, if any, are documented
44%yes, everything is documented
40%some of our major ones
n=287 n=287
yes, with dedicated
team/resources
10%
46%yes
44%no
n=287
strategic importance
never
annually
semi-annually
quarterly
after most projects
after every project
deadline
project visibility
client status/hierarchy
project budget
4.05
53%
23%
9%
6%
5%
3%
3.86
3.30
3.18
1.71
RELATED RESOURCES
452017 In-House Creative Industry Report
TechnologyCreatives, more than most of their corporate colleagues, crave to work on the newest technology and software packages. In fact, organizations that lag behind in these areas have at times found themselves with recruiting challenges.
While creative leaders do not have the same business need for the latest and greatest technology items, they do have a need for creative–specific project management systems. In addition to facilitating the department’s workflow, these systems are key to providing creative leaders with tangible metrics they can leverage in their decision-making process and senior management communications.

*NOTE: PERCENTAGES MAY NOT EQUAL 100% DUE TO ROUNDING.
46 2017 In-House Creative Industry Report
TECHNOLOGY
41+15+7+11+9+8+971+19+16+9+7+5
Q: Who provides technical support for your Macs?
Q: Is technology available for your team to work remotely as needed?
¬ Instituting remote working environments is not just for disaster recovery precautions anymore. Employees who are able to work remotely are said to have higher levels of productivity and job satisfaction.
n=287
7%combination IT & third party
15%combination IT
& ourselves
41%IT department
9%third-party
vendor
8%Mac
specialist
10%other
11%no one/we do it ourselves
n=284
yes, we have VPN using company assets
yes, we have VPN using their own computers
yes, taking files home and using their own computers
yes, through loaner laptops (requiring work to be uploaded ahead of time)
no
other
71%
19%
16%
9%
7%
5%
63% supported, at least in part, by
their IT department
38+33+21+8

*NOTE: PERCENTAGES MAY NOT EQUAL 100% DUE TO ROUNDING.
472017 In-House Creative Industry Report
The Changing Landscape of Digital Asset Managementbit.ly/11HNILO
Digital Asset Management Systems: Benefits for In-House Creative Groupsbit.ly/1QTsjH9
DAM Systems: Before You Buy bit.ly/2orrQHn
TECHNOLOGY: SOFTWARE & SYSTEMS
48+20+28+446+27+2738+33+21+8
Q: Do you have a dedicated resource managing your DAM system?
48%yes, but it is a
hybrid role with other functional responsibilities
20%yes, we have a DAM librarian
Q: Does your team use a digital asset management system?
¬ The most commonly used DAM systems are Adobe Experience Manager Assets, Canto Cumulus, FileMaker Pro, Extensis Portfolio, SharePoint, Widen Media and Workfront.
n=286 n=155
46%no
27%yes, we use a
system for ourteam/division
27%yes, we use an
enterprise-wide system 29%
no
5%other
¬ ProofHQ is the most commonly used soft proofing software, followed by Workfront (which bundles in ProofHQ) and InMotion.
Q: Does your team use soft proofing software to collaborate with clients and collect/track feedback?
n=285
RELATED RESOURCES
no
sort of, we use Adobe Acrobat’s built-in functionality
yes, it is part of our project management software
yes, we have stand-alone software/system
38%
33%
21%
8%
68% have at least a
part-time dedicated resource

*NOTE: PERCENTAGES MAY NOT EQUAL 100% DUE TO ROUNDING.
48 2017 In-House Creative Industry Report
TECHNOLOGY: SOFTWARE & SYSTEMS
19+56+21+4¬ Functionfox and Robohead are being used by 3% of the respondents; Adobe/Neolane, Wrike, and Clients and Profits 2%.
54+9+37 74+10+16n=284 n=284
Q: Does your team track time?
54%yes, through
a system
37%no
9% yes,
manually
Can Workflow Systems Replace Project Management and Traffic Management? bit.ly/1Cam3d5
The Technology Eco-System for Creative Teams bit.ly/1CalXSX
Q: Does your team use project management software?
16%no
10%no, we use paper tickets and other manual methods
74%yes
n=214
RELATED RESOURCES
Q: Which, if any, of these systems does your team use? (select all that apply)
Q: Do you have a dedicated resource managing your project management tool?
21%no
19%yes, we have
a tool administrator
56%yes, but it is a hybrid role
with other functional responsibilities (project manager, traffic, etc.)
4%other
Project Management Systems: Setting Up For Success bit.ly/1QBOPEp
Tips for Evaluating Workflow Tools bit.ly/11ldG7B
¬ Tracking time is an industry best practice and a fundamental necessity to produce your department’s KPIs.26+9+8+8+7+6+6+5+4+4+4
n=212
63% of teams
track time
Workfront
Microsoft SharePoint
Basecamp
Jira
Workamajig
inMotionNow
Trello
Asana
SmartSheet
Custom App: FileMaker Pro
Microsoft Project
26%
9%
8%
8%
7%
6%
6%
5%
4%
4%
4%
75%have an assigned
administrator

492017 In-House Creative Industry Report
Values & Challenges of In-House TeamsMany creative groups stand on the value proposition of being lower cost (whether that is free or a chargeback rate that is lower than agencies), and while that value will open doors, it won’t keep them open. It’s extremely important that creative leaders identify and preach the team’s value outside of cost. Institutional knowledge and shared company values and goals are other highly recognized values of an in-house group, with the greatest value being brand knowledge.
Almost regardless of industry, company size and team size, the challenges of creative leaders are very consistent. Year over year, affecting client behaviors remains the greatest principal challenge. Resourcing, innovation and skill sets are also top challenges. Ensure your group’s value proposition by proactively creating a strategic plan with these challenges in mind.

*NOTE: PERCENTAGES MAY NOT EQUAL 100% DUE TO ROUNDING.
50 2017 In-House Creative Industry Report
Why Does Your In-House Agency Exist? bit.ly/2o9XnfO
Building a Successful Full-Service In-House Agency Requires Visionbit.ly/147dgr8
Yes, We Can Be Greatbit.ly/1erRCnu
VALUES & CHALLENGES OF IN-HOUSE TEAMS54+42+35+31+23+12
Q: Of the provided choices, which are your group’s greatest challenges?
n=285
71+43+37+33+33+20+18+16+15+15+15+15+12+11+10+9+9+7+4Q: Which of the following topics provide the greatest
challenges for you as a creative leader?
n=287
¬ The top five challenges remain the same for the fifth consecutive year.
RELATED RESOURCES
resourcing client behaviors
career pathing for self and staff
gaining respect from internal clients
value recognition/executive support and buy-in
adequate funding for staff
keeping staff engaged
getting the “good” work
splinter groups
branding
prioritizing training
technology/Mac support
adequate funding for non-personnel costs
gaining approval for technology spend
succession planning
connecting team to the corporate mission
compliance processes and requirements
recruiting
retaining staff
other
innovation
skill sets
keeping up with market trends
technology
other
54% 71%
43%
37%
33%
33%
20%
18%
16%
15%
15%
15%
15%
12%
11%
10%
9%
9%
7%
4%
42%
35%
31%
23%
12%
31+30+18+10+7+593+85+83+71+67+66+55+33+33+6

*NOTE: PERCENTAGES MAY NOT EQUAL 100% DUE TO ROUNDING.
512017 In-House Creative Industry Report
VALUES & CHALLENGES OF IN-HOUSE TEAMS
31+30+18+10+7+5 ¬ 35% of creative leaders responded that other creative services groups exist within their company. When multiple groups exist, other variables need to be considered and sorted out, such as clarity on the groups’ services, who to initiate a project with and how the groups collectively function.
Q: Are internal clients required to use your group?
n=353
93+85+83+71+67+66+55+33+33+6
Q: Which of the following do your internal clients recognize as part of your value proposition? (select all that apply)
¬ Creative leaders identified brand knowledge, high-end creative quality and cost savings as the top three value drivers from the clients’ perspective.
n=287
brand knowledge
yes
no, but most come through us anyway
for some projects/certain types of work
no, and it causes us challenges
no
no, but they must go through us to use an agency
historical knowledge of products/deliverables
shared values/goals for company
cost savings
speed/cycle time
high-end creative quality
compliance/legal requirements knowledge
innovativeness
low error rates
other
93%
31%
30%
18%
10%
7%
5%
85%
83%
71%
67%
66%
55%
33%
33%
6%

52 2017 In-House Creative Industry Report
Creative Leader Job MarketThough 70% of in-house creative leaders are mostly or extremely satisfied in their current roles, almost half responded that career pathing for themselves and their teams is one of their greatest challenges. It’s not surprising to learn that almost half of creative leaders aren’t confident in the job market for roles similar to the ones they are in.
Although in-house creative services groups are on the rise — both in size and number — there still aren’t an abundance of them, let alone open senior roles. So for the 54% of leaders who responded that their next career move could most likely be another in-house creative services group, they may be looking at relocation or alternative options. 70+26+14+5+7+13
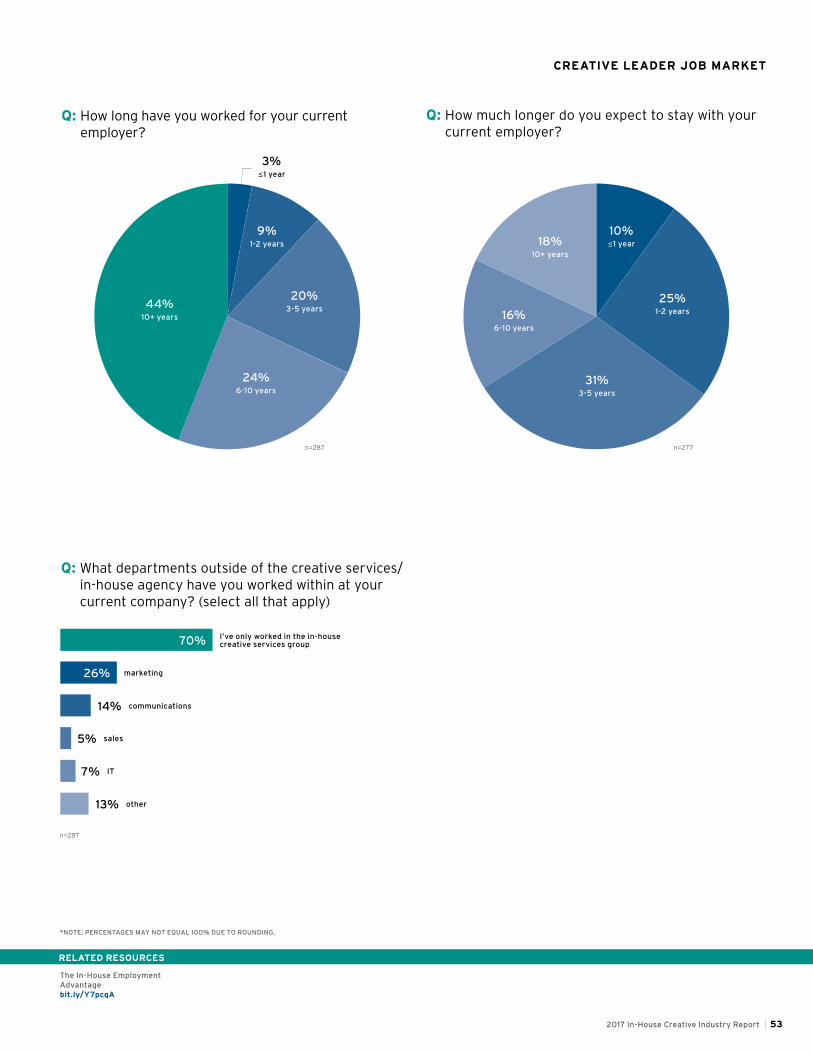
*NOTE: PERCENTAGES MAY NOT EQUAL 100% DUE TO ROUNDING.
532017 In-House Creative Industry Report
The In-House Employment Advantagebit.ly/Y7pcqA
3+9+20+24+44 10+25+31+16+189%1-2 years
10%≤1 year
44%10+ years 16%
6-10 years
18%10+ years
3%≤1 year
20%3-5 years
25%1-2 years
24%6-10 years
31%3-5 years
n=287 n=27770+26+14+5+7+13Q: What departments outside of the creative services/
in-house agency have you worked within at your current company? (select all that apply)
n=287
CREATIVE LEADER JOB MARKET
Q: How long have you worked for your current employer?
Q: How much longer do you expect to stay with your current employer?
I’ve only worked in the in-house creative services group
marketing
communications
sales
IT
other
70%
26%
14%
5%
7%
13%
RELATED RESOURCES

*NOTE: PERCENTAGES MAY NOT EQUAL 100% DUE TO ROUNDING.
54 2017 In-House Creative Industry Report
15+55+13+11+6Q: How satisfied are you in your current role?
15%extremely satisfied
11%passively looking
13%neutral
6%actively looking
55%mostly
satisfied
n=287
51+30+13+6Q: How confident are you in the job market and opportunities available for someone in your role?
n=241
54+11+7+12+16Q: Your next career move would most likely be?
(select all that apply)
¬ Self-employment and retirement were the most popular “other” responses.
n=283
CREATIVE LEADER JOB MARKET
RELATED RESOURCES
Career Pathing for Creatives – Is There Life After Corporate Creative?bit.ly/R9Aad5
Tips for Creative Leaders Looking for New Jobs bit.ly/1EeV9OY
70% are satisfied in
their current roles
mostly confident
not confident
highly confident
do not know
51%
30%
13%
6%
other in-house creative service agencies
within marketing (not creative services)
external agencies
none of the above
other
54%
11%
7%
12%
16%

552017 In-House Creative Industry Report
AppendixSurvey Participant Demographics

*NOTE: PERCENTAGES MAY NOT EQUAL 100% DUE TO ROUNDING.
56 2017 In-House Creative Industry Report
APPENDIX
education, government, not-for-profit 17%
≤ $250M 14%
$250M–$999M 20%
$1B–$5B 22%
$5B–$10B 8%
$10B–$30B 9%
> $30B 10%
SURVEY PARTICIPANT DEMOGRAPHICSSurvey responses were filtered to represent only responses by in-house creative leaders. To identify leadership-level responses we filtered titles per the chart below. Responses were further narrowed down to eliminate duplicate responses and ensure one unique response per company and/or each in-house agency residing within an organization.
Q: Which of the following best describes your title?
Q: Please identify your company’s/organization’s annual revenue.
n=375
creative/marketing services manager 26%
creative director 23%
director/business unit head 14%
art director 9%
design/production manager 9%
operations manager/director 9%
vice president 6%
other management role 5%
¬ 19% of respondents are from the Fortune 500.
n=375

*NOTE: PERCENTAGES MAY NOT EQUAL 100% DUE TO ROUNDING.
572017 In-House Creative Industry Report
APPENDIX
INDUSTRIES REPRESENTED
n=375
aerospace/defense 1%
architecture/construction/engineering 2%
automotive/transportation 1%
associations, events & tradeshows 1%
banking/financial services 9%
construction 1%
consulting/professional services 5%
consumer products 6%
education 8%
energy 1%
food/food services 3%
government 2%
health care 10%
insurance 4%
legal 3%
manufacturing 5%
marketing/advertising 2%
media and entertainment 2%
not-for-profit 7%
oil and gas 1%
pharmaceuticals 3%
real estate 1%
retail 4%
retail: fashion apparel 2%
sports and fitness 1%
technology and software 6%
telecommunications 2%
travel, hospitality & leisure 3%
utilities 1%
other 4%

58 2017 In-House Creative Industry Report
Special thanks to our exclusive sponsor of
the 2017 In-House Creative Industry Report.
Cella is the leading management consultancy and workforce solutions provider for in-house agencies and creative teams. We enable some of the world’s largest companies and best-known brands to deliver impactful creative through the effective management of people, process and technology. We are experts at the core practice of managing and operating in-house creative teams, while supporting their ability to adapt to an ever-changing business environment through our consulting services and professional development programs. Cella is a certified Women’s Business Enterprise and a member of the BLR Holdings family of companies.
Learn more and read our blog at cellaconsulting.com.
®
OPTIMIZING THE BUSINESS SIDE OF CREATIVE
The BOSS Group is an award-winning staffing provider for creative, marketing and digital talent. We’ve been supplying temporary, direct hire and managed staffing solutions to leading organizations across nearly every industry sector for 28 years. The BOSS Group is an eight-time national Best of Staffing® award winner and the only creative staffing firm to receive a Diamond Award for seven consecutive years recognizing superior client and talent satisfaction. The company is a certified Women’s Business Enterprise and a member of the BLR Holdings family of companies.
Learn more about The BOSS Group at thebossgroup.com.
Visit creativeindustryreport.comto download a PDF version of this report and
find out more about The BOSS Group and Cella.