©2017 marko ivan lyszyk all rights reserved
TRANSCRIPT

©2017
Marko Ivan Lyszyk
ALL RIGHTS RESERVED

FLEXURAL BEHAVIOR OF BUILT-UP I-BEAMS MADE FROM HYBRID-FIBER
SIFCON PLATES
By
MARKO IVAN LYSZYK
A thesis submitted to the
Graduate School-New Brunswick
Rutgers, The State University of New Jersey
In partial fulfillment of the requirements
For the degree of
Master of Science
Graduate Program in Civil and Environmental Engineering
Written under the direction of
Dr. Husam Najm
And approved by
_________________________________
_________________________________
_________________________________
New Brunswick, New Jersey
January 2017

ii
ABSTRACT OF THE THESIS
Flexural Behavior of Built-up I-beams Made from Hybrid-Fiber SIFCON Plates
by MARKO IVAN LYSZYK
Thesis Director:
Dr. Husam Najm
Flexural members such as beams are typically made from wood, concrete, prestressed
concrete, steel, and FRP. Built-up I-beams made from thin fiber reinforced plates are
another group of beams that can provide an alternative to steel and reinforced concrete
beams for various uses. The purpose of this research is to evaluate the potential of using
built-up I-beams made of thin SIFCON plates in structural applications such as beams,
lintels, and others. Several built-up I-beams were prepared and tested in flexure. The thin
SIFCON plates were made with straight fibers (brass coated microfibers), hooked fibers,
and a hybrid using both fibers. The plates were connected using organic epoxy resin with
and without thin aluminum angles and with basalt fabrics using an inorganic epoxy. The
built-up I-beams were tested in flexure to evaluate bending strength and their failure
modes such flange yielding, lateral torsional buckling, and web shear failure. The built-
up I-beams were also strengthened using in tension using basalt fabrics to improve their
tensile strength. The results showed that the use of basalt fabrics increases the flexural
capacity of the built-up beams and can be used for retrofitting of these beams. The results
of this study showed that these beams can be fabricated and can be used as structural
members subjected to bending. The study also provided test data and information on the

iii
feasibility of these types of beams, methods of connecting plate components, their
performance in flexure and their failure modes.

iv
ACKNOWLEDGEMENTS
The author would like to acknowledge various individuals whose contribution
was beneficial to this study. I would like to thank Dr. Husam Najm for helping and
guiding me through the research process; Alaa Abd Ali for showing me the proper
procedure for SIFCON mixing, beam fabrication with concrete plates and basalt fiber
sheet attachment; Sam Boukaram, Jaslin Singh, Konrad Kosiak and Helen He for helping
make molds, concrete samples and test; David Caronia and Adi Abu Obaidah for
answering questions relating to concrete casting and general research procedure; Joseph
Pluta and Craig Nowlen for constructing the steel simply supported system for the
flexural testing; my parents for the love and support.

v
TABLE OF CONTENTS
ABSTRACT OF THE THESIS: ......................................................................................... ii
ACKNOWLEDGEMENTS ............................................................................................... iv
TABLE OF CONTENTS .....................................................................................................v
LIST OF TABLES ............................................................................................................. ix
LIST OF FIGURES .............................................................................................................x
CHAPTER 1 – INTRODUCTION ......................................................................................1
CHAPTER 2 – LITERATURE REVIEW ...........................................................................4
2.1 Concrete Reinforced with Steel Fibers ..............................................................4
2.2 Mechanical Properties of SIFCON ..................................................................10
2.3 Applications of SIFCON..................................................................................13
2.4 Aluminum Plates as External Shear Reinforcement ........................................16
2.5 Basalt Fibers as External Flexural Reinforcement...........................................17
CHAPTER 3 – EXPERIMENTAL PROGRAM ...............................................................20
3.1 Glossary and Abbreviations .............................................................................21
3.2 Construction of Plate Molds ............................................................................22
3.3 Concrete Material and Mixing Procedure ........................................................24
3.3.1 Concrete Materials ............................................................................24
3.3.2 Batching of Materials ........................................................................25
3.3.3 General Mixing Procedure ................................................................29
3.3.4 Mixing Procedure with Premixed Fibers ..........................................33
3.4 Casting and Demolding....................................................................................37
3.4.1 Plate Casting .....................................................................................37

vi
3.4.2 Plate Demolding................................................................................41
3.4.3 Cylinder Casting ...............................................................................43
3.4.4 Cylinder Demolding..........................................................................45
3.5 Beam Fabrication .............................................................................................46
3.5.1 Overview ...........................................................................................46
3.5.2 Shear Reinforcement Design ............................................................50
3.5.3 Aluminum Angle Preparation ...........................................................51
3.5.4 Epoxy Mixing Procedure ..................................................................52
3.5.5 Applying Epoxy to Concrete Plates ..................................................54
3.5.6 First Flange – Web Attachment ........................................................56
3.5.7 Second Flange – Web Attachment ....................................................57
3.5.8 Application of FRP as Shear Reinforcement ....................................57
3.5.8.1 Preparation of FRP .............................................................57
3.5.8.2 Batching and Mixing of Nano-Inorganic Composite.........58
3.5.8.3 Application of FRP onto Concrete Surface .......................59
3.5.9 Decision on Shear Reinforcement Material ......................................62
3.5.10 Post-beam Fabrication Aluminum Angle Attachment ....................63
3.5.11 Application of FRP to Bottom of Tension Flange ..........................64
3.6 Testing..............................................................................................................66
3.6.1 Compression Test..............................................................................66
3.6.2 Elastic Modulus Test.........................................................................68
3.6.2.1 Overview ............................................................................68
3.6.2.2 Placement of Elastic Modulus Cage onto Cylinder ...........68

vii
3.6.2.3 Elastic Modulus Test Procedure ........................................70
3.6.3 Flexural Test .....................................................................................72
3.6.3.1 Beam Preparation ...............................................................72
3.6.3.2 Test Setup...........................................................................72
3.6.3.3 First Group Test Procedure ................................................73
3.6.3.4 First Group Flexural Test Observations .............................74
3.6.3.5 Second Group Test Procedure ...........................................75
3.6.3.6 Third Group Test Procedure ..............................................75
3.7 Tension Test & Three-Dimensional Mold Attempts .......................................79
3.7.1 Tension Test ......................................................................................79
3.7.1.1 First Method for Tension Samples .....................................79
3.7.1.2 Second Method for Tension Samples
(with wooden grips) .......................................................................80
3.7.1.3 Third Method for Tension Samples ...................................81
3.7.1.4 Fourth Method for Tension Sample (proposed, not
implemented) .................................................................................85
3.7.2 Three Dimensional Mold and Beam .................................................86
3.7.2.1 Background ........................................................................86
3.7.2.2 Construction of Mold .........................................................86
3.7.2.3 Beam Casting .....................................................................88
3.7.2.4 Beam Demolding ...............................................................90
3.7.2.5 Comments ..........................................................................91

viii
CHAPTER 4 - RESULTS ..................................................................................................93
4.1 Compressive Strength ......................................................................................93
4.2 Elastic Modulus in Compression ....................................................................95
4.3 Flexural Behavior.............................................................................................97
4.3.1 Beams without External Flexural Reinforcement Tested to Failure .98
4.3.2 Beams Tested to First Crack vs. to Failure with External Flexural
Reinforcement ..........................................................................................113
4.3.3 Beams with External Flexural Reinforcement Tested to Failure ....126
4.3.4 Beams with and without External Flexural Reinforcement Tested to
Failure .....................................................................................................141
4.3.5 Flexural Behavior Summary ...........................................................147
CHAPTER 5 - DISCUSSION .........................................................................................152
5.1 Compression Tests .........................................................................................152
5.2 Flexural Tests .................................................................................................156
5.2.1 Beams without External Flexural Reinforcement ...........................157
5.2.2 Beams with External Flexural Reinforcement ................................159
5.2.3 Load-deformation Curves of Beams with and without External
Flexural Reinforcement ...........................................................................161
5.2.4 Effect of External Flexural Reinforcement .....................................163
CHAPTER 6 – CONCLUSIONS AND RECOMENDATIONS ....................................165
6.1 Conclusions ....................................................................................................165
6.2 Recommendations for Future Research .........................................................166
REFEREENCES ..............................................................................................................167

ix
LIST OF TABLES
Table 3-1: Mix design ........................................................................................................24
Table 4-1: Compressive Strength of Concrete Cylinders with Various Fibers ................94
Table 4-2: Compressive Elastic Modulus of Concrete Cylinders with Various Fibers ....96
Table 4-3: Mechanical Properties Summary of Beams without External Flexural
Reinforcement .......................................................................................................... 111-112
Table 4-4: Area under Load-Deformation Curves of Beams without External Flexural
Reinforcement ..................................................................................................................113
Table 4-5: Mechanical Properties Summary of Beams with External Flexural
Reinforcement .......................................................................................................... 139-140
Table 4-6: Area under Load-Deformation Curves of Beams with External Flexural
Reinforcement ..................................................................................................................141
Table 4-7: Elastic Limit – Ultimate Load Ratio and Maximum Deformation ................148
Table 4-8: Effect of External Flexural Reinforcement on Ultimate Load .......................149
Table 4-9: Effect of External Flexural Reinforcement on Area under
Load-Deformation Curve .................................................................................................151

x
LIST OF FIGURES
Figure 3-1: Wooden plate molds........................................................................................24
Figure 3-2: Batching cement ..............................................................................................26
Figure 3-3: Weighing required amount of sand .................................................................27
Figure 3-4: Weighing required amount of superplastizer ..................................................28
Figure 3-5 Adding sand into mixing bowl .........................................................................30
Figure 3-6: Adding cement into mixing bowl....................................................................30
Figure 3-7: Premixing superplastizer with water ...............................................................31
Figure 3-8: Creating voids prior for liquid to penetrate prior to wet mixing .....................32
Figure 3-9: Hand mixing of mortar mix ............................................................................33
Figure 3-10: Adding steel fibers to mixing bowl ...............................................................34
Figure 3-11: Adding small amount of superplastizer-water solution ................................36
Figure 3-12: Placing 50 mm hooked end fibers in wooden molds prior to mixing ...........38
Figure 3-13: Casting plate molds .......................................................................................39
Figure 3-14: Trowel used to provide a smooth finish of the plate sample ........................40
Figure 3-15: Demolding plate molds .................................................................................42
Figure 3-16: Removing plate sample by hand ...................................................................43
Figure 3-17: Adding 50 mm steel fibers into cylinder .......................................................44
Figure 3-18: Concrete plates in curing room .....................................................................46
Figure 3-19: Concrete plate samples in temperature controlled lab environment .............47
Figure 3-20: Delamination of nano-inorganic composite evident at right end of beam ....47
Figure 3-21: Marked lines indicating area of epoxy application .......................................49
Figure 3-22: Steel brush producing a rough surface on the concrete plate ........................50

xi
Figure 3-23: Grinding of aluminum angle .........................................................................51
Figure 3-24: Batching of two components of epoxy .........................................................52
Figure 3-25: Mixing two components of epoxy together ..................................................53
Figure 3-26: Applying epoxy to concrete plate .................................................................55
Figure 3-27: First flange to web attachment ......................................................................56
Figure 3-28: Bricks and wood blocks stabilizing beam configuration ..............................57
Figure 3-29: Lines and tape applied to basalt fiber............................................................58
Figure 3-30: Adding materials into blender .......................................................................59
Figure 3-31: Brushing nano-inorganic composite onto basalt fiber ..................................60
Figure 3-32: Applying slight downward pressure on basalt fiber......................................61
Figure 3-33: Applying epoxy to flange for aluminum angle attachment ...........................63
Figure 3-34: Holding the aluminum angle in place for 30 seconds ...................................64
Figure 3-35: Roller removing excess nano-inorganic composite from basalt fiber...........65
Figure 3-36: Aligning basalt fiber in the middle of the bottom flange ..............................66
Figure 3-37: Concrete cylinder in compression machine cage ..........................................67
Figure 3-38: Attachment of elastic modulus cage .............................................................69
Figure 3-39: Cylinder in compression cage with elastic modulus cage.............................71
Figure 3-40: Simply supported system with two point supports .......................................73
Figure 3-41: Positioning of beam onto point supports.......................................................74
Figure 3-42: First Group after failure ................................................................................75
Figure 3-43: Extent of cracking for first phase of testing ..................................................76
Figure 3-44: Shear and flexural cracks present in beam during testing .............................77
Figure 3-45: Using a knife to cut the basalt fiber on bottom flange ..................................78

xii
Figure 3-46: Removing a strip of basalt fiber ....................................................................79
Figure 3-47: Intermediate grip made out of wood .............................................................80
Figure 3-48: Design of wooden intermediate grips ...........................................................81
Figure 3-49: Design of tension samples for third method .................................................82
Figure 3-50: Molds for tension samples in third method ...................................................83
Figure 3-51: Failure occurred near grips for third method of tension test .........................84
Figure 3-52: Analog load display of tension machine .......................................................85
Figure 3-53: Three dimensional mold sketch ....................................................................87
Figure 3-54: Placing concrete in top flange and web ........................................................89
Figure 3-55: Removing screws and brackets from end of web .........................................90
Figure 3-56: Misaligned web with bottom flange..............................................................91
Figure 3-57: Cracks that occurred during dry curing.........................................................92
Figure 4-1: Average Compressive Strengths of Cylinders ................................................95
Figure 4-2: Average Elastic Moduli of Cylinders in Compression ...................................97
Figure 4-3: Beams Tested to Failure without External Flexural Reinforcement ....... 99-101
Figure 4-4: Load-Deformation Curves of Beams with 6 mm, 30 mm and 6 mm & 30 mm
Steel Fibers.......................................................................................................................102
Figure 4-5: Load-Deformation Curves of Beams with 13 mm, 50 mm and 13 mm &
50 mm Steel Fibers ..........................................................................................................103
Figure 4-6: Load-Deformation Curves of Beams with Straight Steel Fibers ..................104
Figure 4-7: Load-Deformation Curves of Beams with Hooked End Steel Fibers ...........105
Figure 4-8: Load-Deformation Curves of Beams with Hybrid Steel Fibers ....................106
Figure 4-9: Load-Deformation Curves of Beams with 6 mm, 50 mm and 13 mm &

xiii
50 mm Steel Fibers ..........................................................................................................108
Figure 4-10: Load-Deformation Curves of Beams with 30 mm, 13 mm and 13 mm &
50 mm Steel Fibers ..........................................................................................................109
Figure 4-11: Load-Deformation Curves of Beams with 13 mm, 50 mm and 6 mm &
30 mm Steel Fibers ..........................................................................................................110
Figure 4-12: 6MM-0323-FRP6 Tested to First Crack ............................................. 114-115
Figure 4-13: Load-Deformation Curves of Beam with 6 mm Steel Fibers Tested to First
Crack and to Failure with the Addition of External Flexural Reinforcement..................116
Figure 4-14: 30MM-1124-AL6 Tested to First Crack ............................................. 116-117
Figure 4-15: Load-Deformation Curves of Beam with 30 mm Steel Fibers Tested to First
Crack and to Failure with the Addition of External Flexural Reinforcement..................118
Figure 4-16: 6&30MM-0323-AL4 Tested to First Crack ........................................ 118-119
Figure 4-17: Load-Deformation Curves of Beam with 6 mm & 30 mm Steel Fibers
Tested to First Crack and to Failure with the Addition of External Flexural
Reinforcement ..................................................................................................................120
Figure 4-18: 13MM-0317-FRP4 Tested to First Crack ........................................... 120-121
Figure 4-19: Load-Deformation Curves of Beam with 13 mm Steel Fibers Tested to First
Crack and to Failure with the Addition of External Flexural Reinforcement..................122
Figure 4-20: 50MM-1008-AL4 Tested to First Crack ............................................. 122-123
Figure 4-21: Load-Deformation Curves of Beam with 50 mm Steel Fibers Tested to First
Crack and to Failure with the Addition of External Flexural Reinforcement..................124
Figure 4-22: 13&50MM-0318-AL6 Tested to First Crack ...................................... 124-125

xiv
Figure 4-23: Load-Deformation Curves of Beam with 13 mm & 50 mm Steel Fibers
Tested to First Crack and to Failure with the Addition of External Flexural
Reinforcement ..................................................................................................................126
Figure 4-24: Beams Tested to Failure with External Flexural Reinforcement ........ 127-129
Figure 4-25: Load-Deformation Curves of Externally Reinforced Beams with 6 mm,
30 mm and 6 mm & 30 mm Steel Fibers .........................................................................130
Figure 4-26: Load-Deformation Curves of Externally Reinforced Beams with 13 mm,
50 mm and 13 mm & 50 mm Steel Fibers .......................................................................131
Figure 4-27: Load-Deformation Curves of Externally Reinforced Beams with Straight
Steel Fibers.......................................................................................................................132
Figure 4-28: Load-Deformation Curves of Externally Reinforced Beams with Hooked
End Steel Fibers ...............................................................................................................133
Figure 4-29: Load-Deformation Curves of Externally Reinforced Beams with Hybrid
Steel Fibers.......................................................................................................................134
Figure 4-30: Load-Deformation Curves of Externally Reinforced Beams with 6 mm,
50 mm and 13 mm & 50 mm Steel Fibers .......................................................................135
Figure 4-31: Load-Deformation Curves of Externally Reinforced Beams with 13 mm,
30 mm and 13 mm & 50 mm Steel Fibers .......................................................................137
Figure 4-32: Load-Deformation Curves of Externally Reinforced Beams with 13 mm,
50 mm and 6 mm & 30 mm Steel Fibers .........................................................................138
Figure 4-33: Load-Deformation Curves of Beams with 6 mm Steel fibers with and
without External Reinforcement ......................................................................................142

xv
Figure 4-34: Load-Deformation Curves of Beams with 30 mm Steel fibers with and
without External Reinforcement ......................................................................................143
Figure 4-35: Load-Deformation Curves of Beams with 6 mm & 30 mm Steel fibers with
and without External Reinforcement ...............................................................................144
Figure 4-36: Load-Deformation Curves of Beams with 13 mm Steel fibers with and
without External Reinforcement ......................................................................................145
Figure 4-37: Load-Deformation Curves of Beams with 50 mm Steel fibers with and
without External Reinforcement ......................................................................................146
Figure 4-38: Load-Deformation Curves of Beams with 13 mm & 50 mm Steel fibers with
and without External Reinforcement ...............................................................................147
1
CHAPTER 1: INTRODUCTION
Girders in bridge superstructures are typically made of steel, concrete, or
prestressed concrete. Each material has its advantages and disadvantages and engineer
needs to take that into design consideration. In some cases, choosing whether the girders
are made out of steel or concrete also at times may rely on the desire of the client.
Compared to concrete, steel can save more time in terms of fabrication as structural
members do not need time to cure unlike their concrete girder counterparts. It is well-
known that the composition of steel girders is more homogenous than concrete girders,
with taking account the rebar, and this may attribute to its isotropic properties. The
quality control of steel girder fabrication tends to be better than that of concrete girders as
steel girders, as concrete girders require more on-site labor. It is easier to achieve longer
spans with steel as a longer girder can be fabricated as well as splicing onsite.
Unlike concrete, steel can be recycled and reused to become a structural member
again without losing much quality. Steel tends to be lighter than concrete as its cross
sectional dimensions are smaller than that of concrete. Conversely, concrete has certain
attributes that make it superior to steel. Though concrete can be mixed on site, back log
may exist with steel manufacturers and therefore construction delays are possible.
Concrete has greater resistance to high temperatures and fire, whereas steel is susceptible
to both. Unlike steel, different shapes and forms of concrete can be fabricated depending
on the shape of the formwork. Concrete tends to be more economic than steel. In this
study, an alternate material is proposed. This material is known as slurry-infiltrated
concrete or SIFCON for short. Although relatively a new material when compared to
conventional concrete and steel, SIFCON has the potential to be made into structural

2
members whose cross-sections closely resemble that of rolled steel. Structural members
composed of conventional reinforced concrete and prestressed concrete require clear
covers, and such structural members have thicknesses much larger than steel structural
members in order to fit in rebar and prestressing tendons. Conversely, SIFCON does not
necessarily require rebar or prestressing strands as the fibers dispersed throughout the
mix are the main contributors to the its tensile strength.
Due to the fact that SIFCON does not necessarily require rebar or prestressing
strands leads to the notion utilizing structural members out of SIFCON forgoes facilitates
construction as no rebar cage may be required, as well as cost of such labor and material
is reduced, if not entirely eliminated. Furthermore, it may be easier to replace a damaged
steel structural member with one made of SIFCON whose cross-sectional dimensions are
similar to the steel structural member rather than with one made of conventional
reinforced concrete or prestressed concrete. Having the cross-sectional dimensions closer
in size to steel girders rather than conventional concrete girders and not requiring as
much rebar, if any, allows structural members made out of SIFCON to be lighter than
conventional concrete, while being less costly than steel. In this study, Beams and
cylinders were tested to further delve the potential developments of utilizing structural
members made out of SIFCON. The objectives are as follows:
Compare the flexural behavior of built-up beams with varying steel fiber
combinations.
Compare the compressive strengths and elastic moduli in compression of
cylinders with varying steel fiber combinations.

3
Investigate the effect of external basalt fiber flexural reinforcement on cracked
beams. This is done to emulate beam rehabilitation that may be done on site.
Investigate the effect of using different types of external shear reinforcement.

4
CHAPTER 2: LITERATURE REVIEW
1. Concrete Reinforced with Steel Fibers
Though a relatively new topic within the realm of concrete, extensive research has
been conducted on fiber reinforced concrete. One of the most commonly-used materials
for fibers is steel. Caggiano et al. (2012) investigated the effect of concrete reinforced
with mixed steel fibers of different sizes in concrete specimens tested in compression and
flexure, and the results were compared to plain concrete specimens. Cube specimens
were used to determine the compressive strengths of the concrete with and without
various mixed fiber combinations. It was evident from the compressive strengths that the
specimens’ strength with fibers did not differ greatly from those specimen without fibers.
The 150 x 150 x 600 mm beams consisted of both 0.5% and 1% volume of various
combinations of 33 mm and 50 mm hooked end steel fibers. A notch with a depth of 45
mm was made on the bottom of the concrete beams. The beams were then placed on two
point supports with two concentrated loads being applied on top. The beams were loaded
at a rate of 0.005 mm/min, and dedicated displacement transducers measured the
displacements on both sides of the notch. It was evident that the amount of fibers
influenced the first crack strength and entire post-cracking behavior (Caggiano et al.,
2012). The results showed that the greater the percent volume of fibers, the greater the
first crack load would be enhanced. Due to the fact the two of fibers were close in
geometry and material, the fiber combination had little effect on the behavior of the
concrete (Caggiano et al., 2012). It was suggested that future research is needed to
investigate mixing fibers of different materials and geometry (Caggiano et al., 2012).
Shahidan et al. (2015) tested fiber reinforced concrete cubes with 0.5%, 1% and
1.5% volume of hooked end steel fibers. The cubes measured 100 x 100 x 100 mm, and

5
the sizes of steel fibers included those with lengths of 33 mm and 50 mm. The concrete
cubes were tested after 7, 14 and 28 days of moist curing. It was concluded that the
specimen with 1% volume of 33 mm fibers at 28 days had the highest compressive
strength. The specimens with 33 mm fibers overall had higher compressive strengths than
the specimens with 50 mm fibers. This was most likely due to the fact that the smaller
fibers were more able to occupy voids and it was easier for the concrete to compact
(Shahidan et al., 2015). The highest compressive strength out of the specimens with 50
mm steel fibers required the fibers to occupy 0.5% of the volume.
Pajak and Ponikiewski (2013) observed the comparison between self-compacting
concrete reinforced with steel fibers and normally vibrated concrete. Seventeen beams of
square cross sections were cast with fiber volume fractions of 0.5%, 1% and 1.5%. The
fibers included 12.5 mm straight steel fibers and 30 mm hooked end steel fibers. Unlike
Caggiano et al., the straight steel fibers and hooked end steel fibers were not mixed
together. The beams measuring 150 x 150 x 550 mm with a 500 mm span were set on a
servo-controlled electrohydraulic machine, and were subjugated to three-point bending.
On the bottom of each beam, a 25 mm deep incision was made so that the crack mouth
opening displacement could be measured with a clip gauge. LVDT sensors held by a steel
frame were used to measure the midspan deflection. Deflection at maximum load was
larger for hooked end steel fibers than straight fibers. Another difference between the two
fibers was that after the ultimate load was reached, the load-deflection curve of the
specimens with straight steel fibers dropped suddenly, whereas the load-deflection curve
of the specimens with hooked end steel fibers gradually decreased. An increase of percent
volume of fibers indicated an increase of flexural tensile strength. Fracture energy

6
increases with increase of fibers and is higher for hooked end steel fibers than straight
fibers (Pajak and Ponikiewski, 2013).
The effect of steel fibers on high strength concrete was sought after by Kotatkova
and Reiterman (2014). Prismatic specimens with dimensions of 100 x 100 x 400 mm
were tested in flexure in three-point bending. Cubes were tested to obtain compressive
strength and split strength. Eighteen specimens for each test were made with 60 mm
hooked end steel fibers, 30 mm hooked end steel fibers, 25 mm hooked end steel fibers
and 40 mm flat end steel fibers. The results indicated that 60 mm steel fibers provided the
specimens with the greatest toughness and highest fracture energy (Kotatkova and
Reiterman, 2014). Conversely, the specimens with 30 mm steel fibers had higher flexural
and split strength. Large fibers did not do much to stop the initial cracking, but they
prevented the cracks from getting wider (Kotatkova and Reiterman, 2014). Smaller fibers
tended to be more effective in preventing initial cracking, but once the crack reaches a
certain width, the fibers were no longer effective (Kotatkova and Reiterman, 2014). The
specimens with flattened ends proved to be less efficient than the specimens with hooked
end steel fibers (Kotatkova and Reiterman, 2014).
Like Kotatkova and Reiterman, Jain and Singh (2013) examined the behavior of
concrete in flexure reinforced with different types of steel fibers, however hooked end
steel fibers and crimped steel fibers were used. The hooked end steel fibers were 35 mm
and 60 mm long whereas the crimped steel fibers were 30 mm and 60 mm long. The
fibers occupied 0.75% and 1.5% of the concrete volume. For some of the mixes with
crimped steel fibers, the percent volume of fibers at times needed to be reduced to 1%
and 1.2% due to difficulties that arose while mixing concrete and the crimped steel fibers

7
together (Jain and Singh, 2013). Specimens with dimensions of 180 x 180 x 600 mm and
a span length of 540 mm were tested in four-point bending. A close-loop servo-controlled
UTM was used to test the beams at a displacement rate of 0.1 mm/min until a 0.6 mm
midspan deflection was reached, afterwards the displacement rate was increased to 0.25
mm/min. Flexural testing was completed once a midspan deflection of 3.6 mm was
reached. In comparison to the crimped steel fibers, the hooked end steel fibers showed
greater toughness due to better bonding to concrete than crimped steel fibers (Jain and
Singh, 2013). This is relatable to Kotatkova and Reiterman’s research where hooked end
steel fibers proved to be more effective than flattened end steel fibers.
In the study conducted by Marar et al. (2016), eighty-four beams consisted of
hooked end steel fibers with aspect ratios of 65 and 80 that occupied 0.5%, 1% and 1.5%
of the volume. The 100 x 100 x 300 mm beams were further divided into two series
which differed by the grade of concrete used in each: C30 and C50. The grades of
concrete differed only in water-cement ratios. These beams were tested on a four-point
system, but since the shear strength was the main focus, the point load and point supports
were set up different than that used to study flexural behavior. One of the point supports
was at the end of the beam whereas the other point support was just off center of the
beam. One of the point loads was at the opposite end of the beam whereas the other point
load was just off center of the beam. Furthermore, each beam had an incision 20 mm
deep and 3 mm wide on the top and bottom at midspan in order to ensure that shear
failure would occur along the vertical plane intersected by these two incisions, and so that
the cracks at both notches would propagate simultaneously (Marar et al., 2016). Based on
the results, it was concluded that the higher amount of fiber volume fractions led to a

8
higher shear strength, and the aspect ratio had negligible effect on shear strength (Marar
et al., 2016). Also, the higher the strength and fiber volume fraction, the larger influence
the diameter of fibers had on shear strength (Marar et al., 2016).
Ni et al. (2015) examined the relationship between the flexural behavior of fiber
reinforced concrete and the varying aspect ratios of hooked end steel fibers. Hooked end
steel fibers with different lengths and aspect ratios were kept to 0.7% volume along with
polypropylene fibers which accounted for 0.2% of the volume. Steel fibers with 60 mm
length and 100 aspect ratio, 60 mm length and 67 aspect ratio, 35 mm length and 64
aspect ratio and 35 mm length and 39 aspect ratio were used. The polypropylene fibers
had a length of 18 mm and aspect ratio of 692. A marble cutter was used to make an
incision 25 mm deep and 3 mm wide at the middle of a vertical face of the beams. The
beams, with a span length of 500 mm, were placed on a three-point bending system, and
since the beams were to be loaded at a constant deflection rate, a servo-controlled
electrohydraulic machine was operated in “closed loop.” The test was not halted unless a
midspan deflection of 3.5 mm or a load of 5 kN was reached. It was observed that the
fracture energy was not influenced by the aspect ratio (Ni et al., 2014). With the sizes and
type of steel fibers used in this study in mind, there was no relationship between
proportionality limit and aspect ratio (Ni et al., 2014). It is worth to note that the fracture
energy was largest when the fiber’s aspect ratio was 67.
Uygunoglu (2008) studied the flexural behavior and microstructure of concrete
reinforced with hooked end steel fibers. Steel fibers 30 mm and 60 mm in length
occupied 0.2%, 0.4%, 0.6% and 0.8% of the volume. The beams measured 100 x 100 x
350 mm and were tested in flexure on a three-point system with a manually-controlled

9
machine. These beams were loaded until the first crack began to propagate which point
the testing halted, and the crack width was measured. Afterwards, the cracked concrete
was coated with gold. Part of the concrete was grinded down and glued to a glass slide to
a thickness of 30 microns. A LEO VP-1431 scanning electron microscopy was used to
visual inspect the steel fiber-cement interface and polarizing microscopy was used to
examine the thin concrete pieces. Unlike previous studies where the pull-out test has been
utilized, this study allowed for observations of the steel fiber-cement interface to be made
while the steel fibers were still embedded within the concrete (Uygunoglu, 2008). Due to
a “wavy” appearance on the surface of the steel fibers, it was concluded that the steel
fibers and cement bonded well with one another (Uygunoglu, 2008). A larger amount of
steel fibers caused a decrease in the first crack development and an increase in flexural
strength (Uygunoglu, 2008).
The relationship between steel fibers and several mechanical properties was
sought after by Cagatay and Dincer (2010). These mechanical properties included
compressive strength, flexural strength, compressive elastic modulus and toughness. In
this study, 50 mm and 60 mm long hooked end steel fibers made up 0.5%, 0.75% and 1%
of the mix volume. For each fiber type and volume fraction, three cylindrical samples,
three cubic samples, and three prism samples were cast. The samples were tested at 7
days and 28 days. The cylinders and cubes were tested in compression whereas the
prisms were tested in flexure via four-point bending. A comparator was used to measure
strains of concrete cylinders while under compression. Cagatay and Dincer observed that
the greater amount of fibers and a larger aspect ratio led to a higher compressive strength
and toughness of the concrete samples (Cagatay and Dincer, 2010). While compared to

10
the plain concrete samples, the steel fibers had greater effect on cylinders’ compressive
strength at 7 days than 28 days (Cagatay and Dincer, 2010). Based on the results, there
does not seem to be a clear relationship between the compressive strength and
compressive elastic modulus (Cagatay and Dincer, 2010).
2. Mechanical Properties of SIFCON
Unlike fiber reinforced concrete, slurry infiltrated concrete (SIFCON) deals with
a wet mixture of cementitious material and sand, which is poured onto preplaced fibers in
molds. Rahim et al. (2016) compared the mechanical properties of SIFCON prisms with
prisms reinforced with BRC wire mesh. Both specimen types composed of the same mix.
The SIFCON prisms were sized 50 x 100 x 500 mm whereas the BRC wire mesh prisms
were sized 25 x 100 x 500 mm. The hooked end steel fibers had an aspect ratio of 67 and
accounted for 0.5%, 1% and 2% of the volume in the prism samples. Three samples of
each type were tested in flexure after 7 days, 14 days and 28 days of moist curing.
Overall, the SIFCON prisms were stronger than those with BRC wire mesh due to the
volume of the BRC wire mesh being smaller than 0.5% of the prism it occupied (Rahim
et al., 2016). The SIFCON prism with 2% volume of steel fibers proved to be the
strongest and most ductile specimen with a flexural strength of 19.34 MPa and a
maximum deflection of 10.42 mm (Rahim et al., 2016). As the volume of fibers
increased, so did the flexural strength, maximum deflection and ductility (Rahim et al.,
2016).
Thirugnanam et al. (2001) studied the ductility of SIFCON in the hinging zones of
single span beams and as beam-column joints of a multi-story frame. The steel fibers
were cut from thin wires resulting in a 60 mm length and diameter of 0.8 mm. Within the
slurry, the fibers accounted for 8% of the volume. The fibers were placed random

11
orientation inside the molds while maintaining a random orientation, and the cement-sand
slurry was poured on top until the molds were filled for both the hinging zones of the
beams and the beam-column joints of the frames. The remainder of each specimen was
cast with conventional concrete. A single point load was applied to five simply-supported
beams in numerous loading and unloading cycles in order to observe the cracking
behavior and yielding of the beams. The cyclical load was halted once the beams
collapsed. A set of hydraulic jacks applied identical cyclical loading to each story. To
measure the deflections and strain of the structural components of the frame, LVDTs and
Demec strain gauges were used, respectively, and the displacements of the frame
foundation was measured by dial gauges. Steel fibers proved to reduce crack size in this
experiment (Thirugnanam et al., 2001). With the addition of SIFCON, the energy
absorption capacity increased by 50%, the ductility increased by 100% in the single span
beams and the first crack load increased by 40% in these beams (Thirugnanam et al.,
2001).
Nanni (1992) studied the differences of aramid fibers, polypropylene fibers and
steel fibers mixed with a cement-sand slurry. The aramid fibers were braided and
impregnated with epoxy. The aramid fibers were 1 in long, the steel fibers were 1.5 in in
length and the polypropylene fibers were 1.5 in in length. The percent volume for the
aramid fibers, steel fibers and polypropylene fibers ranged from 0.28%-2.20%, 0.46%-
1.46% and 0.21%-0.42%, respectively. For each of the beam specimens, which measured
4 x 4 x 14 in, the fibers were added last into the slurry mix. After testing the beams in
flexure, it was evident that the fiber content has a direct relationship with flexural
strength for the aramid and steel fibers (Nanni, 1992). The first crack proved to be

12
minimally influenced by fiber content (Nanni, 1992). Results showed that aramid fibers
behaved similar to the steel fibers (Nanni, 1992). Aramid fibers are superior to steel in
terms of corrosion, but yet is currently less economical than steel.
Thirty six beams with dimensions of 150 x 150 x 700 mm out of SIFCON were
constructed by Sashidhar et al. (2011). Binding steel wire with a diameter of 1 mm
played the role for fibers and they occupied 6%, 8%, 10% and 12% of the beam volume.
The fibers also varied in size as they included aspect ratios of 40, 50 and 60. As is the
general procedure with casting SIFCON, the fibers were preplaced in the mold and the
cement-sand slurry was then poured on top until the mold was full. The beams were
tested on a four-point system in flexure with a clear span of 600 mm until failure. The
load came from a proving ring which transferred load to two 16 mm diameter rods 200
mm from one another acting upon the top surface of the beams. The midspan deflections
were measured via dial gages. Compared to the reference specimens, the beams
composed of SIFCON had smaller values of deflection (Sashidhar et al., 2011). The load
carrying capacity and energy absorption had a direct correlation with the aspect ratio and
percent volume of the fibers (Sashidhar et al., 2011).
Sharma et al.’s (2008) research involved thirty slab panel specimens that were
made out of SIFCON. The dimensions of each panel were 1 x 1 x 0.025 m. The 25 mm
fibers used were made out of high strength steel, and composed of 5%, 7%, 8% and 9%
volume of the specimens. The fibers were first placed in the mold, and the cement-sand
slurry was poured into the mold. Along with the panel specimens, cubes of dimensions
150 x 150 x 150 mm sides, dog bone specimens of dimensions 300 x 100 x 25 mm and
cylinders of 150 mm diameter and 300 mm height were cast. A servo-controlled machine

13
under constant rate was used to test the accompanying specimens. The panels were set on
a loading frame such that 16 equally-spaced point loads of identical load magnitude were
acting on each panel. This served as a means to equally distribute the load and prevent
punching shear failure (Sharma et al., 2008). The 500 kN capacity machine used a pre-
calibrated proving ring to transfer the load to the point loads. Load-deformation behavior
data was obtained from gages that were placed at the center and mid-third points on the
bottom of the panels. Cracking began in the center of the panels and as the load
increased, cracks propagated towards to the corners of the panels (Sharma et al., 2008).
These multiple cracks were densely packed and the SIFCON panels did not fail suddenly,
which was not observed in the plain mix panel (Sharma et al., 2008). In comparison to
FRC, there was a substantial increase of the structural properties of SIFCON, specifically
the first crack load and ultimate load which increased by 243% and 429%, respectively. It
should be noted, however, that the structural properties increased with a greater fiber
content, but decreased for the fiber content values greater than 8% (Sharma et al., 2008).
It was proposed that this occurred because the greater amount of fibers might have
obstructed the cement-sand slurry from infiltrating the fiber bed completely (Sharma et
al., 2008).
3. Applications of SIFCON
Research has shown that SIFCON can be used to strengthen or enhance certain
mechanical properties of structural members made out of conventional concrete. Liu
(2014) conducted a study on reinforced concrete beams with SIFCON blocks on the top
of beams. One beam was cast each with one SIFCON block, which had the dimensions of
200 x 120 x 70 mm. Three SIFCON blocks were cast and one block was used on the
beam at a time. The dimensions of the blocks were chosen in order to completely occupy

14
the space on the beam where compression yielding would theoretically take place, as well
as to ensure that the compressive strength of the blocks would be less than the GFRP
bars’ tensile strength (Liu, 2014). Hooked end steel fibers with a length of 30 mm were
aligned perpendicular to the load, and placed one layer at a time to attain the highest fiber
content possible. The placement of a cement-sand slurry followed. Two steel plates
separated the SIFCON blocks from the rest of the beam. The beams differed from one
another only by the amount of holes along the sides of the SIFCON blocks. A total of two
LVDTs were used to measure the midspan deformation at the bottom of the beam and the
shortening of the SIFCON block while under compression. The beam was tested with a
SIFCON block until the midspan displacement reached 80 mm. At this point, the first
block was replaced by the second block, and the test was repeated. The GFRP
reinforcement failed before the third block fail could fail as the third block was stronger
than the first two blocks. The SIFCON blocks increased the ductility of the beams, and
the holes drilled in the blocks ensured that the failure would occur in the blocks rather
than in the FRP bars (Liu, 2014).
Twelve beams were cast and subjugated to cyclical loading in Balaji and
Thirugnanam’s (2013) research. Each beam had dimensions of 100 x 150 x 1700 mm. In
order to ensure a flexural failure, each beam consisted of two 8 mm diameter steel rebar
for compression and tension reinforcement as well as 6 mm diameter stirrups spaced at
100 mm (Balaji and Thirugnanam, 2013). The beams were divided into four groups: one
group had laminate confinement in the bottom face, another group had laminate
confinement on the side faces, a third group had laminate confinement on the bottom and
side faces, and the fourth group did not have any laminate confinement. The laminates

15
were made from SIFCON with round crimpled fibers 30 mm in length at 9% volume. The
20 mm laminates were attached to the beams with Isophthalic resin and covered the entire
beam face. The beams were loaded and unloaded in cycles in flexure on a four-point
system until the ultimate load was reached. Compared to the other specimens, it took
longer for the cracks to develop and widen for the beams with laminate confinement on
the side faces (Balaji and Thirugnanam, 2013). The number of laminates attached to the
beams and a direct relationship with the ultimate loads (Balaji and Thirugnanam, 2013).
The ultimate loads of the beam without laminates, with laminates on the bottom face,
with laminates on the side faces, and with laminates on the bottom and side faces were 27
kN, 33 kN, 36 kN and 55 kN, respectively. Crushing of the concrete after the yielding of
the steel occurred in the control beam, but not in the beams with laminate confinement
(Balaji and Thirugnanam, 2013). The results show that the greater amount of SIFCON
laminates used on the beams, the greater the load capacity, ductility and energy
absorption capacity become (Balaji and Thirugnanam, 2013).
While Balaji and Thirugnanam used SIFCON to increase the flexural capacity of
concrete beams, research by Shannag et al. (2001) involved using SIFCON to repair
beams to increase shear capacity. Fourteen beams with dimensions of 15 x 20 x 200 cm
were tested to failure. The beams had no shear reinforcement in the shear span. Four
beams that failed in shear were repaired with SIFCON jackets within the shear span.
Hooked end steel fibers 30 mm in length composing of 8% of the volume were dispersed
in the formwork, which was set directly on the beams. Once in place, the SIFCON slurry
was poured in, and the formwork was removed after 48 hours. The beams were
subjugated to three-point bending with a 2000 kN capacity machine, and the deflection

16
was set at a rate of 0.02 mm/sec. The load, midspan displacement and curvature were
measured with LVDTs. The strain in the rebar was measured via electrical strain gauges.
The SIFCON jackets increased the shear strength by 25%-55%, and the repaired beams
behaved in a ductile manner as opposed to a brittle shear failure (Shannag et al., 2001).
4. Aluminum Plates as External Shear Reinforcement
While there has been investigation of utilizing FRP or steel as an external shear
reinforcement, the idea of using aluminum is relatively new, and there is a substantially
limited corresponding literature. Abu-Obeidah (2012) tested twenty-six shear deficient
concrete beams reinforced with aluminum plates. The beams, including control beams,
were divided into two groups: Group A consisted of 6 beams and Group B consisted of
20 beams. All of the beams had dimensions of 150 x 250 x 1840 mm. The main
difference between the two groups was that Group A had a shear deficiency in both shear
spans, and Group B had a shear deficiency in only one shear span. The author denoted the
beam length between one point load to the nearest support as the shear span, and the
beam length between the two point loads as the zero shear span (Abu-Obeidah, 2012).
The beams in Group A were reinforced with 2 mm thick aluminum plates, #8 stirrups at
187.8 mm intervals in the zero shear span, 2 #16 mm steel bars as tension reinforcement,
2 #10 mm steel bars as compression reinforcement, and had a span length of 1690 mm.
The beams in Group B were reinforced with 2 mm thick aluminum plates, #8 mm stirrups
at 50 mm intervals within one shear span and the zero shear span, 3 #19 mm steel bars as
tension reinforcement, 2 #10 steel bars as compression reinforcement, and had a span
length of 1550 mm. For each group, various amounts, sizes and orientations of aluminum
plates were utilized. The surface of the aluminum plates and concrete that were to be in
contact with one another were grinded down to enhance the bond with epoxy (Abu-

17
Obeidah, 2012). To attach the aluminum plates to the concrete beams, Sikadur-30LP was
used. All beams were tested on four-point system 2500 kN INSTRON 8806 Universal
Testing Machine. Strain was measured by gauges attached to the aluminum plates. The
load rate was set to 10 kN/min, and the beams were tested to failure. The shear capacity
was increased by 10%-89% with help of the aluminum plates.
5. Basalt Fibers as External Flexural Reinforcement
There has been research conducted in recent years on strengthening the flexural
properties of concrete beams by applying basalt fibers to the external surface. Sim et al.
(2015) studied the effect of strengthening concrete beams with basalt fiber sheets. Ten
concrete beams with dimensions of 240 x 15 x 25 cm were cast. In order to ensure that a
flexural failure occurred, D10 stirrups were placed at every 10 cm along the beam length,
and the shear span to depth ratio was 3.5 (Sim et al., 2005). On all beams except for the
control specimens, basalt fibers sheets were placed on the tension side such that the fibers
were parallel with the longitudinal axis of the beams. The specimens were divided by the
length of basalt fiber sheets being used, which was 0.8L and 1.0L, and the number of
basalt fiber sheet layers used, which ranged from one to three. Two beams were used for
each specimen type. The beams were tested on a four-point bending system with a clear
span of 200 cm. The deflection and strain were measured with help of LVDTs on the
tension side and strain gages on the longitudinal rebar. After being tested to failure, basalt
fiber sheets debonded from the concrete for the beams that consisted of three layers of
basalt fiber sheets (Sim et al., 2005). Since the specimens with one and two layers of
basalt fiber sheets failed without debonding, these layers reached their maximum flexural
capacity and thus proved to be more efficient than three layers (Sim et al., 2005). As
expected, the more layers of basalt fiber sheets used, the greater the yield strength and

18
ultimate load were (Sim et al., 2005). The yield strength increased by 15%, 26% and 16%
for the beams with one layer, two layers and three layers, respectively. The ultimate
strength increased by 0%, 27% and 29% for the beams with one layer, two layers and
three layers, respectively. The length of basalt fiber sheets did not seem to matter too
much as the beams with varying basalt strengthening lengths differed only slightly (Sim
et al., 2005).
Ali et al. (2015) casted four 150 x 300 x 2000 mm reinforced concrete beams
were reinforced with basalt fiber reinforced polymer (BFRP) grids, and one beam served
as the control beam. The BFRP grids for the various beams were 3 mm, 5 mm and 7 mm
in thickness. The beams were further reinforced with 10 mm diameter stirrups at 80 mm
intervals in the shear zone to prevent shear failure (Ali et al., 2015). The tension side of
the beams were sandblasted, washed and airbrushed to enhance the bond between the
epoxy and concrete. On this surface, a thin layer of epoxy was applied and the BFRP grid
was placed, followed by another thin layer of epoxy. If there was any excess epoxy, it
was scraped off to provide a smooth, finished surface. Four-point configuration was used
to test the beams in flexure using a servo-controlled hydraulic actuator, and the clear span
was 1860 mm. To measure deflection, three LVDTs were placed at each end and midspan
of the compression side. In comparison to the control beam, the cracking load, yielding
load and flexural strength with aid of the BFRP grids increased 30-50%, 10-15% and 25-
49%, respectively. In contrast to some of the beams reinforced with basalt fiber sheets as
in Sim et al.’s study, Ali et al.’s specimens experienced no debonding of the BFRP grids
and may prove that BFRP grids are more efficient than basalt fiber sheets (Ali et al.,
2015).

19
Shen et al. (2015) studied the effect of using basalt fibers as additional flexural
reinforcement to beams that have already experienced initial cracking. Where Sim et al.
and Ali et al. casted beams for their research, Shen et al. used two pre-existing beams
from a bridge. These beams had minor flexural cracking at the time they were removed
(Shen et al., 2015). Epoxy resin was used as an adhesive to attach two layers of BFRP
sheets on the tension side of one of the beams. Both beams were tested to ultimate load.
The cracks were more dispersed in the beam with BFRP sheets, whereas the cracks were
more concentrated in the control beam (Shen et al., 2015). The beam with BFRP sheets
experienced a 27.2% increase in ultimate load.

20
CHAPTER 3: EXPERIMENTAL PROGRAM
In this project, a total of 37 beams were tested in flexure. These beams were
divided into 3 groups. The first group composed of 2 beams of similar fiber type to see if
shear reinforcement was needed. One beam had shear reinforcement and the other beam
did not. The second group consisted of 18 beams, which were tested in flexure to
determine the ultimate flexural strength. The 18 beams were further divided into 6 sub-
groups of similar fiber type with 3 beams in each sub-group. The third group consisted of
17 beams, which were tested in flexure until cracking, then reinforced with FRP, or fiber
reinforced polymer, on the bottom tensile flange and tested in flexure to failure. The 17
beams were further divided into 6 sub-groups of similar fiber type with 3 beams in each
sub-group apart from 1 sub-group which consisted of 2 beams of similar fiber type. The
sub-groups differed from one another by the type and percent volume of fibers present in
the beams themselves. The results of both the second and third groups were compared to
one another to observe the effect of flexural strength by rehabilitating damaged beams.
The beams were in the shape of I-beams of similar size. The depth of the beam was 4-¾
inches, the width was 4 inches and the length was 18 inches. The two flanges and the web
had a thickness of ⅜ inch. The 6 sub-groups consisted of a mortar mix with the following
combinations of fibers: 5% per volume 50 mm hooked end steel fibers, 3% per volume
30 mm hooked end steel fibers, 2% per volume 6 mm steel fibers, 1% per volume 13 mm
steel fibers, 1.8% per volume 30 mm with 2% per volume 6 mm steel fibers, and 1.8%
per volume 50 mm with 1% per volume 13 mm steel fibers.

21
1. Glossary and Abbreviations
Within this study, there are certain terms and abbreviations used that may be
unknown to the reader. The purpose of this section is to provide the reader with
definitions of the terms as well as any abbreviations used throughout the text, whose
meaning is not mentioned elsewhere other than this section.
First Group – Two beams composed of 50 mm hooked end steel fibers. One had shear
reinforcement and the other did not. Both were tested to determine whether the epoxy
was strong enough to prevent delamination and whether shear reinforcement was needed
for the remaining beams.
Second Group – Eighteen beams composed of 6 mm, 13 mm, 30 mm and 50 mm steel
fibers. Divided into 6 sub-groups of similar fiber type and combination. Beams in this
group were tested in flexure to determine ultimate strength.
Third Group – Seventeen beams composed of 6 mm, 13 mm, 30 mm and 50 mm steel
fibers. Divided into 6 sub-groups of similar fiber type and combination. Beams in this
group were tested to the point of when cracking began, reinforced with basalt fiber on the
bottom of the tensile flange, and tested to failure to study effect of rehabilitation on the
ultimate flexural strength.
Nano-inorganic composite – Adhesive developed at Rutgers University by researchers to
bind fiber reinforced polymers, in this case basalt fiber, to a concrete surface. Made of a
solid component and a wet component. Took two weeks to cure.
Sikadur-31 – Two-component epoxy produced by Sika Corporation. The two components
are known as Component A and Component B. Component A is white in color and
Component B is black in color.

22
Beam Designation: XMM-MODA-SN or X&YMM-MODA-SN
X: Fiber length present in beam (for beams with one fiber type present)
X&Y: Fiber length present in beam (for beams with two fiber types
present)
MM: unit of fiber length (millimeters)
MODA: month and day of when concrete was cast (i.e. March 7th = 0307)
S: Shear reinforcement (AL for aluminum angles; FRP for basalt fiber)
N: Number beam with the fiber type and combination present (i.e. number
from 1-6)
2. Construction of Plate Molds
The molds for the plate specimens were constructed out of ¾ inch thick plywood
and ⅜ inch by ⅜ inch pine hardwood strips. The top surface of the plywood acted as the
bottom surface of the wooden plate mold. The hardwood strips were used to enclose a
rectangular area that would contain the cast concrete to form the plate specimen. Since
the plywood was manufactured in sheets that measured 4 feet by 8 feet, a table wood saw
was used to cut the plywood into smaller pieces. The plate specimens, when cast, would
be consolidated while situated on a vibrating table. The cuts of plywood for the wooden
plate molds needed to be small enough to fit completely onto the vibrating table. In
general, the cuts of plywood measured 20 inches by 14 inches. The hardwood strips were
also cut since they were manufactured in lengths of 36 inches. The plate specimens that
would make up the beams were sized 18 inches by 4 inches with a ⅜ inch thickness. The
hardwood strips were cut into four pieces per each mold. Two pieces would be situated
along the short dimension of the mold and would be denoted as end pieces. The two other

23
pieces of the hardwood strips would be situated along the long dimension of the mold and
would be denoted as side pieces. The side pieces were cut to a length of 18 inches.
Though the end pieces needed to be at least 4 inches long, they were cut such that their
length was 5-6 inches. This was done as way to provide a means of demolding the plate
specimens. The length of the end pieces included 4 inches for the width of the plate
specimen, ¾ inch for the interface with the two side pieces, and ¼ inch to 1 ¼ inch
extension to provide leverage so a chisel and hammer would be able to remove the end
piece. This method shall be discussed later in Section 4.2. The side piece was first
attached to the plywood with two wire nails hammered in the side piece. The location of
the wire nails varied from 1 inch to 4 inches from the nearest end of the side piece. The
reason for this range is that the grain of the wood at times would obstruct the wire from
penetrating the hardwood strip, and a new location nearby would have to be utilized. A
pen and tape measure was used to draw a 1 inch long line at a distance of 4 inches from
the ends of the side piece. This was done so the second side piece would line up to these
two lines while ensuring that the distance between them would be 4 inches. One end
piece was positioned such that one end of the large dimension would be flush with the
small dimension of the side piece, while the end piece extending a distance of at least 4
inches. Two wire nails were hammered into the end piece at a distance of 1 inch from
each end. The second side piece was lined up along the two 1 inch lines and its small
dimension was lined up perpendicularly to the long dimension of the end piece. The
second side piece was attached to the plywood by hammering two wire nails 1 to 4 inches
from each end. The second end piece was lined up such that to enclose the area
encompassed by the first three pieces, and the second end piece was hammered in the

24
plywood with two wire nails positioned at 1 inch from each of its ends. The plate mold
can be seen in Figure 1 below.
Figure 1: Wooden plate molds
3. Concrete Material and Mixing Procedure
3.1 Concrete Materials
The building material being investigated consists of five ingredients: concrete
sand, superplasticizer, Type I Portland cement, water, and steel fibers. The mix design, as
seen below in Table 1, was predetermined based on previous research.
Table 1: Mix Design
Material Percent per Unit Weight
Cement 29.6%
Sand 59.2%
Water 10.7%
Superplastizer 0.6%
The sand was obtained from Weldon Materials in Berkeley Heights, New Jersey.
Prior to pick up, the sand was stored outside and was exposed to the environment. The
sand was not heated before batching and mixing to eliminate moisture. Therefore, it is

25
possible that there is moisture in the sand at the time of pick up, batching and mixing.
The sand had a fineness modulus of 2.6. The sand was not sieved prior to batching,
however, if there was aggregate larger than ⅜ inch, it was removed by hand. Such
aggregate was removed as it was seemed to be a foreign particle that mistakenly made its
way in the pile of sand in the quarry. The water was obtained from a hose in the
laboratory.
3.2 Batching of Materials
The first items to be batched prior to mixing were the cement, sand and water.
One 5-gallon plastic bucket each was used to transport and temporarily store the cement,
sand. The empty bucket was placed on a scale that would record the weight in pounds to
two decimal places with an accuracy of ± 0.05 pounds. The scale was zeroed out while
the empty bucket was on it, such that any additional material on the scale, namely the
material added to the interior of the bucket, would register on the digital dial as the
approximate weight of the material needed. The cement was first added to the empty
bucket on the weight scale. Using a round mouth scoop, the cement was added to the
bucket until the net weight displayed matched the required cement weight as per the mix
design and volume of the mix ± 0.05 pounds. Figure 2 depicts this step.

26
Figure 2: Batching cement
In the case where the weight of material required was beyond the level of
accuracy of the scale, the required weight of that material was rounded up or down
according to the following situations. If the required weight of the material had the digit
in the hundredths place less than 3, then the required weight was rounded down such that
the digit in the hundredths place was 0. If the required weight of the material had the digit
in the hundredths place greater than 2 and less than 8, then the required weight was
rounded such that the digit in the hundredths place was 5. With any required weight of
material outside of the ranges mentioned in the previous two cases, the digit in the
hundredths place was rounded to 0, and a 1 was added to the tenths place. Once the
correct amount of cement was weighed, the bucket with the cement was removed from
the scale and another empty 5-gallon bucket was placed on the scale. The scale was
zeroed out while the empty bucket was situated on the scale so that they weight reading
would be solely of the material in the bucket. The sand was transported from its storage

27
location to the bucket with a round mouth scoop. Dry sand was used as much as possible,
however, there was a possibility that the sand was not completely dry. The sand was
inspected by feel and visually. If the sand was deemed too wet, then the sand would be
dried in an oven until there was no moisture content. The sand was added until the net
weight displayed matched the required sand weight as per the mix design and volume as
seen in Figure 3.
Figure 3: Weighing required amount of sand
Due to the level of accuracy of the scale, the method previously explained
regarding rounding the required weight of material was considered. When the required
weight of the sand was displayed by the scale, the bucket of sand was removed. Another
empty bucket was placed on the scale and the scale was zeroed out. Water was added to
the bucket via a hose in the laboratory until the required weight of the water was
displayed on the scale dial after taking the weight rounding consideration as previously
mentioned. Once the required weight of the water was displayed by the scale dial, the

28
bucket of water was removed. The next material to be batched was the superplasticizer.
Since the amount required of the superplasticizer was relatively small to that of the
cementitious material, a scale with that can read and display a recorded weight to the
nearest one-tenth of a gram was used. A clean plastic cup was placed on the scale and the
scale was zeroed out. The required amount of superplasticizer was poured into the cup.
During the pouring of the superplasticizer, the cup was temporarily removed from the
scale so that if the superplasticizer would spill, the spilled material would not affect the
weight reading on the scale. Once the required amount of superplasticizer was displayed
by the dial on the scale, the cup and superplasticizer were removed as seen in Figure 4.
Figure 4: Weighing required amount of superplastizer
A clean, plastic cylindrical mold was used to contain the required amount of steel
fibers. Using the same scale as was used for measuring the amount of superplasticizer,
the empty cylindrical mold was placed on the scale, and the scale was zeroed out. The
required amount of steel fibers were placed into the cylindrical mold until the weight

29
displayed on the scale dial represented the weight and amount of steel fibers required.
The 30 mm and 50 mm fibers were transported from their storage location to the
cylindrical mold by hand. However, it was advisable that the 6 mm and 13 mm steel
fibers not come into contact directly by hand as a safety precaution. The diameters of the
6 mm and 13 mm steel fibers were relatively small and could puncture the skin even by
wearing the necessary gloves. Therefore, a ⅜ inch diameter steel tamping rod was used to
help guide the 6 mm and 13 mm steel fibers from their bag directly to the cylindrical
mold.
3.3 General Mixing Procedure
The buckets of cement, sand, water and cup of superplasticizer were brought to
the area where the mixer was located. The materials were placed on a tarp in order to
prevent the area from becoming dirty in the case of spillage. The mixer was a Univex
SRM12 concrete mortar mixer. The propeller blade was removed as was the mixing
bowl. The mixing bowl was placed on the ground next to the batched materials so the act
of adding the material to the bowl would be easier. The sand was first added to the bowl.
Figure 5 depicts this step.

30
Figure 5: Adding sand into mixing bowl
The mixing bowl was then attached to the mixer as was the propeller blade, and
the mixing bowl was raised to the starting position required for mixing. Cement was then
added to the mixing bowl by use of the round mouth scoop. This can be seen in Figure 6.
Figure 6: Adding cement into mixing bowl

31
It is worth noting that the cement was added to the bowl after raising the mixing
bowl to the starting position for two main reasons. If the cement was added into the
mixing bowl before the sand, the sand could cause a portion of the cement to plume and
exit the mixing bowl upon impact, which would result in a lower amount of cement than
designed for. Furthermore, due to the nature of the sand, cement and concrete mortar
mixer setup, if both materials were situated in the mixing bowl prior to raising the mixing
bowl, there would be difficulty to raise the mixing bowl since the propeller blade could
not penetrate the cement and sand. Once in the starting position, the mixer was turned on
to the lowest frequency for 1 minute. This was done so that the dry material may be
homogenously mixed before the addition of the liquid material. When the 1 minute of dry
mixing was complete, the superplasticizer was poured into the bucket of water in a way
such that all of the superplasticizer left the cup and none was left on the interior side of
the cup. Figure 7 illustrates this step of the mixing procedure.
Figure 7: Premixing superplastizer with water

32
The bucket of water and superplasticizer was picked up slightly and shaken by
hand in order for the water and superplasticizer to become a homogeneous solution. This
bucket was poured into the mixing bowl and a ⅜ inch diameter steel tamping rod was
used to create voids into the dry material so that the liquid solution could penetrate easier
throughout the dry material and to avoid the liquid material from splashing out of the
mixing bowl once the mixer would be turned on. This step is shown in Figure 8.
Figure 8: Creating voids prior for liquid to penetrate prior to wet mixing
The material was then mixed for 3 minutes of the lowest frequency. After the 3
minutes, the mixer was stopped and a ⅜ inch diameter steel tamping rod was used to mix
the material to provide as much contact as possible between the liquid and solid
components. This was essential because due to the setup of the mixer, the propeller blade
cannot reach the bottom of the mixing bowl, preventing the components from mixing
completely. It was permissible to remove the mixing bowl from the mixer and mix by
hand, which is shown in Figure 9.

33
Figure 9: Hand mixing of mortar mix
This proved to be a more efficient way of mixing rather than using the ⅜ inch
diameter steel tamping rod since it was easier to detect whether dry clumps existed in the
mixing bowl, in which case they would be broken up by hand. Once it was felt that the
mixture had no dry clumps, whether via tamping rod or by hand, the mixing bowl was
attached to the mixer and the mortar was mixed for another phase of 3 minutes. In this
phase, the intensity was increased every 20-30 seconds by 1 tick mark as displayed on the
machine. After this phase, the mixing bowl was removed and the mixing procedure was
complete.
3.4 Mixing Procedure with Premixed Fibers
The mixing procedure for the 6 mm and 13 mm steel fibers differed from the
mixing procedure of the plain mortar mix. Because of their size, the 6 mm and 13 mm
steel fibers were small enough to be mixed along with the cement, sand, water and
superplasticizer before casting. With all the materials batched, the first step of the mixing

34
procedure was to add 2 scoops of sand, 1 scoop of cement and a representative amount of
steel fibers. The steel fibers were poured from a clean, plastic cylindrical mold. This step
is depicted in Figure 10.
Figure 10: Adding steel fibers to mixing bowl
What is meant by the term representative amount, is that the materials present in
the dry mix will not be added to the mixing bowl and mixed together simultaneously.
Rather, to guarantee homogenous mixing occurs, a smaller portion of the dry material

35
would be added and mixed before another portion of the dry material would be added and
mixed. It was up to the person mixing to visually judge how much steel fibers would be
deemed as an appropriate representative amount of steel fibers in order to be
proportionate with each addition of sand and cement. Each of the dry materials were
added and mixed on the lowest intensity for 30 seconds. This process was followed until
all of the dry material had been added and mixed. The superplasticizer was then poured
into the bucket of water such that there was little to no superplasticizer remaining on the
interior sides of the cup. The bucket of the 2 liquid materials was picked up slightly and
shaken by hand to allow the 2 liquid materials to become a homogeneous solution. As
was the case of the addition and mixing of the dry material, the liquid solution was added
and mixed in smaller portions rather than all at the same time. A plastic container was
used to transport a small portion of the liquid solution from the bucket to the mixing
bowl. This was done for 2 reasons. When a small portion of the liquid solution was
introduced to the dry material, the nature of the mixture with a low moisture content
would cause the material to clump, creating voids that would allow access to the bottom
of the mixing bowl as seen in Figure 11.

36
Figure 11: Adding small amount of superplastizer-water solution
With each addition of the liquid solution, the liquid solution was poured in these
deep voids so the material at the bottom could come into contact with moisture. This
method is preferred over adding the entire liquid solution at one moment of the mixing
procedure because the mortar mix with small steel fibers should not be mixed by hand as
was the case in the plain mortar mix procedure explained previously. Due to the diameter
of the small steel fibers, it was fairly easy for the fibers to become lodged into the human

37
skin. Furthermore, because the sand was not completely dry before mixing, it was
possible that the mixture would have contained too much moisture if the entire amount of
liquid solution was added. To ensure that the mixture was not too moist, small portions of
the liquid were added and mixed for 30 seconds on the next higher frequency. It was up
to the visual observation and judgement of the person in charge of mixing to decide
whether more liquid solution was needed or no. This was also to prevent segregation of
the material.
4. Casting and Demolding
4.1 Plate Casting
Before the concrete was placed, a releasing agent was applied to the wooden
molds so that the concrete would not bond with the wooden surface and therefore it
would be easier for demolding. To do so, WD-40 was applied on all interior sides of the
mold wherever the concrete would be in contact the mold. The mixing bowl of concrete
was removed from the mixer and placed next to the vibrating table. The size of the
vibrating plate allowed two plates to be cast at a time. The wooden plate molds were
placed in close proximity to the vibrating table to minimize the lag time between
removing cast plates from the vibrating table and mounting empty molds onto the
vibrating table. Due to their larger size compared to the 6 mm and 13 mm steel fibers, the
30 mm and 50 mm steel fibers were preplaced in the molds before the placement of
concrete, rather than added during the mixing procedure. Other than physically
preplacing the 30 mm and 50 mm fibers, the plate casting procedure was the same for all
mix types. The 30 mm and 50 mm steel fibers were added to the wooden plate molds
after the application of the WD-40 lubricant. After the wooden plate molds were placed

38
onto the vibrating table and the WD-40 was applied, the 30 mm and 50 mm steel fibers
were placed by hand in such a way the fibers were uniformly distributed throughout the
mold while maintaining a random orientation. This is illustrated in Figure 12.
Figure 12: Placing 50 mm hooked end fibers in wooden molds prior to mixing
The vibrating table was turned on to the lowest frequency as to prevent the 30 mm
and 50 mm steel fibers from moving out of position. What was observed before
implementing this step, was that if the vibration was at a mid-level to high-level
frequency, the 30 mm and 50 mm steel fibers tended to gravitate towards one area and
align their orientation in the same if not similar direction. A round mouth scoop was used
to transport concrete from the mixing bowl and place it into the wooden plate molds
which can be seen in Figure 13.

39
Figure 13: Casting plate molds
Once the majority of the 30 mm and 50 mm steel fibers were in contact with the
concrete, the frequency of the vibrating table was increased. It was assumed that weight
of the placed concrete would hold the steel fibers in place while the vibrating frequency
was increased, and that any possible movement of the preplaced steel fibers would be
minimal and have negligible effect. Generally, the concrete was placed along the middle
of the mold to allow the concrete to consolidate towards the ends and sides of the mold

40
during vibration. If the concrete was originally placed along the edge of the mold during
consolidation, the concrete might have spilled over the side of the wooden plate mold and
be deemed wasted material. A 6 inch trowel was used to assist to distributing the concrete
throughout the wooden plate mold and further consolidate the concrete. Having the
trowel be 6 inches in width allowed for the trowel to rest on the sides of the mold and
ensure that the top surface of the concrete plate would be level with the top of the mold.
Figure 14 depicts this step.
Figure 14: Trowel used to provide a smooth finish of the plate sample

41
Using a brushing-like action, the remaining parts of the mold were filled and the
top surface of the concrete plate was leveled with a smooth finish. When the plate molds
were filled and level, they were removed and placed on a level table in an
environmentally-controlled lab room free of vibration for initial curing. To prevent the
concrete from setting and becoming less workable, the concrete was hand mixed with the
round mouth scoop until it was visually and physically determined that the concrete had
adequate workability. After the casted plate samples were stored, the next wooden plate
molds were filled following the same procedure, until all the plates were cast. The plate
samples underwent dry-curing for 24 hours ±8 hours as per ACI C31 specification.
4.2 Plate Demolding
After the dry-curing phase, the plate samples were demolded. The demolding
process required two tools: a hammer and a chisel. Due to the design of the mold itself,
the end pieces extended past the 4-inch wide plate specimen and the two ⅜-inch wide
side pieces. With the end piece sticking out slightly, the chisel and hammer were used to
remove the end piece from the mold entirely, without disrupting the other components of
the mold and the plate specimen itself. The flat end of the chisel was in contact with the
top surface of the plywood, which was the same surface as the bottom of the wooden
plate mold. The angled part of the chisel was faced up and wedged in between the top
surface of the plywood and the bottom of the end piece. The direction of which the chisel
was hammered was such that the longitudinal axis of the chisel was perpendicular to the
wooden plate mold’s end piece. Figure 15a illustrates the demolding of the first end
piece.

42
Figure 15: Right (a) Removing first end piece; Left (b) Removing first side piece
Once the end piece was removed, one of the side pieces was removed. It did
matter which one, but at least one end piece and one side piece needed to be removed.
Having the flat part of the chisel level with the bottom surface of the mold and the angled
part facing up, the chisel was wedged between the bottom of the mold and the side piece,
and hammered such that the side piece would move up. This is illustrated in Figure 15b.
Once it was evident that the one nail connecting the side piece to the bottom of the mold
was dislodged, the side piece was further removed by hand. The plate specimen was
removed with two hands evenly spaced along the plate specimens’ long dimension and
lifting up slowly as see in Figure 16.

43
Figure 16: Removing plate sample by hand
After the plate specimens were removed, one side of the specimens were labeled
to identify the type of fibers present in each plate, when the plate was cast and the last
name of the researcher responsible. The plates were then placed in a curing room where
they would be subjected to wet curing for 28 days. With use a trowel to scrape the bottom
and interior sides of the wooden plate mold, any remaining concrete was removed. The
end and side pieces that were removed in the demolding process were discarded and
replaced with new end and side pieces of similar size. The wooden plate molds were able
to be re-used for an additional two times.
4.3 Cylinder Casting
The cylinders were cast using 4 inch by 8 inch plastic cylindrical molds. Similar
to the wooden plate molds, WD-40 was applied on all interior sides of the plastic
cylindrical molds. The cylindrical molds were placed on the vibrating table. With the
round mouth scoop, the concrete was transported from the mixing bowl into the

44
cylindrical mold. The dial on the vibrating plate was set on a mid-level frequency. If the
frequency was too low, the concrete would not consolidate sufficiently, and if the
frequency was too high, the water would have bled through the top surface of the
concrete. Unlike casting the plate specimens, the 30 mm and 50 mm steel fibers were not
preplaced simultaneously. Instead, they were added in representative amounts with every
scoop of concrete added to ensure that the 30 mm and 50 mm steel fibers were uniformly
distributed throughout the concrete cylinder. Figure 17 depicts adding the 50 mm steel
fibers into the cylinder.
Figure 17: Adding 50 mm steel fibers into cylinder
If this was not done and the steel fibers would have been preplaced all at once
prior to casting, the steel fibers would have been concentrated towards the bottom of the

45
concrete cylinder. The concrete was added in relatively small portions at a time, after
which the 30 mm and 50 mm steel fibers were added. When it became visually evident
that the 30 mm and 50 mm steel fibers could not consolidate further into the concrete, the
next relatively small portion of concrete was added into the cylindrical mold. This
process was repeated until the cylindrical mold was completely filled with concrete. A
flat bottom trowel and ⅜ inch diameter steel tamping rod was used to smooth out the top
surface of the concrete cylinder. Afterwards, the concrete cylinders were capped and
placed on a level table in an environment-controlled lab room free of vibration for initial
curing.
4.4 Cylinder Demolding
After 24 hours ±8 hours of dry curing, the cylinders were demolded. The cap of
the cylindrical mold was removed by hand or by rubber mallet if needed be. The cylinder
was then orientated with the bottom surface facing up and the top surface resting on a
flat, level surface. A nail was hammered in a pre-manufactured hole in the center of the
bottom surface of the cylindrical mold 10-15 times. With the bottom of the cylinder
facing up, a pressurized hose was then used to force air into the manufactured hole. The
air flowed through the space between the cylindrical mold and concrete cylinder, and the
increase in pressure forced the cylindrical mold to be removed from the concrete
cylinder. Once demolded, the concrete cylinders were labeled with information detailing
the mix type, date of casting, and the last name of the researcher responsible. The
cylinders were then placed in a curing room where they would be subjected to wet curing
for 28 days. A few of the plate samples are in the curing room in Figure 18.

46
Figure 18: Concrete plates in curing room
5. Beam Fabrication
5.1 Overview
After 28 days of moist curing, the concrete plates were taken out and placed in a
temperature controlled lab environment as seen in Figure 19. The concrete plates
remained in this storage facility until the epoxy was obtained. The epoxy acted as an
adhesive so that the concrete plates could be connected perpendicular to one another.
Originally, it was thought that a nano-inorganic composite would be strong enough to
connect the concrete plates together. However, when such a beam was tested in flexure as
seen in Figure 20, the bottom flange and web delaminated from one another before any
shear or flexure failure could have taken place. Therefore, an epoxy was sought after to
prevent delamination.

47
Figure 19: Concrete plate samples in temperature controlled lab environment
Figure 20: Delamination of nano-inorganic composite evident at right end of beam
Before the concrete plates could be connected, the concrete plates were prepared.
This process included assigning which concrete plates would act as the flanges and which
concrete plates would act as the webs. The plates that were to be assigned as the webs

48
were chosen on the basis on whether they could stand on their own completely vertically
on a plate acting as a flange. If the plate was able to accomplish this, then it would be
designated as a web and the plate it was balancing on would be designated as a flange.
The concrete plates were also grouped into beams such that each beam would have been
composed of concrete plates of the same mix and age. The next step was to use a black
marker to trace the perimeter of the area of the web-flange interface. This perimeter was
traced on the interior side of the flanges such that the space in between the two
longitudinal lines was ⅜ inch, which corresponded to the thickness of the webs. The two
longitudinal lines were produced such that each line was equidistant from the center
longitudinal axis of the concrete plate to ensure that the concrete plate acting on the web
would be aligned in the center of the flanges. The longitudinal lines were continued along
the thickness of the concrete plates acting as the flanges. This was done in foresight
because once the epoxy would be applied to the area between the web and flange, the
longitudinal lines dictating the area where the web should be aligned would no longer be
visible for the epoxy would cover those lines. Having these continue along the flange
thickness, where the lines would not have been covered by the epoxy, allowed for the
assurance that the flange would be aligned within the two longitudinal lines. For the cases
where the beam was to include shear reinforcement consisting of aluminum angles, a
black marker was used to draw the border of the aluminum angle onto the flange. This
can be seen in Figure 21.

49
Figure 21: Marked lines indicating area of epoxy application
The area bound by these lines represented the area that would be occupied by the
horizontal leg of the aluminum angle. In order for the concrete-epoxy connection to be
enhanced, a steel wire brush was used to produce a rough surface along the longitudinal
edges of the web, the area of the flanges in between the two longitudinal lines, and the
area on the web and flange that was to be in contact with the aluminum angle, if
applicable. Figure 22 shows the steel brush producing a rough surface on the concrete.
This was done to promote interlocking of the concrete and epoxy such to prevent possible
delamination.

50
Figure 22: Steel brush producing a rough surface on the concrete plate
Before all of the beams were connected via epoxy, two test beams were
constructed to determine whether the epoxy was strong enough so that delamination
would not occur through visual inspection. Both beams were composed of 5% volume of
50 mm steel hooked end fibers and had age was 200 days. One beam had aluminum
angles as shear reinforcement and the other beam had no shear reinforcement. It is also
worth of note that in order to prevent the flange from moving during application of epoxy
and attaching the web, the flange of each beam was clamped down to the table.
5.2 Shear Reinforcement Design
Not certain whether the concrete beams would fail in shear or flexure, it was
decided to include shear reinforcement in order for a flexural failure to occur. Since the
beam was 18 inches in length, it was decided to divide the length of the beam in thirds,
where the 2 thirds from the ends would include shear reinforcement as that is where shear
is the greatest. The middle third would not have shear reinforcement. Therefore, the shear
reinforcement zone would exist within 6 inches from each end.

51
5.3 Aluminum Angle Preparation
For one of the initial two beams of the first group, aluminum angles were used as
shear reinforcement. The aluminum angle had a thickness of 1/16 inches and each leg
was 1 inch long. Since the aluminum angle was manufactured in 6 foot lengths, a chop
saw was used to cut the 6 inch lengths. After cutting the aluminum angles in 6-inch
lengths, it was observed that there was aluminum become jagged at the location where
the cut was. A grinder was used to smooth out the ends so that the aluminum angle would
be flush with the corner made by the web and flange. The grinder was also used to
produce a rough surface on the sides of the aluminum angle that was to be in contact with
the epoxy. The grinding of the aluminum angle and the grinded surface of the aluminum
angle are shown in Figure 23a and Figure 23b, respectively.
Figure 23: Left (a) Grinding aluminum angle; Right (b) Grinded aluminum angle

52
5.4 Epoxy Mixing Procedure
The Sikadur-31 epoxy consisted of two components. A plastic container was used
to batch and contain both components. The plastic container was placed on a scale and
the scale was zeroed out such that any non-zero weight reading on the scale would
indicate the weight of additional material other than the plastic container. The two
components had a weight ratio of 1:1, meaning for any size mix, each component’s
weight should be the same as each other. A wooden paint stirrer was used to transport an
amount of Component A to the container, and the container was placed onto the scale.
The weight of the material was noted and Component B was added to the plastic
container on top of the Component A via a 2 inch wide plastic spatula until the weight
reading on the scale doubled the weight of the white component which is shown in Figure
24.
Fiugre
Figure 24: Batching of two components of epoxy
Another wooden paint stirrer was used to mix the two components by hand until
the epoxy formed a uniform gray color and no white or black was visible, indicating a

53
homogeneous mix. Depending on the size of the mix and intensity of mixing, the duration
of hand mixing with the stirring tool generally was between 2-5 minutes. This step is
depicted in Figure 25.
Figure 25: Mixing two components of epoxy together
It should be noted that there was no specific reason why a wooden paint stirrer
and a 2 inch plastic spatula were used, but it should be emphasized that three separate
tools should be used to batch each component and mixing them together for two reasons.
The first reason is to prevent one component on the batching tool from coming into
contact with the other component in the storage container, and if this were to happen, the
components could begin to react with each other in the storage container. The second

54
reason is to prevent excess component on the batching tool from coming into contact with
the already-batched material in the plastic container for mixing. Once the material was
properly batched, no more material was added. However, if the same tool was used for
batching and mixing, then the individual component still on the tool might disrupt the 1:1
ratio in the plastic container.
5.5 Applying Epoxy to Concrete Plates
Once the epoxy was homogenously mixed, a wooden or metal spatula is used to
transport the epoxy from the plastic container and place it onto the concrete plate. The
epoxy was applied in the area encompassed by the lines that were previously drawn and
the area of the web that was to be in contact with the flange. As mentioned before, the
area bound by these lines represented the area where the web and flange were to be
connected. It was made sure that the layer of epoxy was not too thick otherwise shrinking
of the epoxy would have a negative impact on the connection. Therefore, the wooden or
metal spatula was used to smooth and distribute the epoxy throughout the area dictated by
the previously drawn lines and the area of the web that was to be in contact with the
flange until the layer of epoxy was relatively small as seen in Figure 26.

55
Figure 26: Applying epoxy to concrete plate
There was no means of measuring the thickness of the epoxy layer, so visual
inspection and judgement were used to determine whether the thickness of the epoxy
layer was sufficient. Due to the fact that one of the first two beams to be tested had shear
reinforcement consisting of aluminum angles, the aluminum angles needed to be in
contact with the epoxy as well. The vertical leg of the aluminum angle was to be attached
the web whereas the horizontal leg was to be attached to the flange. The epoxy was
applied to one side of the vertical leg of the aluminum angle, yet the epoxy, that was to be
in contact with the horizontal leg of the aluminum angle and flange, was applied directly
on the flange. The reason that the epoxy was applied to one leg of the aluminum angle
was to facilitate the placement of the aluminum angle which would not have been the
case if the epoxy was applied on both legs of the aluminum angle prior to placement. The
application of the epoxy in the area that was to be occupied by the horizontal leg of the

56
aluminum angle followed the same procedure for the application of the epoxy for the
web-flange connection.
5.6 First Flange - Web Attachment
With the epoxy applied on the web and flange, the web was placed onto the flange
such that the areas of the web and flange covered by epoxy would coincide with one
another. Pressure was briefly applied downward onto the web by hand and the position of
the web was adjusted such that the angle between the web and flange was 90 degrees.
This step is illustrated in Figure 27.
Figure 27: First flange to web attachment
Bricks and/or wood blocks were strategically placed on both sides of the web
until the epoxy set to ensure the required perpendicular connection. The epoxy needed at
minimum 24 hours to completely set as per Sikadur-31 specifications, so as a
conservative rule of thumb, the concrete plates were not disturbed until the next day. It
would normally take 48 hours to for a beam to be fabricated, as the second flange would
not be attached to the web until the epoxy from the first web-flange connection
completely set.
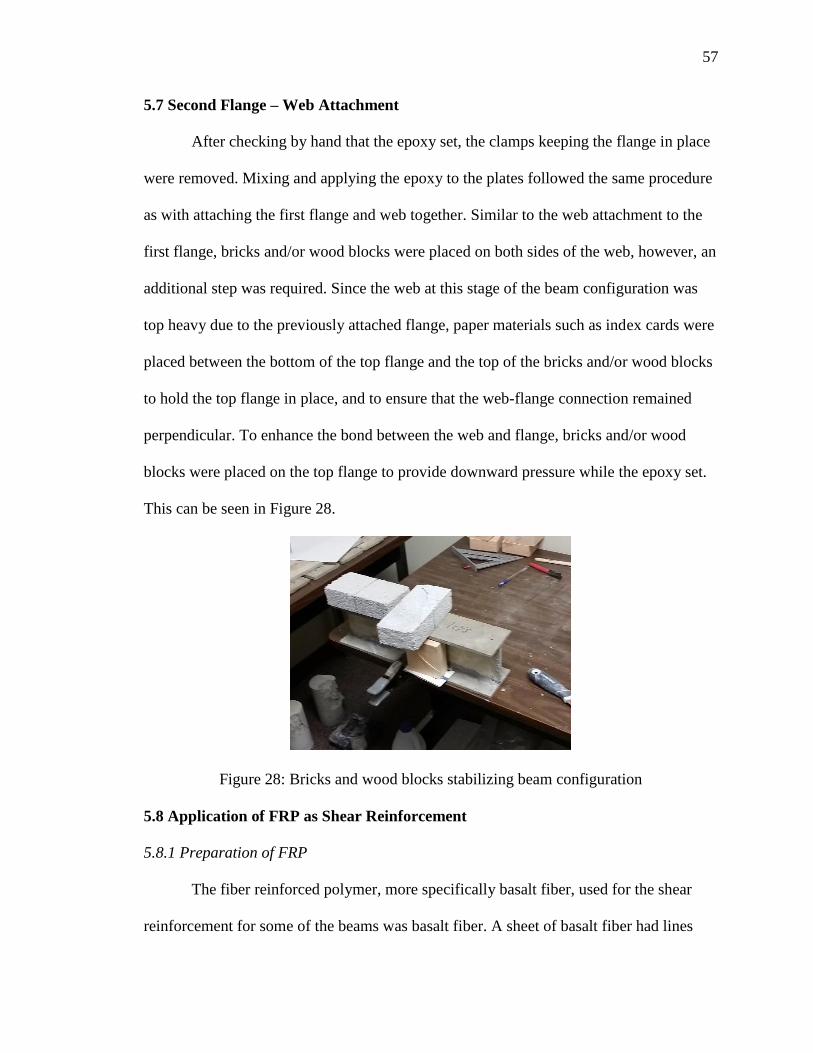
57
5.7 Second Flange – Web Attachment
After checking by hand that the epoxy set, the clamps keeping the flange in place
were removed. Mixing and applying the epoxy to the plates followed the same procedure
as with attaching the first flange and web together. Similar to the web attachment to the
first flange, bricks and/or wood blocks were placed on both sides of the web, however, an
additional step was required. Since the web at this stage of the beam configuration was
top heavy due to the previously attached flange, paper materials such as index cards were
placed between the bottom of the top flange and the top of the bricks and/or wood blocks
to hold the top flange in place, and to ensure that the web-flange connection remained
perpendicular. To enhance the bond between the web and flange, bricks and/or wood
blocks were placed on the top flange to provide downward pressure while the epoxy set.
This can be seen in Figure 28.
Figure 28: Bricks and wood blocks stabilizing beam configuration
5.8 Application of FRP as Shear Reinforcement
5.8.1 Preparation of FRP
The fiber reinforced polymer, more specifically basalt fiber, used for the shear
reinforcement for some of the beams was basalt fiber. A sheet of basalt fiber had lines

58
drawn on it with a black marker to represent rectangular pieces with dimensions of six
inches by seven inches. The dimension of six inches was required to reinforce the beam
up to six inches from each end. The dimension of seven inches was required to reinforce
the beam in shear by being connected to the top of the bottom flange, side of the web and
bottom of the top flange. Figure 29 shows the preparation of the basalt fiber.
Fiber 29: Lines and tape applied to basalt fiber
Once these lines representing the dimensions were drawn, transparent scotch tape
was placed on top of the lines perpendicular to the longitudinal orientation of the basalt
fibers. This was done to prevent the fiber from fraying while cutting the basalt fiber with
scissors.
5.8.2 Batching and Mixing of Nano-Inorganic Composite
The materials to produce the nano-inorganic composite consisted of a solid
component and a liquid component. The solid component was previously batched and
stored in a plastic bag. The liquid component needed to be batched out 190 grams for
each bag of solid component. The solid component was first added to the blender, and
then the liquid component followed which can be seen in Figure 30.

59
Figure 30: Adding materials into blender
The lid was placed on top of the blender and the blender was turned on maximum
speed for two minutes. After two minutes, the blender was stopped and a plastic spatula
was used to move any unmixed solid component to the bottom of the blender to produce
the greatest yield of material. The lid was placed on top of the blender, and the blender
was turned on maximum speed for another two minutes.
5.8.3 Application of FRP onto Concrete Surface
The nano-inorganic composite was poured into a square plastic container. One
piece of the basalt fiber was placed nearby the container containing the nano-inorganic
composite on a plastic sheet. A foam brush was dipped into the nano-inorganic
composite, and the nano-inorganic composite was brushed onto the basalt fiber in the

60
direction parallel to the longitudinal axis of the basalt fibers until the color of the basalt
fiber would not be visible through the layer of nano-inorganic composite. Figure 31
illustrates brushing the nano-inorganic composite onto the basalt fiber.
Figure 31: Brushing nano-inorganic composite onto basalt fiber
The piece of basalt fiber was then flipped over, and the process of applying the
nano-inorganic composite was repeated. However, after the nano-inorganic composite
was applied to the second side of the basalt fiber, a plastic roller with ridges was used to
remove any excess nano-inorganic composite that may have been present. The piece of
basalt fiber was flipped to its initial side where the nano-inorganic composite was applied
with the foam brush and as with the second side, the use of the plastic roller was required.
The beam was positioned on its side such that the flanges were vertical and the web was
horizontal. The nano-inorganic composite was applied to the area of shear reinforcement
along the beam. This area included parts the web, bottom of the top flange and top of the
bottom flange that were within six inches from each end. Afterwards, the basalt fiber was
placed on top of this designated area and downward pressure was applied by hand to

61
minimize the space between the concrete surface and basalt fiber. This is shown in Figure
32.
Figure 32: Applying slight downward pressure on basalt fiber
The foam brush was further used to apply additional nano-inorganic composite to
the top surface of the basalt fiber, and a roller was used to remove any excess nano-
inorganic composite. The process of applying the basalt fiber was repeated to the
opposite end of the beam. The other side of the beam had basalt fiber applied to its ends
after the nano-inorganic composite dried, which typically was assumed to be eight hours
or overnight to be conservative.

62
5.9 Decision on Shear Reinforcement Material
The question that arose was whether aluminum angles or the basalt fiber be used
as the shear reinforcement. The benefit of using aluminum angles was that epoxy and
aluminum was readily available, and it only took two days for the beams to be ready for
testing. There was a concern that the shear strength might not be great enough due to the
fact that the previously dried epoxy protruded out and prevented the aluminum angles
being flush with the corners at the web-flange connection. Whereas this would pose a
potential problem for the rigid aluminum angles, the relatively flexible basalt fiber would
not be significantly affected. The basalt fiber, would simply follow the contours of the
web and flange. The issue with the basalt fiber was that it required the nano-inorganic
composite. The nano-inorganic composite was produced by researchers at Rutgers
University and was not necessarily readily available, and the nano-inorganic composite
required a minimum of two weeks to completely set. Nevertheless, the basalt fiber was
chosen in favor to the aluminum angles. After applying the basalt fiber to eight of the
beams, six beams consisting of 13 mm steel fibers and two beams consisting of 6 mm
steel fibers, more material to produce the nano-inorganic composite was required. Due to
unforeseen delays in obtaining the required amount of material to produce the nano-
inorganic composite, it was decided that the aluminum angles should play the role as
shear reinforcement. The decision was reinforced with the fact that the type of shear
reinforcement would not have a significant effect on the results of the flexural tests
because the objective of the shear reinforcement was to ensure that the beams would fail
in flexure and not in shear.

63
5.10 Post-beam Fabrication Aluminum Angle Attachment
After it was evident that waiting for more material for the nano-inorganic
composite would result in substantial delay as discussed in Section 5.9, it was decided
that the remaining beams would have aluminum angles serving as their shear
reinforcement. The issue with attaching the aluminum angles at this stage was that the
epoxy used to attach the web and flanges together was dry, and protruding out of the
web-flange connections. At times, these protrusions prevented the rigid aluminum angles
to be flush with the corners of where the web and flange met. This created spaces
between the surface of the aluminum angle and the concrete. To compensate for this, the
amount of epoxy was increased in order to fill up these voids. Using a clean, wood or
metal spatula, epoxy was applied to the web in area bounded by 1 inch from the web and
6 inches from the end of the beam. This is depicted in Figure 33.
Figure 33: Applying epoxy to flange for aluminum angle attachment
This area was also the same size area as one leg of the aluminum angle. The metal
spatula was used to apply epoxy also onto the vertical leg of the aluminum angle. The
aluminum angle was then positioned such that the entire horizontal leg made contact with

64
the already-placed epoxy and the vertical leg made contact with the web of the beam.
After the aluminum angle was set on the desired location, slight pressure was applied by
hand towards the flange and web for 30 seconds to ensure the bond between the
aluminum angle and concrete was strong as possible, and the epoxy would be essentially
forced into any voids caused by the dry epoxy protrusions. Figure 34 shows how the
aluminum angle was held in place.
Figure 34: Holding the aluminum angle in place for 30 seconds
Due to the set time of the epoxy, aluminum angles were only attached to the
bottom half of the beam on a given day. It was not until the following day that the beam
was turned over, and four more aluminum angles were attached to the beam.
5.11 Application of FRP to Bottom of Tension Flange
In order to strengthen the bottom flange after cracking, basalt fiber was applied. A
sheet of basalt fiber had lines drawn on it with a black marker to represent rectangular
pieces with dimensions of 3 inches by 18 inches. The dimension of 3 inches was chosen
to ensure that the flexural strength was enhanced while simultaneously not too strong in
flexure such that a shear failure would be prevented. The dimension of 18 inches ensured

65
that the basalt fiber covered the entire length of the bottom flange. Once these lines
representing the dimensions were drawn, transparent scotch tape was placed on top of the
lines perpendicular to the longitudinal orientation of the basalt fibers. This was done to
prevent the fiber from fraying while cutting the basalt fiber with scissors. The batching,
mixing and application of the nano-inorganic composite followed the same procedure as
in Sections 5.8.2 and 5.8.3, respectively. Figure 35 illustrates how the roller was used to
remove excess nano-inorganic composite from the basalt fiber.
Figure 35: Roller removing excess nano-inorganic composite from basalt fiber
The beam was positioned such that the bottom flange was facing up and parallel
with the surface of the table. The nano-inorganic composite was applied in an area 3
inches in width and ½ inch from each side of the flange since the 3-inch wide basalt fiber
fabric was to be placed in the middle of the bottom flange as depicted in Figure 36.

66
Figure 36: Aligning basalt fiber in the middle of the bottom flange
Afterwards, the basalt fiber was placed on top of this designated area and
downward pressure was applied by hand to minimize the space between the concrete
surface and basalt fiber. The foam brush was further used to apply additional nano-
inorganic composite to the top surface of the basalt fiber, and a roller was used to remove
any excess nano-inorganic composite.
6. Testing
6.1 Compression Test
After undergoing 28 days of moist curing, the cylinders were removed from the
curing room. Three cylinders of each mix type were tested to obtain the compressive
strength. The equipment used was a Forney compression machine. The cylinder had steel
caps placed on each of its ends, and the cylinder was placed directly onto the testing
platform in the compression cage as see in Figure 37.

67
Figure 37: Concrete cylinder in compression machine cage
The plate providing the compression force was lowered onto the top of the
cylinder until the plate was barely touching the cylinder yet at the same time holding the
cylinder in place via compression. At this point, the load reading was zeroed out. The
compression machine was set on ‘Metered Advance’ and the load rate was controlled by
hand using a dial situated on the machine. The load rate generally was between 200 lb/sec
and 400 lb/sec. The test was concluded until the ultimate load was reached and the
cylinder broke.

68
6.2 Elastic Modulus Test
6.2.1 Overview
After undergoing 28 days of moist curing, the cylinders were removed from the
curing room. The cylinders were to be tested to obtain the elastic modulus in
compression. An elastic modulus cage was used to measure the axial deformation. An
issue arose with the elastic modulus cage in which the spring connecting the top and
bottom yokes was too loose, and would prevent the top yoke from being parallel to the
bottom yoke. There was a delay in testing as it took time for the manufacturer of the
elastic modulus cage to send a new spring. By the time the spring arrived and was fitted
onto the elastic modulus cage, another issue arose. Due a prior commitment, the
researcher in charge of testing was to be away for a period of time. Although the some of
the earlier-cast cylinders could have been tested on Day 35 instead of Day 28, the later-
cast cylinders would could not have been tested having a similar age since the researcher
would not be present to test the cylinders. Therefore, it was decided that the elastic
modulus testing should commence after the researcher returned such that all the cylinders
would be tested with the same age. Even though the age of the cylinders on the day of
testing was 70 days rather than 28 days, it was assumed that since the rate of increase of
the compressive strength of concrete typically slows down dramatically after 28 days, the
older age of the cylinders would not have much effect in the compressive elastic
modulus.
6.2.2 Placement of Elastic Modulus Cage onto Cylinder
Unlike the previous compressive tests where the metal caps were placed on both
ends of the cylinder, the size of the elastic modulus cage prevented the metal caps from

69
fitting onto the cylinder. Instead of metal caps, both ends of the cylinder being tested
were dipped into liquid sulfur. With sulfur caps in place, the elastic modulus cage was
able fit onto the cylinder. The total height of the elastic modulus cage was 6 ½ inches and
the cylinders were 8 inches in height. Being that the optimal position for elastic modulus
cage was to be as symmetric to the cylinder as possible, the bottom yoke of the elastic
modulus cage was placed on a two separate pieces of medium density fiberboard with a
thickness of ¾ inch. Figure 38 illustrates the elastic modulus cage resting on the two
separate pieces of medium density fiberboard during attachment.
Figure 38: Attachment of elastic modulus cage
This allowed for the bottom yoke to be level during attachment to the cylinder,
and for the cylinder to be placed symmetrically along the longitudinal axis of the cylinder
by having ¾ inch of clear space between the yokes and ends of the cylinder. The screws
on the bottom yoke were attached first, and they were turned such that they would reach

70
the surface of the cylinder simultaneously to prevent eccentricity. The attachment of the
middle yoke followed, as did the top yoke. While attaching all three yokes, it was
important that the pin holding up one side of the top yoke remained completely vertical
and the axial deformation pin was centered on the pin’s required platform. It was made
sure that the screws were symmetric in how far they were turned so that the cross section
of the cylinder was concentric with that of the yokes. Once all the screws were secured
and the elastic modulus cage was in optimal position, the braces holding the yokes
together were removed.
6.2.3 Elastic Modulus Test Procedure
Using a Forney compression machine, the cylinder with the elastic modulus cage
was placed directly onto the testing platform in the compression cage. The machine was
turned on, and the plate providing the compressive force was lowered onto the top of the
cylinder until the plate was barely touching the cylinder yet at the same time holding the
cylinder in place through compression. At this point, the deformation measuring device
on the elastic modulus cage and the load cell on the compression machine were zeroed
out. The compression machine was set on ‘Metered Advance’ and the load rate was
controlled by hand using a dial situated on the machine. Though the setup of the
compression machine prevented the load rate from being constant, the load rate was
typically 200 lb/sec. It should be noted that the load rate was below the range of that
specified in ASTM C469 due to the fact that the researcher needed to control the load rate
dial manually and record simultaneously, so a lower load rate allowed enough time for
the researcher to observe when the load cell reached a 1000 pound interval and record
what the axial deformations were. The axial deformation measurements were recorded at

71
every 1000 pounds until 40% of the cylinder’s ultimate load was reached as per ASTM
C469 Specifications.
Figure 39: Cylinder in compression cage with elastic modulus cage
Despite the fact that the cylinders used for elastic modulus testing were not used
for compressive strength tests, the ultimate load of the cylinders were assumed to be the
same as cylinders of the same mix tested previously. This was done in order to estimate
when the load was to about to exceed the elastic limit. If anything, the assumed elastic

72
limit at 28 days was more conservative, as a 70-day old cylinder would require a greater
load to exceed the elastic limit. Once the cylinder was tested to 40% of its assumed
ultimate load, it was removed from the compression machine and placed on a nearby
table. The elastic modulus cage was removed from and refitted on the cylinder to be
tested again. This procedure was repeated one more time until the elastic modulus
readings were recorded twice as per ASTM C469 Specifications.
6.3 Flexural Test
6.3.1 Beam Preparation
A black marker was used to draw lines along the outer surface and thickness of
the top and bottom flange. Lines were drawn across the width of the beams at a distance
of 1 inch from the beam’s ends, and this line was continued onto the side of the flanges.
This line was made to assist in proper placement of the beam on the point supports, and
to ensure there was a 1 inch overhang towards each end. Lines were also drawn across
the width of the beams at a distance of 7 inches from the beam’s ends, and this line was
continued onto the side of the flanges. This line was made to ensure the two point loads
would be symmetric placed onto the beam.
6.3.2 Test Setup
The beam was situated on two point supports. The apices of the two point
supports were 16 inches from each other to provide one inch overhang to prevent
slipping. The simply supported system, as seen in Figure 40, was made of ¼ inch thick
steel plate with dimensions of 6 inches by 22 long inches, and two ⅛ inch thick steel
angles with dimensions of 2 inches by 2 inches. The angles were cut to a length of 5
inches to allow enough room for the width of the 4 inch wide beam. Two point loads

73
consisted of two ¼ inch thick rods three inches in length. The point loads were separated
4 inches apart from one another.
Figure 40: Simply supported system with two point supports
6.3.3 First Group Test Procedure
The beam was placed on the point supports such that the lines on the bottom
flange one inch from each end coincided with the apices of the point supports. Next, the
point loads were aligned with the lines on the top flange seven inches from each end.
Because the point supports were five inches wide compared to the four inch width of the
beam, the beam was centered in the middle of the point support. Due to the fact that the
width of the beam was larger than the lengths of the rods acting as the point loads, the
beam was also positioned such that the center of the width of the point loads coincided
with the longitudinal axis of the beam. This is illustrated in Figure 41.

74
Figure 41: Positioning of beam onto point supports
This was to ensure the load acting on the beam was not eccentric. Once in
position, the fine adjustment knob on the MTS machine was used to lower the point load
onto the beam until the point loads were barely touching the top flange and the measured
load was 10 to 15 pounds. Even though the load was not zeroed out prior to testing, the
10 to 15 pound offset was deemed to have negligible effect since the failure load was
predicted to be two order of magnitudes larger than the load offset and the load offset was
kept consistent with all beam specimens. The deflection reading was zeroed out, and the
MTS flexure machine automatically applied the load, while recording the load and
deflection. The beam was tested beyond failure until it was evident that the load was
relatively constant while the deflection continued to increase.
6.3.4 First Group Flexural Test Observations
After the testing the two beams of the first group, one beam with aluminum
angles for shear reinforcement and one beam without shear reinforcement, it was

75
concluded that the epoxy was strong enough to serve its purpose since it was evident that
no delamination had taken place. The beam without shear reinforcement failed in shear,
whereas the beam with shear reinforcement failed in flexure as seen in Figure 42.
Figure 42: First Group after failure
It was decided that the remaining beams would require shear reinforcement since
the objective of the project is to study the flexural strength rather than the shear strength.
6.3.5 Second Group Test Procedure
The second group was tested using the same procedure as the first group
described in Section 6.3.3. The second group was tested in flexure in strength with only
shear reinforcement to determine the ultimate flexural strength of the beams.
6.3.6 Third Group Test Procedure
The third group was tested using the same procedure as the first and second
group, except the test to beginning of cracking was stopped until it was visually evident
that cracking began, and the beams were removed from the MTS flexural machine and

76
placed in a secure temporary storage location. Figure 43 shows how much a crack would
typically propagate before stopping the first phase of testing.
Figure 43: Extent of cracking for first phase of testing
Basalt fiber was attached to the bottom of the tensile flange as described in
Section 5.10. After two weeks of the nano-inorganic composite curing, the beams were
tested to failure using the same procedure as discussed in Section 6.3.3.
When the sixth beam (first beam in the 6 mm steel fibers sub-group) was tested in
flexure, both flexural cracks and shear cracks were present. Not sure at the time whether
the occurrence of shear cracks was due to the beam’s properties or the flexural strength
with the addition of the basalt fiber on the bottom flange was too great, it was decided
that two more beams would be tested to see if shear cracks develop. If this was case, the
basalt fiber on the bottom flange would have had to be reduced. Two beams (both beams
in the 13 mm steel fibers sub-group) were tested, and they both developed flexural cracks
and shear cracks. One such beam is depicted in Figure 44.

77
Figure 44: Shear and flexural cracks present in beam during testing
It was concluded since the issue occurred with beams of a different sub-group that
shear cracks developed due to the increase of flexural strength. It should be noted that the
beams with the first five beams tested in the third group (30 mm steel fibers and 50 mm
steel fibers) alone had no issue with shear cracking. A possible reason for this is that the
flexural strength of these beams were less than that of the beam of the other sub-groups.
It was advised to reduce the width of the basalt fiber along the bottom of the tensile
flange for the remaining beams. The basalt fiber was reduced to 2 inches in order to
lower the flexural strength while simultaneously providing enough basalt fiber to see an
increase in flexural strength.
Since the width of the remaining beams’ basalt fiber was to be reduced to 2
inches, a strip ½ inch in width was removed from each side. A tape measure and black
marker was used to indicate ½ inch from both sides of the FRP. A sharp-bladed knife was
used to cut through the dried nano-inorganic composite and basalt fiber along the lines

78
made by the black marker. The ½ inch strips were lifted up with the knife on one end and
pulled off by hand. After having the width of the basalt fiber reduced, the remaining
beams were tested to failure using the procedure described in Section 6.3.3. Figure 45
and Figure 46 show cutting the basalt fiber with a knife and removing the strip of basalt
fiber, respectively.
Figure 45: Using a knife to cut the basalt fiber on bottom flange

79
Figure 46: Removing a strip of basalt fiber
7. Tension Test & Three-Dimensional Mold Attempts
7.1 Tension Test
7.1.1 First Method for Tension Samples
In order to determine the tensile strength and tensile elastic modulus of the
concrete, plate samples were to be made to be tested in tension. The elastic modulus was
to be determined by recording the strain via strain gage directly attached onto the
concrete. The first method’s proposed design was a concrete specimen with dimensions 2
inches by 8 inches and a thickness of ⅜ inch. The molds and casting for the tension
samples followed the same procedure as described in Sections 2 and 4.1, respectively.
After 28 days of moist curing, the tension samples were removed from the curing room.
It was then realized that the distance between the grips of the tension machine was
greater than the length of the tension samples.

80
7.1.2 Second Method for Tension Samples (with wooden grips)
The next proposed method of performing the tension samples was to use 4 inches
by 18 inches plate samples with a thickness of ⅜ inch. The focus on using this size of a
plate sample to test in tension was that a set of intermediate grips needed to be
constructed as seen in Figure 47.
Figure 47: Intermediate grip made out of wood
There were two reasons why a set of intermediate grips needed to be constructed.
The first reason was to prevent contact and potential slipping of the concrete with metal
grips of the machine. The second reason was to provide a means of fitting a 4 inch wide
plate sample to fit on the tension machine’s 2-inch wide grips. Therefore, a proposed
design required one end of the intermediate grips to be 4 inches in width to match the
width of the plate sample, and the width of the intermediate grips would have a width to
match the width of the metal grips present on the tension machine. Wood was chosen as
the material for the intermediate grips because it had a relatively low cost, was readily
available, and was easy to cut. The challenge that came with choosing wood as the
material to fabricate the intermediate grips was that it was difficult to get perfectly

81
straight lines required for the grips. Figure 48 illustrates the design of the intermediate
grips.
Figure 48: Design of wooden intermediate grips
7.1.3 Third Method for Tension Samples
Due to the fact that the wooden grips were able to be correctly fabricated, the idea
was proposed to design a concrete sample such that that maximum width would
completely fit the machine’s metal grips, yet have a narrowed cross section in the middle
so that the failure would be guaranteed to take place in the middle of the specimen, away
from the grips. Figure 49 displays the design of the plate mold for the third method
tension samples.

82
Figure 49: Design of tension samples for third method
The mold fabrication and placement of concrete of the tension samples followed
the same procedure as described in Sections 2 and 4.1, except for two changes in the
mold fabrication. The mold was constructed such that the interior dimensions were 2
inches by 24 inches. Furthermore, two 8-inch pieces of hardwood strips with a cross
section of ¼ inch by ¼ inch were glued together and attached along the interior perimeter
of the middle third of the side piece with duct tape. The molds for the tension samples
can be seen in Figure 50.

83
Figure 50: Molds for tension samples in third method
This was done on the other side piece as well so that the concrete sample would
narrow in the middle third. Once the concrete samples spent 28 days of moist curing in
the curing room, the concrete samples were taken out and let to dry. A strain gage was
attached in to the middle of the tension sample. The strain gage was attached to the
middle third such that the both the center and longitudinal axis of the strain gage
coincided with the center and longitudinal axis of the tensile specimen. A small amount
of 200 Catalyst-C was applied onto the location where the strain gage was to be situated.

84
After 30 seconds, the accompanying M-bond 200 Adhesive was placed in this location,
followed by the strain gage. After 3 minutes of constant downward pressure by hand onto
the strain gage, the sample was ready for testing. The concrete tensile sample was set in
the tensile machine. During the test, the failure occurred in the bottom third of the tension
sample, near the grips as see in Figure 51.
Figure 51: Failure occurred near grips for third method of tension test
This was not a desired outcome. It was discovered that the cross section of the
middle third of the specimen was in fact larger than the bottom and top thirds. Although
the width of the middle third was smaller than the remainder of the specimen, the
thickness happened to be too large and thus created a larger cross section than that of the
bottom and top thirds of the specimen. This could have resulted due to two possible
reasons. One possible reason is the width of the middle third of the tension specimen was
smaller than the length of the 50 mm steel hooked-end fibers that were placed. This
relatively small width could have could have caused the steel fibers to be stuck in
between the two sides of the mold, preventing concrete from consolidating entirely, and
causing the concrete to build up on top, exceeding the desired thickness. The second
possible reason is that because concrete in the middle third was level to ensure a
thickness of ½ inch rather than ⅜ inch. This was due to the two ¼ inch thick hardwood
strips being stacked on top of each other, resulting in a thickness of ½ inch. Since

85
consolidation during concrete placement was aided by using a steel trowel, the width of
the middle third was too small to allow the steel trowel to level the concrete in the middle
third to a thickness of ⅜ inch, and the two ¼ inch pieces of hardwood strips dictated the
thickness of the middle third of the tension specimen. Furthermore, it was deemed that
the load cell of the tension machine was too high for the tension samples since the tension
sample failed around 500 to 600 pounds, whereas the tension machine had a capacity of
60,000 pounds. Figure 52 displays the analog load display of the tension machine.
Figure 52: Analog load display of tension machine
7.1.4 Fourth Method for Tension Sample (proposed, not implemented)
Based on the previous methods to perform a direct tensile test, the next method
followed closely to that of the first method. The tensile specimen would roughly be the
same size as that described in the first method of performing the tensile test. The
difference in this method was the machine used. Instead of the tension machine, the MTS
machine that normally was used for flexural tests would be utilized. Using the MTS

86
machine, the computer program Test Works would be able to record the instantaneous
load, deformation and plot this information on a graph. What was needed was a set of
tension grips that could be temporary installed on the MTS machine. Due to delay and
time constraint of obtaining the tension grips, it was decided to forgo this method. Out of
the methods attempted in this project to determine the tensile properties, both elastic
modulus and uniaxial strength, this method is recommended for future researchers to
pursue if documenting such characteristics of their concrete is desired.
7.2 Three Dimensional Mold and Beam
7.2.1 Background
An attempt was made to fabricate a concrete I-beam using a three-dimensional
mold. If this method were to be successfully implemented, it would forgo the step of
attaching the concrete plates together via epoxy. Wood was used to construct the three-
dimensional wood as it was relatively inexpensive and readily available. It was decided to
used 6 mm steel fibers premixed in the concrete. This was done to maintain the desired
random orientation of the steel fibers, which would have not been possible with the larger
steel fibers since they would have tended to align parallel to the longitudinal axis of the
beam within the ⅜ inch thick web.
7.2.2 Construction of Mold
The mold composed of three main parts: the bottom and edges of the bottom
flange, the web and interior surfaces of the top and bottom flanges, and the top and edges
of the top flange. These parts shall be named Section A, Section B, and Section C,
respectively. Section A was constructed using the same procedure as for the plate sample
molds described in Section 2, however, the plywood was 4-¾ inches wide and 18-¾

87
inches long, and the hardwood strips consisted of two pieces 18-¾ inches in length and
two pieces 4 inches in length. Section B consisted of three sub-sections that eventually
were attached to each other. Figure 53 shows the design of the three dimensional mold.
Figure 53: Left – Section A; Middle – Section B; Right – Section C
The first sub-section was made up two pieces of plywood with a width of 2-½
inches and four pieces of plywood with a width of 2-3/16 inches. All six pieces were of
18-¾ inches long. Each 2-½ inch wide piece were placed orthogonally between two 2-3/16
inch wide pieces and attached with brackets and screws. The second sub-section
composed of two pieces of wood that were attached to the ends of the beam along the
web. This sub-section was a piece of plywood measuring 4 inches in height and 2 inches
wide. A 4 inch long hardwood strip was attached to one end to fit inside the end of the
mold to ensure the ⅜ inch thickness was retained throughout the entire web. The second
sub-section was attached to the first sub-section via brackets and screws. The third sub-
section was made up of two hardwood strips measuring 18-¾ inches in length and two

88
hardwood strips measuring 4 inches in length. All four pieces were hammered on top of
the second sub-section similar to that of Section A. Section C composed of the same size
plywood as Section A.
7.2.3 Beam Casting
The plate mold for the bottom flange was placed on a vibrating table and WD-40
was sprayed into the interior surface of Section A, B and C. With the vibrating table
turned on, concrete was placed into the mold with a scoop and a 6 inch wide steel trowel
was used to smooth the top surface of the concrete. Section B was placed on top of
Section A such that the perimeters of both sections would coincide with one another.
Clamps were placed to hold Section A and Section B together. Due to the limited amount
of clamps, one clamp was used on each side of the bottom flange. The clamps were
positioned such that they were equidistant from both each other and the ends of the
beams to prevent eccentricity. Concrete was placed into the web and into the top flange
as seen in Figure 54.

89
Figure 54: Placing concrete in top flange and web
A 6 inch wide steel trowel was used to smooth the top surface of the concrete.
Section C was placed on top of Section B such that the perimeters of each section would
coincide with another. Clamps were placed to hold Section B and Section C together. As
stated before, due to the limited number of clamps, the clamps were positioned similar to
that of the clamps on the bottom flange. The casted beam was placed on top of a bucket
during dry curing since the clamps would have prevented the casted beam from curing on
a flat, level surface such as the floor or table. The beam spent 24 hours of dry curing in an
environmentally stable lab before being demolded.

90
7.2.4 Beam Demolding
The clamps at the top of the beam were removed as well as the top plank of wood.
A hammer and chisel were used to dislodge the ⅜ inch hardwood strips from the top of
the beam. It should be noted that the direction of the hammering of the chisel was parallel
to the local edge of the flange as to prevent damage to the concrete beam. The screws
attaching the ends of the web to the sides of the web were removed as were the wood
pieces covering the ends of the web via a ⅜ inch corded drill. This can be seen in Figure
55.
Figure 55: Removing screws and brackets from end of web
The drill was then used to remove the screws and brackets attaching the interior
flange wood pieces to the sides of the web. The chisel was positioned at one end of the
remaining wood pieces attached to the flange. The hammer forced the wood piece to
dislodge from in between the flange and web. This step was repeated to the other
remaining wood pieces attached to the flange and web. The order of which the wood
pieces were removed was from top to bottom. At this point of the demolding process, the

91
remaining part of the wooden mold was attached to the bottom and sides of the bottom
flange. This resembled the setup for concrete plate samples. The ⅜ inch hardwood strips
were removed using the same procedure as described in Section 4.2. The beam was
removed from the last piece of the wood and placed in the curing room for 28 days.
7.2.5 Comments
After spending 28 days in the curing room, observations were made to determine
whether the beam was in adequate condition to be tested and whether this method of
beam fabrication should be pursued in this project. Observations included: concrete
leaking during casting, web and flanges were not lined up and cross section was not
symmetric, cracks easily formed from misaligned flange and web. Figure 56 and Figure
57 show the misalignment that occurred with utilizing the three dimensional mold and the
cracks that occurred during dry curing in the mold, respectively.
Figure 56: Misaligned web with bottom flange

92
Figure 57: Cracks that occurred during dry curing
Evidently it was decided not to pursue this method. The underlying culprit was
the choice of material for the mold: wood. With wood as the main material for the three-
dimensional mold, it was hard to get mold perfectly shaped, and the concrete seemed to
stick to wood even if release lubricant was used.

93
CHAPTER 4: RESULTS
This chapter discusses the results of the experimental program conducted on
SIFCON plates. The test results include compression test results on fiber concrete and
hybrid fiber concrete specimens as well results from modulus of elasticity test on
concrete cylinders. However, most of the test results and discussions reported in this
chapter will focus on I-beam test results in flexure.
1. Compressive Strength Tests
Compressive tests were conducted on fiber concrete cylinders with variable fiber
content and fiber types. Table 1 shows the results of the compression tests of the various
fiber content combinations. The compressive strengths shown in the table are given in
pounds per square inch (psi). Three cylinders, labeled ‘A’, ‘B’ and ‘C’, of each fiber
content combination were cast and tested using a Forney Compression Machine available
in the Civil Laboratory at Rutgers University. The cylinders were tested at 28 days. The
average compressive strengths are tabulated in the last row in Table 1. The test results
show that the cylinders with hybrid fibers gave the highest compressive strength
compared to the cylinders with only one type of fibers. Those cylinders with hybrid fibers
including 6 mm brass-coated micro fibers and 30 mm hooked fibers give the highest
compressive strength followed by those cylinders with hybrid fibers 13 mm micro fibers
and 50 mm hooked steel fibers. The cylinders with only 13 mm brass coated micro
straight fibers and only 6 mm brass coated micro straight steel fibers have the lowest
compressive strengths. The cylinders with only 50 mm hooked steel fibers and only 30
mm hooked steel fibers have intermediate compressive strengths.

94
Table 1: Compressive Strength of Concrete Cylinders with Various Fibers
COMPRESSIVE STRENGTH (psi)
6 MM 13 MM 30 MM 50 MM 6 MM & 30
MM
13 MM & 50
MM
A 9,016 8,693 8,811 8,721 10,253 9,391
B 8,878 7,967 8,558 9,185 10,062 9,221
C 7,996 7,657 9,778 8,905 10,050 9,398
Average 8,630 8,106 8,685 8,953 10,121 9,337
Figure 1 shows the comparison of the average compressive strengths of each of
the different fiber content combinations based on three cylinders tested after 28 days.
This bar graph provides a visual representation of the average compressive strengths. As
with Table 1, the compressive strengths have units in pounds per square inch (psi). The
concrete with 6 mm micro fibers and 30 mm hooked steel fibers has the highest
compressive strength, whereas the concrete with 13 mm steel fibers has the lowest
compresive strength. From the highest strength to the lowest strength, the fiber
combinations are as follows: 6 mm & 30 mm steel fibers, 13 mm & 50 mm steel fibers,
50 mm steel fibers, 30 mm steel fibers, 6 mm steel fibers and 13 mm steel fibers.
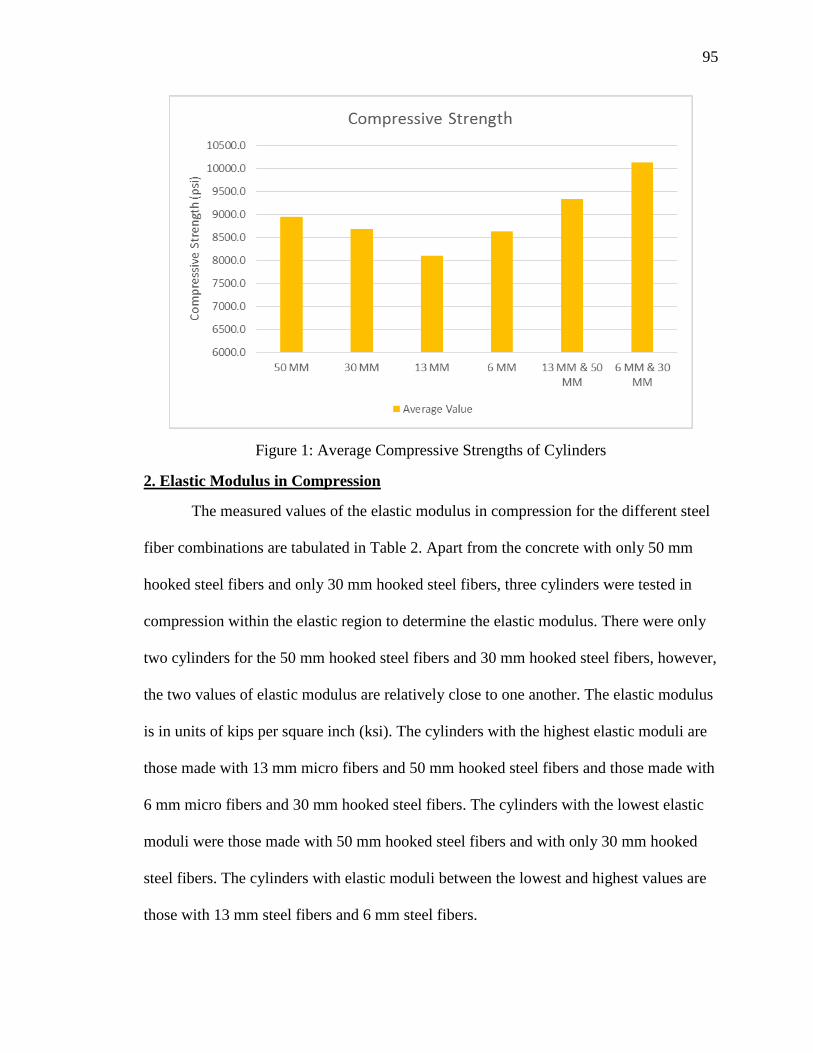
95
Figure 1: Average Compressive Strengths of Cylinders
2. Elastic Modulus in Compression
The measured values of the elastic modulus in compression for the different steel
fiber combinations are tabulated in Table 2. Apart from the concrete with only 50 mm
hooked steel fibers and only 30 mm hooked steel fibers, three cylinders were tested in
compression within the elastic region to determine the elastic modulus. There were only
two cylinders for the 50 mm hooked steel fibers and 30 mm hooked steel fibers, however,
the two values of elastic modulus are relatively close to one another. The elastic modulus
is in units of kips per square inch (ksi). The cylinders with the highest elastic moduli are
those made with 13 mm micro fibers and 50 mm hooked steel fibers and those made with
6 mm micro fibers and 30 mm hooked steel fibers. The cylinders with the lowest elastic
moduli were those made with 50 mm hooked steel fibers and with only 30 mm hooked
steel fibers. The cylinders with elastic moduli between the lowest and highest values are
those with 13 mm steel fibers and 6 mm steel fibers.

96
Table 2: Compressive Elastic Modulus of Concrete Cylinders with Various Fibers
COMPRESSIVE ELASTIC MODULUS (ksi)
6 MM 13 MM 30 MM 50 MM 6 MM & 30
MM
13 MM & 50
MM
A 4,442 4,674 4,252 4,237 4,428 4,735
B 4,244 4,374 4,461 4,276 4,547 4,584
C 4,827 4,298 x x 4,681 4,341
Average 4,504 4,449 4,357 4,256 4,552 4,553
Figure 2 shows the comparison of the average compressive elastic modulus of
multiple cylinders for each of the different fiber content combinations tested after 70
days. This bar graph provides a visual representation of the average compressive elastic
moduli. As with Table 2, the compressive strengths have units in ksi. The concrete with
13 mm mircro/50 mm hooked steel fibers has the highest elastic modulus, whereas the
concrete with 50 mm steel fibers has the lowest modulus. From the highest elastic
modulus to the lowest elastic modulus, the fiber combinations are as follows: 13 mm &
50 mm steel fibers, 6 mm & 30 mm steel fibers, 6 mm steel fibers, 13 mm steel fibers, 30
mm steel fibers and 50 mm steel fibers.

97
Figure 2: Average Elastic Moduli of Cylinders in Compression
3. Flexural Behavior
Although three beams were tested for each sub-group with exception of the 50
mm hooked fiber sub-group, one beam was used to represent its corresponding sub-group
to compare its load-deformation curve with that of another beam sub-group. Only one
beam was chosen to represent its corresponding sub-group in to reduce congestions in the
graphs. The load-deformation curves are divided into three groups to highlight three
different attributes: beams that were tested to ultimate load without external basalt fiber
flexural reinforcement, beams that were tested to first crack load, and beams that were
tested to ultimate load with external basalt fiber flexural reinforcement after having been
cracked. Due to the fact that the concrete plates of the different beams were cast at
different times of the study, it was a common occurrence that the beams did not have the
same age at the time of testing. In order to compare the beams of different fiber
combination, it shall be assumed that the strength and elastic modulus of the various

98
concrete mixes does not change substantially after 28 days. To reinforce this assumption,
the compressive elastic moduli and compressive strengths test results indicate that these
two mechanical properties generally do not vary greatly among the various concrete
mixes. The load-deformation curves of different beams are compared with one another.
Data such as ultimate load, midspan deformation at the ultimate load, elastic limit,
midspan deformation at the elastic limit, bending stiffness, accumulative area under the
curve, area of the elastic region, area under the load-deformation curve between the
elastic limit and ultimate load and post-ultimate region area are taken into consideration
when drawing comparisons.
3.1 Failure of Beams without External Basalt Fiber Flexural Reinforcement
The beams series represented in this section are 6MM-0323-AL2, 13MM-0317-
FRP3, 6&30MM-0401-AL1, 13&50MM-0318-AL1, 30MM-1029-AL1 and 50MM-
1015-AL1. All beams did not have any external basalt fiber flexural reinforcement, and
were tested to failure. Figure 3 shows these beams at end of testing. The age of the beam
with 6 mm fibers, 13 mm fibers, 6 mm & 30 mm fibers, 13 mm & 50 mm fibers, 30 mm
fibers, and 50 mm fibers were 105 days, 118 days, 96 days, 117 days, 258 days and 272
days, respectively. The following graphs illustrate load-deformation curves generated by
the flexure tests. Each graph depicts test results from either two or three beams for
comparison.

99
(a)
(b)

100
(c)
(d)
(e)

101
(f)
Figure 3: Beams Tested to Failure without External Flexural Reinforcement (a) 6MM-
0323-AL2; (b) 13MM-0317-FRP3; (c) 6&30MM-0401-AL1; (d) 13&50MM-0318-AL1;
(e) 30MM-1029-AL1; (f) 50MM-1015-AL1
The load-deformation curves in Figure 4 are of two beams with different fiber
types and one beam with both fiber types that are present in the other two beams. Beam
6&30MM-0401-AL1 has the highest ultimate load and 6MM-0323-AL2 has the lowest
ultimate load. The midspan deformation at the ultimate load of beam series 6&30MM-
0401-AL1 is the highest, whereas the non-hybrid beams’ midspan deformations at the
ultimate load are relatively close to one another. The load at the elastic limit and the
midspan deflection at the elastic limit follows the same trend among the three beams of
the same series. The same trend is also observed for the ultimate load and midspan
deformation at the ultimate load. The hybrid beam has the highest bending stiffness, and
the beam with 6MM-0323-AL2 has the lowest bending stiffness. Beams 6MM-0323-AL2
and 30MM-1029-AL1 show a dip in load right after the elastic limit which is not as
evident for 6&30MM-0401-AL1. Around the ultimate, the graph of 6MM-0323-AL2
resembles a parabola, where 30MM-1029-AL1 and 6&30MM-0401-AL1 resemble more

102
of a point. Before gradually leveling out, all three graphs’ post-ultimate slopes are similar
to their respective slopes prior the elastic limit. Beam 30MM-1029-AL1 shows a relative
sharp decrease in load after the graph’s peak which is not present in the other beams.
Beam 6&30MM-0401-AL1 and 30MM-1029-AL1 level off longer than 6MM-0323-
AL2, and maintain a similar load and maximum deformation, though 6&30MM-0401-
AL1’s maximum deformation is larger.
Figure 4: Load-Deformation Curves of Beams with 6 mm, 30 mm and 6 mm & 30 mm
Steel Fibers
The load-deformation curves Figure 5 are of two beams with different fiber types
and one beam with both fiber types that are present in the other two beams. Beam
50MM-1015-AL1 has the highest ultimate load, 13MM-0317-FRP3 has the lowest
ultimate load, and 13&50MM-0318-AL1 has an ultimate load between the highest and
lowest value. The midspan deformation at the ultimate load of 13&50MM-0318-AL1 is
the greatest, whereas the midspan deformation at the ultimate load of 50MM-1015-AL1
is the least. Beam 50MM-1015-AL1 has the greatest elastic limit and 13MM-0317-FRP3

103
has the lowest elastic limit. The midspan deformation at the elastic limit of 13&50MM-
0318-AL1 is the greatest, whereas the midspan deformation at the elastic limit of 50MM-
1015-AL1 is the least. Beam 50MM-1015-AL1 has the highest bending stiffness, and
13&50MM-0318-AL1 has the smallest bending stiffness. All three graphs exhibit a
decrease in load just after the elastic limit. After the peak in the graph, 50MM-1015-AL1
decreases at a rate similar to the slope before the elastic limit, whereas the post-ultimate
slope of the other two beams are more gradual compared to their respective slopes in the
elastic region. Beam 13&50MM-0318-AL1 experienced greatest deformation change
between the elastic limit and ultimate load, whereas 50MM-1015-AL1 experienced the
least deformation change between the elastic limit and ultimate load. During the last
phase of the testing, 13&50MM-0318-AL1 supported the greatest load and deformation,
whereas 13MM-0317-FRP3 supported the least load and deformation.
Figure 5: Load-Deformation Curves of Beams with 13 mm, 50 mm and 13 mm & 50 mm
Steel Fibers

104
Figure 6 depicts load-deformation curves of two beams with straight steel fibers.
The ultimate load and midspan deformation at the ultimate load of 6MM-0323-AL2 are
slightly larger than those of 13MM-0317-FRP3. Beam 6MM-0323-AL2 has a slightly
greater elastic limit and corresponding midspan deformation than 13MM-0317-FRP3.
Beam 13MM-0317-FRP3 has a greater bending stiffness than 6MM-0323-AL2. Both
graphs have a defined decrease in load after the elastic limit, though this is more
pronounced with 6MM-0323-AL2. The graph for 6MM-0323-AL2 forms a parabolic
shape, and this is not as evident in 13MM-0317-FRP3. After the ultimate load, the slope
of the graph for 6MM-0323-AL2 resembles the slope in its elastic region, whereas the
post-ultimate slope of the graph for 13MM-0317-FRP3 is more gradual than its
corresponding slope in the elastic region. Both graphs maintain a similar load towards the
end of the testing, though 13MM-0317-FRP3 reaches a larger deformation in this stage.
Figure 6: Load-Deformation Curves of Beams with Straight Steel Fibers

105
Figure 7 depicts load-deformation curves of two beams with hooked end steel
fibers. The ultimate is larger for 50MM-1015-AL1 than 30MM-1029-AL1. However, the
midspan deformation at the ultimate load is slightly larger for 30MM-1029-AL1 than
50MM-1015-AL1. Beam 50MM-1015-AL1 has a greater elastic limit and slightly larger
corresponding midspan deformation than 30MM-1029-AL1. Beam 50MM-1015-AL1 has
a greater bending stiffness than 30MM-1029-AL1. There is a small dip in load right after
the elastic limit for both beams. Although both ultimate loads are at a part of the graph
where a point forms, there is a small load plateau after the ultimate is reached for 50MM-
1015-AL1. The post-ultimate slope of 50MM-1015-AL1 is similar to the slope in the
elastic region, whereas the post-ultimate slope is more gradual than slope in the elastic
region for 30MM-1029-AL1. Towards the end of testing, both beams supported a similar
load, yet 30MM-1029-AL1 experienced a greater deformation.
Figure 7: Load-Deformation Curves of Beams with Hooked End Steel Fibers

106
Figure 8 depicts load-deformation curves of two beams with hybrid or multiple
fiber types. The ultimate load is substantially larger for 6&30MM-0401-AL1 than
13&50MM-0318-AL1. The midspan deflection at the ultimate load is larger for
13&50MM-0318-AL1 than 6&30MM-0401-AL1. Beam 6&30MM-0401-AL1 has a
greater elastic limit and bending stiffness, yet a smaller corresponding midspan
deformation than 13&50MM-0318-AL1. Around the ultimate load, the graph for
6&30MM-0401-AL1 forms a sharp peak, whereas 13&50MM-0318-AL1’s graph
resembles a parabola. Beam 13&50MM-0318-AL1shows a distinctive decrease in load
after elastic limit is reached. The post-ultimate slope is similar to the slope prior to the
elastic limit for 6&30MM-0401-AL1, whereas the post-ultimate slope for 13&50MM-
0318-AL1 is more gradual. Both beams support similar loads towards the end of testing,
though 13&50MM-0318-AL1 deforms much more.
Figure 8: Load-Deformation Curves of Beams with Hybrid Steel Fibers

107
Load-deformation curves for 6MM-0323-AL2, 50MM-1015-AL1 and
13&50MM-0318-AL1 are shown in Figure 9. Beam 50MM-1015-AL1 has the highest
ultimate load, whereas 6MM-0323-AL2 has the lowest ultimate load. Beam 13&50MM-
0318-AL1 has the largest midspan deformation at the ultimate load, while beam 50MM-
1015-AL1 has the smallest midspan deformation at the ultimate load. Beam 50MM-1015-
AL1 has the highest elastic limit, yet the smallest corresponding midspan deformation.
Beam 6MM-0323-AL2 has the lowest elastic limit, yet a corresponding midspan
deformation that is relatively close to that of 13&50MM-0318-AL1. Beam 50MM-1015-
AL1 has the highest bending stiffness, whereas the bending stiffness of the other two
beams are relatively close to one another. Beam 6MM-0323-AL2 and 13&50MM-0318-
AL1 have a well-defined decrease in load after the elastic limit, and the graphs resemble
a parabola around the peak, unlike 50MM-1015-AL1. The width of the curve is smallest
for 50MM-1015-AL1 and greatest for 13&50MM-0318-AL1. The post- ultimate slope is
similar to the slope in the elastic region for 6MM-0323-AL2 and 50MM-1015-AL1,
whereas the post-ultimate slope of 13&50MM-0318-AL1 is more gradual than the slope
in the elastic region. At the last phase of testing, 13&50MM-0318-AL1 supports the
greatest load and experiences the greatest deformation, whereas 6MM-0323-AL2
supports the least load and deformation at this phase.

108
Figure 9: Load-Deformation Curves of Beams with 6 mm, 50 mm and 13 mm & 50 mm
Steel Fibers
Load-deformation curves for 30MM-1029-AL1, 13MM-0317-FRP3 and
13&50MM-0318-AL1 are shown in Figure 10. Beam 30MM-1029-AL1 has the highest
ultimate load, whereas 13MM-0317-FRP3 has the lowest ultimate load. Beam
13&50MM-0318-AL1 has the largest midspan deformation at the ultimate load, and
13MM-0317-FRP3 has the smallest midspan deformation at the ultimate load. Beam
30MM-1029-AL1 has the highest elastic limit and beam 13MM-0317-FRP3 has the
lowest elastic limit. At the elastic limit, 13&50MM-0318-AL1 has the largest
corresponding midspan deformation, whereas 13MM-0317-FRP3 has the lowest
corresponding midspan deformation. Beam 30MM-1029-AL1 has the highest bending
stiffness, and beam 13&50MM-0318-AL1 has the lowest bending stiffness. Beam
13&50MM-0318-AL1 has a well-defined decrease in load after elastic limit. The graphs
for 30MM-1029-AL1 and 13MM-0317-FRP3 form a sharp peak around the ultimate
load, whereas the graph follows a parabolic shape for 13&50MM-0318-AL1 around the

109
ultimate load. The post-ultimate slopes for all three beams are less than their
corresponding slopes in the elastic region. The width of the curve is largest for is largest
for 13&50MM-0318-AL1. When the graphs leveled out towards the end of testing,
13&50MM-0318-AL1 experienced the greatest deformation and was able to support the
greatest load at this deformation, whereas 13MM-0317-FRP3 experienced the least
deformation and supported the least load at the corresponding deformation.
Figure 10: Load-Deformation Curves of Beams with 13 mm, 30 mm and 13 mm & 50
mm Steel Fibers
Load-deformation curves for 6&30MM-0401-AL1, 13MM-0317-FRP3 and
50MM-1015-AL1 are shown in Figure 11. Beam 6&30MM-0401-AL1 has the highest
ultimate load, whereas 13MM-0317-FRP3 has the lowest ultimate load. Beam 6&30MM-
0401-AL1 has the largest midspan deformation at the ultimate load, and 50MM-1015-
AL1 has the smallest midspan deformation at the ultimate load. Beam 6&30MM-0401-
AL1 has the highest elastic limit and corresponding midspan deformation, whereas
13MM-0317-FRP3 has the lowest elastic limit and corresponding midspan deformation.

110
Beam 50MM-1015-AL1 has the highest bending stiffness, whereas 13MM-0317-FRP3
has the lowest bending stiffness. Not all graphs exhibit a significant decrease in load after
the elastic limit. Although not all graphs have a sharp peak at the ultimate load, neither
graph forms a perfect parabola. The post-ultimate slope of 13MM-0317-FRP3 is more
gradual than the slope in the elastic region, whereas the post-ultimate slopes of 50MM-
1015-AL1 and 6&30MM-0401-AL1 resemble the slopes of the elastic region before
leveling out. Beam 6&30MM-0401-AL1 maintains the greatest load and deformation
towards the end of testing, whereas 13MM-0317-FRP3 maintains the least load and
deformation at this stage.
Figure 11: Load-Deformation Curves of Beams with 13 mm, 50 mm and 6 mm& 30 mm
Steel Fibers
Table 3 shows a summary of the mechanical properties obtained from the flexural
tests for all the beams tested without external flexural reinforcement. The first column
tabulates the ultimate load of each beam. The beams that have the greatest ultimate load
to the least strength in terms of fiber combinations are as follows: 6 mm & 30 mm steel

111
fibers, 50 mm steel fibers, 30 mm steel fibers, 13 mm & 50 mm steel fibers, 6 mm steel
fibers and 13 mm steel fibers. The second column tabulates the midpan deformation or
deflection at the ultimate load of each beam. At the ultimate load, the beams that have the
greatest deflection load to the least deflection in terms of fiber combinations are as
follows: 13 mm & 50 mm steel fibers, 6 mm & 30 mm steel fibers, 6 mm steel fibers, 30
mm steel fibers, 50 mm steel fibers and 13 mm steel fibers. The third column tabulates
the elastic limit of each beam. The beams that have the greatest elastic limit to the least
elastic limit in terms of fiber combinations are as follows: 6 mm & 30 mm steel fibers, 50
mm steel fibers, 6 mm steel fibers, 13 mm steel fibers, 13 mm & 50 mm steel fibers, and
30 mm steel fibers. The fourth column tabulates what is the midpan deformation or
deflection at the elastic limit of each beam. At the elastic limit, the beams that have the
greatest deflection load to the least deflection in terms of fiber combinations are as
follows: 6 mm & 30 mm steel fibers, 6 mm steel fibers, 13 mm & 50 mm steel fibers, 50
mm steel fibers, 13 mm steel fibers and 30 mm steel fibers. The fifth column tabulates the
bending stiffness each beam. The beams that have the greatest bending stiffness to the
least bending stiffness in terms of fiber combinations are as follows: 50 mm steel fibers,
30 mm steel fibers, 6 mm & 30 mm steel fibers, 13 mm steel fibers, 13 mm & 50 mm
steel fibers and 6 mm steel fibers.
Table 3: Mechanical Properties Summary of Beams without External Flexural
Reinforcement
Specimen Ultimate
Load
(lb)
Deflection
at
Ultimate
(mm)
Elastic
Limit (lb)
Deflection at
Elastic
Limit
(mm)
Bending
Stiffness
(lb/mm)
6MM-0401-AL1 2,692.1 1.059 2,448.7 0.821 2,957.9
6MM-0323-AL2 1,854.6 1.102 1,718.6 0.836 2,060.3
6MM-0323-AL3 1,970.6 1.424 1,835.9 1.196 1,575.2
13MM-0317-FRP1 2,020.5 0.614 1,938.7 0.582 3,351.9
13MM-0317-FRP2 1,339.0 0.794 9,24.6 0.502 1,844.3

112
13MM-0317-FRP3 1,787.8 0.789 1,579.6 0.553 2,847.4
30MM-1029-AL1 2,607.6 0.921 2,007.7 0.638 3,161.7
30MM-1029-AL2 2,175.6 0.988 1,706.0 0.588 2,906.7
30MM-1029-AL3 3,078.5 1.254 1,953.3 0.674 2,907.6
50MM-1015-AL1 2,771.5 0.775 2,592.3 0.676 3,811.9
50MM-1015-AL2 2,247.9 1.232 1,356.4 0.577 2,341.4
50MM-1015-AL3 2,984.0 0.898 2,775.9 0.737 3,899.4
6&30MM-0401-AL1 3,183.1 1.077 2,924.6 0.908 3,302.8
6&30MM-0323-AL2 3,737.0 1.53 3,176.0 1.185 2,743.7
6&30MM-0323-AL2 1,996.8 1.088 1,793.7 0.835 2,229.0
13&50MM-0318-AL1 2,072.8 1.521 1,987.3 0.944 2,167.2
13&50MM-0318-AL2 2,060.8 1.351 1,447.6 0.693 2,061.3
13&50MM-0318-AL3 2,583.5 1.084 1,783.1 0.664 2,675.8
Table 4 lists the areas of various regions as well as the accumulative areas of the
load-deformation curves obtained from the flexural tests for all the beams tested without
external flexural reinforcement. The first column tabulates the area of the elastic region
of each beam. In the elastic region, the beams that have the greatest area to the least area
in terms of fiber combinations are as follows: 6 mm & 30 mm steel fibers, 6 mm steel
fibers, 50 mm steel fibers, 13 mm & 50 mm steel fibers, 30 mm steel fibers and 13 mm
steel fibers. The second column tabulates the area under the load-deformation curve
between the elastic limit and ultimate load of each beam. Between the elastic limit and
ultimate load, the beams that have the greatest area to the least area in terms of fiber
combinations are as follows: 13 mm & 50 mm steel fibers, 30 mm steel fibers, 6 mm &
30 mm steel fibers, 50 mm steel fibers, 6 mm steel fibers and 13 mm steel fibers. The
third column tabulates the post-ultimate area under the load-deformation curve of each
beam. The beams that have the greatest post-ulitmate area to the least post-ultimate area
in terms of fiber combinations are as follows: 13 mm & 50 mm steel fibers, 6 mm & 30
mm steel fibers, 50 mm steel fibers, 30 mm steel fibers, 13 mm steel fibers and 6 mm
steel fibers. The fourth column tabulates the accumulative area under the load-
deformation curve of each beam. The beams with the greatest accumulative area to the

113
least accumulative area in terms of fiber combinations are as follows: 13 mm & 50 mm
steel fibers, 6 mm & 30 mm steel fibers, 30 mm steel fibers, 50 mm steel fibers, 13 mm
steel fibers and 6 mm steel fibers.
Table 4: Area under Load-Deformation Curves of Beams without External Flexural
Reinforcement
Specimen Area of Elastic
Region (lb-mm)
Area between Elastic
Limit and Ultimate
Load (lb-mm)
Area of Post-
Ultimate Region
(lb-mm)
Accumulative
Area
(lb-mm)
6MM-0401-AL1 1,003.9 608.2 2,146.7 3,758.8
6MM-0323-AL2 714.4 463.8 1,711.9 2,890.1
6MM-0323-AL3 1,127.5 434.4 1,950.8 3,512.6
13MM-0317-FRP1 567.3 63.5 3,083.7 3,714.6
13MM-0317-FRP2 232.1 339.4 3,589.8 4,161.3
13MM-0317-FRP3 434.1 400.9 2,392.1 3,227.0
30MM-1029-AL1 647.1 643.8 4,121.2 5,412.2
30MM-1029-AL2 502.6 795.0 2,877.9 4,175.5
30MM-1029-AL3 660.4 1,510.5 2,921.8 5,092.7
50MM-1015-AL1 872.8 262.7 3,901.1 5,036.6
50MM-1015-AL2 390.6 1,239.0 3,660.1 5,289.7
50MM-1015-AL3 1,057.4 461.8 2,795.1 4,314.4
6&30MM-0401-AL1 1,358.6 521.7 5,160.9 7,041.1
6&30MM-0323-AL2 1,923.9 1,225.8 4,879.5 8,029.2
6&30MM-0323-AL2 774.0 485.6 6,454.4 7,713.9
13&50MM-0318-AL1 963.0 1,133.9 8,688.6 10,785.5
13&50MM-0318-AL2 496.1 1,177.5 4,829.8 6,503.4
13&50MM-0318-AL3 589.3 948.0 4,546.9 6,084.2
3.2 Beams Tested to First Crack vs. to Failure with External Flexural
Reinforcement
The beams represented in this section are 6MM-0323-FRP6, 13MM-0317-FRP4,
6&30MM-0323-AL4, 13&50MM-0318-AL6, 30MM-1124-AL6 and 50MM-1008-AL4.
The beams were first tested to the point when cracking started to take place, which in this
study is referred to as first crack. At the time of testing to first crack, the age of the beam
with 6 mm fibers, 13 mm fibers, 6 mm & 30 mm fibers, 13 mm & 50 mm fibers, 30 mm
fibers, and 50 mm fibers were 133 days, 139 days, 133 days, 138 days, 253 days and 300
days, respectively. These beams were then reinforced with basalt fiber and tested to

114
failure. At the time of testing to failure, the age of the beam with 6 mm fibers, 13 mm
fibers, 6 mm & 30 mm fibers, 13 mm & 50 mm fibers, 30 mm fibers, and 50 mm fibers
were 153 days, 159 days, 153 days, 158 days, 272 days and 319 days, respectively. It
should be noted that due to the fact that some previous beams failed in shear as opposed
to flexure, not all the beams had the same width of basalt fiber attached to the tension
flange at the time of testing. The basalt fiber attached to 13MM-0317-FRP5, 30MM-
1124-AL6 and 50MM-1008-AL4 had a width of 3 inches, whereas the basalt fiber
attached to 6MM-0323-FRP6, 6&30MM-0323-AL5 and 13&50MM-0318-AL4 had a
width of 2 ½ inches, 2 inches and 2 ½ inches, respectively. All of these six beams failed
in flexure, apart from 13MM-0317-FRP5, which failed in shear. Included in this section
are graphs used to illustrate load-deformation curves generated by the flexure tests. Each
graph depicts test results of one beam having been tested to first crack and to failure after
having been externally reinforced with basalt fiber.
(a)

115
(b)
Figure 12: 6MM-0323-FRP6 Tested to First Crack (a) Side view; (b) Bottom view
Figure 12 shows the extent of cracking of 6MM-0323-FRP6. The two load-
deformation curves represent the results of two tests of one beam composed of 6 mm
steel fibers in Figure 13. The rehabilitated beam has a greater bending stiffness, which is
denoted by the steeper slope. There is a decrease in load after the elastic limit when the
beam was not reinforced with basalt fiber, whereas this not evident when the beam was
reinforced with basalt fiber. Specifically, the bending stiffness of the beam while testing
just to the point of when cracking started is 2,729 lb/mm and the bending stiffness of the
beam after being reinforced with basalt fiber is 4,049 lb/mm. After reinforcing the beam
with basalt fiber, it is shown that the elastic limit is increased and occurs at a greater
midspan deformation than the elastic limit. The elastic limit for testing to first crack is
1,856 lb and occurred at a midspan deformation of 0.63 mm, whereas after being
reinforced with basalt fiber, the elastic limit is 3,387 lb and occurs at a midspan
deformation of 0.87 mm.

116
Figure 13: Load-Deformation Curves of Beam with 6 mm Steel Fibers Tested to First
Crack and to Failure with the Addition of External Flexural Reinforcement
(a)

117
(b)
Figure 14: 30MM-1124-AL6 Tested to First Crack (a) Side view; (b) Bottom view
Figure 14 shows the extent of cracking of 30MM-1124-AL6. The two load-
deformation curves represent the results of two tests of one beam composed of 30 mm
steel fibers in Figure 15. The rehabilitated beam has a greater bending stiffness, which is
denoted by the steeper slope. Neither graph exhibits a decrease in load after the elastic
limit. Specifically, the bending stiffness of the beam while testing just to the point of
when cracking started is 3,046 lb/mm and the bending stiffness of the beam after being
reinforced with basalt fiber is 3,667 lb/mm. With external flexural reinforcement, the
elastic limit increases and occurs at a larger midspan deformation. The elastic limit for
testing to first crack is 3,028 lb and occurred at a midspan deformation of 0.99 mm,
whereas after being reinforced with basalt fiber, the elastic limit is 4,227 lb, and occurs at
a midspan deformation of 1.31 mm.

118
Figure 15: Load-Deformation Curves of Beam with 30 mm Steel Fibers Tested to First
Crack and to Failure with the Addition of External Flexural Reinforcement
(a)

119
(b)
Figure 16: 6&30MM-0323-AL4 Tested to First Crack (a) Side view; (b) Bottom view
Figure 16 shows the extent of cracking of 6&30MM-0323-AL4. The two load-
deformation curves represent the results of two tests of one beam composed of 6 mm &
30 mm steel fibers in Figure 17. As can be seen in the graph, the bending stiffnesses of
both load-deformation curves are close to one another. Specifically, the bending stiffness
of the beam while testing just to the point of when cracking started is 4,190 lb/mm and
the bending stiffness of the beam after being reinforced with basalt fiber is 4,109 lb/mm.
After testing to first crack, it is shown that the elastic limit is lower, and occurs at a
smaller midspan deformation than the beam reinforced with basalt fiber. There is a
decrease in load after the elastic limit when the beam is tested to first crack, but because
the load does not increase afterwards, it is inconclusive as to whether the peak of this
curve corresponds to the elastic limit or ultimate load. The elastic limit for testing to first
crack is 2,700 lb and occurred at a midspan deformation of 0.66 mm, whereas after being
reinforced with basalt fiber, the elastic limit is 4,213 lb and occurs at a midspan
deformation of 1.13 mm.

120
Figure 17: Load-Deformation Curves of Beam with 6 mm & 30 mm Steel Fibers Tested
to First Crack and to Failure with the Addition of External Flexural Reinforcement
(a)

121
(b)
Figure 18: 13MM-0317-FRP4 Tested to First Crack (a) Side view; (b) Bottom view
Figure 18 shows the extent of cracking of 13MM-0317-FRP4. The two load-
deformation curves represent the results of two tests of one beam composed of 13 mm
steel fibers in Figure 19. The bending stiffnesses of both load-deformation curves are
close to one another. The bending stiffness of the beam while testing just to the point of
when cracking started is 2,558 lb/mm and the bending stiffness of the beam after being
reinforced with basalt fiber is 2,796 lb/mm. Neither graph shows a decrease in load after
the elastic limit. After testing to first crack, it is shown that the elastic limit is lower, and
occurs at a smaller midspan deformation than the elastic limit after being reinforced with
basalt fiber. The elastic limit for testing to first crack is 1,780 lb, and occurrs at a midspan
deformation of 0.71 mm, whereas after being reinforced with basalt fiber, the elastic limit
is 2,811 lb, and occurs at a midspan deformation of 1.08 mm.

122
Figure 19: Load-Deformation Curves of Beam with 13 mm Steel Fibers Tested to First
Crack and to Failure with the Addition of External Flexural Reinforcement
(a)

123
(b)
Figure 20: 50MM-1008-AL4 Tested to First Crack (a) Side view; (b) Bottom view
Figure 20 shows the extent of cracking of 50MM-1008-AL4. The two load-
deformation curves represent the results of two tests of one beam composed of 50 mm
steel fibers in Figure 21. The rehabilitated beam has a greater bending stiffness, which is
denoted by the steeper slope. The bending stiffness of the beam while testing just to the
point of when cracking started is 3,489 lb/mm, and the bending stiffness of the beam after
being reinforced with basalt fiber is 4,534 lb/mm. After the elastic limit, there is a small
decrease in load when the beam is tested to first crack. This phenomenon is non-existent
once the beam is reinforced with basalt fiber on its tensile flange. The beam with external
flexural reinforcement has a greater elastic limit and correpsonding midspan deformation.
The elastic limit for testing to first crack is 1,837 lb, and occurrs at a midspan
deformation of 0.53 mm, whereas after being reinforced with basalt fiber, the elastic limit

124
is 3,193 lb, and occurs at a midspan deformation of 0.71 mm.
Figure 21: Load-Deformation Curves of Beam with 50 mm Steel Fibers Tested to First
Crack and to Failure with the Addition of External Flexural Reinforcement
(a)

125
(b)
Figure 22: 13&50MM-0318-AL6 Tested to First Crack (a) Side view; (b) Bottom view
Figure 22 shows the extent of cracking of 13&50MM-0318-AL6. The two load-
deformation curves represent the results of two tests of one beam composed of 13 mm &
50 mm steel fibers in Figure 23. The rehabilitated beam has a greater bending stiffness,
which is denoted by the steeper slope. Specifically, the bending stiffness of the beam
while testing just to the point of when cracking started is 2,267 lb/mm, and the bending
stiffness of the beam after being reinforced with basalt fiber is 2,800 lb/mm. After the
beam has been reinforced with basalt fiber, the elastic limit is increased, yet the
corresponding midspan deformation of both curves are similar. Furthermore, both curves
shows a decrease in load at similar deformations. The elastic limit for testing to first
crack is 1,914 lb and occurred at a midspan deformation of 0.83 mm, whereas after being
reinforced with basalt fiber, the elastic limit is 2,566 lb, and occurs at a midspan

126
deformation of 0.93 mm.
Figure 23: Load-Deformation Curves of Beam with 13 mm & 50 mm Steel Fibers Tested
to First Crack and to Failure with the Addition of External Flexural Reinforcement
3.3 Beams with External Flexural Reinforcement Tested to Failure
The beams represented in this section are 6MM-0323-FRP6, 13MM-0317-FRP5,
6&30MM-0323-AL5, 13&50MM-0318-AL4, 30MM-1124-AL6 and 50MM-1008-AL4.
After having been tested to first crack, all beams were externally reinforced with basalt
fiber and tested to failure. Figure 24 shows these beams at end of testing. The age of the
beam with 6 mm fibers, 13 mm fibers, 6 mm & 30 mm fibers, 13 mm & 50 mm fibers, 30
mm fibers, and 50 mm fibers were 153 days, 159 days, 153 days, 158 days, 272 days and
319 days, respectively. It should be noted that due to the fact that some previous beams
failed in shear as opposed to flexure, not all the beams had the same width of basalt fiber
attached to the tension flange at the time of testing. The basalt fiber attached to 13MM-
0317-FRP5, 30MM-1124-AL6 and 50MM-1008-AL4 had a width of 3 inches, whereas
the basalt fiber attached to 6MM-0323-FRP6, 6&30MM-0323-AL5 and 13&50MM-

127
0318-AL4 had a width of 2 ½ inches, 2 inches and 2 ½ inches, respectively. All of these
six beams failed in flexure, apart from 13MM-0317-FRP5, which failed in shear. The
following graphs illustrate load-deformation curves generated by the flexure tests. Each
graph depicts test results from either two or three beams for comparison.
(a)
(b)

128
(c)
(d)

129
(e)
(f)
Figure 24: Beams Tested to Failure with External Flexural Reinforcement (a) 6MM-
0323-FRP6; (b) 13MM-0317-FRP5; (c) 6&30MM-0323-AL5; (d) 13&50MM-0318-AL4;
(e) 30MM-1124-AL6; (f) 50MM-1008-AL4
The load-deformation curves in Figure 25 are of two beams with different fiber
types and one beam with both fiber types that are present in the other two beams. Beam
30MM-1124-AL6 has the highest ultimate load, and the other beams have similar
ultimate loads. The midspan deformation at the ultimate load of 30MM-1124-AL6 is the
greatest, whereas the midspan deformations at the ultimate load of 6MM-0323-FRP6 is
the least. The elastic limit and midspan deflection at the elastic limit follow the same
trend among the three beams as the ultimate load and midspan deformation at the
ultimate load. Beams 6MM-0323-FRP6 and 30MM-1124-AL6 have similar bending
stiffnesses, and 6&30MM-0323-AL5 has the lowest bending stiffness. In any of the three
graphs, there is no decrease in load after the elastic limit. All beams exhibit a parabolic
shape around ultimate load, and experience a sharp drop after the peak, though 30MM-
1124-AL6 seems to level out before continuing to drop. All beams have a smooth

130
leveling of load towards end of testing, and support similar loads at this stage. Beam
6&30MM-0323-AL5 deforms the greatest, whereas 6MM-0323-FRP6 deforms the least.
Figure 25: Load-Deformation Curves of Externally Reinforced Beams with 6 mm, 30
mm and 6 mm & 30 mm Steel Fibers
The load-deformation curves in Figure 26 are of two beams with different fiber
types and one beam with both fiber types that are present in the other two beams. Beam
50MM-1008-AL4 has the highest ultimate load and 13&50MM-0318-AL4 has the lowest
ultimate load. The midspan deformation at the ultimate load of 13MM-0317-FRP5 is the
greatest, whereas the midspan deformatione at the ultimate load of 50MM-1008-AL4 is
the least. Beam 50MM-1008-AL4 has the greatest elastic limit, whereas 13MM-0317-
FRP5 has the lowest elastic limit. Regarding the midspan deformation at the elastic limit,
13MM-0317-FRP5 has the largest deformation, whereas 50MM-1008-AL4 has the
smallest deformation. Beam 50MM-1008-AL4 has the highest bending stiffness, and
13MM-0317-FRP5 has the lowest bending stiffness. There is no decrease in load after
elastic limit in any of the graphs. All graphs tend to curve and plateau, but a perfect

131
parabola is not formed. However, 13MM-0317-FRP5 most resembles a parabola around
the ultimate load. Beams 13MM-0317-FRP5 and 13&50MM-0318-AL4 both experience
a sharp drop in load after the ultimate before leveling out. This also occurs with 50MM-
1008-AL4, but some load is resisted temporarily before continuing to drop. During the
last phase of testing, 13MM-0317-FRP5 and 50MM-1008-AL4 have almost identical
slopes, and support similar loads towards the end, yet 13MM-0317-FRP5 deforms the
most. At this stage, 13&50MM-0318-AL4 slopes at a rate similar to the other two beams,
but supports a smaller load and deforms the least.
Figure 26: Load-Deformation Curves of Externally Reinforced Beams with 13 mm, 50
mm and 13 mm & 50 mm Steel Fibers
Figure 27 depicts load-deformation curves of two beams with straight steel fibers.
The ultimate loads of both beams are close to one another, yet the midspan deformation
at the ultimate load is larger for 13MM-0317-FRP5 than 6MM-0323-FRP6. Beam 6MM-
0323-FRP6 has a greater elastic limit yet a smaller corresponding midspan deformation
than 13MM-0317-FRP5. Beam 6MM-0323-FRP6 has a greater bending stiffness than

132
13MM-0317-FRP5. In either graph, there is no significant decrease in load after the
elastic limit. Both beams form a line resembling a parabola around the ultimate load. The
width of 13MM-0317-FRP5’s graph is larger than that of 6MM-0323-FRP6. There is a
sharp decrease in both graphs, but 6MM-0323-FRP6 has a deeper drop than 13MM-
0317-FRP5. Both beams level out towards the end and support similar loads, though
13MM-0317-FRP5 deforms much more.
Figure 27: Load-Deformation Curves of Externally Reinforced Beams with Straight Steel
Fibers
Figure 28 depicts load-deformation curves of two beams with hooked end fibers.
The ultimate loads of both beams are close to one another, yet the midspan deformation
at the ultimate load is larger for 50MM-1008-AL4 than 30MM-1124-AL6. Beam 30MM-
1124-AL6 has a greater elastic limit and corresponding midspan deformation than
50MM-1008-AL4. Beam 50MM-1008-AL4 has a greater bending stiffness than 30MM-
1124-AL6. There is no significant drop in load after the elastic limit in either graph. The
graph for 30MM-1124-AL6 forms more a parabola, whereas the graph for 50MM-1008-

133
AL4 curves and flattens out around the ultimate load. Both beams experience a sharp
decrease in load, a phase of resisting some load, and a continuation of the sharp decrease
in load. Beam 30MM-1124-AL6 resists load longer than 50MM-1008-AL4 between the
two sharp drops. Both beams level off and support similar loads at the end of testing.
Beam 30MM-1124-AL6 deforms more than 50MM-1008-AL4, and 50MM-1008-AL4
begins its leveling off phase earlier than 30MM-1124-AL6.
Figure 28: Load-Deformation Curves of Externally Reinforced Beams with Hooked End
Steel Fibers
Figure 29 depicts load-deformation curves of two beams with hybrid or multiple
fiber types. Beam 6&30MM-0323-AL5 has a larger ultimate load, yet smaller
corresponding midspan deformation than 13&50MM-0318-AL4. Beam 6&30MM-0323-
AL5 has a greater elastic limit and corresponding midspan deformation than 13&50MM-
0318-AL4. Both beams have almost identical bending stiffnesses. There is no decrease in
load after the elastic limit in either graph. Both graphs are almost identical in size and
shape except for a few differences. Around the ultimate, 6&30MM-0323-AL5 forms a

134
parabola, whereas 13&50MM-0318-AL4 tends to flatten out more. Both beams have a
sharp decrease in load, yet 13&50MM-0318-AL4 resists some load before the graph
continues to drop. The slopes of both graphs during leveling off are similar as is the load
both beams support in this phase. Beam 6&30MM-0323-AL5 deforms more than
13&50MM-0318-AL4.
Figure 29: Load-Deformation Curves of Externally Reinforced Beams with Hybrid Steel
Fibers
Load-deformation curves for 6MM-0323-FRP6, 50MM-1008-AL4 and
13&50MM-0318-AL4 are shown in Figure 30. Beam 50MM-1008-AL4 has the highest
ultimate load, whereas 6MM-0323-FRP6 and 13&50MM-0318-AL4 have similar
ultimate loads. Beam 13&50MM-0318-AL4 has the largest midspan deformation at the
ultimate load, and 6MM-0323-FRP6 has the smallest midspan deformation at the ultimate
load. Beam 6MM-0323-FRP6 has the highest elastic limit, whereas 13&50MM-0318-
AL4 has the lowest elastic limit. At the elastic limit, 13&50MM-0318-AL4 has the
greatest midspan deformation and 50MM-1008-AL4 has the smallest midspan

135
deformation. Beams 6MM-0323-FRP6 and 50MM-1008-AL4 have similar bending
stiffnesses, whereas 13&50MM-0318-AL4 has the lowest bending stiffness. There is no
decrease in load after the elastic limit in either graph. At the peak, 6MM-0323-FRP6
forms a parabolic shape, 13&50MM-0318-AL4 flattens out, and 50MM-1008-AL4 seems
to does not really form a parabola or flatten out. All graphs have a sharp decrease in load
after the peak, though 13&50MM-0318-AL4 experiences the sharpest drop. During the
leveling off of the load, 50MM-1008-AL4 supports the greatest load and deforms the
most, whereas 6MM-0323-FRP6 supports the least load and deforms the least.
Figure 30: Load-Deformation Curves of Externally Reinforced Beams with 6 mm, 50
mm and 13 mm & 50 mm Steel Fibers
Load-deformation curves for 30MM-1124-AL6, 13MM-0317-FRP5 and
13&50MM-0318-AL4 are shown in Figure 31. Beam 30MM-1124-AL6 has the highest
ultimate load, whereas 13&50MM-0318-AL4 has an ultimate load slightly less than that
of 13MM-0317-FRP5. Beam 13MM-0317-FRP5 has the largest midspan deformation at
the ultimate load, and 30MM-1124-AL6 has the smallest midspan deformation at the

136
ultimate load. Beam 30MM-1124-AL6 has the highest elastic limit, whereas 13MM-
0317-FRP5 has the lowest elastic limit. Beam 13MM-0317-FRP5 has the largest midspan
deformation at the elastic limit, whereas 13&50MM-0318-AL4 has the smallest midspan
deformation at the elastic limit. Beam 30MM-1124-AL6 has the highest bending
stiffness, whereas 13MM-0317-FRP5 has the lowest bending stiffness. There is no
decrease in load after the elastic limit in either graph. Beam 13MM-0317-FRP5 and
30MM-1124-AL6 resemble a parabola around the ultimate load, whereas 13&50MM-
0318-AL4 flattens out more. All graphs experience a sharp decrease in load after the
ultimate load, though 30MM-1124-AL6 temporarily resists load before continuing to
decrease. Beams 13MM-0317-FRP5 and 30MM-1124-AL6 have almost identical slopes
while the load is leveling off. Beams 13MM-0317-FRP5 and 30MM-1124-AL6 support
similar loads towards the end of testing, and 13MM-0317-FRP5 experiences the greatest
deformation. Beam 13&50MM-0318-AL4 deforms the least and supports the least load
towards the end of testing.

137
Figure 31: Load-Deformation Curves of Externally Reinforced Beams with 13 mm, 30
mm and 13 mm & 50 mm Steel Fibers
Load-deformation curves for 6&30MM-0323-AL5, 13MM-0317-FRP5 and
50MM-1008-AL4 are shown in Figure 32. Beam 50MM-1008-AL4 has the highest
ultimate load, whereas 13MM-0317-FRP5 and 6&30MM-0323-AL5 have similar
ultimate loads. Beam 13MM-0317-FRP5 has the largest midspan deformation at the
ultimate load, and 6&30MM-0323-AL5 has the smallest midspan deformation at the
ultimate load. Beam 6&30MM-0323-AL5 has the highest elastic limit, whereas 13MM-
0317-FRP5 has the lowest elastic limit. At the elastic limit, 13MM-0317-FRP5 has the
largest midspan deformation and 50MM-1008-AL4 has the smallest midspan
deformation. Beam 50MM-1008-AL4 has the highest bending stiffness, whereas 13MM-
0317-FRP5 has the lowest bending stiffness. There is no decrease in load after the elastic
limit in any of the graphs. Beams 13MM-0317-FRP5 and 6&30MM-0323-AL5 form a
parabola around the ultimate load, whereas 50MM-1008-AL4 depicts a curve that flattens
out at the apex before rapidly decreasing. All graphs exhibit a rapid decrease in load after

138
the ultimate, though 50MM-1008-AL4 temporarily resists some load before the load
rapidly drops again. Beams 13MM-0317-FRP5 and 50MM-1008-AL4 have almost
identical slopes in the last phase of testing. All beams support similar loads in this phase.
Out of all three beams 13MM-0317-FRP5 deforms the most, and 50MM-1008-AL4
deforms the least.
Figure 32: Load-Deformation Curves of Externally Reinforced Beams with 13 mm, 50
mm and 6 mm & 30 mm Steel Fibers
Table 5 shows a summary of the mechanical properties obtained from the flexural
tests for all the beams tested with external flexural reinforcement. The first column
tabulates the ultimate load of each beam. The beams that have the greatest ultimate load
to the least strength in terms of fiber combinations are as follows: 30 mm steel fibers, 50
mm steel fibers, 6 mm & 30 mm steel fibers, 6 mm steel fibers, 13 mm steel fibers and 13
mm & 50 mm steel fibers. The second column tabulates the midpan deformation or
deflection at the ultimate load of each beam. At the ultimate load, the beams that have the
greatest deflection load to the least deflection in terms of fiber combinations are as

139
follows: 13 mm steel fibers, 30 mm steel fibers, 50 mm steel fibers, 13 mm & 50 mm
steel fibers, 6 mm steel fibers and 6 mm & 30 mm steel fibers. The third column tabulates
the elastic limit of each beam. The beams that have the greatest elastic limit to the least
elastic limit in terms of fiber combinations are as follows: 30 mm steel fibers, 6 mm & 30
mm steel fibers, 6 mm steel fibers, 13 mm steel fibers, 50 mm steel fibers and 13 mm &
50 mm steel fibers. The fourth column tabulates what is the midpan deformation or
deflection at the elastic limit of each beam. At the elastic limit, the beams that have the
greatest deflection load to the least deflection in terms of fiber combinations are as
follows: 30 mm steel fibers, 13 mm steel fibers, 6 mm & 30 mm steel fibers, 13 mm & 50
mm steel fibers, 6 mm steel fibers and 50 mm steel fibers. The fifth column tabulates the
bending stiffness each beam. The beams that have the greatest bending stiffness to the
least bending stiffness in terms of fiber combinations are as follows: 50 mm steel fibers, 6
mm steel fibers, 6 mm & 30 mm steel fibers, 30 mm steel fibers, 13 mm & 50 mm steel
fibers and 13 mm steel fibers.
Table 5: Mechanical Properties Summary of Beams with External Flexural
Reinforcement
Specimen Ultimate
Load
(lb)
Deflection
at
Ultimate
(mm)
Elastic
Limit (lb)
Deflection at
Elastic
Limit
(mm)
Bending
Stiffness
(lb/mm)
6MM-0323-AL4 4,666.9 2.624 3,366.5 0.957 3,703.3
6MM-0323-FRP5 3,523.9 1.503 3,030.3 0.919 3,350.7
6MM-0323-FRP6 3,741.8 1.234 3,387.2 0.865 4,049.2
13MM-0317-FRP4 3,934.1 2.413 2,811.1 1.083 2,796.2
13MM-0317-FRP5 3,814.1 2.308 3,158.2 1.377 2,398.2
13MM-0317-FRP6 3,747.2 2.958 2,827.0 1.001 2,939.3
30MM-1024-AL4 4,523.3 2.197 3,166.3 1.037 3,126.1
30MM-1024-AL5 5,410.8 2.125 4,707.5 1.564 3,063.3
30MM-1124-AL6 5,256.0 2.115 4,227.2 1.307 3,666.5
50MM-1008-AL4 5,196.6 2.15 3,192.9 0.711 4,539.9
50MM-1124-AL5 3,525.0 2.092 2,616.3 0.805 3,314.8
6&30MM-0323-AL4 4,466.6 1.388 4,213.2 1.134 4,108.5
6&30MM-0323-AL5 3,921.3 1.929 3,493.0 1.255 3,066.7
6&30MM-0401-AL6 3,830.7 1.51 3,275.4 0.971 3,433.6

140
13&50MM-0318-AL4 3,665.3 2.272 3,183.1 1.093 3,059.8
13&50MM-0318-AL5 3,553.2 1.828 2,896.9 0.967 3,055.9
13&50MM-0318-AL6 2,831.6 1.708 2,565.8 0.933 2,800.1
Table 6 lists the areas of various regions as well as the accumulative areas of the
load-deformation curves obtained from the flexural tests for all the beams tested with
external flexural reinforcement. The first column tabulates the area of the elastic region
of each beam. In the elastic region, the beams that have the greatest area to the least area
in terms of fiber combinations are as follows: 30 mm steel fibers, 6 mm & 30 mm steel
fibers, 13 mm steel fibers, 6 mm steel fibers, 13 mm & 50 mm steel fibers and 50 mm
steel fibers. The second column tabulates the area under the load-deformation curve
between the elastic limit and ultimate load of each beam. Between the elastic limit and
ultimate load, the beams that have the greatest area to the least area in terms of fiber
combinations are as follows: 50 mm steel fibers, 13 mm steel fibers, 30 mm steel fibers, 6
mm steel fibers, 13 mm & 50 mm steel fibers and 6 mm & 30 mm steel fibers. The third
column tabulates the post-ultimate area under the load-deformation curve of each beam.
The beams that have the greatest post-ulitmate area to the least post-ultimate area in
terms of fiber combinations are as follows: 13 mm steel fibers, 6 mm & 30 mm steel
fibers, 30 mm steel fibers, 13 mm & 50 mm steel fibers, 50 mm steel fibers and 6 mm
steel fibers. The fourth column tabulates the accumulative area under the load-
deformation curve of each beam. The beams with the greatest accumulative area to the
least accumulative area in terms of fiber combinations are as follows: 13 mm steel fibers,
30 mm steel fibers, 6 mm & 30 mm steel fibers, 50 mm steel fibers, 13 mm & 50 mm
steel fibers and 6 mm steel fibers.

141
Table 6: Area under Load-Deformation Curves of Beams with External Flexural
Reinforcement
Specimen Area of Elastic
Region (lb-mm)
Area between Elastic
Limit and Ultimate
Load (lb-mm)
Area of Post-
Ultimate Region
(lb-mm)
Accumulative
Area
(lb-mm)
6MM-0323-AL4 1,688.5 6,845.3 7,661.6 16,195.3
6MM-0323-FRP5 1,404.3 1,950.4 3,261.2 6,616.0
6MM-0323-FRP6 1,508.1 1,329.3 3,348.5 6,186.0
13MM-0317-FRP4 1,621.5 4,639.8 11,655.3 17,916.7
13MM-0317-FRP5 2,249.1 3,337.6 7,459.2 13,046.0
13MM-0317-FRP6 1,460.4 6,776.3 5,610.0 13,846.7
30MM-1024-AL4 1,676.0 4,663.9 7,099.6 13,439.4
30MM-1024-AL5 3,731.7 2,884.9 6,008.4 12,625.0
30MM-1124-AL6 3,013.2 3,891.6 8,289.2 15,194.0
50MM-1008-AL4 1,144.3 6,394.1 8,082.0 15,620.4
50MM-1124-AL5 1,072.3 4,182.8 2,551.5 7,806.5
6&30MM-0323-AL4 2,594.2 1,115.0 10,672.0 14,381.2
6&30MM-0323-AL5 2,353.5 2,542.1 5,875.6 10,771.2
6&30MM-0401-AL6 1,618.9 1,960.0 7,720.1 11,299.1
13&50MM-0318-AL4 1,814.3 4,149.5 3,442.3 9,406.1
13&50MM-0318-AL5 1,426.3 2,868.8 8,907.3 13,202.4
13&50MM-0318-AL6 1,219.0 2,101.9 4,252.3 7,573.2
3.4 Beams with and without External Flexural Reinforcement Tested to Failure
This section utilizes graphs of the load-deformation curves to illustrate the effect
of external flexural reinforcement. Each graph depicts test results of two beams tested to
failure with and without external flexural reinforcement. The beams represented in this
section are those found in Sections 3.1 and 3.3.
Two load-deformation curves for 6MM-0323-AL2 and 6MM-0323-FRP6 are
depicted in Figure 33. After being rehabilitated with basalt fiber, the ultimate load 6MM-
0323-FRP6 is larger than the ultimate load of 6MM-0323-AL2. The difference between
the midspan deformations at theultimate load of the two beams is less drastic than the
difference of the ultimate loads themselves. As with the ultimate load, the elastic limit
and the corresponding midspan deformation of 6MM-0323-FRP6 are larger than those of
6MM-0323-AL2. The bending stiffness of 6MM-0323-FRP6 is larger than the bending

142
stiffness of 6MM-0323-AL2. In contrast to 6MM-0323-AL2, there is a steep drop in the
load-deformation curve of 6MM-0323-FRP6 beyond the ultimate load. Beam 6MM-
0323-AL2 displays a decrease in load after the elastic limit. Around the ultimate load, a
parabola forms for each beam, though 6MM-0323-FRP6 has a sharper peak. Beam 6MM-
0323-FRP6 has a steep drop after the ultimate load, whereas the post-ultimate slope of
6MM-0323-AL2 similar to its slope in the elastic region. Towards the end of testing,
6MM-0323-FRP6 levels off more, has greater maximum deformation, and supports a
greater load than 6MM-0323-AL2.
Figure 33: Load-Deformation Curves of Beams with 6 mm Steel fibers with and without
External Reinforcement
Two load-deformation curves for 30MM-1029-AL1 and 30MM-1124-AL6 are
depicted in Figure 34. After being rehabilitated with basalt fiber, the ultimate load and
corresponding midspan deformation of 30MM-1124-AL6 is larger than those of 30MM-
1029-AL1. As with the ultimate load, the elastic limit and the midspan deformation at the
elastic limit of 30MM-1124-AL6 are larger than those of 30MM-1029-AL1. The bending

143
stiffness 30MM-1124-AL6 is larger than the bending stiffness of 30MM-1029-AL1.
Neither graph shows a decrease in load after the elastic limit. Around the ultimate load,
30MM-1029-AL1 exhibits a sharp peak, whereas 30MM-1124-AL6 is more reminiscent
to a parabola. The post-ultimate slope of 30MM-1029-AL1 is similar to its slope in the
elastic region, whereas 30MM-1124-AL6’s post-ultimate slope includes two sharp drops
in load. Both graphs level out towards the end, though 30MM-1124-AL6 supports a
greater load and deforms more than 30MM-1029-AL1.
Figure 34: Load-Deformation Curves of Beams with 30 mm Steel fibers with and without
External Reinforcement
Two load-deformation curves for 6&30MM-0401-AL1 and 6&30MM-0323-AL5
are depicted in Figure 35. After being rehabilitated with basalt fiber, the ultimate load of
6&30MM-0323-AL5 is greater than the ultimate load of 6&30MM-0401-AL1. The
midspan deformation at ultimate load of 6&30MM-0323-AL5 is larger than that of
6&30MM-0401-AL1. The elastic limit and corresponding midspan deformation of
6&30MM-0323-AL5 are larger than those of 6&30MM-0401-AL1. The bending stiffness

144
of both beams are similar to one another. In both curves, there is no decrease in load after
the elastic limit. Around the ultimate, 6&30MM-0401-AL1 has a relatively small
parabolic shape, whereas 6&30MM-0323-AL5 has a more pronounced parabolic shape.
The post-ultimate slope of 6&30MM-0401-AL1 is similar to its slope in the elastic
region, whereas there is a sharp decrease in load after the ultimate load for 6&30MM-
0323-AL5. During the leveling off of the load towards the end of testing, both beams
share similar slopes and support similar loads. Beam 6&30MM-0323-AL5 experiences
greater deformation than 6&30MM-0401-AL1.
Figure 35: Load-Deformation Curves of Beams with 6 mm & 30 mm Steel fibers with
and without External Reinforcement
Two load-deformation curves for 13MM-0317-FRP3 and 13MM-0317-FRP5 are
depicted in Figure 36. The ultimate load and corresponding midspan deformation of
13MM-0317-FRP5 are larger than those of 13MM-0317-FRP3. The elastic limit and
corresponding midspan deformation for 13MM-0317-FRP5 are larger than those of
13MM-0317-FRP3. The bending stiffness of 13MM-0317-FRP5 is less than the bending

145
stiffness of 13MM-0317-FRP3. There is a slight decrease in load after the elastic limit for
13MM-0317-FRP3, but this is not evident for 13MM-0317-FRP5. The graph for 13MM-
0317-FRP5 is reminiscent to a parabola around the ultimate load, whereas the graph for
13MM-0317-FRP3 curves up to a sharp peak before the load begins to drop. There is a
sharp drop in load for 13MM-0317-FRP5 after the ultimate. Beam 13MM-0317-FRP5
supports a greater load and deformation than 13MM-0317-FRP3 towards the end of
testing.
Figure 36: Load-Deformation Curves of Beams with 13 mm Steel fibers with and without
External Reinforcement
Two load-deformation curves for 50MM-1015-AL1 and 50MM-1008-AL4 are
depicted in Figure 37. Beam 50MM-1008-AL4 has a greater ultimate load and
corresponding midspan deformation than 50MM-1015-AL1. Beam 50MM-1008-AL4 has
a greater elastic limit, corresponding deformation and bending stiffness. Neither beam
shows a clear decrease in load after the elastic limit. Apart from the ultimate load,
50MM-1015-AL1 shows a relatively flat line at the peak, whereas 50MM-1008-AL4

146
gradually curves all the up to the peak. The post-ultimate slope of 50MM-1015-AL1 is
similar to the slope of its elastic region, whereas 50MM-1008-AL4 experiences a sharp
drop in load after the ultimate load. Both beams exhibit leveling off in the last phase of
testing, though 50MM-1008-AL4 supports a greater load and deforms more than 50MM-
1015-AL1.
Figure 37: Load-Deformation Curves of Beams with 50 mm Steel fibers with and without
External Reinforcement
Two load-deformation curves for 13&50MM-0318-AL1 and 13&50MM-0318-
AL4 are depicted in Figure 38. Beam 13&50MM-0318-AL4 has a greater ultimate load
and corresponding midspan deformation than 13&50MM-0318-AL1. The elastic limit
and its corresponding midspan deformation is greater for 13&50MM-0318-AL4. Beam
13&50MM-0318-AL4 has a greater bending stiffness than 13&50MM-0318-AL1. Beam
13&50MM-0318-AL1 exhibits a decrease in load after the elastic limit, which is not seen
in 13&50MM-0318-AL4. Although both graphs are not very smooth around the peak,
13&50MM-0318-AL1 forms somewhat closer a parabola, whereas 13&50MM-0318-

147
AL4 tends to flatten out more. There is a sharp drop with 13&50MM-0318-AL4 after the
ultimate load, whereas the post-ultimate slope of 13&50MM-0318-AL1 is much more
gradual. Beam 13&50MM-0318-AL1 experiences a longer period of leveling off than
13&50MM-0318-AL4, as well as supports a greater load and deforms more towards the
end of testing.
Figure 38: Load-Deformation Curves of Beams with 13 mm & 50 mm Steel fibers with
and without External Reinforcement
3.5 Flexural Behavior Summary
Table 7 shows the load at the elastic limit and ultimate load for all the beams
tested. Included are beams with and without external basalt fiber flexural reinforcement.
The fifth column in Table 7 shows the percentage of the ultimate load at which the elastic
load limit was observed in a given row. For the beams with 6 mm, 13 mm and 50 mm
steel fibers, the introduction of flexural reinforcement lowers the percentage of the
ultimate load which the elastic load limit was observed. The opposite is true for the
beams with 30 mm, 6 & 30 mm and 13 & 50 mm steel fibers. With the addition of

148
external flexural reinforcement, the maximum midspan deformation does increase for
some of the specimens. The specimens that experience an increase of maximum midspan
deformation due to the addition of external flexural reinforcement include beams with 6
mm, 13 mm, 30 mm and 6 & 30 mm steel fibers. The opposite is true for the beams with
50 mm mm and 13 & 50 mm steel fibers where the maximum deformation tends to
decrease with the addition of flexural reinforcement.
Table 7: Elastic Limit – Ultimate Load Ratio and Maximum Deformation
Specimen Flexural
Reinforcement
Elastic Limit
(lb)
Ultimate
Load (lb)
Elastic Limit:
Ultimate Load
Max δ
(mm)
6MM-0401-AL1 No 2,448.7 2,692.1 91.0 % 3.422
6MM-0323-AL2 No 1,718.6 1,854.6 92.7 % 3.419
6MM-0323-AL3 No 1,835.9 1,970.6 93.2 % 4.41
6MM-0323-AL4 Yes 3,366.5 4,666.9 72.1 % 7.928
6MM-0323-FRP5 Yes 3,030.3 3,523.9 86.0 % 3.996
6MM-0323-FRP6 Yes 3,387.2 3,741.8 90.5 % 4.405
13MM-0317-FRP1 No 1,938.7 2,020.5 96.0 % 4.361
13MM-0317-FRP2 No 924.6 1,339.0 69.1 % 6.896
13MM-0317-FRP3 No 1,579.6 1,787.8 88.4 % 4.334
13MM-0317-FRP4 Yes 2,811.1 3,934.1 71.5 % 13.48
13MM-0317-FRP5 Yes 3,158.2 3,814.1 82.8 % 8.857
13MM-0317-FRP6 Yes 2,827.0 3,747.2 75.4 % 7.679
30MM-1029-AL1 No 2,007.7 2,607.6 77.0 % 7.081
30MM-1029-AL2 No 1,706.0 2,175.6 78.4 % 6.929
30MM-1029-AL3 No 1,042.4 3,078.5 33.9 % 4.62
30MM-1024-AL4 Yes 3,166.3 4,523.3 70.0 % 9.245
30MM-1024-AL5 Yes 4,707.5 5,410.8 87.0 % 5.641
30MM-1124-AL6 Yes 4,227.2 5,256.0 80.4 % 7.43
50MM-1015-AL1 No 2,592.3 2,771.5 93.5 % 5.752
50MM-1015-AL2 No 1,356.4 2,247.9 60.3 % 8.249
50MM-1015-AL3 No 2,775.9 2,984.0 93.0 % 4.774
50MM-1008-AL4 Yes 3,192.9 5,196.6 61.4 % 7.413
50MM-1124-AL5 Yes 2,616.3 3,525.0 74.2 % 4.768
6&30MM-0401-AL1 No 2,924.6 3,183.1 91.9 % 6.818
6&30MM-0323-AL2 No 3,175.9 3,737.0 85.0 % 6.482
6&30MM-0323-AL3 No 1,793.7 1,996.8 89.8 % 12.666
6&30MM-0323-AL4 Yes 4,213.2 4,466.6 94.3 % 9.991
6&30MM-0323-AL5 Yes 3,493.0 3,921.3 89.1 % 8.463
6&30MM-0401-AL6 Yes 3,275.4 3,830.7 85.5 % 8.561
13&50MM-0318-AL1 No 1,987.3 2,072.8 95.9 % 14.492
13&50MM-0318-AL2 No 1,447.6 2,060.8 70.2 % 7.823
13&50MM-0318-AL3 No 1,783.1 2,583.5 69.0 % 6.089
13&50MM-0318-AL4 Yes 3,183.1 3,665.3 86.8 % 6.447
13&50MM-0318-AL5 Yes 2,896.9 3,553.2 81.5 % 12.447
13&50MM-0318-AL6 Yes 2,565.8 2,831.6 90.6 % 7.248

149
Table 8 depicts the average ultimate load values of beams of a certain fiber type
with and without external basalt fiber flexural reinforcement. With the addition of
external basalt flexural reinforcement, the beams experienced a greater ultimate load.
This increase in ultimate load is represented as a percent increase with respect to the
average ultimate load of the beams without flexural reinforcement. The ultimate load of
the beams increased from 45% to 73% with the addition of external flexural
reinforcement. The beams with 13 mm steel fibers experienced the smallest increase of
ultimate load, whereas the beams with 6 mm & 30 mm steel fibers experienced the
greatest increase of ultimate load.
Table 8: Effect of External Flexural Reinforcement on Ultimate Load
Fiber Combination Average Ultimate Load
without External
Flexural Reinforcement
(lb)
Average Ultimate Load
with External Flexural
Reinforcement (lb)
Percent Increase of
Ultimate Load Due to
Flexural
Reinforcement
6 MM 2,172.4 3,977.5 55%
13 MM 1,715.7 3,831.8 45%
30 MM 2,620.6 5,063.3 52%
50 MM 2,667.8 4,360.8 61%
6&30 MM 2,972.3 4,072.9 73%
13&50 MM 2,239.0 3,350.0 67%
Table 9 shows the average partial and accumulative areas under the load-
deformation curves of beams of a certain fiber type with and without external flexural
reinforcement. This area represents the fracture toughness or the fracture energy of the
beam. With the addition of external flexural reinforcement, the beams generally
experienced an increase of area under the load-deformation curve. The increase of the
area under the load-deformation curve of the elastic region, between the elastic limit and
ultimate load, after the ultimate load and accumulative area are represented as percent
increases. The fracture energy area of the elastic region of the beams increased from 62%

150
to 365% with the aid of external flexural reinforcement. The beams with 30 mm steel
fibers experienced the largest increase of area in the elastic region, whereas the beams
with 6 mm & 30 mm as well as 6 mm steel fibers experienced the smallest increase of
area in the elastic region. The area under the load-deformation curve between the elastic
limit and the ultimate load of the beams increased from 152% to 1,736% with the aid of
external flexural reinforcement. The beams with 13 mm steel fibers experienced the
largest increase of area in the elastic region, whereas the beams with 6 mm & 30 mm
steel fibers experienced the smallest increase of area in the elastic region. With the aid of
external flexural reinforcement, the beams with 13 mm steel fibers showed to have the
greatest increase in area of the post-ultimate region, which in this case was 173%.
Contrary to the other regions, the beams with 13 mm & 50 mm steel fibers experienced a
decrease of 8% area in the post-ultimate region. The accumulative area under the load-
deformation curve of the beams increased from 0% to 304% with the aid of external
flexural reinforcement. The beams with 13 mm steel fibers experienced the largest
increase of accumulative area under the load-deformation curve, whereas the beams with
6 mm & 30 mm steel fibers experienced the smallest increase of accumulative area under
the load-deformation curve.

151
Table 9: Effect of External Flexural Reinforcement on Area under Load-Deformation
Curve
Fiber Combination Average Area under
Curve without External
Flexural Reinforcement
(lb)
Average Area under
Curve with External
Flexural
Reinforcement (lb)
Percent Increase of
Ultimate Load Due to
Flexural
Reinforcement
ELASTIC REGION
6 MM 948.6 1,533.7 62%
13 MM 411.2 1,777.0 332%
30 MM 603.4 2,806.9 365%
50 MM 773.6 1,108.3 43%
6&30 MM 1,352.2 2,188.9 62%
13&50 MM 682.8 1,486.5 118%
BETWEEN ELASTIC LIMIT AND ULTIMATE LOAD
6 MM 502.1 3,375.0 572%
13 MM 267.9 4,917.9 1,736%
30 MM 983.1 3,813.5 288%
50 MM 654.5 5,288.4 708%
6&30 MM 744.4 1,872.4 152%
13&50 MM 1,086.5 3,040.1 180%
POST-ULTIMATE REGION
6 MM 1,936.5 4,757.1 146%
13 MM 3,021.9 8,241.5 173%
30 MM 3,307.0 7,132.4 116%
50 MM 3,452.1 5,316.8 54%
6&30 MM 5,498.2 8,089.3 47%
13&50 MM 6,021.7 5,534.0 -8%
ACCUMULATIVE
6 MM 3,387.2 9,665.8 185%
13 MM 3,701.0 14,936.4 304%
30 MM 4,893.4 13,752.8 181%
50 MM 4,880.2 11,713.5 140%
6&30 MM 12,150.5 12,150.5 0%
13&50 MM 7,791.0 10,060.6 29%

152
CHAPTER 5: DISCUSSION
1. Compression Tests
In the compression tests, two sets of concrete cylinders were tested to determine
the compressive strengths and the compressive elastic modulus of the various mixes. The
first set of cylinders that were tested to determine the compressive strengths had an age of
28 days. The second set of cylinders that were tested to determine the compressive elastic
moduli had an age of 70 days. Although the age of concrete for both sets differed from
one another, the cylinders within one set all had the same age. As this is the case, this
issue should have negligible effect on the results, since this study investigates the
difference of mechanical properties between mixes, and not the correlation between the
compressive strength and compressive elastic modulus. The only parameter in the
compression tests was the steel fiber combination present in each mix. When comparing
the mechanical properties of the specimens, the average value is taken into account, and
not the value of individual specimens.
The mixes with the greatest compressive strength to the mixes with the least
compressive strength are as follows: 6 mm and 30 mm steel fibers, 13 mm and 50 mm
steel fibers, 50 mm steel fibers, 30 mm steel fibers, 6 mm steel fibers and 13 mm steel
fibers. The difference between the greatest and least compressive strengths was 2,016 psi.
The various fiber combinations can be divided into three groups: straight steel fibers,
hooked end steel fibers and hybrid steel fibers. The hybrid steel fibers contains both
straight steel fibers and hooked end steel fibers. With these three groups in mind, it is
evident the concrete with hybrid steel fibers had the greatest compressive strengths, the
concrete with hooked end steel fibers had the intermediate compressive strengths and the
concrete with straight steel fibers had the least compressive strengths.

153
In regards to the three groups, the concrete with the hybrid fibers resulted in the
greatest compressive strengths due to the fact that voids created by the larger fibers were
filled with the small fibers. The amount of the steel fibers alone is not a factor in ranking
the compressive strengths in this study, otherwise the concrete with 5% volume of
hooked end steel fibers would have a greater compressive strength than the concrete with
3.8% volume of 6 mm and 30 mm steel fibers and the concrete with 2.8% volume of 13
mm and 50 mm steel fibers. The concrete with hooked end steel fibers had greater
compressive strengths than the concrete with straight steel fibers because the fiber
volumes of the hooked end steel fibers were greater than the fiber volumes of the straight
steel fibers. The concrete with hooked end steel fibers included 5% volume of 50 mm
steel fibers and 3% volume of 30 mm steel fibers, whereas the concrete with straight steel
fibers included 2% volume of 6 mm steel fibers and 1% volume of 13 mm steel fibers.
The fact that the hooked end steel fibers are larger in size than the straight steel fibers
might indicate that a greater fiber size increases the compressive strength, however, this
presumption loses validity when taking into account that the concrete with 6 mm and 30
mm steel fibers had a greater compressive strength than the concrete with 13 mm and 50
mm steel fibers, and the concrete with 6 mm steel fibers had a greater compressive
strength than the concrete with 13 mm steel fibers.
It is also noteworthy to examine the compressive strength ranking in each fiber
group. In the group with hybrid steel fibers, the concrete with 6 mm and 30 mm steel
fibers had a greater compressive strength than the concrete with 13 mm and 50 mm steel
fibers because the concrete with 6 mm and 13 mm steel fibers had a greater fiber volume.
The fiber volume of 6 mm and 30 mm steel fibers was 3.8%, whereas the fiber volume of

154
13 mm and 50 mm steel fibers was 2.8%. In the group with hooked end steel fibers, the
concrete with 50 mm steel fibers had a greater compressive strength than the concrete
with 30 mm steel fibers because the concrete with 50 mm steel fibers had a greater fiber
volume. The fiber volume of 50 mm steel fibers was 5%, whereas the fiber volume of 30
mm steel fibers was 3%. In the group with straight steel fibers, the concrete with 6 mm
steel fibers had a greater compressive strength than the concrete with 13 mm steel fibers
because the concrete with 6 mm steel fibers had a greater fiber volume. The fiber volume
of 6 mm steel fibers was 2%, whereas the fiber volume of 13 mm steel fibers was 1%.
The mixes with the greatest compressive elastic modulus to the mixes with the
least compressive elastic modulus are as follows: 13 mm and 50 mm steel fibers, 6 mm
and 30 mm steel fibers, 6 mm steel fibers, 13 mm steel fibers, 30 mm steel fibers and 50
mm steel fibers. The difference between the greatest and least compressive elastic moduli
was 297 ksi. The concrete with hybrid steel fibers had the greatest compressive elastic
moduli, the concrete with straight steel fibers had the intermediate compressive elastic
moduli and the concrete with hooked end steel fibers had the least compressive elastic
moduli.
In regards to the three groups, the amount of the steel fibers alone is not a factor
in ranking the compressive elastic moduli in this study. The increase either in size of steel
fibers or the fiber volume did not affect the compressive elastic modulus. This is indeed
true otherwise the concrete with a greater fiber volume and greater size such as those
present in the hooked end steel fiber group would have a greater compressive elastic
modulus than the straight steel fiber group. One similarity between the concrete with
hybrid steel fibers and the concrete with straight steel fibers alone is both contain fibers

155
that were mixed with the concrete prior to casting. In contrast, the hooked end steel fibers
were preplaced in the mold. By having the fibers mixed with the concrete, the fibers were
more likely to be more uniformly distributed throughout the concrete. After placing the
hooked end steel fibers into the molds, the fibers at times would move during vibration of
the concrete. In casting cylinders, it is possible that the amount of hooked end steel fibers
and concrete added were not perfectly proportionate to one another throughout the mold.
It is hypothesized that the hooked end steel fibers would be concentrated in some areas
and sparser in other areas of the molds. This would cause the hooked end steel fibers to
be less uniformly distributed than the straight steel fibers. The explanation as to why the
hybrid fibers resulted in greater elastic moduli than the straight steel fibers is due to the
fact that voids created by the larger fibers were filled with the small fibers.
To further enforce the reasoning on what affects and what does not affect the
compressive elastic modulus, each group should be closer examined. Although the
concrete with 13 mm and 50 mm steel fibers had a greater compressive elastic modulus
than the concrete with 6 mm and 30 mm steel fibers, both essentially had the same
compressive elastic modulus as their average values differed only by 1 ksi. Within the
group with straight steel fibers, the concrete with 6 mm steel fibers had a greater
compressive elastic modulus than the concrete with 13 mm steel fibers. A possible
reasoning behind this is that either a smaller size of fibers or a lower fiber volume within
the concrete attributes to a greater compressive elastic modulus. However, this reasoning
is invalid since neither trend is consistent within the group with hybrid steel fibers and
the group with hooked end steel fibers. The 13 mm and 50 mm steel fibers were larger in
size than the 6 mm and 30 mm steel fibers, and the concrete with 13 mm and 50 mm steel

156
fibers had a lower fiber volume compared to the concrete with 6 mm and 30 mm steel
fibers. Similarly to the group with straight steel fibers, the 30 mm steel fibers were
smaller in size than the 50 mm steel fibers, yet the concrete with 30 mm steel fibers had a
lower fiber volume than the concrete with 50 mm steel fibers. It may be hypothesized that
reasoning behind the ranking of compressive elastic modulus follows that of the three
groups of fibers. Neither the size of the fibers nor the fiber volume attributes to the
compressive elastic modulus, but rather the uniformity of the fibers.
With the results of the compressive strengths and compressive elastic moduli, it is
advisable to determine whether there is a relationship between the two mechanical
properties in this study. An observation made consulting the results is that the ranking of
the specimens according to compressive strength did not match the ranking of the
specimens according to compressive elastic modulus. This also occurred in Catagay et.
al’s (2010) study, and it was concluded that there is not much correlation between
compressive strength and compressive elastic modulus of steel-fiber reinforced concrete.
The same conclusion can be proposed with this study, otherwise the ranking of these two
mechanical properties would mirror one another.
2. Flexural Tests
In the flexural tests, two sets of concrete beams were tested to failure. The first set
of beams were tested without external flexural reinforcement on the tension flange. The
second set of beams were tested with external flexural reinforcement on the tension
flange. Unlike, the cylinders, the beams tested did not all have the same age. Nonetheless,
the effect of the age shall be discussed, in order to reinforce the aforementioned
assumption. Although the age of concrete for most of the beams differed from one

157
another, the age of the concrete should not have an effect on the mechanical properties of
the beams, as all beams were tested much later than 28 days, and theoretically the
strengths stayed relatively constant. Specifically, the youngest age of the beams was 96
days. Both sets of beams had the same parameters, yet as the second set of beams were
tested with external flexural reinforcement, the second set of beams had a few additional
parameters. The mutual parameters of both sets of beams were the age, fiber volume,
fiber size and shear reinforcement. The additional parameters of the beams with external
flexural reinforcement were the width of the external flexural reinforcement on the
tension flange and failure type, as some beams failed in shear due to an excessive flexural
capacity and as a result other beams had their external flexural reinforcement reduced.
When comparing the mechanical properties of the specimens, the average value is taken
into account, and not the value of individual specimens.
2.1 Beams without External Flexural Reinforcement
The mixes with the highest ultimate load to the mixes with the lowest ultimate
load are as follows: 6 mm and 30 mm steel fibers, 50 mm steel fibers, 30 mm steel fibers,
13 mm and 50 mm steel fibers, 6 mm steel fibers and 13 mm steel fibers. The difference
between the highest and lowest ultimate loads was 1,257 lb. The percent volume of fibers
had an effect on the ranking of the beams in regards to ultimate load. The ranking from
highest fiber volume to lowest fiber volume is almost identical with that of the ranking of
the ultimate load, with exception to the beams with 13 mm and 50 mm steel fibers.
Comparing the rankings of the beams of a certain fiber content helps illustrate the fact
that a greater fiber volume results in a beam experiencing a greater ultimate load. The
fiber size does not seem to have a visible effect on the ultimate load of the beams,

158
otherwise the beams with 13 mm and 50 mm steel fibers would have experienced a
greater ultimate load than the beams with 30 mm steel fibers.
As mentioned before, the age of the concrete plates that make up the beams do not
affect the ultimate load of the beams. Since concrete strength is known to increase with
time, it should have an effect on the ultimate load, however, if this was indeed the case
then the beams with 50 mm steel fibers would have had a greater ultimate load than the
beams with 6 mm and 30 mm steel fibers. If by any chance the age of the concrete does
have an effect on the ultimate load, then it is substantially overshadowed by effect of
fiber volume of the beams.
All except three beams had aluminum angles as shear reinforcement. The other
three beams had basalt fiber as shear reinforcement. Due to the fact that all three beams
of similar fiber type only had one type of shear reinforcement, there is no way to compare
the aluminum angles and basalt fibers within a group of beams with a certain fiber
content. Nevertheless, the only effect the shear reinforcement would have had on the
beams would be the shear strength of the beams, but since these beams failed in flexure,
the shear reinforcement does not affect the ultimate load in this case.
As for the other mechanical properties measured in this study such as the midspan
deformation at the ultimate load, the elastic limit, midspan deformation at the elastic limit
and the bending stiffness of the beams it remains inconclusive as to why the beams
performed differently to one another. Through comparing the ranking of the different
fiber combinations for these properties, there is no trend that can be seen that would
explain why some beams experienced a certain load and corresponding midspan
deformation compared to other beams.

159
2.2 Beams with External Flexural Reinforcement
The mixes with the highest ultimate load to the mixes with the lowest ultimate
load are as follows: 30 mm steel fibers, 50 mm steel fibers, 6 mm and 30 mm steel fibers,
6 mm steel fibers, 13 mm steel fibers and 13 mm and 50 mm steel fibers. The difference
between the highest and lowest ultimate load was 1,713 lb. The fiber volume had an
effect on the ranking of the beams in regards to ultimate load. The ranking from highest
fiber volume to lowest fiber volume is almost identical with that of the ranking of the
ultimate load, with exception to the beams with 13 mm and 50 mm steel fibers.
Comparing the rankings of the beams of a certain fiber content helps illustrate the fact
that a greater fiber volume results in a beam with a greater ultimate load. The fiber size
does not seem to have a visible effect on the ultimate load of the beams, otherwise the
beams with 13 mm and 50 mm steel fibers would have experienced a greater ultimate
load than the beams with 30 mm steel fibers. The beams with 50 mm steel fibers and 30
mm steel fibers experienced the greatest ultimate loads as their external flexural
reinforcement was 3 inches wide, whereas the width of the external flexural
reinforcement of the remaining beams was reduced to ensure a flexural failure. With this
in mind, comparing the beams with similar widths of external flexural reinforcement, the
ranking of the beams with the greatest to least ultimate loads is similar to the ranking of
the beams without external flexural reinforcement. Another factor that had a role in
possibly affecting the ranking of the beams in regards to ultimate load is how the beams
failed. Three beams with external flexural reinforcement failed in shear, as opposed to
flexure. These three beams included one beam with 6 mm steel fibers and two beams
with 13 mm steel fibers. These beams failed in shear as their 3-inch wide external

160
flexural reinforcement made them too strong in flexure, and thus they were subjugated to
a shear failure. When these beams are not considered as part of the average ultimate load
for the fiber type they belong to, there is little to no change in the ranking, and hence the
failure type has negligible effect on the ranking of the beams in terms of ultimate load in
this study.
As mentioned before, the age of the concrete plates that make up the beams do not
affect the ultimate load of the beams. Since concrete strength is known to increase with
time, it should have an effect on the ultimate load, however, if this was indeed the case
then the beams with 13 mm steel fibers would have had a greater ultimate load than the
beams with 6 mm steel fibers. If by any chance the age of the concrete does have an
effect on the ultimate load, then it is substantially overshadowed by effect of fiber
volume of the beams.
All except five beams had aluminum angles as shear reinforcement. The other
five beams had basalt fiber as shear reinforcement. Three of the beams with basalt fiber
as shear reinforcement composed of 13 mm steel fibers, and as state before, due to the
fact that all three beams of similar fiber type only had one type of shear reinforcement,
there is no way to compare the performance of aluminum angles and basalt fibers among
the beams with 13 mm steel fibers. However, three beams with 6 mm steel fibers
included two beams with basalt fiber as shear reinforcement and one beam with
aluminum angles as shear reinforcement. The one beam with aluminum angles had a
much different ultimate load than the other two beams, but it was not because of the shear
reinforcement, but rather that one beam failed in shear and had external flexural
reinforcement 3 inches in width. The other two beams had their external flexural

161
reinforcement reduced from 3 inches to ensure a flexural failure, and thus had a lower
ultimate load. Nevertheless, the only effect the shear reinforcement would have on the
beams would be the shear strength of the beams, but since the beams were to fail in
flexure, the shear reinforcement does not affect the ultimate load in this case.
As for the other mechanical properties measured in this study such as the midspan
deformation at the ultimate load, the elastic limit, midspan deformation at the elastic limit
and the bending stiffness of the beams it remains inconclusive as to why the beams
performed differently to one another. Through comparing the ranking of the different
fiber combinations for these properties, there is no trend that can be seen that would
explain why some beams experienced a certain load and corresponding midspan
deformation compared to other beams.
2.3 Load-deformation Curves of Beams with and without External Flexural
Reinforcement
The load-deformation curves of the beams without external flexural reinforcement
differed from those with external flexural reinforcement. Three main differences were
observed between the two types of graphs. First, the load-deformation curves of the
beams without external flexural reinforcement experienced a sudden drop in load after
the elastic limit was reached, and then the curve continued to rise until the ultimate load
was reached. The load-deformation curves of the beams with external flexural
reinforcement showed no drop in load immediately after the elastic limit. In a stress-
strain curve, the sudden drop after the elastic limit would correspond to the upper and
lower yield points, and comparing the different curves in regards to this phenomenon is
similar to comparing mild steel with aluminum. It is proposed that the basalt fiber on the

162
tension flange adds ductility to the beam, as materials with more ductility, such as
aluminum, continuously transition into the plastic region as opposed to mild steel, which
experiences upper and lower yield points. Secondly, the curves differed in shape and
slope around the ultimate load. For the beams without external flexural reinforcement,
whose load-deformation curves formed a relatively sharp apex around the ultimate load,
the addition of external flexural reinforcement caused the load-deformation curves to
form a parabola around the ultimate load. Similarly, for the beams without external
flexural reinforcement, whose load-deformation curves formed a parabola around the
ultimate load, the addition of external flexural reinforcement caused the load-deformation
curves to flatten around the ultimate load. In both instances, the slope of the load-
deformation curves around the ultimate load decreases with external flexural
reinforcement. What occurred when the slope decreased before and after the ultimate
load was that the beams were deforming more at a smaller load increment compared to
the beams without external flexural reinforcement. This phenomenon leads to the
conclusion that the basalt fiber increases the ductility of the beams. Lastly, the slope of
the curves differed from one another after the ultimate load was reached. Beams that did
not have external flexural reinforcement had load-deformation curves whose post-
ultimate slope mimicked the slope of the load-deformation curve in the elastic region. In
contrast, the post-ultimate slope of the load-deformation curves of beams with external
flexural reinforcement were relatively large as the curves showed a sharp drop sometime
after the ultimate load was reached. The sharp drop in load coincided with the failure of
the basalt fibers on the tension flange of the beam, and as soon as the basalt fibers failed,
the beams were no longer able to resist load. This shows that the post-ultimate behavior

163
of the beams rely heavily on the external flexural reinforcement, as the sharp decrease in
load does not occur until the sole failure of the basalt fiber.
2.4 Effect of External Flexural Reinforcement
The external flexural reinforcement increased the average ultimate load of the
beams from 45% to 73%. The beams ranked from greatest to least percent increase in
ultimate load are as follows: 6 mm and 30 mm steel fibers, 13 mm and 50 mm steel
fibers, 50 mm steel fibers, 6 mm steel fibers, 30 mm steel fibers and 13 mm steel fibers.
Similar to the reasoning why certain beams experienced a greater ultimate load than
others, the beams with a greater fiber volume generally tended to experience a greater
percent increase in ultimate load. There were two exceptions however. The beams with
50 mm steel fibers, though greater in fiber volume, experienced a smaller percent
increase of ultimate load compared to the beams with hybrid fibers. Additionally, the
percent increase was larger for the beams with 6 mm steel fibers than the beams with 13
mm.
The ratio of the elastic limit to the ultimate load tends to decrease for beams with
6 mm steel fibers, 13 mm steel fibers and 50 mm steel fibers after incorporating the
external flexural reinforcement. This decrease is a result of a greater difference in load
between the elastic limit and ultimate load, and thus the plastic region is increased as it
takes a greater load and deformation for the beams to reach ultimate once the elastic limit
is achieved. The ratio of the elastic limit to the ultimate load tends to increase for beams
with 30 mm steel fibers, 6 mm and 30 mm steel fibers and 13 mm and 50 mm steel fibers
after incorporating the external flexural reinforcement. This increase is a result of a
smaller difference in load between the elastic limit and ultimate load, thus the plastic

164
region is increased as it takes a smaller load and deformation for the beams to reach
ultimate once the elastic limit is achieved.
The area under the load-deformation curve is related to the energy absorption of
the beams. It is clear to see that the area under the load-deformation curves increased
with the addition of external flexural reinforcement. Generally, the largest increase in
area was in the plastic region between the elastic limit and the ultimate load. This
signifies that the external flexural reinforcement was mainly effective in facilitating the
beams to undergo more load and plastic deformation before reaching the ultimate load.

165
CHAPTER 6: CONCLUSION AND RECOMMENDATIONS
1. Conclusion
Based on the results and discussion of the experimental investigation of this
study, the following conclusions can be made:
Built-up I-beams made with hybrid fibers SIFCON plates can be fabricated to
support loads.
It is possible to connect the SIFCON plates using an organic epoxy resin with
aluminum angles and an inorganic epoxy with basalt fibers.
The 1/8 in thick SIFCON plates were too slender to fabricate and work with to
make the built-up I-beams.
It was difficult to fabricate monolithic I-Beam using a three dimensional mold so
as to avoid building individual plates and connecting them because the long fibers
could not be uniformly distributed in the web and the flanges.
Flexural behavior of built-up I-beams made from plates with hybrid-fiber was
superior to those made from plates with one fiber type.
Built-up I-beams reinforced with basalt fabrics at the bottom had higher flexural
strength and ductility compared to unreinforced built-up I-beams.
There is little correlation between the compressive strength and elastic modulus of
concrete cylinders made with hybrid fibers.
Concrete made with hybrid fibers of 50 mm hooked steel fibers and straight brass
coated fibers had higher compressive strengths than concrete made with only
straight steel fibers or with only hooked end steel fibers.
Specimens with pre-placed steel fibers had higher elastic moduli compared to
those specimens with fibers mix with concrete.

166
The specimens with hybrid steel fibers show the higher elastic moduli due to the
straight steel fibers filling the voids created by the larger hooked end steel fibers.
Fibers that are more uniformly distributed within concrete had higher elastic
modulus.
Built-up beams reinforced with basalt fiber fabrics acting as external flexural
reinforcement showed higher stiffness. The failure of the beams with external
flexural reinforcement is reached only when the basalt fabric fails.
2. Recommendations for Future Research
The statements below are recommendations for future research and for improving this
study.
Fabricate and test three-dimensional monolithic I-beam and compare them to
built-up I-beams.
Determine tensile strength and tensile elastic modulus using a direct tension test.
Fabricate and test built-up box beams made of SIFCON plates.
Investigate further the use of the basalt fabrics for retrofit of built-up I-beams.
Perform analytical study to for built-up beam design with and without basalt
fabric.

167
REFERENCES
ASTM C31. 2016. “Standard Practice for Making and Curing Concrete Test Specimens
in the Field.” American Society for Testing and Materials.
ASTM C469. 2014. “Standard Test Method for Static Modulus of Elasticity and
Poisson’s Ratio of Concrete in Compression.” American Society for Testing and
Materials.
Abu-Obeidah, Adi Salman. 2012. “Behavior of Shear Deficient Reinforced Concrete
Beams with Externally Bonded Aluminum Plates.” Thesis. Sharjah, United Arab
Emirates: American University of Sharjah, June.
Ali, Nageh Mohammed, Xin Wang, Zhishen Wu and Ahmed Yehia Hassanein. 2015. “Basalt
fiber reinforced polymer grids as an external reinforcement for reinforced concrete structures.”
Reinforced Plastics & Composites 1615-1627.
Balaji, S. and G.S. Thirugnanam. 2013. “Flexural strengthening of reinforced concrete beams
using precast SIFCON laminates.” Journal of Structural Engineering 262-267.
Cagatay, Ismail H. and Riza Dincer. 2011. “Modeling of concrete containing steel fibers:
toughness and mechanical properties.” Computers and Concrete 357-369.
Caggiano, Antonio, Marco Cremona, Ciro Faella, Carmine Lima and Enzo Martinelli. 2012.
“Fracture behavior of concrete beams reinforced with mixed long/short steel fibers.” Construction
and Building Materials 832-840.
Jain, Kranti and Bhupinder Singh. 2013. “Flexural performance criteria for steel fibre reinforced
concrete – an experimental investigation.” Journal of Structural Engineering 486-495.
Kotatkova, Jaroslava and Pavel Reiterman. 2014. “Effects of Different Types of Steel Fibers on
the Mechanical Properties of High Strength Concrete.” Advanced Materials Research 80-84.
Liu, Kang. 2014. “Experimental Study on the Ductility of Beams with SIFCON Blocks.” Applied
Mechanics and Materials 41-44.
Marar, Khaled, Ozgur Eren and Hooman Roughani. 2016. “The Influence of Amount and Aspect
Ratio of Fibers on Shear Behaviour of Steel Fiber Reinforced Concrete.” KSCE Journal of Civil
Engineering 1-7.
Nanni, Antonio. 1992. “PROPERTIES OF ARAMID-FIBER REINFORCED CONCRETE AND
SIFCON.” Journal of Materials in Civil Engineering 1-15.
Ni, Kun, Yun Xin Shi, Yi Ning Ding, Yan Gang Zhang, Jing Bin Shi and Wei Liu. 2015.
“Influence of Aspect Ratio of Hooked End Steel Fiber on Flexural Behavior of Fiber Reinforced
Concrete.” Key Engineering Materials 560-564.
Pajak, M. and T. Ponikiewski. 2013. “Flexural behavior of self-compacting concrete reinforced
with different types of steel fibers.” Construction and Building Materials 397-408.

168
Rahim, Mustaqqim Abdul, Zuhayr Md Ghazaly, Raja Nurazira Raja Mamat, Muhammed Azizi
Azizan, Nur Fitriah Isa and Shahiron Shahidan. 2016. “Experimental Study of Slurry Infiltrated
Fiber Reinforced Concrete.” Materials Science Form 363-366.
Shen, Deijan, Shucheng Deng, Jinyang Zhang, Wei Wang and Guoqing Jiang. 2015. “Behavior of
reinforced concrete box beam with initial cracks repaired with basalt fiber-reinforced polymer
sheet.” Reinforced Plastics & Composites 1540-1554.
Sashidhar, C., H. Sudarsana Rao, K. Gnaneswara and N.V. Ramana. 2011. “Flexural behavior of
SIFCON produced with low tensile strength steel fibre.” The Indian Concrete Journal 37-41.
Shahidan, Shahiron, Mustaqqim Abdul Rahim, Nik Suharliza, Nik Zol, Muhammad Azizi Azizan
and Isham Ismail. 2015. “Properties Of Steel Fiber Reinforcement Concrete With Different
Characteristic Of Steel Fiber.” Applied Mechanics and Materials 28-32.
Shannag, M.J., S. Barakat and F. Jaber. 2001. “Structural repair of shear-deficient reinforced
concrete beams using SIFCON.” Magazine of Concrete Research 391-403.
Sharma, Dr. H. K., V. P. Singh and Mukesh Kumar. 2008. “STRUCTURAL OPTIMIZATION
AND PERFORMANCE OF SIFCON PLATES.” 7th WSEAS Int. Conference on APPLIED
COMPUTER & APPLIED COMPUTATIONAL SCIENCE 787-792.
Sim, Jongsung, Cheolwoo Park and Do Young Moon. 2015. “Characteristics of basalt fiber as a
strengthening material for concrete structures.” Composites Part B: Engineering 504-512.
Thirugnanam, G.S., P. Govindan and A. Sethurathnam. 2001. “Ductile behavior of SIFCON
structural members.” Journal of Structural Engineering 27-32.
Uygunoglu, Tayfun. 2008. “Investigation of microstructure and flexural behavior of steel-fiber
reinforced concrete.” Materials and Structures 1441-1449.