2017 oregon wine symposium | rob mcmillan- state of the industry
TRANSCRIPT
FULL BACK
IMAGE TRANSPARENT
PANEL
Replace image:
1. Go to View-Master
2. Delete current image
3. Insert new image
4. Send to Back
CHANGE PANEL COLOR
and transparency as
needed.
State of the Wine Industry 2017
Rob McMillan EVP & Founder, Silicon Valley Bank Wine Division
SV
B 2
013 4
:3 (
WH
ITE
)
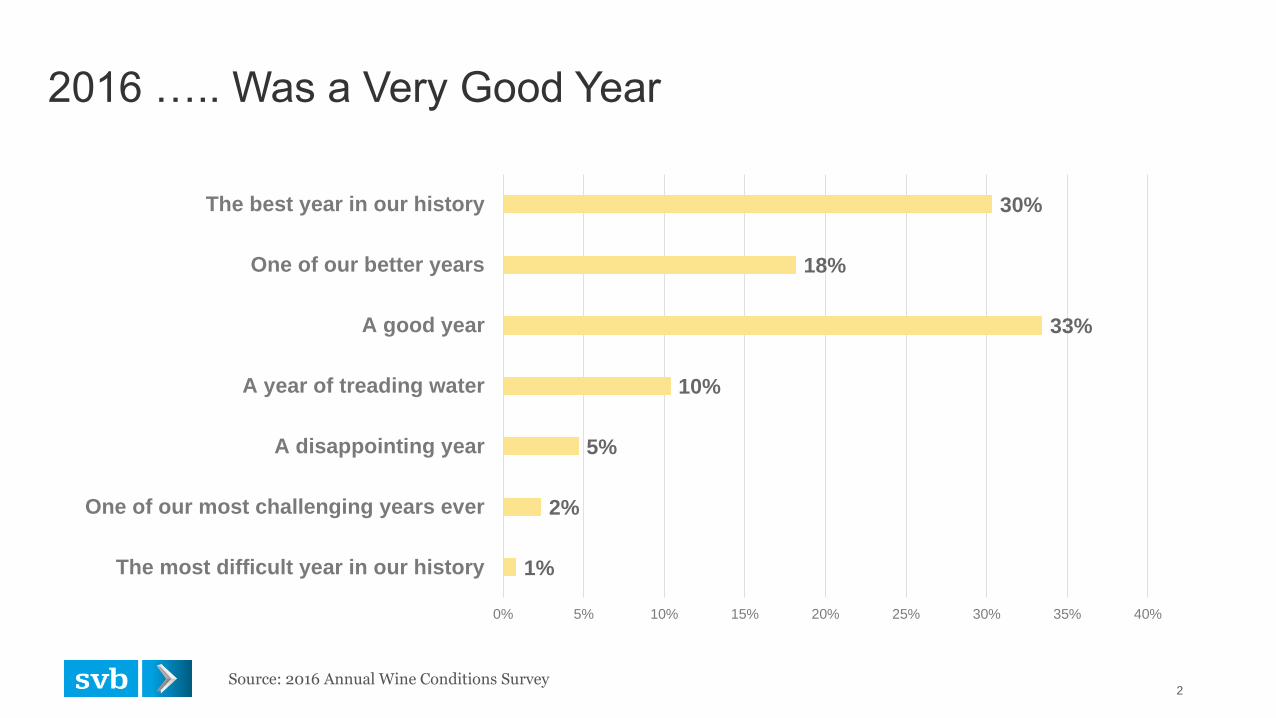
2016 ….. Was a Very Good Year
2
1%
2%
5%
10%
33%
18%
30%
0% 5% 10% 15% 20% 25% 30% 35% 40%
The most difficult year in our history
One of our most challenging years ever
A disappointing year
A year of treading water
A good year
One of our better years
The best year in our history
Source: 2016 Annual Wine Conditions Survey
SV
B 2
013 4
:3 (
WH
ITE
)
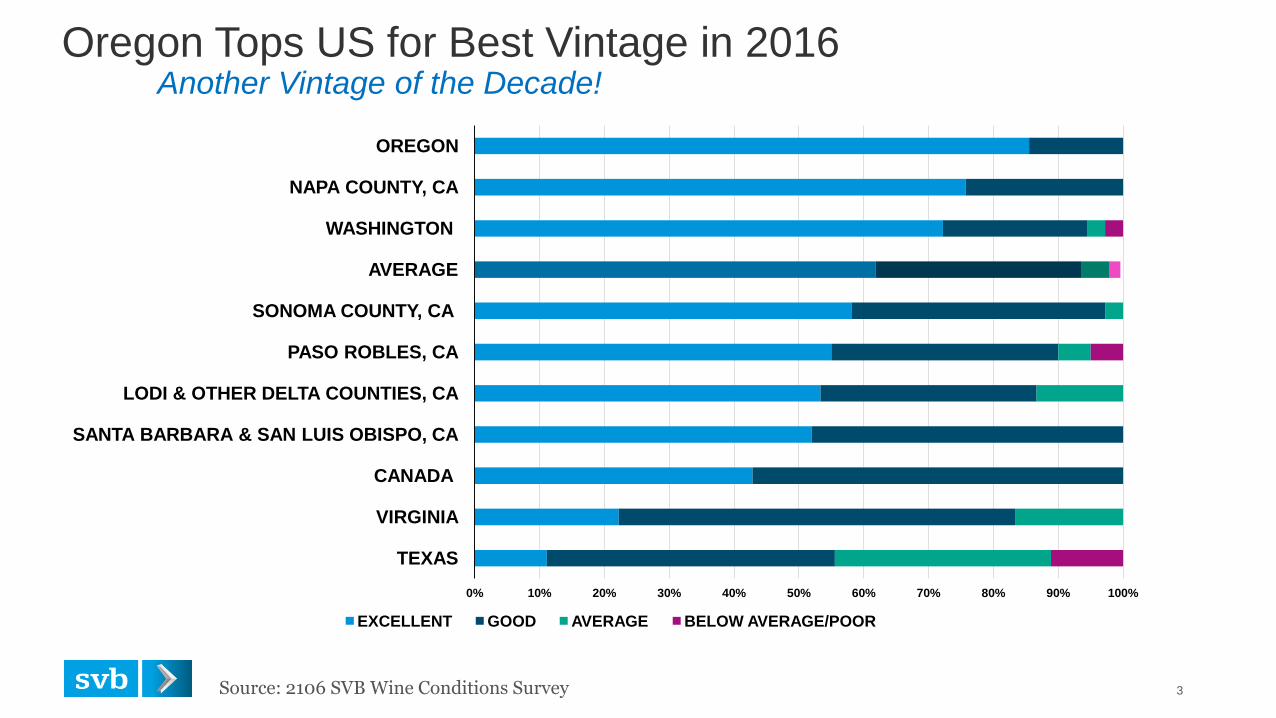
Oregon Tops US for Best Vintage in 2016 Another Vintage of the Decade!
Source: 2106 SVB Wine Conditions Survey 3
0% 10% 20% 30% 40% 50% 60% 70% 80% 90% 100%
TEXAS
VIRGINIA
CANADA
SANTA BARBARA & SAN LUIS OBISPO, CA
LODI & OTHER DELTA COUNTIES, CA
PASO ROBLES, CA
SONOMA COUNTY, CA
AVERAGE
WASHINGTON
NAPA COUNTY, CA
OREGON
EXCELLENT GOOD AVERAGE BELOW AVERAGE/POOR
SV
B 2
013 4
:3 (
WH
ITE
)
-35
-20
-5
10
25
40
55
70
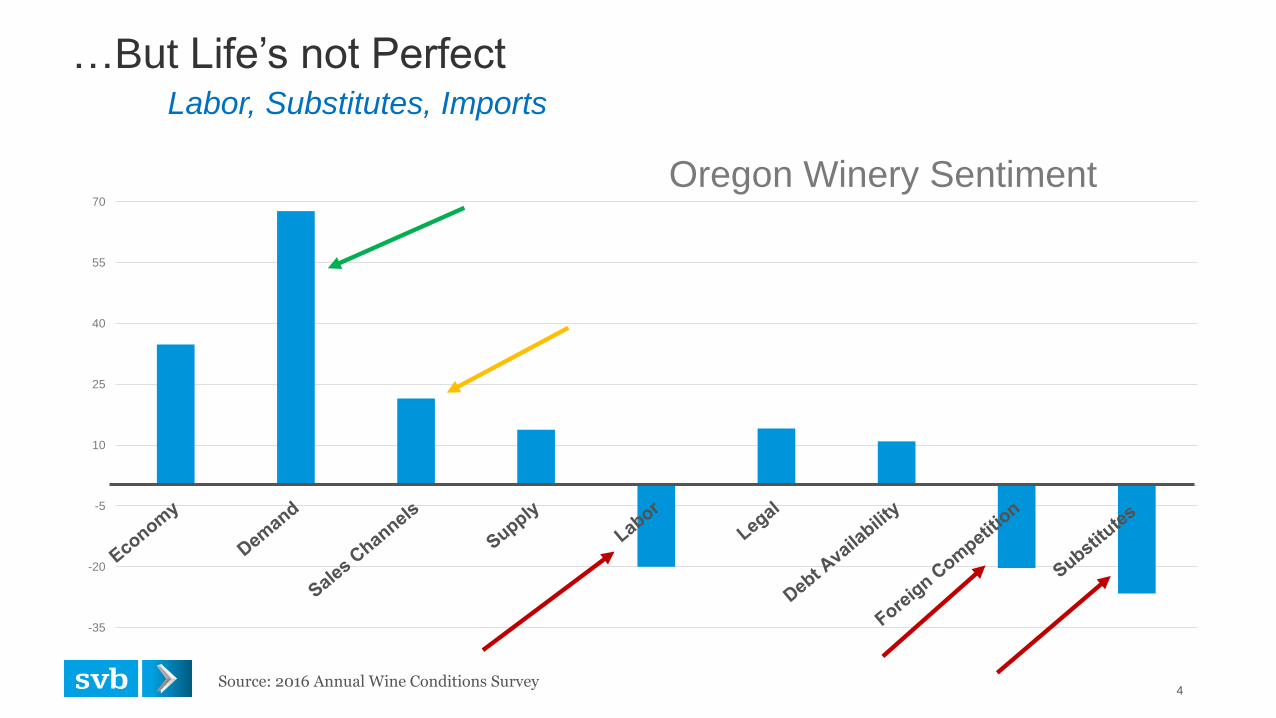
Oregon Winery Sentiment
…But Life’s not Perfect Labor, Substitutes, Imports
4 Source: 2016 Annual Wine Conditions Survey
SV
B 2
013 4
:3 (
WH
ITE
)
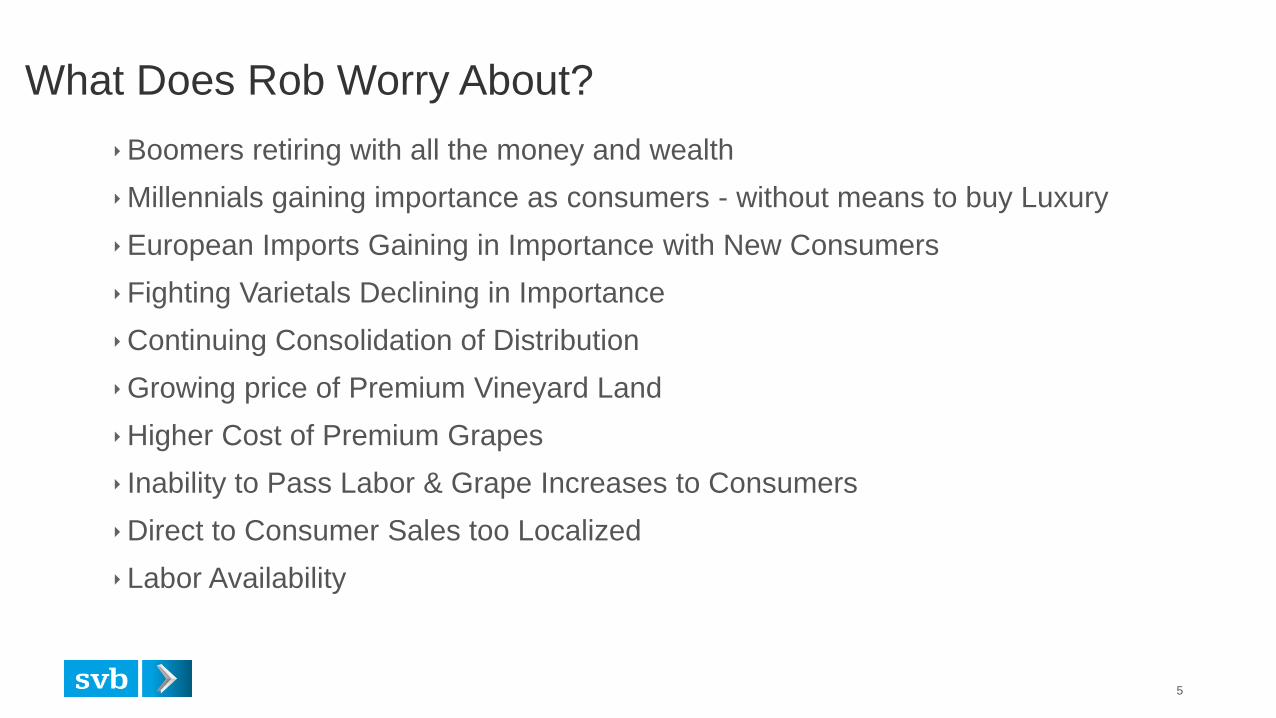
What Does Rob Worry About?
Boomers retiring with all the money and wealth
Millennials gaining importance as consumers - without means to buy Luxury
European Imports Gaining in Importance with New Consumers
Fighting Varietals Declining in Importance
Continuing Consolidation of Distribution
Growing price of Premium Vineyard Land
Higher Cost of Premium Grapes
Inability to Pass Labor & Grape Increases to Consumers
Direct to Consumer Sales too Localized
Labor Availability
5
SV
B 2
013 4
:3 (
WH
ITE
)
350
400
450
500
550
600
650
700
750
800
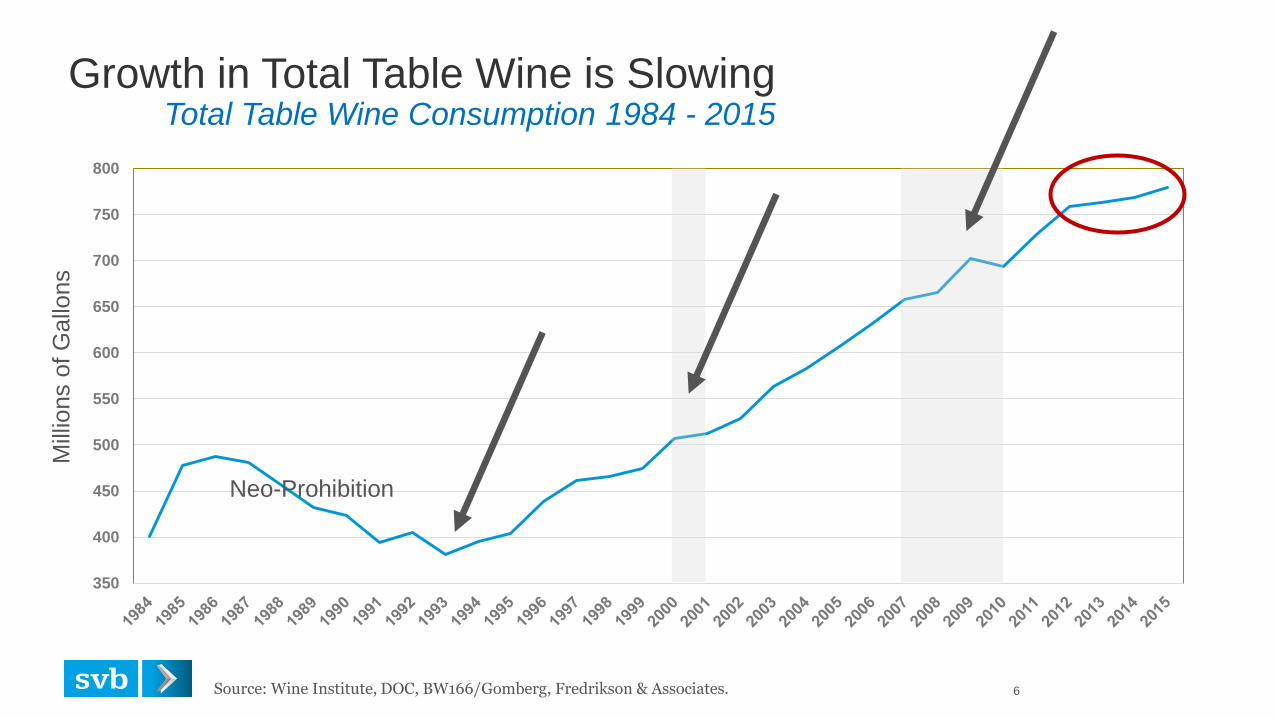
Growth in Total Table Wine is Slowing Total Table Wine Consumption 1984 - 2015
Source: Wine Institute, DOC, BW166/Gomberg, Fredrikson & Associates. 6
Neo-Prohibition
Mill
ions o
f G
allo
ns
SV
B 2
013 4
:3 (
WH
ITE
)
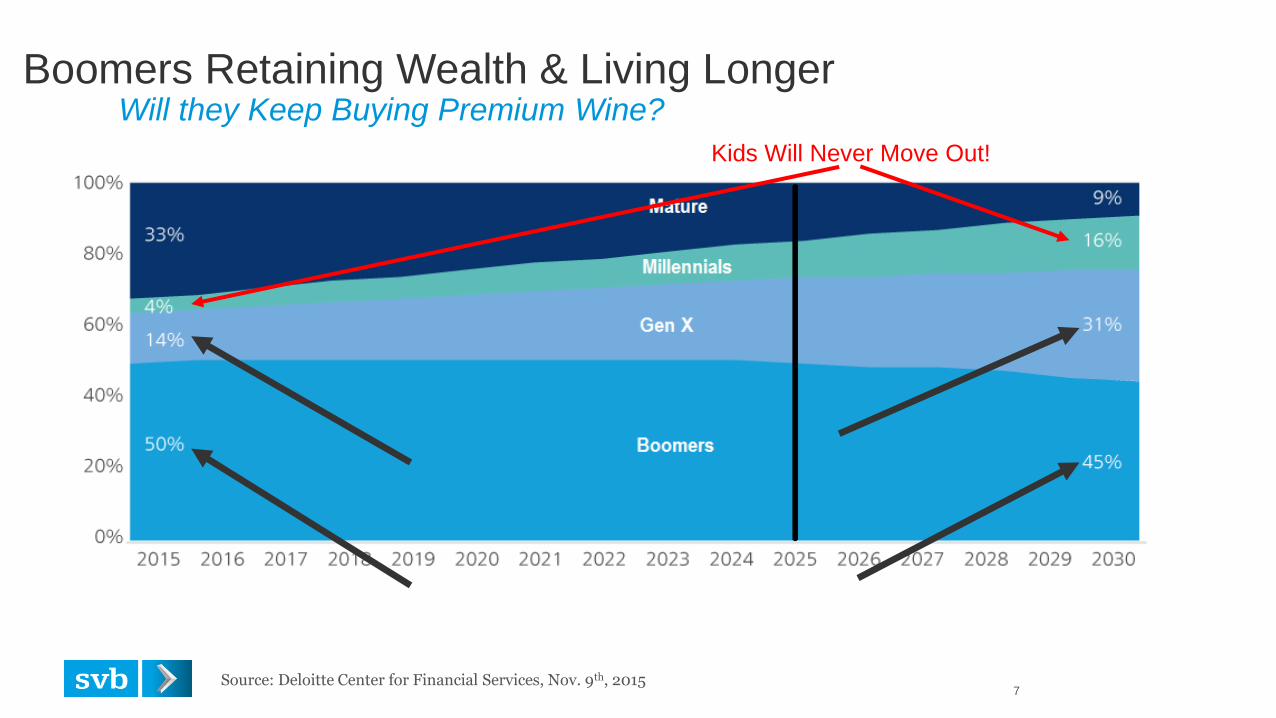
Boomers Retaining Wealth & Living Longer Will they Keep Buying Premium Wine?
Source: Deloitte Center for Financial Services, Nov. 9th, 2015 7
Kids Will Never Move Out!
SV
B 2
013 4
:3 (
WH
ITE
)
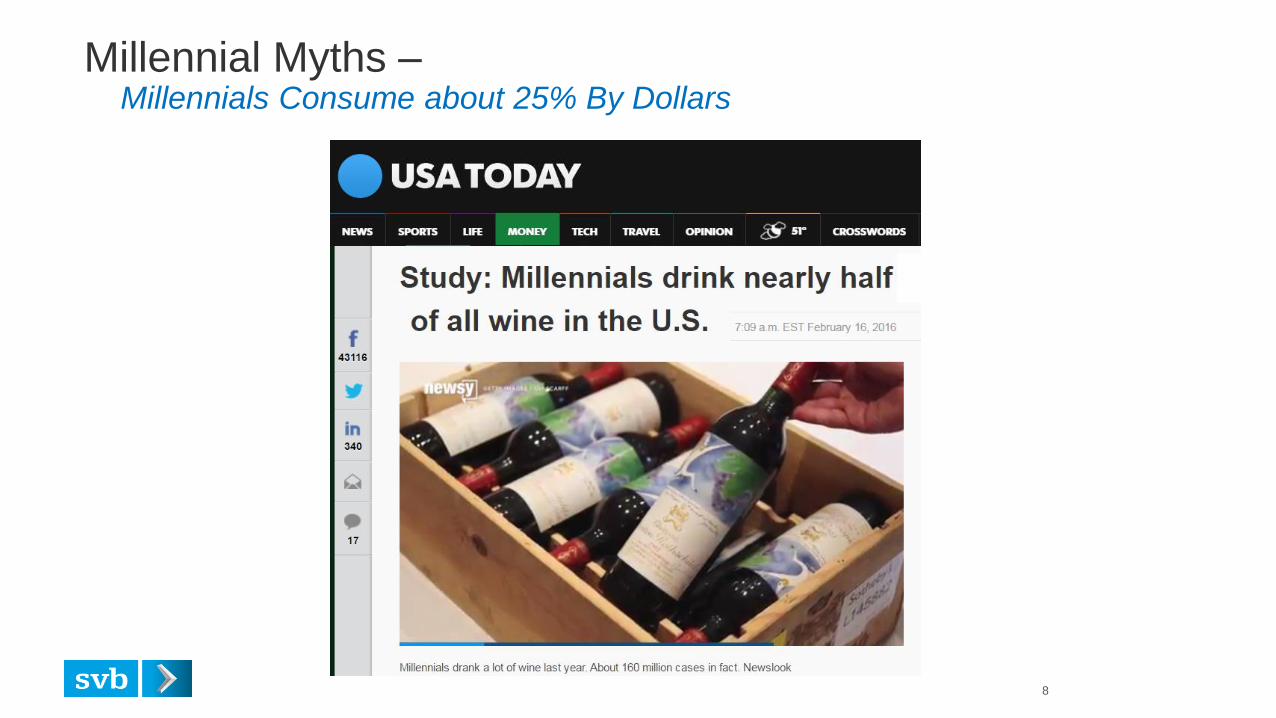
Millennial Myths – Millennials Consume about 25% By Dollars
8
SV
B 2
013 4
:3 (
WH
ITE
)
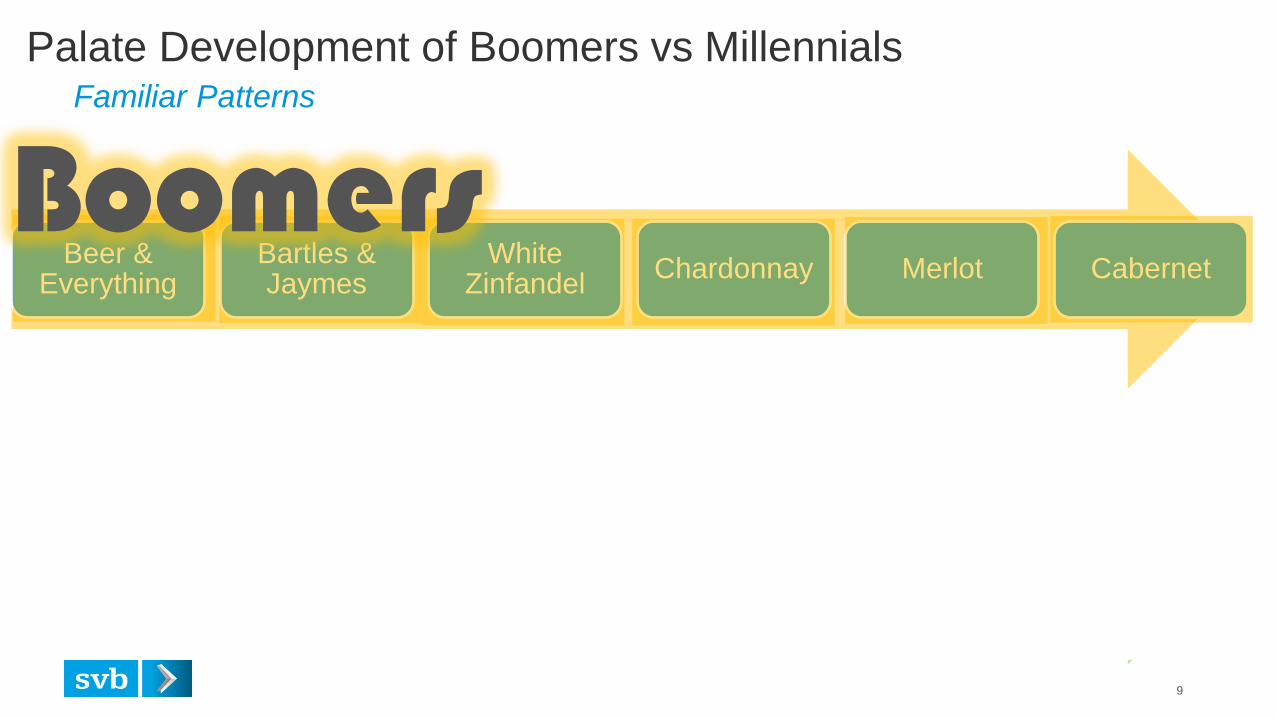
Palate Development of Boomers vs Millennials Familiar Patterns
9
Beer & Everything
Bartles & Jaymes
White Zinfandel
Chardonnay Merlot Cabernet
Good Beer & Everything
Prosecco Moscato Sauvignon
Blanc Red Blends
Oregon Pinot?
Millennials
Boomers
SV
B 2
013 4
:3 (
WH
ITE
)
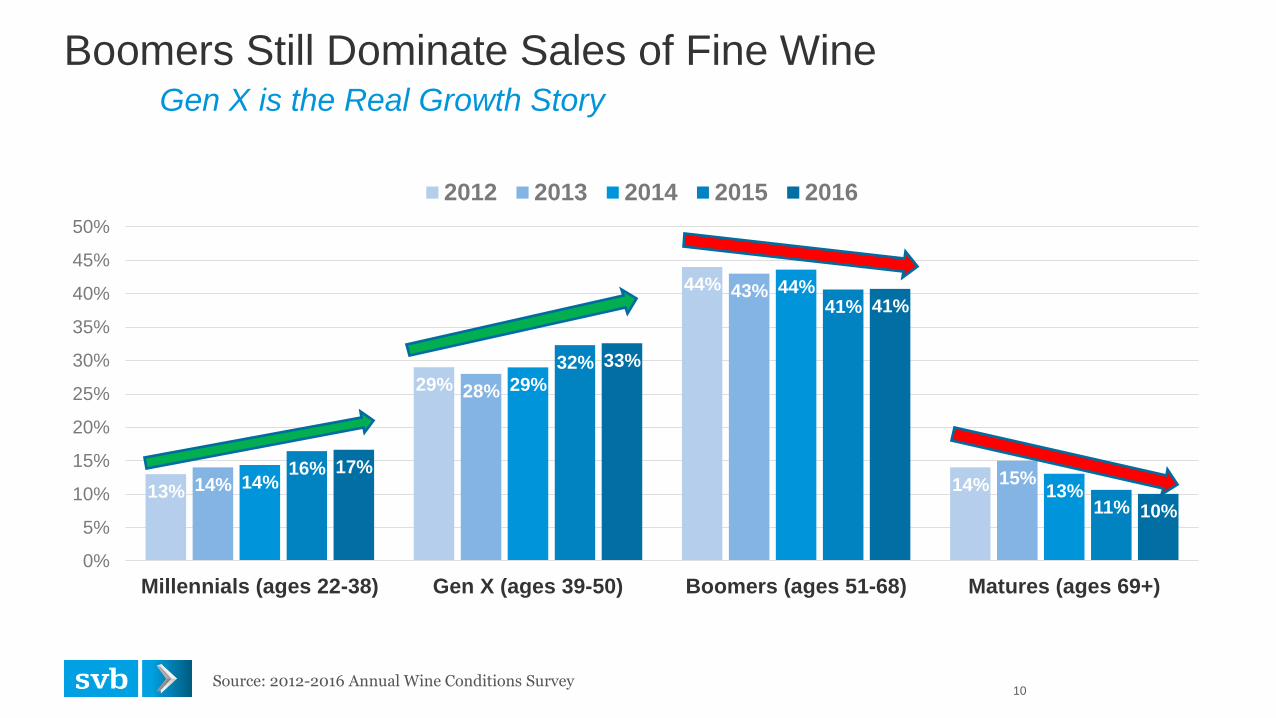
13%
29%
44%
14% 14%
28%
43%
15% 14%
29%
44%
13%
16%
32%
41%
11%
17%
33%
41%
10%
0%
5%
10%
15%
20%
25%
30%
35%
40%
45%
50%
Millennials (ages 22-38) Gen X (ages 39-50) Boomers (ages 51-68) Matures (ages 69+)
2012 2013 2014 2015 2016
Source: 2012-2016 Annual Wine Conditions Survey 10
Boomers Still Dominate Sales of Fine Wine Gen X is the Real Growth Story
SV
B 2
013 4
:3 (
WH
ITE
)
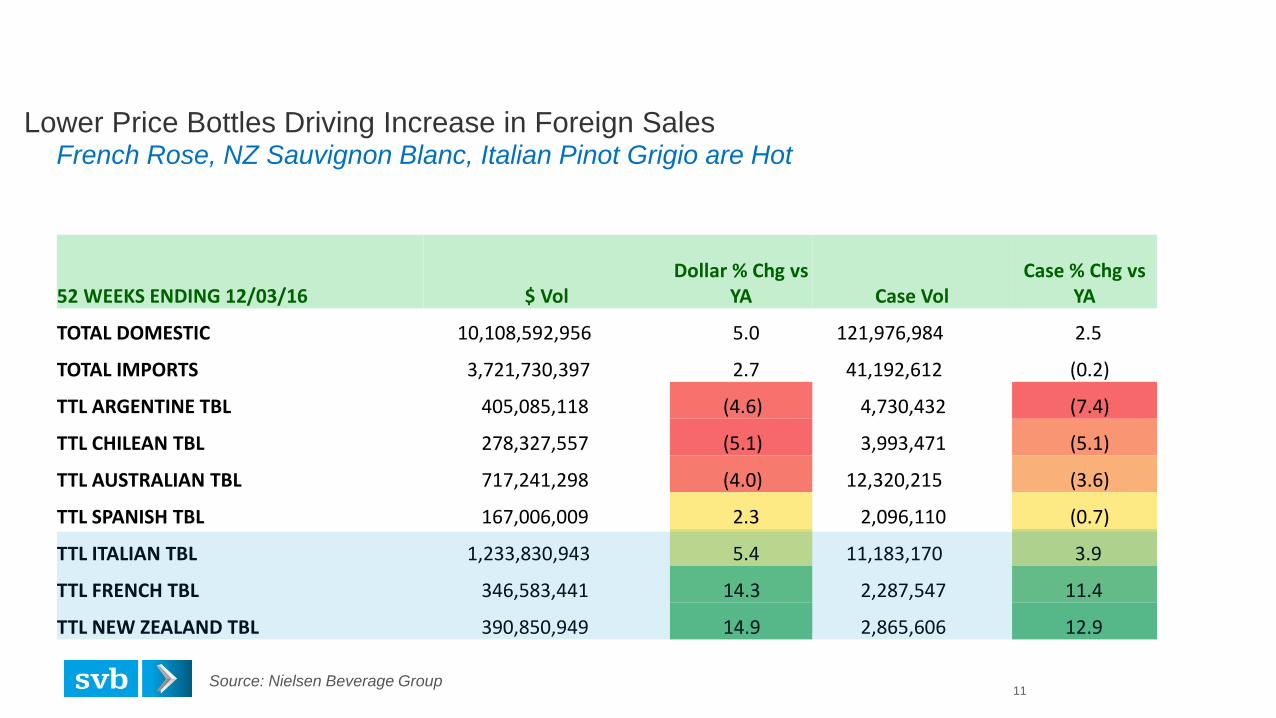
52 WEEKS ENDING 12/03/16 $ Vol Dollar % Chg vs
YA Case Vol Case % Chg vs
YA
TOTAL DOMESTIC 10,108,592,956 5.0 121,976,984 2.5
TOTAL IMPORTS 3,721,730,397 2.7 41,192,612 (0.2)
TTL ARGENTINE TBL 405,085,118 (4.6) 4,730,432 (7.4)
TTL CHILEAN TBL 278,327,557 (5.1) 3,993,471 (5.1)
TTL AUSTRALIAN TBL 717,241,298 (4.0) 12,320,215 (3.6)
TTL SPANISH TBL 167,006,009 2.3 2,096,110 (0.7)
TTL ITALIAN TBL 1,233,830,943 5.4 11,183,170 3.9
TTL FRENCH TBL 346,583,441 14.3 2,287,547 11.4
TTL NEW ZEALAND TBL 390,850,949 14.9 2,865,606 12.9
Lower Price Bottles Driving Increase in Foreign Sales French Rose, NZ Sauvignon Blanc, Italian Pinot Grigio are Hot
Source: Nielsen Beverage Group 11
SV
B 2
013 4
:3 (
WH
ITE
)
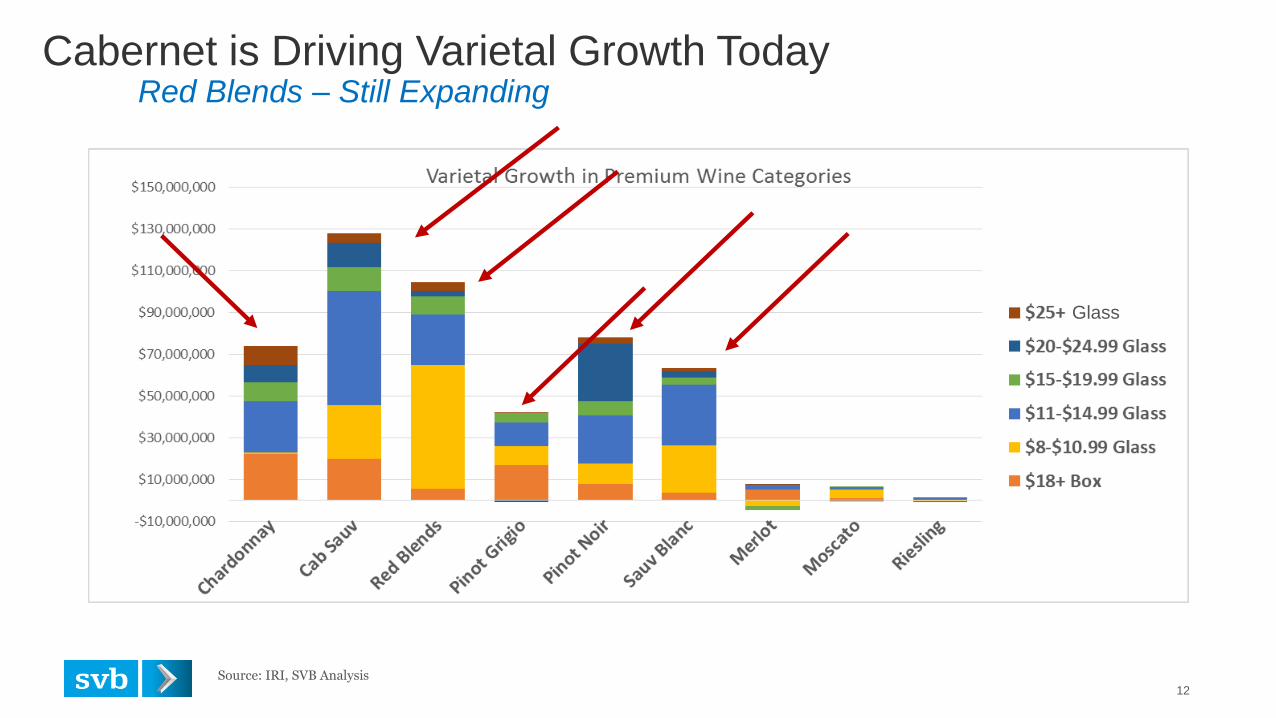
Cabernet is Driving Varietal Growth Today Red Blends – Still Expanding
12
Source: IRI, SVB Analysis
Glass
SV
B 2
013 4
:3 (
WH
ITE
)
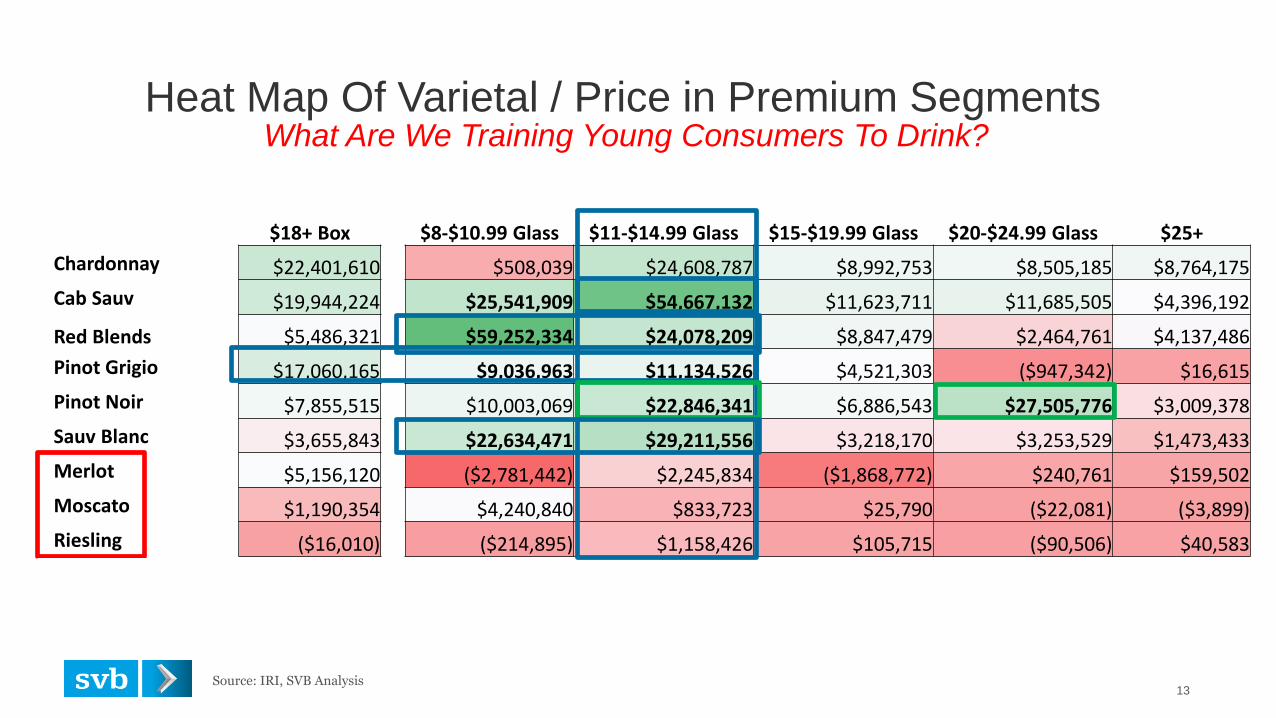
$18+ Box $8-$10.99 Glass $11-$14.99 Glass $15-$19.99 Glass $20-$24.99 Glass $25+
Chardonnay $22,401,610 $508,039 $24,608,787 $8,992,753 $8,505,185 $8,764,175
Cab Sauv $19,944,224 $25,541,909 $54,667,132 $11,623,711 $11,685,505 $4,396,192
Red Blends $5,486,321 $59,252,334 $24,078,209 $8,847,479 $2,464,761 $4,137,486
Pinot Grigio $17,060,165 $9,036,963 $11,134,526 $4,521,303 ($947,342) $16,615
Pinot Noir $7,855,515 $10,003,069 $22,846,341 $6,886,543 $27,505,776 $3,009,378
Sauv Blanc $3,655,843 $22,634,471 $29,211,556 $3,218,170 $3,253,529 $1,473,433
Merlot $5,156,120 ($2,781,442) $2,245,834 ($1,868,772) $240,761 $159,502
Moscato $1,190,354 $4,240,840 $833,723 $25,790 ($22,081) ($3,899)
Riesling ($16,010) ($214,895) $1,158,426 $105,715 ($90,506) $40,583
Syrah?
Zinfandel?
Heat Map Of Varietal / Price in Premium Segments
Source: IRI, SVB Analysis 13
What Are We Training Young Consumers To Drink?
SV
B 2
013 4
:3 (
WH
ITE
)
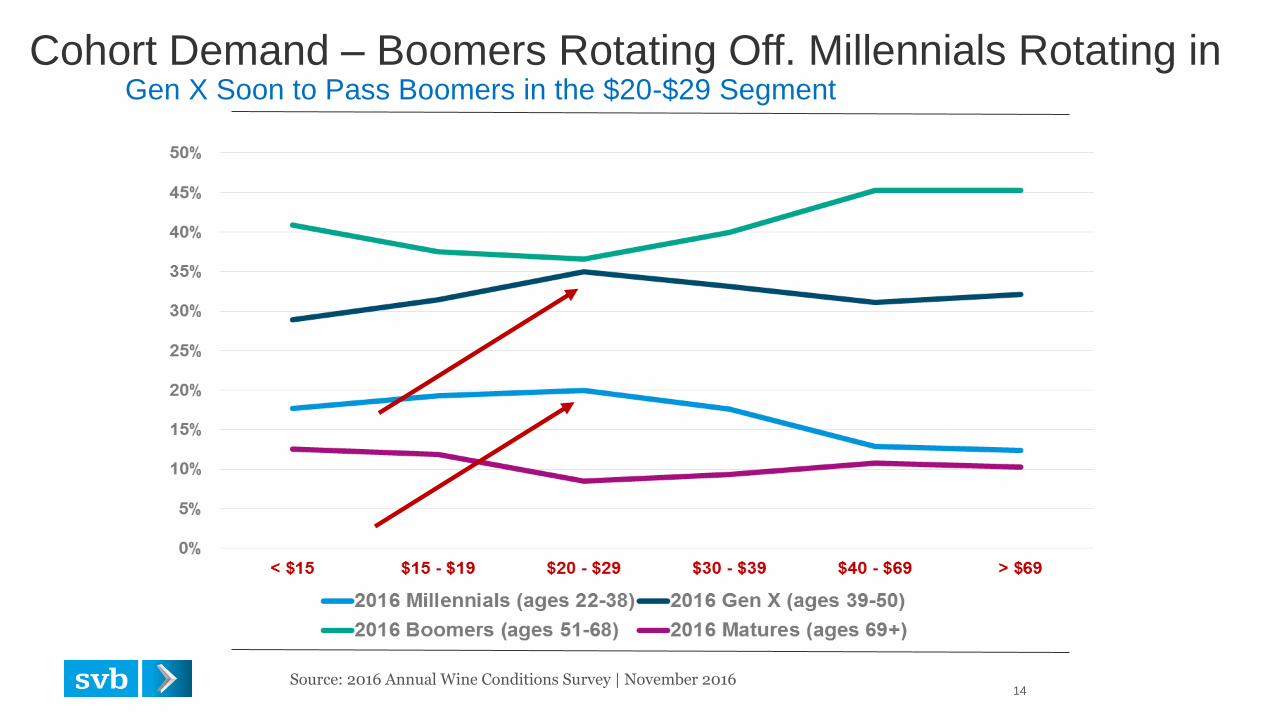
Cohort Demand – Boomers Rotating Off. Millennials Rotating in Gen X Soon to Pass Boomers in the $20-$29 Segment
Source: 2016 Annual Wine Conditions Survey | November 2016 14
SV
B 2
013 4
:3 (
WH
ITE
)
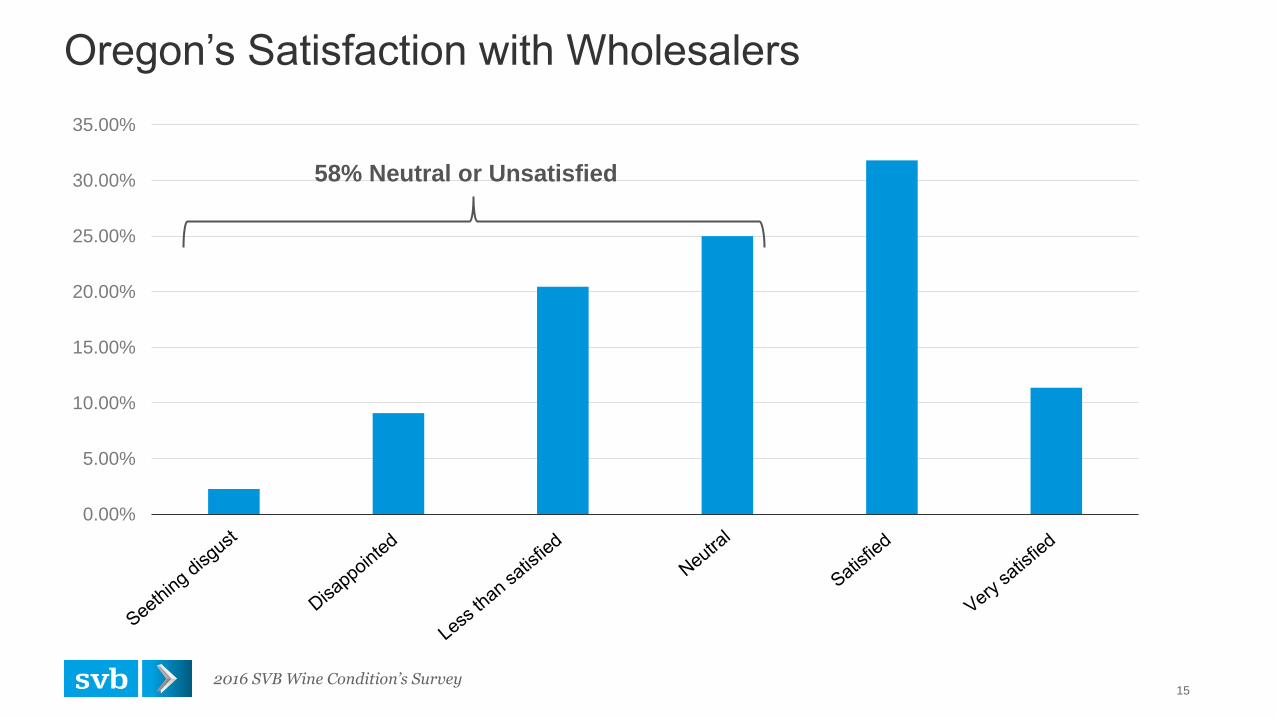
Oregon’s Satisfaction with Wholesalers
2016 SVB Wine Condition’s Survey 15
0.00%
5.00%
10.00%
15.00%
20.00%
25.00%
30.00%
35.00%
58% Neutral or Unsatisfied
SV
B 2
013 4
:3 (
WH
ITE
)
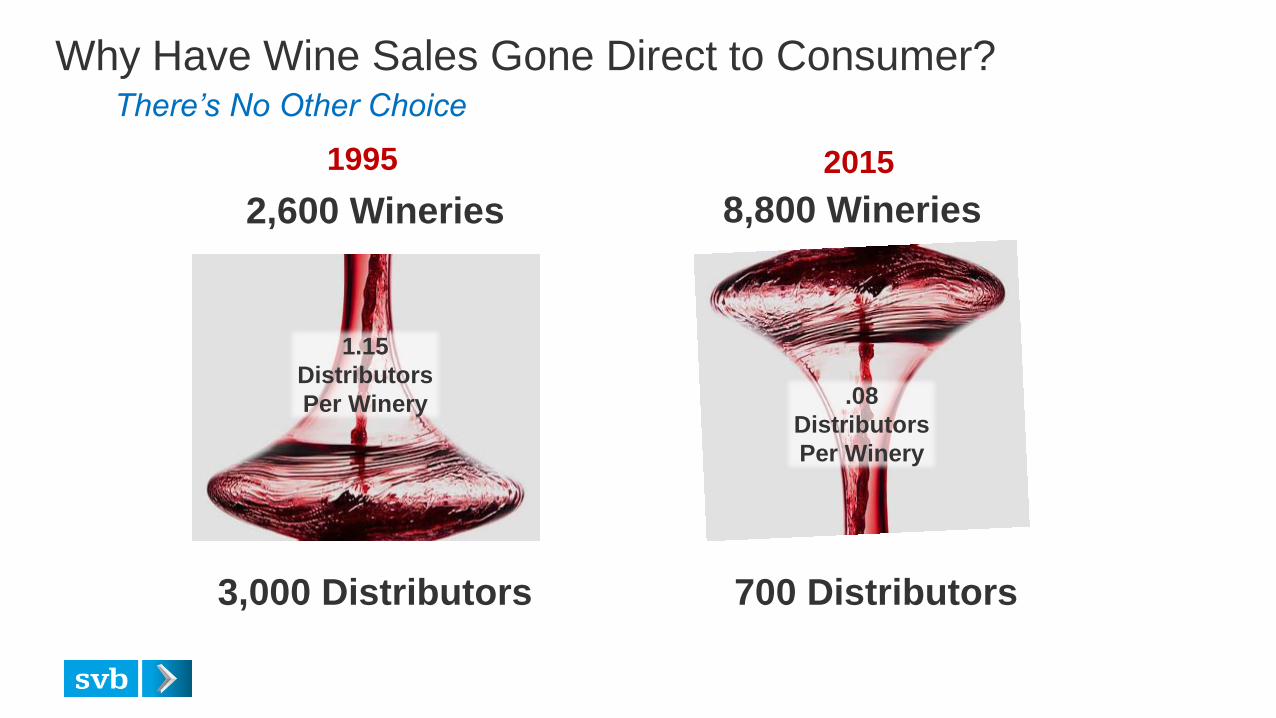
Why Have Wine Sales Gone Direct to Consumer? There’s No Other Choice
1995
2,600 Wineries 8,800 Wineries
2015
3,000 Distributors 700 Distributors
1.15
Distributors
Per Winery .08
Distributors
Per Winery
SV
B 2
013 4
:3 (
WH
ITE
)
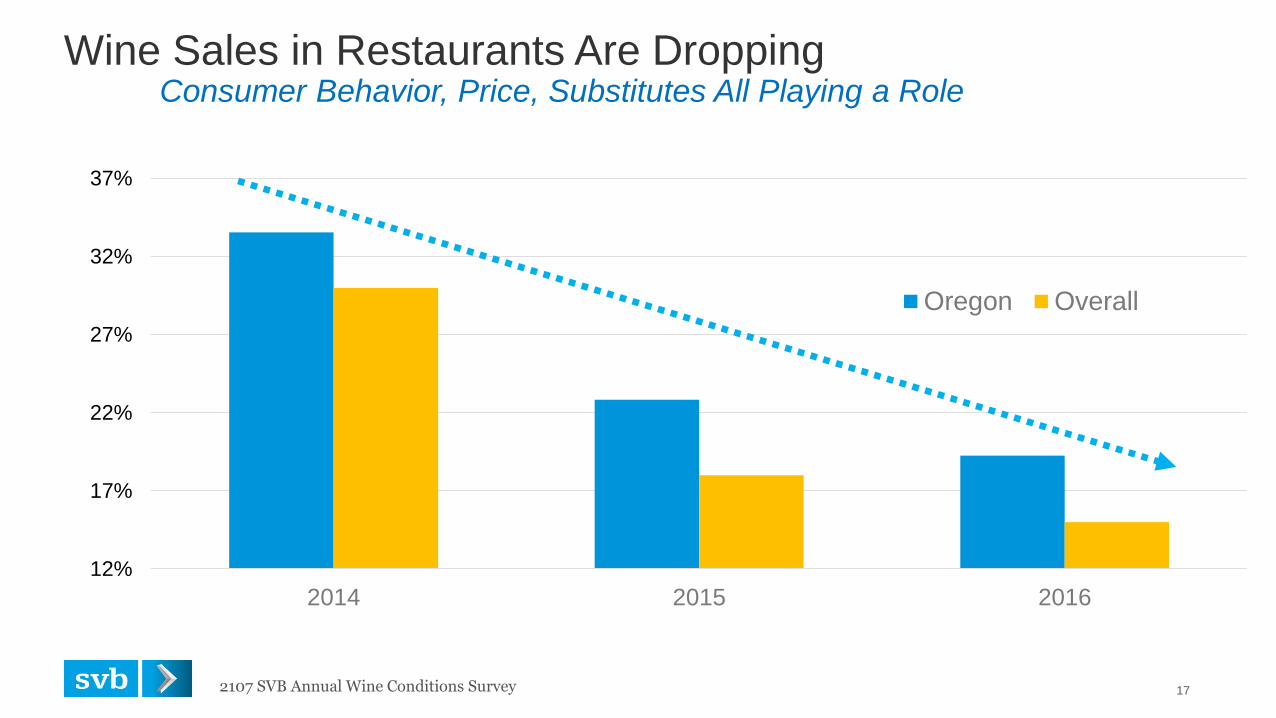
12%
17%
22%
27%
32%
37%
2014 2015 2016
Oregon Overall
Wine Sales in Restaurants Are Dropping Consumer Behavior, Price, Substitutes All Playing a Role
17 2107 SVB Annual Wine Conditions Survey
SV
B 2
013 4
:3 (
WH
ITE
)
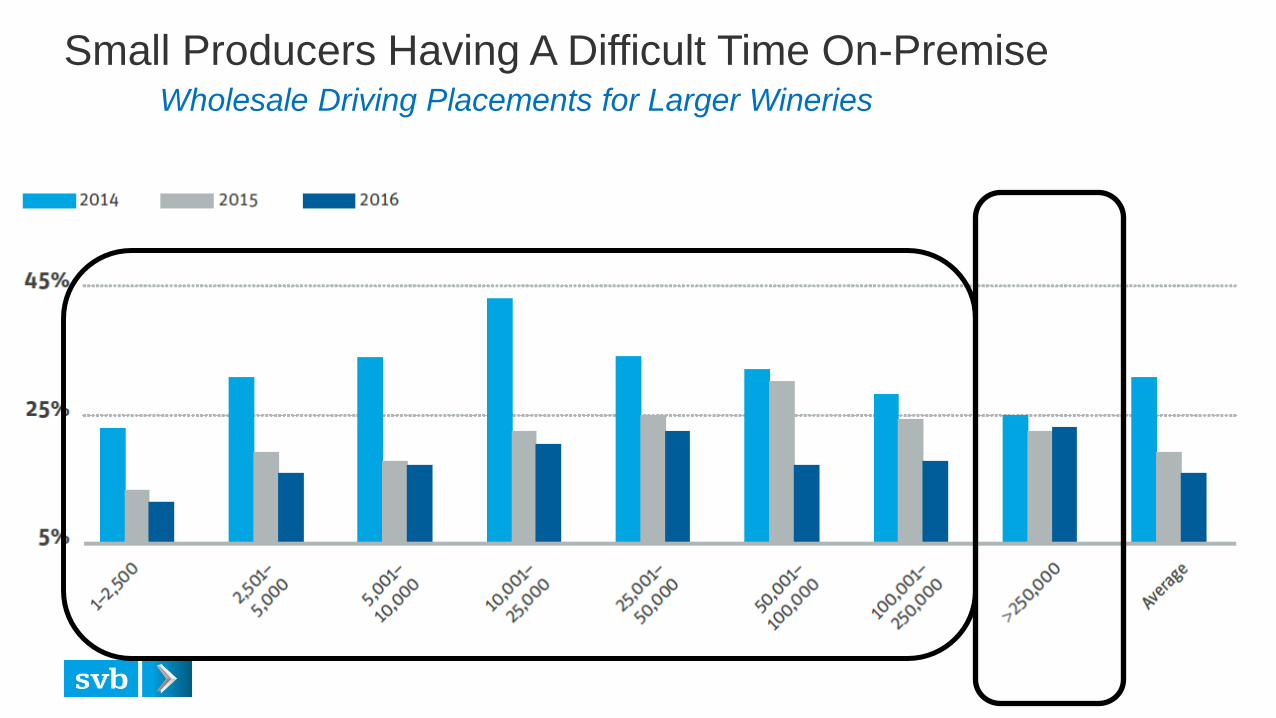
Small Producers Having A Difficult Time On-Premise Wholesale Driving Placements for Larger Wineries
SV
B 2
013 4
:3 (
WH
ITE
)
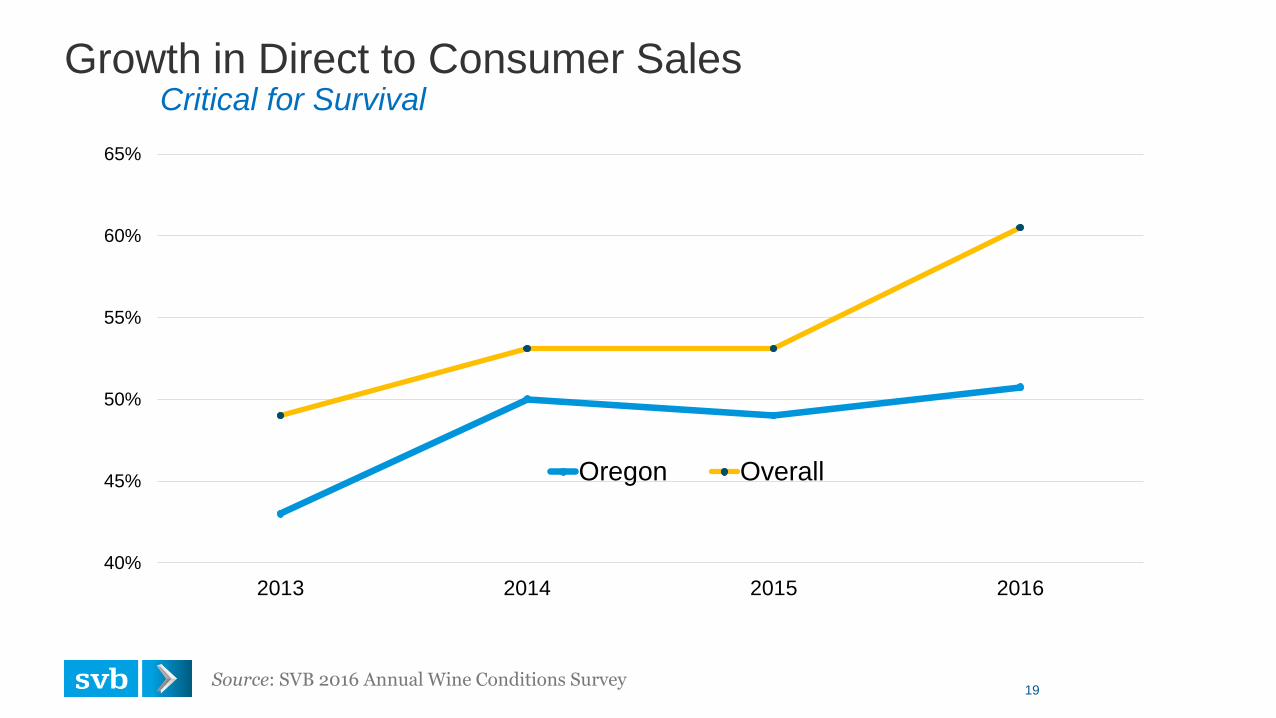
Growth in Direct to Consumer Sales Critical for Survival
Source: SVB 2016 Annual Wine Conditions Survey 19
40%
45%
50%
55%
60%
65%
2013 2014 2015 2016
Oregon Overall
SV
B 2
013 4
:3 (
WH
ITE
)
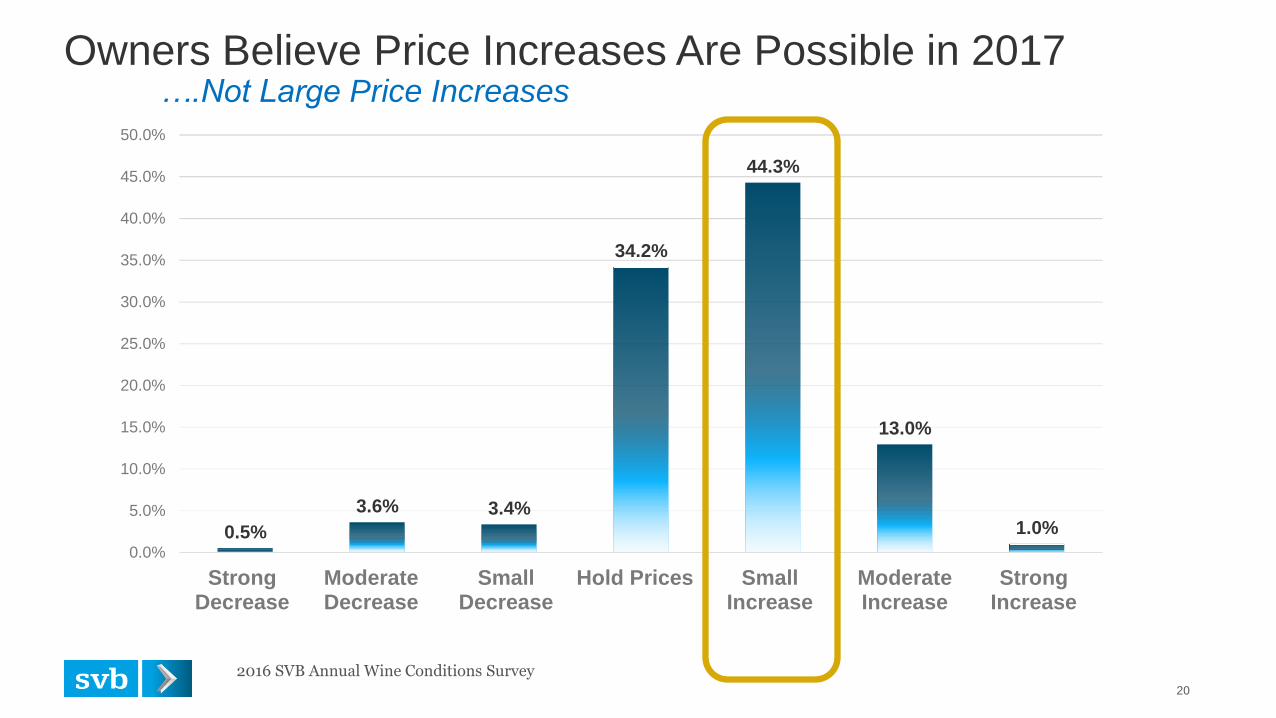
Owners Believe Price Increases Are Possible in 2017 ….Not Large Price Increases
20
0.5%
3.6% 3.4%
34.2%
44.3%
13.0%
1.0%
0.0%
5.0%
10.0%
15.0%
20.0%
25.0%
30.0%
35.0%
40.0%
45.0%
50.0%
StrongDecrease
ModerateDecrease
SmallDecrease
Hold Prices SmallIncrease
ModerateIncrease
StrongIncrease
2016 SVB Annual Wine Conditions Survey
SV
B 2
013 4
:3 (
WH
ITE
)
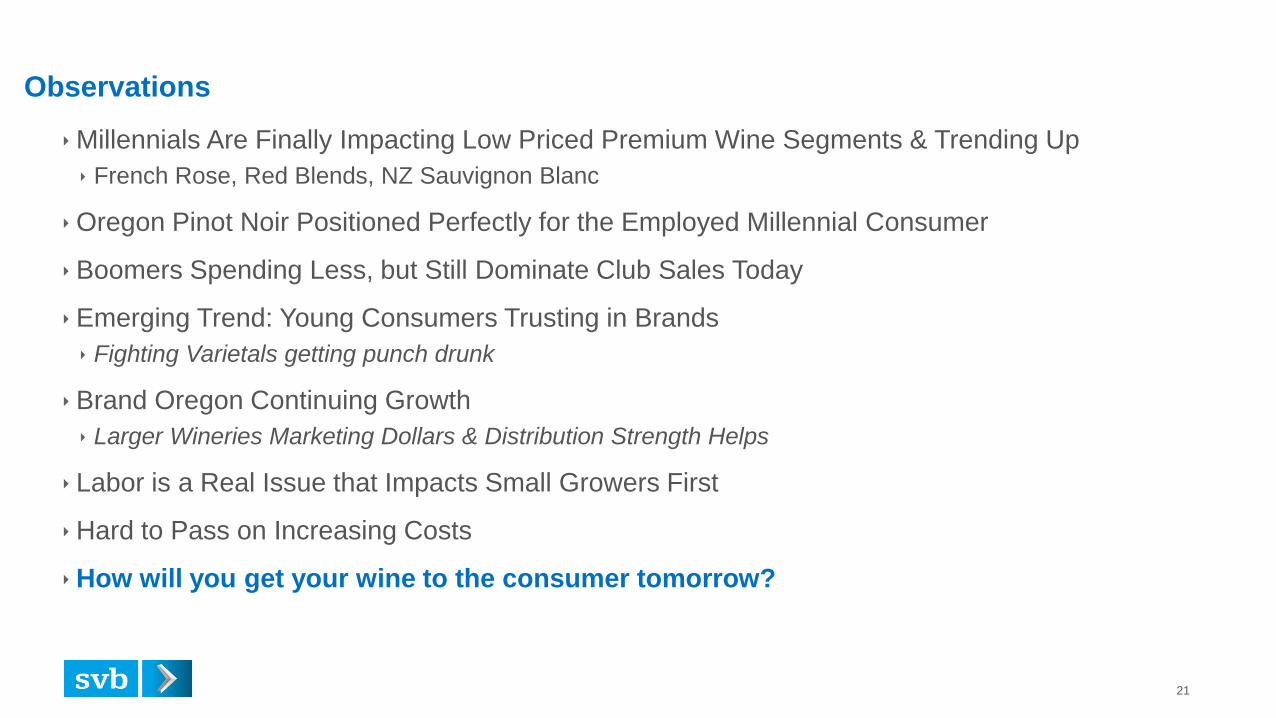
Observations
Millennials Are Finally Impacting Low Priced Premium Wine Segments & Trending Up
French Rose, Red Blends, NZ Sauvignon Blanc
Oregon Pinot Noir Positioned Perfectly for the Employed Millennial Consumer
Boomers Spending Less, but Still Dominate Club Sales Today
Emerging Trend: Young Consumers Trusting in Brands
Fighting Varietals getting punch drunk
Brand Oregon Continuing Growth
Larger Wineries Marketing Dollars & Distribution Strength Helps
Labor is a Real Issue that Impacts Small Growers First
Hard to Pass on Increasing Costs
How will you get your wine to the consumer tomorrow?
21
FULL BACK
IMAGE TRANSPARENT
PANEL
Replace image:
1. Go to View-Master
2. Delete current image
3. Insert new image
4. Send to Back
CHANGE PANEL COLOR
and transparency as
needed.
State of the Wine Industry 2017
Rob McMillan EVP & Founder, Silicon Valley Bank Wine Division
Email: [email protected]
Twitter: @SVBWine
Blog: SVB on Wine
FULL BACK
IMAGE TRANSPARENT
PANEL
Replace image:
1. Go to View-Master
2. Delete current image
3. Insert new image
4. Send to Back
CHANGE PANEL COLOR
and transparency as
needed.
END