2017 predictive analytics symposium - soa · 2017 predictive analytics symposium . session 7, risk...
TRANSCRIPT

2017 Predictive Analytics Symposium
Session 7, Risk Assessment Applications of Predictive Analytics
Moderator: Priyanka Srivastava
Presenters:
Dihui Lai, Ph.D. Nitin Nayak, Ph.D., MBA
Jason L. VonBergen, FSA, MAAA
SOA Antitrust Compliance Guidelines SOA Presentation Disclaimer

Using Machine Learning for Accelerated UnderwritingDihui Lai, PhDReinsurance Group of America
Sept, 2017

2
Overview
Background
Accelerated Underwriting
Model Structure and Model Performance
Model Interpretability and Model Validation

3
Background: Term Life Insurance Application Flow
Complete Forms 1-Day
Paramed Exam 1-Week
Review 2 - 4 Weeks
Policy Issued 1-Week
Policy Signed 2-3 Days
Placed in Force 2-3 Days
Time Consuming
Medical Exams are NOT always Pleasant
Extra Expenses

4
Background: Term Life Insurance Application Flow
Complete Forms
Placed in Force

5
Comparisons: SI v.s. Accelerated Underwriting
Simplified Issue
No fluids for any applicants
Short application
Use Rx, MIB, MVR database referenced
Relatively Low Face amount
Term typical
Typically rates are higher than fully UW
One preferred Class (still expensive)
Accelerated Underwriting
No fluids for certain percentage of applicants
Full application with drill downs
Use Rx, MIB, MVR database referenced
Face amount Comparable to Full UW
Term or permanent
Targeting fully UW rates
Including all preferred classes

6
Accelerated Underwriting Workflow
MVR
Full Application
Does applicant meet the requirements?
Does applicant meet the requirements?
Apply Full Underwriting with Fluids
Accelerated offer
Machine Learning

7
Model Selection
Which One?
Tree
• Non-cyclic binary rule structures
• Interpretability in the form of a single tree
• Easy to be ensemble to “forest”
GLM
• Interpretability, transparent coefficients
• Limited capability of explaining non-
linearity
Neural Network
• All-star model
• Widely integrated for face-recognition, auto-
drive, speech recognition.
• Low transparency and interpretability
SVM
• Non-probabilistic based classifier
• Able to explain complex geometry structure
• All-star until the breakthrough in deep learning

8
The Hierarchical Model Structure
Mortality
Classifier for Multiple-
Underwriting Classes
Classification Trees + Neural
Network
Classifier for Declined Risks
Classification Trees
Classifier for Prefer-ness
Classification Trees
……
……

9
Model Performance Assessment
Low Risk High Risk
Important Variables:
• BMI
• Age
• Prescription Count
• …
10
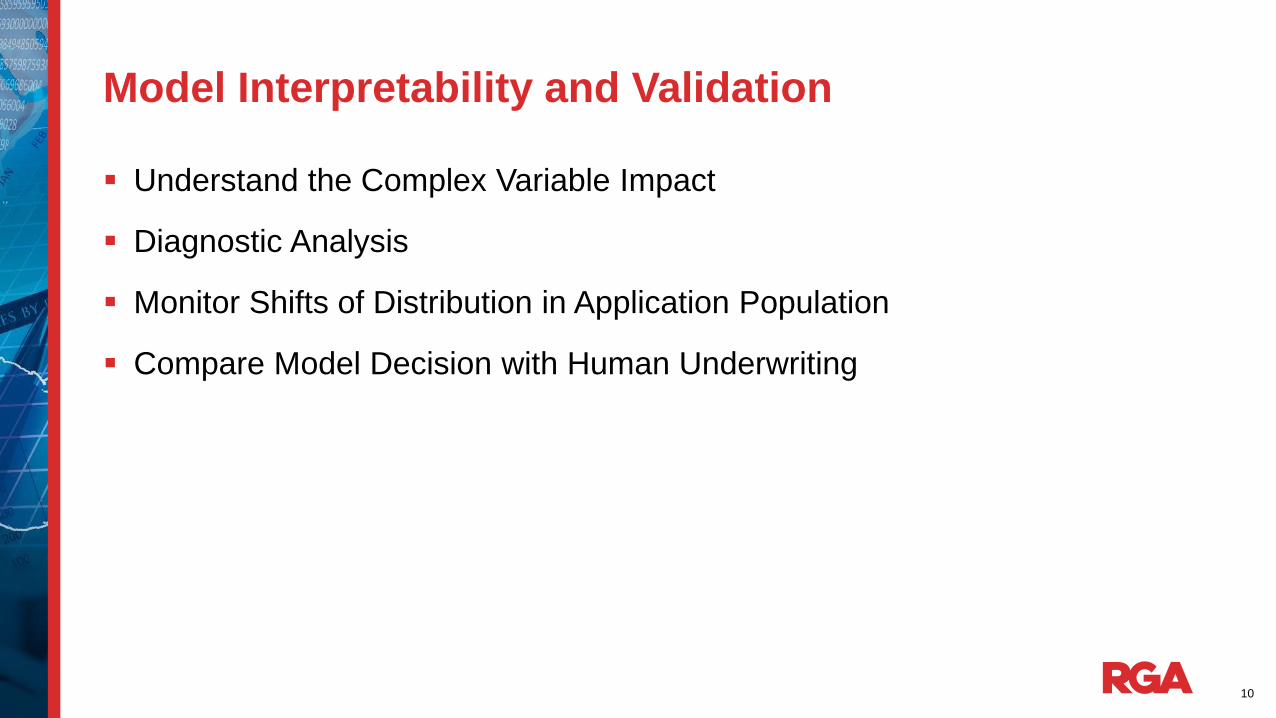
Model Interpretability and Validation
Understand the Complex Variable Impact
Diagnostic Analysis
Monitor Shifts of Distribution in Application Population
Compare Model Decision with Human Underwriting

©2015 RGA. All rights reserved.

Predictive Analytics Applications in InsuranceNitin Nayak, Ph.D.
Digital & Smart AnalyticsSwiss Re

Nitin Nayak | Digital & Smart Analytics | SOA Predictive Analytics Symposium 2017
Predictive Analytics for Life InsurancePredicting Applicant’s Smoking Propensity for Application Triage
2
• Business Problem: Can one predict an applicant’s smoking status without fluid-testing?

Nitin Nayak | Digital & Smart Analytics | SOA Predictive Analytics Symposium 2017
Worldwide opportunity for life protection is about US$ 8 6 T. In the US, mid-market represents a s ignificant opportunity
3
Reduce Friction
Incr
ease
Re
leva
nce engage the changing needs
of today’s consumer
Reduce friction in underwriting and acquisition processes
Existing distribution channels favor higher policy sizes & not mid-market
Strategy for closing protection gap

Nitin Nayak | Digital & Smart Analytics | SOA Predictive Analytics Symposium 2017
• Current underwriting process for life insurance is costly and time-intensive– requires laboratory tes ts (blood, urinalysis), paramedics (height, weight)
– takes weeks - months, increasing likelihood of applicant “walking away”
• Swiss Re is addressing this challenge, s tarting with tobacco classification of applicants as key focus– Smokers have 1.75 to 3 -fold higher mortality than non-smokers .
– US life insurance industry loads actuarial pricing up to 2 0 0 % more for tobacco use
– After age and gender, tobacco use, especially cigarette smoking, is the s ingle most important factor for risk loading of life insurance policies .
Swiss Re’s motivation and approach for supporting “fluid-less” life insurance underwriting
4

Nitin Nayak | Digital & Smart Analytics | SOA Predictive Analytics Symposium 2 0 1 7
• High performance expectation – Sensitivity/ specificity of smoker detection solution does not
equal or exceed the best medical screening tes ts thus far.
• Non-disclosed smoking in insurance applications– Identifying smokers from insurance application is difficult
due to large number (up to 5 0 %) of non-disclosed smokers , i.e ., actual smokers se lf-reporting as non-smokers
• No smoker-specific profile available to identify smokers– Difficult to detect smokers using “smoker” characteris tics
in application data.
Developing a “fluid-less” underwriting process based on detecting “smoker propensity” poses several challenges
Insurance Applicant Distribution
Smokers claiming to
be Non-smokers
True Smokers
True Non-smokers
5

Nitin Nayak | Digital & Smart Analytics | SOA Predictive Analytics Symposium 2 0 1 7
1 . A Predictive Analytics Model– Model designed to predict smokers and non-smokers
2 . A Triage-based Underwriting Process– Majority of applicants (go through Fast Track
process requiring no lab (cotinine) tes ts for smoking
– Predicted smokers go through Traditional(business-as-usual) process with lab tes t required
3 . A Cost/ Benefit Analysis and Optimization Model– Analyzes cost impact of prediction errors (i.e .,
misclassification of smokers as non-smokers) & savings from fast track with no lab-test for majority of applicants
– Computes age , gender, and face amount requirements for a for client-specific life product with positive NPV
3 -part solution approach is designed to address the challenges of fas t underwriting for life insurance policies
Following slides provide details on the 3-part solution6

Nitin Nayak | Digital & Smart Analytics | SOA Predictive Analytics Symposium 2 0 1 7
Analytics Model: Sample predictors used from internal & external data sources
7
Sample Application Data
Gender
PlaceOfBirth
InsuranceAge
AlcoholAbuseFlag
Income
DrugAbuseFlag
BMI
BenefitTermLife
BenefitAmount to Income Ratio
…
…
US Data from 3rd party vendors
Medical Information Bureau (MIB)
Motor Vehicle Records (MVR)
Prescription History (Rx)
Sample Data from External Open Sources (CDC, ALA, etc.)
Tobacco-related data by State:
• Tobacco tax
• Smoking cessation spending per smoker
• Laws banning smoking in public spaces
• Number of tobacco retailers per 10K
• Smoking rates by county

Nitin Nayak | Digital & Smart Analytics | SOA Predictive Analytics Symposium 2 0 1 7
Analytics Model: Model’s prediction performance is good on several metrics
8
Performance Metrics Explained
Recall (R):What percent true-positives in the population are correctly identified?
Precis ion (P):What percent predicted positives are indeed true positives?
F-score (F): Useful metric for skewed class populationF = 2 *P*R / (P + R)
Area under ROC curve (AUC):Higher value (closer to 1 ) indicates good prediction performance
Prediction Model Details
Problem Type: Class ification
Machine Learning Techniques used:• GBM (best performance)• GLMNET (Logis tic regression)• Random Forest

Nitin Nayak | Digital & Smart Analytics | SOA Predictive Analytics Symposium 2 0 1 7
Triage using predictive analytics model supports fas t-track processing for majority of the applicants ( > 8 4 %)
9
Self-Declared Smoker
Smoker Rate
Declared NS
Self-Declared Non-Smoker
Non-Smoker Rate
Non-Smoker Rate
Predicted SmokerPredicted
Non-Smoker
Apply Predictive Model
Smoker Rate
PerformLab TestTested
SmokerTested
Non-Smoker
Fast Track( > 84%)
Business as usual( < 16%)
Life Insurance Application Details
No Lab TestLab Test Reqd.
Note: Tobacco Usage is only one aspect of the overall risk.

Nitin Nayak | Digital & Smart Analytics | SOA Predictive Analytics Symposium 2 0 1 7
Cost-Benefit: Calculator computes NPV of life product using predictive model and actuarial data
10
Actuarial Data
Prediction Model Results
Cost-Savings Calculator

Nitin Nayak | Digital & Smart Analytics | SOA Predictive Analytics Symposium 2 0 1 7
– For ages below 5 5 , Lab-test Savings > Mortality Costs results in positive NPV
– For ages 5 5 and beyond, Mortality Costs > Lab-test Savings results in negative NPV
11
-1.0
-0.5
0.0
0.5
1.0
1.5
2.0
<25 25-34 35-44 45-54 55-64 65-74 75-84 85+
Mill
ions
Costs, Savings, and Net Benefit (NPV) displayed by applicant’s Age (population = 100,000 applicants, product = term life with $100K face amount)
Cost Benefit NPV
Actuarial Data: Source-LMS US data on PV (Mortality Costs) based on age, insured amount, gender, product termCost Assumption: Lab testing cost $55 (does not include parameds)Note: Revenue impact of fast underwriting process is not included in calculations
Cost-Benefit:10 -year te rm life product for applicants be low age 5 5 and face amount < $ 10 0 K

Nitin Nayak | Digital & Smart Analytics | SOA Predictive Analytics Symposium 2017 12

Nitin Nayak | Digital & Smart Analytics | SOA Predictive Analytics Symposium 2017
Legal notice
13
©2017 Swiss Re. All rights reserved. You are not permitted to create any modifications or derivative works of this presentation or to use it for commercial or other public purposes without the prior written permission of Swiss Re.
The information and opinions contained in the presentation are provided as at the date of the presentation and are subject to change without notice. Although the information used was taken from reliable sources, Swiss Re does not accept any responsibility for the accuracy or comprehensiveness of the details given. All liability for the accuracy and completeness thereof or for any damage or loss resulting from the use of the information contained in this presentation is expressly excluded. Under no circumstances shall Swiss Re or its Group companies be liable for any financial or consequential loss relating to this presentation.

The Northwestern Mutual Life Insurance Company – Milwaukee, WI
RISK ASSESSMENT APPLICATIONS OF PREDICTIVE ANALYTICS
Jason Von Bergen, FSA, MAAA
September 14th, 2017

2
Digital Evolution of Risk Assessment
FROM TO
Paper questionnaires
Invasive paramedical exams
Multiple requests for records
Age/amount determined
Decision in weeks
Digital applications
Non-invasive
Real-time access to data
Customized
Decision in minutes or days

3
Enabling Factors to Accelerate Innovation
CustomerCentricity
Mortality & Expense Focus
DataAvailability
Advanced Analytics
Computational Capability
MORTALITY
EXPENSES INTEREST
Distinctive & customized experience
Mortality & morbidity
excellence
Holistic & prioritized approach

4
Business Motivations to Change
1
2
3
Customer Experience
Expense Savings
Future Optionality
• Enabling a rich digital experience• Solving today’s pain points
• Multi-million/yr. Home Office opportunity
• Rich data delivers insights• Insights drive design
Customers want a simple experience. We can deliver CX AND mortality excellence.
HUGE opportunity. We won’t trade class-level mortality loss for expense savings.
Risk class segmentation, product offerings / pricing, claims processes, etc.
4 Competitive Position
• Most others are doing something• InsureTech pushing boundaries
There is potential anti-selection risk in not offering anything.

5
What to Understand Before Beginning
Sources of Mortality Value Data & Modeling Philosophy & Process
• Mortality performance & drivers Including declines and
process drop-outs Connection w/
philosophy & process
• Quantified protective value studies
• State of current data
• Data change processes
• Modeling infrastructure & maturity
• Risk assessment philosophy compatibility w/ triage
• New Business & policy acquisition process Home Office &
distribution partnersMotivations & change
management
Program Goals & Constraints
• Are you willing to trade mortality for expenses?
• What differentiates you when data becomes commoditized?
6
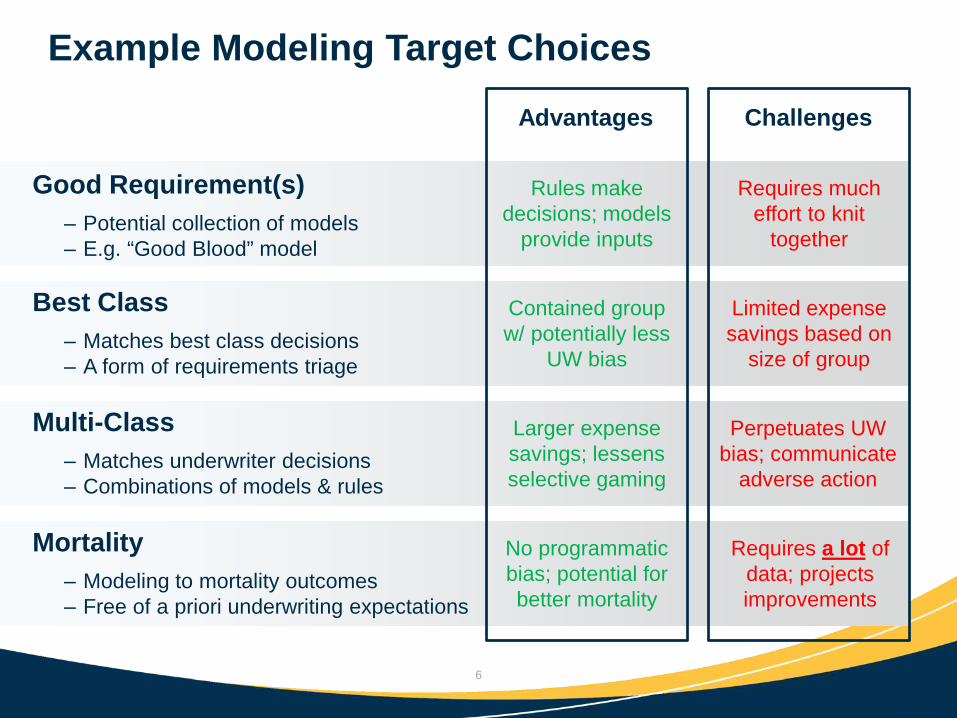
Example Modeling Target ChoicesAdvantages Challenges
Good Requirement(s)
Best Class
Multi-Class
Mortality
‒ Potential collection of models‒ E.g. “Good Blood” model
‒ Matches best class decisions‒ A form of requirements triage
‒ Matches underwriter decisions‒ Combinations of models & rules
‒ Modeling to mortality outcomes‒ Free of a priori underwriting expectations
Rules make decisions; models
provide inputs
Requires much effort to knit
together
Contained group w/ potentially less
UW bias
Limited expense savings based on
size of group
Larger expense savings; lessens selective gaming
Perpetuates UW bias; communicate
adverse action
No programmatic bias; potential for better mortality
Requires a lot of data; projects improvements

7
Data Runway & Experimentation
Application Data
Prior PolicyMIB
MVR Rx
Credit
EMRs
Lab Data
Social
Purchase • Which data elements are more/less relevant based on current protective value studies?
• How can you incorporate data in model target / methodology?
• How robust is the data – proven or still experimental?
• Will the data be used for accelerated UW only or also in traditional?
• What can the data be used for, i.e. any regulatory concerns?
Sensor
Genetic
8
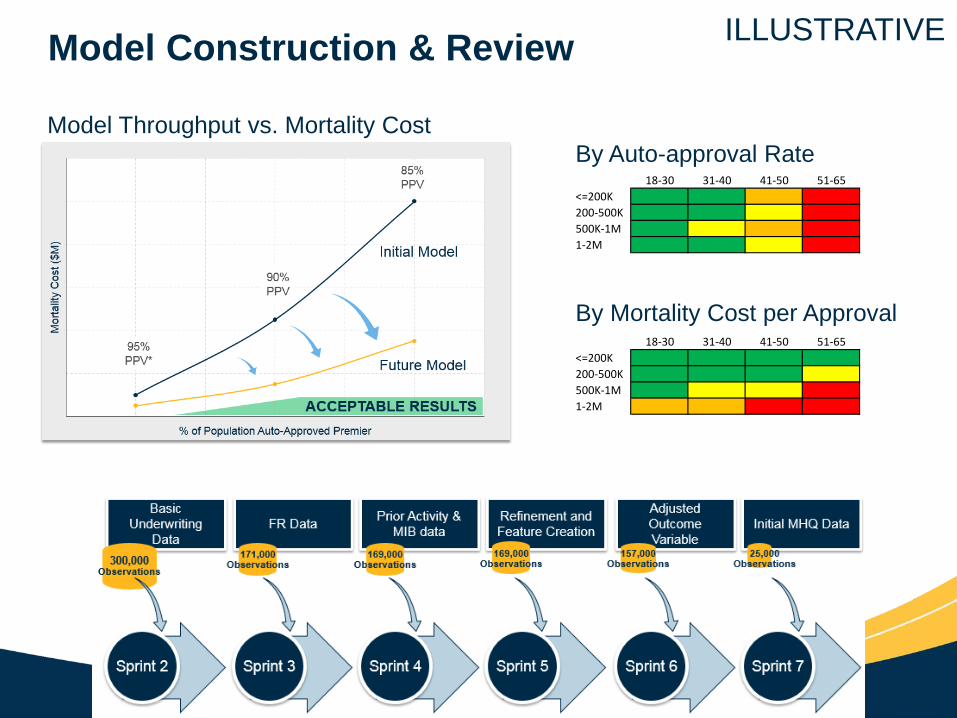
Model Construction & Review
18-30 31-40 41-50 51-65<=200K200-500K500K-1M1-2M
18-30 31-40 41-50 51-65<=200K200-500K500K-1M1-2M
ILLUSTRATIVE
Model Throughput vs. Mortality CostBy Auto-approval Rate
By Mortality Cost per Approval

9
Performance Reporting & Monitoring
• Weekly reporting of numbers of cases approved
• Monthly report with detailed break-down of model eligibility and throughput by age & amount
• Quarterly hold-out sample miss analysis – occurrence & severity
Accelerated Underwriting Performance Reporting
Model Monitoring Mechanisms
• Random hold-out sample (e.g. 10%)
• Post-issue APS or Rx scan to study
• Post-issue APS or Rx scan to rescind
• Beta testing with live data before release
How does this impact your desired client experience?

10
Lessons Learned
1. Create a data roadmap early on to identify priorities
2. Spend some time understanding data transformations during underwriting
3. Deep leadership by business experts speeds development and iterative delivery
4. Be flexible in development & deployment of the model
5. Engage underwriters early & oftento drive understanding
GET STARTED!
Resetting data to initial state can be
hard
Can’t effectively be led by IT
Model & rules & external optimization
Change management is slow