2017 sample costs to establish an orchard and produce walnuts · introduction sample costs to...
TRANSCRIPT

UNIVERSITY OF CALIFORNIA AGRICULTURE AND NATURAL RESOURCES COOPERATIVE EXTENSION
AGRICULTURAL ISSUES CENTER UC DAVIS DEPARTMENT OF AGRICULTURAL AND RESOURCE ECONOMICS
2017
SAMPLE COSTS TO ESTABLISH AN ORCHARD AND PRODUCE WALNUTS
SAN JOAQUIN VALLEY – NORTH Late leafing – lateral bearing
Joseph A. Grant UC Cooperative Extension Farm Advisor, San Joaquin County Janet L. Caprile UC Cooperative Extension Farm Advisor, Contra Costa County David A. Doll UC Cooperative Extension Farm Advisor, Merced County Jeremy Murdock Staff Research Associate, Department of Agricultural and Resource
Economics, UC Davis Daniel A. Sumner Director, University of California Agricultural Issues Center and Frank H. Buck, Jr. Professor, Department of Agricultural and
Resource Economics, University of California, Davis
Walnut Cost and Returns Study San Joaquin Valley North – 2017 UCCE, UC AIC, UC DAVIS-ARE 2
UC AGRICULTURE AND NATURAL RESOURCES COOPERATIVE EXTENSION
AGRICULTURAL ISSUES CENTER UC DAVIS DEPARTMENT OF AGRICULTURAL AND RESOURCE ECONOMICS
SAMPLE COSTS TO ESTABLISH AN ORCHARD AND PRODUCE WALNUTS
San Joaquin Valley North – 2017 Late Leafing – lateral bearing
CONTENTS
INTRODUCTION 2 ASSUMPTIONS 3 Establishment Cultural Practices and Material Inputs 3 Mature Orchard Cultural Practices and Material Inputs 5 Labor, Equipment, and Interest 7 Cash Overhead 8 Non-Cash Overhead 9 REFERENCES 11 Table 1. SAMPLE COSTS PER ACRE TO ESTABLISH A WALNUT ORCHARD 12 Table 2. COSTS PER ACRE TO PRODUCE WALNUTS 14 Table 3. COSTS AND RETURNS PER ACRE TO PRODUCE WALNUTS 16 Table 4. MONTHLY COSTS PER ACRE TO PRODUCE WALNUTS 18 Table 5. RANGING ANALYSIS – WALNUTS 19 Table 6. WHOLE FARM EQUIPMENT, INVESTMENT, AND BUSINESS OVERHEAD COSTS 20 Table 7. HOURLY EQUIPMENT COSTS 20 Table 8. WALNUT OPERATIONS WITH EQUIPMENT & MATERIAL INPUTS 21
INTRODUCTION Sample costs to establish a walnut orchard and produce walnuts under sprinkler irrigation in the northern San Joaquin Valley are presented in this study. Note that this study is intended as a guide only. It can be used to guide production decisions, estimate potential returns, prepare budgets and evaluate production loans. Sample costs given for labor, materials, equipment and contract services are based on July 2017 figures. Practices described are based on production practices considered typical for the crop and area, but will not apply to every situation. A blank column titled Your Costs is provided in Tables 2 and 3 to enter your estimated costs. For an explanation of calculations used in the study refer to the section titled Assumptions. For more information contact Jeremy Murdock, University of California Agriculture and Natural Resources, Agricultural Issues Center, Department of Agricultural and Resource Economics, at 530-752-4651 or [email protected]. The local extension office can be contacted through Joe Grant, [email protected], UCCE, San Joaquin County, David Doll, [email protected], UCCE, Merced County, or Janet Caprile, [email protected], UCCE, Contra Costa County. Sample Cost of Production studies for many commodities are available and can be downloaded from the website, http://coststudies.ucdavis.edu. Archived studies are also available on the website. Costs and Returns Study Program/Acknowledgements. A costs and returns study is a compilation of specific crop data collected from meetings with professionals working in production agriculture from the

Walnut Cost and Returns Study San Joaquin Valley North – 2017 UCCE, UC AIC, UC DAVIS-ARE 3
region the study is based. The authors thank the growers, input suppliers, and other industry representatives who provided information, assistance, and expert advice. The use of trade names and cultural practices in this report does not constitute an endorsement or recommendation by the University of California nor is any criticism implied by omission of other similar products or cultural practices. The University is an affirmative action/equal opportunity employer.
ASSUMPTIONS The following assumptions refer to Tables 1 to 8 and pertain to sample costs to establish an orchard and produce walnuts under sprinkler irrigation in the northern San Joaquin Valley. The cultural practices described represent production operations and materials considered typical for a well-managed farm in the region. Costs, materials, and practices in this study will not apply to all farms. Timing and types of cultural practices will vary among growers within the region and from season to season due to variables such as weather, soil, insect and disease pressure. Land. The hypothetical farm consists of 100 contiguous acres of land. Of that, 60 acres are being established to walnuts, 35 are planted to other permanent or annual crops, and five acres are roads, irrigation system and farmstead. The farm is managed by the owner.
Establishment Cultural Practices and Material Inputs
Site Preparation. The orchard is being established on land previously planted to walnuts. The land is assumed to be deep, well drained, and either a class I or II soil. Orchard removal is done by an orchard removal company in November and field cleanup following tree removal is done by the grower. During November and December, the field is ripped in six passes in which the roots (and irrigation pipe from the former orchard) are removed by the grower. Ripping begins at a two foot depth and gets progressively deeper, ending at 3.5 to 4.5 feet. Some of the passes might be deferred to late spring (after grain/grass crop) if rains come early and/or the soil is too wet. A winter grain/grass crop is grown on the field during December to June. It is assumed that this will yield a zero net cost, therefore no cost is shown. The field is ripped to six feet deep in July, disked three times and landplaned in August. Berms are made in September and the field fumigated in September. All operations preparing the orchard for planting are done in the years prior to planting, but costs are shown in the first year. Trees. The walnut trees are a late leafing, lateral bearing variety. The ¾ inch caliber nursery grafted trees on Paradox rootstock are planted on 24 X 24 foot spacing, resulting in 76 trees per acre. The economic life of the orchard is estimated to be 25 years. Planting. Planting in the early spring (February) starts by marking tree sites then digging holes and planting. This study assumes hand rather than machine planting. After or at planting, the trees are topped, the trunks are treated with white, water-based latex paint to protect the trees from sunburn and the trees are staked with ten-foot stakes. In the second year, 2 percent of the trees or an average of 1.5 trees per acre are replanted. Pruning. New trees are topped at planting or soon thereafter so that trunk development is encouraged. During the first year, the trunk is tied to the stake to prevent it from breaking, growing crooked or leaning. Trees are pruned annually during the winter in years one through seven to develop the permanent structural framework of the trees. Pruning costs in years one and two include winter pruning, and summer pruning to train the tree trunk, to prevent shoot breakage and to remove rootstock suckers and other

Walnut Cost and Returns Study San Joaquin Valley North – 2017 UCCE, UC AIC, UC DAVIS-ARE 4
unwanted growth. Suckering is done 3 to 4 times per season (May – July) during the first two years. Orchard prunings are stacked, chipped or shredded by a custom operator, in every fourth middle in the third year, alternate middles during the fourth and fifth year and all middles thereafter. Irrigation. Water is pumped from a well and passes through a filtration system to the full coverage sprinkler system. This study assumes that a well and pump existing from the former orchard required refurbishing to meet the water demands and pressure requirements of the new orchard. Refurbishing costs include inspection of the well, replacement of the motor and pump, upgrading of the electrical service, and installation of new filters. The orchard is irrigated from late-April to mid-September. The first irrigation event should be no earlier than late-April, except for the year that the orchard is planted. Price per acre-foot for water will vary among orchards in this region depending on the various well characteristics, irrigation district, and other factors. Water is calculated to cost $7.50 per acre-inch ($90 per acre-foot). The amount of water applied to the orchard during the establishment period is shown in Table A. Fertilization. Nitrogen (N) is the major nutrient required for proper tree growth and optimum yields. During the first two years, 15-15-15 is applied by hand around the base of the young tree, once in March and once in June or July. Beginning in the third year, nitrogen fertilizer as UAN-32 is injected through the sprinkler system from April to late July/early August. Annual rates of actual N are shown in Table B. Tissue Testing. Beginning in the third year, leaf samples at one sample per 20 acres are taken by the PCA in July for tissue analysis to determine nutrient status. The cost shown are for the lab analysis. Pest Management. The pesticides and rates mentioned in this cost study are listed in UC Integrated Pest Management Guidelines, Walnuts. See the Integrated Pest Management (IPM) website http://ipm.ucdavis.edu for other materials available. Fumigation. Prior to removal of the previous orchard, the orchard site soil is sampled (1 sample/20 acres) and if nematodes injurious to walnuts are found to be present, the site will be fumigated. Pre-plant fumigation may not be necessary on bare or row crop ground, but is often necessary where orchards follow orchards. Telone II, a soil fumigant, is applied as a broadcast treatment at a rate of 33.7 gallons per acre. This will treat the entire orchard, 100 percent of the ground. After the broadcast application, chloropicrin is applied down the tree rows (11 ft) at a rate of 200 lbs/treated acre. Application costs including materials are approximately $1,400 per acre. The above rates are effective on light textured soils when the soils are properly ripped and dried prior to fumigation. Heavier textured soils may need additional efforts to dry and prepare the soil if the fumigation is to be effective. Contact your local farm advisor for more information about fumigation. Weeds (Orchard Floor Management). Beginning in the first year, pre-emergent and post-emergent herbicide applications are made under the tree rows (strip spray) in the fall (November) and again in spring (March). These treatments cover one-fourth of the orchard floor. Prior to the fall herbicide application a pass is made with a blower/sweeper to remove debris from the berm. This prevents the pre-
Table B. Applied Nitrogen Per Acre Year Lbs N
1 10 2 25 3 50 4 75 5 100 6 150
7+ 200
Table A. Annual Applied Water Year Acre-Inches
1 20 2 20
3-5 36 6+ 42
Walnut Cost and Returns Study San Joaquin Valley North – 2017 UCCE, UC AIC, UC DAVIS-ARE 5
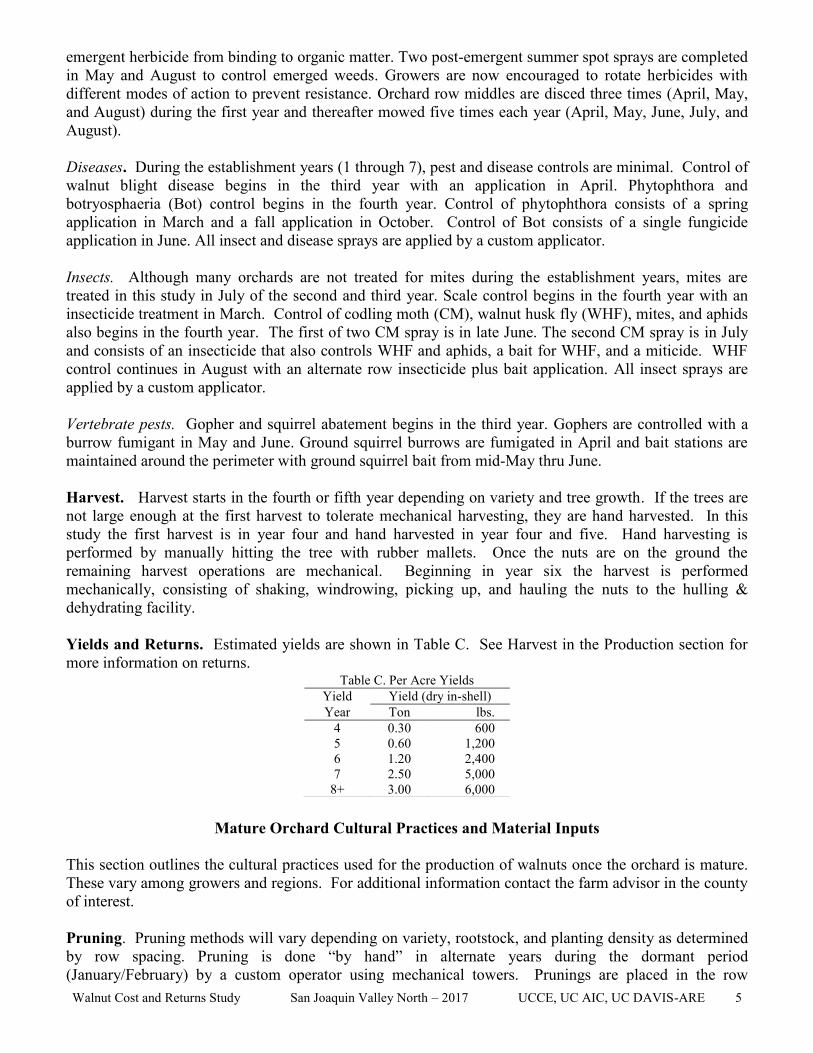
emergent herbicide from binding to organic matter. Two post-emergent summer spot sprays are completed in May and August to control emerged weeds. Growers are now encouraged to rotate herbicides with different modes of action to prevent resistance. Orchard row middles are disced three times (April, May, and August) during the first year and thereafter mowed five times each year (April, May, June, July, and August). Diseases. During the establishment years (1 through 7), pest and disease controls are minimal. Control of walnut blight disease begins in the third year with an application in April. Phytophthora and botryosphaeria (Bot) control begins in the fourth year. Control of phytophthora consists of a spring application in March and a fall application in October. Control of Bot consists of a single fungicide application in June. All insect and disease sprays are applied by a custom applicator. Insects. Although many orchards are not treated for mites during the establishment years, mites are treated in this study in July of the second and third year. Scale control begins in the fourth year with an insecticide treatment in March. Control of codling moth (CM), walnut husk fly (WHF), mites, and aphids also begins in the fourth year. The first of two CM spray is in late June. The second CM spray is in July and consists of an insecticide that also controls WHF and aphids, a bait for WHF, and a miticide. WHF control continues in August with an alternate row insecticide plus bait application. All insect sprays are applied by a custom applicator. Vertebrate pests. Gopher and squirrel abatement begins in the third year. Gophers are controlled with a burrow fumigant in May and June. Ground squirrel burrows are fumigated in April and bait stations are maintained around the perimeter with ground squirrel bait from mid-May thru June. Harvest. Harvest starts in the fourth or fifth year depending on variety and tree growth. If the trees are not large enough at the first harvest to tolerate mechanical harvesting, they are hand harvested. In this study the first harvest is in year four and hand harvested in year four and five. Hand harvesting is performed by manually hitting the tree with rubber mallets. Once the nuts are on the ground the remaining harvest operations are mechanical. Beginning in year six the harvest is performed mechanically, consisting of shaking, windrowing, picking up, and hauling the nuts to the hulling & dehydrating facility. Yields and Returns. Estimated yields are shown in Table C. See Harvest in the Production section for more information on returns.
Mature Orchard Cultural Practices and Material Inputs This section outlines the cultural practices used for the production of walnuts once the orchard is mature. These vary among growers and regions. For additional information contact the farm advisor in the county of interest. Pruning. Pruning methods will vary depending on variety, rootstock, and planting density as determined by row spacing. Pruning is done “by hand” in alternate years during the dormant period (January/February) by a custom operator using mechanical towers. Prunings are placed in the row
Table C. Per Acre Yields Yield Yield (dry in-shell) Year Ton lbs.
4 0.30 600 5 0.60 1,200 6 1.20 2,400 7 2.50 5,000
8+ 3.00 6,000

Walnut Cost and Returns Study San Joaquin Valley North – 2017 UCCE, UC AIC, UC DAVIS-ARE 6
middles and chipped or shredded by a custom operator. One-half of the cost of the pruning, stacking and shredding is charged to the operation each year. Irrigation. Irrigation costs include pumping (water) and labor costs. The water is pumped from a well and passes through a filtration system and fed into the full coverage sprinkler system. Forty-two acre- inches of water are applied from mid-April to mid-September. Although not shown in this study, a post-harvest irrigation may be needed from late September through October. Irrigations will vary according to tree size and soil type. A water pumping cost of $7.50 per acre inch is based on current PG&E rates. Tensiometers, water budgeting using evapotranspiration estimates, stem water potential measurements, or other established methods are used to monitor orchard water status and schedule irrigations. The monitoring may be done by the grower or by a private irrigation consultant. The monitoring is done by the grower at no additional cost. Labor is calculated at 0.06 hours per irrigation and includes time for maintaining the lines. Fertilization. Beginning with the first irrigation, a total of 200 pounds of nitrogen per season as UAN-32 is injected through the sprinklers from April to late July/early August. Labor costs for the fertilizer applications are included in the irrigation costs. Fertilizer rates should be adjusted according to need as indicated by leaf analysis results. Tissue Testing. Leaf samples are taken in July by the PCA at one sample per 20 acres for tissue analysis to determine nutrient status. The cost shown is for the lab analysis. Pest Management. The pesticides and rates mentioned in this cost study are listed in Integrated Pest Management for Walnuts and UC Pest Management Guidelines. Pesticides mentioned in this study are not recommendations, but those commonly used in the region. For information and pesticide use permits, contact the local county Agricultural Commissioner’s office. For information on other pesticides available, pest identification, monitoring, and management, visit the UC IPM website at www.ipm.ucdavis.edu. Pest control costs can vary considerably each year depending upon local conditions and pest populations in any given year. Adjuvants are recommended for many pesticides for effective control and are not included as a cost in this study. Pest Control Adviser (PCA). Written recommendations are required for many pesticides and are available from licensed pest control or certified crop advisers. In addition the PCA or an independent consultant will monitor the field during the growing season for fertilizer recommendations. Growers may hire a private PCA or receive the service as part of a service agreement with an agricultural chemical and fertilizer company. In this study, the grower has a full service agreement with a company. Weeds (Orchard Floor Management). Weeds are controlled in the tree row with pre-emergent and post-emergent strip sprays in the fall (November) and again in the spring (Mid-March). A pass with the blower/sweeper is necessary to remove debris from the berms prior to the application in November. This prevents pre-emergent herbicides from binding to organic matter. A post-emergent material is applied in May and August as a spot spray to control emerging weeds that were not controlled by the previous sprays. A pre-harvest herbicide application is also made in July. The row middles are mowed five times, once per month from April to August. Mowing the vegetation in the row middles in April also provides frost protection. Winter cover crops can be planted in the row middles in fall and mowed in the spring, but this practice and the associated costs are not included in this study. Insects. Several insect pests are treated each year. Insect and disease applications are done by a custom operator. Multiple generations of codling moth occur and are controlled with carefully timed sprays based on developmental models and population monitoring. A first seasonal treatment for codling moth is applied in late June. A second spray for codling moth is made in mid-July. This spray consists of an

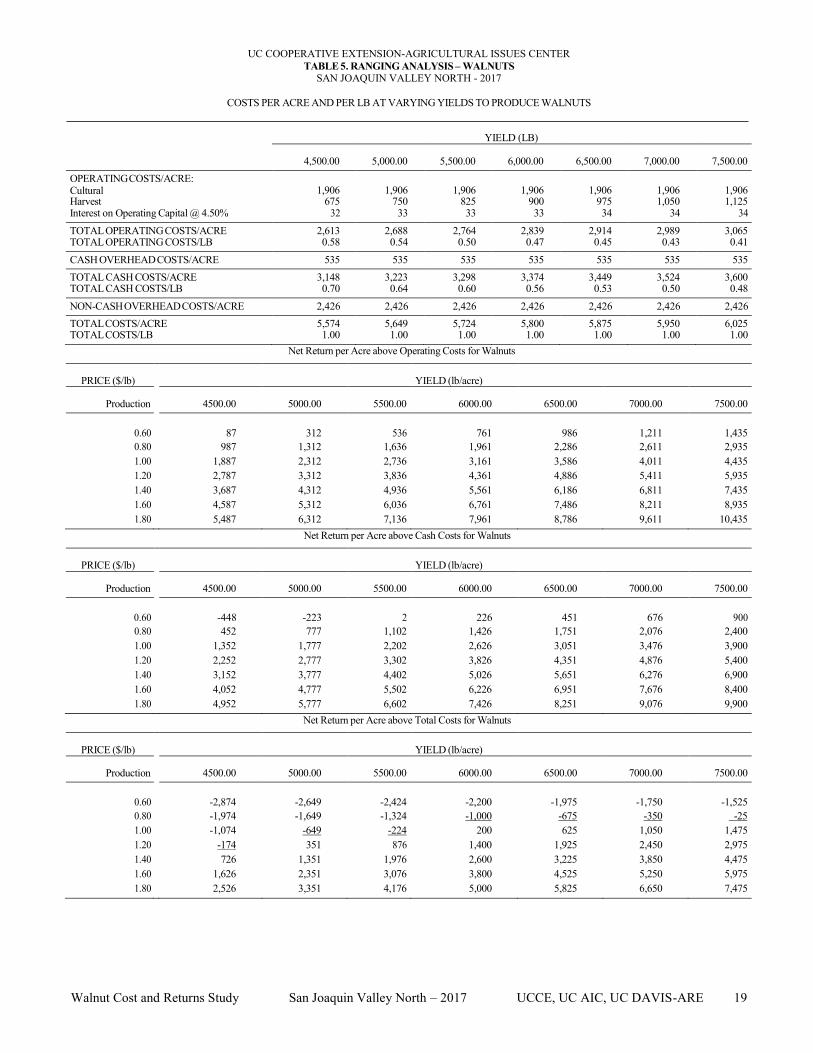
Walnut Cost and Returns Study San Joaquin Valley North – 2017 UCCE, UC AIC, UC DAVIS-ARE 7
insecticide that controls walnut husk fly (WHF) and walnut aphid, a bait for WHF, and a miticide. WHF control continues with an alternate row insecticide plus bait sprays in August. Scale is controlled with a single insecticide treatment in March. Disease. Walnut blight disease is controlled with a single pesticide application in April. Phytophthora is controlled with two pesticide applications; a spring application in March and a fall application in October. Botryosphaeria is controlled with a single fungicide application in June. All disease sprays are applied by a custom applicator. Vertebrate pests. Gophers are controlled with a burrow fumigant beginning in May and June of the third year. Ground squirrel burrows are fumigated in April and bait stations are maintained around the perimeter with ground squirrel bait from mid-May thru June. Harvest. The crop is harvested (shaken, windrowed, raked, and picked up) and hauled by a contracted custom harvesting operation. The orchard is harvested once. The grower pays the hulling and dehydrating costs. Mechanical harvesting begins by shaking the tree trunk or branches to remove the walnuts. Sweepers windrow the walnuts in the orchard middles so that the pick-up machine can gather and dump them into trailers. Hand labor for raking nuts from around the trees missed by the sweeper is included in the custom harvest. The walnuts are hauled from the orchard to a hulling and dehydrating facility. Yields. Typical annual yields for Walnut varieties are measured in clean, dry, in-shell tons or pounds per acre and are shown in Table C. The average yield over the life of the orchard in this study is 6,000 pounds. Returns. Actual price depends on a number of factors such as demand, crop size, variety, nut size, and quality. An estimated price of $1.20 per dehydrated in-shell pound is used in this study. Ranging Analysis. Table 5 has a range of return prices used for calculating net returns per acre with different yields. For this analysis, crop yields ranged from 4,500 to 7,500 pounds per acre and crop prices ranged from $0.60 to $1.80 per ton. Assessments. Under state law, the California Walnut Commission (CWC) collects mandatory assessment fees from growers to pay for walnut related activities. The CWC assessment for the 2017 crop year is $0.01 per pound of in-shell nuts. The California Walnut Board (CWB) collects an assessment fee from walnut handlers. The CWB handler assessment for 2017 is $0.0465 per pound of shelled nuts. The CWB assessment is not included in this study because it is not paid by the grower. Pickup/ATV-Mule. The study assumes pickup business use mileage of two hours per acre per year for the farm. The ATV-Mule use for checking the orchard, diseases and irrigation system are shown as a line item. The travel and time for the pickup and ATV-Mule are estimated and not taken from any specific data.
Labor, Equipment, and Interest
Labor. Hourly wages for workers are $15.50 for machine operators and $11.00 per hour non-machine labor. Adding 39 percent for the employers’ share of federal and state payroll taxes, insurance, and other possible benefits gives the labor rates shown of $21.55 and $15.29 per hour for machine labor and non-machine labor, respectively. The overhead includes the employer’s share of federal and California state payroll taxes, workers’ compensation insurance for orchards and a percentage for other possible benefits. Workers’ compensation insurance costs will vary among growers. The cost is based on the average

Walnut Cost and Returns Study San Joaquin Valley North – 2017 UCCE, UC AIC, UC DAVIS-ARE 8
industry rate as of January, 2017. Labor for operations involving machinery are 20 percent higher than the operation time given in Table 2 to account for the extra labor involved in equipment set up, moving, maintenance, work breaks, and field repair. Equipment Operating Costs. Repair costs are based on purchase price, annual hours of use, total hours of life, and repair coefficients formulated by American Society of Agricultural and Biological Engineers (ASABE). Fuel and lubrication costs are also determined by ASABE equations based on maximum power takeoff (PTO) horsepower, and fuel type. Average prices for on-farm delivery of diesel and gasoline based on July 2017 data from the Energy Information Administration are $2.92 and $3.18 per gallon, respectively. The cost includes a 9.25 percent sales tax, a $0.16/gal excise tax on diesel fuel, a 2.25% sales tax, and a $0.28/gal excise tax on gasoline. It is noted that federal and state excise taxes are refundable for on-farm use when filing the farm income tax return. Fuel, Lube & Repair. The fuel, lube, and repair cost per acre for each operation in Table 2 is determined by multiplying the total hourly operating cost in Table 7 for each piece of equipment used for the selected operation by the hours per acre. Tractor time is 10 percent higher than implement time for a given operation to account for setup, travel and down time. Interest on Operating Capital. Interest on operating capital is based on cash operating costs and is calculated monthly until harvest at a nominal rate of 4.50 percent per year. A nominal interest rate is the typical market cost of borrowed funds. The interest cost of post-harvest operations is discounted back to the last harvest month using a negative interest charge. The rate will vary depending upon various factors, but the rate is considered a typical lending rate by a farm lending agency as of January 2017. Risk. The risks associated with crop production should not be underestimated. While this study makes every effort to model a production system based on typical, real world practices, it cannot fully represent financial, agronomic and market risks, which affect profitability and economic viability of walnut production. Because of so many potential risk factors, effective risk management must combine specific tactics in a detailed manner, in various combinations for a sustainable operation. Moreover, Table 5 of this study reflects a ranging analysis of returns based on various assumptions which is therefore hypothetical in nature. It is important to realize that actual results may differ from the returns contained in this study. Any returns above total costs are considered returns on risk and investment to management, (or owners).
Cash Overhead
Cash overhead consists of various cash expenses paid out during the year that are assigned to the whole farm and not to a particular operation. These costs can include property taxes, interest on operating capital, office expense, liability and property insurance, sanitation services, equipment repairs, and management. Property Taxes. Counties charge a base property tax rate of 1 percent on the assessed value of the property. In some counties special assessment districts exist and charge additional taxes on property including equipment, buildings, and improvements. For this study, county taxes are calculated as 1 percent of the average value of the property. Insurance. Insurance for farm investments varies depending on the assets included and the amount of coverage. Property Insurance. This provides coverage for property loss and is charged at 0.846 percent of the average value of the assets over their useful life.

Walnut Cost and Returns Study San Joaquin Valley North – 2017 UCCE, UC AIC, UC DAVIS-ARE 9
Liability Insurance. A standard farm liability insurance policy will help cover the expenses for which you become legally obligated to pay for bodily injury claims on your property and damages to another person’s property as a result of a covered accident. Common liability expenses covered under your policy include attorney fees and court costs, medical expenses for people injured on your property, injury or damage to another’s property. In this study, liability insurance costs $640 for the entire farm or $6.40 per acre. Office Expense. Office and business expenses are estimated at $75 per acre. These expenses include office supplies, telephones, bookkeeping, accounting, shop and office utilities, and miscellaneous administrative charges. Regulatory Costs. Various environmental fees are collected by the county and state. The fees will vary by county. For example the Air Resources Board (state agency) charges $100 per plan to deal with air pollution and the Ag Waiver Fee (county agency) cost $2.00 per acre. The grower must also provide safety training, safety equipment, and maintain training records. A cost of $5.26 per producing acre or $500 for the farm is shown. This includes an annual coliform test of the well water at a cost of $22.00. Sanitation Services. Sanitation services provide portable single toilet units with washing facilities for the orchard and cost the farm (orchard) $300 annually. The cost includes delivery and two months of weekly service. Management/Supervisor Wages. Wages for management are not included as a cash cost. Returns above total costs are considered a return to management and risk. Investment Repairs. Annual maintenance/repairs on investments (Non-cash Overhead) is calculated as two percent of the purchase price, except for tree replacement in the orchard. The average tree replacement cost over the life of the orchard is assumed to be 0.10 percent of the establishment cost.
Non-Cash Overhead
Non-cash overhead is calculated as the capital recovery cost for equipment and other farm investments. Capital Recovery Costs. Capital recovery cost is the annual depreciation and interest costs for a capital investment. It is the amount of money required each year to recover the difference between the purchase price and salvage value (unrecovered capital). It is equivalent to the annual payment on a loan for the investment with the down payment equal to the discounted salvage value. This is a more complex method of calculating ownership costs than straight-line depreciation and opportunity costs, but more accurately represents the annual costs of ownership because it takes the time value of money into account (Boehlje and Eidman). The formula for the calculation of the annual capital recovery costs is ((Purchase Price – Salvage Value) x Capital Recovery Factor) + (Salvage Value x Interest Rate). Salvage Value. Salvage value is an estimate of the remaining value of an investment at the end of its useful life. For farm machinery (tractors and implements) the remaining value is a percentage of the new cost of the investment (Boehlje and Eidman). The percent remaining value is calculated from equations developed by the American Society of Agricultural and Biological Engineers (ASABE) based on equipment type and years of life. The life in years is estimated by dividing the wearout life, as given by ASABE by the annual hours of use in this operation. For other investments including irrigation systems, buildings, and miscellaneous equipment, the value at the end of its useful life is zero. The salvage value for land is the purchase price because land does not depreciate. The purchase price and salvage value for equipment and investments are shown in Table 7.

Walnut Cost and Returns Study San Joaquin Valley North – 2017 UCCE, UC AIC, UC DAVIS-ARE 10
Capital Recovery Factor. Capital recovery factor is the amortization factor or annual payment whose present value at compound interest is 1. The amortization factor is a table value that corresponds to the interest rate used and the life of the machine. Interest Rate. An interest rate of 5.00 percent is used to calculate capital recovery. The rate will vary depending upon loan amount and other lending agency conditions, but is the basic suggested rate by a farm lending agency as of January 2017. Land Value. Bare crop land for walnut production is estimated to cost $24,000. Values will vary according to soil type and water source. For this study, the producing acreage estimated worth is; $35,771 per acre. It is the crop value plus the establishment cost ($24,000 + $11,771). Sprinkler Irrigation System. The sprinkler system is a full coverage system using Nelson Rotator® R2000 sprinklers with buried PVC laterals. The system is installed in the tree row on the 60 walnut acres and includes a filtration/injection system located near the pumping plant. Irrigation Pumping System. The 200 foot deep well with a pumping level at 125 – 150 feet on the site and a 125 horsepower pump to irrigate the 60 acres was refurbished at a cost of $70,000 (from local well/pump company). Refurbishing costs include inspection of the well, replacement of the motor and pump, upgrading of the electrical service, and installation of new filters. Fuel Tanks. Two 500-gallon fuel tanks are placed on stands in cement containment meeting Federal, State, and local regulations. Fuel is delivered to the equipment by gravity feed. Tools. Includes shop tools/equipment, hand tools and field tools such as pruning equipment. Establishment Cost. Costs to establish the orchard are used to determine the non-cash overhead expenses, capital recovery, and interest on investment for the production years. The establishment cost is the sum of cash costs for land preparation, planting, trees, production expenses, and cash overhead for growing walnut trees through the first year nuts are harvested less returns from production. The Accumulated Net Cash Cost in the fourth year shown in Table 1 represents the establishment cost per acre. For this study, this cost is $11,771 per acre or $706,260 for the 60-acre orchard. Establishment cost is amortized beginning in the fifth year over the remaining 21 years of production. Tree replacement or repair is based on 0.10 percent of the establishment cost. Equipment. Farm equipment is purchased new or used, but the study shows the current purchase price for new equipment. The new purchase price is adjusted to 60 percent to indicate a mix of new and used equipment. Annual ownership costs for equipment and other investments are shown in Table 6. Equipment costs are composed of three parts: non-cash overhead, cash overhead, and operating costs. Both of the overhead factors have been discussed in previous sections. The operating costs consist of repairs, fuel, and lubrication and are discussed under operating costs. Table Values. Due to rounding, the totals may be slightly different from the sum of the components.

Walnut Cost and Returns Study San Joaquin Valley North – 2017 UCCE, UC AIC, UC DAVIS-ARE 11
REFERENCES American Society of Agricultural and Biological Engineers (ASABE). 2013 ASABE Standards Book with 2015 Standards Supplement. St. Joseph, MI: Curran Associates, Inc., 2015. Boehlje, Michael D., and Vernon R. Eidman. Farm Management. New York: John Wiley and Sons, 1984. California Chapter of the American Society of Farm Managers and Rural Appraisers. Trends in Agricultural Land & Lease Values. Woodbridge, CA: American Society of Farm Managers and Rural Appraisers, 2016.
“Economic Research Service – Publications.” United States Department of Agriculture. www.ers.usda.gov/data-products.aspx. Grant, Joseph A., Kathleen M. Kelly-Anderson, Janet L. Caprile, David Doll, Karen M. Klonsky and Richard L. De Moura. “Sample Costs to Establish a Walnut Orchard and Produce Walnuts. Northern San Joaquin Valley- 2013”. UC Davis Cost Studies. http://coststudies.ucdavis.edu/en/current/. “Identify and Manage Pests in Crops and Agriculture.” University of California Statewide Integrated Pest Management Program. http://www.ipm.ucdavis.edu/PMG/crops-agriculture.html. “National Agricultural Statistics Service.” United States Department of Agriculture. www.nass.usda.gov/Quick_Stats/. “Tax Rates for Motor Vehicle and Diesel Fuels.” California State Board of Equalization. Last modified May 2015. http://www.boe.ca.gov/pdf/l413.pdf. University of California Statewide Integrated Pest Management Program. UC Pest Management Guidelines, Walnuts. University of California, Davis, CA., 2011. http://www.ipm.ucdavis.edu University of California. Integrated Pest Management for Walnuts. 2nd ed. Pub. 3270. Oakland, CA. University of California, Division of Agriculture and Natural Resources, 1987. University of California. Walnut Production Manual. Pub. 3373. Oakland, CA. University of California, Division of Agriculture and Natural Resources, 1998. “U.S. Gasoline and Diesel Retail Prices.” U.S. Energy Information Administration (EIA). Last modified April 2016. https://www.eia.gov/dnav/pet/pet_pri_gnd_dcus_nus_m.htm.

Walnut Cost and Returns Study San Joaquin Valley North – 2017 UCCE, UC AIC, UC DAVIS-ARE 12
UC COOPERATIVE EXTENSION-AGRICULTURAL ISSUES CENTER TABLE 1. SAMPLE COSTS PER ACRE TO ESTABLISH A WALNUT ORCHARD
SAN JOAQUIN VALLEY NORTH – 2017
Cost Per Acre Year: 1st 2nd 3rd 4th 5th 6th 7th
Yield: Pounds Per Acre: 600 1,200 2,400 5,000 Pre-Plant Costs:
Orchard Removal (includes woodchip removal) 750 Fumigation: Nematode Sample (1/20 acres) 2 Subsoil 6X (field cleanup, root & pipe removal) 1,200 Level/seed bed preparation for cover crop 70 Dec – June (grain/grass grows) (no costs shown)
Subsoil/Rip to 6 ft. depth 300 Disc 3X & landplane 100 Make Berms 30 Fumigation: Broadcast (Telone) & 11’ Tree rows (Chloropicrin) 1,400
Irrigation System Installation 350
TOTAL PRE-PLANT COSTS 4,202 Planting Costs: Survey, Mark, Dig Holes & Plant (includes 76 trees) 1,577 31
Head, Stake & Paint Trees (includes stakes) 232 3 TOTAL PLANTING COSTS 1,809 34
Cultural Costs: Prune/Sucker: (Yrs. 1-2, prune & sucker, Yrs. 3+, prune) (Yr. 7- alternate years) 141 20 60 70 70 70 70
Fertilize: Hand applied (15-15-15) Yr. 1-2. Injected through sprinklers (UAN) Yr. 3+ 57 99 30 45 60 90 120 Irrigate: (water & labor) (fertigation labor included) 168 168 288 288 288 333 333 Well Test/ Water Test (including coliform test) 4 4 4 4 4 4 4 Weed: Spring Strip Spray (Prowl, Roundup) 29 29 29 29 29 29 29 Weed: Disc 3X (Yr. 1) Mow 5X (Yr. 2+) 20 46 46 46 46 46 46 Weed: Summer Spot Spray 2X (Roundup, Treevix, MSO) 73 73 73 73 73 73 73 Weed: Pre-Harvest Strip Spray (Roundup, Goal 2XL) 28 28 28 28 Remove Debris from Berm with Blower/Sweeper 5 5 5 5 Weed: Fall Strip Spray (Matrix, Alion, Roundup) 85 85 85 85 85 85 85 Insect: Mites (Zeal)
76 76
Vertebrate: Ground squirrels (Weevil-Cide in burrows)
4 4 4 4 4 Vertebrate: Ground squirrels (baited traps)
25 25 25 25 25
Vertebrate: Gophers (Weevil-Cide)
11 11 11 11 11 Disease: Walnut blight (Kocide, Manex, Zinc Sulfate)
136 136 136 136 136
Disease: Phytophthora (K-Phite) 2X 97 97 97 97 Disease: Botryosphaeria (Pristine) 84 84 84 84 Leaf samples/Tissue Analysis
3 3 3 3 3
Prune: Stack & shred prunings (4th middle) Yr. 3. (alternate) Yr. 4-5. (all middles) Yr. 6+.
50 60 60 120 120 Insect: Scale (Seize 35 WP)
72 72 72 72
Insect: Codling Moth (Altacor)
76 76 76 76 Insect: Walnut Husk Fly, Codling Moth, Aphids, Mites (Assail, NuLure, Onager)
210 210 210 210
Insect: Walnut Husk Fly (Assail) (alternate rows)
114 114 114 114 ATV use 28 28 28 28 28 28 28 Pickup use 73 73 73 73 73 73 73 TOTAL CULTURAL COSTS 678 701 1021 1,666 1,681 1,816 1,846 Harvest Costs:
Shake, pick, sweep, haul
45 90 180 350 Dry and Hull
42 84 168 350
California Walnut Commission Assessment
6 12 24 50 TOTAL HARVEST COSTS 93 186 372 750 Interest On Operating Capital @ 4.50% 393 15 23 24 25 29 30 TOTAL OPERATING COSTS/ACRE 7,082 750 1,044 1,783 1,892 2,217 2,626

Walnut Cost and Returns Study San Joaquin Valley North – 2017 UCCE, UC AIC, UC DAVIS-ARE 13
UC COOPERATIVE EXTENSION-AGRICULTURAL ISSUES CENTER TABLE 1. CONTINUED
SAN JOAQUIN VALLEY NORTH – 2017
Cost Per Acre Year: 1st 2nd 3rd 4th 5th 6th 7th
Yield: Pounds Per Acre: 600 1,200 2,400 5,000 Cash Overhead Costs:
Office Expense 75 75 75 75 75 75 75 Liability Insurance 6 6 6 6 6 6 6 Sanitation Service 5 5 5 5 5 5 5 Regulatory Fees 5 5 5 5 5 5 5 Property Taxes 262 262 262 262 321 321 321 Property Insurance 22 22 22 22 27 27 27 Investment Repairs 83 83 83 83 95 95 95 TOTAL CASH OVERHEAD COSTS 458 458 458 458 534 534 534 TOTAL CASH COSTS/ACRE 7,540 1,208 1,502 2,241 2,426 2,751 3,160 INCOME/ACRE FROM PRODUCTION 720 1,440 2,880 6,000 NET CASH COSTS/ACRE FOR THE YEAR 7,540 1,208 1,502 1,521 986
PROFIT/ACRE ABOVE CASH COSTS 129 2,840 ACCUMULATED NET CASH COSTS/ACRE 7,540 8,748 10,250 11,771 12,757 12,628 9,788 Non-Cash Overhead Costs (Capital Recovery)
Buildings (2400 sq. ft.) 55 55 55 55 55 55 55 Fuel Tanks: 2-500 Gallon 11 11 11 11 11 11 11 Solid Set Sprinkler System with Filter 118 118 118 118 118 118 118 Pump/Well 76 76 76 76 76 76 76 Land 1200 1200 1200 1200 1200 1200 1200 Shop/Field Tools 14 14 14 14 14 14 14 Bait Stations (60)
2 2 2 2 2
Equipment 25 28 28 31 31 31 31 Orchard Establishment 918 918 918 TOTAL CAPITAL RECOVERY 1499 1,502 1,504 1,507 2,425 2,425 2,425 TOTAL COST/ACRE FOR THE YEAR 9,039 2,710 3,006 3,748 4,851 5,176 5,585 INCOME/ACRE FROM PRODUCTION 720 1,440 2,880 6,000 TOTAL NET COST/ACRE FOR THE YEAR 9,039 2,710 3,006 3,028 3,411 2,296 NET PROFIT/ACRE ABOVE TOTAL COST 415 TOTAL ACCUMULATED NET COST/ACRE 9,039 11,749 14,755 17,783 21,194 23,490 23,075

Walnut Cost and Returns Study San Joaquin Valley North – 2017 UCCE, UC AIC, UC DAVIS-ARE 14
UC COOPERATIVE EXTENSION-AGRICULTURAL ISSUES CENTER TABLE 2. COSTS PER ACRE TO PRODUCE WALNUTS
SAN JOAQUIN VALLEY NORTH – 2017
Operation Cash and Labor Costs per Acre
Operation Time
(Hrs/A) Labor
Cost Fuel Lube
& Repairs Material
Cost Custom/
Rent Total Cost
Your Cost
Cultural: Well & Water Test (includes Coliform Test) 0.00 0 0 0 0 4 4 Pruning: Alt. Year (half of cost shown) 0.00 0 0 0 0 130 130 Pruning: Stack and Shred (Alt. Years) 0.00 0 0 0 0 120 120 Disease: Scale 0.00 0 0 0 47 25 72 Weeds: Spring Strip Spray 0.18 5 0 0 23 0 29 Irrigate 10X 0.00 18 0 0 315 0 333 Disease: Phytophthora 2X 0.00 0 0 0 47 50 97 Ground Squirrels: Weevil-Cide in Burrows 0.00 3 0 0 1 0 4 Fertigate: UAN-32 0.00 0 0 0 120 0 120 Weeds: Mow Middles 5X 0.92 24 13 9 0 0 46 Disease: Blight 0.00 0 0 0 111 25 136 Weeds: Summer Spot Spray 2X 0.36 9 0 1 63 0 73 Gophers: Weevil-Cide 0.00 8 0 0 3 0 11 Ground Squirrels: Bait Traps 0.00 5 0 0 21 0 25 Insects: Codling Moth (CM) 0.00 0 0 0 51 25 76 Disease: Botryosphaeria 0.00 0 0 0 59 25 84 Leaf Tissue Analysis 0.00 0 0 0 0 3 3 Insects: CM/WHF/Aphids/Mites 0.00 0 0 0 185 25 210 Weeds: Pre-Harvest Strip Spray 0.18 5 0 0 23 0 28 Insects: WHF (Alt. Row) 0.00 0 0 0 101 13 114 Clear Berms of Plant Residue 0.14 4 1 0 0 0 5 Weeds: Fall Strip Spray 0.18 5 0 0 79 0 85 Pickup Truck Use 2.00 52 15 7 0 0 73 ATV Use 1.00 26 1 1 0 0 28 TOTAL CULTURAL COSTS 4.97 162 31 19 1,250 444 1,906 Harvest: Harvest & Haul 0.00 0 0 0 0 420 420 Hull & Dry 0.00 0 0 0 0 420 420 CA Walnut Commission 0.00 0 0 0 60 0 60 TOTAL HARVEST COSTS 0.00 0 0 0 60 840 900 Interest on Operating Capital at 4.50% 33 TOTAL OPERATING COSTS/ACRE 5 162 31 19 1,310 1,284 2,839

Walnut Cost and Returns Study San Joaquin Valley North – 2017 UCCE, UC AIC, UC DAVIS-ARE 15
UC COOPERATIVE EXTENSION-AGRICULTURAL ISSUES CENTER TABLE 2. CONTINUED
SAN JOAQUIN VALLEY NORTH – 2017
Operation Cash and Labor Costs per Acre
Operation Time
(Hrs/A) Labor Cost
Fuel Lube Material &Repairs Cost
Custom/ Rent
Total Cost
Your Cost
CASH OVERHEAD: Liability Insurance 6 Office Expense 75 Regulatory Fees 5 Sanitation Service 5 Property Taxes 321 Property Insurance 27 Investment Repairs 95 TOTAL CASH OVERHEAD COSTS/ACRE 535 TOTAL CASH COSTS/ACRE 3,374 NON-CASH OVERHEAD: Per Producing Annual Cost
Acre Capital Recovery Buildings (2400sq. ft.) 842 55 55 Fuel Tanks: 2-500Gal 116 11 11 Solid Set Sprinkler w/ Filter 1,850 118 118 Land Walnuts 24,000 1,200 1,200 Pump/Well 1,167 76 76 Shop/Field Tools 158 14 14 Bait Stations (60) 9 2 2 Orchard Establishment 11,771 918 918 Equipment 267 31 31 TOTAL NON-CASH OVERHEAD COSTS 40,179 2,426 2,426 TOTAL COSTS/ACRE 5,800
Walnut Cost and Returns Study San Joaquin Valley North – 2017 UCCE, UC AIC, UC DAVIS-ARE 16
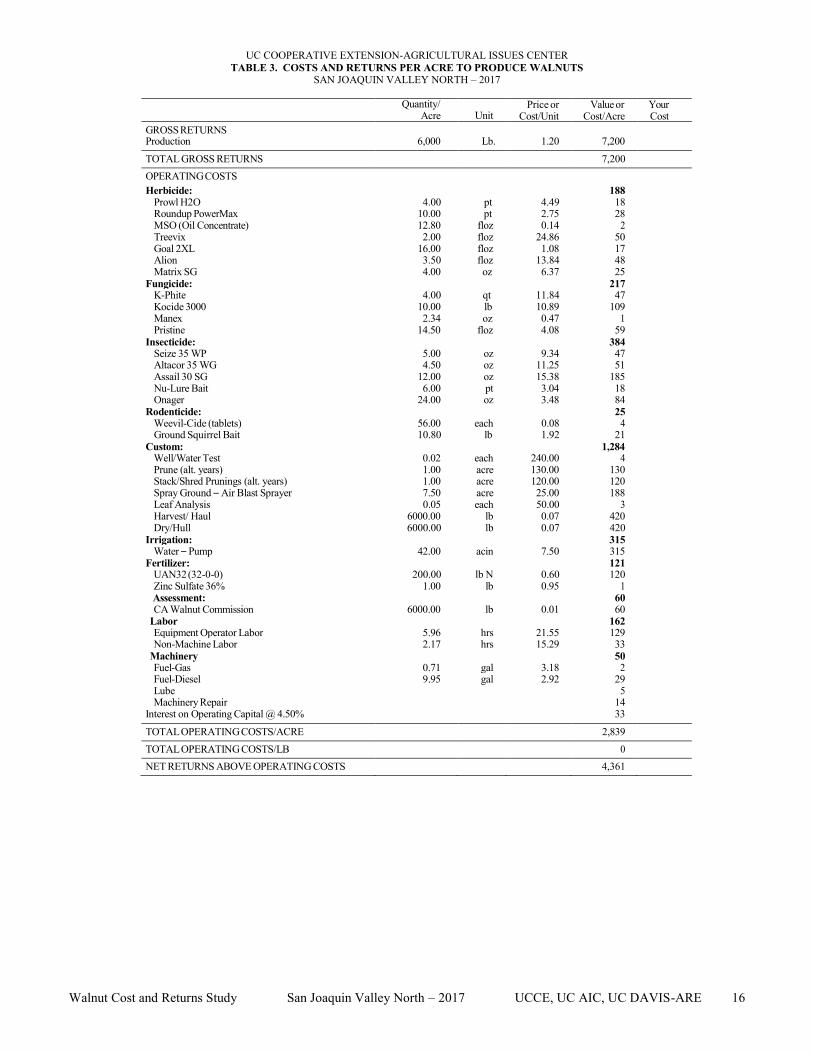
UC COOPERATIVE EXTENSION-AGRICULTURAL ISSUES CENTER TABLE 3. COSTS AND RETURNS PER ACRE TO PRODUCE WALNUTS
SAN JOAQUIN VALLEY NORTH – 2017
Quantity/ Acre
Unit
Price or Cost/Unit
Value or Cost/Acre
Your Cost
GROSS RETURNS Production 6,000 Lb. 1.20 7,200 TOTAL GROSS RETURNS 7,200 OPERATING COSTS Herbicide: 188
Prowl H2O 4.00 pt 4.49 18 Roundup PowerMax 10.00 pt 2.75 28 MSO (Oil Concentrate) 12.80 floz 0.14 2 Treevix 2.00 floz 24.86 50 Goal 2XL 16.00 floz 1.08 17 Alion 3.50 floz 13.84 48 Matrix SG 4.00 oz 6.37 25 Fungicide: 217 K-Phite 4.00 qt 11.84 47 Kocide 3000 10.00 lb 10.89 109 Manex 2.34 oz 0.47 1 Pristine 14.50 floz 4.08 59 Insecticide: 384 Seize 35 WP 5.00 oz 9.34 47 Altacor 35 WG 4.50 oz 11.25 51 Assail 30 SG 12.00 oz 15.38 185 Nu-Lure Bait 6.00 pt 3.04 18 Onager 24.00 oz 3.48 84 Rodenticide: 25 Weevil-Cide (tablets) 56.00 each 0.08 4 Ground Squirrel Bait 10.80 lb 1.92 21 Custom: 1,284 Well/Water Test 0.02 each 240.00 4 Prune (alt. years) 1.00 acre 130.00 130 Stack/Shred Prunings (alt. years) 1.00 acre 120.00 120 Spray Ground – Air Blast Sprayer 7.50 acre 25.00 188 Leaf Analysis 0.05 each 50.00 3 Harvest/ Haul 6000.00 lb 0.07 420 Dry/Hull 6000.00 lb 0.07 420 Irrigation: 315 Water – Pump 42.00 acin 7.50 315 Fertilizer: 121 UAN32 (32-0-0) 200.00 lb N 0.60 120 Zinc Sulfate 36% 1.00 lb 0.95 1 Assessment: 60 CA Walnut Commission 6000.00 lb 0.01 60 Labor 162 Equipment Operator Labor 5.96 hrs 21.55 129 Non-Machine Labor 2.17 hrs 15.29 33 Machinery 50 Fuel-Gas 0.71 gal 3.18 2 Fuel-Diesel 9.95 gal 2.92 29 Lube 5 Machinery Repair 14 Interest on Operating Capital @ 4.50% 33
TOTAL OPERATING COSTS/ACRE 2,839 TOTAL OPERATING COSTS/LB 0 NET RETURNS ABOVE OPERATING COSTS 4,361
Walnut Cost and Returns Study San Joaquin Valley North – 2017 UCCE, UC AIC, UC DAVIS-ARE 17
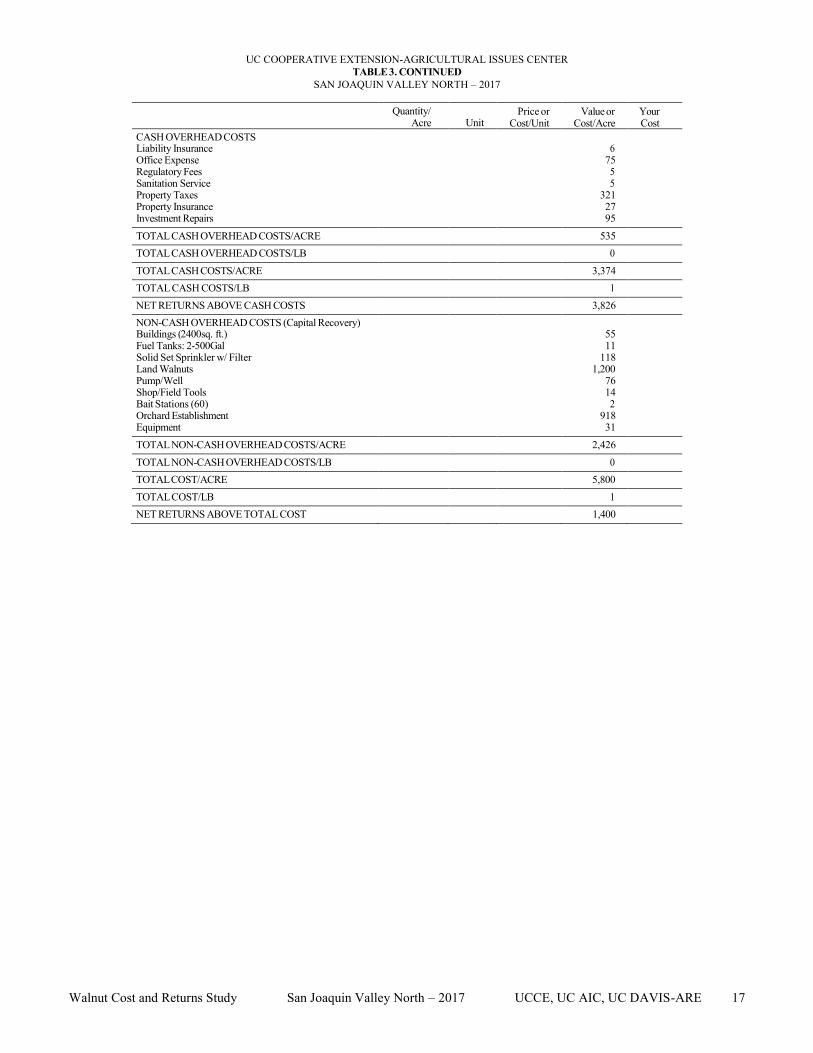
UC COOPERATIVE EXTENSION-AGRICULTURAL ISSUES CENTER TABLE 3. CONTINUED
SAN JOAQUIN VALLEY NORTH – 2017
Quantity/ Acre
Unit
Price or Cost/Unit
Value or Cost/Acre
Your Cost
CASH OVERHEAD COSTS Liability Insurance 6 Office Expense 75 Regulatory Fees 5 Sanitation Service 5 Property Taxes 321 Property Insurance 27 Investment Repairs 95 TOTAL CASH OVERHEAD COSTS/ACRE 535 TOTAL CASH OVERHEAD COSTS/LB 0 TOTAL CASH COSTS/ACRE 3,374 TOTAL CASH COSTS/LB 1 NET RETURNS ABOVE CASH COSTS 3,826 NON-CASH OVERHEAD COSTS (Capital Recovery) Buildings (2400sq. ft.) 55 Fuel Tanks: 2-500Gal 11 Solid Set Sprinkler w/ Filter 118 Land Walnuts 1,200 Pump/Well 76 Shop/Field Tools 14 Bait Stations (60) 2 Orchard Establishment 918 Equipment 31 TOTAL NON-CASH OVERHEAD COSTS/ACRE 2,426 TOTAL NON-CASH OVERHEAD COSTS/LB 0 TOTAL COST/ACRE 5,800 TOTAL COST/LB 1 NET RETURNS ABOVE TOTAL COST 1,400
Walnut Cost and Returns Study San Joaquin Valley North – 2017 UCCE, UC AIC, UC DAVIS-ARE 18
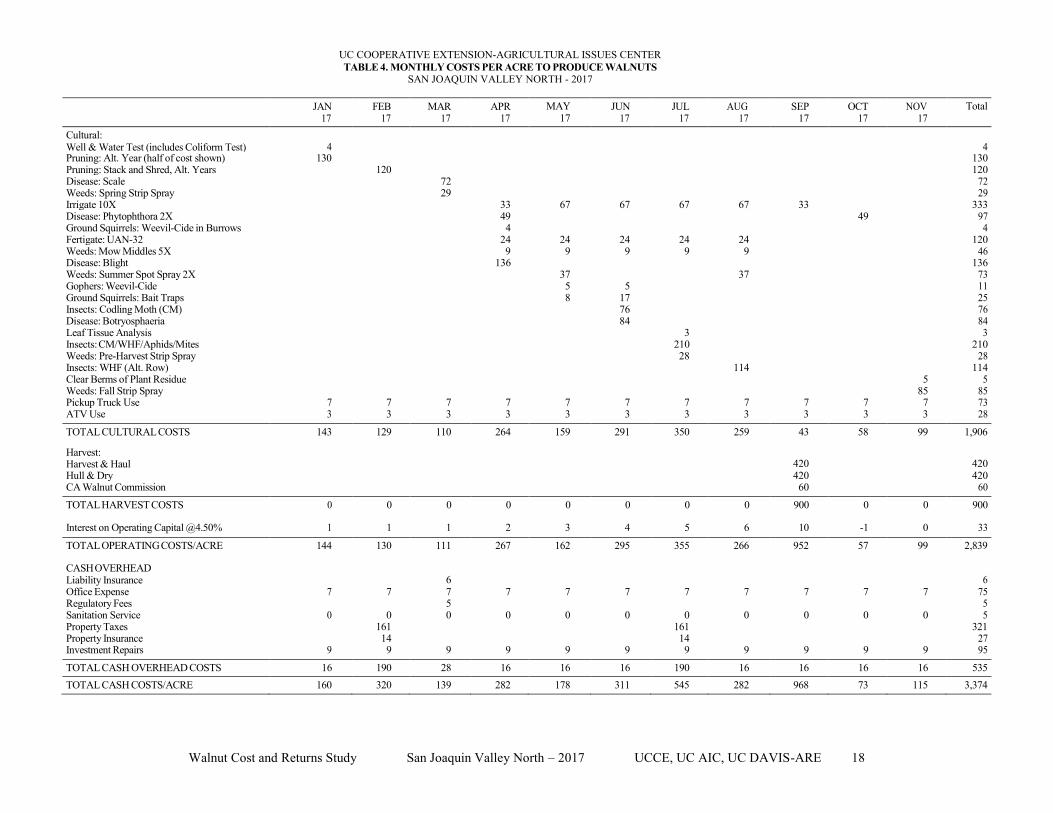
UC COOPERATIVE EXTENSION-AGRICULTURAL ISSUES CENTER TABLE 4. MONTHLY COSTS PER ACRE TO PRODUCE WALNUTS
SAN JOAQUIN VALLEY NORTH - 2017
JAN 17
FEB 17
MAR 17
APR 17
MAY 17
JUN 17
JUL 17
AUG 17
SEP 17
OCT 17
NOV 17
Total
Cultural: Well & Water Test (includes Coliform Test)
4
4
Pruning: Alt. Year (half of cost shown) 130 130 Pruning: Stack and Shred, Alt. Years 120 120 Disease: Scale 72 72 Weeds: Spring Strip Spray 29 29 Irrigate 10X 33 67 67 67 67 33 333 Disease: Phytophthora 2X 49 49 97 Ground Squirrels: Weevil-Cide in Burrows 4 4 Fertigate: UAN-32 24 24 24 24 24 120 Weeds: Mow Middles 5X 9 9 9 9 9 46 Disease: Blight 136 136 Weeds: Summer Spot Spray 2X 37 37 73 Gophers: Weevil-Cide 5 5 11 Ground Squirrels: Bait Traps 8 17 25 Insects: Codling Moth (CM) 76 76 Disease: Botryosphaeria 84 84 Leaf Tissue Analysis 3 3 Insects: CM/WHF/Aphids/Mites 210 210 Weeds: Pre-Harvest Strip Spray 28 28 Insects: WHF (Alt. Row) 114 114 Clear Berms of Plant Residue 5 5 Weeds: Fall Strip Spray 85 85 Pickup Truck Use 7 7 7 7 7 7 7 7 7 7 7 73 ATV Use 3 3 3 3 3 3 3 3 3 3 3 28
TOTAL CULTURAL COSTS 143 129 110 264 159 291 350 259 43 58 99 1,906
Harvest: Harvest & Haul
420
420
Hull & Dry 420 420 CA Walnut Commission 60 60
TOTAL HARVEST COSTS 0 0 0 0 0 0 0 0 900 0 0 900
Interest on Operating Capital @4.50% 1 1 1 2 3 4 5 6 10 -1 0 33
TOTAL OPERATING COSTS/ACRE 144 130 111 267 162 295 355 266 952 57 99 2,839
CASH OVERHEAD Liability Insurance
6
6
Office Expense 7 7 7 7 7 7 7 7 7 7 7 75 Regulatory Fees 5 5 Sanitation Service 0 0 0 0 0 0 0 0 0 0 0 5 Property Taxes 161 161 321 Property Insurance 14 14 27 Investment Repairs 9 9 9 9 9 9 9 9 9 9 9 95
TOTAL CASH OVERHEAD COSTS 16 190 28 16 16 16 190 16 16 16 16 535 TOTAL CASH COSTS/ACRE 160 320 139 282 178 311 545 282 968 73 115 3,374
Walnut Cost and Returns Study San Joaquin Valley North – 2017 UCCE, UC AIC, UC DAVIS-ARE 19
UC COOPERATIVE EXTENSION-AGRICULTURAL ISSUES CENTER TABLE 5. RANGING ANALYSIS – WALNUTS
SAN JOAQUIN VALLEY NORTH - 2017
COSTS PER ACRE AND PER LB AT VARYING YIELDS TO PRODUCE WALNUTS
YIELD (LB)
4,500.00
5,000.00
5,500.00
6,000.00
6,500.00
7,000.00
7,500.00 OPERATING COSTS/ACRE: Cultural
1,906
1,906
1,906
1,906
1,906
1,906
1,906
Harvest 675 750 825 900 975 1,050 1,125 Interest on Operating Capital @ 4.50% 32 33 33 33 34 34 34
TOTAL OPERATING COSTS/ACRE 2,613 2,688 2,764 2,839 2,914 2,989 3,065 TOTAL OPERATING COSTS/LB 0.58 0.54 0.50 0.47 0.45 0.43 0.41
CASH OVERHEAD COSTS/ACRE 535 535 535 535 535 535 535 TOTAL CASH COSTS/ACRE 3,148 3,223 3,298 3,374 3,449 3,524 3,600 TOTAL CASH COSTS/LB 0.70 0.64 0.60 0.56 0.53 0.50 0.48
NON-CASH OVERHEAD COSTS/ACRE 2,426 2,426 2,426 2,426 2,426 2,426 2,426 TOTAL COSTS/ACRE 5,574 5,649 5,724 5,800 5,875 5,950 6,025 TOTAL COSTS/LB 1.00 1.00 1.00 1.00 1.00 1.00 1.00
Net Return per Acre above Operating Costs for Walnuts
PRICE ($/lb)
YIELD (lb/acre)
Production
4500.00
5000.00
5500.00
6000.00
6500.00
7000.00
7500.00
0.60
87
312
536
761
986
1,211
1,435 0.80 987 1,312 1,636 1,961 2,286 2,611 2,935 1.00 1,887 2,312 2,736 3,161 3,586 4,011 4,435 1.20 2,787 3,312 3,836 4,361 4,886 5,411 5,935 1.40 3,687 4,312 4,936 5,561 6,186 6,811 7,435 1.60 4,587 5,312 6,036 6,761 7,486 8,211 8,935 1.80 5,487 6,312 7,136 7,961 8,786 9,611 10,435
Net Return per Acre above Cash Costs for Walnuts
PRICE ($/lb)
YIELD (lb/acre)
Production
4500.00
5000.00
5500.00
6000.00
6500.00
7000.00
7500.00
0.60
-448
-223
2
226
451
676
900 0.80 452 777 1,102 1,426 1,751 2,076 2,400 1.00 1,352 1,777 2,202 2,626 3,051 3,476 3,900 1.20 2,252 2,777 3,302 3,826 4,351 4,876 5,400 1.40 3,152 3,777 4,402 5,026 5,651 6,276 6,900 1.60 4,052 4,777 5,502 6,226 6,951 7,676 8,400 1.80 4,952 5,777 6,602 7,426 8,251 9,076 9,900
Net Return per Acre above Total Costs for Walnuts
PRICE ($/lb)
YIELD (lb/acre)
Production
4500.00
5000.00
5500.00
6000.00
6500.00
7000.00
7500.00
0.60
-2,874
-2,649
-2,424
-2,200
-1,975
-1,750
-1,525 0.80 -1,974 -1,649 -1,324 -1,000 -675 -350 -25 1.00 -1,074 -649 -224 200 625 1,050 1,475 1.20 -174 351 876 1,400 1,925 2,450 2,975 1.40 726 1,351 1,976 2,600 3,225 3,850 4,475 1.60 1,626 2,351 3,076 3,800 4,525 5,250 5,975 1.80 2,526 3,351 4,176 5,000 5,825 6,650 7,475

Walnut Cost and Returns Study San Joaquin Valley North – 2017 UCCE, UC AIC, UC DAVIS-ARE 20
UC COOPERATIVE EXTENSION-AGRICULTURAL ISSUES CENTER TABLE 6. WHOLE FARM ANNUAL EQUIPMENT, INVESTMENT, AND BUSINESS OVERHEAD COSTS
SAN JOAQUIN VALLEY NORTH - 2017
ANNUAL EQUIPMENT COSTS
Cash Overhead
Yr.
Description
Price
Years Life
Salvage Value
Capital Recovery
Insurance
Taxes
Total
17 Pickup Truck 1/2 T 32,000 5 14,342 4,796 20 232 5,047 17 Weed Sprayer 100 G 5,000 10 884 577 2 29 609 17 90 HP 4WD Tractor 60,500 15 11,778 5,283 31 361 5,675 17 Mower Flail 10' 12,000 10 2,122 1,385 6 71 1,462 17 ATV-Mule 9,000 12 2,250 874 5 56 935 17 Sweeper/Blower 62,000 15 5,952 5,697 29 340 6,066
TOTAL 180,500 - 37,329 18,613 92 1,089 19,794
60% of New Cost* 108,300 - 22,397 11,168 55 653 11,876 *Used to reflect a mix of new and used equipment
ANNUAL INVESTMENT COSTS
Cash Overhead Description
Price
Years Life
Salvage Value
Capital Recovery
Insurance
Taxes
Repairs
Total
INVESTMENT Buildings 2400sqft 80,000 30 0 5,204 34 400 1,600 7,238 Fuel Tanks 2-500Gal 10,975 15 768 1,022 5 59 220 1,305 Solid Set Sprinkler w/ Filter 111,000 30 7,770 7,104 50 594 2,220 9,968 Land Walnuts 1,440,000 30 1,440,000 72,000 1,218 14,400 0 87,618 Pump/Well 60Ac 70,000 30 0 4,554 30 350 1,400 6,333 Shop/Field Tools 15,000 15 1,500 1,376 7 83 300 1,765 Bait Stations (60) 510 5 0 118 0 3 10 131 Orchard Establishment 706,260 21 0 55,086 299 3,531 706 59,622
TOTAL INVESTMENT 2,433,745 - 1,450,038 146,462 1,643 19,419 6,456 173,980
ANNUAL BUSINESS OVERHEAD COSTS
Units/ Price/ Total Description Farm Unit Unit Cost Liability Insurance 60.00 acre 6.40 384 Office Expense 60.00 acre 75.00 4,500 Regulatory Fees 60.00 acre 5.26 316 Sanitation Service 60.00 acre 5.00 300
UC COOPERATIVE EXTENSION-AGRICULTURAL ISSUES CENTER TABLE 7. HOURLY EQUIPMENT COSTS
SAN JOAQUIN VALLEY NORTH - 2017
Walnuts Total Cash Overhead Operating Yr.
Description
Hours Used
Hours Used
Capital Recovery
Insurance
Taxes
Lube & Repairs
Fuel
Total Oper.
Total Costs/Hr.
17 Pickup Truck 1/2 T 120 400 7.19 0.03 0.35 3.48 7.30 10.78 18.35 17 Weed Sprayer 100 G 54 150 2.31 0.01 0.12 1.34 0.00 1.34 3.78 17 90 HP 4WD Tractor 61 1066 2.97 0.02 0.20 3.47 12.91 16.37 19.57 17 Mower Flail 10' 55 200 4.16 0.02 0.21 5.83 0.00 5.83 10.21 17 ATV-Mule 114 166 3.16 0.02 0.20 0.83 1.19 2.02 5.40 17 Sweeper/Blower 9 250 13.67 0.07 0.82 2.50 8.76 11.26 25.82
Walnut Cost and Returns Study San Joaquin Valley North – 2017 UCCE, UC AIC, UC DAVIS-ARE 21
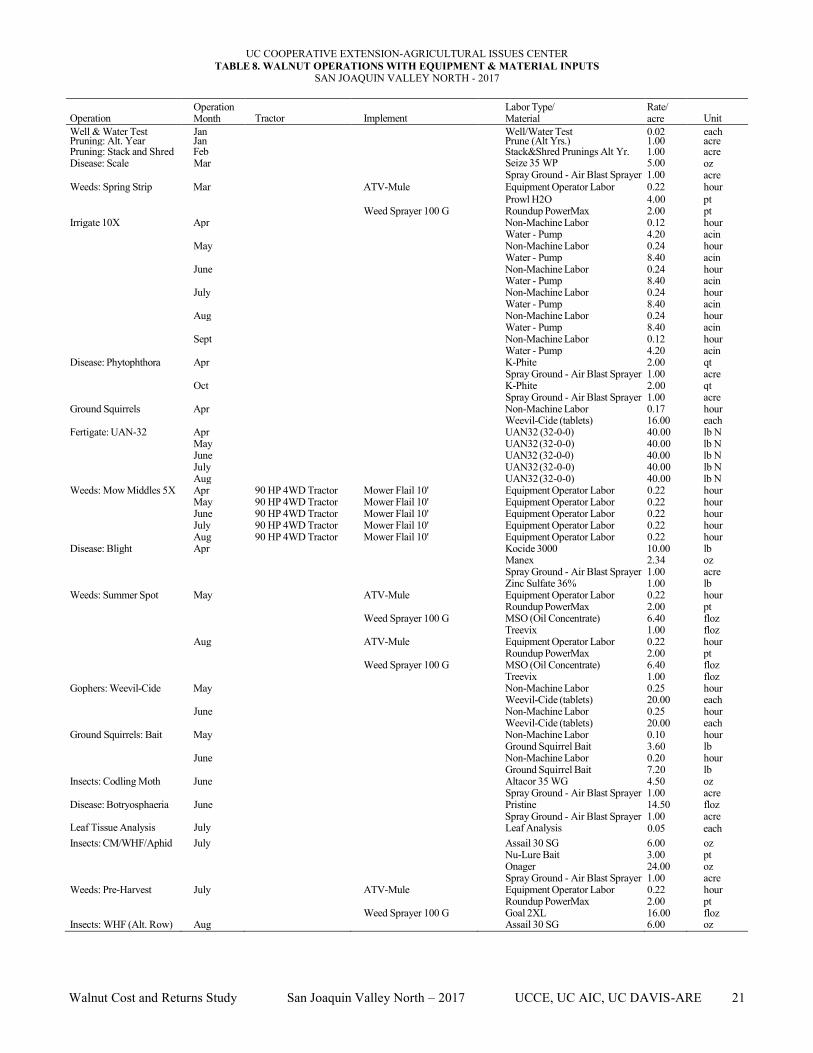
UC COOPERATIVE EXTENSION-AGRICULTURAL ISSUES CENTER TABLE 8. WALNUT OPERATIONS WITH EQUIPMENT & MATERIAL INPUTS
SAN JOAQUIN VALLEY NORTH - 2017
Operation
Operation Month
Tractor
Implement
Labor Type/ Material
Rate/ acre
Unit
Well & Water Test Jan Well/Water Test 0.02 each Pruning: Alt. Year Jan Prune (Alt Yrs.) 1.00 acre Pruning: Stack and Shred Disease: Scale
Feb Mar Stack&Shred Prunings Alt Yr. 1.00
Seize 35 WP 5.00 Spray Ground - Air Blast Sprayer 1.00
acre oz acre
Weeds: Spring Strip Mar ATV-Mule Equipment Operator Labor 0.22 hour Prowl H2O 4.00 pt Weed Sprayer 100 G Roundup PowerMax 2.00 pt Irrigate 10X Apr Non-Machine Labor 0.12 hour
Water - Pump 4.20 acin May Non-Machine Labor 0.24 hour Water - Pump 8.40 acin June Non-Machine Labor 0.24 hour Water - Pump 8.40 acin July Non-Machine Labor 0.24 hour Water - Pump 8.40 acin Aug Non-Machine Labor 0.24 hour Water - Pump 8.40 acin Sept Non-Machine Labor 0.12 hour Water - Pump 4.20 acin Disease: Phytophthora Apr K-Phite 2.00 qt
Spray Ground - Air Blast Sprayer 1.00 acre Oct K-Phite 2.00 qt Spray Ground - Air Blast Sprayer 1.00 acre Ground Squirrels Apr Non-Machine Labor 0.17 hour
Weevil-Cide (tablets) 16.00 each Fertigate: UAN-32 Apr UAN32 (32-0-0) 40.00 lb N
May UAN32 (32-0-0) 40.00 lb N June UAN32 (32-0-0) 40.00 lb N July UAN32 (32-0-0) 40.00 lb N Aug UAN32 (32-0-0) 40.00 lb N Weeds: Mow Middles 5X Apr 90 HP 4WD Tractor Mower Flail 10' Equipment Operator Labor 0.22 hour
May 90 HP 4WD Tractor Mower Flail 10' Equipment Operator Labor 0.22 hour June 90 HP 4WD Tractor Mower Flail 10' Equipment Operator Labor 0.22 hour July 90 HP 4WD Tractor Mower Flail 10' Equipment Operator Labor 0.22 hour Aug 90 HP 4WD Tractor Mower Flail 10' Equipment Operator Labor 0.22 hour Disease: Blight Apr Kocide 3000 10.00 lb
Manex 2.34 oz Spray Ground - Air Blast Sprayer 1.00 acre Zinc Sulfate 36% 1.00 lb Weeds: Summer Spot May ATV-Mule Equipment Operator Labor 0.22 hour
Roundup PowerMax 2.00 pt Weed Sprayer 100 G MSO (Oil Concentrate) 6.40 floz Treevix 1.00 floz Aug ATV-Mule Equipment Operator Labor 0.22 hour Roundup PowerMax 2.00 pt Weed Sprayer 100 G MSO (Oil Concentrate) 6.40 floz Treevix 1.00 floz Gophers: Weevil-Cide May Non-Machine Labor 0.25 hour
Weevil-Cide (tablets) 20.00 each June Non-Machine Labor 0.25 hour Weevil-Cide (tablets) 20.00 each Ground Squirrels: Bait May Non-Machine Labor 0.10 hour
Ground Squirrel Bait 3.60 lb June Non-Machine Labor 0.20 hour Ground Squirrel Bait 7.20 lb Insects: Codling Moth June Altacor 35 WG 4.50 oz
Spray Ground - Air Blast Sprayer 1.00 acre Disease: Botryosphaeria June Pristine 14.50 floz
Leaf Tissue Analysis
July Spray Ground - Air Blast Sprayer
Leaf Analysis 1.00 0.05
acre each
Insects: CM/WHF/Aphid July Assail 30 SG 6.00 oz Nu-Lure Bait 3.00 pt Onager 24.00 oz Spray Ground - Air Blast Sprayer 1.00 acre Weeds: Pre-Harvest July ATV-Mule Equipment Operator Labor 0.22 hour
Roundup PowerMax 2.00 pt Weed Sprayer 100 G Goal 2XL 16.00 floz Insects: WHF (Alt. Row) Aug Assail 30 SG 6.00 oz

Walnut Cost and Returns Study San Joaquin Valley North – 2017 UCCE, UC AIC, UC DAVIS-ARE 22
UC COOPERATIVE EXTENSION-AGRICULTURAL ISSUES CENTER TABLE 8. CONTINUED
SAN JOAQUIN VALLEY NORTH - 2017
Operation
Operation Month
Tractor
Implement
Labor Type/ Material
Rate/ acre
Unit
Nu-Lure Bait 3.00 pt
Spray Ground - Air Blast Sprayer 0.50 acre Clear Berms of Plant Nov Sweeper/Blower Equipment Operator Labor 0.17 hour Weeds: Fall Strip Spray Nov ATV-Mule Equipment Operator Labor 0.22 hour
Alion 3.50 floz
Weed Sprayer 100 G Roundup PowerMax 2.00 pt
Matrix SG 4.00 oz Pickup Truck Use Nov Pickup Truck 1/2 T Equipment Operator Labor 2.40 hours ATV Use Nov ATV-Mule Equipment Operator Labor 1.20 hours Harvest & Haul Sept ShkSwpPkHl MatOrch 6,000.00 lb Hull & Dry Sept Dry/Hull 6,000.00 lb CA Walnut Commission Sept CA Walnut Commission 6,000.00 lb