2017: skyscraper history’s tallest, highest- volume, and most geographically diverse ...€¦ ·...
TRANSCRIPT

The Council on Tall Buildings and Urban Habitat 2017 Year in Review report www.ctbuh.org | www.skyscrapercenter.com
2017: Skyscraper History’s Tallest, Highest-Volume, and Most Geographically Diverse YearAbstract
The 2017 Tall Building Year in Review / Tall Buildings in Numbers data analysis report shows that more buildings of 200 meters’ height or greater were completed in 2017 than in any other year, with a total of 144 completions. Notably, 2017 was also the most geographically diverse year in terms of the number of cities and countries that completed 200-meter-plus buildings, with 69 cities across 23 countries represented in the data, up from 54 cities across 18 countries in 2016. The report covers other statistical highlights of 2017 and predicts completions for 2018.
Keywords: 2017, Completions, Height, Statistics, Skyscrapers, Urbanization
Figure 1. Tallest in 2017: Ping An Finance Center, Shenzhen, 599 meters. © Tim Griffith for KPF Figure 2. 131st-Tallest in 2017: Shahar Tower, Givatayim, 202 meters. © Assaf Pinchuk
CTBUH Year in Review: Tall Trends of 2017
0
20
40
60
80
100
Num
ber o
f bui
ldin
gs 2
00 m
+ co
mpl
eted
eac
h ye
ar
10
30
50
70
90
110
120
130
140
150
160
1960
1
1963
2
1964
1
1967
2
1968
1
1971
2
1975
4
1976
4
1977
3
1978
3
1979
2
1980
3
1981
3
1984
7
1985
6
1986
9
1987
6
1988
6
1991
14
1994
5
1995
1
1969
31
1973
6
2
1974
6
1
1982
5
1
1983
11
1
1989
8
1
1990
15
3
1993
6
1996
10
2
1997
13
2
1998
17
3
1999
12
2
2000
23
2
2001
22
1
2002
17
1
2003
31
120
04
18
1
2005
31
1
2007
32
3
2008
47
4
2009
52
3
2011
81
9
1970
3
2006
27
2
1972
10
1992
2010
73
9
1
2014
2013
74
1966
1965
1962
1961
2012
1 1
8
1
2015
9
160
911
2016
144
127
2
2017
2018
115
15
102
Buildings 200 Meters or Taller Completed Each Year from 1960 to 2018
12
20
130
19
69
15
1
73
2 6 11 11 15
1920 1930 1940 1950 1960 1970 1980 1990 2000 20100
100
200
300
400
500
600
700
800
900
1,000
146
11
71
5283
263
24
609
50
1 3
1,100
1,200
1,300
1,400
1,500
1,319
1,478
126
2017
Total Number of 200-meter-plus Buildings in Existence at Decade’s end from 1920 to 2018
138
146
2018
1,448
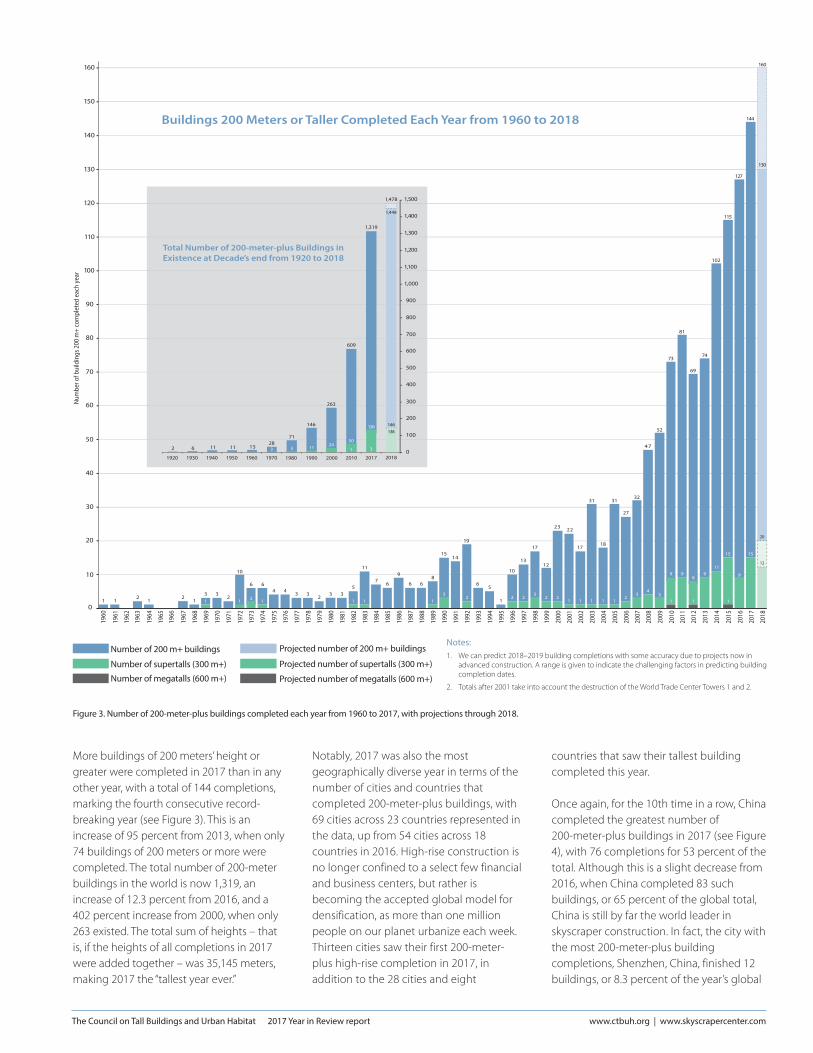
Figure 3. Number of 200-meter-plus buildings completed each year from 1960 to 2017, with projections through 2018.
Notes:1. We can predict 2018–2019 building completions with some accuracy due to projects now in
advanced construction. A range is given to indicate the challenging factors in predicting building completion dates.
2. Totals after 2001 take into account the destruction of the World Trade Center Towers 1 and 2.
Number of 200 m+ buildings
Number of supertalls (300 m+)
Number of megatalls (600 m+)
Projected number of 200 m+ buildings
Projected number of supertalls (300 m+)
Projected number of megatalls (600 m+)
The Council on Tall Buildings and Urban Habitat 2017 Year in Review report www.ctbuh.org | www.skyscrapercenter.com
countries that saw their tallest building completed this year.
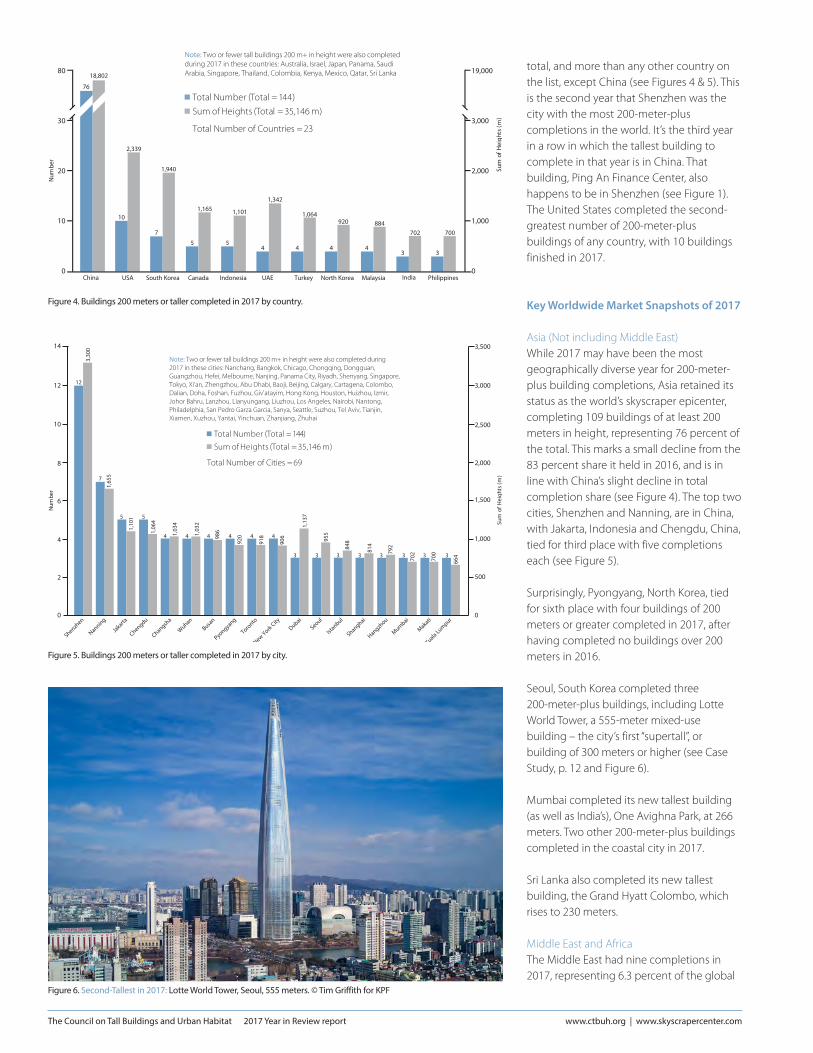
Once again, for the 10th time in a row, China completed the greatest number of 200-meter-plus buildings in 2017 (see Figure 4), with 76 completions for 53 percent of the total. Although this is a slight decrease from 2016, when China completed 83 such buildings, or 65 percent of the global total, China is still by far the world leader in skyscraper construction. In fact, the city with the most 200-meter-plus building completions, Shenzhen, China, finished 12 buildings, or 8.3 percent of the year’s global
More buildings of 200 meters’ height or greater were completed in 2017 than in any other year, with a total of 144 completions, marking the fourth consecutive record-breaking year (see Figure 3). This is an increase of 95 percent from 2013, when only 74 buildings of 200 meters or more were completed. The total number of 200-meter buildings in the world is now 1,319, an increase of 12.3 percent from 2016, and a 402 percent increase from 2000, when only 263 existed. The total sum of heights – that is, if the heights of all completions in 2017 were added together – was 35,145 meters, making 2017 the “tallest year ever.”
Notably, 2017 was also the most geographically diverse year in terms of the number of cities and countries that completed 200-meter-plus buildings, with 69 cities across 23 countries represented in the data, up from 54 cities across 18 countries in 2016. High-rise construction is no longer confined to a select few financial and business centers, but rather is becoming the accepted global model for densification, as more than one million people on our planet urbanize each week. Thirteen cities saw their first 200-meter-plus high-rise completion in 2017, in addition to the 28 cities and eight
The Council on Tall Buildings and Urban Habitat 2017 Year in Review report www.ctbuh.org | www.skyscrapercenter.com
total, and more than any other country on the list, except China (see Figures 4 & 5). This is the second year that Shenzhen was the city with the most 200-meter-plus completions in the world. It’s the third year in a row in which the tallest building to complete in that year is in China. That building, Ping An Finance Center, also happens to be in Shenzhen (see Figure 1). The United States completed the second-greatest number of 200-meter-plus buildings of any country, with 10 buildings finished in 2017. Key Worldwide Market Snapshots of 2017
Asia (Not including Middle East) While 2017 may have been the most geographically diverse year for 200-meter-plus building completions, Asia retained its status as the world’s skyscraper epicenter, completing 109 buildings of at least 200 meters in height, representing 76 percent of the total. This marks a small decline from the 83 percent share it held in 2016, and is in line with China’s slight decline in total completion share (see Figure 4). The top two cities, Shenzhen and Nanning, are in China, with Jakarta, Indonesia and Chengdu, China, tied for third place with five completions each (see Figure 5).
Surprisingly, Pyongyang, North Korea, tied for sixth place with four buildings of 200 meters or greater completed in 2017, after having completed no buildings over 200 meters in 2016.
Seoul, South Korea completed three 200-meter-plus buildings, including Lotte World Tower, a 555-meter mixed-use building – the city’s first “supertall”, or building of 300 meters or higher (see Case Study, p. 12 and Figure 6).
Mumbai completed its new tallest building (as well as India’s), One Avighna Park, at 266 meters. Two other 200-meter-plus buildings completed in the coastal city in 2017.
Sri Lanka also completed its new tallest building, the Grand Hyatt Colombo, which rises to 230 meters.
Middle East and Africa The Middle East had nine completions in 2017, representing 6.3 percent of the global
Figure 4. Buildings 200 meters or taller completed in 2017 by country.
Figure 5. Buildings 200 meters or taller completed in 2017 by city.
Sum
of
Hei
ght
s (m
)
Num
ber
0
10
20
30
80
0
1,000
2,000
3,000
19,000
Total Number (Total = 144)
Sum of Heights (Total = 35,146 m)
Note: Two or fewer tall buildings 200 m+ in height were also completed during 2017 in these countries: Australia, Israel, Japan, Panama, Saudi Arabia, Singapore, Thailand, Colombia, Kenya, Mexico, Qatar, Sri Lanka
2017 Completions: 200 m+ Buildings by Country
Total Number of Countries = 23
3
700
45
4
702
4
920
1,101
1,342
1,940
3
884
Philippines
10
2,339
USA
76
18,802
China MalaysiaNorth KoreaTurkeyUAEIndonesia India
5
1,165
CanadaSouth Korea
7
4
1,064
Sum
of H
eigh
ts (m
)
Num
ber
0
2
4
6
8
10
12
14
0
500
1,000
1,500
2,000
2,500
3,000
3,500
Shenzhen
Nanning
Jakarta
Changsha
Seoul
Hangzhou
Busan
New York CityDubai
Istanbul
Wuhan
Toronto
Mumbai
Shanghai
Chengdu
Pyongyang
Note: Two or fewer tall buildings 200 m+ in height were also completed during 2017 in these cities: Nanchang, Bangkok, Chicago, Chongqing, Dongguan, Guangzhou, Hefei, Melbourne, Nanjing, Panama City, Riyadh, Shenyang, Singapore, Tokyo, Xi’an, Zhengzhou, Abu Dhabi, Baoji, Beijing, Calgary, Cartagena, Colombo, Dalian, Doha, Foshan, Fuzhou, Giv'atayim, Hong Kong, Houston, Huizhou, Izmir, Johor Bahru, Lanzhou, Lianyungang, Liuzhou, Los Angeles, Nairobi, Nantong, Philadelphia, San Pedro Garza Garcia, Sanya, Seattle, Suzhou, Tel Aviv, Tianjin, Xiamen, Xuzhou, Yantai, Yinchuan, Zhanjiang, Zhuhai
333333
444444
55
7
12
3,30
0
1,65
5
1,10
1
1,06
4
1,03
4
1,03
2
986
920
918
906
1,13
7
955
848
814
792
702
Makati
Kuala Lumpur
33
700
664
Total Number (Total = 144)
Sum of Heights (Total = 35,146 m)
Total Number of Cities = 69
Figure 6. Second-Tallest in 2017: Lotte World Tower, Seoul, 555 meters. © Tim Griffith for KPF
The Council on Tall Buildings and Urban Habitat 2017 Year in Review report www.ctbuh.org | www.skyscrapercenter.com
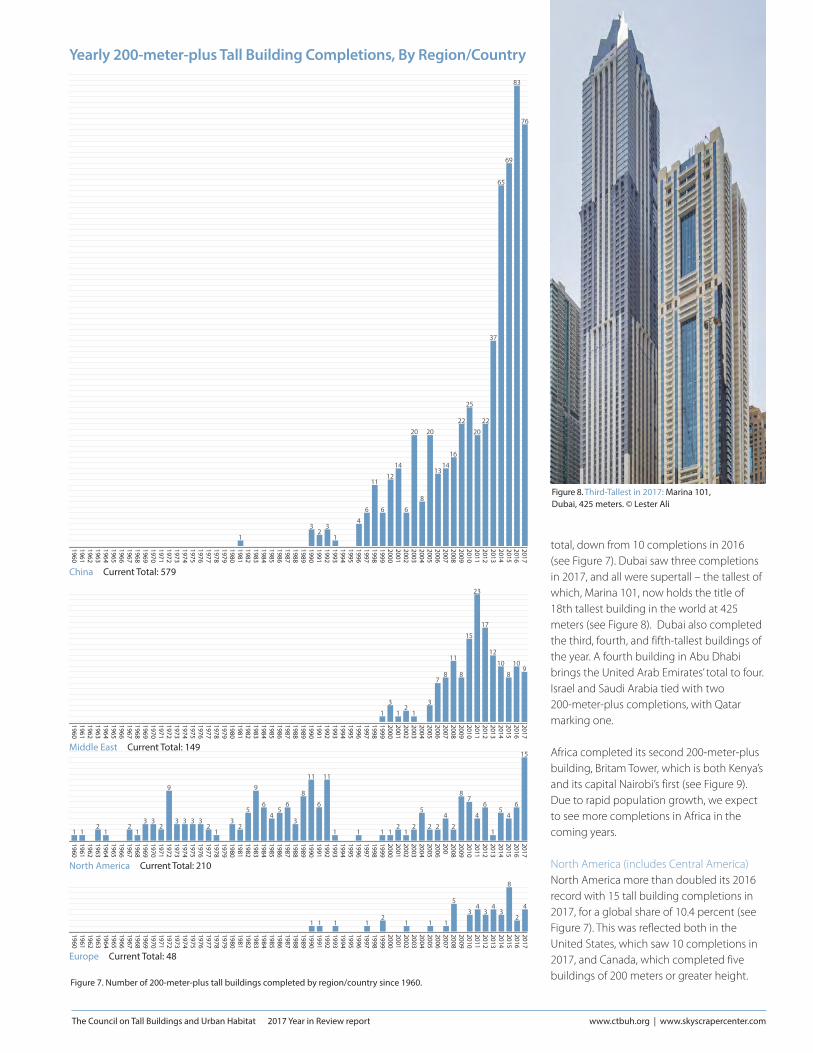
total, down from 10 completions in 2016 (see Figure 7). Dubai saw three completions in 2017, and all were supertall – the tallest of which, Marina 101, now holds the title of 18th tallest building in the world at 425 meters (see Figure 8). Dubai also completed the third, fourth, and fifth-tallest buildings of the year. A fourth building in Abu Dhabi brings the United Arab Emirates’ total to four. Israel and Saudi Arabia tied with two 200-meter-plus completions, with Qatar marking one.
Africa completed its second 200-meter-plus building, Britam Tower, which is both Kenya’s and its capital Nairobi’s first (see Figure 9). Due to rapid population growth, we expect to see more completions in Africa in the coming years.
North America (includes Central America) North America more than doubled its 2016 record with 15 tall building completions in 2017, for a global share of 10.4 percent (see Figure 7). This was reflected both in the United States, which saw 10 completions in 2017, and Canada, which completed five buildings of 200 meters or greater height.
Figure 8. Third-Tallest in 2017: Marina 101, Dubai, 425 meters. © Lester Ali
China1
32
3
1
4
8
666
1112
1314
20 20
14
16
22
25
20
37
22
65
69
83
76
Middle East12
11
8
109
10
12
17
23
15
8
11
87
33
Europe34
3
5
1112
11112
1
43
2
4
8
USA2 222
43
76
7
34
21
211
2
54 4
5
2
5
7
98
9
5
23
12
45
23
9
233
112 2
1
43
1 11 1
North America1
54
6
15
78
221
6
44
2
5
21
2111
11
6
11
8
3
65
4
6
9
5
23
12
3333
9
233
12
12
11
3
1
3
1 11 1
1
3
China Current Total: 579
China1
32
3
1
4
8
666
1112
1314
20 20
14
16
22
25
20
37
22
65
69
83
76
Middle East12
11
8
109
10
12
17
23
15
8
11
87
33
Europe34
3
5
1112
11112
1
43
2
4
8
USA2 222
43
76
7
34
21
211
2
54 4
5
2
5
7
98
9
5
23
12
45
23
9
233
112 2
1
43
1 11 1
North America1
54
6
15
78
221
6
44
2
5
21
2111
11
6
11
8
3
65
4
6
9
5
23
12
3333
9
233
12
12
11
3
1
3
1 11 1
1
3
Europe Current Total: 48
Figure 7. Number of 200-meter-plus tall buildings completed by region/country since 1960.
China1
32
3
1
4
8
666
1112
1314
20 20
14
16
22
25
20
37
22
65
69
83
76
Middle East12
11
8
109
10
12
17
23
15
8
11
87
33
Europe34
3
5
1112
11112
1
43
2
4
8
USA2 222
43
76
7
34
21
211
2
54 4
5
2
5
7
98
9
5
23
12
45
23
9
233
112 2
1
43
1 11 1
North America1
54
6
15
78
221
6
44
2
5
21
2111
11
6
11
8
3
65
4
6
9
5
23
12
3333
9
233
12
12
11
3
1
3
1 11 1
1
3
Middle East Current Total: 149
China1
32
3
1
4
8
666
1112
1314
20 20
14
16
22
25
20
37
22
65
69
83
76
Middle East12
11
8
109
10
12
17
23
15
8
11
87
33
Europe34
3
5
1112
11112
1
43
2
4
8
USA2 222
43
76
7
34
21
211
2
54 4
5
2
5
7
98
9
5
23
12
45
23
9
233
112 2
1
43
1 11 1
North America1
54
6
15
78
221
6
44
2
5
21
2111
11
6
11
8
3
65
4
6
9
5
23
12
3333
9
233
12
12
11
3
1
3
1 11 1
1
3
North America Current Total: 210
Yearly 200-meter-plus Tall Building Completions, By Region/Country
The Council on Tall Buildings and Urban Habitat 2017 Year in Review report www.ctbuh.org | www.skyscrapercenter.com
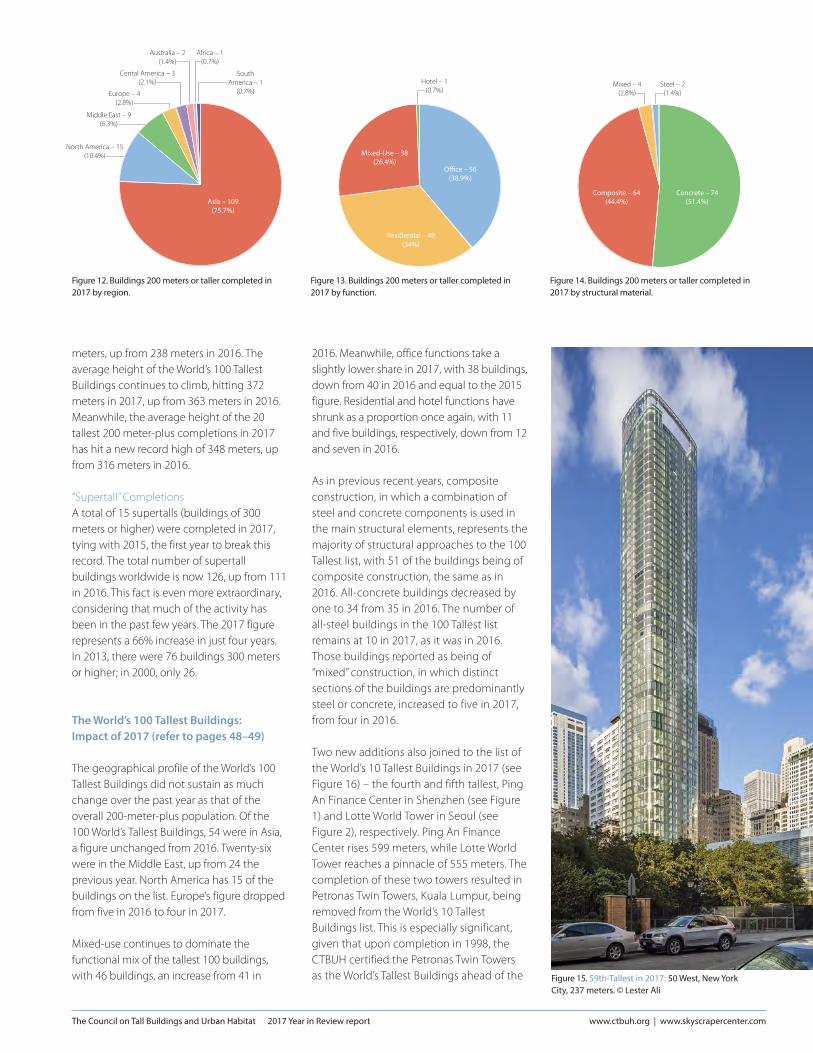
Completions by Function The functional share of tall buildings in 2017 proved to be among the most interesting discoveries in the study, as the data showed a large shift from all-office and mixed-use function to all-residential towers (see Figure 13). Buildings with all-residential functions spiked to 49 completions, or 34 percent of the total, up from just 19, or 15% of the total last year. At the same time, all-office building completions fell to 56, or 39 percent of the total, compared to 67, or 52 percent of completions in 2016. Of all the pure-office buildings completed, 44, or 78.6%, were in China.
Completions by Material Of the 144 buildings of 200 meters or greater height completed in 2017, 74, or 51 percent, used concrete as the main structural material; while 64, or 44 percent, used a composite of steel and concrete (see Figure 14). The significant use of concrete can be attributed to a combination of concrete’s relative ubiquity and lower cost in many regions, as well as its comparative simplicity in construction, which would increase its appeal in regions with lower-skilled labor pools.
In 2017, two buildings had all-steel construction, consistent with the 2016 figure. As of this writing, there were only seventeen 200-meter-plus buildings currently under construction that employed all-steel structural systems.
Average Height The average height of 200-meter-plus buildings completed in 2017 was 244
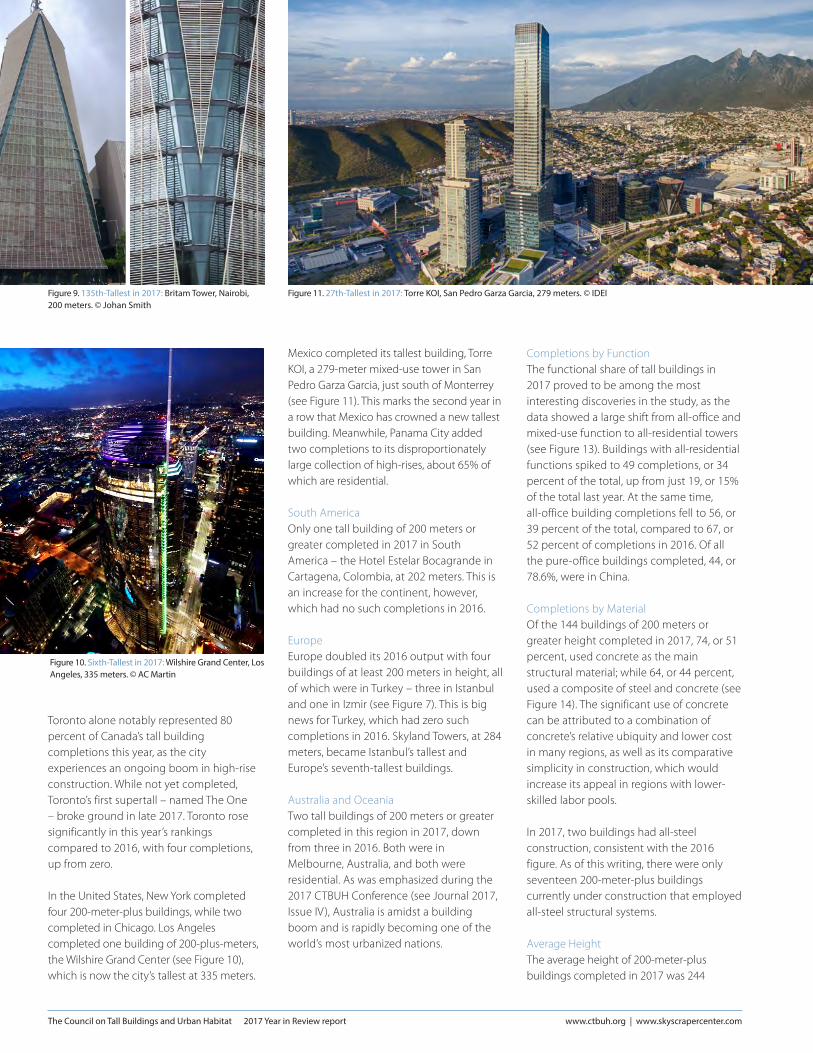
Toronto alone notably represented 80 percent of Canada’s tall building completions this year, as the city experiences an ongoing boom in high-rise construction. While not yet completed, Toronto’s first supertall – named The One – broke ground in late 2017. Toronto rose significantly in this year’s rankings compared to 2016, with four completions, up from zero.
In the United States, New York completed four 200-meter-plus buildings, while two completed in Chicago. Los Angeles completed one building of 200-plus-meters, the Wilshire Grand Center (see Figure 10), which is now the city’s tallest at 335 meters.
Mexico completed its tallest building, Torre KOI, a 279-meter mixed-use tower in San Pedro Garza Garcia, just south of Monterrey (see Figure 11). This marks the second year in a row that Mexico has crowned a new tallest building. Meanwhile, Panama City added two completions to its disproportionately large collection of high-rises, about 65% of which are residential.
South America Only one tall building of 200 meters or greater completed in 2017 in South America – the Hotel Estelar Bocagrande in Cartagena, Colombia, at 202 meters. This is an increase for the continent, however, which had no such completions in 2016.
Europe Europe doubled its 2016 output with four buildings of at least 200 meters in height, all of which were in Turkey – three in Istanbul and one in Izmir (see Figure 7). This is big news for Turkey, which had zero such completions in 2016. Skyland Towers, at 284 meters, became Istanbul’s tallest and Europe’s seventh-tallest buildings.
Australia and Oceania Two tall buildings of 200 meters or greater completed in this region in 2017, down from three in 2016. Both were in Melbourne, Australia, and both were residential. As was emphasized during the 2017 CTBUH Conference (see Journal 2017, Issue IV), Australia is amidst a building boom and is rapidly becoming one of the world’s most urbanized nations.
Figure 10. Sixth-Tallest in 2017: Wilshire Grand Center, Los Angeles, 335 meters. © AC Martin
Figure 11. 27th-Tallest in 2017: Torre KOI, San Pedro Garza Garcia, 279 meters. © IDEIFigure 9. 135th-Tallest in 2017: Britam Tower, Nairobi, 200 meters. © Johan Smith
The Council on Tall Buildings and Urban Habitat 2017 Year in Review report www.ctbuh.org | www.skyscrapercenter.com
meters, up from 238 meters in 2016. The average height of the World’s 100 Tallest Buildings continues to climb, hitting 372 meters in 2017, up from 363 meters in 2016. Meanwhile, the average height of the 20 tallest 200 meter-plus completions in 2017 has hit a new record high of 348 meters, up from 316 meters in 2016.
“Supertall” Completions A total of 15 supertalls (buildings of 300 meters or higher) were completed in 2017, tying with 2015, the first year to break this record. The total number of supertall buildings worldwide is now 126, up from 111 in 2016. This fact is even more extraordinary, considering that much of the activity has been in the past few years. The 2017 figure represents a 66% increase in just four years. In 2013, there were 76 buildings 300 meters or higher; in 2000, only 26. The World’s 100 Tallest Buildings: Impact of 2017 (refer to pages 48–49)
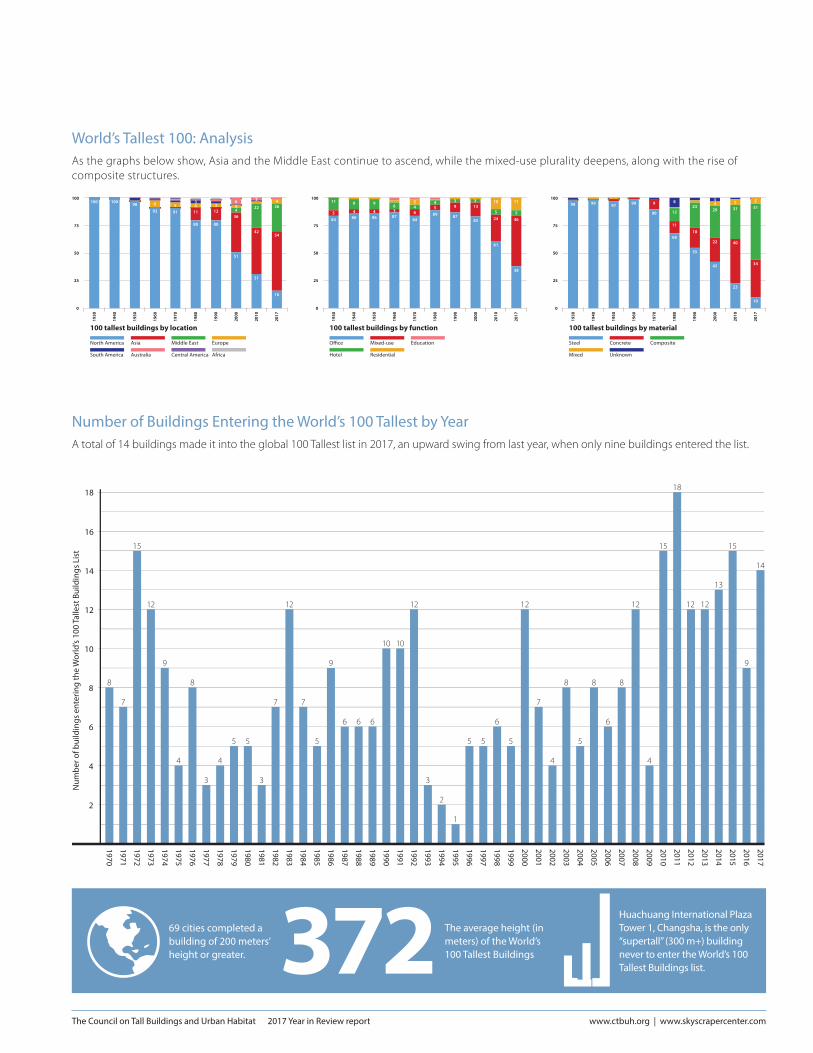
The geographical profile of the World’s 100 Tallest Buildings did not sustain as much change over the past year as that of the overall 200-meter-plus population. Of the 100 World’s Tallest Buildings, 54 were in Asia, a figure unchanged from 2016. Twenty-six were in the Middle East, up from 24 the previous year. North America has 15 of the buildings on the list. Europe’s figure dropped from five in 2016 to four in 2017.
Mixed-use continues to dominate the functional mix of the tallest 100 buildings, with 46 buildings, an increase from 41 in
2016. Meanwhile, office functions take a slightly lower share in 2017, with 38 buildings, down from 40 in 2016 and equal to the 2015 figure. Residential and hotel functions have shrunk as a proportion once again, with 11 and five buildings, respectively, down from 12 and seven in 2016.
As in previous recent years, composite construction, in which a combination of steel and concrete components is used in the main structural elements, represents the majority of structural approaches to the 100 Tallest list, with 51 of the buildings being of composite construction, the same as in 2016. All-concrete buildings decreased by one to 34 from 35 in 2016. The number of all-steel buildings in the 100 Tallest list remains at 10 in 2017, as it was in 2016. Those buildings reported as being of “mixed” construction, in which distinct sections of the buildings are predominantly steel or concrete, increased to five in 2017, from four in 2016.
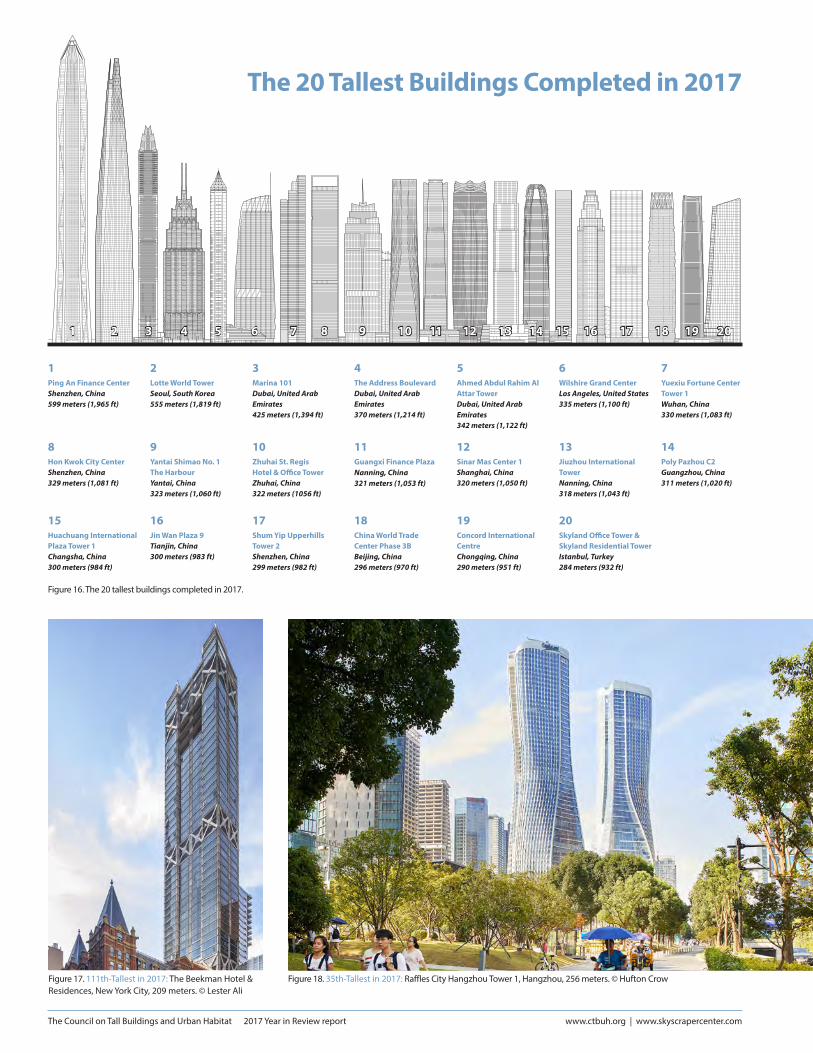
Two new additions also joined to the list of the World’s 10 Tallest Buildings in 2017 (see Figure 16) – the fourth and fifth tallest, Ping An Finance Center in Shenzhen (see Figure 1) and Lotte World Tower in Seoul (see Figure 2), respectively. Ping An Finance Center rises 599 meters, while Lotte World Tower reaches a pinnacle of 555 meters. The completion of these two towers resulted in Petronas Twin Towers, Kuala Lumpur, being removed from the World’s 10 Tallest Buildings list. This is especially significant, given that upon completion in 1998, the CTBUH certified the Petronas Twin Towers as the World’s Tallest Buildings ahead of the
Figure 14. Buildings 200 meters or taller completed in 2017 by structural material.
Figure 13. Buildings 200 meters or taller completed in 2017 by function.
Figure 12. Buildings 200 meters or taller completed in 2017 by region.
Hotel – 1(0.7%)
Office – 56(38.9%)
Mixed-Use – 38(26.4%)
Residential – 49(34%)
Concrete – 74(51.4%)
Composite – 64(44.4%)
Steel – 2 (1.4%)
Mixed – 4 (2.8%)
Asia – 109(75.7%)
South America – 1
(0.7%)
Africa – 1(0.7%)
Australia – 2(1.4%)
Cental America – 3(2.1%)
Europe – 4(2.8%)
Middle East – 9(6.3%)
North America – 15(10.4%)
Figure 15. 59th-Tallest in 2017: 50 West, New York City, 237 meters. © Lester Ali
The Council on Tall Buildings and Urban Habitat 2017 Year in Review report www.ctbuh.org | www.skyscrapercenter.com
Figure 17. 111th-Tallest in 2017: The Beekman Hotel & Residences, New York City, 209 meters. © Lester Ali
Figure 18. 35th-Tallest in 2017: Raffles City Hangzhou Tower 1, Hangzhou, 256 meters. © Hufton Crow
Figure 16. The 20 tallest buildings completed in 2017.
The 20 Tallest Buildings Completed in 2017
1 2 3 4 5 6 7 8 9 10 11 12 13 14 15 16 17 18 19 20
1Ping An Finance CenterShenzhen, China 599 meters (1,965 ft)
5Ahmed Abdul Rahim Al Attar TowerDubai, United Arab Emirates342 meters (1,122 ft)
4The Address BoulevardDubai, United Arab Emirates 370 meters (1,214 ft)
2Lotte World Tower Seoul, South Korea555 meters (1,819 ft)
3Marina 101Dubai, United Arab Emirates425 meters (1,394 ft)
6Wilshire Grand CenterLos Angeles, United States 335 meters (1,100 ft)
7Yuexiu Fortune Center Tower 1Wuhan, China330 meters (1,083 ft)
14Poly Pazhou C2Guangzhou, China 311 meters (1,020 ft)
10Zhuhai St. Regis Hotel & Office TowerZhuhai, China 322 meters (1056 ft)
9Yantai Shimao No. 1 The HarbourYantai, China 323 meters (1,060 ft)
8Hon Kwok City CenterShenzhen, China 329 meters (1,081 ft)
11Guangxi Finance PlazaNanning, China 321 meters (1,053 ft)
13Jiuzhou International TowerNanning, China 318 meters (1,043 ft)
12Sinar Mas Center 1Shanghai, China320 meters (1,050 ft)
15Huachuang International Plaza Tower 1Changsha, China 300 meters (984 ft)
16Jin Wan Plaza 9Tianjin, China 300 meters (983 ft)
19Concord International CentreChongqing, China 290 meters (951 ft)
17Shum Yip Upperhills Tower 2Shenzhen, China 299 meters (982 ft)
18China World Trade Center Phase 3BBeijing, China 296 meters (970 ft)
20Skyland Office Tower & Skyland Residential TowerIstanbul, Turkey284 meters (932 ft)

The Council on Tall Buildings and Urban Habitat 2017 Year in Review report www.ctbuh.org | www.skyscrapercenter.com
Willis (then Sears) Tower in Chicago, to much controversy.
While a total of 15 supertalls were completed in 2017, only 14 entered the World’s 100 Tallest Buildings list. Thus, 2017 saw the completion of the world’s first supertall building never to enter the 100 Tallest list – Huachuang International Plaza in Changsha, China.
Analysis
Overall, 2017 was a record-breaking year for skyscraper completions on a variety of fronts. We’re once again witnessing an all-time-high for 200-meter-plus building completions, with this year’s total increasing by 350% over the past decade. While the total number of tall building completions is an important metric to watch, the data on the rapid geographic diversification of 200-meter-plus building completions, in 69 cities across 23 countries, is perhaps the most telling result. In 2007, only 20 cities across the globe completed 200-meter-plus buildings – the highest number on record at the time. A decade later, the number of cities represented in this report has more than tripled. A record 28 of those cities completed their new tallest buildings in 2017.
China still leads the world in 200-meter-plus building completions, but the nation may start to lose its dramatic lead as other
countries, such as India, accelerate economic and population growth. North America, which for much of the 20th century completed the majority of 200-meter-plus buildings in the world, is also beginning to see a resurgence in tall building construction. In addition, new technologies and increased international capital flows are facilitating the creation of ever-taller skyscrapers.
The data from 2017 shows a continuation of the trend towards a greater global proliferation of skyscraper construction. Most of the prevailing trends of the past few years – the preponderance of construction taking place in Asia, and in particular, China; the predominance of composite construction being used to achieve greater heights and more complex designs – have held steady.
Figure 20. 49th-Tallest in 2017: Tencent Seafront Tower 1, Shenzhen, 246 meters © Shao Feng
Figure 19. 87th-Tallest in 2017: 150 North Riverside, Chicago, 221 meters. © Tom Rossiter Photography
Figure 21. 10th-Tallest in 2017: Zhuhai St. Regis Hotel & Office Tower, Zhuhai, 322 meters. © Jason Leung
The Council on Tall Buildings and Urban Habitat 2017 Year in Review report www.ctbuh.org | www.skyscrapercenter.com
But a few discoveries this year are notable, if not wildly divergent.
The increase in geographic diversity invites further scrutiny. Of the 69 cities with at least one 200-meter-plus building completion, 34 were in China. While not entirely surprising, nevertheless it is clear that, in addition to powerhouses like Shenzhen, there are also some smaller regional cities joining the list, such as Baoji in Shaanxi province; Yantai, in Shandong province; Lianyungang, in Jiangsu; and Yinchuan, in Ningxia. Although in many cases each of these cities has erected only a single building of 200 meters or more in 2017, and each of these cities has more than one million people, the term “smaller regional city” is relative in China, which seems to be executing on its plan to create impressive skylines and more evenly distribute people in its campaign of mass urbanization.
Outside China, some infrequently-seen city names include Giv’atayim, Israel (near Tel Aviv); Izmir, Turkey; Nairobi, Kenya and Pyongyang, North Korea. The reasons for this are likely as diverse as these countries are from each other; the functions span office, residential and mixed-use.
The resurgence of all-residential tall buildings, against what had been an
Figure 23. 117th-Tallest in 2017: Rosewood Sanya and International Finance Forum, Sanya, 207 meters. © 1st Image
increasing trend towards a mix of functions, is also of interest. In the past, CTBUH has credited the prevalence of the mixed-use function in buildings at the upper end of the height range to a developers’ hedging strategy. The greater the number of functions in the building, the less likely it is that economic weakness in one sector could delay or halt the project, or result in it being unsold or unrented for prolonged periods.
Skyscrapers are lagging indicators of economic trends. An investment strategy could be green-lighted under economic conditions that could change significantly throughout the construction period, which could be anywhere from two to 10 years or more. It is tempting to speculate that we are now seeing the built results of a full-blown recovery from the 2008 economic crisis, as greater confidence in single-function programs sparks a resurgence in speculative residential development. Further, there has been growing interest over the past several years in residential real-estate investment by absentee owners as a wealth management strategy. However, market dynamics vary greatly between regions, so it’s likely there are other factors to the story.
Figure 24. 80th-Tallest in 2017: FMC Tower at Cira Centre South, Philadelphia, 223 meters. © Lester Ali
Figure 22. 62nd-Tallest in 2017: Madison Square Park Tower, New York City, 237 meters. © Lester Ali

The Council on Tall Buildings and Urban Habitat 2017 Year in Review report www.ctbuh.org | www.skyscrapercenter.com
Rank Building Name Location Floors Height (m)
1 Goldin Finance 117 Tianjin 128 597
2 China Zun Tower Beijing 108 528
3 Lakhta Center St. Petersburg 86 462
4 Changsha IFS Tower T1 Changsha 94 452
5 Suzhou IFS Suzhou 98 450
6 Wuhan Center Tower Wuhan 88 438
7 China Resources Headquarters Shenzhen 67 393
8 Capital Market Authority Tower Riyadh 76 385
9 Nanning Logan Century 1 Nanning 82 381
10 Hanking Center Tower Shenzhen 73 350
Table 2: Projected 10 tallest buildings in 2018Middle EastAsia Europe
Table 1: All buildings 200 meters or taller completed in 2017 (144 no.)
Rank Building Name Location Floors Height (m)
1 Ping An Finance Center Shenzhen 115 599
2 Lotte World Tower Seoul 123 555
3 Marina 101 Dubai 101 425
4 The Address Boulevard Dubai 73 370
5 Ahmed Abdul Rahim Al Attar Tower Dubai 76 342
6 Wilshire Grand Center Los Angeles 62 335
7 Yuexiu Fortune Center Tower 1 Wuhan 69 330
8 Hon Kwok City Center Shenzhen 80 329
9 Yantai Shimao No. 1 The Harbour Yantai 59 323
10 Zhuhai St. Regis Hotel & Office Tower Zhuhai 61 323
11 Guangxi Finance Plaza Nanning 68 321
12 Sinar Mas Center 1 Shanghai 65 320
13 Jiuzhou International Tower Nanning 71 318
14 Poly Pazhou C2 Guangzhou 61 311
15 Huachuang International Plaza Tower 1 Changsha 66 300
16 Jin Wan Plaza 9 Tianjin 66 300
17 Shum Yip Upperhills Tower 2 Shenzhen 62 299
18 China World Trade Center Phase 3B Beijing 59 296
19 Concord International Centre Chongqing 64 290
=20 Skyland Office Tower Istanbul 65 284
=20 Skyland Residential Tower Istanbul 64 284
=22 Greenland Zhengzhou Central Plaza North Tower Zhengzhou 63 284
=22 Greenland Zhengzhou Central Plaza South Tower Zhengzhou 63 284
=24 Metropol Tower Istanbul Istanbul 58 280
=24 China Resources Center 2 Hefei 65 280
26 Bodi Center Tower C Hangzhou 57 280
27 Torre KOI San Pedro Garza García 65 279
28 Victoria Dockside Hong Kong 66 274
29 Ryomyong Street Apartment Building Pyongyang 82 270
=30 Suning Plaza Tower A Xuzhou 62 266
=30 One Avighna Park Mumbai 64 266
32 Menara Astra Jakarta 50 262
33 Vanke Chang'an Center Dongguan 60 260
34 One Bloor Street East Toronto 75 257
=35 Raffles City Hangzhou Tower 1 Hangzhou 61 256
=35 Raffles City Hangzhou Tower 2 Hangzhou 59 256
37 CITIC Ruibo Tower 1 Shanghai 55 256
38 Trump Tower At Century City Makati 58 251
39 Banghua World Trade Center Guangzhou 55 250
40 The Shang Salcedo Makati 67 250
41 Shenzhen University Subway Station Tower Shenzhen 51 249
=42 Jinmao International Plaza Tower 1 Changsha 52 248
=42 Jinmao International Plaza Tower 2 Changsha 52 248
44 Brookfield Place Tower One Calgary 56 247
=45 The-W 101 Busan 69 246
=45 The-W 102 Busan 69 246
=45 The-W 103 Busan 69 246
=45 The-W 104 Busan 69 246
49 Tencent Seafront Tower 1 Shenzhen 50 246
=50 Changjiang Media Tower Wuhan 49 243
=50 Setia Eco City - Vogue Suite One Kuala Lumpur 63 243
=52 Sandy Federal Tower Fuzhou 55 240
=52 Shuibei Jewelry Headquarters Tower 1 Shenzhen 48 240
=52 Ryomyong Street 70-Storey Building Pyongyang 70 240
55 Menam Residence Bangkok 59 239
=56 Azrieli Sarona Tel Aviv 53 238
=56 Hunan Daily Media Center Changsha 54 238
=56 CITIC Ruibo Tower 2 Shanghai 52 238
59 50 West New York City 64 237
=60 Wuhan International Financial Plaza Wuhan 51 237
=60 V on Shenton Residential Tower Singapore 54 237
62 Madison Square Park Tower New York City 63 237
63 Strait Pearl Plaza Xiamen 50 235
64 Harbour Plaza Residences East Toronto 66 233
Rank Building Name Location Floors Height (m)
65 Lihe Tower Shenzhen 48 231
66 609 Main at Texas Houston 50 230
=67 Rongchao Headquarters Tower Shenzhen 54 230
=67 China Merchants Bank Tower Nanjing 48 230
69 Grand Hyatt Colombo Colombo 47 230
70 Lanzhou Center Office Tower Lanzhou 40 229
71 Elite 500 Dos Mares Panama City 60 228
72 Al Asmakh Tower Doha 34 227
73 Marina One Singapore 30 225
74 Coastal Center Shenzhen 46 225
75 Shenyang New World Center Tower C Shenyang 57 224
76 Harbour Plaza Residences West Toronto 62 224
77 River Point Chicago 52 223
=78 World Crest Mumbai 57 223
=78 FMC Tower at Cira Centre South Philadelphia 49 223
=78 3 Manhattan West New York City 64 223
81 Optical Valley New World Center A Wuhan 44 222
=82 Shenzhen Energy Headquarters North Tower Shenzhen 43 222
=82 Tianxi Twin Towers 1 Chengdu 65 222
=82 Tianxi Twin Towers 2 Chengdu 65 222
=82 MARQUE Sukhumvit Bangkok 50 222
86 Suzhou Center Plaza 1 Suzhou 56 222
87 150 North Riverside Chicago 50 221
88 Landscape-Brilliant Center Hefei 50 221
89 Telkom Landmark Tower 2 Jakarta 46 220
=90 The Altus Johor Bahru 60 220
=90 Yintai Center Tower 1 Chengdu 52 220
=90 Horoy Times Square A Shenzhen 46 220
=90 Kaisa Center Phase 3 Huizhou 45 220
=90 Zhanjiang Fortune Meeting Zhanjiang 45 220
=95 Light House Melbourne 69 218
=95 Maike Business Center Tower 1 Xi An 50 218
97 Evolution Tower Panama City 54 218
98 Shenyang New World Center Tower E Shenyang 55 218
=99 Genyuan Marriott Hotel Yinchuan 50 216
=99 Mistral Office Tower Izmir 48 216
101 Chancheng Greenland Center Phase 2 Office Tower 1 Foshan 48 214
102 Lodha Venezia Tower A Mumbai 68 214
=103 The Sentral Residences Tower A Kuala Lumpur 58 210
=103 The Sentral Residences Tower B Kuala Lumpur 58 210
=105 Greenland Center Tower 8 Nanning 47 210
=105 Fortune Center Residential Tower 2 Liuzhou 60 210
=105 Fortune Financial Centre Chongqing 45 210
=105 SINIC Center Nanchang 35 210
=105 Ryomyong Street 55-Storey Building Pyongyang 55 210
110 FWD Tower Jakarta 40 209
111 The Beekman Hotel & Residences New York City 47 209
112 Horizon Skyline Garden Office Tower Shenzhen 44 209
113 The Parkhouse Nishi Shinjuku Tower 60 Tokyo 60 209
=114 Huijing Center Tower 1 Dongguan 52 208
=114 Sunshine International Tower Lianyungang 60 208
=114 CECIC Headquarters Nanchang 208
117 Rosewood Sanya and International Finance Forum Sanya 46 207
118 Wynn International Financial Center Xi An 46 206
119 Akasaka Intercity AIR Tokyo 37 205
=120 Al Rajhi Bank Tower Riyadh 36 205
=120 Eternity Apartment @ District 8 Jakarta 51 205
=120 Infinity Apartment @ District 8 Jakarta 51 205
=120 Horizon Tower A Abu Dhabi 63 205
=120 Harmony Square Nantong 47 205
125 88 Scott Toronto 58 204
126 Baoji IFC Baoji 41 203
=127 Triumph One #1 Nanning 47 203
=127 Triumph One #2 Nanning 47 203
Rank Building Name Location Floors Height (m)
=129 EQ Tower Melbourne 63 202
=129 Hotel Estelar Bocagrande Cartagena 52 202
131 The Shahar Tower Givatayim 52 202
132 F5 Tower Seattle 43 201
=133 Triumph One #3 Nanning 46 200
=133 Triumph One #4 Nanning 46 200
135 Britam Tower Nairobi 31 200
=136 Three Central Makati 51 200
=136 Chengdu World Financial Center 1 Chengdu 46 200
=136 Chengdu World Financial Center 2 Chengdu 46 200
=136 Nanjing Financial City Tower 4 Nanjing 46 200
=136 Seoul Trimage Tower I Seoul 47 200
=136 Seoul Trimage Tower II Seoul 47 200
=136 Ryomyong Street 50-Storey Building Pyongyang 50 200
=136 Al-Obeikan Hilton Tower Hotel Riyadh 35 200
=136 Victoria Mansion Tower 1 Dalian 57 200
Projections for 2018
As indicated in Table 2, we expect between 130 and 160 buildings of 200 meters’ or greater height to complete in 2018. Between 12 and 20 of these buildings are predicted to be supertall (300 meters or taller). This is fairly conservative, taking into consideration the total number of projects currently underway. However, as many other research organizations now do, we must also acknowledge the increasing economic and political volatility in many places around the world. Our increasingly interconnected, global industry means that disruptions to planning, design and construction of tall building projects could occur unexpectedly. As always, the most up-to-date information about the status of skyscrapers around the world can be found at the CTBUH Skyscraper Center: www.skyscrapercenter.com
See Table 2 for the 10 tallest buildings projected to complete in 2018.
Central America (3 no.)North America (15 no.)Asia (109 no.) Middle East (13 no.) Australia (2 no.) South America (1 no.) Africa (1 no.)
The Council on Tall Buildings and Urban Habitat 2017 Year in Review report www.ctbuh.org | www.skyscrapercenter.com
2001
2002
2003
2004
2005
2006
2007
2008
2009
2010
2011
2012
2013
2014
2015
2016
2018
2017
800 m
400 m
500 m
600 m
700 m
200 m
300 m
Tallest 100:363 meters
2016 Average:238 meters127 Buildings
Tallest 100:372 meters
2017 Average:244 meters144 Buildings
Tallest 100:358 meters
2015 Average:243 meters115 Buildings
Tallest 100:350 meters
2014 Average:242 meters102 Buildings
Tallest 100:344 meters
2013 Average:241 meters74 Buildings
Tallest 100:340 meters
2012 Average:249 meters69 Buildings
Tallest 100:331 meters
2011 Average:245 meters81 Buildings
Tallest 100:323 meters
2010 Average:256 meters73 Buildings
Tallest 100:307 meters
2009 Average:229 meters52 Buildings
Tallest 100:304 meters
2008 Average:245 meters47 Buildings
Tallest 100:298 meters
2007 Average:238 meters32 Buildings
Tallest 100:295 meters
2006 Average:237 meters27 Buildings
Tallest 100:292 meters
2005 Average:228 meters31 Buildings
Tallest 100:290 meters
2004 Average:247 meters18 Buildings
Tallest 100:287 meters
2003 Average:233 meters31 Buildings
Tallest 100:284 meters
2002 Average:223 meters17 Buildings
Tallest 100:283 meters
2001 Average:228 meters22 Buildings
The Global Tall Building Picture: Impact of 2017
Tall Buildings in Numbers
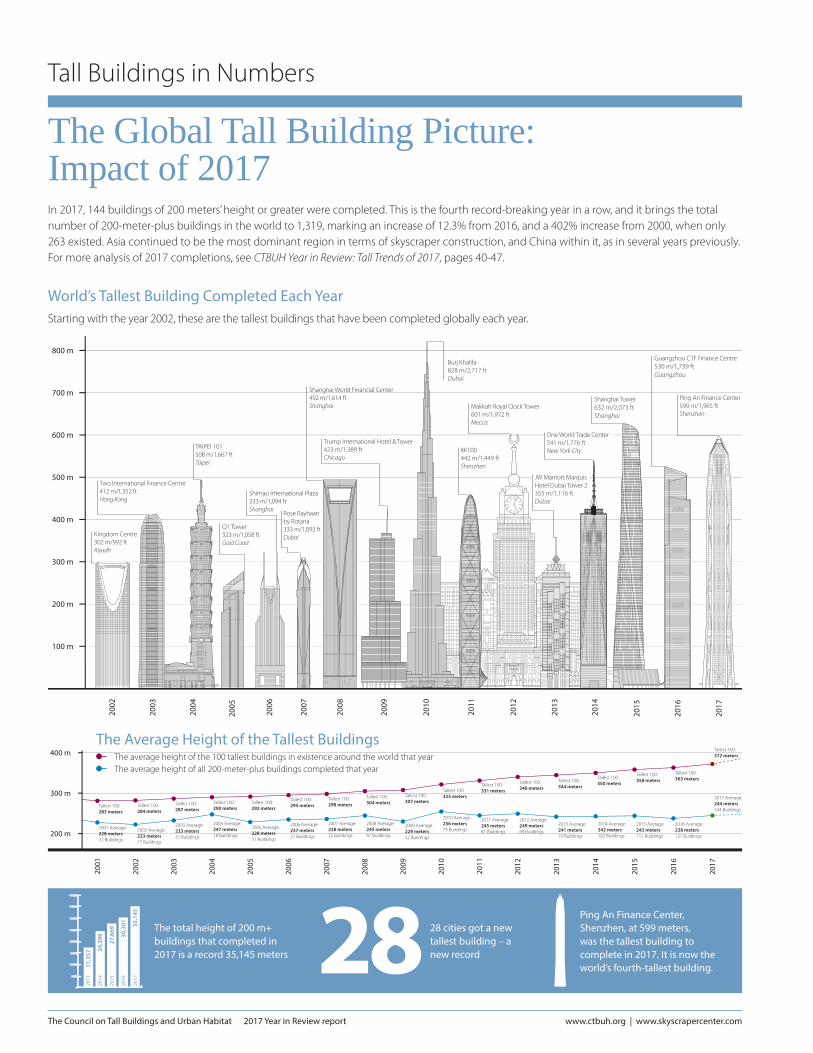
In 2017, 144 buildings of 200 meters’ height or greater were completed. This is the fourth record-breaking year in a row, and it brings the total number of 200-meter-plus buildings in the world to 1,319, marking an increase of 12.3% from 2016, and a 402% increase from 2000, when only 263 existed. Asia continued to be the most dominant region in terms of skyscraper construction, and China within it, as in several years previously. For more analysis of 2017 completions, see CTBUH Year in Review: Tall Trends of 2017, pages 40-47.
World’s Tallest Building Completed Each Year Starting with the year 2002, these are the tallest buildings that have been completed globally each year.
The total height of 200 m+ buildings that completed in 2017 is a record 35,145 meters
The Average Height of the Tallest BuildingsThe average height of the 100 tallest buildings in existence around the world that yearThe average height of all 200-meter-plus buildings completed that year
0
5000
10000
15000
20000
25000
30000
35000
40000
30,3
01
35,1
45
27,6
69
24,3
99
17,3
572013
2014
2015
2016
2017
Ping An Finance Center, Shenzhen, at 599 meters, was the tallest building to complete in 2017. It is now the world’s fourth-tallest building.
28 cities got a new tallest building – a new record
2002
2003
2004
2005
2006
2007
2008
2009
2010
2011
2012
100 m
800 m
400 m
500 m
600 m
700 m
2013
2014
2015
2016
2017
200 m
300 m
Makkah Royal Clock Tower601 m/1,972 ftMecca
KK100442 m/1,449 ftShenzhen
One World Trade Center 541 m/1,776 ftNew York City
Shanghai Tower 632 m/2,073 ftShanghai
Burj Khalifa 828 m/2,717 ftDubai
Trump International Hotel & Tower 423 m/1,389 ftChicago
Shanghai World Financial Center 492 m/1,614 ftShanghai
Q1 Tower 323 m/1,058 ftGold Coast
Shimao International Plaza 333 m/1,094 ftShanghai
TAIPEI 101 508 m/1,667 ftTaipei
Two International Finance Centre 412 m/1,352 ftHong Kong
Kingdom Centre 302 m/992 ftRiyadh
JW Marriott Marquis Hotel Dubai Tower 2 355 m/1,116 ft Dubai
Rose Rayhaan by Rotana 333 m/1,093 ftDubai
Guangzhou CTF Finance Centre530 m/1,739 ftGuangzhou
Ping An Finance Center 599 m/1,965 ftShenzhen
28
The Council on Tall Buildings and Urban Habitat 2017 Year in Review report www.ctbuh.org | www.skyscrapercenter.com
14
12
10
6
8
4
2
16
18
12
18
15 15
4
12 12
8
6
88
4
7
12
5 5
6666
5 5
1
2
5
1010
7
12 12
7
3 3
55
4
3
8
4
9 9 9
12
15
7
8
13
14
Num
ber
of b
uild
ings
ent
erin
g th
e W
orld
’s 10
0 Ta
llest
Bui
ldin
gs L
ist
Hotel Residential
100 tallest buildings by function
Mixed-use EducationOffice
1930
1940
1950
1960
1970
1980
1990
2000
2010
2017
0
25
50
75
100
8487
9
8689
9
87
13
83 24 46
38
1110
61
86
911
84
54 3 3
5 5645
63445
Mixed Unknown
100 tallest buildings by material
Concrete CompositeSteel
1930
1940
1950
1960
1970
1980
1990
2000
2010
2017
0
25
50
75
10099979998 9
90
8
12
11
6818
55
2329
22
42
40
23
31 51
34
10
5 543
South America Australia
100 tallest buildings by location
Asia Middle East
Central America
Europe
Africa
North America
1930
1940
1950
1960
1970
1980
1990
2000
2010
2017
0
25
50
75
100100 100
98
92 91 11
80
12
80
36
51
42
22
31
54
26
16
6
436 5 4
33
43
World’s Tallest 100: Analysis As the graphs below show, Asia and the Middle East continue to ascend, while the mixed-use plurality deepens, along with the rise of composite structures.
Number of Buildings Entering the World’s 100 Tallest by Year A total of 14 buildings made it into the global 100 Tallest list in 2017, an upward swing from last year, when only nine buildings entered the list.
The average height (in meters) of the World’s 100 Tallest Buildings37269 cities completed a
building of 200 meters’ height or greater.
Huachuang International Plaza Tower 1, Changsha, is the only “supertall” (300 m+) building never to enter the World’s 100 Tallest Buildings list.