2017 state of utilities presentation 115 kv underground transmission lines csu 230 kv transmission...
TRANSCRIPT
2017 State of the Utilities
Jerry Forte
Chief Executive Officer
October 20, 2017
Electricity | Natural Gas | Water | Wastewater
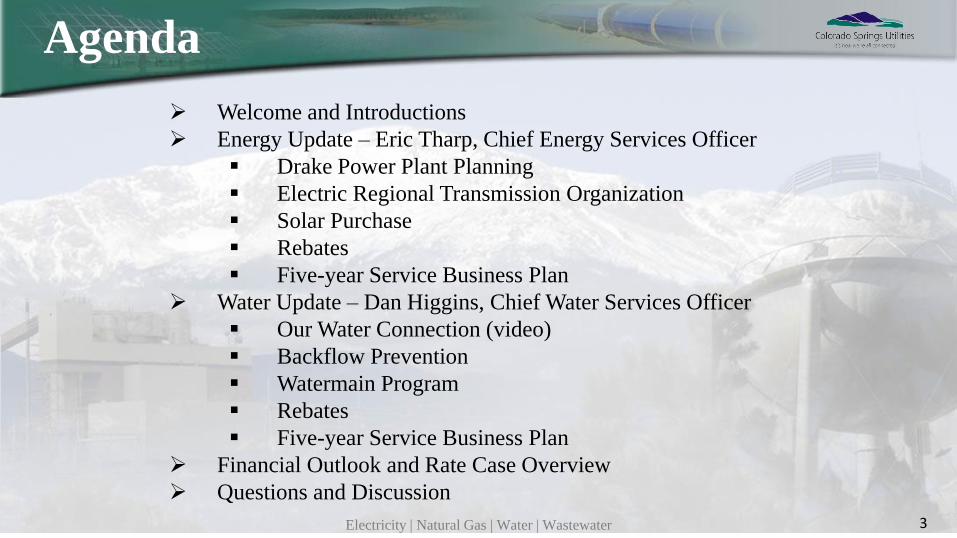
Welcome and Introductions
Energy Update – Eric Tharp, Chief Energy Services Officer
Drake Power Plant Planning
Electric Regional Transmission Organization
Solar Purchase
Rebates
Five-year Service Business Plan
Water Update – Dan Higgins, Chief Water Services Officer
Our Water Connection (video)
Backflow Prevention
Watermain Program
Rebates
Five-year Service Business Plan
Financial Outlook and Rate Case Overview
Questions and Discussion
3
Agenda
Energy Update
Eric Tharp
Chief Energy Services Officer
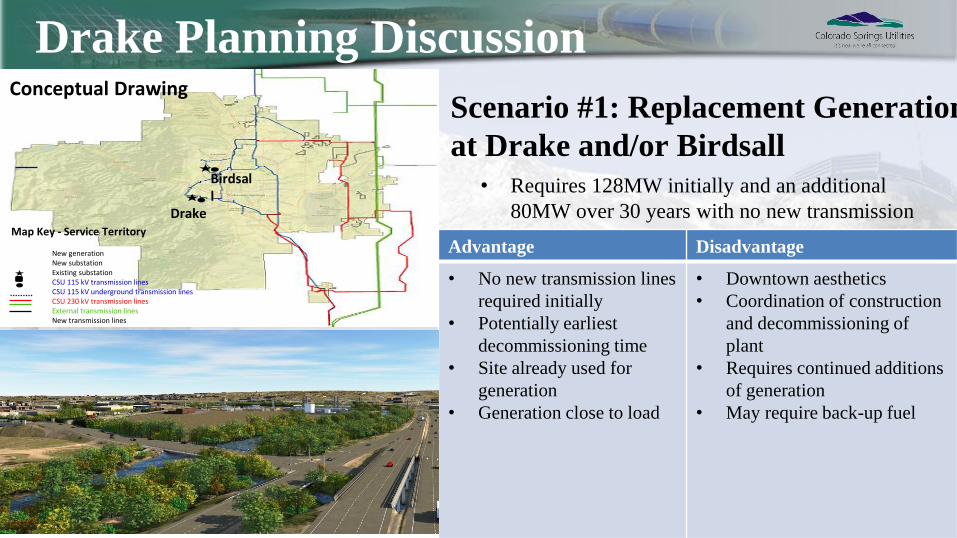
Drake Planning Discussion
Scenario #1: Replacement Generation
at Drake and/or Birdsall
Conceptual Drawing
New generationNew substationExisting substationCSU 115 kV transmission linesCSU 115 kV underground transmission linesCSU 230 kV transmission linesExternal transmission linesNew transmission lines
Map Key - Service Territory
Birdsall
Drake
Conceptual Drawing
Advantage Disadvantage
• No new transmission lines
required initially
• Potentially earliest
decommissioning time
• Site already used for
generation
• Generation close to load
• Downtown aesthetics
• Coordination of construction
and decommissioning of
plant
• Requires continued additions
of generation
• May require back-up fuel
• Requires 128MW initially and an additional
80MW over 30 years with no new transmission
Conceptual Drawing
Kelker
C
BADrake
New generationNew substationExisting substationCSU 115 kV transmission linesCSU 115 kV underground transmission linesCSU 230 kV transmission linesExternal transmission linesNew transmission lines
Map Key - Service Territory
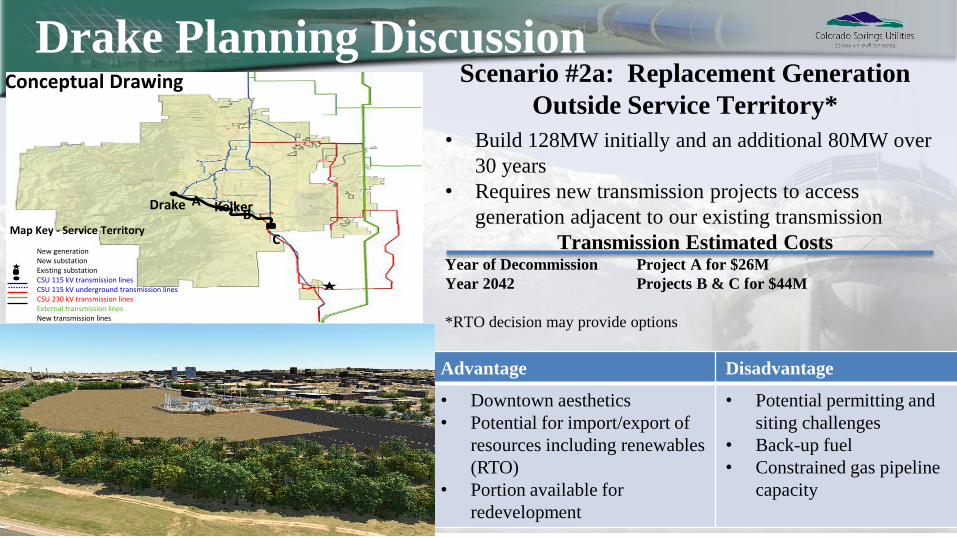
Drake Planning DiscussionScenario #2a: Replacement Generation
Outside Service Territory*
• Build 128MW initially and an additional 80MW over
30 years
• Requires new transmission projects to access
generation adjacent to our existing transmission
Transmission Estimated CostsYear of Decommission Project A for $26M
Year 2042 Projects B & C for $44M
*RTO decision may provide options
Note: New Transmission routes, substations, project siting and permitting costs have not yet been determined. Map is only conceptual.
Advantage Disadvantage
• Downtown aesthetics
• Potential for import/export of
resources including renewables
(RTO)
• Portion available for
redevelopment
• Potential permitting and
siting challenges
• Back-up fuel
• Constrained gas pipeline
capacity
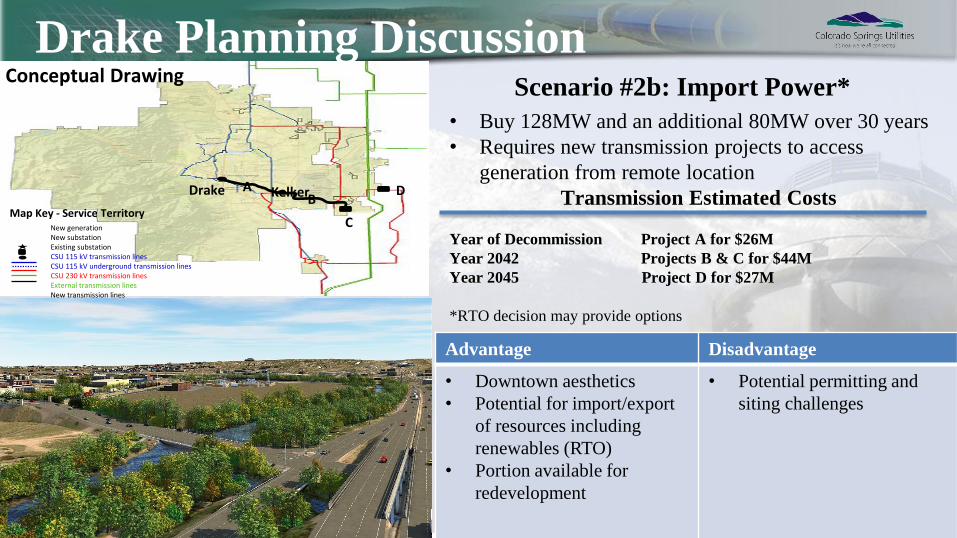
Drake Planning DiscussionScenario #2b: Import Power*
• Buy 128MW and an additional 80MW over 30 years
• Requires new transmission projects to access
generation from remote location
Transmission Estimated Costs
Year of Decommission Project A for $26M
Year 2042 Projects B & C for $44M
Year 2045 Project D for $27M
*RTO decision may provide options
Conceptual Drawing
Kelker D
C
BADrake
New generationNew substationExisting substationCSU 115 kV transmission linesCSU 115 kV underground transmission linesCSU 230 kV transmission linesExternal transmission linesNew transmission lines
Map Key - Service Territory
Note: New Transmission routes, substations, project siting and permitting costs have not yet been determined. Map is only conceptual.
Advantage Disadvantage
• Downtown aesthetics
• Potential for import/export
of resources including
renewables (RTO)
• Portion available for
redevelopment
• Potential permitting and
siting challenges
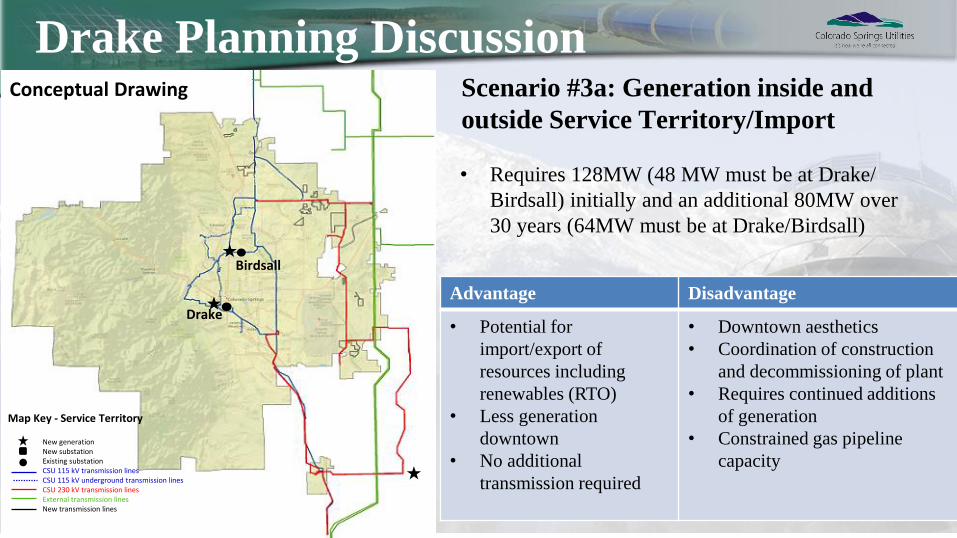
Drake Planning DiscussionScenario #3a: Generation inside and
outside Service Territory/Import
• Requires 128MW (48 MW must be at Drake/
Birdsall) initially and an additional 80MW over
30 years (64MW must be at Drake/Birdsall)
Conceptual Drawing
Birdsall
Drake
New generationNew substationExisting substationCSU 115 kV transmission linesCSU 115 kV underground transmission linesCSU 230 kV transmission linesExternal transmission linesNew transmission lines
Map Key - Service Territory
Conceptual Drawing
Advantage Disadvantage
• Potential for
import/export of
resources including
renewables (RTO)
• Less generation
downtown
• No additional
transmission required
• Downtown aesthetics
• Coordination of construction
and decommissioning of plant
• Requires continued additions
of generation
• Constrained gas pipeline
capacity
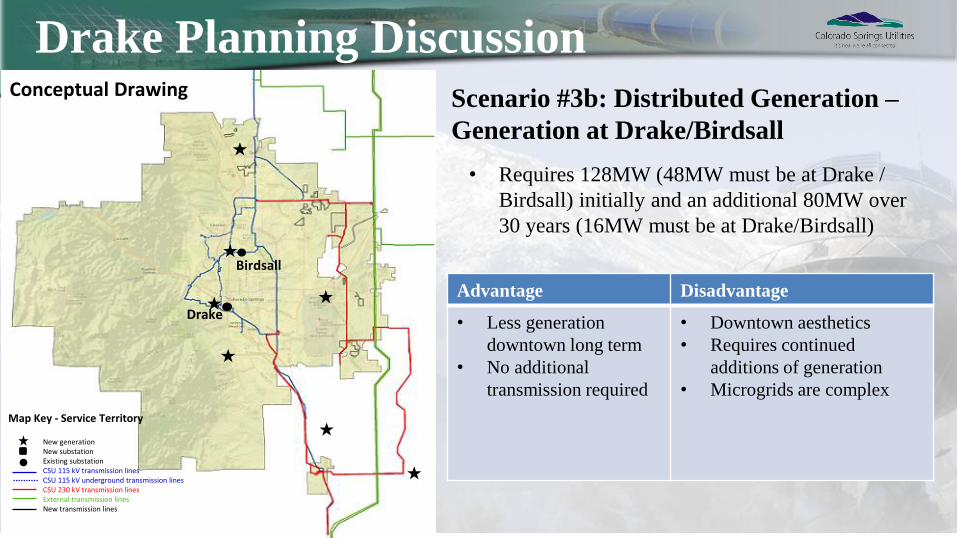
Drake Planning Discussion
Scenario #3b: Distributed Generation –
Generation at Drake/Birdsall
• Requires 128MW (48MW must be at Drake /
Birdsall) initially and an additional 80MW over
30 years (16MW must be at Drake/Birdsall)
Conceptual Drawing
Birdsall
Drake
New generationNew substationExisting substationCSU 115 kV transmission linesCSU 115 kV underground transmission linesCSU 230 kV transmission linesExternal transmission linesNew transmission lines
Map Key - Service Territory
Conceptual Drawing
Advantage Disadvantage
• Less generation
downtown long term
• No additional
transmission required
• Downtown aesthetics
• Requires continued
additions of generation
• Microgrids are complex
Birdsall
Drake
New generationNew substationExisting substationCSU 115 kV transmission linesCSU 115 kV underground transmission linesCSU 230 kV transmission linesExternal transmission linesNew transmission lines
Map Key - Service Territory
Kelker
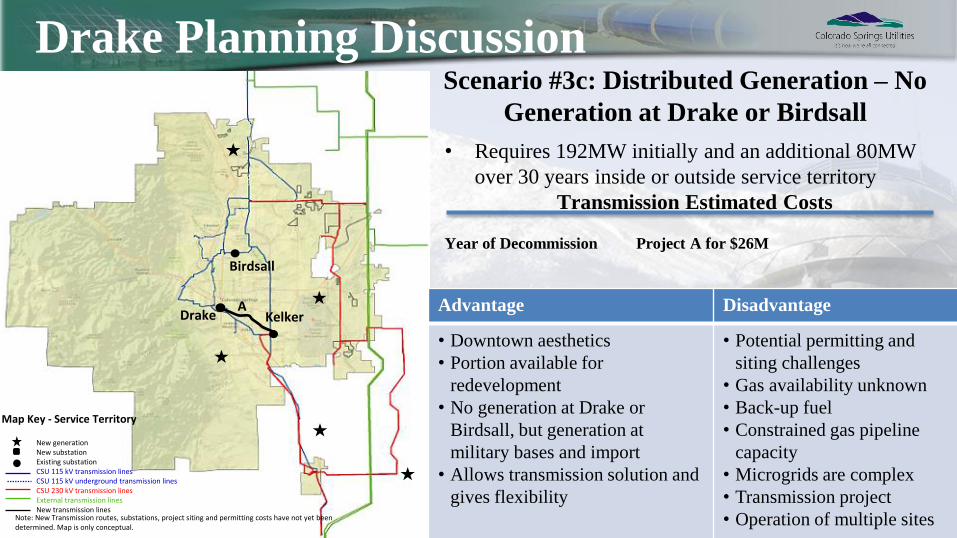
Drake Planning DiscussionScenario #3c: Distributed Generation – No
Generation at Drake or Birdsall
• Requires 192MW initially and an additional 80MW
over 30 years inside or outside service territory
Transmission Estimated Costs
Year of Decommission Project A for $26M
Note: New Transmission routes, substations, project siting and permitting costs have not yet been determined. Map is only conceptual.
Advantage Disadvantage
• Downtown aesthetics
• Portion available for
redevelopment
• No generation at Drake or
Birdsall, but generation at
military bases and import
• Allows transmission solution and
gives flexibility
• Potential permitting and
siting challenges
• Gas availability unknown
• Back-up fuel
• Constrained gas pipeline
capacity
• Microgrids are complex
• Transmission project
• Operation of multiple sites
A
Electric Regional Transmission
Organization: Mountain West
Transmission Group
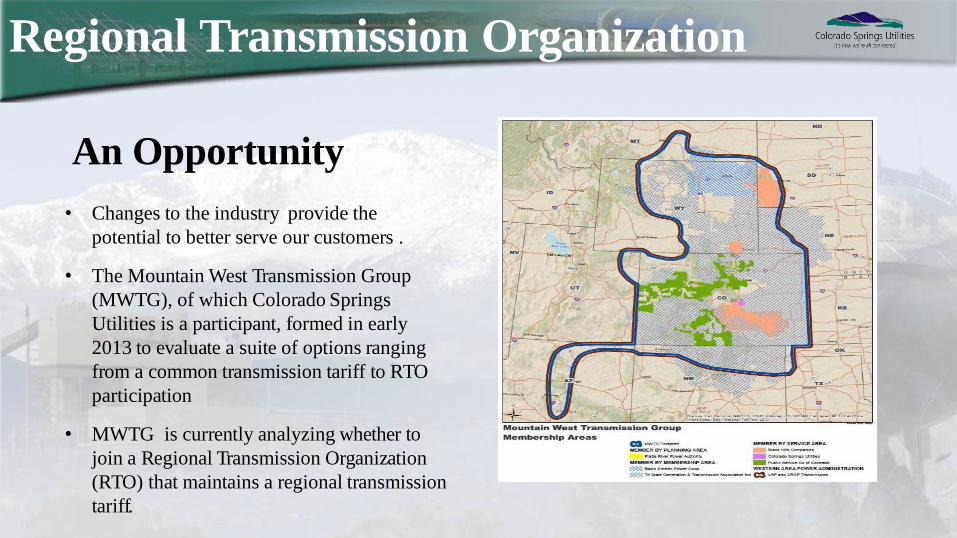
An Opportunity
• Changes to the industry provide the
potential to better serve our customers .
• The Mountain West Transmission Group
(MWTG), of which Colorado Springs
Utilities is a participant, formed in early
2013 to evaluate a suite of options ranging
from a common transmission tariff to RTO
participation
• MWTG is currently analyzing whether to
join a Regional Transmission Organization
(RTO) that maintains a regional transmission
tariff.
Regional Transmission Organization
Strategic Considerations
RTO Implications For:
Energy Vision• Potential access to new renewables
• Potential facilitation of greater renewable integration
• Potential use of purchase power agreements to meet renewable portfolio standards
Rates• Potential of lower customer rates for the entire region
• Regional rate differentiation for Colorado Springs Utilities may erode
Transmission Infrastructure• Planning
• Permitting
• Siting
Strategic Considerations
RTO Implications For:
Utilization of Available Generation Capacity• Potential to increase use of available capacity
Efficiencies, Economies of Scale• Dispatch of lowest cost units
• Most efficient use of transmission
Autonomy• Dispatch of generation
• Transmission cost sharing based on member benefit
• Greater FERC scrutiny on transmission revenue requirement - “Just and reasonable”
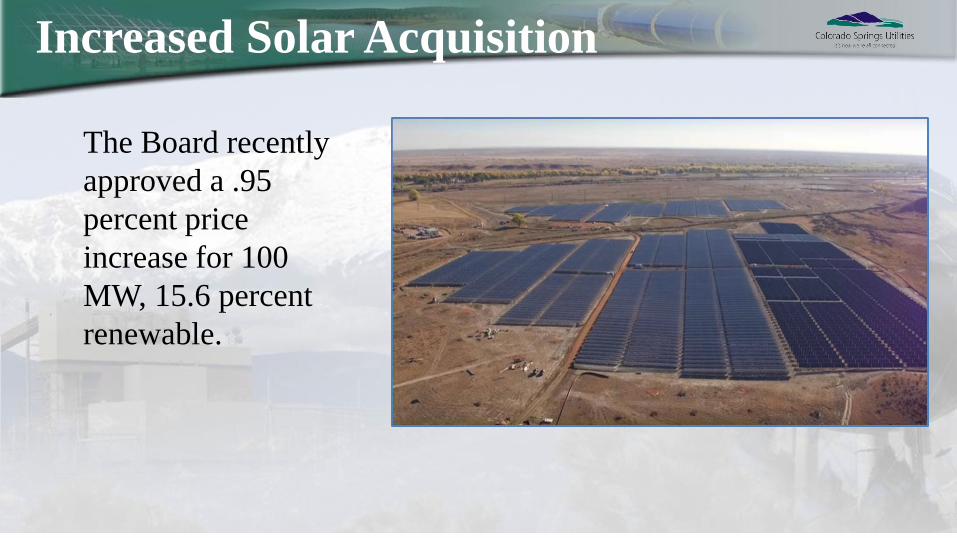
The Board recently
approved a .95
percent price
increase for 100
MW, 15.6 percent
renewable.
Increased Solar Acquisition

Electricity | Natural Gas | Water | Wastewater
• Custom Energy Efficiency - Applicable to projects not covered under other business rebate programs
• Lighting - Rebate commensurate with energy savings
• Cooling - Instant price markdown at distributor locations
• Builder Incentive - For new home construction, rebate based on Home Energy Rating Score (HERS)
• Business/Multifamily Windows
• Showerheads
• Community Solar Gardens
• Solar Photovoltaic
• Solar Thermal
Demand Side Management & Renewable
Energy Incentives
Coming in 2018
Contact your Account Manager for all program details
Business Demand Reduction Incentive Program
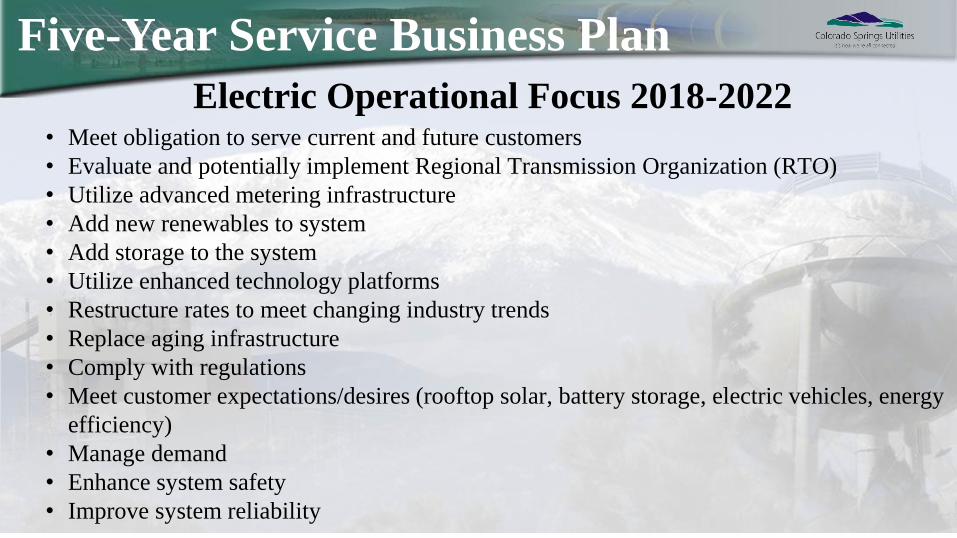
Five-Year Service Business Plan
Electric Operational Focus 2018-2022• Meet obligation to serve current and future customers
• Evaluate and potentially implement Regional Transmission Organization (RTO)
• Utilize advanced metering infrastructure
• Add new renewables to system
• Add storage to the system
• Utilize enhanced technology platforms
• Restructure rates to meet changing industry trends
• Replace aging infrastructure
• Comply with regulations
• Meet customer expectations/desires (rooftop solar, battery storage, electric vehicles, energy
efficiency)
• Manage demand
• Enhance system safety
• Improve system reliability
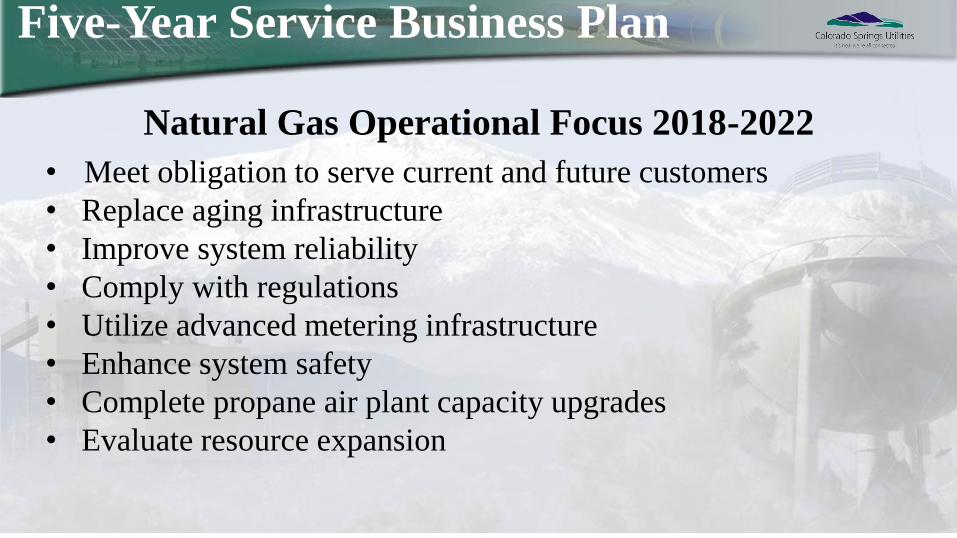
Natural Gas Operational Focus 2018-2022
• Meet obligation to serve current and future customers
• Replace aging infrastructure
• Improve system reliability
• Comply with regulations
• Utilize advanced metering infrastructure
• Enhance system safety
• Complete propane air plant capacity upgrades
• Evaluate resource expansion
Five-Year Service Business Plan
Water Update
Dan Higgins
Chief Water Services Officer
Electricity | Natural Gas | Water | Wastewater
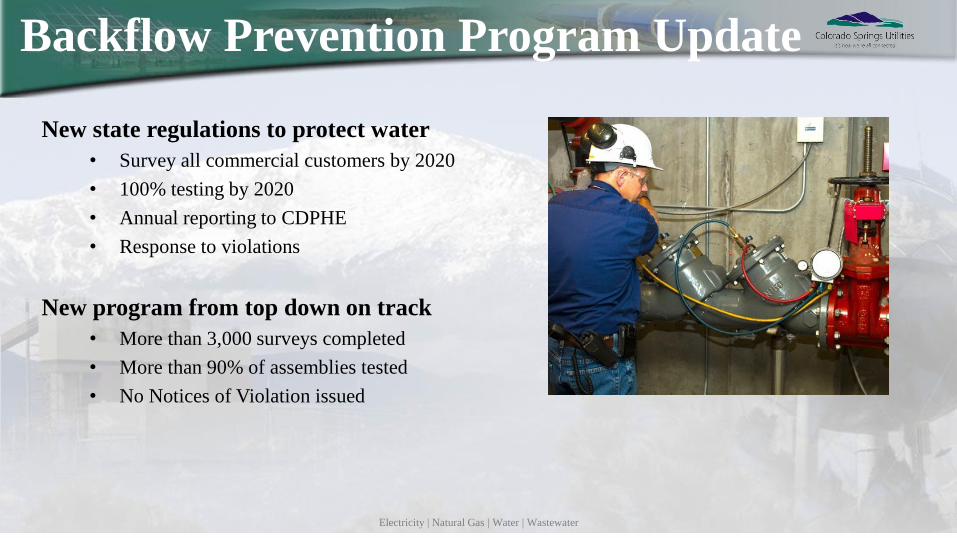
New state regulations to protect water
• Survey all commercial customers by 2020
• 100% testing by 2020
• Annual reporting to CDPHE
• Response to violations
New program from top down on track
• More than 3,000 surveys completed
• More than 90% of assemblies tested
• No Notices of Violation issued
Backflow Prevention Program Update
Electricity | Natural Gas | Water | Wastewater
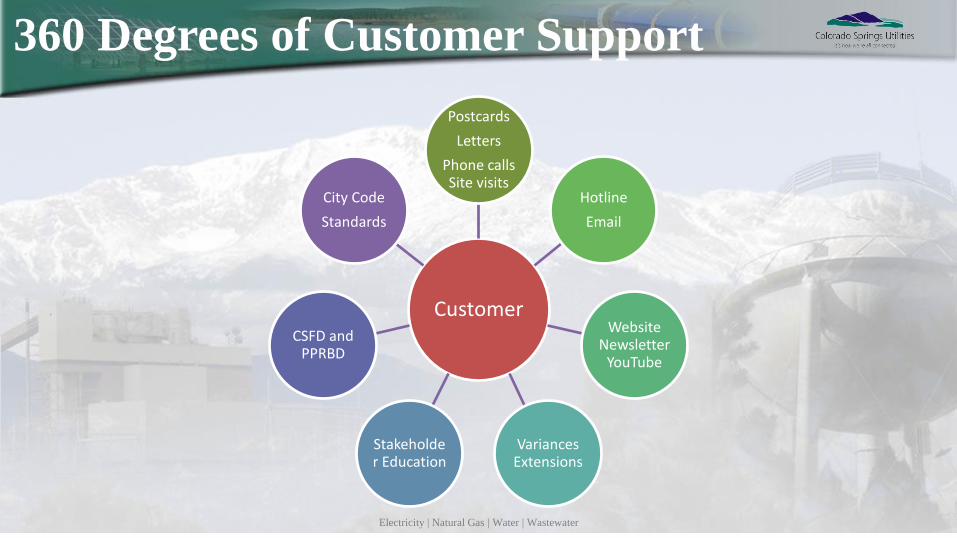
360 Degrees of Customer Support
Customer
Postcards
Letters
Phone calls Site visits
Hotline
Website Newsletter
YouTube
Variances Extensions
Stakeholder Education
CSFD and PPRBD
City Code
Standards
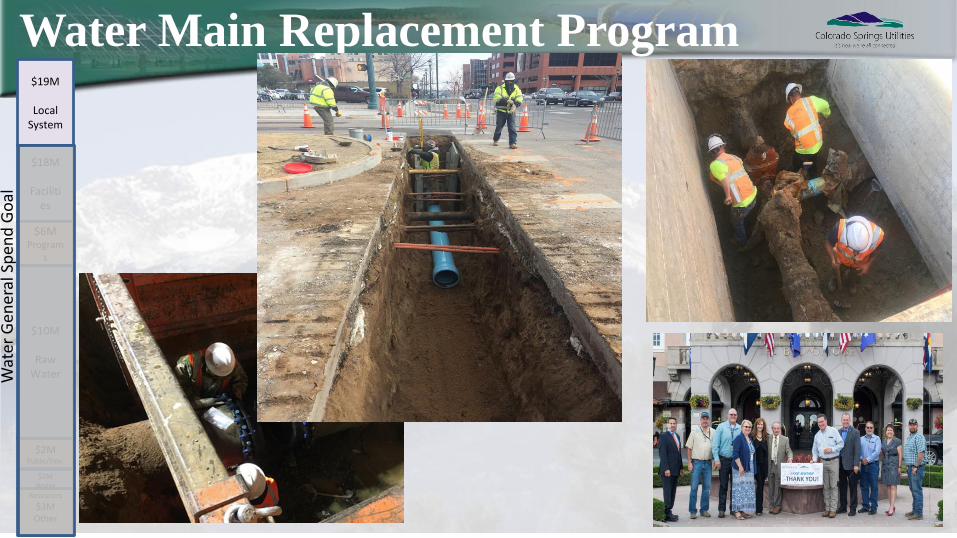
Water Main Replacement Program
22
$19M
Local System
$18M
Facilities
$6MProgram
s
$10M
Raw Water
$2MPublic/Dev.
$3MOther
$2MWater
Resources
Wat
er G
ener
al S
pen
d G
oal
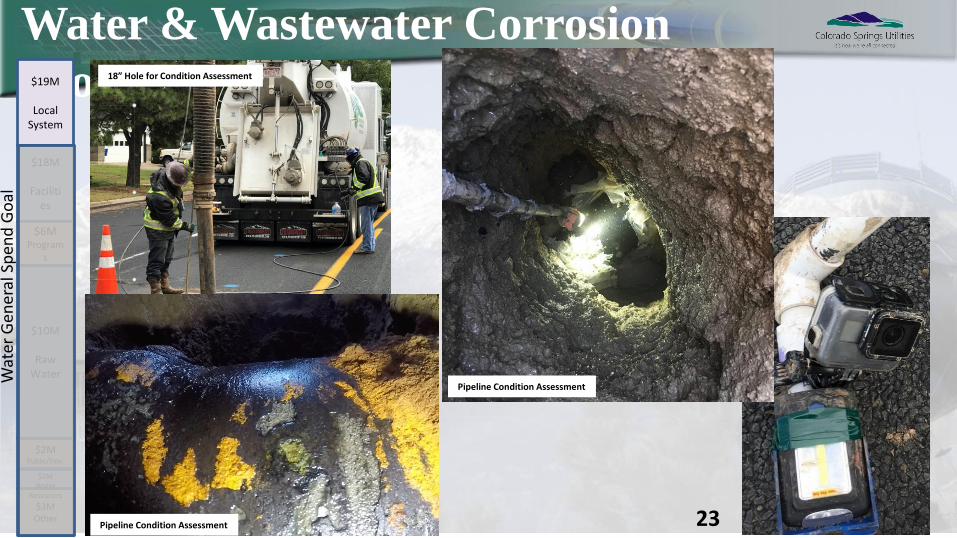
Water & Wastewater Corrosion
Program
23
$19M
Local System
$18M
Facilities
$6MProgram
s
$10M
Raw Water
$2MPublic/Dev.
$3MOther
$2MWater
Resources
Wat
er G
ener
al S
pen
d G
oal
18” Hole for Condition Assessment
Pipeline Condition Assessment
Pipeline Condition Assessment
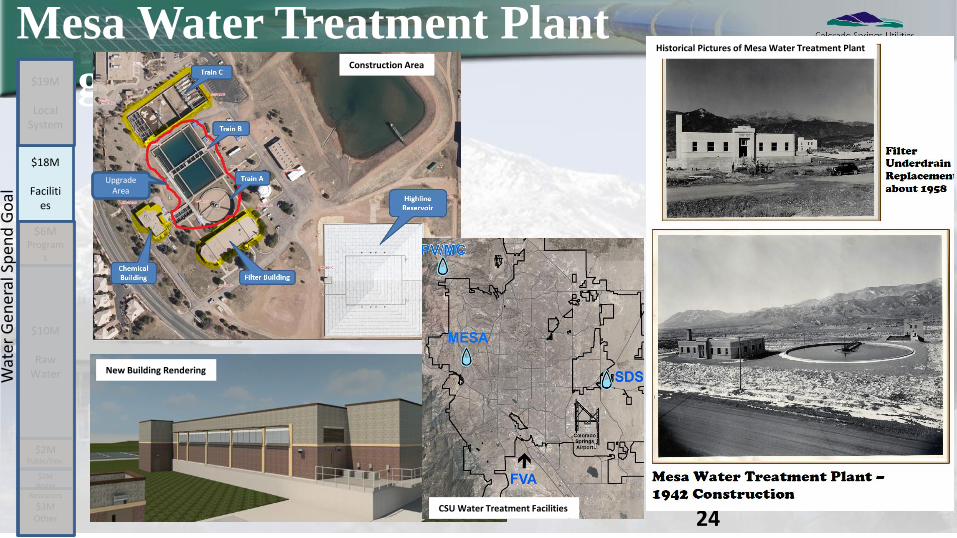
Mesa Water Treatment Plant
Upgrades
24
$19M
Local System
$18M
Facilities
$6MProgram
s
$10M
Raw Water
$2MPublic/Dev.
$3MOther
$2MWater
Resources
Wat
er G
ener
al S
pen
d G
oal
Upgrade Area
Construction Area
New Building Rendering
CSU Water Treatment Facilities
Historical Pictures of Mesa Water Treatment Plant
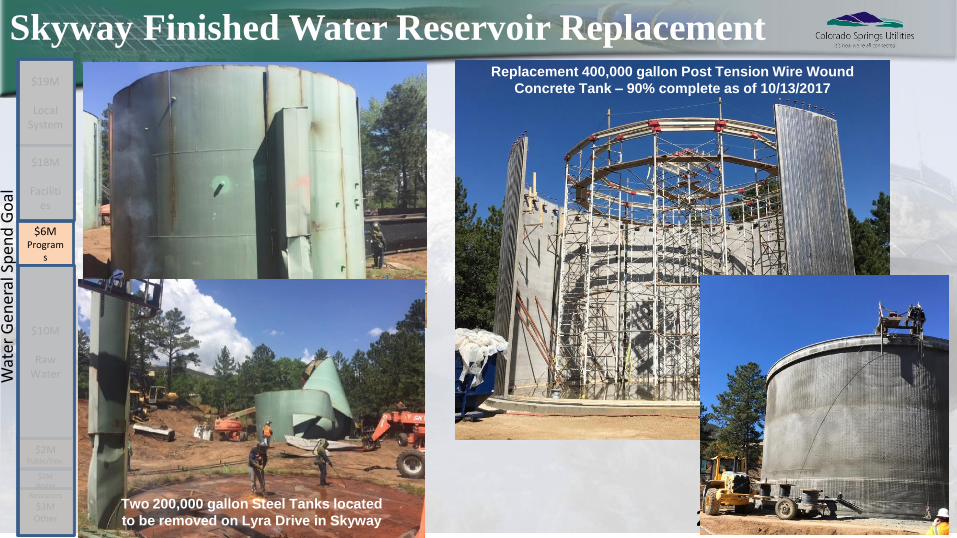
Skyway Finished Water Reservoir Replacement
25
$19M
Local System
$18M
Facilities
$6MProgram
s
$10M
Raw Water
$2MPublic/Dev.
$3MOther
$2MWater
Resources
Wat
er G
ener
al S
pen
d G
oal
Two 200,000 gallon Steel Tanks located
to be removed on Lyra Drive in Skyway
Replacement 400,000 gallon Post Tension Wire Wound
Concrete Tank – 90% complete as of 10/13/2017
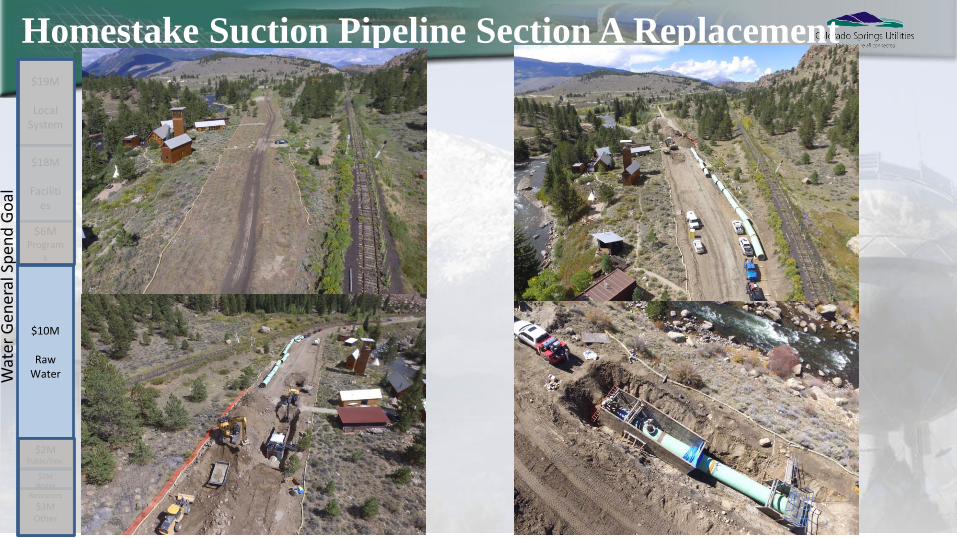
Homestake Suction Pipeline Section A Replacement
26
$19M
Local System
$18M
Facilities
$6MProgram
s
$10M
Raw Water
$2MPublic/Dev.
$3MOther
$2MWater
Resources
Wat
er G
ener
al S
pen
d G
oal
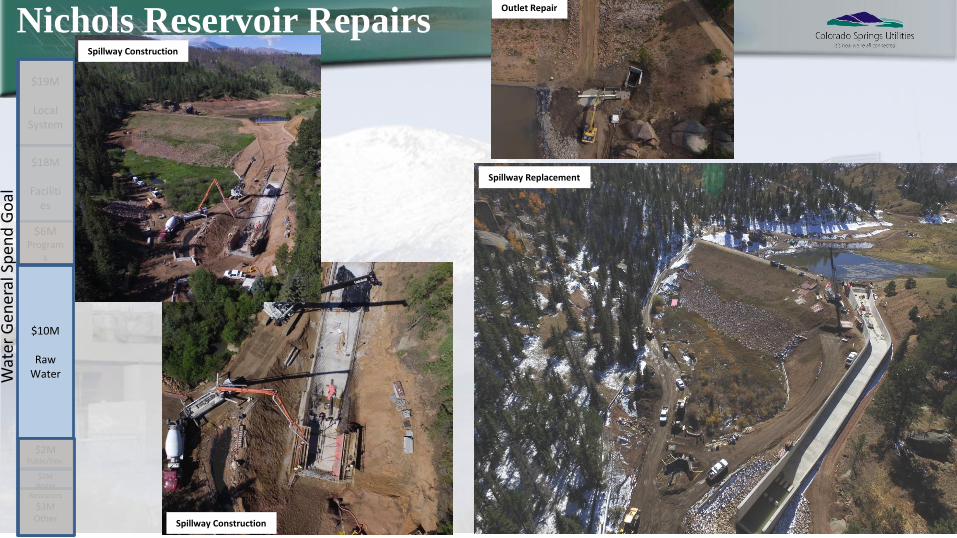
Nichols Reservoir Repairs
27
$19M
Local System
$18M
Facilities
$6MProgram
s
$10M
Raw Water
$2MPublic/Dev.
$3MOther
$2MWater
Resources
Wat
er G
ener
al S
pen
d G
oal
Outlet Repair
Spillway Construction
Spillway Construction
Spillway Replacement
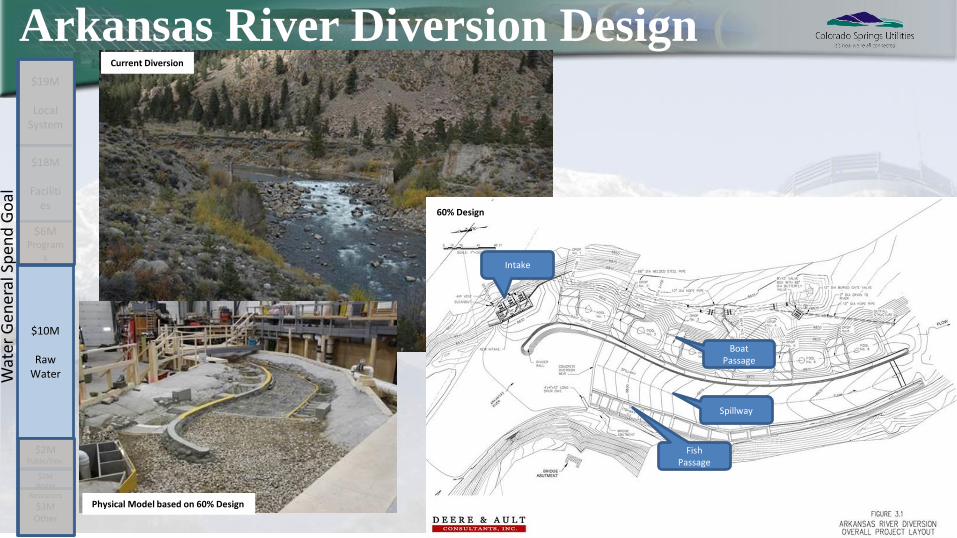
Arkansas River Diversion Design
28
$19M
Local System
$18M
Facilities
$6MProgram
s
$10M
Raw Water
$2MPublic/Dev.
$3MOther
$2MWater
Resources
Wat
er G
ener
al S
pen
d G
oal
Current Diversion
Physical Model based on 60% Design
Fish Passage
Spillway
Boat Passage
Intake
60% Design
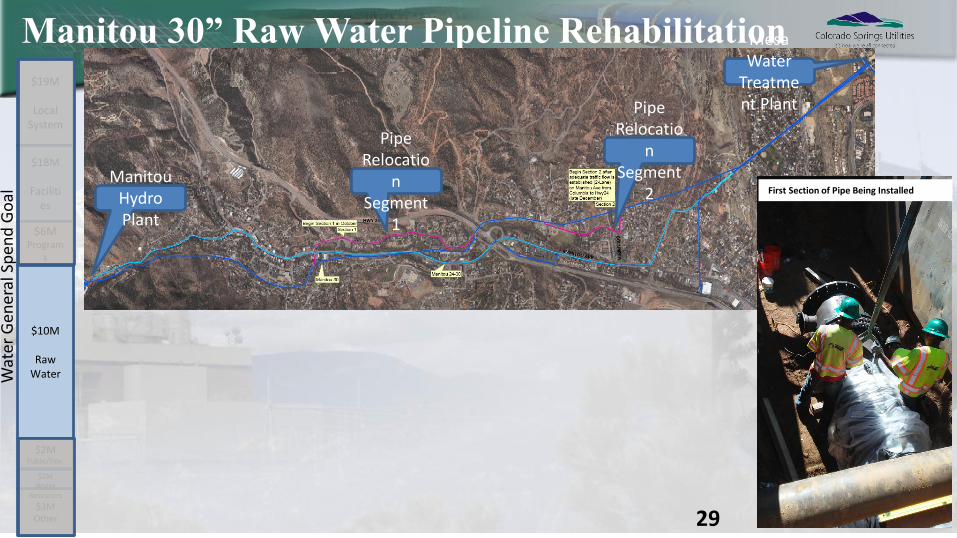
Manitou 30” Raw Water Pipeline Rehabilitation
29
$19M
Local System
$18M
Facilities
$6MProgram
s
$10M
Raw Water
$2MPublic/Dev.
$3MOther
$2MWater
Resources
Wat
er G
ener
al S
pen
d G
oal
Manitou Hydro Plant
Mesa Water
Treatment Plant
Pipe Relocatio
n Segment
1
Pipe Relocatio
n Segment
2 First Section of Pipe Being Installed
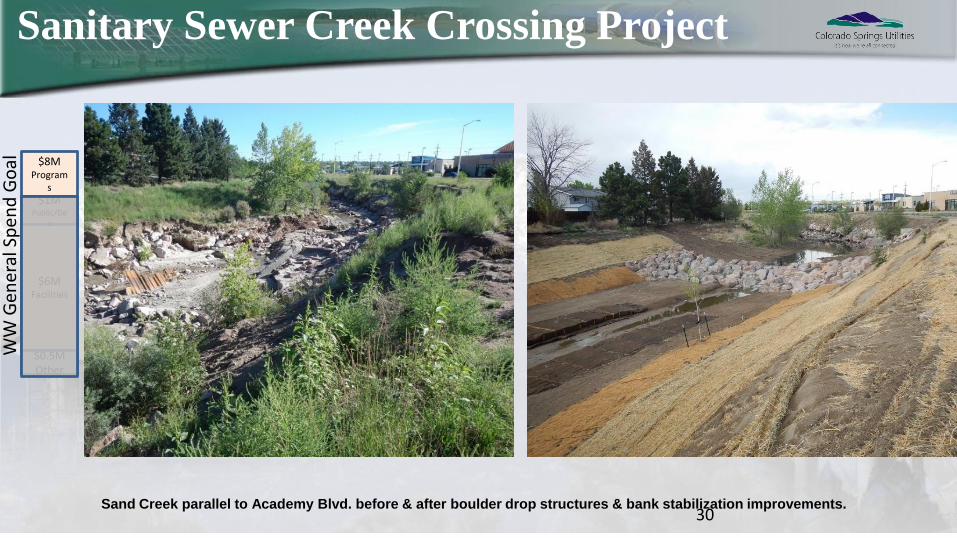
30Sand Creek parallel to Academy Blvd. before & after boulder drop structures & bank stabilization improvements.
Sanitary Sewer Creek Crossing Project
$8MProgram
s
$6MFacilities
$0.5MOther
WW
Gen
eral
Sp
end
Go
al
$1MPublic/De
v
31
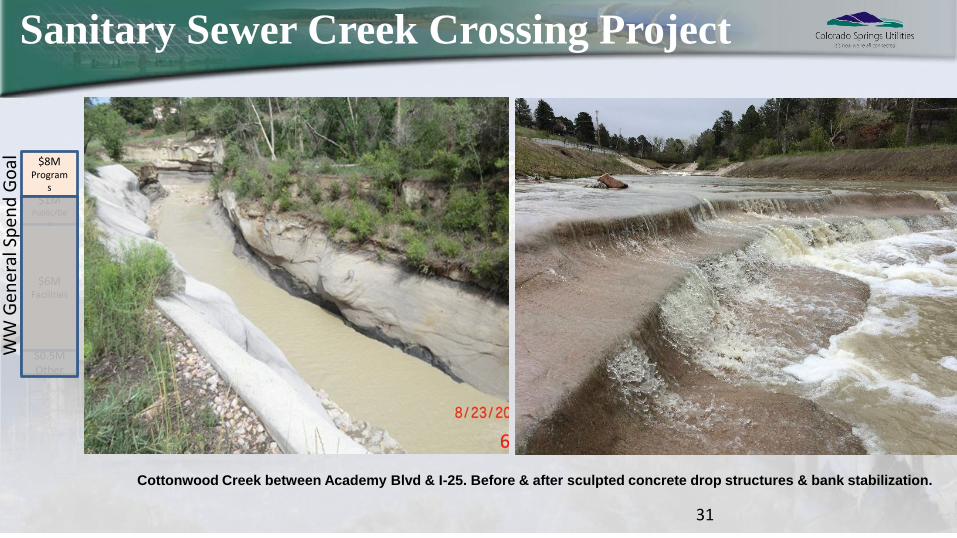
Cottonwood Creek between Academy Blvd & I-25. Before & after sculpted concrete drop structures & bank stabilization.
Sanitary Sewer Creek Crossing Project
$8MProgram
s
$6MFacilities
$0.5MOther
WW
Gen
eral
Sp
end
Go
al
$1MPublic/De
v
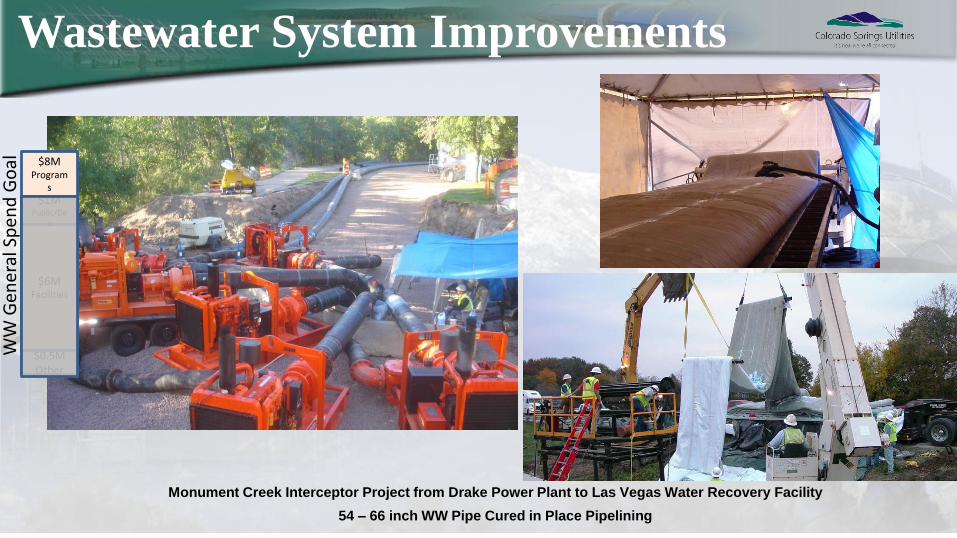
Wastewater System Improvements
Monument Creek Interceptor Project from Drake Power Plant to Las Vegas Water Recovery Facility
54 – 66 inch WW Pipe Cured in Place Pipelining
$8MProgram
s
$6MFacilities
$0.5MOther
WW
Gen
eral
Sp
end
Go
al
$1MPublic/De
v
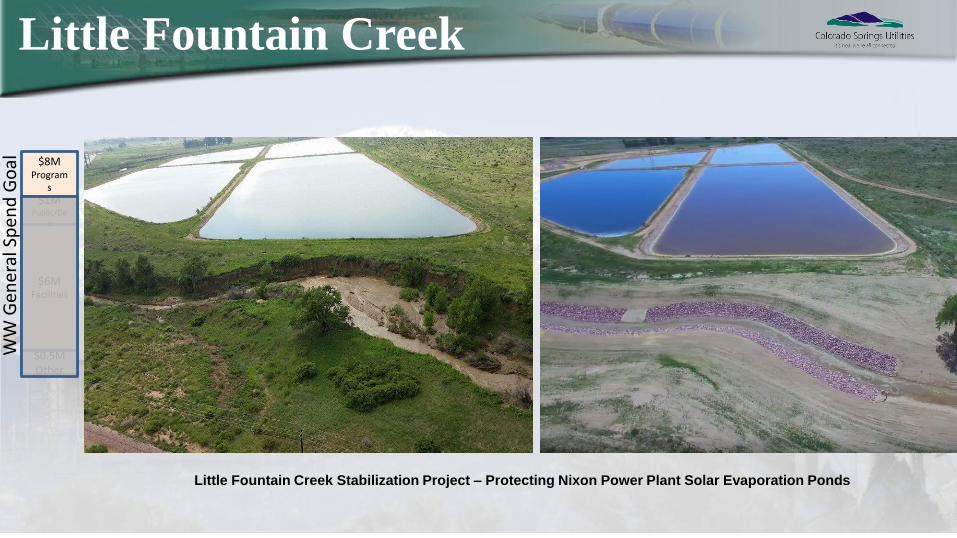
Little Fountain Creek
Little Fountain Creek Stabilization Project – Protecting Nixon Power Plant Solar Evaporation Ponds
$8MProgram
s
$6MFacilities
$0.5MOther
WW
Gen
eral
Sp
end
Go
al
$1MPublic/De
v
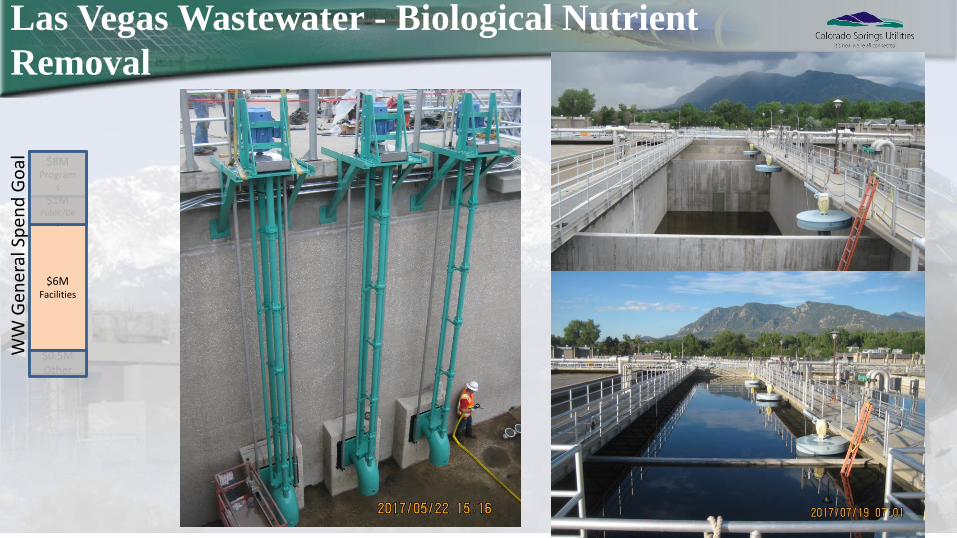
Las Vegas Wastewater - Biological Nutrient
Removal
34
$8MProgram
s
$6MFacilities
$0.5MOther
WW
Gen
eral
Sp
end
Go
al
$1MPublic/De
v

Water Efficiency Programs
We’re here to help!
• Irrigation Audits & Equipment
Rebates
• Native Grass Conversion and Indoor
Incentive Programs
• Industry Benchmarking
• Pre-Rinse Spray Valve Retrofits
(commercial kitchens)
• Hotel Audits
• Key Account Representatives (Water
& Energy Consultations)
• Invite Us to your next staff meeting –
Learn about the value of water
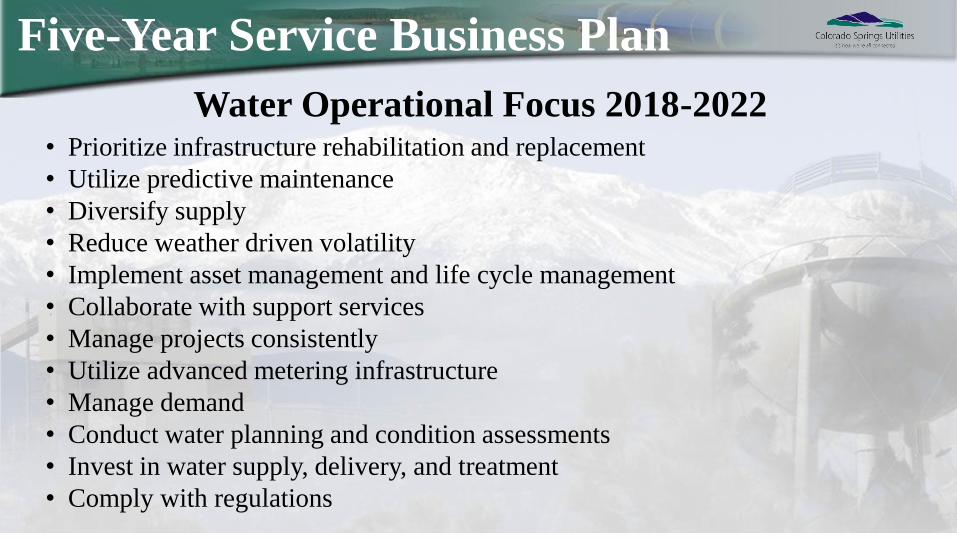
Water Operational Focus 2018-2022• Prioritize infrastructure rehabilitation and replacement
• Utilize predictive maintenance
• Diversify supply
• Reduce weather driven volatility
• Implement asset management and life cycle management
• Collaborate with support services
• Manage projects consistently
• Utilize advanced metering infrastructure
• Manage demand
• Conduct water planning and condition assessments
• Invest in water supply, delivery, and treatment
• Comply with regulations
Five-Year Service Business Plan
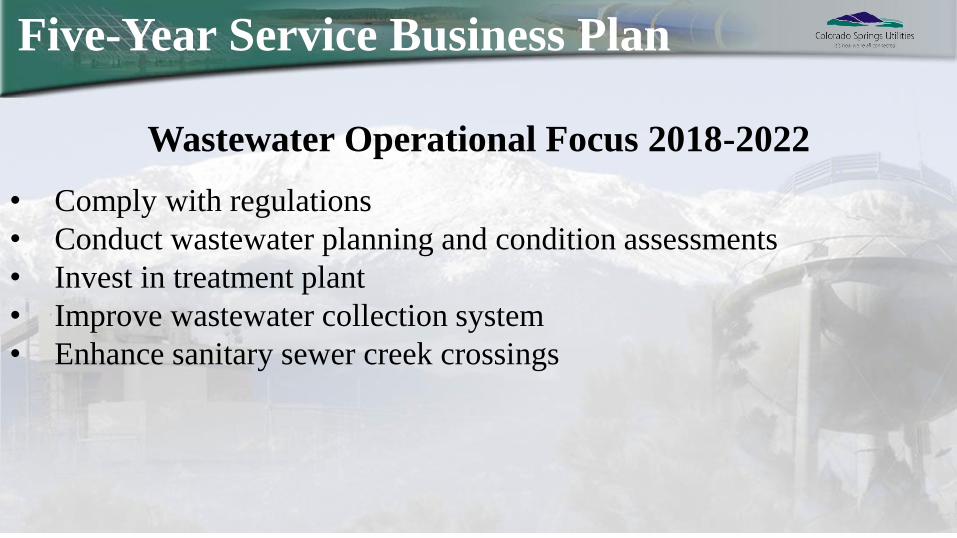
Wastewater Operational Focus 2018-2022
• Comply with regulations
• Conduct wastewater planning and condition assessments
• Invest in treatment plant
• Improve wastewater collection system
• Enhance sanitary sewer creek crossings
Five-Year Service Business Plan
Electricity | Natural Gas | Water | Wastewater Electricity | Natural Gas | Water | Wastewater
Proposed 2018 Budget & Rates
Scott Shewey
Interim Chief Planning & Finance Officer
October 20, 2017
Electricity | Natural Gas | Water | Wastewater Electricity | Natural Gas | Water | Wastewater
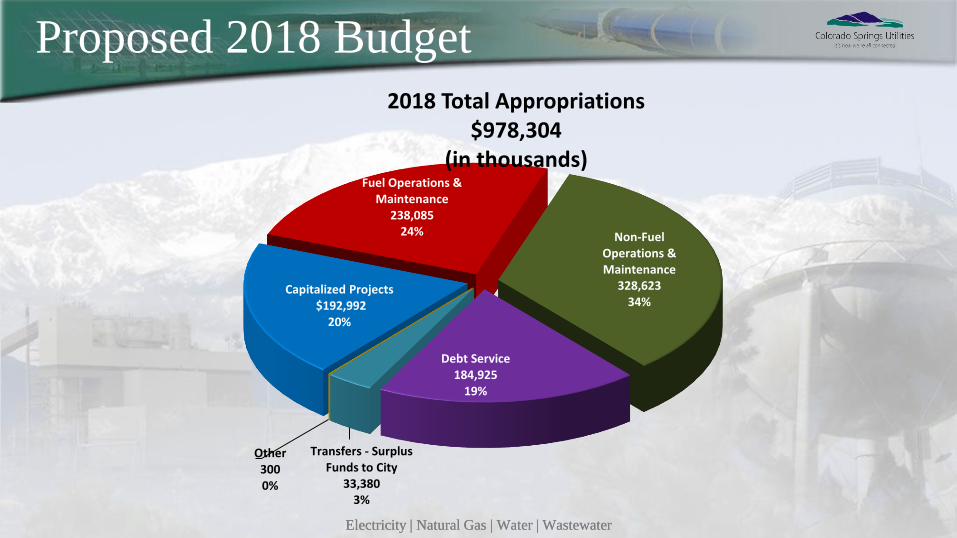
Proposed 2018 Budget
Capitalized Projects$192,992
20%
Fuel Operations & Maintenance
238,085 24% Non-Fuel
Operations & Maintenance
328,623 34%
Debt Service184,925
19%
Transfers - Surplus Funds to City
33,380 3%
Other300 0%
2018 Total Appropriations$978,304
(in thousands)
Electricity | Natural Gas | Water | Wastewater Electricity | Natural Gas | Water | Wastewater
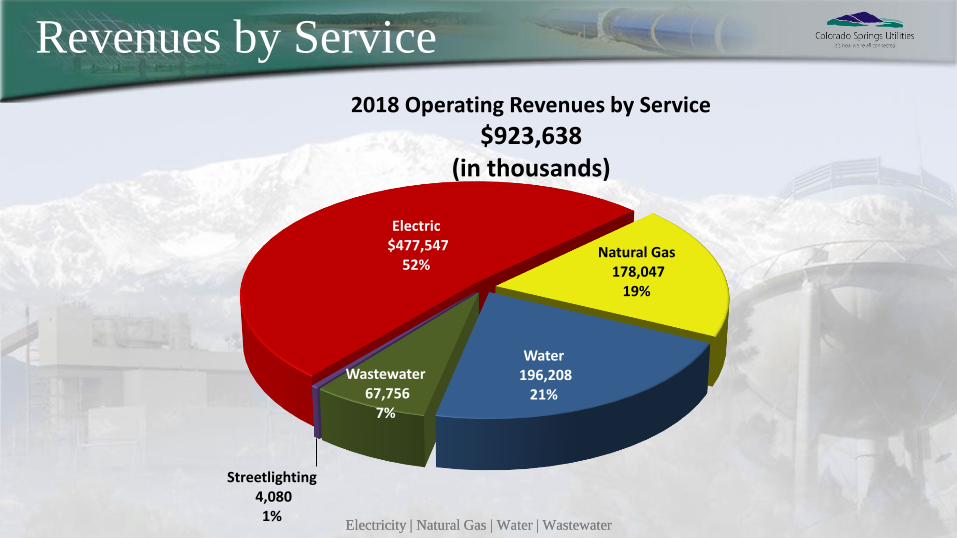
Revenues by Service
Electric$477,547
52%Natural Gas
178,047 19%
Water196,208
21%
Wastewater67,756
7%
Streetlighting4,080 1%
2018 Operating Revenues by Service
$923,638(in thousands)
Electricity | Natural Gas | Water | Wastewater
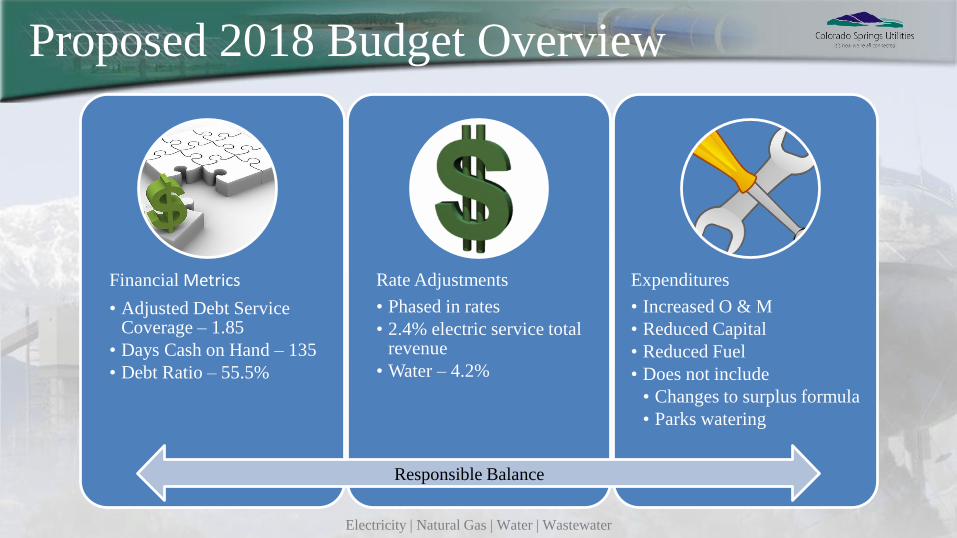
Proposed 2018 Budget Overview
Financial Metrics
• Adjusted Debt Service Coverage – 1.85
• Days Cash on Hand – 135
• Debt Ratio – 55.5%
Rate Adjustments
• Phased in rates
• 2.4% electric service total revenue
• Water – 4.2%
Expenditures
• Increased O & M
• Reduced Capital
• Reduced Fuel
• Does not include
• Changes to surplus formula
• Parks watering
Responsible Balance
Electricity | Natural Gas | Water | Wastewater
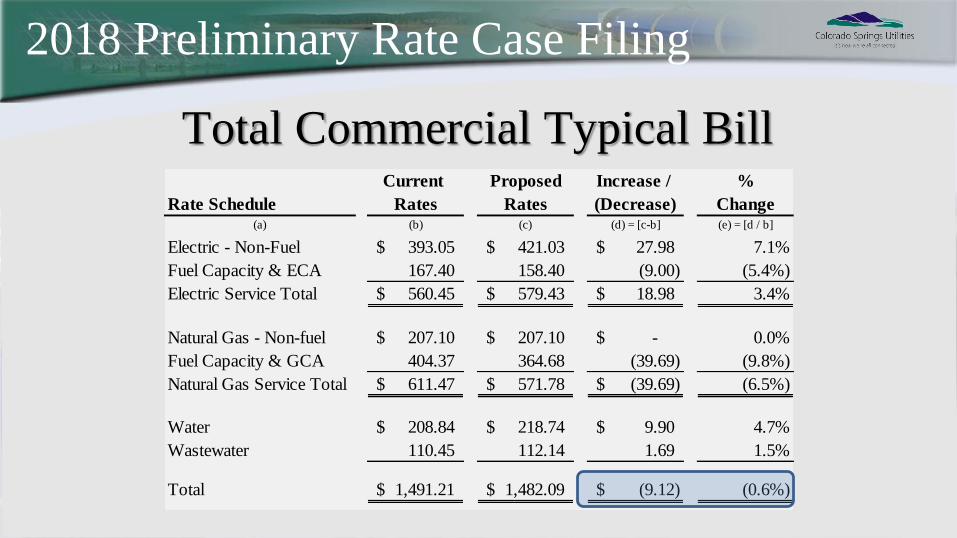
2018 Preliminary Rate Case Filing
Total Commercial Typical BillCurrent Proposed Increase / %
Rate Schedule Rates Rates (Decrease) Change(a) (b) (c) (d) = [c-b] (e) = [d / b]
Electric - Non-Fuel 393.05$ 421.03$ 27.98$ 7.1%
Fuel Capacity & ECA 167.40 158.40 (9.00) (5.4%)
Electric Service Total 560.45$ 579.43$ 18.98$ 3.4%
Natural Gas - Non-fuel 207.10$ 207.10$ -$ 0.0%
Fuel Capacity & GCA 404.37 364.68 (39.69) (9.8%)
Natural Gas Service Total 611.47$ 571.78$ (39.69)$ (6.5%)
Water 208.84$ 218.74$ 9.90$ 4.7%
Wastewater 110.45 112.14 1.69 1.5%
Total 1,491.21$ 1,482.09$ (9.12)$ (0.6%)
Electricity | Natural Gas | Water | Wastewater
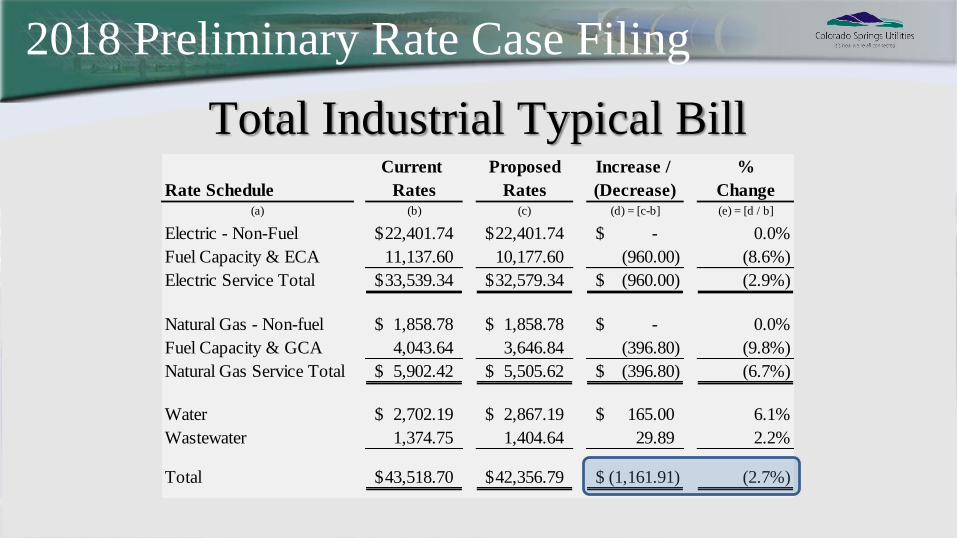
2018 Preliminary Rate Case Filing
Total Industrial Typical BillCurrent Proposed Increase / %
Rate Schedule Rates Rates (Decrease) Change(a) (b) (c) (d) = [c-b] (e) = [d / b]
Electric - Non-Fuel 22,401.74$ 22,401.74$ -$ 0.0%
Fuel Capacity & ECA 11,137.60 10,177.60 (960.00) (8.6%)
Electric Service Total 33,539.34$ 32,579.34$ (960.00)$ (2.9%)
Natural Gas - Non-fuel 1,858.78$ 1,858.78$ -$ 0.0%
Fuel Capacity & GCA 4,043.64 3,646.84 (396.80) (9.8%)
Natural Gas Service Total 5,902.42$ 5,505.62$ (396.80)$ (6.7%)
Water 2,702.19$ 2,867.19$ 165.00$ 6.1%
Wastewater 1,374.75 1,404.64 29.89 2.2%
Total 43,518.70$ 42,356.79$ (1,161.91)$ (2.7%)
Electricity | Natural Gas | Water | Wastewater
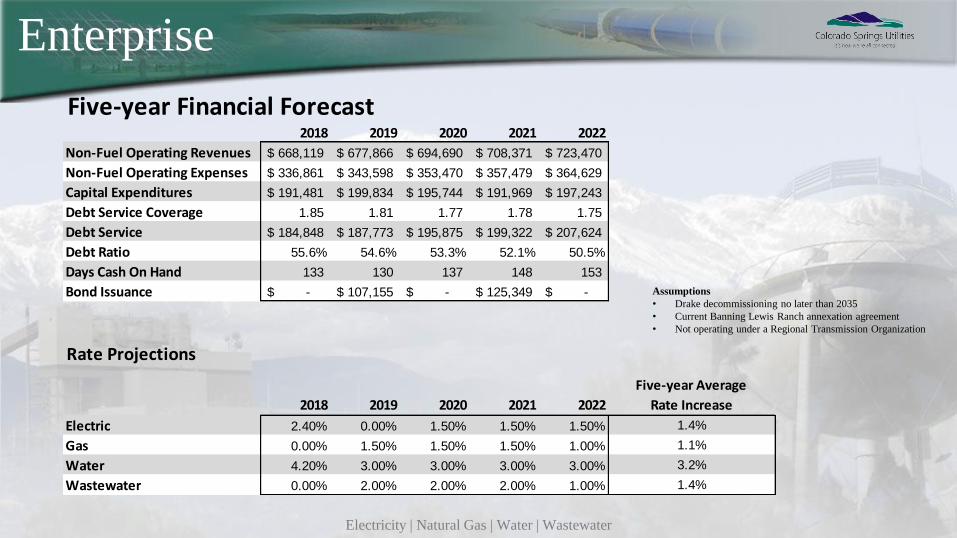
Enterprise
2018 2019 2020 2021 2022
Non-Fuel Operating Revenues 668,119$ 677,866$ 694,690$ 708,371$ 723,470$
Non-Fuel Operating Expenses 336,861$ 343,598$ 353,470$ 357,479$ 364,629$
Capital Expenditures 191,481$ 199,834$ 195,744$ 191,969$ 197,243$
Debt Service Coverage 1.85 1.81 1.77 1.78 1.75
Debt Service 184,848$ 187,773$ 195,875$ 199,322$ 207,624$
Debt Ratio 55.6% 54.6% 53.3% 52.1% 50.5%
Days Cash On Hand 133 130 137 148 153
Bond Issuance -$ 107,155$ -$ 125,349$ -$
2018 2019 2020 2021 2022
2.40% 0.00% 1.50% 1.50% 1.50% 1.4%
0.00% 1.50% 1.50% 1.50% 1.00% 1.1%
4.20% 3.00% 3.00% 3.00% 3.00% 3.2%
0.00% 2.00% 2.00% 2.00% 1.00% 1.4%Wastewater
Five-year Financial Forecast
Rate Projections
Five-year Average
Rate Increase
Electric
Gas
Water
Assumptions
• Drake decommissioning no later than 2035
• Current Banning Lewis Ranch annexation agreement
• Not operating under a Regional Transmission Organization
Electricity | Natural Gas | Water | Wastewater Electricity | Natural Gas | Water | Wastewater
Questions?