2017 stats & charts · angeles university foundation medical center 2,975,000 6 baguio general...
TRANSCRIPT

2017 Stats & Charts
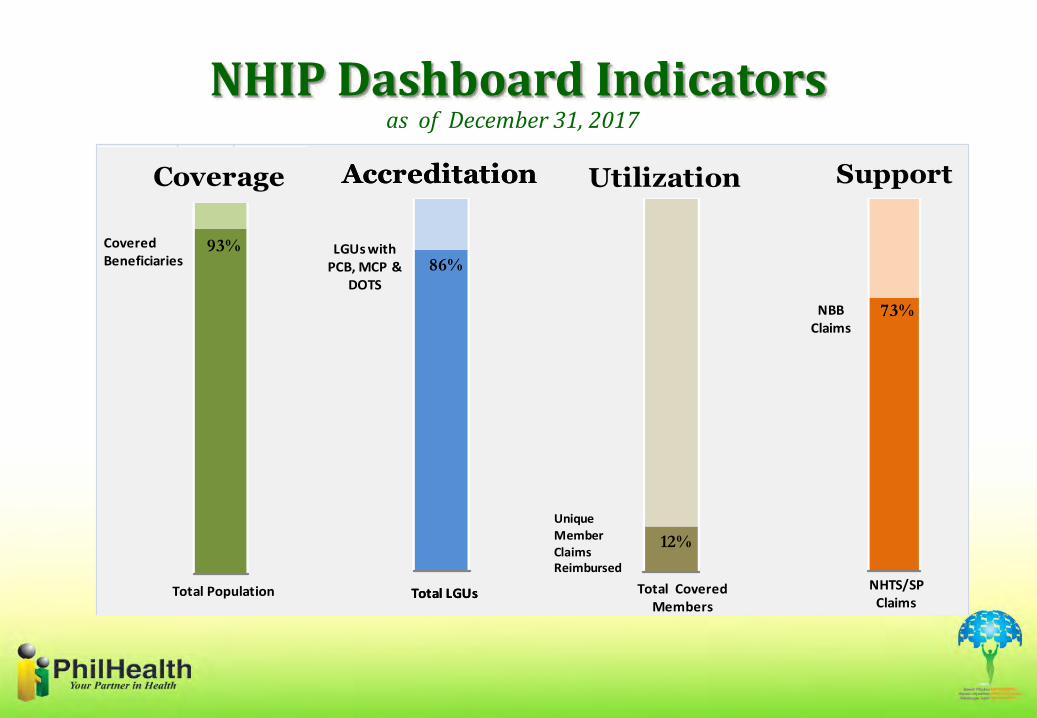
NHIP Dashboard Indicators
73%
Support
NHTS/SPClaims
NBB Claims
12%
Unique MemberClaims Reimbursed
Total CoveredMembers
Utilization
86%
Accreditation
Total LGUs
LGUs with PCB, MCP &
DOTS
Accreditation
Total LGUs
93%
Total Population
CoveredBeneficiaries
Coverage
as of December 31, 2017
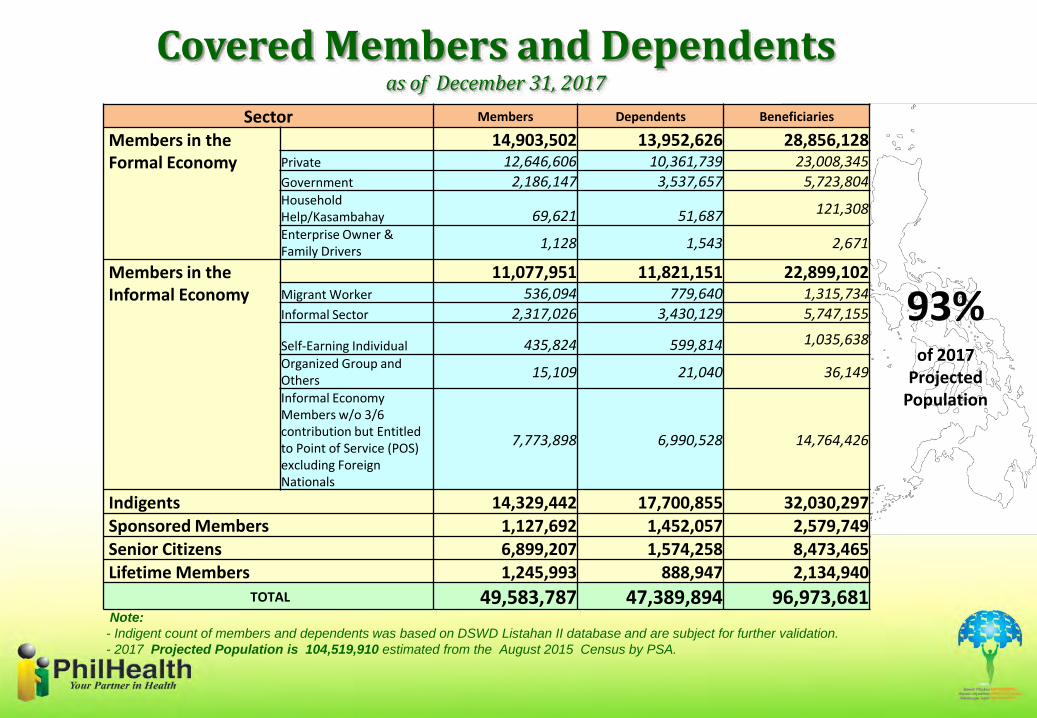
Covered Members and Dependentsas of December 31, 2017
93%of 2017
Projected Population
Note:
- Indigent count of members and dependents was based on DSWD Listahan II database and are subject for further validation.
- 2017 Projected Population is 104,519,910 estimated from the August 2015 Census by PSA.
Sector Members Dependents Beneficiaries
Members in the Formal Economy
14,903,502 13,952,626 28,856,128 Private 12,646,606 10,361,739 23,008,345
Government 2,186,147 3,537,657 5,723,804 Household Help/Kasambahay 69,621 51,687 121,308
Enterprise Owner & Family Drivers
1,128 1,543 2,671
Members in the Informal Economy
11,077,951 11,821,151 22,899,102 Migrant Worker 536,094 779,640 1,315,734
Informal Sector 2,317,026 3,430,129 5,747,155
Self-Earning Individual 435,824 599,814 1,035,638
Organized Group and Others
15,109 21,040 36,149
Informal Economy Members w/o 3/6 contribution but Entitled to Point of Service (POS) excluding Foreign Nationals
7,773,898 6,990,528 14,764,426
Indigents 14,329,442 17,700,855 32,030,297 Sponsored Members 1,127,692 1,452,057 2,579,749 Senior Citizens 6,899,207 1,574,258 8,473,465 Lifetime Members 1,245,993 888,947 2,134,940
TOTAL 49,583,787 47,389,894 96,973,681
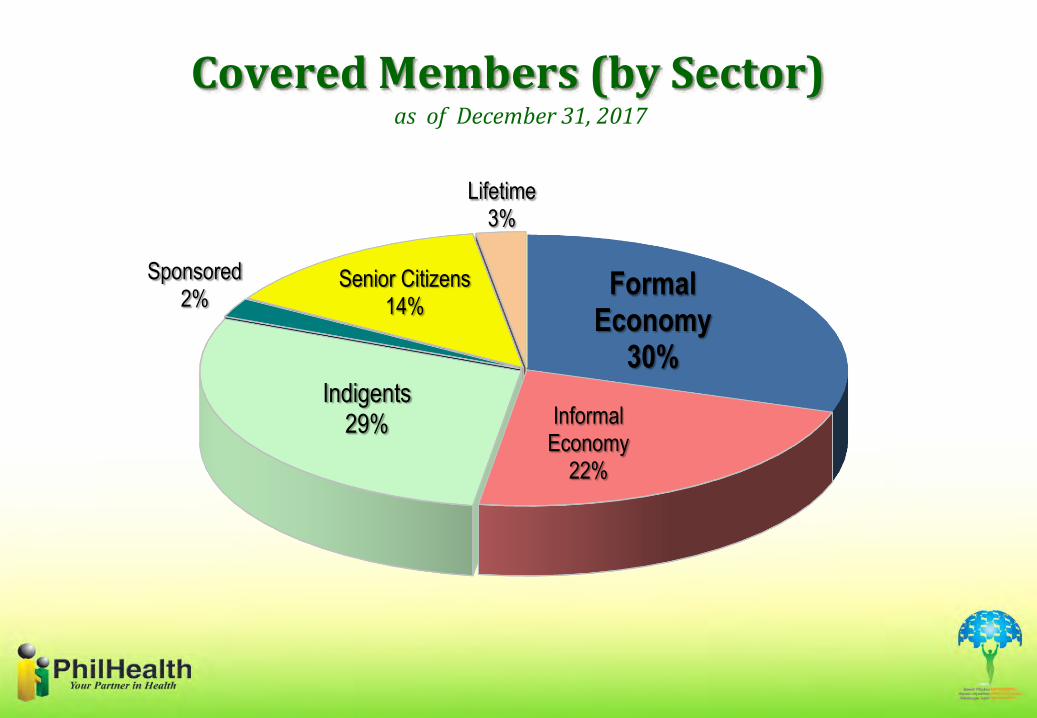
Covered Members (by Sector)
Formal Economy
30%
Informal Economy
22%
Indigents29%
Sponsored2%
Senior Citizens14%
Lifetime3%
as of December 31, 2017
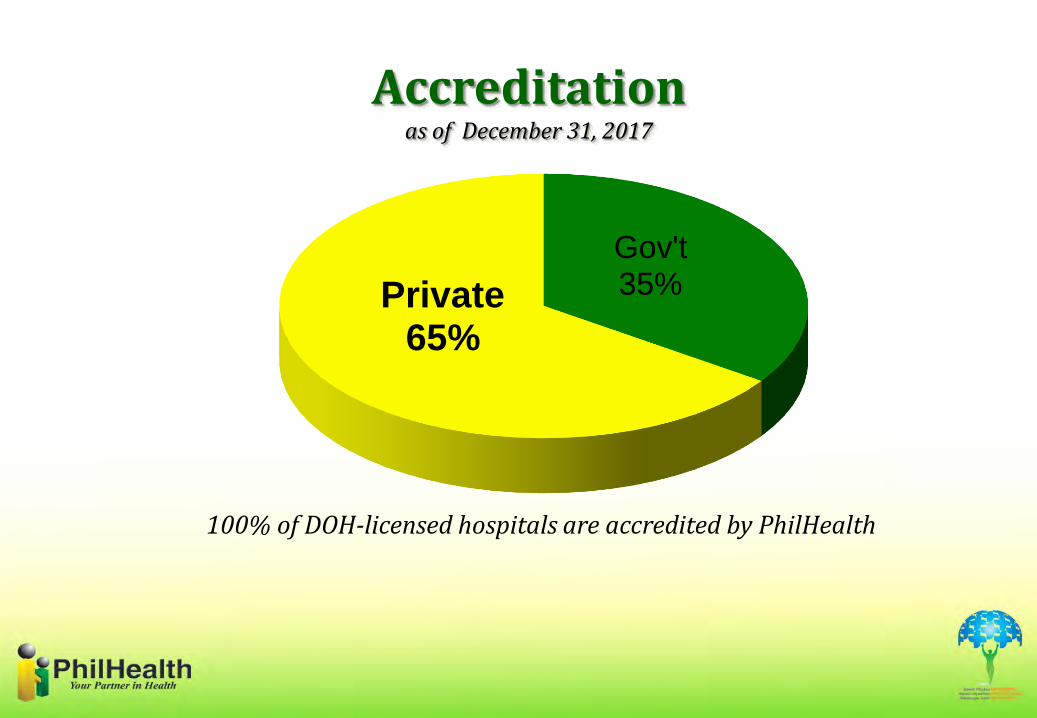
Accreditation as of December 31, 2017
Gov't35%Private
65%
100% of DOH-licensed hospitals are accredited by PhilHealth.
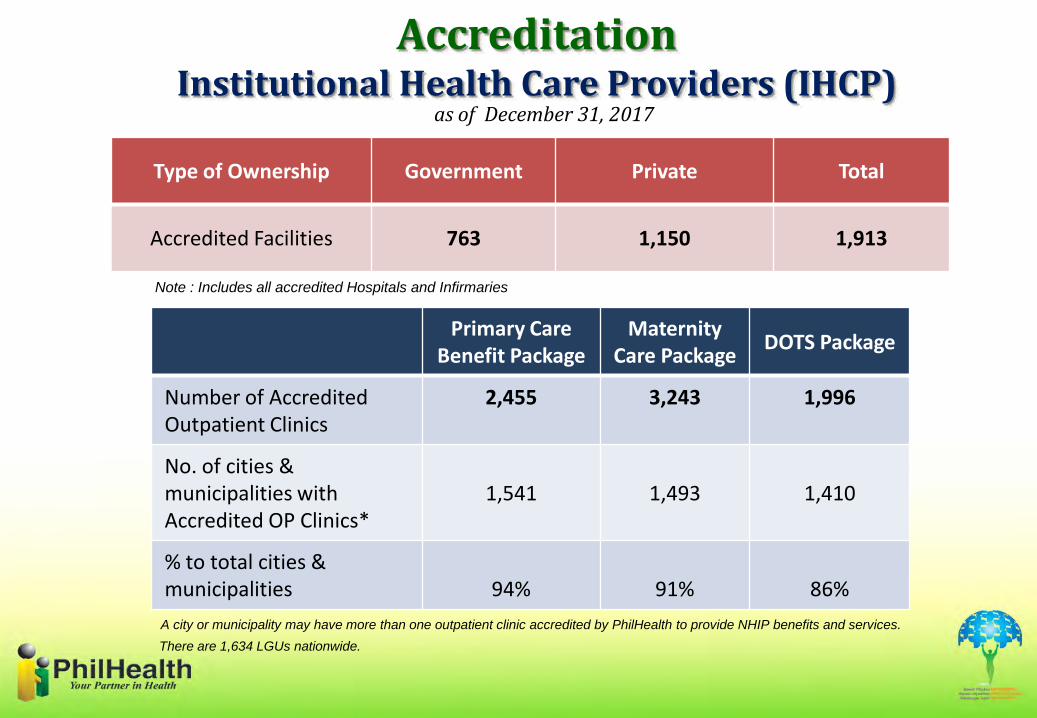
Accreditation Institutional Health Care Providers (IHCP)
Type of Ownership Government Private Total
Accredited Facilities 763 1,150 1,913
Primary Care Benefit Package
MaternityCare Package
DOTS Package
Number of Accredited Outpatient Clinics
2,455 3,243 1,996
No. of cities &municipalities with Accredited OP Clinics*
1,541 1,493 1,410
% to total cities &municipalities 94% 91% 86%
A city or municipality may have more than one outpatient clinic accredited by PhilHealth to provide NHIP benefits and services.
Note : Includes all accredited Hospitals and Infirmaries
There are 1,634 LGUs nationwide.
as of December 31, 2017
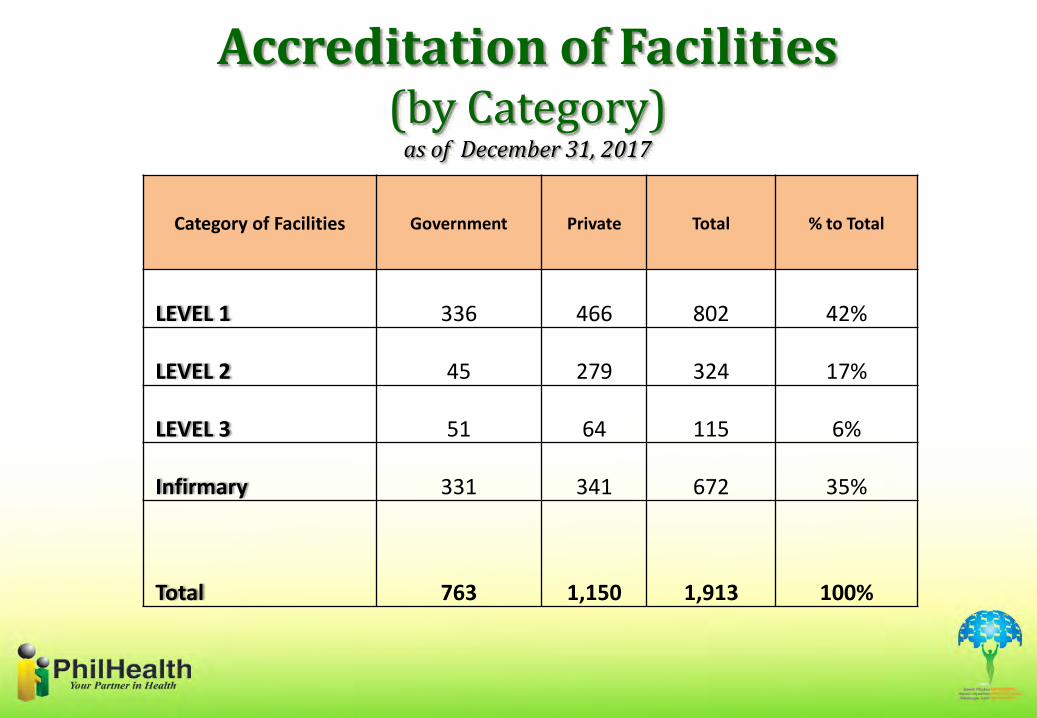
Accreditation of Facilities(by Category)
as of December 31, 2017
Category of Facilities Government Private Total % to Total
LEVEL 1 336 466 802 42%
LEVEL 2 45 279 324 17%
LEVEL 3 51 64 115 6%
Infirmary 331 341 672 35%
Total 763 1,150 1,913 100%
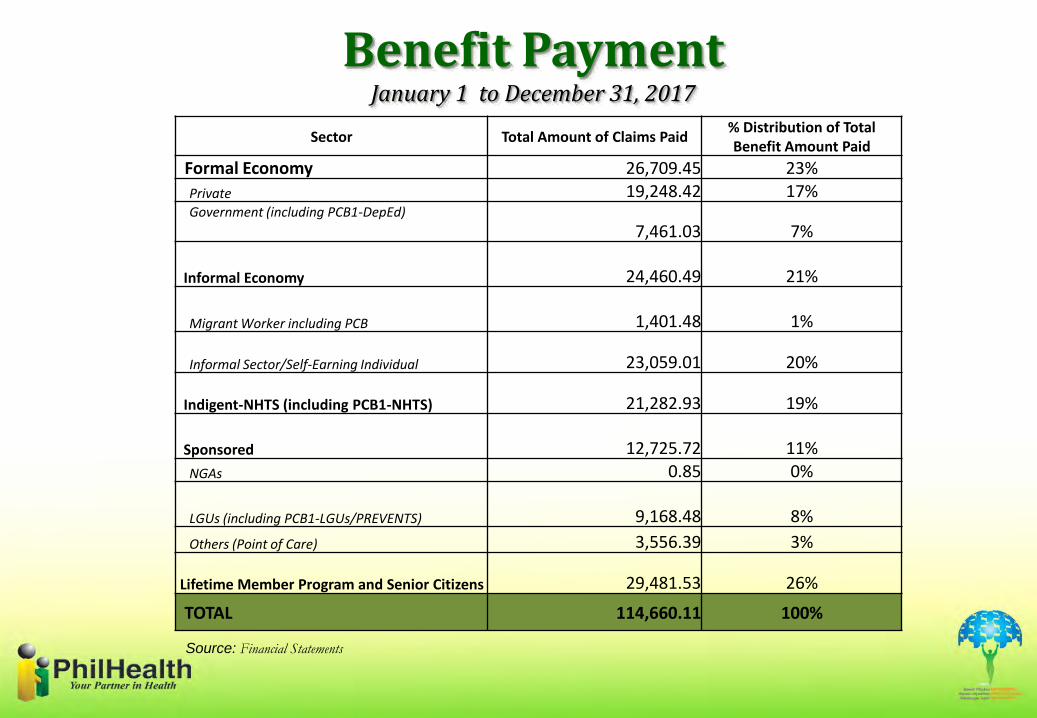
Benefit Payment January 1 to December 31, 2017
Source: Financial Statements
Sector Total Amount of Claims Paid% Distribution of Total Benefit Amount Paid
Formal Economy 26,709.45 23%
Private 19,248.42 17%Government (including PCB1-DepEd)
7,461.03 7%
Informal Economy 24,460.49 21%
Migrant Worker including PCB 1,401.48 1%
Informal Sector/Self-Earning Individual 23,059.01 20%
Indigent-NHTS (including PCB1-NHTS) 21,282.93 19%
Sponsored 12,725.72 11%
NGAs 0.85 0%
LGUs (including PCB1-LGUs/PREVENTS) 9,168.48 8%
Others (Point of Care) 3,556.39 3%
Lifetime Member Program and Senior Citizens 29,481.53 26%
TOTAL 114,660.11 100%
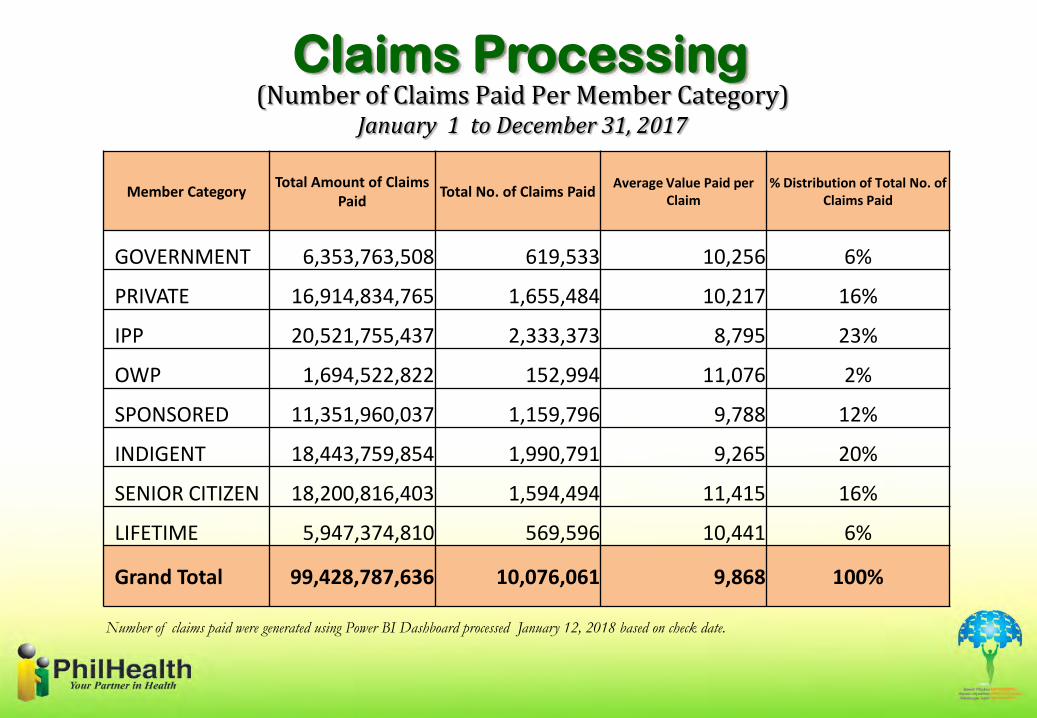
(Number of Claims Paid Per Member Category)January 1 to December 31, 2017
Claims Processing
Number of claims paid were generated using Power BI Dashboard processed January 12, 2018 based on check date.
Member CategoryTotal Amount of Claims
PaidTotal No. of Claims Paid
Average Value Paid per Claim
% Distribution of Total No. of Claims Paid
GOVERNMENT 6,353,763,508 619,533 10,256 6%
PRIVATE 16,914,834,765 1,655,484 10,217 16%
IPP 20,521,755,437 2,333,373 8,795 23%
OWP 1,694,522,822 152,994 11,076 2%
SPONSORED 11,351,960,037 1,159,796 9,788 12%
INDIGENT 18,443,759,854 1,990,791 9,265 20%
SENIOR CITIZEN 18,200,816,403 1,594,494 11,415 16%
LIFETIME 5,947,374,810 569,596 10,441 6%
Grand Total 99,428,787,636 10,076,061 9,868 100%
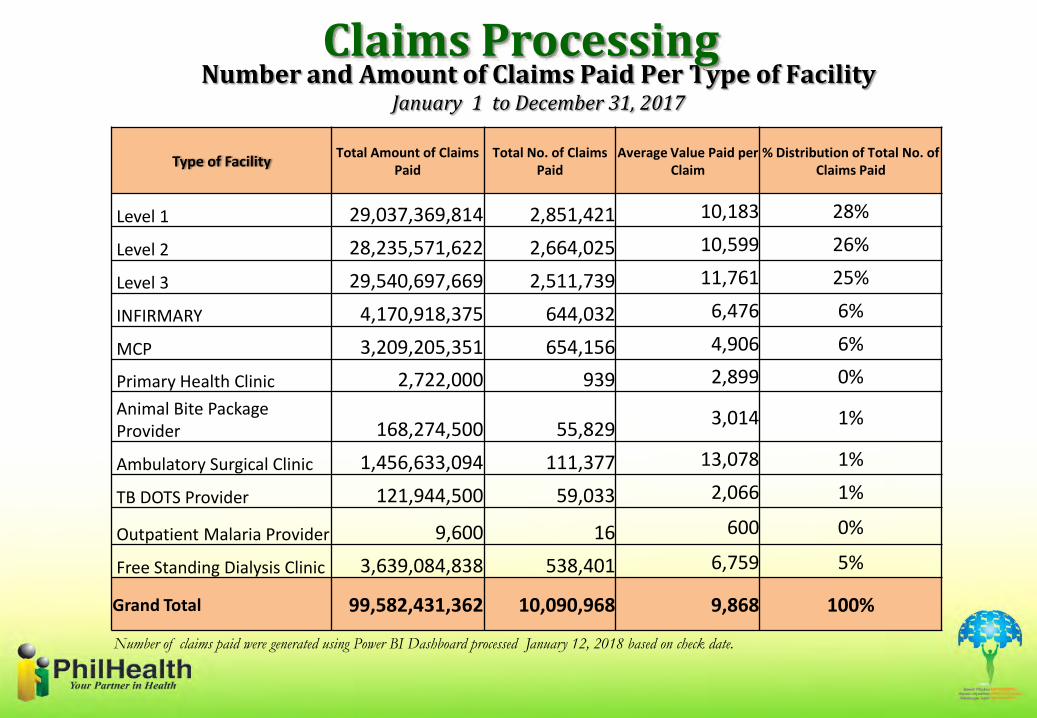
Number and Amount of Claims Paid Per Type of FacilityJanuary 1 to December 31, 2017
Claims Processing
Type of FacilityTotal Amount of Claims
PaidTotal No. of Claims
PaidAverage Value Paid per
Claim% Distribution of Total No. of
Claims Paid
Level 1 29,037,369,814 2,851,421 10,183 28%
Level 2 28,235,571,622 2,664,025 10,599 26%
Level 3 29,540,697,669 2,511,739 11,761 25%
INFIRMARY 4,170,918,375 644,032 6,476 6%
MCP 3,209,205,351 654,156 4,906 6%
Primary Health Clinic 2,722,000 939 2,899 0%
Animal Bite Package Provider 168,274,500 55,829
3,014 1%
Ambulatory Surgical Clinic 1,456,633,094 111,377 13,078 1%
TB DOTS Provider 121,944,500 59,033 2,066 1%
Outpatient Malaria Provider 9,600 16 600 0%
Free Standing Dialysis Clinic 3,639,084,838 538,401 6,759 5%
Grand Total 99,582,431,362 10,090,968 9,868 100%
Number of claims paid were generated using Power BI Dashboard processed January 12, 2018 based on check date.
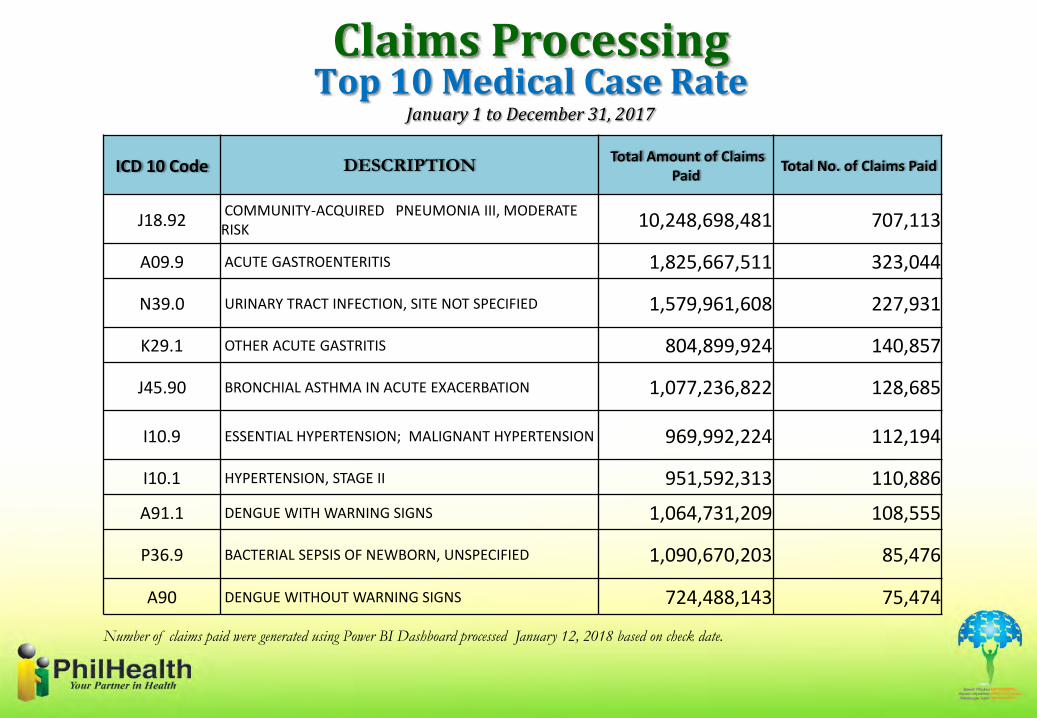
Top 10 Medical Case Rate January 1 to December 31, 2017
Claims Processing
ICD 10 Code DESCRIPTION Total Amount of Claims
Paid Total No. of Claims Paid
J18.92COMMUNITY-ACQUIRED PNEUMONIA III, MODERATE RISK 10,248,698,481 707,113
A09.9 ACUTE GASTROENTERITIS 1,825,667,511 323,044
N39.0 URINARY TRACT INFECTION, SITE NOT SPECIFIED 1,579,961,608 227,931
K29.1 OTHER ACUTE GASTRITIS 804,899,924 140,857
J45.90 BRONCHIAL ASTHMA IN ACUTE EXACERBATION 1,077,236,822 128,685
I10.9 ESSENTIAL HYPERTENSION; MALIGNANT HYPERTENSION 969,992,224 112,194
I10.1 HYPERTENSION, STAGE II 951,592,313 110,886
A91.1 DENGUE WITH WARNING SIGNS 1,064,731,209 108,555
P36.9 BACTERIAL SEPSIS OF NEWBORN, UNSPECIFIED 1,090,670,203 85,476
A90 DENGUE WITHOUT WARNING SIGNS 724,488,143 75,474
Number of claims paid were generated using Power BI Dashboard processed January 12, 2018 based on check date.
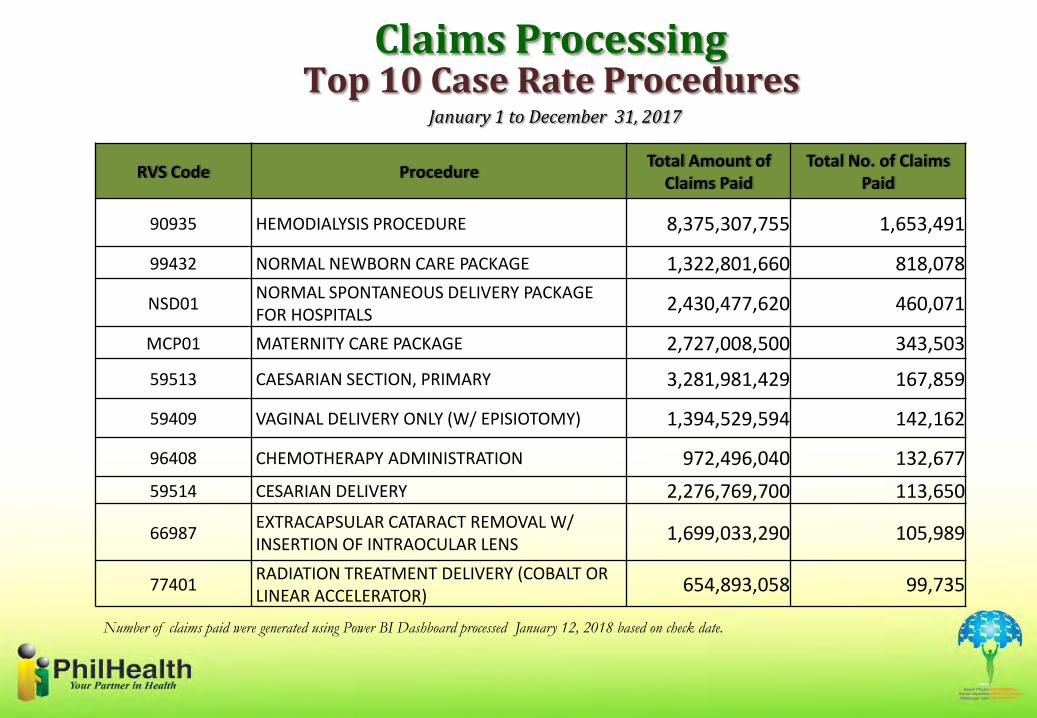
Top 10 Case Rate ProceduresJanuary 1 to December 31, 2017
Claims Processing
RVS Code ProcedureTotal Amount of
Claims PaidTotal No. of Claims
Paid
90935 HEMODIALYSIS PROCEDURE 8,375,307,755 1,653,491
99432 NORMAL NEWBORN CARE PACKAGE 1,322,801,660 818,078
NSD01NORMAL SPONTANEOUS DELIVERY PACKAGE FOR HOSPITALS
2,430,477,620 460,071
MCP01 MATERNITY CARE PACKAGE 2,727,008,500 343,503
59513 CAESARIAN SECTION, PRIMARY 3,281,981,429 167,859
59409 VAGINAL DELIVERY ONLY (W/ EPISIOTOMY) 1,394,529,594 142,162
96408 CHEMOTHERAPY ADMINISTRATION 972,496,040 132,677
59514 CESARIAN DELIVERY 2,276,769,700 113,650
66987EXTRACAPSULAR CATARACT REMOVAL W/ INSERTION OF INTRAOCULAR LENS
1,699,033,290 105,989
77401RADIATION TREATMENT DELIVERY (COBALT OR LINEAR ACCELERATOR)
654,893,058 99,735
Number of claims paid were generated using Power BI Dashboard processed January 12, 2018 based on check date.
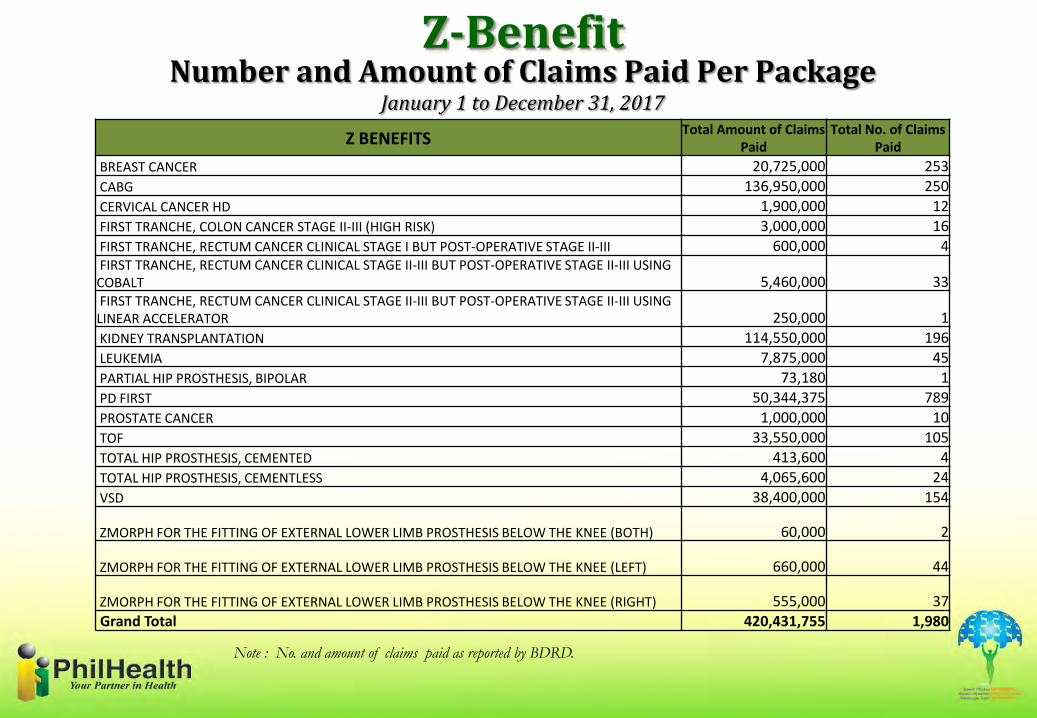
Number and Amount of Claims Paid Per PackageJanuary 1 to December 31, 2017
Z-Benefit
Note : No. and amount of claims paid as reported by BDRD.
Z BENEFITSTotal Amount of Claims
PaidTotal No. of Claims
Paid
BREAST CANCER 20,725,000 253
CABG 136,950,000 250
CERVICAL CANCER HD 1,900,000 12
FIRST TRANCHE, COLON CANCER STAGE II-III (HIGH RISK) 3,000,000 16
FIRST TRANCHE, RECTUM CANCER CLINICAL STAGE I BUT POST-OPERATIVE STAGE II-III 600,000 4 FIRST TRANCHE, RECTUM CANCER CLINICAL STAGE II-III BUT POST-OPERATIVE STAGE II-III USING COBALT 5,460,000 33 FIRST TRANCHE, RECTUM CANCER CLINICAL STAGE II-III BUT POST-OPERATIVE STAGE II-III USING LINEAR ACCELERATOR 250,000 1
KIDNEY TRANSPLANTATION 114,550,000 196
LEUKEMIA 7,875,000 45
PARTIAL HIP PROSTHESIS, BIPOLAR 73,180 1
PD FIRST 50,344,375 789
PROSTATE CANCER 1,000,000 10
TOF 33,550,000 105
TOTAL HIP PROSTHESIS, CEMENTED 413,600 4
TOTAL HIP PROSTHESIS, CEMENTLESS 4,065,600 24
VSD 38,400,000 154
ZMORPH FOR THE FITTING OF EXTERNAL LOWER LIMB PROSTHESIS BELOW THE KNEE (BOTH) 60,000 2
ZMORPH FOR THE FITTING OF EXTERNAL LOWER LIMB PROSTHESIS BELOW THE KNEE (LEFT) 660,000 44
ZMORPH FOR THE FITTING OF EXTERNAL LOWER LIMB PROSTHESIS BELOW THE KNEE (RIGHT) 555,000 37 Grand Total 420,431,755 1,980

Number and Amount of Claims Paid Per FacilityJanuary 1 to December 31, 2017
Z-Benefit
Note : No. and amount of claims paid as reported by BDRD.
Z BENEFITSTotal Amount of
Claims PaidTotal No. of Claims Paid
ANGELES UNIVERSITY FOUNDATION MEDICAL CENTER 2,975,000 6
BAGUIO GENERAL HOSPITAL AND MEDICAL CENTER 3,928,180 45
BATANGAS MEDICAL CENTER 3,075,000 33
BICOL MEDICAL CENTER 800,000 10
BICOL REGIONAL TRAINING AND TEACHING HOSPITAL 665,000 8
CAGAYAN VALLEY MEDICAL CENTER 325,000 4
CHINESE GENERAL HOSPITAL & MEDICAL CENTER 3,850,000 7
CORAZON LOCSIN MONTELIBANO MEM. REG'L HOSP. 7,300,092 66
DAVAO REGIONAL MEDICAL CENTER 1,125,000 15
DE LOS SANTOS MEDICAL CENTER 2,850,000 5
EAST AVENUE MEDICAL CENTER 400,000 5
ILOCOS TRAINING AND REGIONAL MEDICAL CENTER 75,000 1
KAPAMPANGAN DEVELOPMENT FOUNDATION, INC. 1,170,000 76
KIDNEY SOLUTIONS INC. 934,614 38
LORMA MEDICAL CENTER 1,150,000 2
MAKATI MEDICAL CENTER 436,153 13
MANILA DOCTORS HOSPITAL 4,950,000 9
MARY MEDIATRIX MEDICAL CENTER 7,950,000 15
NATIONAL KIDNEY AND TRANSPLANT INSTITUTE 114,597,857 789
NORTHERN MINDANAO MEDICAL CENTER 10,761,000 40
NOTRE DAME DE CHARTRES HOSPITAL 1,000,000 2
PHILIPPINE CHILDREN'S MEDICAL CENTER 3,710,000 19
PHILIPPINE HEART CENTER 140,980,000 362
SOUTHERN PHILIPPINES MEDICAL CENTER 34,730,000 91
ST. FRANCES CABRINI MEDICAL CENTER, INC. 1,025,000 12
ST. LUKE'S MEDICAL CENTER - GLOBAL CITY 14,400,000 25
ST. PAUL'S HOSPITAL OF ILOILO, INC. 3,048,458 20
UNIVERSITY OF THE EAST RAMON MAGSAYSAY MEMORIAL MEDICAL CENTER, INC. 90,000 6
UP-PHILIPPINE GENERAL HOSPITAL 33,260,000 163
VICENTE SOTTO MEMORIAL MEDICAL CENTER 17,425,400 78
WESTERN VISAYAS MEDICAL CENTER 1,445,000 15
Grand Total 420,431,755 1,980
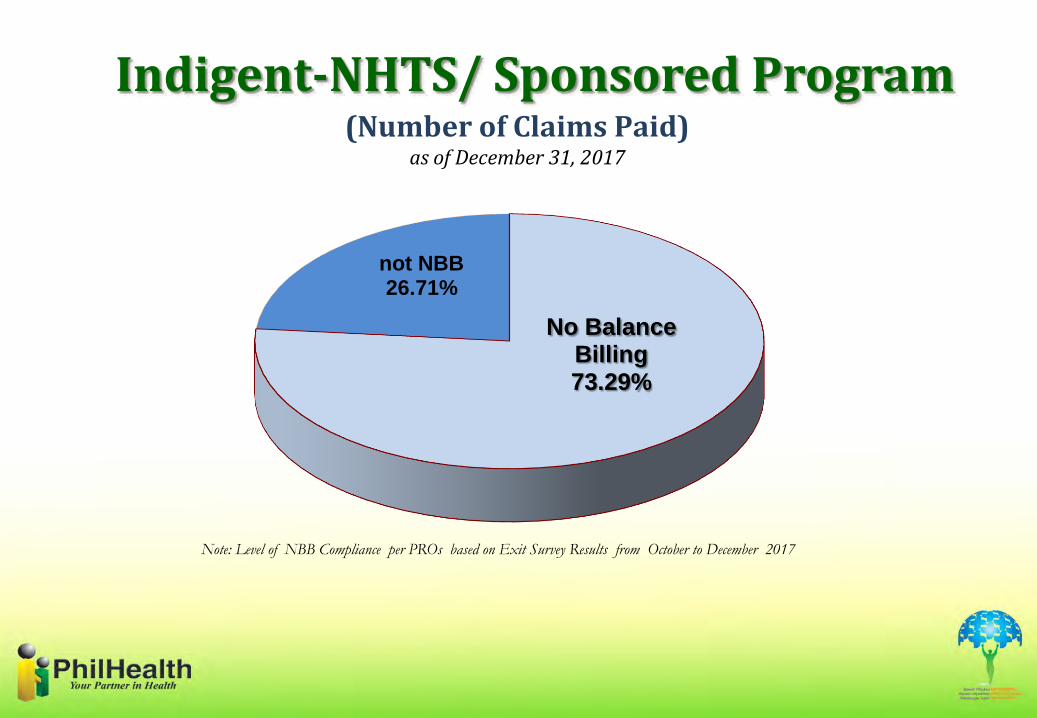
(Number of Claims Paid)as of December 31, 2017
Indigent-NHTS/ Sponsored Program
No Balance Billing73.29%
not NBB26.71%
Note: Level of NBB Compliance per PROs based on Exit Survey Results from October to December 2017
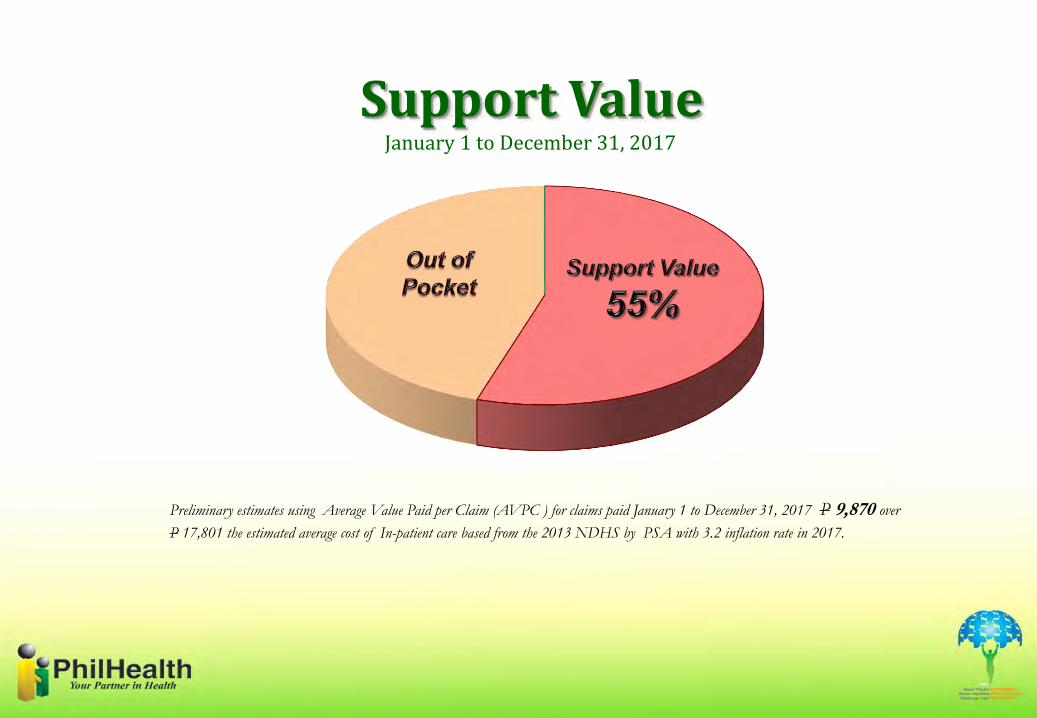
January 1 to December 31, 2017
Support Value
Preliminary estimates using Average Value Paid per Claim (AVPC ) for claims paid January 1 to December 31, 2017 P 9,870 over
P 17,801 the estimated average cost of In-patient care based from the 2013 NDHS by PSA with 3.2 inflation rate in 2017.