20171108 9m 2017 results - e.on · relation to court case & kfk solution ... thereof...
TRANSCRIPT

9M 2017 Results
8th November 2017
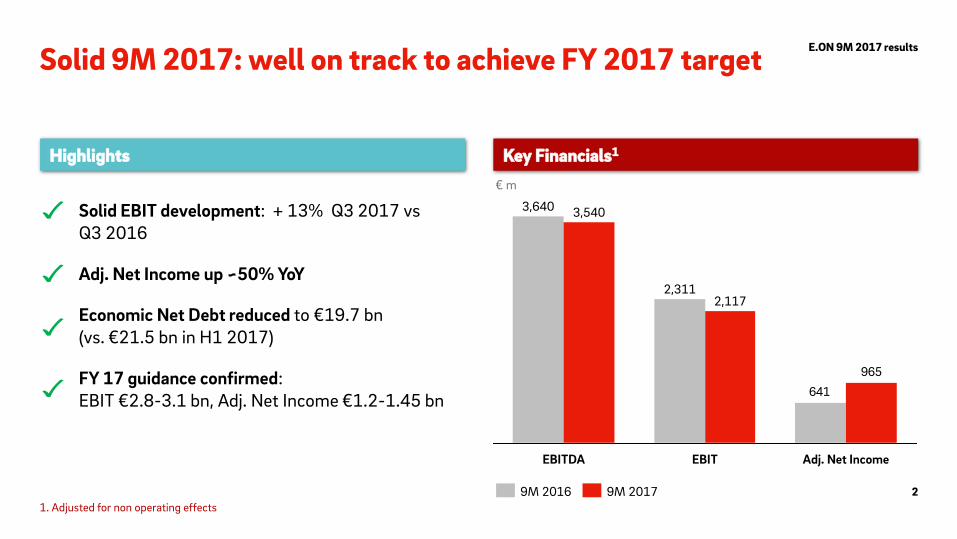
Solid 9M 2017: well on track to achieve FY 2017 target E.ON 9M 2017 results
Solid EBIT development: + 13% Q3 2017 vs Q3 2016
Adj. Net Income up ~50% YoY
Economic Net Debt reduced to €19.7 bn (vs. €21.5 bn in H1 2017)
FY 17 guidance confirmed: EBIT €2.8-3.1 bn, Adj. Net Income €1.2-1.45 bn
Highlights
2
641
965
Adj. Net Income EBITDA EBIT
3,540
2,117 2,311
3,640
9M 2017 9M 2016
Key Financials1
€ m
1. Adjusted for non operating effects

– Lower prices & volumes, additional depreciation of asset retirement costs (ARC)
+ End of nuclear fuel tax, one-off effects in relation to court case & KFK solution
+ Higher regulated revenues in Germany and CEE
+ Tariff increases in Sweden
+ Price increases in Germany and UK – Higher costs (e.g. ECO2), PPM3 cap,
competitive dynamics in UK, Energy procurement crisis in Romania (Q1 2017)
– Arkona book gain in Q2 2016 (offshore)
Catch-up continues in Q3 2017
12
221
165
9M 2017 2.117
Corp. Functions & Other,
Consolidation -142
Renewables -61
Customer Solutions
-195
Energy Networks
9M 2016 w/o div. operations
2.282
EBIT1 9M 2017 vs. 9M 2016 € m
1. Adjusted for non operating effects, 2. Energy Company Obligation (ECO) 3. Prepayment Meter (PPM)
3
E.ON 9M 2017 results
Energy Networks
Customer Solutions
Renewables
Preussen Elektra
Key 9M Effects
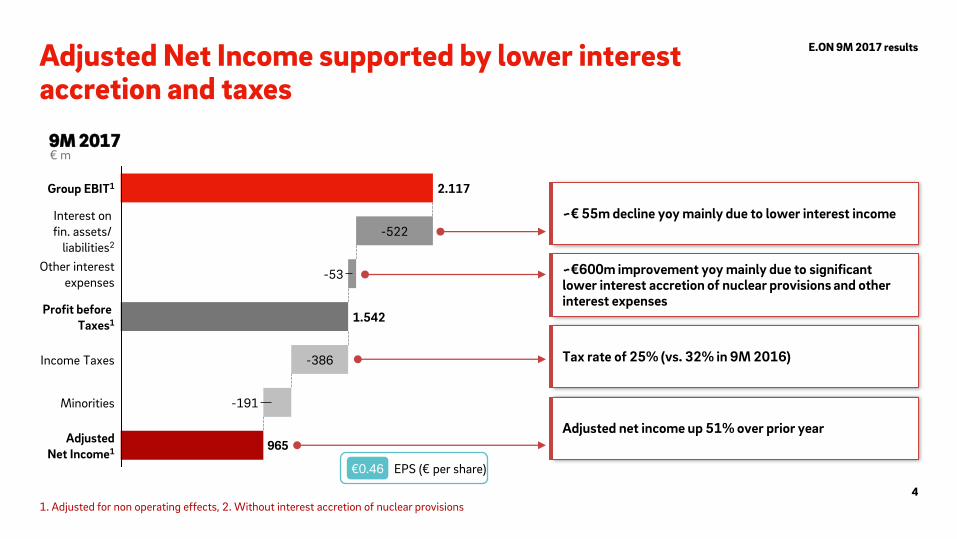
Adjusted Net Income supported by lower interest accretion and taxes
9M 2017 € m
~€ 55m decline yoy mainly due to lower interest income
1. Adjusted for non operating effects, 2. Without interest accretion of nuclear provisions 4
E.ON 9M 2017 results
EPS (€ per share)
965
Minorities -191
Income Taxes -386
Adjusted Net Income1
Profit before Taxes1 1.542
Other interest expenses -53
Interest on fin. assets/
liabilities2
-522
Group EBIT1 2.117
Tax rate of 25% (vs. 32% in 9M 2016)
~€600m improvement yoy mainly due to significant lower interest accretion of nuclear provisions and other interest expenses
Adjusted net income up 51% over prior year
€0.46

END improves significantly due to high cash flow and refund of nuclear fuel tax
+6.6
END 9M 2017
-19.7
-4.9
-3.6
-11.2
Others Divestments Pensions
0.4
10.2
0.2
Dividend
-0.5
ABB5
1.35
AROs6
-2.2
KFK payment to government
fund4
-10.3
Cash impact of NFT refund3
3.4
OCF2 Investments END FY 2016
-26.3 -0.9
-4.0
-21.4
0.6
3.5
€ bn
END1 9M 2017 vs. FY 2016
1. Economic net debt definition takes into account the decommissioning provisions calculated with a real discount rate of 0.0% as opposed to IFRS ARO’s. 2. OCF adjusted for KFK and NFT effects, 3. Nuclear Fuel Tax (NFT) including positive interest income effect, before taxes and payment to minorities 4. Kommission zur Überprüfung der Finanzierung des Kernenergieausstiegs (KFK), 5. Accelerated Book Build (ABB), 6. Includes transfer of nuclear storage liabilities to government fund
AROs Pension provisions Net financial position
5
E.ON 9M 2017 results
Operating Cash Flow: -3.3
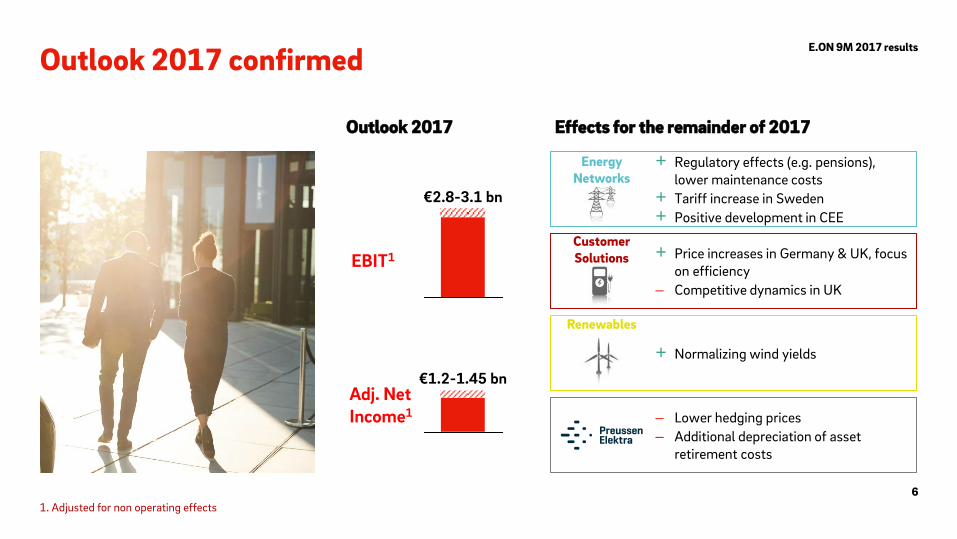
Outlook 2017 confirmed
EBIT1
Adj. Net Income1
Outlook 2017
1. Adjusted for non operating effects
€1.2-1.45 bn
Effects for the remainder of 2017
E.ON 9M 2017 results
6
– Lower hedging prices
– Additional depreciation of asset retirement costs
Energy Networks
Customer Solutions
Renewables
+ Regulatory effects (e.g. pensions), lower maintenance costs
+ Tariff increase in Sweden
+ Positive development in CEE
+ Price increases in Germany & UK, focus on efficiency
– Competitive dynamics in UK
+ Normalizing wind yields
€2.8-3.1 bn

Appendix
Financial Details
Contacts, Calendar & Disclaimer
1
2

8
E.ON 9M 2017 results Appendix: Table of Contents
1
11 Energy Networks 12
Customer Solution
13 Renewables 14 Preussen Elektra
9 Financial Highlights 10
Cash Conversion
15 Financial Appendix

Financial Highlights
€m 9M 2016 9M 2017 % YoY
Sales 28,198 27,937 -1
EBITDA 1 3,640 3,540 -3
EBIT 1 2,311 2,117 -8
Adjusted net income 1 641 965 +51
OCF bIT 3,827 -3,091 -181
Investments 1,981 2,222 +12
Economic net debt ² 26,320 19,699 -25
9
E.ON 9M 2017 results
EBIT • Energy Networks: +18% YoY.
Higher regulated revenues in Germany and CEE and tariff increases in Sweden
• Customer Solutions: -36% YoY. Lower margins and increased competitors dynamic
• Renewables: -20% YoY. Arkona book gain in Q2 2016 and lower wind conditions
OCF bIT • Cash provided by operating
activities €6.3 bn below prior-year level
• Key drivers: €10.3 bn payment to nuclear fund (KFK3) (-) and €3.4 bn4 nuclear fuel tax (NFT) refund (+)
Adj. Net Income • €324 m above last years
9M result • Improvement YoY mainly
driven by significant lower interest accretion of nuclear provisions, other interest expenses and a tax rate of 25% (vs. 32% in 9M 2016)
1. Adjusted for non operating effects, 2. Economic net debt as per 31 Dec 2016 and 30 Sept 2017; Economic net debt definition takes into account the decommissioning provisions calculated with a real discount rate of 0.0% as opposed to IFRS ARO’s 3. Kommission zur Überprüfung der Finanzierung des Kernenergieausstiegs (KFK) 4. Nuclear Fuel Tax (NFT) including positive interest income effect, before taxes and payment to minorities
1
Investments • Energy Networks: €864 m
(vs. €866 m YoY) • Customer Solutions: €350
m (vs. €392 m YoY) • Renewables: €961 m
(vs. €637 m YoY )

Capex
-2.2
OCF
3.5
Tax Payments
-0.3
Interest Payments
-0.3
OCF bIT4
4.2
Changes in WC
0.9
Cash Adjustments3
-0.2
EBITDA1
3.5
+120%
FCF
1.3
High cash conversion rate2 of 120% supported by strong operating cash flow
9M 2017 € bn
1. Adjusted for non operating effects, 2. Cash Conversion Rate: OCF bIT / EBITDA, adjusted for NFT and KFK effects, 3. Net non cash effective EBITDA items incl. provision utilizations, 4. Adjusted for KFK and NFT effects
10
E.ON 9M 2017 results
1

Highlights
Segments: Energy Networks
• Germany:
+ Regulatory effects
+ Lower maintenance costs
• Sweden:
+ Tariff increases
• CEE & Turkey:
+ Tariff increases in Hungary
+ Higher allowed revenues in Czech Republic & Romania
Energy Networks
284
288 345
270
788
+18%
CEE & Turkey
Sweden
Germany
9M 2017
1,417
9M 2016
1,196
638
1. Adjusted for non operating effects
EBIT1 € m
€m
9M 2016 9M 2017 % YoY 9M 2016 9M 2017 % YoY 9M 2016 9M 2017 % YoY 9M 2016 9M 2017 % YoY
Revenue 10,288 10,797 +5 736 831 +13 1,183 1,239 +5 12,207 12,867 +5
EBITDA 1 1,084 1,217 +12 411 467 +14 428 451 +5 1,923 2,135 +11
EBIT 1 638 788 +24 288 345 +20 270 284 +5 1,196 1,417 +18
thereof Equity-method earnings 54 60 +11 0 0 - 47 -7 -115 101 53 -48
OCFbIT 1,809 2,106 +16 398 443 +11 394 424 +8 2,601 2,973 +14
Investments 517 396 -23 180 228 +27 169 240 +42 866 864 -0
TotalGermany Sweden CEE & Turkey
11
E.ON 9M 2017 results D
etai
ls
1

Segments: Customer Solutions
Customer Solutions Highlights
• Germany:
– Lower power margins due to increased TSO2 fees (Q1 2017)
– Lower gas margin due to price decrease in Nov 2016
+ Price increases as per Q2 2017
• UK:
– Higher ECO3 costs & FX weakening
– Price cap on PPM4 customers
– Competitive dynamics
• Other:
– Energy procurement crisis in Romania in Q1 2017
177
227
144
144
93
116
-36%
Other
UK
Germany
9M 2017
353
9M 2016
548
EBIT1 € m
1. Adjusted for non operating effects 2. Transmission system operator (TSO) 3. Energy Company Obligation (ECO) 4. Prepayment meter (PPM)
€m
9M 2016 9M 2017 % YoY 9M 2016 9M 2017 % YoY 9M 2016 9M 2017 % YoY 9M 2016 9M 2017 % YoY
Revenue 5,526 5,424 -2 5,676 5,083 -10 4,877 4,972 +2 16,079 15,479 -4
EBITDA 1 192 147 -23 297 218 -27 274 219 -20 763 584 -23
EBIT 1 144 93 -35 227 144 -37 177 116 -34 548 353 -36
thereof Equity-method earnings 0 0 - 0 0 - 8 11 +38 8 11 +38
OCFbIT 352 226 -36 283 229 -19 505 277 -45 1,140 732 -36
Investments 47 42 -11 158 142 -10 187 166 -11 392 350 -11
TotalUKGermany Other
12
E.ON 9M 2017 results D
etai
ls
1

• Offshore:
– Arkona book gain in Q2 2016
– Lower wind conditions in UK, FX (GBP) weakening
• Onshore:
+ COD of Colbeck’s Corner in May 2016
+ Higher production of US wind farms
– Lower wind conditions in Europe (esp. Italy & UK)
Segments: Renewables
Renewables Highlights
243186
6266
-20%
Offshore/Other
Onshore/Solar
9M 2017
248
9M 2016
309
EBIT1 € m
1. Adjusted for non operating effects
€m
9M 2016 9M 2017 % YoY 9M 2016 9M 2017 % YoY 9M 2016 9M 2017 % YoY
Revenue 567 691 +22 455 439 -4 1,022 1,130 +11
EBITDA 1 229 209 -9 355 299 -16 584 508 -13
EBIT 1 66 62 -6 243 186 -23 309 248 -20
thereof Equity-method earnings 11 18 +64
OCFbit 525 540 +3
Investments 637 961 +51
Onshore Wind / Solar Offshore Wind / Others Total
13
E.ON 9M 2017 results D
etai
ls
1
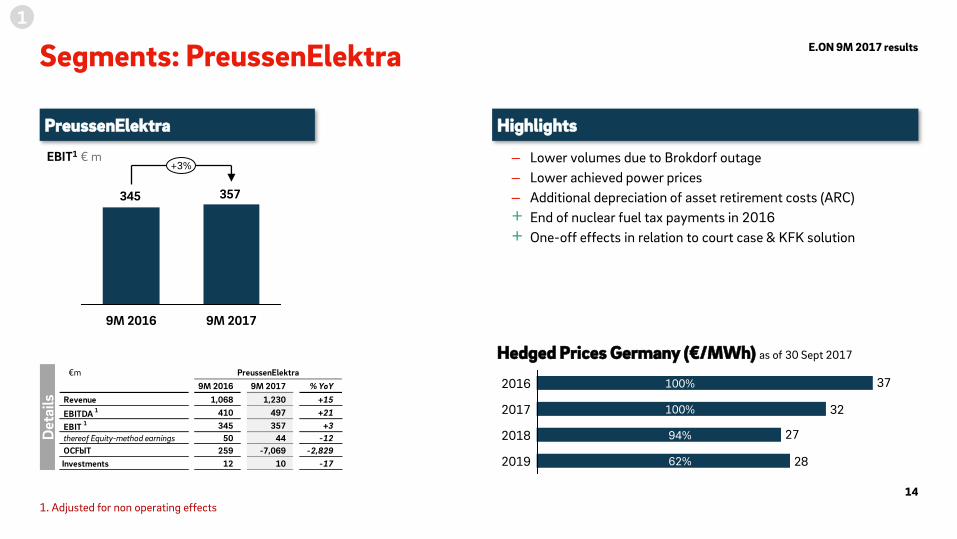
Segments: PreussenElektra
PreussenElektra Highlights
357345
+3%
9M 2017 9M 2016
– Lower volumes due to Brokdorf outage
– Lower achieved power prices
– Additional depreciation of asset retirement costs (ARC)
+ End of nuclear fuel tax payments in 2016
+ One-off effects in relation to court case & KFK solution
Hedged Prices Germany (€/MWh) as of 30 Sept 2017
EBIT1 € m
1. Adjusted for non operating effects
€m
9M 2016 9M 2017 % YoY
Revenue 1,068 1,230 +15
EBITDA 1 410 497 +21
EBIT 1 345 357 +3
thereof Equity-method earnings 50 44 -12
OCFbIT 259 -7,069 -2,829
Investments 12 10 -17
PreussenElektra
14
E.ON 9M 2017 results
32
28
27
37
2019
2018
2017
2016
94%
62%
100%
Det
ails
100%
1

Adjusted Net Income
€m 9M 2016 9M 2017 % YoY
EBITDA 1 3,640 3,540 -3
Depreciation/amortization -1,329 -1,423 -7
EBIT 1 2,311 2,117 -8
Economic interest expense (net) -1,118 -575 +49
EBT 1 1,193 1,542 +29
Income Taxes on EBT 1 -387 -386 +0
% of EBT 1 -32% -25% -
Non-controlling interests -165 -191 -16
Adjusted net income 1 641 965 +51
1. Adjusted for non operating effects
15
E.ON 9M 2017 results
1
Economic interest expense (net) • Improvement mainly driven
by significant lower interest accretion of nuclear provisions and other interest expenses
Tax rate • Tax rate of 25% (vs. 32%
in 9M 2016)

Reconciliation of Adj. EBIT to IFRS Net Income
€m 9M 2016 9M 2017 % YoY
EBITDA 1 3,640 3,540 -3
Depreciation/Amortization/Impairments -1,329 -1,423 -7
EBIT 1 2,311 2,117 -8
Economic interest expense (net) -1,118 -575 +49
Net book gains 1 288 n/a
Restructuring -221 -173 +22
Mark-to-market valuation of derivatives 768 -453 -159
Impairments (net) -44 5 +111
Other non-operating earnings -79 3,298 n/a
Income/Loss from continuing operations before income taxes 1,618 4,507 +179
Income taxes -624 -604 +3
Income/loss from discontinued operations, net -10,293 0 +100
Non-controlling interests -5,351 197 +104
Net income/loss attributable to shareholders of E.ON SE -3,948 3,706 +194
1. Adjusted for non operating effects
E.ON 9M 2017 results
1
16
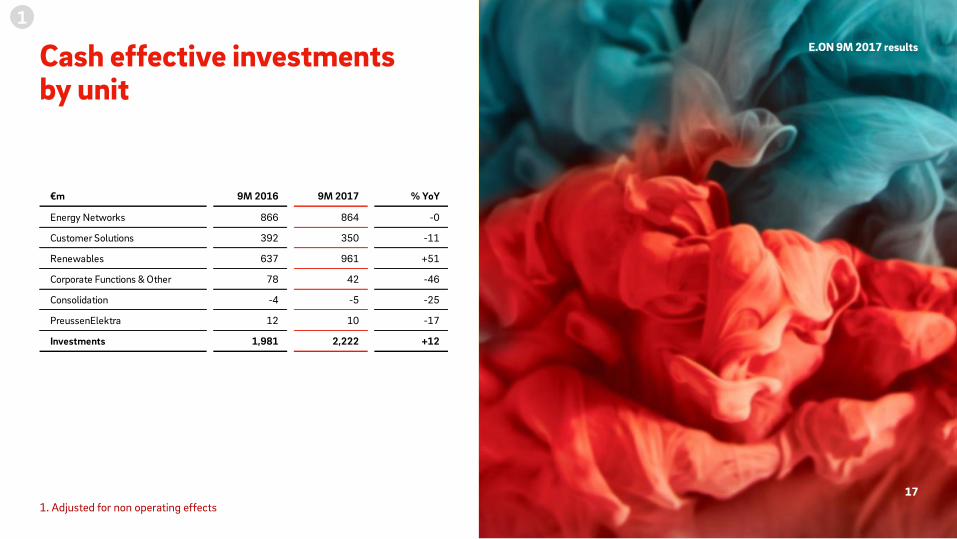
Cash effective investments by unit
1. Adjusted for non operating effects
€m 9M 2016 9M 2017 % YoY
Energy Networks 866 864 -0
Customer Solutions 392 350 -11
Renewables 637 961 +51
Corporate Functions & Other 78 42 -46
Consolidation -4 -5 -25
PreussenElektra 12 10 -17
Investments 1,981 2,222 +12
E.ON 9M 2017 results
17
1

Economic Net Debt1
1. Economic net debt definition takes into account the decommissioning provisions calculated with a real discount rate of 0.0% as opposed to IFRS ARO’s, 2. Net figure; does not include transactions relating to our operating business or asset management
E.ON 9M 2017 results
18
1
€m 31 Dec 2016 30 June 2017 30 Sept 2017
Liquid funds 8,573 14,252 5,450
Non-current securities 4,327 3,850 3,801
Financial liabilities -14,227 -14,691 -14,304
Adjustment FX hedging ² 390 311 158
Net financial position -937 3,722 -4,895
Provisions for pensions -4,009 -3,748 -3,586
Asset retirement obligations -21,374 -21,459 -11,218
Economic net debt -26,320 -21,485 -19,699

Economic interest expense (net)
€m 9M 2016 9M 2017 Difference
(in € m)
Interest from financial assets/liabilities -467 -522 -55
Interest cost from provisions for pensions and similar provisions -64 -61 +2
Accretion of provisions for retirement obligation and similar provisions -647 -49 +597
Construction period interests¹ 29 29 +0
Others 31 29 -2
net interest result -1,118 -575 +543
1. Borrowing cost that are directly attributable to the acquisition, construction or production of a qualified asset. Borrowing cost are (virtual) interest costs incurred by an entity in connection with the borrowing of funds. (interest rate: 5.6%)
19
E.ON 9M 2017 results
1
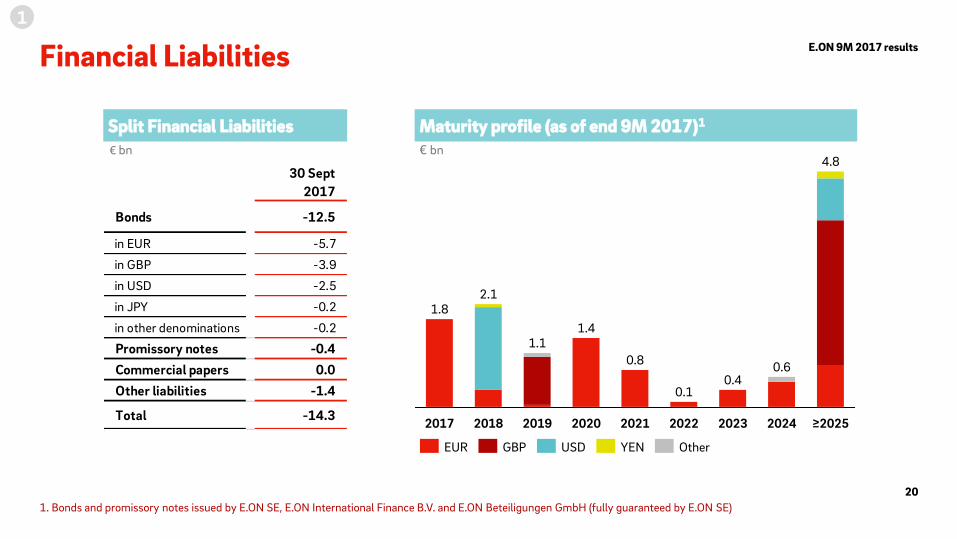
Financial Liabilities
Split Financial Liabilities
€ bn
30 Sept
2017
Bonds -12.5
in EUR -5.7
in GBP -3.9
in USD -2.5
in JPY -0.2
in other denominations -0.2
Promissory notes -0.4
Commercial papers 0.0
Other liabilities -1.4
Total -14.3
1
20
E.ON 9M 2017 results
2018
1.1 1.4
2019
1.8
≥2025
4.8
0.6
2024
0.4
2023 2022
0.8
2020
0.1
2021 2017
2.1
GBP EUR USD Other YEN
Maturity profile (as of end 9M 2017)1
€ bn
1. Bonds and promissory notes issued by E.ON SE, E.ON International Finance B.V. and E.ON Beteiligungen GmbH (fully guaranteed by E.ON SE)

E.ON Investor Relations contacts
T +49 (201) 184 2806 [email protected]
Alexander Karnick T+49 (201) 184 28 38
Head of Investor Relations [email protected]
Martina Burger T +49 (201) 184 28 07
Manager Investor Relations [email protected]
Dr. Stephan Schönefuß T +49 (201) 184 28 22
Manager Investor Relations [email protected]
E.ON 9M 2017 results
21
2

Financial calendar & important links
Financial calendar
March 14, 2018 Annual Report 2017
May 8, 2018 Interim Report I: January – March 2018
May 9, 2018 2018 Annual Shareholders Meeting
August 8, 2018 Interim Report II: January – June 2018
November 14, 2018 Interim Report III: January – September 2018
Important links
Presentations https://www.eon.com/en/investor-relations/presentations.html
Annual Reports https://www.eon.com/en/investor-relations/financial-publications/annual-report.html
Interim Reports https://www.eon.com/en/investor-relations/financial-publications/interim-report.html
Shareholders Meeting https://www.eon.com/en/investor-relations/shareholders-meeting.html
Bonds / Creditor Relations https://www.eon.com/en/investor-relations/bonds.html
22
E.ON 9M 2017 results
2

This presentation contains information relating to E.ON Group ("E.ON") that must not be relied upon for any purpose and may not be redistributed, reproduced, published, or passed on to any other person or used in whole or in part for any other purpose. By accessing this document you agree to abide by the limitations set out in this document as well as any limitations set out on the webpage of E.ON SE on which this presentation has been made available.
This document is being presented solely for informational purposes. It should not be treated as giving investment advice, nor is it intended to provide the basis for any evaluation or any securities and should not be considered as a recommendation that any person should purchase, hold or dispose of any shares or other securities.
This presentation may contain forward-looking statements based on current assumptions and forecasts made by E.ON management and other information currently available to E.ON. Various known and unknown risks, uncertainties and other factors could lead to material differences between the actual future results, financial situation, development or performance of the company and the estimates given here. E.ON does not intend, and does not assume any liability whatsoever, to update these forward-looking statements or to conform them to future events or developments.
Neither E.ON nor any respective agents of E.ON undertake any obligation to provide the recipient with access to any additional information or to update this presentation or any information or to correct any inaccuracies in any such information.
Certain numerical data, financial information and market data (including percentages) in this presentation have been rounded according to established commercial standards. As a result, the aggregate amounts (sum totals or interim totals or differences or if numbers are put in relation) in this presentation may not correspond in all cases to the amounts contained in the underlying (unrounded) figures appearing in the consolidated financial statements. Furthermore, in tables and charts, these rounded figures may not add up exactly to the totals contained in the respective tables and charts.
Disclaimer
23
E.ON 9M 2017 results
2