2018 05 investor presentation+v2 · 7 lithia motors may 2018 lithia business mix 53% of gross...
TRANSCRIPT

LITHIA MOTORS MAY 20181
INVESTOR PRESENTATIONMay 2018

LITHIA MOTORS MAY 20182
DISCLOSUREForward-Looking StatementsThis presentation includes "forward-looking statements" within the meaning of the "Safe-Harbor" provisions of the Private Securities Litigation Reform Act of 1995. Forward lookingstatements include statements regarding our goals, plans, projections and guidance regarding our financial position, results of operations, market position, pending and potential futureacquisitions and business strategy, and often contain words such as "project," "outlook," "expect," "anticipate," "intend," "plan," "believe," "estimate," "may," "seek," "would," "should,""likely," "goal," "strategy," "future," "maintain," "continue," "remain," "target" or "will" and similar references to future periods. Examples of forward-looking statements in this pressrelease include, among others, statements regarding:
• Expected operating results, such as improved store efficiency and performance and targeted 2018 performance such as revenue, EPS and growth rates;• Our ability to improve store performance;• Anticipated acquisition opportunities and additions of dealership locations to our portfolio in the future, and our ability to improve earnings and achieve returns on investments;• Anticipated revenues from acquired and open point stores; and• Anticipated availability of liquidity from our credit facility and unfinanced operating real estate.
By their nature, forward-looking statements involve risks and uncertainties because they relate to events that depend on circumstances that may or may not occur in the future.Forward-looking statements are not guarantees of future performance, and our actual results of operations, financial condition and liquidity and development of the industry in which weoperate may differ materially from those made in or suggested by the forward-looking statements in this press release. The risks and uncertainties that could cause actual results todiffer materially from estimated or projected results include, without limitation, future economic and financial conditions (both nationally and locally), changes in customer demand, ourrelationship with, and the financial and operational stability of, vehicle manufacturers and other suppliers, risks associated with our indebtedness (including available borrowing capacity,compliance with financial covenants and ability to refinance or repay indebtedness on favorable terms), government regulations, legislation and others set forth throughout "Part II, Item7. Management's Discussion and Analysis of Financial Condition and Results of Operations" and in "Part I, Item 1A. Risk Factors" of our most recent Annual Report on Form 10-K, andfrom time to time in our other filings with the SEC. We urge you to carefully consider this information and not place undue reliance on forward-looking statements. We undertake no dutyto update our forward-looking statements, including our earnings outlook, which are made as of the date of this presentation..
Non-GAAP Financial MeasuresThis presentation contains non-GAAP financial measures such as adjusted net income and diluted earnings per share, adjusted SG&A as a percentage of revenue and gross profit,adjusted operating margin, adjusted operating profit as a percentage of gross profit, adjusted pre-tax margin, EBITDA, adjusted EBITDA, leveraged EBITDA and adjusted total debt.Non-GAAP measures do not have definitions under GAAP and may be defined differently by and not comparable to similarly titled measures used by other companies. As a result, wereview any non-GAAP financial measures in connection with a review of the most directly comparable measures calculated in accordance with GAAP. We caution you not to placeundue reliance on such non-GAAP measures, but also to consider them with the most directly comparable GAAP measures. We present cash flows from operations in the attachedtables, adjusted to include the change in non-trade floor plan debt to improve the visibility of cash flows related to vehicle financing. As required by SEC rules, we have reconciled thesemeasures to the most directly comparable GAAP measures in the attachments to this release. We believe the non-GAAP financial measures we present improve the transparency ofour disclosures; provide a meaningful presentation of our results from core business operations, because they exclude items not related to core business operations and other non-cash items; and improve the period-to-period comparability of our results from core business operations. These presentations should not be considered an alternative to GAAPmeasures.
LITHIA MOTORS MAY 20183
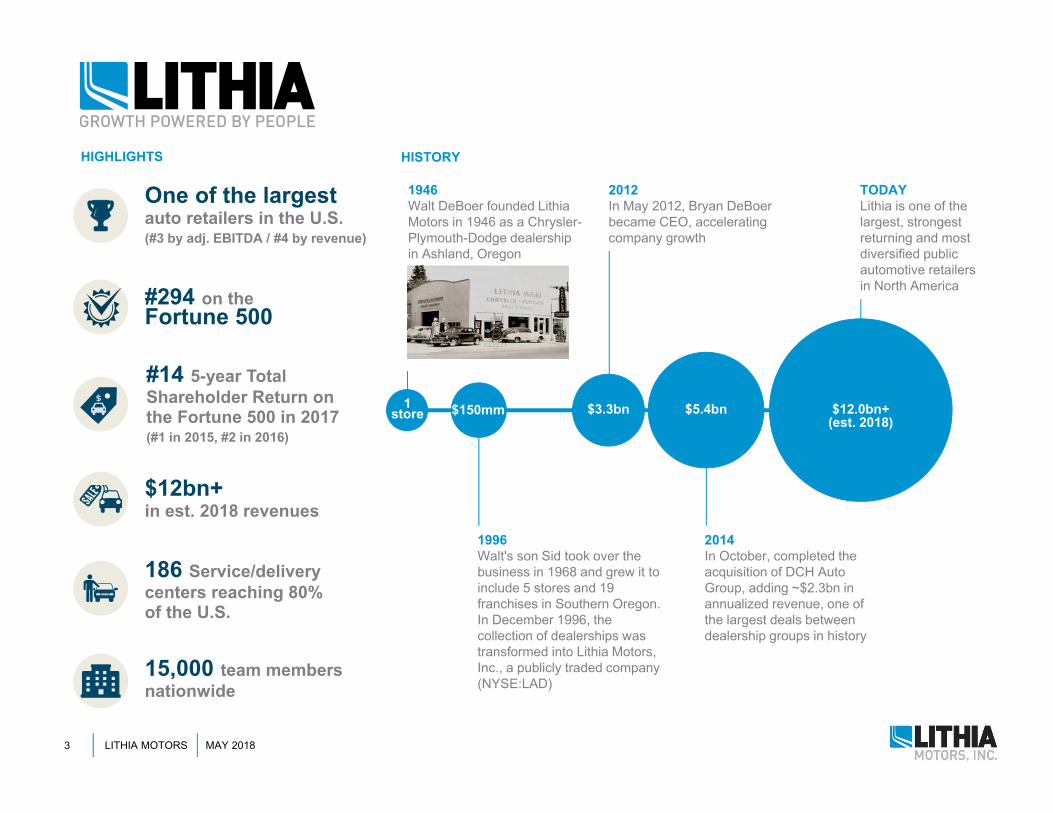
One of the largest auto retailers in the U.S. (#3 by adj. EBITDA / #4 by revenue)
#294 on the Fortune 500
$12bn+in est. 2018 revenues
186 Service/delivery centers reaching 80% of the U.S.
15,000 team membersnationwide
TODAYLithia is one of the largest, strongest returning and most diversified public automotive retailers in North America
1946Walt DeBoer founded Lithia Motors in 1946 as a Chrysler-Plymouth-Dodge dealership in Ashland, Oregon
1996Walt's son Sid took over the business in 1968 and grew it to include 5 stores and 19 franchises in Southern Oregon. In December 1996, the collection of dealerships was transformed into Lithia Motors, Inc., a publicly traded company (NYSE:LAD)
2012In May 2012, Bryan DeBoer became CEO, accelerating company growth
2014In October, completed the acquisition of DCH Auto Group, adding ~$2.3bn in annualized revenue, one of the largest deals between dealership groups in history
$150mm $3.3bn $5.4bn $12.0bn+(est. 2018)
#14 5-year Total Shareholder Return on the Fortune 500 in 2017 (#1 in 2015, #2 in 2016)
HIGHLIGHTS HISTORY
1 store
LITHIA MOTORS MAY 20184
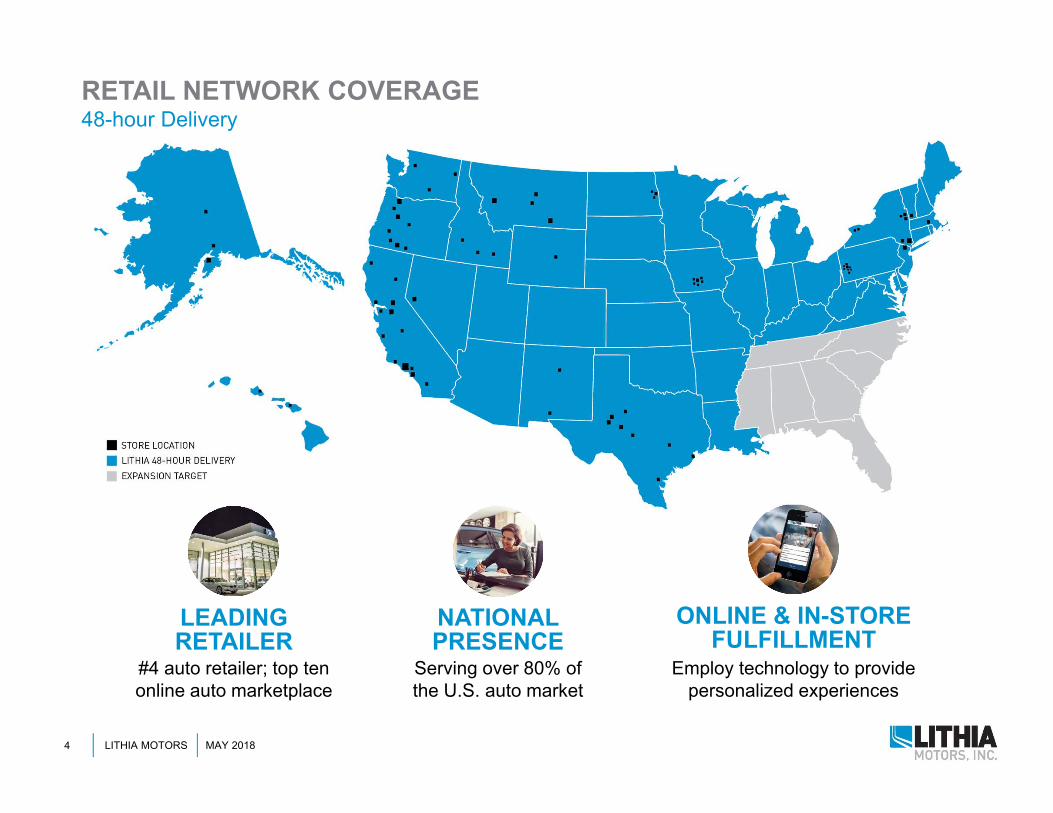
RETAIL NETWORK COVERAGE48-hour Delivery
NATIONAL PRESENCE
Serving over 80% of the U.S. auto market
LEADING RETAILER
#4 auto retailer; top ten online auto marketplace
ONLINE & IN-STORE FULFILLMENT
Employ technology to provide personalized experiences

LITHIA MOTORS MAY 20185
Vast potential in existing storesWorld-class performance management
Agile, local market approach
INTERNALDRY POWDER
Acquire strong brand, under-performing businesses
Create complementary opportunities
Deliver superb returns
GREENFIELD-LIKE GROWTH
Proven leadership team
Generates substantial cash
Innovating to meet customer needs
CAPITAL ENGINE
OUR STRATEGY

LITHIA MOTORS MAY 20186
OUR KEY STRENGTHS
LITHIA MOTORS MAY 20187
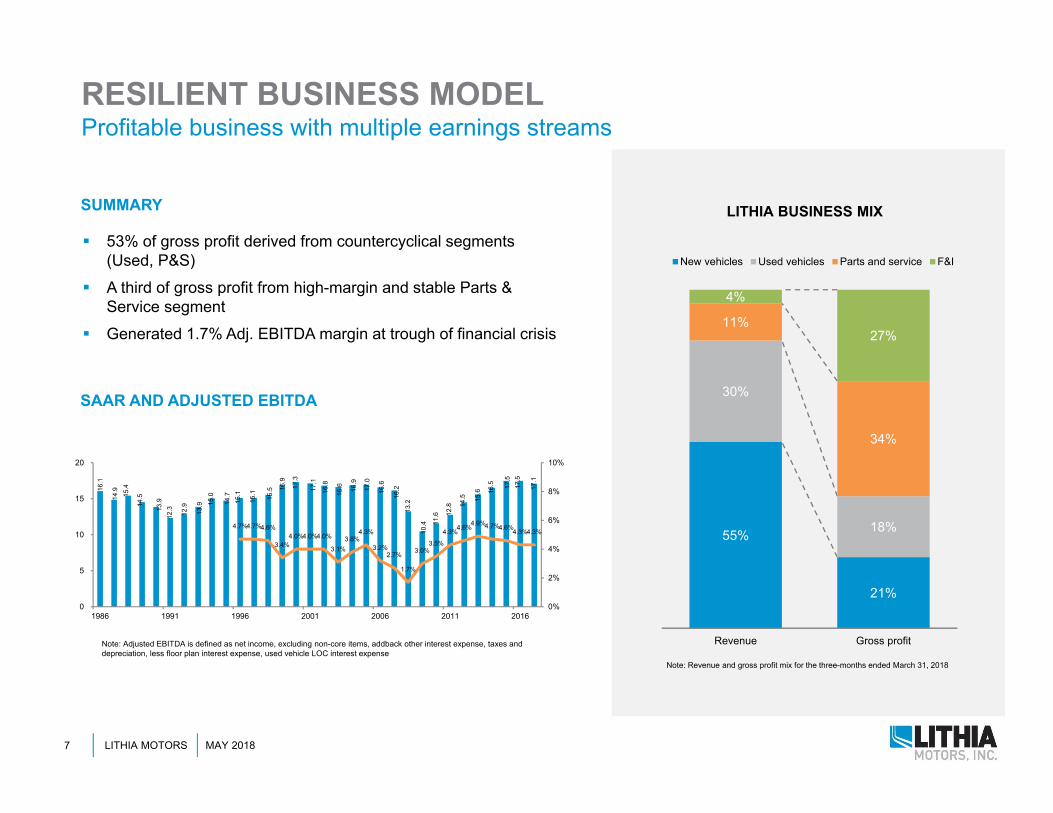
LITHIA BUSINESS MIX
53% of gross profit derived from countercyclical segments (Used, P&S)
A third of gross profit from high-margin and stable Parts & Service segment
Generated 1.7% Adj. EBITDA margin at trough of financial crisis
SAAR AND ADJUSTED EBITDA
RESILIENT BUSINESS MODELProfitable business with multiple earnings streams
16.1
14.9 15.4
14.5
13.9
12.3 12.9
13.9 15
.0
14.7
15.1
15.1 15.5 16
.9
17.3
17.1
16.8
16.6 16
.9
17.0
16.6
16.2
13.2
10.4 11
.6 12.8 14
.5 15.6 16
.5 17.5
17.5
17.1
4.7%4.7%4.6%
3.4%4.0%4.0%4.0%
3.1%3.8%
4.3%
3.2%2.7%
1.7%
3.0%3.5%
4.3%4.6%4.9%4.7%4.6%4.3%4.3%
0%
2%
4%
6%
8%
10%
0
5
10
15
20
1986 1991 1996 2001 2006 2011 2016
Note: Adjusted EBITDA is defined as net income, excluding non-core items, addback other interest expense, taxes and depreciation, less floor plan interest expense, used vehicle LOC interest expense
SUMMARY
55%
21%
30%
18%
11%
34%
4%
27%
Revenue Gross profit
New vehicles Used vehicles Parts and service F&I
Note: Revenue and gross profit mix for the three-months ended March 31, 2018
LITHIA MOTORS MAY 20188
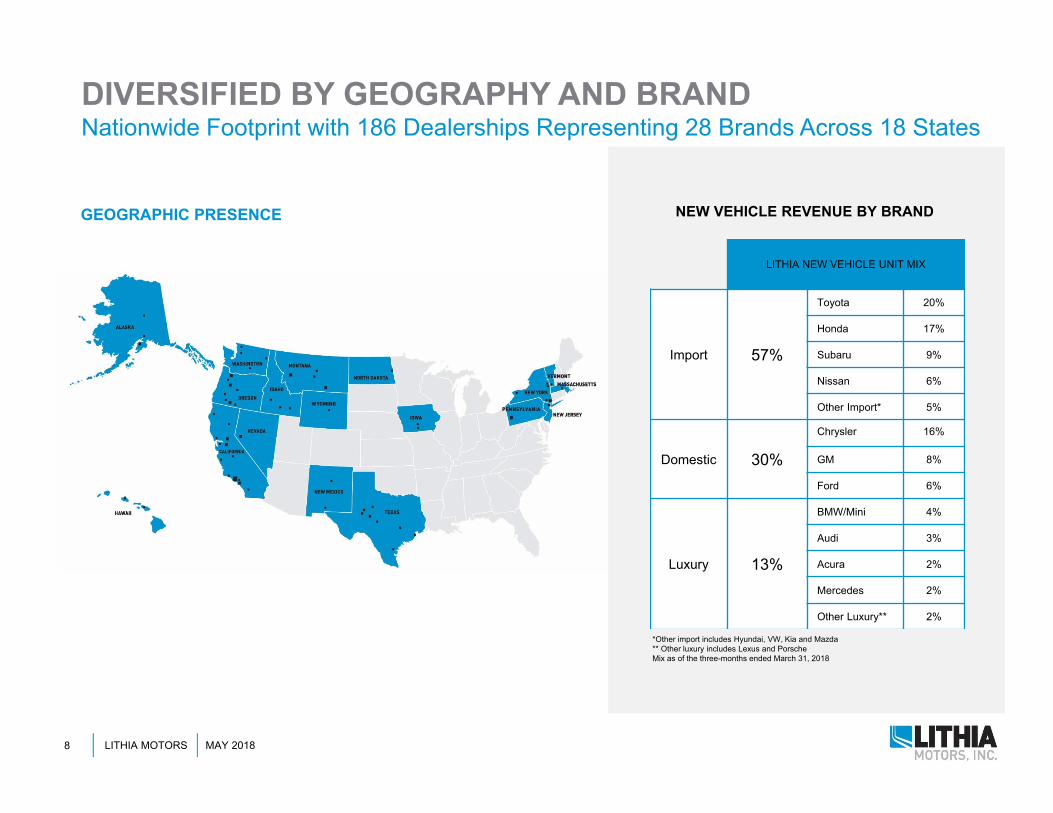
DIVERSIFIED BY GEOGRAPHY AND BRANDNationwide Footprint with 186 Dealerships Representing 28 Brands Across 18 States
LITHIA NEW VEHICLE UNIT MIX
Import 57%
Toyota 20%
Honda 17%
Subaru 9%
Nissan 6%
Other Import* 5%
Domestic 30%
Chrysler 16%
GM 8%
Ford 6%
Luxury 13%
BMW/Mini 4%
Audi 3%
Acura 2%
Mercedes 2%
Other Luxury** 2%
*Other import includes Hyundai, VW, Kia and Mazda ** Other luxury includes Lexus and PorscheMix as of the three-months ended March 31, 2018
GEOGRAPHIC PRESENCE NEW VEHICLE REVENUE BY BRAND
LITHIA MOTORS MAY 20189
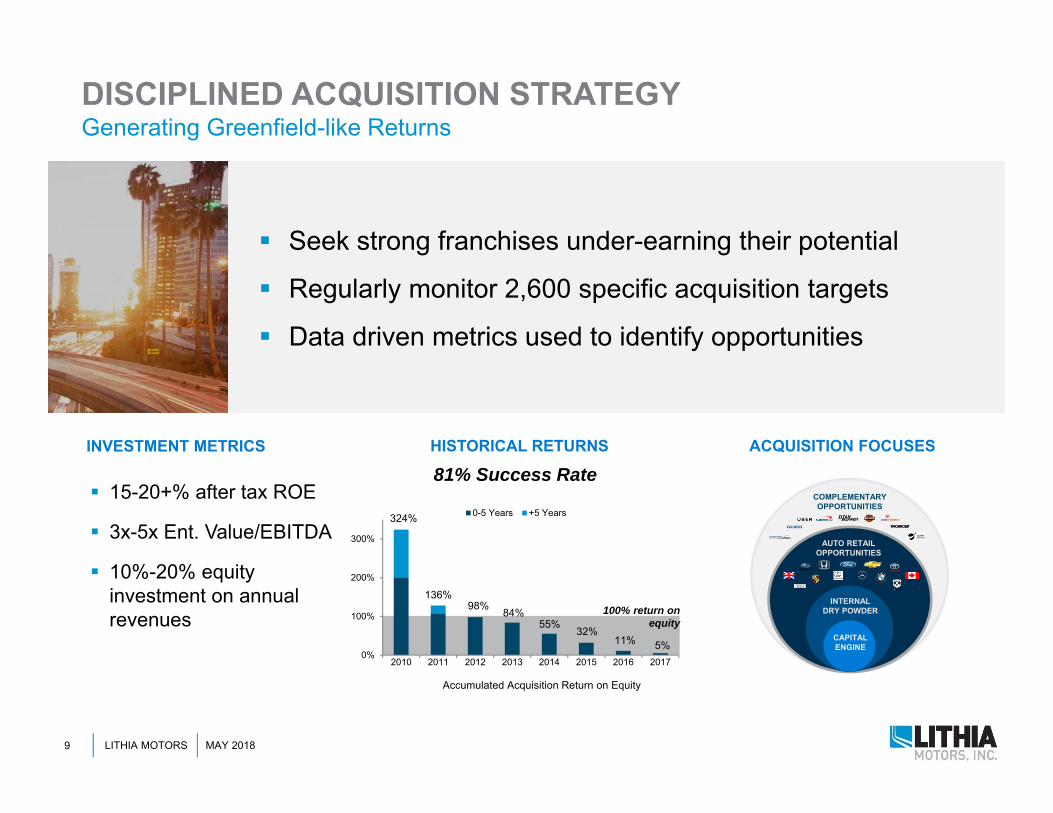
DISCIPLINED ACQUISITION STRATEGYGenerating Greenfield-like Returns
INVESTMENT METRICS
Seek strong franchises under-earning their potential
Regularly monitor 2,600 specific acquisition targets
Data driven metrics used to identify opportunities
15-20+% after tax ROE
3x-5x Ent. Value/EBITDA
10%-20% equity investment on annual revenues
INTERNAL DRY POWDER
AUTO RETAILOPPORTUNITIES
COMPLEMENTARYOPPORTUNITIES
CAPITALENGINE
HISTORICAL RETURNS
100% return on equity
324%
136%98%
55%32%
11% 5%
ACQUISITION FOCUSES
81% Success Rate
84%
0%
100%
200%
300%
2010 2011 2012 2013 2014 2015 2016 2017
Accumulated Acquisition Return on Equity
0-5 Years +5 Years
LITHIA MOTORS MAY 201810
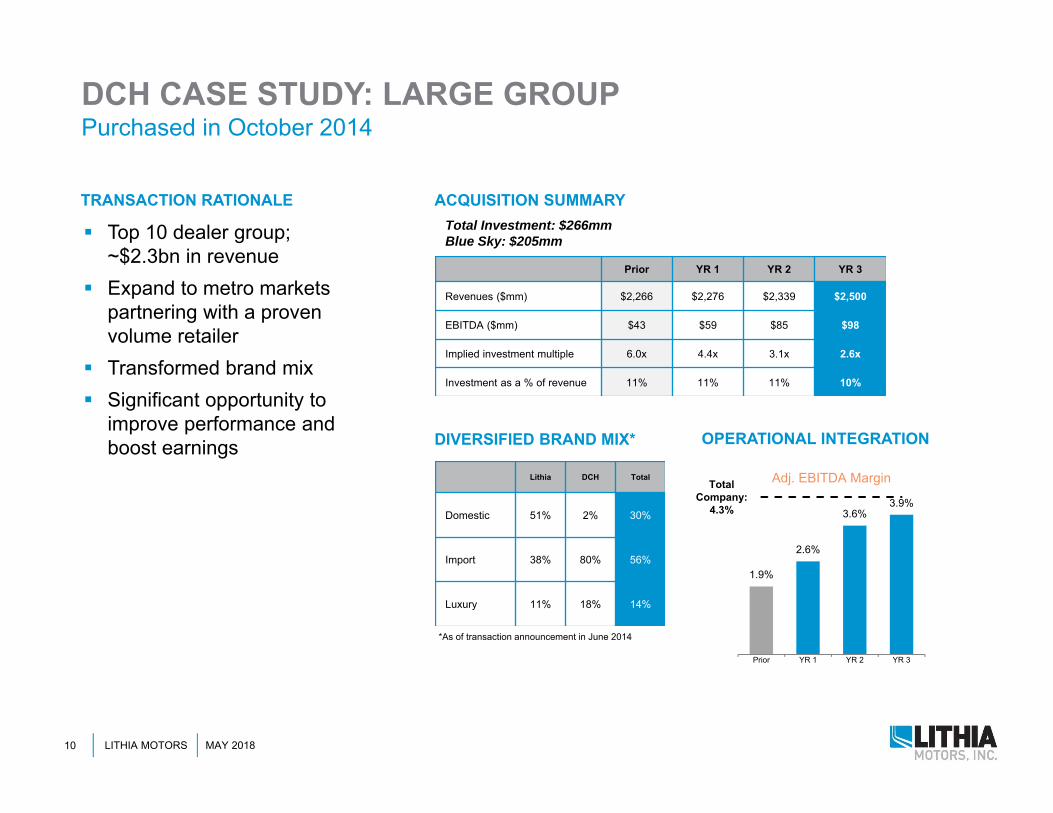
DCH CASE STUDY: LARGE GROUPPurchased in October 2014
*As of transaction announcement in June 2014
1.9%
2.6%
3.6%3.9%
Prior YR 1 YR 2 YR 3
Adj. EBITDA MarginTotal Company:
4.3%
Prior YR 1 YR 2 YR 3
Revenues ($mm) $2,266 $2,276 $2,339 $2,500
EBITDA ($mm) $43 $59 $85 $98
Implied investment multiple 6.0x 4.4x 3.1x 2.6x
Investment as a % of revenue 11% 11% 11% 10%
Lithia DCH Total
Domestic 51% 2% 30%
Import 38% 80% 56%
Luxury 11% 18% 14%
Total Investment: $266mmBlue Sky: $205mm Top 10 dealer group;
~$2.3bn in revenue Expand to metro markets
partnering with a proven volume retailer
Transformed brand mix Significant opportunity to
improve performance and boost earnings
TRANSACTION RATIONALE ACQUISITION SUMMARY
DIVERSIFIED BRAND MIX* OPERATIONAL INTEGRATION
LITHIA MOTORS MAY 201811
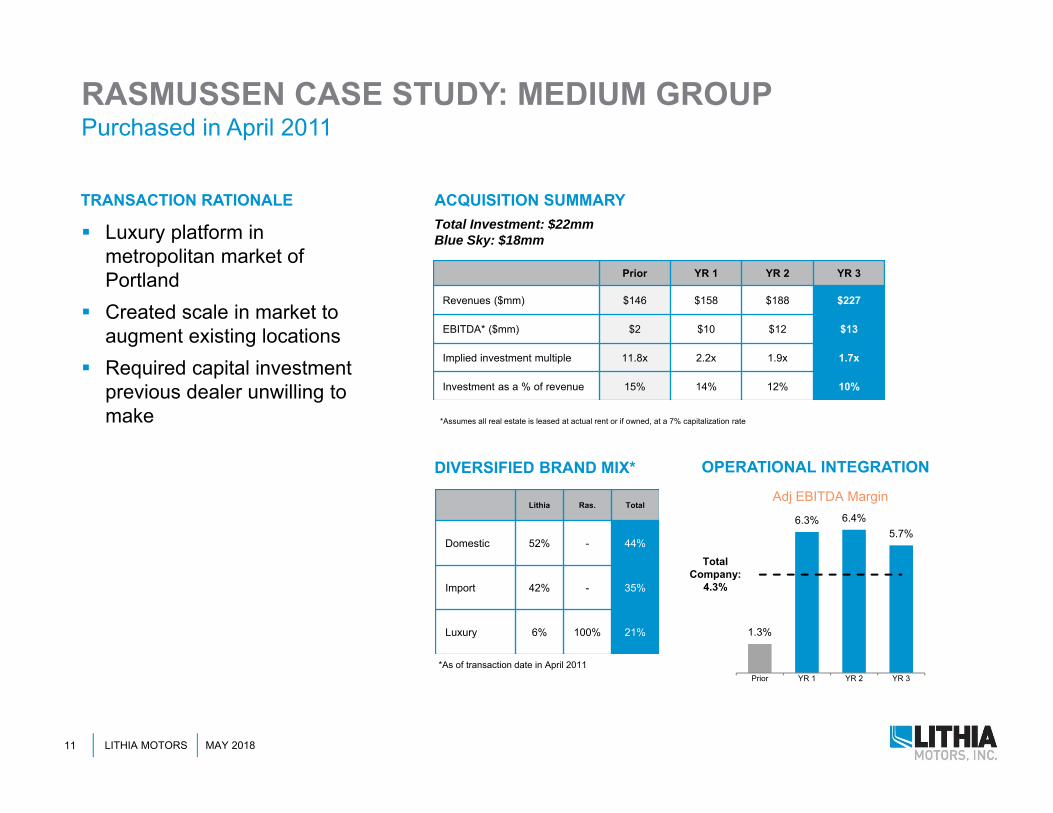
Luxury platform in metropolitan market of Portland
Created scale in market to augment existing locations
Required capital investment previous dealer unwilling to make
TRANSACTION RATIONALE ACQUISITION SUMMARY
DIVERSIFIED BRAND MIX* OPERATIONAL INTEGRATION
RASMUSSEN CASE STUDY: MEDIUM GROUPPurchased in April 2011
*Assumes all real estate is leased at actual rent or if owned, at a 7% capitalization rate
Prior YR 1 YR 2 YR 3
Revenues ($mm) $146 $158 $188 $227
EBITDA* ($mm) $2 $10 $12 $13
Implied investment multiple 11.8x 2.2x 1.9x 1.7x
Investment as a % of revenue 15% 14% 12% 10%
Total Investment: $22mmBlue Sky: $18mm
*As of transaction date in April 2011
Lithia Ras. Total
Domestic 52% - 44%
Import 42% - 35%
Luxury 6% 100% 21% 1.3%
6.3% 6.4%5.7%
Prior YR 1 YR 2 YR 3
Adj EBITDA Margin
Total Company:
4.3%

LITHIA MOTORS MAY 201812
Exclusive franchise: only Honda store on island of Maui
Remodeled store to improve operational efficiencies
Entered Hawaii; subsequently added four dealerships on Oahu
TRANSACTION RATIONALE ACQUISITION SUMMARY
SUBSEQUENT EXPANSION OPERATIONAL INTEGRATION
*Assumes all real estate is leased at actual rent or if owned, at a 7% capitalization rate
Prior YR 1 YR 2 YR 3
Revenues ($mm) $36 $34 $53 $65
EBITDA* ($mm) $0.3 $2 $4 $6
Implied investment multiple 16.4x 2.9x 1.3x 0.9x
Investment as a % of revenue 15% 16% 10% 8%
Total Investment: $5.5mmBlue Sky: $4.6mm
*Assumes full year revenues for Honolulu Ford acquired in 2016
$34$65
$145
2014 2016*
Hawaii Revenues
Island Honda All Other HI stores
0.9%
5.6%
8.0%9.0%
Prior YR 1 YR 2 YR 3
Adj. EBITDA Margin
Total Company:
4.3%
ISLAND HONDA: SINGLE STOREPurchased in January 2014

LITHIA MOTORS MAY 201813
PRODUCT LINE OVERVIEW

LITHIA MOTORS MAY 201814
NEW VEHICLE OVERVIEW
Average age of vehicles historically high at 11+ years Technology, safety and sustainability drive sales Target 12 to 36 months for acquisition improvement
SUMMARY
Recovery spikes above long-run average
5.0
10.0
15.0
20.0
1976 1981 1986 1991 1996 2001 2006 2011
HISTORICAL NEW VEHICLE SAAR TRENDS
HISTORICAL REVENUE PERFORMANCE ($MM)
$1,848
$5,764
2012 2017
CAGR: 25.5% Growth SSS%
2012 32.8% 30.0%
2013 22.1% 16.3%
2014 36.4% 11.4%
2015 47.9% 8.8%
2016 8.5% 3.3%
2017 21.0% 3.2%
71.9%
100.0% 100.0%
9.2%25.0%
Pre-acq Company Avg Target
Lithia Partners Group:122.8%
INCREMENTAL GROSS PROFIT AT TARGET: ~ $60MM
% Of Sales Above OEM Market Share
DRY POWDER OPPORTUNITYImprove to 25% Above OEM market share
Note: Analysis as of December 31, 2017

LITHIA MOTORS MAY 201815
USED VEHICLE OVERVIEW
USED MARKET SIZE
HISTORICAL REVENUE PERFORMANCE ($MM)
$833
$2,544
2012 2017
CAGR: 25.0% Growth SSS%
2012 22.8% 20.6%
2013 23.8% 18.4%
2014 32.0% 15.3%
2015 41.4% 13.1%
2016 15.6% 11.1%
2017 12.4% 2.3%
CarMax, 2%
Private Party, 29%
Franchised Dealers,
37%
14.4 15.4 16.4 17.4
40.5 42.038.8 39.4
2012 2013 2014 2015
Ret
ail U
nits
sol
d (m
m)
New Used
Source: WardsAuto Group “U.S. Market Used Vehicle Sales“ report
2.8x 2.7x 2.4x 2.3x
IndependentDealers,
32%
USED MARKET SHARE
~2.5x larger than new vehicle market at ~40mm annual unit sales Low correlation with new vehicle cycle; full spectrum offerings
including 10+ year old vehicles Target 12 to 36 months for acquisition improvement
SUMMARY
INCREMENTAL GROSS PROFIT AT TARGET: ~ $80MM
Lithia Partners Group: 97 units
Avg. Used Units per Store Each Month
38
67
85
Pre-acq Company Avg Target
DRY POWDER OPPORTUNITYImprove to 85 Units per Store Each Month
Note: Analysis as of December 31, 2017
LITHIA MOTORS MAY 201816
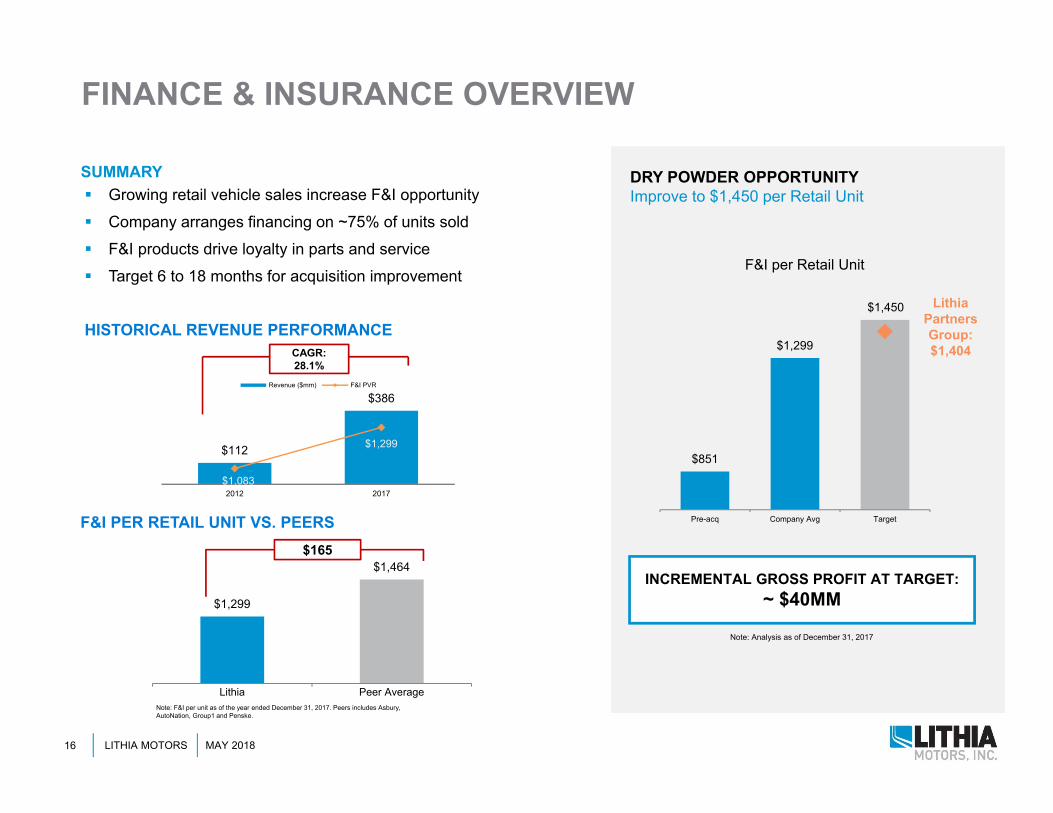
FINANCE & INSURANCE OVERVIEW
Growing retail vehicle sales increase F&I opportunity Company arranges financing on ~75% of units sold F&I products drive loyalty in parts and service Target 6 to 18 months for acquisition improvement
SUMMARY
HISTORICAL REVENUE PERFORMANCE
$112
$386
$1,083
$1,299
2012 2017
Revenue ($mm) F&I PVR
CAGR: 28.1%
F&I PER RETAIL UNIT VS. PEERS
$1,299
$1,464
Lithia Peer Average
$165
Note: F&I per unit as of the year ended December 31, 2017. Peers includes Asbury, AutoNation, Group1 and Penske.
INCREMENTAL GROSS PROFIT AT TARGET: ~ $40MM
Lithia Partners Group: $1,404
F&I per Retail Unit
$851
$1,299
$1,450
Pre-acq Company Avg Target
DRY POWDER OPPORTUNITYImprove to $1,450 per Retail Unit
Note: Analysis as of December 31, 2017

LITHIA MOTORS MAY 201817
PARTS & SERVICE OVERVIEW
~50% margin business; ~1/3 of Company’s gross profit Resilient earnings that are recession resistant Prior 10 years of vehicle sales populate customer base Target 3 to 7 years for acquisition improvement
SUMMARY
LITHIA MARKET UNITS-IN-OPERATION OPPORTUNITY
HISTORICAL REVENUE PERFORMANCE
$383
$1,016
48.4% 48.5%2013 2017
Revenue ($mm) Gross margin %
CAGR: 23.9%
Growth SSS%
2012 10.0% 6.3%
2013 11.1% 6.9%
2014 33.5% 11.3%
2015 44.3% 10.2%
2016 14.3% 8.6%
2017 20.3% 5.1%
74,668 74,908 75,895 78,61484,705
92,510
108,617
126,407
0.7%
4.5%6.3% 6.9%
11.3% 10.2%8.6%
5.1%
(10)%
(5)%
0%
5%
10%
50,000
70,000
90,000
110,000
130,000
2010 2011 2012 2013 2014 2015 2016 2017
10-year Avg UIO SB&P Y-o-Y SS Sales Growth
INCREMENTAL GROSS PROFIT AT TARGET: ~ $60MM
14.1%
25.0%
Company Avg Target
Lithia Partners Group:20.2%
% Service Retention Above OEM Average
DRY POWDER OPPORTUNITYImprove to 25% Above OEM Average Retention
Note: Analysis as of December 31, 2017

LITHIA MOTORS MAY 201818
SCALABLE SG&A AND OPERATING MODEL
Target SG&A as a % of gross profit in the low to mid 60% range Total gross profit per retail unit consistent the last three years Target 1 to 5 years for acquisition improvement
SUMMARY
TOTAL GROSS PROFIT PER RETAIL UNIT
HISTORICAL OPERATING PERFORMANCE
2015 2016 2017
New $2,039 $1,985 $2,033
Used 2,434 2,323 2,208
F&I 1,196 1,276 1,299
Total* $3,420 $3,426 $3,425
* Total includes gross profit for new retail, used retail, used wholesales, and F&I
2015 2016 2017
Adj. SG&A as a % of GP 67.9% 68.9% 68.8%
Adj. EBITDA margin % 4.6% 4.3% 4.3%
Adj. pre-tax margin % 3.8% 3.6% 3.4%
Adj. net margin % 2.4% 2.2% 2.1%
INCREMENTAL GROSS PROFIT AT TARGET: ~ $100MM
89.4%
68.7%
62.0%
Pre-acq Company Avg Target
Lithia Partners Group:57. 7%
SG&A as a % Of Gross Profit
DRY POWDER OPPORTUNITYReduce SG&A as a % of Gross Profit to 62%
Note: Analysis as of December 31, 2017

LITHIA MOTORS MAY 201819
DRY POWDER OPPORTUNITY
($mm) Current Performance
Synergistic Benefit Total
New Vehicle: increase OEM market share $60 - $60
Used Vehicle: increase # of used vehicles retailed 80 50 130
F&I: increase PVR 40 130 170
Parts & Service: increase retention rate 60 20 80
Incremental gross profit opportunity $240 $200 $440
Estimated EBITDA1 $70 $50 $120
Leverage: reduce SG&A as a % of gross 100 - 100
Additional floor plan interest expense (6) (4) (10)
Incremental EBITDA opportunity $164 $46 $210
SUMMARY OF INCREMENTAL PROFIT OPPORTUNITY
Current performance improvements create additional business line synergies: Increased trade-ins
drive incremental used vehicle sales
Increased retail vehicle sales generate additional F&I income
Increased units in operation grow downstream service business
Potential EBITDA opportunity of ~$210mm
COMMENTARY
Note: Values based on analysis performed as of December 2017
LITHIA MOTORS MAY 201820
FINANCIAL DISCIPLINE & OUR CAPITAL ENGINE
LITHIA MOTORS MAY 201821
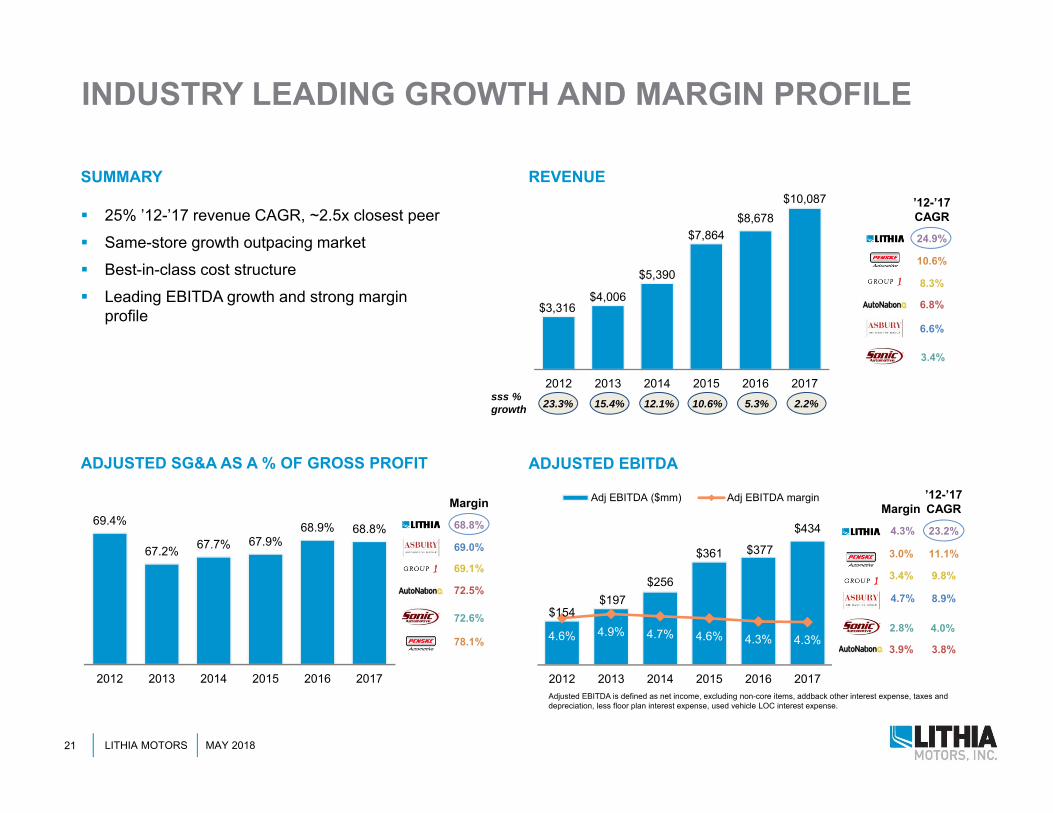
$154 $197
$256
$361 $377
$434
4.6% 4.9% 4.7% 4.6% 4.3% 4.3%
2012 2013 2014 2015 2016 2017
Adj EBITDA ($mm) Adj EBITDA margin
INDUSTRY LEADING GROWTH AND MARGIN PROFILE
25% ’12-’17 revenue CAGR, ~2.5x closest peer Same-store growth outpacing market Best-in-class cost structure Leading EBITDA growth and strong margin
profile
SUMMARY
$3,316 $4,006
$5,390
$7,864 $8,678
$10,087
2012 2013 2014 2015 2016 2017
’12-’17CAGR
6.6%
6.8%
8.3%
24.9%
10.6%
3.4%
15.4%sss %growth 12.1% 10.6% 5.3% 2.2%
REVENUE
69.4%
67.2% 67.7% 67.9%68.9% 68.8%
2012 2013 2014 2015 2016 2017
Margin
69.0%
72.5%
69.1%
68.8%
78.1%
ADJUSTED SG&A AS A % OF GROSS PROFIT ADJUSTED EBITDA
4.3%
4.7%
’12-’17CAGR
23.2%
3.8%
9.8%
8.9%
11.1%
Margin
3.9%
3.4%
3.0%
Adjusted EBITDA is defined as net income, excluding non-core items, addback other interest expense, taxes and depreciation, less floor plan interest expense, used vehicle LOC interest expense.
23.3%
72.6%2.8% 4.0%

LITHIA MOTORS MAY 201822
ROBUST FCF GENERATION AND LOW LEVERAGE
Strong free cash flow generation
Proven ability to delever Low leverage vs. peers Disciplined and
transparent capital allocation policies Organic growth
opportunities Strategic M&A Dividends Opportunistic buy-
backs
SUMMARY
2.3%
3.9%
1.5%
3.3%
1.9%
0.4%
2017Leveraged
EBITDA margin
1.4x
0.9x
2.0x
1.3x 1.5x
2.0x
2012 2013 2014 2015 2016 2017
3.2x
2.9x
3.6x
2.0x
3.4x
3.7x
Debt / Adj EBITDA
$147 $147 $170
$278 $277
$329
74.6% 74.6% 66.4% 76.9% 74.6% 75.7%
2013 2013 2014 2015 2016 2017
Leveraged EBITDA (US$mm) Conversion %
Note: Leveraged EBITDA conversion defined as EBITDA less capex / EBITDA; Total debt exclude floor plan and used vehicle LOC.
LEVERAGED EBITDA (EBITDA – CAPEX)
TOTAL DEBT TO EBITDA

LITHIA MOTORS MAY 201823
PRUDENT STEWARDS OF CAPITAL
CAPITAL EXPENDITURES FREE CASH FLOW AND ACQUISITIONS
DIVIDENDS PAID SHARE REPURCHASES
$130$87
$164$186
$159
$33
$320
$31
$118
$215
2013 2014 2015 2016 2017
Free Cash Flow** Acquisition Equity Value
$MM 2014 2015 2016 2017
Post-Acq. Improv. $21 $33 $31 $36
Facilities for Open Points 7 3 - 1
Lease Buy-outs 25 10 24 -
Existing Facility Improv. 20 20 24 34
Maintenance 13 17 26 34
Total $86 $83 $100 $105Note: FCF defined as earnings before interest, taxes, depreciation and amortization (EBITDA) add back stock compensation less cash paid for taxes, interest, dividends and capital expenditures.
$13 $16 $20 $24 $27
$0.49*$0.61
$0.76
$0.95 $1.06
$0.00
$0.20
$0.40
$0.60
$0.80
$1.00
$1.20
2013 2014 2015 2016 2017 $-
$5.0
$10.0
$15.0
$20.0
$25.0
$30.0
$35.0
$ pe
r Sha
re
$MM
Dividends Paid Dividend per Share
$5 $16 $32 $113 $34
$40.76
$70.52
$102.84
$80.24$93.38
$0.00
$25.00
$50.00
$75.00
$100.00
$125.00
2013 2014 2015 2016 2017 $-
$25.0
$50.0
$75.0
$100.0
$125.0
$150.0
$ pe
r Sha
re
$MM
Share Repurchases Price per Share
# of Shares *Q4’12 dividend was accelerated and paid in December 2012 rather in 2013. Data has been normalized to include the $0.10 dividend in 2013
127,900 226,729 306,386 1,407,674 361,457
LITHIA MOTORS MAY 201824
Q1’18 UPDATE
LITHIA MOTORS MAY 201825
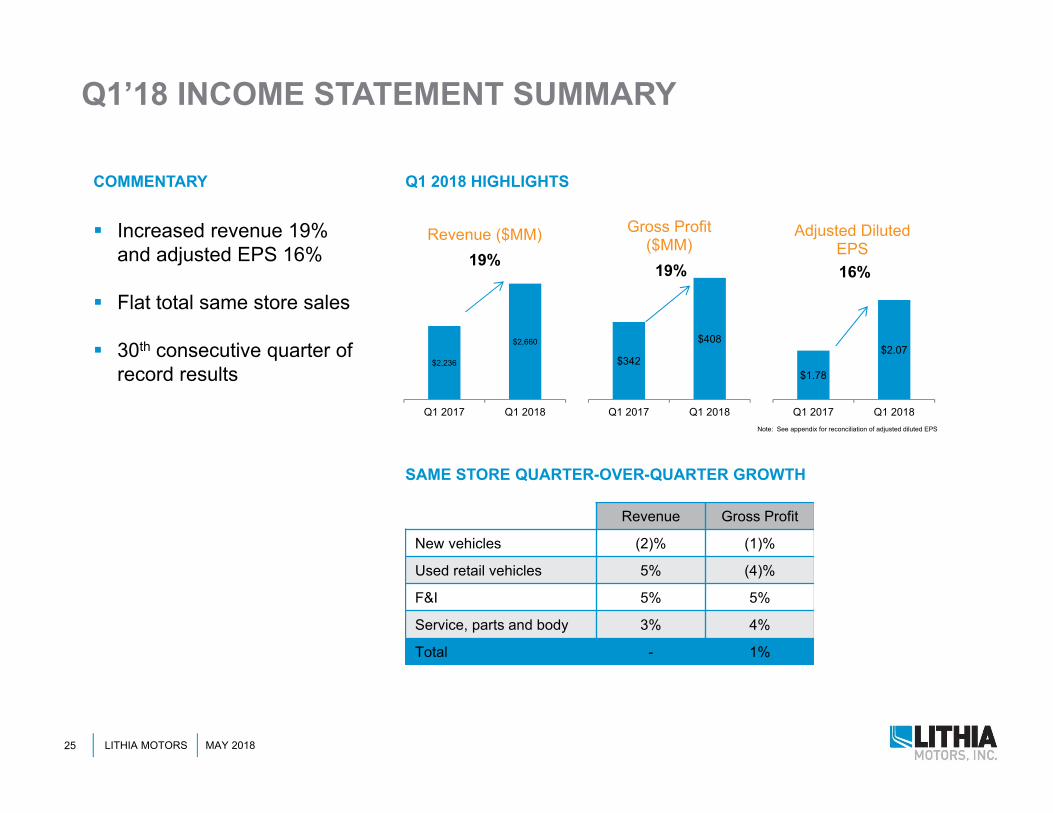
Q1’18 INCOME STATEMENT SUMMARY
$2,236
$2,660
Q1 2017 Q1 2018
Revenue ($MM)
$1.78
$2.07
Q1 2017 Q1 2018
Adjusted Diluted EPS
$342
$408
Q1 2017 Q1 2018
Gross Profit ($MM)
19% 16%19%
Note: See appendix for reconciliation of adjusted diluted EPS
Revenue Gross Profit
New vehicles (2)% (1)%
Used retail vehicles 5% (4)%
F&I 5% 5%
Service, parts and body 3% 4%
Total - 1%
Q1 2018 HIGHLIGHTS
SAME STORE QUARTER-OVER-QUARTER GROWTH
Increased revenue 19% and adjusted EPS 16%
Flat total same store sales
30th consecutive quarter of record results
COMMENTARY

LITHIA MOTORS MAY 201826
Q1’18 PEER COMPARISON
SAME STORE GROSS PROFIT GROWTH ADJUSTED NET PROFIT MARGIN
SAME STORE SALES GROWTH ADJUSTED SG&A AS A % OF GROSS PROFIT
6.0%
3.2% 2.9%
1.4%0.5%
-0.5%Penske AutoNation Group1 Lithia Asbury Sonic
2.5%
2.0% 1.9% 1.8%
1.3%
0.5%
Asbury Lithia Penske AutoNation Group1 SonicNote: See appendix for reconciliation of adjusted net profit margin.
LAD ABG AN SAH GPI PAG
New Vehicles (1.6)% 0.7% 1.4% 2.1% 4.9% 6.7%
Used Vehicles 4.6% 3.6% 7.5% 2.6% 6.1% 11.4%
F&I 5.1% 2.4% 9.6% 4.7% 10.3% 10.4%
SB&P 2.8% 2.7% 2.2% 0.8% 3.4% 8.0%
Total (0.2)% 1.9% 3.2% 3.1% 4.2% 7.6%
69.6% 71.1%72.6%
76.8%
75.6%
83.1%
69.4%
72.9%74.4%
76.7% 77.3%
82.4%
Asbury Lithia AutoNation Penske Group1 Sonic
Q1 2017 Q1 2018
Note: See appendix for reconciliation of adjusted SG&A.
bps reduction(increase)
(180) (180)20 (170) 7010
Note: Group1 results reflect US only performance

LITHIA MOTORS MAY 201827
EARNINGS OUTLOOK
$5,390
$7,864 $8,678
$10,087
$12,250
2014 2015 2016 2017 2018E
REVENUE TARGET
$5.11
$7.02 $7.42$8.39
$10.60
2014 2015 2016 2017 2018E
EPS TARGET
Note: See appendix for reconciliation of adjusted diluted EPS
Full year revenues of $12.0 billion to $12.5 billion
Earnings per share of $10.60
Targeting double-digit top and bottom line growth
2018 TARGETS
34.6%% y-o-ygrowth 45.9% 10.3% 16.2% 21.4%
28.1%% y-o-ygrowth 37.4% 5.7% 13.1% 26.3%
LITHIA MOTORS MAY 201828
APPENDIX
LITHIA MOTORS MAY 201829
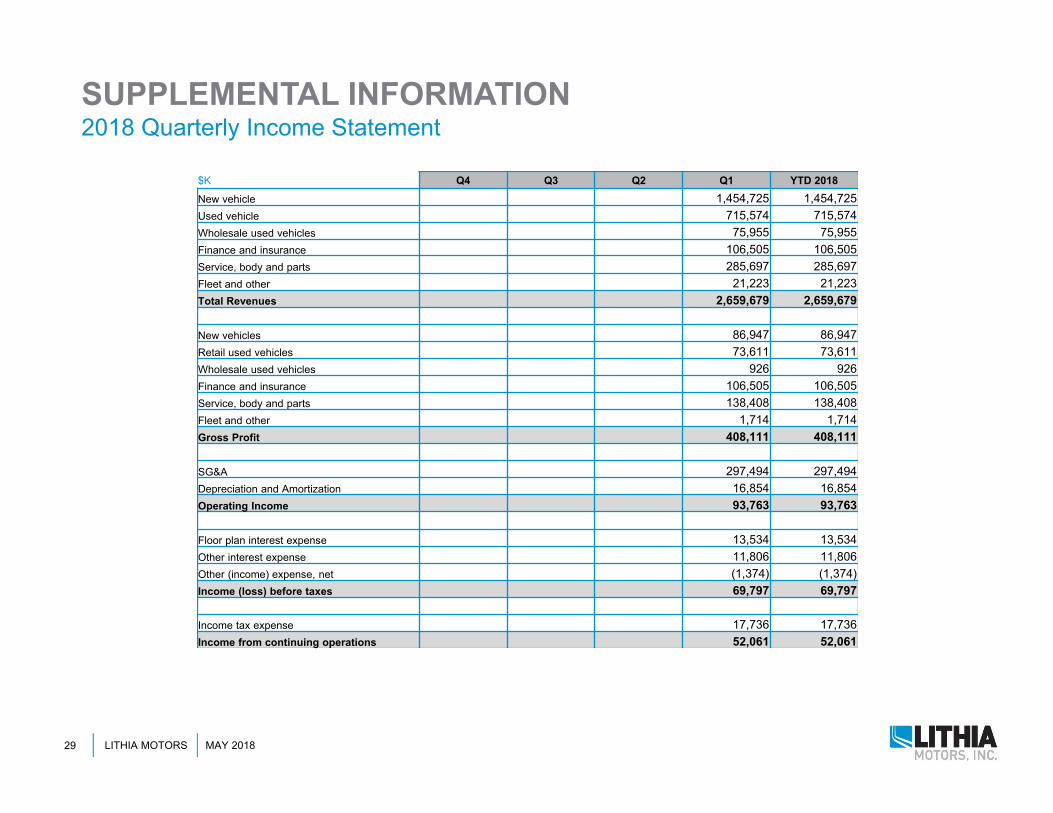
SUPPLEMENTAL INFORMATION2018 Quarterly Income Statement
$K Q4 Q3 Q2 Q1 YTD 2018New vehicle 1,454,725 1,454,725Used vehicle 715,574 715,574Wholesale used vehicles 75,955 75,955Finance and insurance 106,505 106,505Service, body and parts 285,697 285,697Fleet and other 21,223 21,223Total Revenues 2,659,679 2,659,679
New vehicles 86,947 86,947Retail used vehicles 73,611 73,611Wholesale used vehicles 926 926Finance and insurance 106,505 106,505Service, body and parts 138,408 138,408Fleet and other 1,714 1,714Gross Profit 408,111 408,111
SG&A 297,494 297,494Depreciation and Amortization 16,854 16,854Operating Income 93,763 93,763
Floor plan interest expense 13,534 13,534Other interest expense 11,806 11,806Other (income) expense, net (1,374) (1,374)Income (loss) before taxes 69,797 69,797
Income tax expense 17,736 17,736Income from continuing operations 52,061 52,061

LITHIA MOTORS MAY 201830
SUPPLEMENTAL INFORMATION2017 Adjusted Income Statement Details
YTD 12/31/2017
OEM settlements
Gain on sale of store Reserve adjustments Acquisition expenses Tax act YTD
12/31/2017
$K, except for per share amounts As Reported Q1 Q4 Q2 Q3 Q2 Q3 Q4 Adjusted
Selling, general and administrative $1,049,378 - 5,104 (3,878) (1,704) (2,137) (3,516) - $1,043,247
Income from operations 408,986 - (5,104) 3,878 1,704 2,137 3,516 - 415,117
Other income (expense), net 12,195 (9,111) - - - - - - 3,084
Income from continuing operationsbefore income taxes $347,069 (9,111) (5,104) 3,878 1,704 2,137 3,516 - $344,089
Income taxes (101,852) 3,423 2,482 (1,231) (943) (821) (1,381) (32,901) (133,224)
Net income from continuing operations $245,217 (5,688) (2,622) 2,647 761 1,316 2,135 (32,901) $210,865
Diluted earnings per share fromcontinuing operations $9.75 (0.23) (0.10) 0.11 0.03 0.05 0.09 (1.31) $8.39
Diluted share count 25,145

LITHIA MOTORS MAY 201831
SUPPLEMENTAL INFORMATION2016 Adjusted Income Statement Details
YTD 12/31/2016
Gain on sale of stores Equity investment fair valuation adjustment Legal reserve adjustment Tax attribute YTD
12/31/2016
$K, except for per share amounts As Reported Q1 Q1 Q2 Q3 Q4 Q1 Q4 Q4 Adjusted
Asset impairments $13,992 - (3,498) (3,498) (3,498) (3,498) - - - -
Selling, general and administrative 899,590 1,087 - - - - (1,906) (2,030) - 896,741
Income from operations 338,364 (1,087) 3,498 3,498 3,498 3,498 1,906 2,030 - 355,205
Other income (6,103) - 2,066 2,065 2,066 2,065 - - - 2,159
Income from continuing operationsbefore income taxes $283,523 (1,087) 5,564 5,563 5,564 5,563 1,906 2,030 - $308,626
Income taxes (86,465) 426 (5,945) (6,837) (7,592) (8,156) (747) (2,503) (1,320) (119,139)
Net income from continuing operations $197,058 (661) (381) (1,274) (2,028) (2,593) 1,159 (473) (1,320) $189,487
Diluted earnings per share fromcontinuing operations $7.72 (0.03) (0.01) (0.05) (0.08) (0.11) 0.05 (0.02) (0.05) $7.42
Diluted share count 25,521

LITHIA MOTORS MAY 201832
SUPPLEMENTAL INFORMATION2015 Adjusted Income Statement Details
YTD 12/31/2015 Gain on sale of stores Asset impairment
Transition Agreement Equity Investment
YTD 12/31/2015
$K, except for per share amounts As Reported Q1 Q2 Q2 Q4 Q3 Q1 Q2 Q3 Q4 Adjusted
Asset impairments $20,124 — — (2,000) (1,603) — (4,130) (4,130) (4,131) (4,130) —
Selling, general and administrative 811,175 3,349 2,570 — — (18,296) — — — — 798,798
Income from operations 302,735 (3,349) (2,570) 2,000 1,603 18,296 4,130 4,130 4,131 4,130 335,236
Other income (1,006) — — — — — 1,732 1,733 1,732 $1,733 5,924
Income from continuing operations before income taxes $262,704 (3,349) (2,570) 2,000 1,603 18,296 5,862 5,863 5,863 5,863 $302,135
Income taxes (79,705) 1,004 1,305 (780) (605) (6,507) (7,250) (7,652) (7,414) (8,516) (116,120)
Net income from continuing operations $182,999 (2,345) (1,265) 1,220 998 11,789 (1,388) (1,789) (1,551) (2,653) $186,015
Diluted earnings per share from continuing operations $6.91 (0.09) (0.05) 0.05 0.03 0.45 (0.05) (0.07) (0.06) (0.10) $7.02
Diluted share count 26,490
LITHIA MOTORS MAY 201833
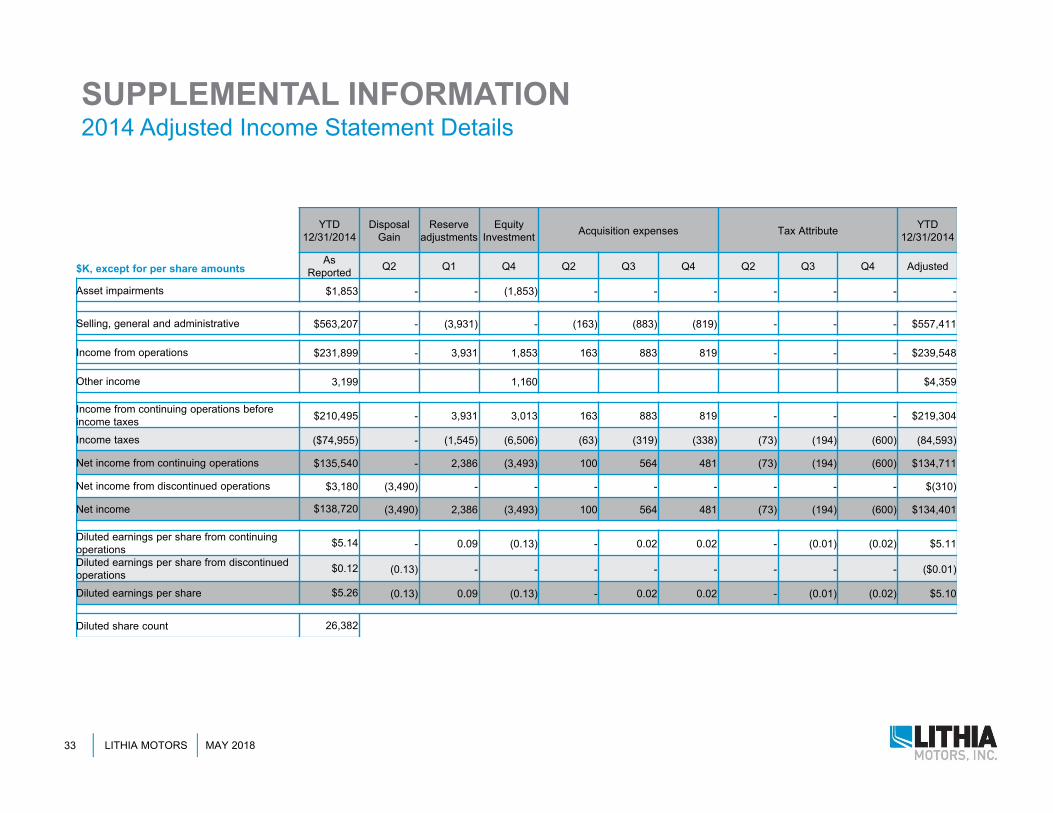
SUPPLEMENTAL INFORMATION2014 Adjusted Income Statement Details
YTD 12/31/2014
Disposal Gain
Reserve adjustments
Equity Investment Acquisition expenses Tax Attribute YTD
12/31/2014
$K, except for per share amountsAs
Reported Q2 Q1 Q4 Q2 Q3 Q4 Q2 Q3 Q4 Adjusted
Asset impairments $1,853 - - (1,853) - - - - - - -
Selling, general and administrative $563,207 - (3,931) - (163) (883) (819) - - - $557,411
Income from operations $231,899 - 3,931 1,853 163 883 819 - - - $239,548
Other income 3,199 1,160 $4,359
Income from continuing operations before income taxes $210,495 - 3,931 3,013 163 883 819 - - - $219,304
Income taxes ($74,955) - (1,545) (6,506) (63) (319) (338) (73) (194) (600) (84,593)
Net income from continuing operations $135,540 - 2,386 (3,493) 100 564 481 (73) (194) (600) $134,711
Net income from discontinued operations $3,180 (3,490) - - - - - - - - $(310)
Net income $138,720 (3,490) 2,386 (3,493) 100 564 481 (73) (194) (600) $134,401
Diluted earnings per share from continuing operations $5.14 - 0.09 (0.13) - 0.02 0.02 - (0.01) (0.02) $5.11
Diluted earnings per share from discontinued operations $0.12 (0.13) - - - - - - - - ($0.01)
Diluted earnings per share $5.26 (0.13) 0.09 (0.13) - 0.02 0.02 - (0.01) (0.02) $5.10
Diluted share count 26,382
LITHIA MOTORS MAY 201834
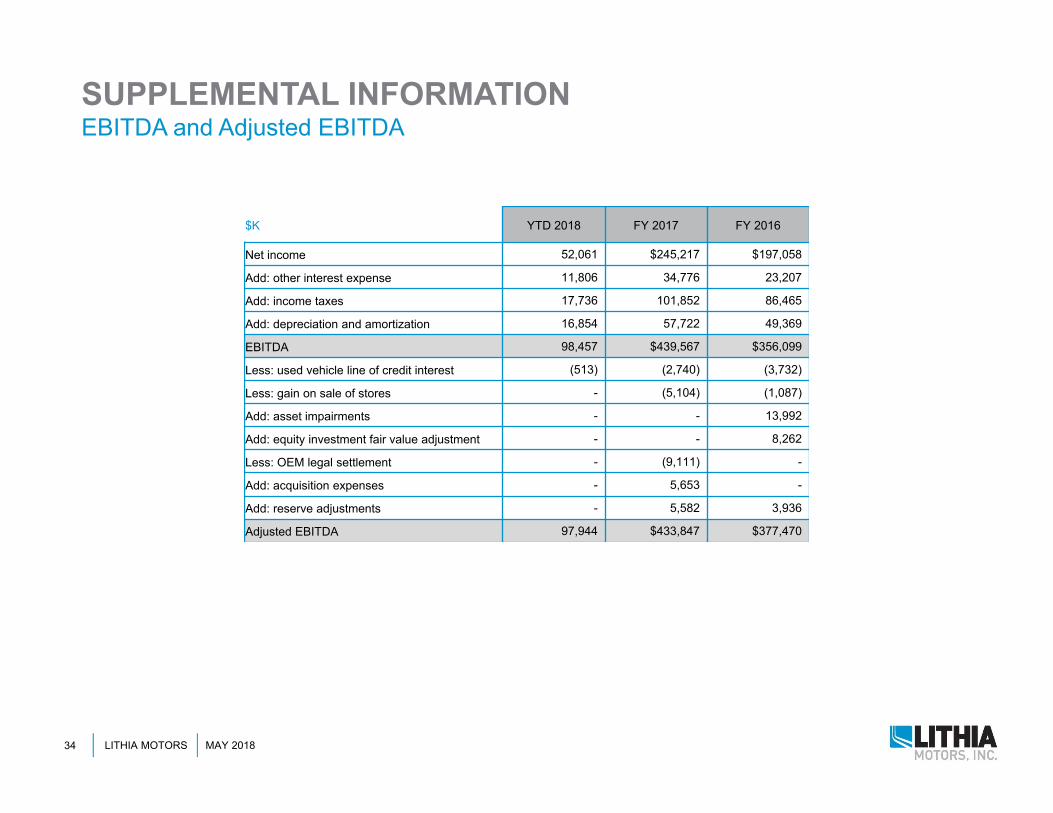
SUPPLEMENTAL INFORMATIONEBITDA and Adjusted EBITDA
$K YTD 2018 FY 2017 FY 2016
Net income 52,061 $245,217 $197,058
Add: other interest expense 11,806 34,776 23,207
Add: income taxes 17,736 101,852 86,465
Add: depreciation and amortization 16,854 57,722 49,369
EBITDA 98,457 $439,567 $356,099
Less: used vehicle line of credit interest (513) (2,740) (3,732)
Less: gain on sale of stores - (5,104) (1,087)
Add: asset impairments - - 13,992
Add: equity investment fair value adjustment - - 8,262
Less: OEM legal settlement - (9,111) -
Add: acquisition expenses - 5,653 -
Add: reserve adjustments - 5,582 3,936
Adjusted EBITDA 97,944 $433,847 $377,470