resourceinsight.com · 2018-06-13 · ji exhibit 2 state of indiana before the indiana utility...
TRANSCRIPT

JI Exhibit 2
STATE OF INDIANA
BEFORE THE INDIANA UTILITY REGULATORY COMMISSION
PETITION OF INDIANAPOLIS POWER & LIGHTCOMPANY (“IPL”) FOR (1) AUTHORITY TO INCREASERATES AND CHARGES FOR ELECTRIC UTILITYSERVICE, (2) APPROVAL OF REVISED DEPRECIATIONRATES, ACCOUNTING RELIEF, INCLUDING UPDATEOF THE MAJOR STORM DAMAGE RESTORATIONRESERVE ACCOUNT, APPROVAL OF A VEGETATIONMANAGEMENT RESERVE ACCOUNT, INCLUSION INBASIC RATES AND CHARGES OF THE COSTS OFCERTAIN PREVIOUSLY APPROVED PROJECTS,INCLUDING THE EAGLE VALLEY COMBINED CYCLEGAS TURBINE, THE NATIONAL POLLUTIONDISCHARGE ELIMINATION SYSTEM AND COALCOMBUSTION RESIDUALS COMPLIANCE PROJECTS,RATE ADJUSTMENT MECHANISM PROPOSALS, COSTDEFERRALS, AMORTIZATIONS, AND (3) APPROVALOF NEW SCHEDULES OF RATES, RULES ANDREGULATIONS FOR SERVICE.
) ) ) ) ) ) ) ) ) ) ) ) ) ) ) ) ) )
CAUSE NO. 45029
DIRECT TESTIMONY OF
JONATHAN WALLACH
ON BEHALF OF
CITIZENS ACTION COALITION OF INDIANA, INC., INDIANA COALITION FOR
HUMAN SERVICES, INDIANA COMMUNITY ACTION ASSOCIATION, AND SIERRA
CLUB
Resource Insight, Inc.
MAY 24, 2018

JI Exhibit 2
Direct Testimony of Jonathan Wallach Cause No. 45029 May 24, 2018 Page i
TABLE OF CONTENTS
I. Introduction and Summary .................................................................................... 1
II. IPL’s Proposal to Increase the Residential Fixed Customer Charge and
Volumetric Energy Rates ....................................................................................... 6
III. IPL’s Proposal for the Residential Fixed Customer Charge Violates
Principles of Cost-Based Rate Design ................................................................. 12
IV. Customer Impacts from IPL’s Proposal for the Residential Fixed Customer
Charge .................................................................................................................. 23
V. IPL’s Proposal for Declining-Block Energy Rates Would Further Dampen
Energy Price Signals ............................................................................................ 30
VI. Conclusions and Recommendations .................................................................... 35

JI Exhibit 2
Direct Testimony of Jonathan Wallach Cause No. 45029 May 24, 2018 Page 1
I. Introduction and Summary 1
Q: Please state your name, occupation, and business address. 2
A: My name is Jonathan F. Wallach. I am Vice President of Resource Insight, 3
Inc., 5 Water Street, Arlington, Massachusetts. 4
Q: Please summarize your professional experience. 5
A: I have worked as a consultant to the electric power industry since 1981. From 6
1981 to 1986, I was a Research Associate at Energy Systems Research 7
Group. In 1987 and 1988, I was an independent consultant. From 1989 to 8
1990, I was a Senior Analyst at Komanoff Energy Associates. I have been in 9
my current position at Resource Insight since 1990. 10
Over the past four decades, I have advised and testified on behalf of 11
clients on a wide range of economic, planning, and policy issues relating to 12
the regulation of electric utilities, including: electric-utility restructuring; 13
wholesale-power market design and operations; transmission pricing and 14
policy; market-price forecasting; market valuation of generating assets and 15
purchase contracts; power-procurement strategies; risk assessment and 16
mitigation; integrated resource planning; mergers and acquisitions; cost 17
allocation and rate design; and energy-efficiency program design and 18
planning. 19
My resume is attached as Attachment JFW-1. 20
Q: Have you testified previously in utility proceedings? 21
A: Yes. I have sponsored expert testimony in 90 state, provincial, and federal 22
proceedings in the U.S. and Canada, including before the Indiana Utility 23

JI Exhibit 2
Direct Testimony of Jonathan Wallach Cause No. 45029 May 24, 2018 Page 2
Regulatory Commission (“the Commission”) in Cause No. 44967. I include a 1
detailed list of my previous testimony in Attachment JFW-1. 2
Q: On whose behalf are you testifying? 3
A: I am testifying on behalf of the Citizens Action Coalition of Indiana, Inc., 4
(“CAC”), Indiana Coalition for Human Services (“ICHS”), Indiana 5
Community Action Association (“INCAA”), and Sierra Club (collectively, 6
“Joint Intervenors” or “JI”). 7
Q: Are you sponsoring any attachments? 8
A: Yes. I am sponsoring the following attachments: 9
Attachment JFW-1: Resume of Jonathan Wallach, Resource Insight, Inc. 10
Attachment JFW-2: Bill Impacts from Joint Intervenor’s Recommended 11 Customer Charge 12
Attachment JFW-3: Citations to Marginal-Price Elasticity Studies 13
Attachment JFW-4: IPL response to CAC Data Request 2-3 14
Attachment JFW-5: National Association of Regulatory Utility 15 Commissioners, Distributed Energy Resources Rate Design and 16 Compensation, 118 (November 2016) 17
Attachment JFW-6: James C. Bonbright, Principles of Public Utility 18 Rates. Columbia University Press, 334 (1961) 19
Attachment JFW-7: Alfred E. Kahn, The Economics of Regulation, The 20 MIT Press, 85 (1988) 21
Attachment JFW-8: Paul J. Garfield and Wallace F. Lovejoy, Public 22 Utility Economics, Prentice-Hall, Inc., 155-156 (1964) 23
Attachment JFW-9: IPL response to CAC Data Request 2-8 24
Attachment JFW-10: IURC Cause No. 44945, Petitioner’s Exhibit 2S, 25 Attachment ZE-1S 26
Attachment JFW-11: IPL 2016 Integrated Resource Plant, Attachment 27 4.3, Table 2-2 28
Attachment JFW-12: IPL response to CAC Data Request 2-2 29

JI Exhibit 2
Direct Testimony of Jonathan Wallach Cause No. 45029 May 24, 2018 Page 3
Q: What is the purpose of your testimony? 1
A: On December 21, 2017, Indianapolis Power and Light Company (“IPL” or 2
“the Company”) filed a petition (including supporting direct testimony) with 3
the Commission for authority to increase electric rates. On February 16, 4
2018, the Company filed supplemental and revised supporting direct 5
testimony to reflect the Tax Cuts and Jobs Act. My testimony responds to 6
revised direct testimony by IPL witness J. Stephen Gaske regarding the 7
Company’s proposed design of residential rates and regarding the Company’s 8
allocated cost of service study (“ACOSS”), which served as the basis for the 9
Company’s proposed rate designs. Specifically, my testimony addresses IPL’s 10
proposals to increase the monthly customer charge for residential customers 11
and to maintain a declining-block rate structure for residential energy rates.1 12
My response to Mr. Gaske relies on data and documents provided through 13
discovery. I also rely on information provided in settlement testimony by IPL 14
witness Zac Elliot in Cause No. 44945 and in the Company’s 2016 Integrated 15
Resource Plan. 16
Q: Does your testimony address the allocation of costs among the various 17
customer classes based on the Company’s ACOSS? 18
A: No. My testimony does not assess whether the allocation methods used in the 19
Company’s ACOSS produce a reasonable allocation of costs to customer 20
classes. Instead, my testimony addresses the Company’s proposal to rely on 21
1 By “residential”, I mean customers taking service under Rates RS (non-space-heating,
non-water-heating service), RH, (space-heating service), and RC (water-heating service). I do
not address the Company’s proposals regarding the customer charge and energy rates for load-
controlled residential customers taking service under Rate CR/CW.

JI Exhibit 2
Direct Testimony of Jonathan Wallach Cause No. 45029 May 24, 2018 Page 4
the allocation results from the ACOSS for rate design purposes, specifically 1
for the purposes of setting the level of the residential customer charge. 2
Q: Please summarize your findings and recommendations with regard to 3
IPL’s proposal to increase the residential customer charge. 4
A: The Company’s proposal runs contrary to long-standing principles for 5
designing cost-based rates since it would inappropriately shift recovery of 6
demand-related costs from the volumetric energy rate to the fixed customer 7
charge. As explained in more detail below, the Company’s proposal to 8
recover demand-related costs through the residential customer charge would: 9
Lead to subsidization of high-usage residential customers’ costs by low-10
usage customers, and thereby inequitably increase bills for the 11
Company’s low-usage residential customers. 12
Dampen price signals to consumers for controlling their bills through 13
conservation or investments in energy efficiency or distributed 14
renewable generation. 15
Consequently, the Commission should reject the Company’s proposal to 16
increase the residential monthly customer charge. 17
Instead, I recommend that the residential customer charge be set at 18
$8.15 per residential customer per month. Consistent with long-standing 19
cost-causation and rate-design principles, a monthly customer charge of 20
$8.15 per customer would provide for the recovery of the cost of meters, 21
service drops, and customer services required to connect a residential 22
customer. 23

JI Exhibit 2
Direct Testimony of Jonathan Wallach Cause No. 45029 May 24, 2018 Page 5
Q: Please summarize your findings and recommendations with regard to 1
the design of volumetric energy rates. 2
A: The Company lacks a reasonable basis for its proposal to maintain the 3
existing declining-block rate structure. The Company’s proposal to recover 4
demand-related costs at a higher rate in the first energy block than in the 5
second or third blocks would further dampen energy price signals and 6
promote inefficient customer behavior. In the interests of gradualism, I 7
recommend that the declining-block structure be phased out over this and the 8
next few rate cases. 9
Q: How is the rest of your testimony organized? 10
A: In Section II, I describe the Company’s proposals for increasing the 11
residential fixed customer charge and volumetric energy rates and explain 12
how IPL relies on the results of its ACOSS to derive its proposed rate design. 13
In Section III, I discuss how the Company’s proposal violates long-standing 14
principles of cost-based rate design. In addition, I describe in Section III my 15
derivation of a cost-based fixed customer charge for residential customers. In 16
Section IV, I discuss how the Company’s proposal for the residential fixed 17
customer charge would give rise to unreasonable cost subsidization within 18
the residential class, and would dampen energy price signals. In Section V, I 19
discuss why it would be reasonable to phase out the current declining-block 20
structure for residential volumetric energy rates. Finally, Section VI 21
summarizes my conclusions and recommendations. 22

JI Exhibit 2
Direct Testimony of Jonathan Wallach Cause No. 45029 May 24, 2018 Page 6
II. IPL’s Proposal to Increase the Residential Fixed Customer Charge and 1
Volumetric Energy Rates 2
Q: Please summarize the Company’s proposals with respect to the fixed 3
customer charge and volumetric energy rates for residential customers. 4
A: The Company proposes to increase both the fixed customer charge and the 5
volumetric block energy rates in order to recover its proposed allocation of 6
test-year revenue requirements to the residential class. Table 1 shows the 7
current fixed customer charge and volumetric energy rates for residential 8
customers and IPL’s proposals for increasing the residential fixed customer 9
charge and volumetric energy rates.2 10
Table 1: IPL Proposed Residential Rate Increase 11
Current IPL
Proposed Rate
Increase % Increase
Customer Charge ($/Bill)
Up to 325 kWh 11.25 16.00 4.75 42.2%
Over 325 kWh 17.00 27.00 10.00 58.8%
Average 15.91 24.91 9.00 56.6%
Energy Rate (¢/kWh)
First 500 kWh 10.389 10.532 0.143 1.4%
Over 500 kWh 8.296 8.439 0.143 1.7%
Over 1000 kWh (RH/RC) 7.036 7.178 0.143 2.0%
Average 9.045 9.188 0.143 1.6%
2 Fixed customer charges and volumetric block energy rates shown in Table 1 are from
Petitioner’s Witness Gaske’s Attachment JSG 8-T. Average customer charges and energy rates
were derived based on data provided in Petitioner’s Witness Gaske’s Attachment JSG 7-T.
JI Exhibit 2
Direct Testimony of Jonathan Wallach Cause No. 45029 May 24, 2018 Page 7
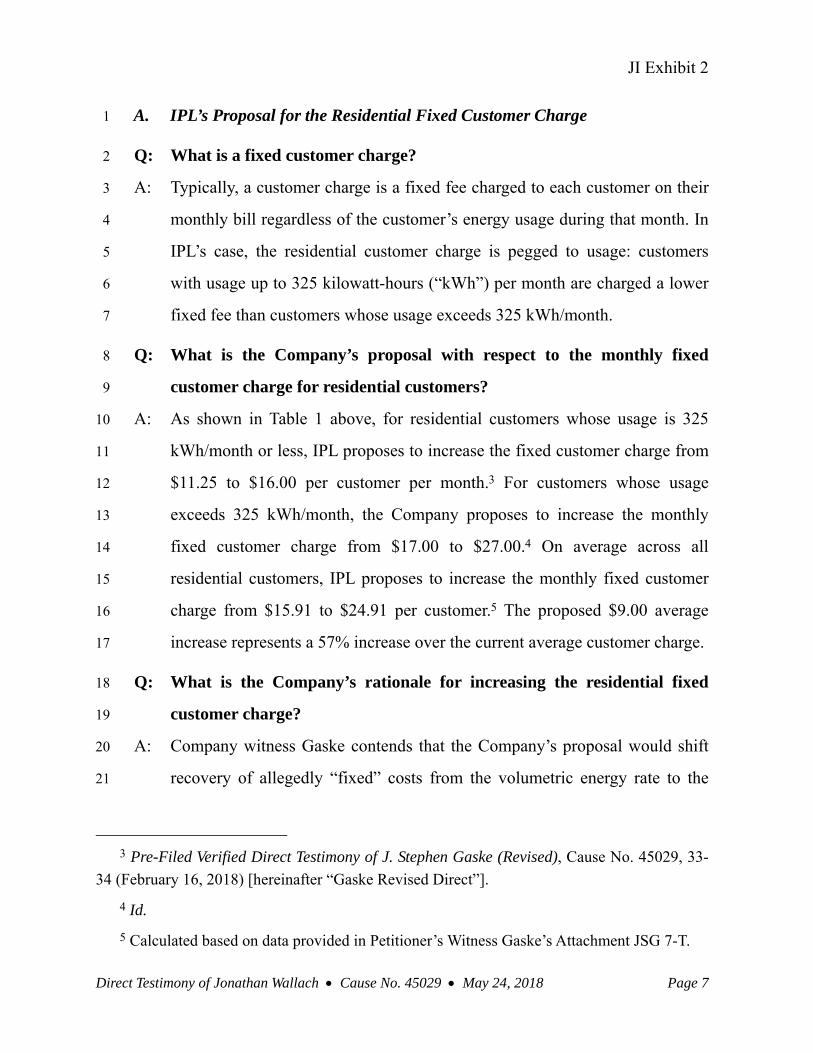
A. IPL’s Proposal for the Residential Fixed Customer Charge 1
Q: What is a fixed customer charge? 2
A: Typically, a customer charge is a fixed fee charged to each customer on their 3
monthly bill regardless of the customer’s energy usage during that month. In 4
IPL’s case, the residential customer charge is pegged to usage: customers 5
with usage up to 325 kilowatt-hours (“kWh”) per month are charged a lower 6
fixed fee than customers whose usage exceeds 325 kWh/month. 7
Q: What is the Company’s proposal with respect to the monthly fixed 8
customer charge for residential customers? 9
A: As shown in Table 1 above, for residential customers whose usage is 325 10
kWh/month or less, IPL proposes to increase the fixed customer charge from 11
$11.25 to $16.00 per customer per month.3 For customers whose usage 12
exceeds 325 kWh/month, the Company proposes to increase the monthly 13
fixed customer charge from $17.00 to $27.00.4 On average across all 14
residential customers, IPL proposes to increase the monthly fixed customer 15
charge from $15.91 to $24.91 per customer.5 The proposed $9.00 average 16
increase represents a 57% increase over the current average customer charge. 17
Q: What is the Company’s rationale for increasing the residential fixed 18
customer charge? 19
A: Company witness Gaske contends that the Company’s proposal would shift 20
recovery of allegedly “fixed” costs from the volumetric energy rate to the 21
3 Pre-Filed Verified Direct Testimony of J. Stephen Gaske (Revised), Cause No. 45029, 33-
34 (February 16, 2018) [hereinafter “Gaske Revised Direct”].
4 Id.
5 Calculated based on data provided in Petitioner’s Witness Gaske’s Attachment JSG 7-T.

JI Exhibit 2
Direct Testimony of Jonathan Wallach Cause No. 45029 May 24, 2018 Page 8
fixed customer charge and thereby move the energy rate closer to marginal 1
cost: 2
One principle that I applied was to move the components of the rate 3 design closer to a level that reflects the marginal cost associated with 4 usage. To do that, I generally increased the customer charges and/or the 5 demand charges to a level that recovers a higher proportion of the fixed 6 costs of service.6 7
Q: To which costs is Mr. Gaske referring when he discusses the “fixed costs 8
of service”? 9
A: Mr. Gaske considers all costs classified as either customer-related or demand-10
related in the Company’s ACOSS to be “fixed”.7 11
Q: Please describe how the ACOSS classifies costs. 12
A: In order to allocate costs to customer classes, the ACOSS first separates total 13
costs into production, transmission, distribution, and customer functions. 14
Costs in each function are then classified as energy-, demand-, or customer-15
related based on whether costs are considered to be “caused” by energy sales, 16
peak demand, or the number of customers, respectively. Finally, costs 17
classified as either energy-, demand-, or customer-related are allocated to 18
customer classes in proportion to each class’s contribution to total-system 19
energy sales, peak demand, or number of customers, respectively. 20
The cost of meters, service drops, and customer services are deemed to 21
be customer-related in the ACOSS. In addition, the ACOSS classifies a 22
portion of pole and conductor costs as customer-related, based on the results 23
of a minimum-system analysis of such distribution plant costs. 24
6 Gaske Revised Direct, 12.
7 IPL response to CAC Data Request 2-3 (Attachment JFW-4).

JI Exhibit 2
Direct Testimony of Jonathan Wallach Cause No. 45029 May 24, 2018 Page 9
The remaining portion of pole and conductor costs not classified as 1
customer-related are instead classified as demand-related in the ACOSS, 2
along with all production, transmission, and line-transformer plant and fixed 3
operations and maintenance (“O&M”) costs. Finally, fuel and variable O&M 4
costs are classified as energy-related. 5
Q: Please describe the Company’s minimum-system analysis of pole and 6
conductor costs. 7
A: The Company’s minimum-system analysis attempts to estimate the cost to 8
install the same amount of poles and wires as are currently on the distribution 9
system, assuming that each piece of distribution equipment is sized to meet 10
minimal load.8 In other words, the Company’s minimum-system analysis 11
attempts to estimate the cost to replicate the configuration of the existing 12
distribution system using “minimum-size” equipment. 13
As discussed above, the “minimum” portion of pole and conductor plant 14
costs (as determined by the minimum-system analysis) is classified as 15
customer-related and then allocated to customer classes in proportion to the 16
number of customers in each class. The remaining portion of such plant costs 17
is classified as demand-related and then allocated to customer classes in 18
proportion to each class’s contribution to the sum of all classes non-19
coincident peaks. 20
Q: Does IPL propose to recover all costs classified as demand-related and 21
customer-related in the ACOSS through the residential fixed customer 22
charge? 23
8 Gaske Revised Direct, 16-17.

JI Exhibit 2
Direct Testimony of Jonathan Wallach Cause No. 45029 May 24, 2018 Page 10
A: No. However, as indicated in Table 2 below, the $24.91 average fixed 1
customer charge proposed by IPL would effectively recover 100% of the 2
Company’s estimate of customer-related costs (including pole and conductor 3
costs classified as customer-related) and 74% of the Company’s estimate of 4
demand-related transmission and distribution costs.9 5
Table 2: Costs Recovered through IPL Proposed Residential Fixed Customer Charge 6
Residential Adjusted Revenue
Requirements Residential
Bills Cost per
Bill
% Recovered
through Customer
Charge
Cost per Bill
Recovered through
Customer Charge
Customer-Related $74,194,361 5,338,932 $13.90 100% $13.90
T&D Demand-Related $79,489,287 5,338,932 $14.89 74% $11.02
Total $153,683,648 $28.79 $24.91
B. IPL’s Proposal for Residential Volumetric Energy Rates 7
Q: Please describe the proposed structure of the Company’s volumetric 8
energy rates for residential customers. 9
A: The Company proposes to maintain a “declining-block” rate structure for its 10
residential volumetric energy rates. This means that a residential customer 11
pays a different volumetric rate for usage up to a certain threshold amount 12
(i.e., a “block” of usage) than for usage that exceeds that threshold, and that 13
the volumetric rate charged for the first block of usage is higher than that for 14
the second block. Thus, with a declining-block rate structure, a residential 15
customer will pay a higher volumetric rate for that portion of her monthly 16
9 Calculated based on data provided in IPL’s response to CAC Data Request 2-3
(Attachment JFW-4).
JI Exhibit 2
Direct Testimony of Jonathan Wallach Cause No. 45029 May 24, 2018 Page 11
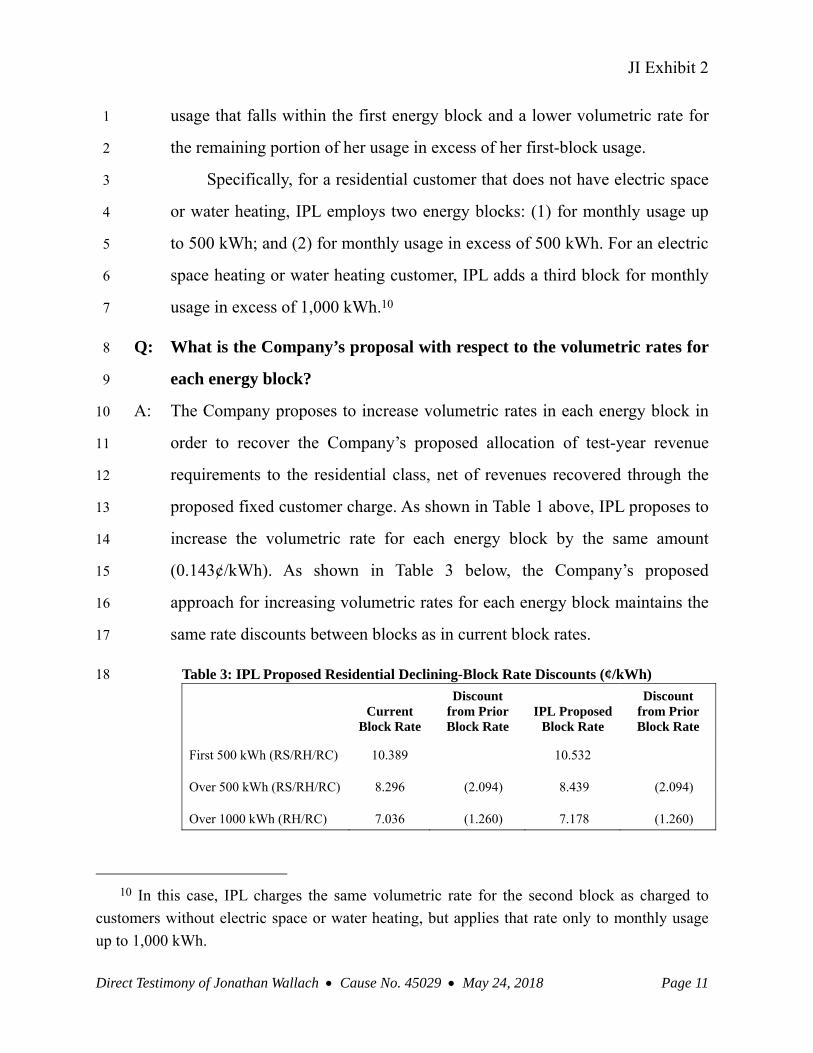
usage that falls within the first energy block and a lower volumetric rate for 1
the remaining portion of her usage in excess of her first-block usage. 2
Specifically, for a residential customer that does not have electric space 3
or water heating, IPL employs two energy blocks: (1) for monthly usage up 4
to 500 kWh; and (2) for monthly usage in excess of 500 kWh. For an electric 5
space heating or water heating customer, IPL adds a third block for monthly 6
usage in excess of 1,000 kWh.10 7
Q: What is the Company’s proposal with respect to the volumetric rates for 8
each energy block? 9
A: The Company proposes to increase volumetric rates in each energy block in 10
order to recover the Company’s proposed allocation of test-year revenue 11
requirements to the residential class, net of revenues recovered through the 12
proposed fixed customer charge. As shown in Table 1 above, IPL proposes to 13
increase the volumetric rate for each energy block by the same amount 14
(0.143¢/kWh). As shown in Table 3 below, the Company’s proposed 15
approach for increasing volumetric rates for each energy block maintains the 16
same rate discounts between blocks as in current block rates. 17
Table 3: IPL Proposed Residential Declining-Block Rate Discounts (¢/kWh) 18
Current
Block Rate
Discount from Prior Block Rate
IPL Proposed Block Rate
Discount from Prior Block Rate
First 500 kWh (RS/RH/RC) 10.389 10.532
Over 500 kWh (RS/RH/RC) 8.296 (2.094) 8.439 (2.094)
Over 1000 kWh (RH/RC) 7.036 (1.260) 7.178 (1.260)
10 In this case, IPL charges the same volumetric rate for the second block as charged to
customers without electric space or water heating, but applies that rate only to monthly usage
up to 1,000 kWh.

JI Exhibit 2
Direct Testimony of Jonathan Wallach Cause No. 45029 May 24, 2018 Page 12
III. IPL’s Proposal for the Residential Fixed Customer Charge Violates 1
Principles of Cost-Based Rate Design 2
Q: What are the relevant considerations in designing cost-based rates for 3
residential customers? 4
A: As the Commission recognized in Cause No. 44576, the primary challenge in 5
rate design is to reflect the costs that customers impose on the system, both to 6
encourage them to use utility resources responsibly and to share costs fairly: 7
Cost recovery design alignment with cost causation principles sends 8 efficient price signals to customers, allowing customers to make 9 informed decisions regarding their consumption of the service being 10 provided.11 11
Accordingly, fixed customer charges should reflect the fact that each 12
customer contributes equally to certain types of costs (e.g., meter costs) 13
regardless of that customer’s energy usage. Volumetric energy rates, on the 14
other hand, recognize that customers of different sizes and load profiles 15
contribute to other types of costs (e.g., generation plant costs) at different 16
levels. If usage-driven costs are inappropriately collected through fixed 17
customer charges, then customers will have reduced incentives to control 18
their bills through conservation or investments in energy efficiency or 19
distributed renewable generation.12 20
11 IURC Final Order, Cause No. 44576, 72.
12 National Association of Regulatory Utility Commissioners, Distributed Energy
Resources Rate Design and Compensation, 118 (November 2016), available at
https://pubs.naruc.org/pub/19FDF48B-AA57-5160-DBA1-BE2E9C2F7EA0 (excerpt included
as Attachment JFW-5).

JI Exhibit 2
Direct Testimony of Jonathan Wallach Cause No. 45029 May 24, 2018 Page 13
Q: Given these considerations, what categories of costs are appropriately 1
recovered through the volumetric energy rate? 2
A: In order to provide efficient price signals, volumetric energy rates should be 3
set at levels that recover those categories of costs that tend to increase with 4
customer usage over the long run, including plant, fuel, and O&M costs for 5
the production, transmission, and distribution functions. In other words, 6
volumetric energy rates should reflect long-run marginal costs. 7
As James Bonbright explains in his seminal text Principles of Public 8
Utility Rates: 9
In view of the above-noted importance attached to existing utility rates 10 as indicators of rates to be charged over a somewhat extended period in 11 the future, one may argue with much force that the cost relationships to 12 which rates should be adjusted are not those highly volatile relationships 13 reflected by short-run marginal costs but rather those relatively stable 14 relationships represented by long-run marginal costs. The advantages of 15 the relatively stable and predictable rates in permitting consumers to 16 make more rational long-run provisions for the use of utility services 17 may well more than offset the admitted advantages of the more flexible 18 rates that would be required in order to promote the best available use of 19 the existing capacity of a utility plant.13 20
I conclude this chapter with the opinion, which would probably 21 represent the majority position among economists, that, as setting a 22 general basis of minimum public utility rates and of rate relationships, 23 the more significant marginal or incremental costs are those of a 24 relatively long-run variety – of a variety which treats even capital costs 25 or “capacity costs” as variable costs.14 26
Almost three decades later, Alfred Kahn affirmed Bonbright’s opinion 27
in his The Economics of Regulation: 28
13 James C. Bonbright, Principles of Public Utility Rates. Columbia University Press, 334
(1961), available at media.terry.uga.edu/documents/exec_ed/bonbright/
principles_of_public_utility_rates.pdf (excerpt included as Attachment JFW-6).
14 Id., 336.

JI Exhibit 2
Direct Testimony of Jonathan Wallach Cause No. 45029 May 24, 2018 Page 14
… the practically achievable benchmark for efficient pricing is more 1 likely to be a type of average long-run incremental cost, computed for a 2 large, expected incremental block of sales, instead of SRMC [short-run 3 marginal cost] ….15 4
Q: Which costs are appropriately recovered through the fixed customer 5
charge? 6
A: In contrast to the volumetric energy rate, the fixed customer charge is 7
intended to reflect the cost to connect to the distribution system a customer 8
who uses very little or zero energy. Such “minimum connection costs” are 9
generally limited to plant and maintenance costs for a service drop and meter, 10
along with meter-reading, billing, and other customer-service expenses. As 11
Bonbright explains: 12
But this twofold distinction [between demand and energy in rate design] 13 overlooks the fact that a material part of the operating and capital costs 14 of utility business is more directly and more closely related to the 15 number of customers than to energy consumption on the one hand or 16 maximum kilowatt demand on the other hand. The most obvious 17 examples of these so-called customer costs are the expenses associated 18 with metering and billing.16 19
In their Public Utility Economics, economists Paul Garfield and Wallace 20
Lovejoy also describe which costs are truly customer-related and therefore 21
appropriately recovered through the fixed customer charge: 22
15 Alfred E. Kahn, The Economics of Regulation, The MIT Press, 85 (1988) (excerpt
included as Attachment JFW-7).
16 Bonbright, op. cit., 311 (excerpt included as Attachment JFW-6).

JI Exhibit 2
Direct Testimony of Jonathan Wallach Cause No. 45029 May 24, 2018 Page 15
The purpose of both the service charge and the minimum charge is to 1 cover at least some of the costs incurred by the utility whether or not the 2 customer uses energy in a particular month. For small customers under 3 the block meter-rate schedule, a charge of this kind is intended to cover 4 the expenses relating to meter service and maintenance, meter reading, 5 accounting and collecting, return on the investment in meters and the 6 service lines connecting the customer’s premises to the distribution 7 system, and others. Such expenses as these represent as a minimum the 8 “readiness-to-serve” expenses incurred by the utility on behalf of each 9 customer.17 10
More recently, Severin Borenstein restated these principles for 11
designing cost-based fixed customer charges as follows: 12
When having one more customer on the system raises the utility’s costs 13 regardless of how much the customer uses – for instance, for metering, 14 billing, and maintaining the line from the distribution system to the 15 house – then a fixed charge to reflect that additional fixed cost the 16 customer imposes on the system makes perfect economic sense. The 17 idea that each household has to cover its customer-specific fixed costs 18 also has obvious appeal on ground of fairness or equity.18 19
Q: Is the Company’s proposal for the residential fixed customer charge 20
consistent with these long-standing principles of cost-based rate design? 21
A: No. Contrary to these principles, IPL proposes to recover through the 22
residential fixed customer charge not just minimum connection costs – i.e., 23
the costs for meters, service drops, and customer services – but also the 24
Company’s estimates of the cost per residential customer for: (1) customer-25
related distribution plant; and (2) demand-related transmission and 26
17 Paul J. Garfield and Wallace F. Lovejoy, Public Utility Economics, Prentice-Hall, Inc.,
155-156 (1964) (excerpt included as Attachment JFW-8).
18 Severin Borenstein, “What’s So Great About Fixed Charges?” (2014), available at
https://energyathaas.wordpress.com/2014/11/03/whats-so-great-about-fixed-charges/.

JI Exhibit 2
Direct Testimony of Jonathan Wallach Cause No. 45029 May 24, 2018 Page 16
distribution plant.19 As discussed above in Section II, the $24.91 average 1
fixed customer charge proposed by IPL would effectively recover 100% of 2
the Company’s estimate of customer-related distribution plant cost per 3
customer and 74% of the Company’s estimate of demand-related 4
transmission and distribution plant cost per customer. 5
Q: How does IPL estimate the customer-related distribution plant cost per 6
residential customer proposed for recovery through the residential fixed 7
customer charge? 8
A: The Company relies on the results of its minimum-system analysis to 9
estimate the customer-related distribution plant cost per residential customer. 10
Specifically, the Company’s ACOSS allocates to the residential class about 11
$30.6 million of distribution plant costs that were classified as customer-12
related using a minimum-system analysis. Dividing by the number of 13
residential bills in the test year, IPL estimates a customer-related distribution 14
plant cost of $5.74 per residential customer.20 15
Q: Is it reasonable to rely on the results of a minimum-system analysis to 16
estimate the customer-related distribution plant cost per residential 17
customer? 18
A: No. As noted above in Section II, the purpose of a minimum-system analysis 19
is to determine the portion of distribution plant costs to be allocated to 20
customer classes based on the number of customers in each class. The 21
Company has not offered any evidence that its minimum-system analysis 22
19 See IPL’s response to CAC Data Request 2-3 for a discussion of the costs to be recovered
through the Company’s proposed residential customer charge (Attachment JFW-4).
20 Calculated based on data provided in IPL’s response to CAC Data Request 2-3
(Attachment JFW-4).
JI Exhibit 2
Direct Testimony of Jonathan Wallach Cause No. 45029 May 24, 2018 Page 17
also yields reliable estimates of the customer-related distribution plant cost 1
per customer. 2
To the contrary, minimum-system analyses overstate the minimum plant 3
cost per customer because they assume that a minimum system carrying 4
minimal load would have the same amount of distribution equipment (e.g., 5
the same number of poles, the same length of conductor) as is currently 6
installed in a distribution system designed to carry actual distribution load. In 7
other words, the minimum-system method assumes that each piece of 8
distribution equipment would serve the same number of customers on 9
average, regardless of whether the customers are average-sized (as for the 10
actual system) or have minimal demand (as for the hypothetical minimum-11
size system.) 12
This is not a realistic assumption, since even a minimally sized piece of 13
distribution equipment should be able to serve more minimal-demand 14
customers than the number of average-demand customers served by average-15
sized distribution equipment. Consequently, the true minimum distribution 16
plant cost to serve a customer with minimal usage is likely to be less than 17
that derived using a minimum-system analysis. Indeed, since the minimum-18
system method attempts to estimate the plant cost incurred regardless of 19
usage – i.e., the cost to serve load approaching zero – the true minimum plant 20
cost per customer is zero since distribution equipment that carries zero load 21
can serve an infinite number of customers with zero load. 22

JI Exhibit 2
Direct Testimony of Jonathan Wallach Cause No. 45029 May 24, 2018 Page 18
Q: Why does the Company propose to recover demand-related transmission 1
and distribution plant costs through the residential fixed customer 2
charge? 3
A: As discussed in Section II, IPL contends that all such demand-related costs 4
are “fixed” and therefore appropriately recovered through a fixed customer 5
charge. 6
Q: Do you agree that demand-related transmission and distribution plant 7
costs are fixed? 8
A: No. Such costs may appear “fixed” when considered from a short-run 9
accounting perspective, since the revenue requirements associated with debt 10
service and maintenance in any year are unlikely to vary much with load in 11
that year. 12
However, from the long-run perspective of cost-causation and price 13
efficiency, plant investments are variable with respect to customer demand. 14
The Company’s proposal to shift recovery of such demand-related costs from 15
the volumetric energy rate to the fixed customer charge would drive the 16
energy rate from long-run to short-run marginal cost and thereby dampen 17
price signals for efficient customer behavior.21 18
Q: What would be an appropriate rate for the residential fixed customer 19
charge in order to recover the minimum cost to connect a residential 20
customer? 21
A: As shown in Table 4 below, I derive a cost-based fixed customer charge for 22
residential customers of $8.15 per customer per month. Consistent with long-23
21 I discuss the impact of the Company’s proposal on energy price signals in Section IV. I
also discuss in Section IV how the Company’s proposal would lead to inequitable subsidization
of high-usage residential customers’ costs by low-usage residential customers.
JI Exhibit 2
Direct Testimony of Jonathan Wallach Cause No. 45029 May 24, 2018 Page 19
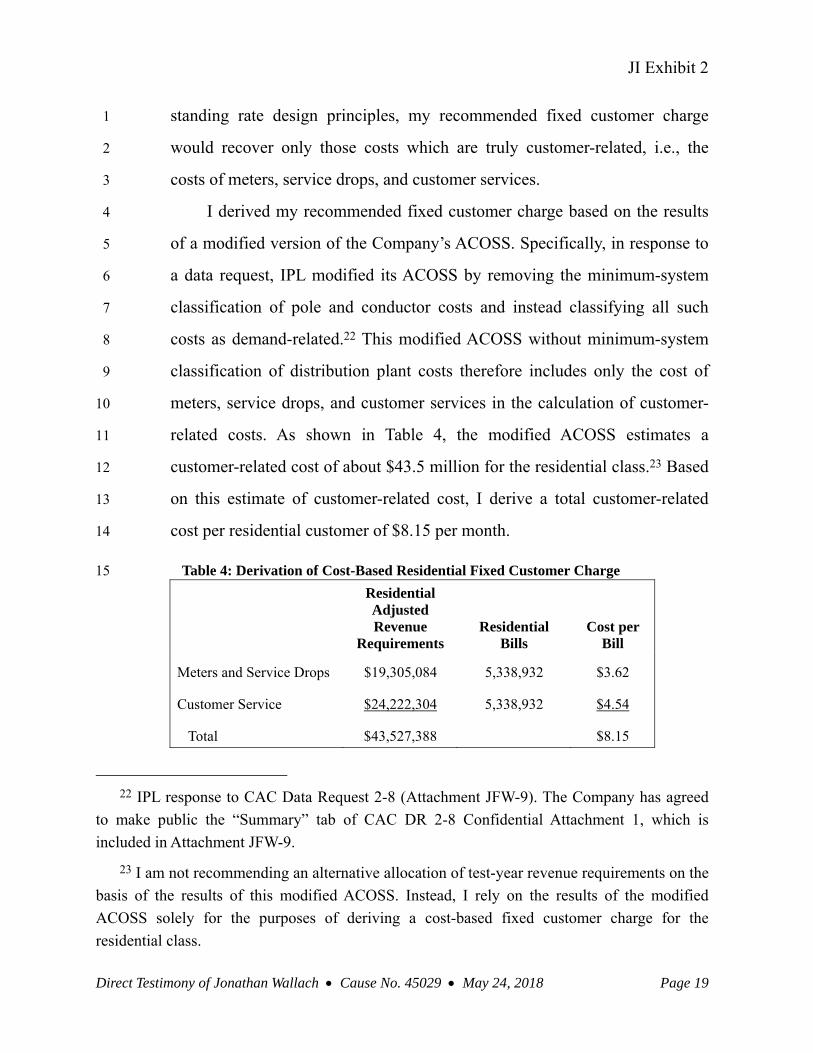
standing rate design principles, my recommended fixed customer charge 1
would recover only those costs which are truly customer-related, i.e., the 2
costs of meters, service drops, and customer services. 3
I derived my recommended fixed customer charge based on the results 4
of a modified version of the Company’s ACOSS. Specifically, in response to 5
a data request, IPL modified its ACOSS by removing the minimum-system 6
classification of pole and conductor costs and instead classifying all such 7
costs as demand-related.22 This modified ACOSS without minimum-system 8
classification of distribution plant costs therefore includes only the cost of 9
meters, service drops, and customer services in the calculation of customer-10
related costs. As shown in Table 4, the modified ACOSS estimates a 11
customer-related cost of about $43.5 million for the residential class.23 Based 12
on this estimate of customer-related cost, I derive a total customer-related 13
cost per residential customer of $8.15 per month. 14
Table 4: Derivation of Cost-Based Residential Fixed Customer Charge 15
Residential Adjusted Revenue
Requirements Residential
Bills Cost per
Bill
Meters and Service Drops $19,305,084 5,338,932 $3.62
Customer Service $24,222,304 5,338,932 $4.54
Total $43,527,388 $8.15
22 IPL response to CAC Data Request 2-8 (Attachment JFW-9). The Company has agreed
to make public the “Summary” tab of CAC DR 2-8 Confidential Attachment 1, which is
included in Attachment JFW-9.
23 I am not recommending an alternative allocation of test-year revenue requirements on the
basis of the results of this modified ACOSS. Instead, I rely on the results of the modified
ACOSS solely for the purposes of deriving a cost-based fixed customer charge for the
residential class.

JI Exhibit 2
Direct Testimony of Jonathan Wallach Cause No. 45029 May 24, 2018 Page 20
Q: Do you recommend charging all residential customers a fixed customer 1
charge of $8.15 per month regardless of customer usage? 2
A: Yes. Unlike the Company’s proposed fixed customer charge, my 3
recommended fixed customer charge reflects only costs that are truly 4
customer-related, i.e. those costs incurred to connect a residential customer 5
regardless of customer size. Consequently, it would be appropriate for all 6
residential customers to be billed my recommended fixed customer charge at 7
a uniform rate. 8
Q: What accounts for the $16.76 difference between your recommended 9
$8.15 fixed customer charge and the $24.91 average fixed customer 10
charge proposed by IPL? 11
A: The $16.76 difference between my recommended $8.15 fixed customer 12
charge and the $24.91 average fixed customer charge proposed by IPL 13
represents demand-related pole, conductor, and other transmission and 14
distribution plant costs that would be inappropriately recovered through the 15
fixed customer charge under the Company’s proposal. As discussed in 16
Section IV below, this shift in recovery of demand-related costs from the 17
volumetric energy rate to the fixed customer charge would give rise to cost 18
subsidization within the residential class and would dampen energy price 19
signals to consumers for controlling their bills through conservation or 20
investments in energy efficiency or distributed renewable generation. 21
Q: Although not proposed by IPL in this rate case, would it ever be 22
appropriate to recover any demand-related costs through a residential 23
demand charge? 24

JI Exhibit 2
Direct Testimony of Jonathan Wallach Cause No. 45029 May 24, 2018 Page 21
A: No. Recovery of demand-related costs through a residential demand charge 1
would dampen price signals for conservation, promote inefficient customer 2
behavior, and undermine customers’ ability to control electricity costs. 3
Demand charges on a monthly bill are typically determined based on the 4
customer’s maximum demand, whenever that maximum occurs during the 5
month. In order to control monthly demand costs, customers would therefore 6
need to have detailed information regarding their load profiles for each day 7
of the month as well as an in-depth understanding of which combination of 8
appliance- or equipment-usage gives rise to monthly maximum demands. 9
Even with such information and knowledge, it would be difficult for a 10
residential customer to reduce demand charges, since even a single failure to 11
control load during the month would result in the same demand charge as if 12
the customer had not attempted to control load at all. 13
A demand charge would also provide little or no incentive for 14
residential customers to take actions that reduce distribution-system costs. 15
Distribution equipment costs typically are driven by the coincident peak load 16
for all customers sharing the equipment. An individual customer is unlikely 17
to reach her maximum demand at the same time as when the coincident peak 18
on the distribution system occurs. Thus, a demand charge will provide an 19
incentive to a residential customer to control load at the time that customer 20
reaches her individual maximum demand, which does not necessarily 21
correspond to the time of peak load on the distribution system. In fact, some 22
customers might respond to a demand charge by shifting loads from their 23
own peak to the peak hour on the local distribution system, thereby 24
increasing their contribution to maximum or critical loads on the local 25
distribution system and further stressing the system during peak periods. 26

JI Exhibit 2
Direct Testimony of Jonathan Wallach Cause No. 45029 May 24, 2018 Page 22
Finally, shifting recovery of demand-related costs from the energy rate 1
to a demand charge would send the wrong energy price signal. Shifting 2
demand-related costs to a demand charge would lower the energy rate and 3
thereby perversely encourage increased energy consumption, some of which 4
might occur at times of peak loading on the distribution system – when 5
energy conservation is most needed. Shifting costs from the energy rate to a 6
demand charge could therefore increase distribution system costs and offset 7
any (limited) benefits from a residential demand charge. 8
Severin Borenstein aptly summed up the shortcomings (and the 9
antiquated nature) of demand charges when he wrote: “It is unclear why 10
demand charges still exist.”24 11
Q: Have you estimated the bill impacts associated with your recommended 12
residential fixed customer charge? 13
A: Yes. In Attachment JFW-2, I provide both my estimate of the bill impacts 14
with an $8.15 fixed customer charge and the Company’s estimate of bill 15
impacts with its proposed residential fixed customer charge.25 As shown in 16
Attachment JFW-2 for my recommended fixed customer charge, I increased 17
the volumetric energy rates proposed by IPL to recover the revenues 18
associated with the $16.76 difference between my recommended $8.15 fixed 19
customer charge and the $24.91 average fixed customer charge proposed by 20
24 Severin Borenstein, “The Economics of Fixed Cost Recovery by Utilities”, in Recovery
of Utility Fixed Costs: Utility, Consumer, Environmental and Economist Perspectives,
Lawrence Berkeley National Laboratory, 60 (2016). Available at http://eta-
publications.lbl.gov/sites/default/files/lbnl-1005742.pdf.
25 I derived Attachment JFW-2 by modifying Petitioner’s Witness Gaske’s Attachment JSG
9-T. My spreadsheet underlying this calculation will be provided with my workpaper
submission.

JI Exhibit 2
Direct Testimony of Jonathan Wallach Cause No. 45029 May 24, 2018 Page 23
IPL. In order to isolate the bill impacts from a change in the fixed customer 1
charge, I maintained the Company’s proposed declining-block structure when 2
calculating the volumetric energy rates associated with an $8.15 fixed 3
customer charge. However, I discuss in Section V why it would be reasonable 4
to phase out the current declining-block structure for residential volumetric 5
energy rates. 6
IV. Customer Impacts from IPL’s Proposal for the Residential Fixed 7
Customer Charge 8
A. IPL’s Proposal Would Lead to Intra-Class Cost Subsidization 9
Q: How would the Company’s proposal to increase the residential fixed 10
customer charge cause intra-class subsidization? 11
A: As discussed in Section III, IPL’s proposal to increase the residential fixed 12
customer charge would shift recovery of demand-related costs from the 13
volumetric energy rate to the fixed customer charge. Such demand-related 14
costs are driven by residential load and are therefore appropriately recovered 15
from residential customers in proportion to their contribution to total load. To 16
the extent that demand-related costs are recovered at a fixed rate through the 17
residential customer charge rather than at a volumetric rate through the 18
energy charge, residential customers with below-average usage would bear a 19
disproportionate share of demand-related costs and consequently subsidize 20
customers with above-average usage. In this case, a residential customer with 21
below-average usage will pay more, and a residential customer with above 22
average-usage will pay less, than their fair share of such costs. 23

JI Exhibit 2
Direct Testimony of Jonathan Wallach Cause No. 45029 May 24, 2018 Page 24
Q: What is the extent of the intra-class subsidization under the Company’s 1
proposal for the residential fixed customer charge? 2
A: As explained in Section III, the $16.76 difference between the minimum 3
connection cost of $8.15 and the $24.91 average fixed customer charge 4
proposed by IPL represents demand-related transmission and distribution 5
costs that would be inappropriately recovered from each residential customer 6
every month through a fixed charge on the customer’s bill. The Company 7
estimates about 5.3 million residential bills in the test year.26 This means that 8
$89.5 million of demand-related costs would be recovered annually through 9
the residential fixed customer charge under the Company’s proposal.27 10
If the demand-related costs recovered through the residential fixed 11
customer charge under the Company’s proposal were instead recovered 12
through the volumetric energy rate (as I propose), each residential customer 13
would contribute to recovery of these costs in proportion to their usage. The 14
Company estimates residential sales in the test year of about 4.9 million 15
megawatt-hours.28 Therefore, if the $89.5 million of demand-related costs 16
continued to be recovered through the volumetric energy rate rather than 17
through the fixed customer charge, they would be charged at a rate of 1.84 18
26 The number of residential bills in the test year is provided in Petitioner’s Witness Gaske’s
Attachment JSG 7-T.
27 The $89.5 million result is derived by taking the product of the annual number of
residential bills (5.3 million) and the amount of the proposed average residential fixed customer
charge in excess of minimum connection cost ($16.76 per bill).
28 Residential sales for the test year are provided in Petitioner’s Witness Gaske’s
Attachment JSG 7-T.

JI Exhibit 2
Direct Testimony of Jonathan Wallach Cause No. 45029 May 24, 2018 Page 25
cents per kilowatt-hour (“¢/kWh”).29 Under the rate structure that I propose, 1
a residential customer with below-average monthly usage of 500 kWh would 2
contribute about $110 per year toward recovery of the $89.5 million of 3
demand-related costs while a customer with above-average monthly usage of 4
1,500 kWh would contribute about $331 per year.30 Thus, under my proposal, 5
the 1,500 kWh customer would contribute three times more than the 500 6
kWh customer, in direct proportion to their usage and consistent with 7
accepted principles of cost-causation. 8
In contrast, under the Company’s proposal to recover $89.5 million of 9
demand-related costs through the fixed customer charge, each residential 10
customer would contribute about $201 per year toward recovery of such 11
costs regardless of that customer’s usage. A below-average 500 kWh 12
customer would therefore pay nearly double their fair share of these demand-13
related costs under the Company’s proposal while an above-average 1,500 14
kWh customer would pay only 61% of their fair share. 15
B. IPL’s Proposal Would Dampen Energy Price Signals 16
Q: Would the Company’s proposal to increase the residential fixed 17
customer charge send appropriate price signals? 18
A: No. As discussed in Section III, IPL proposes to set the residential fixed 19
customer charge at a rate that greatly exceeds the minimum cost to connect a 20
residential customer. The amount in excess of minimum connection costs 21
29 The 1.84¢/kWh result is derived by dividing $89.5 million by residential sales of 4.9
million megawatt-hours. This calculation assumes that the $89.5 million of demand-related
costs would be recovered through all residential energy blocks at a uniform rate.
30 Based on data provided in Petitioner’s Witness Gaske’s Attachment JSG 7-T, I estimate
monthly usage of 910 kWh for an average residential customer.

JI Exhibit 2
Direct Testimony of Jonathan Wallach Cause No. 45029 May 24, 2018 Page 26
represents usage-related costs that are more appropriately recovered in the 1
volumetric energy rate. However, under the Company’s proposal, this excess 2
over the minimum connection costs would instead be inappropriately 3
recovered through the fixed customer charge. This shift in the recovery of 4
usage-related costs from the volumetric energy rate to the fixed customer 5
charge would dampen price signals and discourage economically efficient 6
behavior by residential customers. 7
Q: To what extent would the Company’s proposal to increase the residential 8
fixed customer charge dampen price signals provided by the residential 9
volumetric energy rate? 10
A: With a fixed amount of revenue requirements to be recovered from the 11
residential class, the higher the residential fixed customer charge, the lower 12
the volumetric energy rate, and vice versa. As shown in Table 5 below, with 13
the average residential fixed customer charge set at $24.91, IPL proposes an 14
average volumetric energy rate of 9.19¢/kWh in order to recover the 15
proposed allocation of test year revenue requirements to residential 16
customers.31 If, instead, the fixed customer charge were set at the cost-based 17
rate of $8.15, I estimate that the average volumetric energy rate would have 18
to be increased to 11.03¢/kWh to recover the same allocated revenue 19
requirement.32 20
31 Petitioner’s Witness Gaske’s Attachment JSG 7-T.
32 For the purposes of this calculation, I assume the same declining-block rate structure for
the block volumetric energy rates as proposed by IPL. However, as discussed in Section V, I do
not recommend maintaining the declining-block rate structure proposed by the Company.
JI Exhibit 2
Direct Testimony of Jonathan Wallach Cause No. 45029 May 24, 2018 Page 27
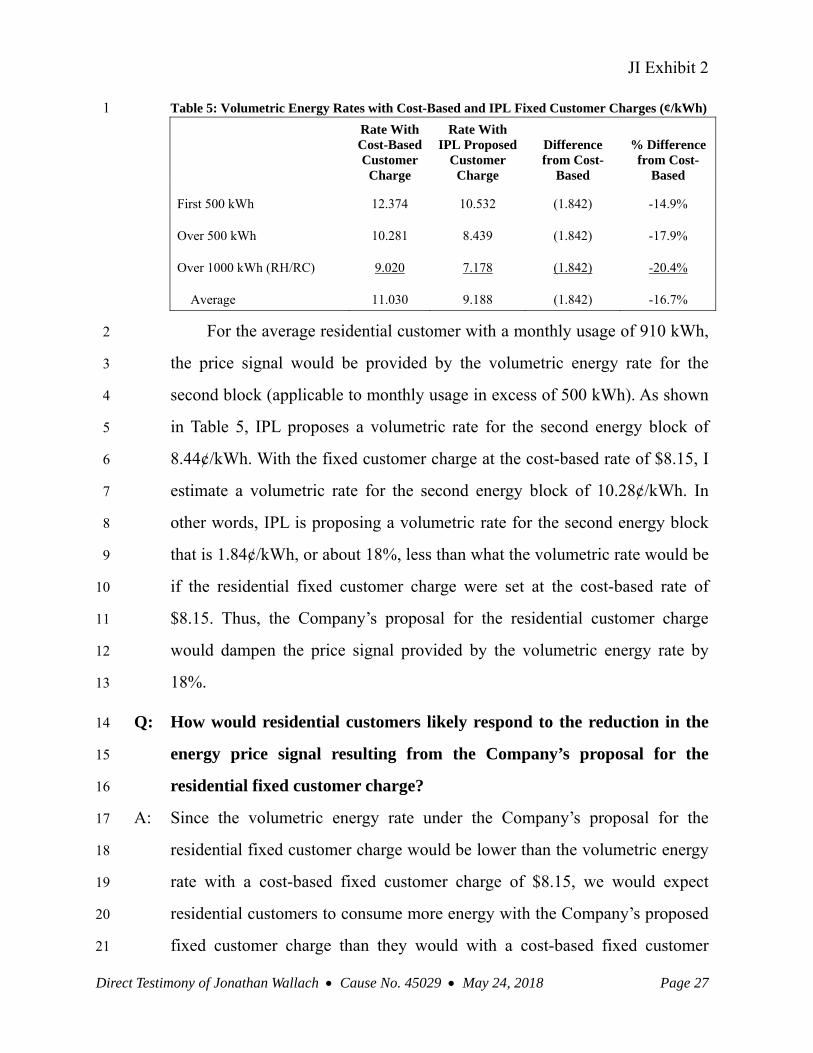
Table 5: Volumetric Energy Rates with Cost-Based and IPL Fixed Customer Charges (¢/kWh) 1
Rate With Cost-Based Customer
Charge
Rate With IPL Proposed
Customer Charge
Difference from Cost-
Based
% Difference from Cost-
Based
First 500 kWh 12.374 10.532 (1.842) -14.9%
Over 500 kWh 10.281 8.439 (1.842) -17.9%
Over 1000 kWh (RH/RC) 9.020 7.178 (1.842) -20.4%
Average 11.030 9.188 (1.842) -16.7%
For the average residential customer with a monthly usage of 910 kWh, 2
the price signal would be provided by the volumetric energy rate for the 3
second block (applicable to monthly usage in excess of 500 kWh). As shown 4
in Table 5, IPL proposes a volumetric rate for the second energy block of 5
8.44¢/kWh. With the fixed customer charge at the cost-based rate of $8.15, I 6
estimate a volumetric rate for the second energy block of 10.28¢/kWh. In 7
other words, IPL is proposing a volumetric rate for the second energy block 8
that is 1.84¢/kWh, or about 18%, less than what the volumetric rate would be 9
if the residential fixed customer charge were set at the cost-based rate of 10
$8.15. Thus, the Company’s proposal for the residential customer charge 11
would dampen the price signal provided by the volumetric energy rate by 12
18%. 13
Q: How would residential customers likely respond to the reduction in the 14
energy price signal resulting from the Company’s proposal for the 15
residential fixed customer charge? 16
A: Since the volumetric energy rate under the Company’s proposal for the 17
residential fixed customer charge would be lower than the volumetric energy 18
rate with a cost-based fixed customer charge of $8.15, we would expect 19
residential customers to consume more energy with the Company’s proposed 20
fixed customer charge than they would with a cost-based fixed customer 21

JI Exhibit 2
Direct Testimony of Jonathan Wallach Cause No. 45029 May 24, 2018 Page 28
charge. The magnitude of the increase in energy consumption would depend 1
on: (1) the extent to which the volumetric energy rate with the Company’s 2
proposed residential fixed customer charge is lower than the volumetric 3
energy rate with a cost-based fixed customer charge; and (2) the price 4
elasticity of electricity demand. 5
Q: What is the price elasticity of electricity demand? 6
A: Residential customers respond to the price incentives created by the electrical 7
rate structure. Those responses are generally measured as price elasticities, 8
i.e., the ratio of the percentage change in consumption to the percentage 9
change in price. Price elasticities are generally low in the short term and rise 10
over several years, because customers have more options for increasing or 11
reducing energy usage in the medium to long term. For example, a review by 12
Espey and Espey (2004) of 36 articles on residential electricity demand 13
published between 1971 and 2000 reports short-run elasticity estimates of 14
about −0.35 on average across studies and long-run elasticity estimates of 15
about −0.85 on average across studies.33 In other words, on average across 16
these studies, consumption decreased by 0.35% in the short term and by 17
0.85% in the long term for every 1% increase in price. 18
Studies of electric price response typically examine the change in usage 19
as a function of changes in the marginal rate paid by the customer.34 Table 6 20
33 The citation for this study is provided in Attachment JFW-3.
34 For the average residential customer with a monthly usage of 910 kWh, that would be the
volumetric rate for the second energy block (applicable to monthly usage in excess of 500
kWh).

JI Exhibit 2
Direct Testimony of Jonathan Wallach Cause No. 45029 May 24, 2018 Page 29
below lists the results of seven studies of marginal-price elasticity over the 1
last forty years.35 2
Table 6: Summary of Marginal-Price Elasticities 3
Authors Date Elasticity Estimates
Acton, Bridger, and Mowill 1976 −0.35 to −0.7
McFadden, Puig, and Kirshner 1977 −0.25 without electric space heat and −0.52 with space heat
Barnes, Gillingham, and Hageman 1981 −0.55
Henson 1984 –0.27 to –0.30
Reiss and White 2005 −0.39
Xcel Energy Colorado 2012 –0.3 (at years 2 and 3)
Orans et al, on BC Hydro inclining-block rate
2014 –0.13 in 3rd year of phased-in rate
Q: What would be a reasonable estimate of the marginal-price elasticity for 4
changes in the residential volumetric energy rate? 5
A: From Table 6, it appears that –0.3 would be a reasonable mid-range estimate 6
of the impact over a few years. 7
Q: What would be a reasonable estimate of the effect on energy use from 8
the Company’s proposal for the residential fixed customer charge? 9
A: As discussed above, if the residential fixed customer charge were increased 10
as proposed by IPL, the volumetric rate for the second energy block would be 11
about 18% less than what the volumetric rate would be if the residential fixed 12
customer charge were set at the cost-based rate of $8.15. Assuming an 13
elasticity of –0.3, this 18% reduction in the volumetric energy rate would 14
result in an increase in energy consumption of more than 5% for the average 15
residential customer. This means that all else equal, residential load after a 16
few years with a residential fixed customer charge as proposed by IPL would 17
35 The citations for these studies are provided in Attachment JFW-3.

JI Exhibit 2
Direct Testimony of Jonathan Wallach Cause No. 45029 May 24, 2018 Page 30
be expected to be about 5% higher than it would have been if the residential 1
fixed customer charge had been set at the cost-based rate of $8.15. 2
For comparison, I estimate that the Company’s residential energy 3
efficiency programs over the three years 2018 through 2020 will deliver an 4
amount of energy savings equivalent to about 4% of forecasted annual 5
residential load.36 Thus, the additional consumption induced by the 6
Company’s proposal for the residential fixed customer charge would negate 7
the energy savings achieved by the Company’s residential energy efficiency 8
programs between 2018 and 2020. 9
V. IPL’s Proposal for Declining-Block Energy Rates Would Further 10
Dampen Energy Price Signals 11
Q: How does the Company propose to recover demand-related costs other 12
than those proposed to be recovered through the residential fixed 13
customer charge? 14
A: As discussed in Section II, the Company’s proposed residential fixed 15
customer charge would recover about 74% of the demand-related 16
transmission and distribution costs allocated to the residential class. The 17
Company proposes to recover the remaining 26% of demand-related 18
transmission and distribution costs, along with 100% of residential demand-19
related production costs, through declining-block volumetric energy rates. 20
36 Based on data regarding residential energy efficiency net savings provided in Attachment
ZE-1S to settlement testimony by IPL witness Zac Elliott in Cause No. 44945 and on data
regarding the Company’s forecast of residential energy sales provided in the Table 2-2 of
Attachment 4.3 to the Company’s 2016 Integrated Resource Plan. See Attachments JFW-10 and
JFW-11.

JI Exhibit 2
Direct Testimony of Jonathan Wallach Cause No. 45029 May 24, 2018 Page 31
Q: What is the amount of demand-related costs that IPL proposes to 1
recover through residential volumetric energy rates? 2
A: The Company proposes to allocate about $350 million of demand-related 3
production, transmission, and distribution costs to the residential class.37 As 4
discussed in Section II, the residential customer charge proposed by IPL 5
would recover about 74% of residential transmission and distribution 6
demand-related costs through the fixed customer charge. Netting out the 7
demand-related transmission and distribution costs to be recovered through 8
the fixed customer charge proposed by IPL, I estimate that about $289 9
million of demand-related costs would be recovered through the residential 10
volumetric energy rates proposed by IPL.38 With residential test-year sales of 11
4.9 million megawatt-hours, this $289 million of demand-related costs would 12
be recovered from residential customers at an average volumetric rate of 13
5.95¢/kWh. 14
Q: Is the Company proposing to recover demand-related costs at a uniform 15
volumetric rate of 5.95¢/kWh? 16
A: No. As discussed in Section II, IPL proposes to retain the current declining-17
block structure for its volumetric energy rates. Consequently, as illustrated in 18
Table 7 below, the Company proposes to recover demand-related costs at an 19
above-average rate in the first energy block and at below-average rates in the 20
second and third blocks. 21
37 Petitioner’s Witness Gaske’s Attachment JSG 3-T, 6. The $350 million amount represents
the mitigated allocation of demand-related costs to the residential class.
38 I estimate that demand-related production costs constitute almost 95% of the $289
million of demand-related costs that would be recovered through residential volumetric energy
rates under the Company’s proposal.

JI Exhibit 2
Direct Testimony of Jonathan Wallach Cause No. 45029 May 24, 2018 Page 32
Table 7: Volumetric Rate Recovery of Demand-Related Costs (¢/kWh) 1
IPL Proposed
Rate
Fuel + Energy-Related
Cost
Net Demand-Related
Cost
Average Demand-Related
Cost
Net/Average Demand-Related
Cost
First 500 kWh (RS/RH/RC) 10.53 3.23 7.30 5.95 122.6%
Over 500 kWh (RS/RH/RC) 8.44 3.23 5.20 5.95 87.4%
Over 1000 kWh (RH/RC) 7.18 3.23 3.94 5.95 66.3%
Q: Why is IPL proposing declining-block rate recovery of demand-related 2
costs? 3
A: According to Company witness Gaske, declining-block rate recovery is the 4
next best option after demand-charge recovery for recovering these allegedly 5
“fixed” costs: 6
Because the residential and small commercial customers generally do 7 not have meters that measure their peak monthly demand and allow 8 fixed, demand-related costs to be recovered through a demand charge, a 9 declining block rate structure is a second-best way to recover the fixed 10 costs that are not recovered in the customer charge. IPL’s declining 11 block rate structure for these rate schedules helps ensure that an 12 appropriate level of fixed costs is recovered from each customer while 13 also reducing the amount of fixed costs loaded into the marginal energy 14 charges of most customers.39 15
Q: Do you agree with the Company’s contention that demand-related costs 16
are appropriately recovered through declining volumetric rates? 17
A: No. As discussed in Section III, from a long-run cost-causation and price-18
efficiency perspective, these demand-related costs vary with customer usage 19
and therefore are appropriately recovered from customers in proportion to 20
their usage. Consequently, such costs should be recovered through a uniform 21
rate so that all customers pay volumetric energy rates that reasonably reflect 22
long-run marginal costs. 23
39 Gaske Revised Direct, 35.

JI Exhibit 2
Direct Testimony of Jonathan Wallach Cause No. 45029 May 24, 2018 Page 33
Conversely, the Company’s proposal to recover demand-related costs 1
through declining-block volumetric energy rates would drive second- and 2
third-block energy rates from long-run to short-run marginal costs and 3
thereby dampen energy price signals for most customers. 4
Even from a short-run cost-causation perspective, it would not be 5
reasonable to recover demand-related costs through declining energy rates. 6
Declining-block rate recovery of demand-related costs might be appropriate 7
in the case where low-usage customers’ hourly loads were “peakier” than 8
high-usage customers’ hourly loads, i.e, in the case where customer load 9
factors were lower for low-usage customers than for high-usage customers.40 10
If customer load factors generally increased with customer usage, then a 11
customer’s contribution to demand-related costs per kilowatt-hour of usage 12
would be greater for a low-usage customer than for a high-usage customer. In 13
which case, a high-usage customer would pay more than their fair share of 14
demand-related costs if such costs were recovered through a uniform 15
volumetric energy rate. 16
However, load-research data collected by the Company indicates that 17
this is not the case for the Company’s residential customers.41 As illustrated 18
in Figure 1 below, load factors do not appear to increase with customer 19
usage. This means that all residential customers contribute to demand-related 20
40 Customer load factor is the ratio of average hourly usage to hourly usage at the time of
system peak. A customer who used the same amount of energy every hour of every day of the
month would have a load factor of 1 since average hourly usage during the month would be
equal to usage in the system-peak hour. In contrast, a customer who used the same amount of
energy every hour except for the system-peak hour, where he used double the amount of
energy, would have a load factor of about 0.5.
41 The Company provided data from its load research program in response to CAC Data
Request 2-2 (Attachment JFW-12). Please see my associated workpaper.

JI Exhibit 2
Direct Testimony of Jonathan Wallach Cause No. 45029 May 24, 2018 Page 34
costs in the same proportion to energy usage regardless of customer size. 1
Thus, the residential class’ demand-related costs are effectively driven by 2
energy usage and therefore appropriately recovered through a uniform 3
volumetric energy rate. 4
5
Q: Do you recommend eliminating the declining-block structure for 6
residential volumetric energy rates? 7
A: In the interests of gradualism, I do not recommend completely eliminating 8
the declining-block structure for residential volumetric energy rates in this 9
rate case. Instead, I recommend that the rate discounts for the second and 10
third energy blocks be reduced gradually to zero over this and the next two or 11
three rate cases.42 The exact timing and magnitude of the reductions to block 12
discounts will depend on the magnitude of the revenue increase or decrease 13
42 It may be appropriate to phase out the third-block discount for electric space and water
heat customers over a longer period.
0%
20%
40%
60%
80%
100%
120%
140%
160%
180%
200%
0 500 1000 1500 2000 2500 3000 3500
Customer Monthly Load
Factor
Customer Monthly Energy [kWh]
Figure 1: Residential Load Factor vs. Energy Usage

JI Exhibit 2
Direct Testimony of Jonathan Wallach Cause No. 45029 May 24, 2018 Page 35
approved by the Commission in this and subsequent rate cases and on the 1
anticipated frequency of future rate cases. 2
VI. Conclusions and Recommendations 3
Q: What do you conclude with respect to the Company’s proposal to 4
increase the residential fixed customer charge? 5
A: The Company’s proposal would inappropriately shift load-related costs from 6
the volumetric energy rate to the fixed customer charge, dampen price signals 7
to consumers for reducing energy usage, disproportionately and inequitably 8
increase bills for the Company’s smallest residential customers, and result in 9
subsidization of larger residential customers’ costs by customers with below-10
average usage. Accordingly, the Commission should reject the Company’s 11
proposal to increase the monthly fixed customer charge for residential 12
customers. Instead, consistent with long-standing cost-causation and rate-13
design principles, I recommend that the residential fixed customer charge be 14
set at a cost-based rate of $8.15 per residential customer per month. 15
Q: What do you conclude with respect to the Company’s proposal for 16
residential volumetric energy rates? 17
A: The Company lacks a reasonable basis for its proposal to maintain the 18
existing declining-block rate structure for residential volumetric energy rates. 19
The Company’s proposal to recover demand-related costs at a higher rate in 20
the first energy block than in the second or third blocks would further 21
dampen energy price signals and promote inefficient customer behavior. In 22
the interests of gradualism, I recommend phasing out the declining-block 23
structure over this and the next few rate cases. 24
Q: Does this conclude your direct testimony? 25
A: Yes. 26

VERIFICATION
I, Jonathan Wallach, affirm under penalties of perjury that the foregoing representations are true and corredt to the best of my knowledge, information and belief.
Jonathan Wallach Date

ATTACHMENT JFW-1
Qualifications of
JONATHAN F. WALLACH Resource Insight, Inc.
5 Water Street Arlington, Massachusetts 02476
SUMMARY OF PROFESSIONAL EXPERIENCE
1990–Present
Vice President, Resource Insight, Inc. Provides research, technical assistance, and expert testimony on electric- and gas-utility planning, economics, regulation, and restructuring. Designs and assesses resource-planning strategies for regulated and competitive markets, including estimation of market prices and utility-plant stranded investment; negotiates restructuring strategies and implementation plans; assists in procurement of retail power supply.
1989–90 Senior Analyst, Komanoff Energy Associates. Conducted comprehensive cost-benefit assessments of electric-utility power-supply and demand-side conservation resources, economic and financial analyses of independent power facilities, and analyses of utility-system excess capacity and reliability. Provided expert testimony on statistical analysis of U.S. nuclear plant operating costs and perform-ance. Co-wrote The Power Analyst, software developed under contract to the New York Energy Research and Development Authority for screening the economic and financial performance of non-utility power projects.
1987–88 Independent Consultant. Provided consulting services for Komanoff Energy Associates (New York, New York), Schlissel Engineering Associates (Belmont, Massachusetts), and Energy Systems Research Group (Boston, Massachusetts).
1981–86 Research Associate, Energy Systems Research Group. Performed analyses of electric utility power supply planning scenarios. Involved in analysis and design of electric and water utility conservation programs. Developed statistical analysis of U.S. nuclear plant operating costs and performance.
EDUCATION
BA, Political Science with honors and Phi Beta Kappa, University of California, Berkeley, 1980.
Massachusetts Institute of Technology, Cambridge, Massachusetts. Physics and Political Science, 1976–1979.
PUBLICATIONS
“The Future of Utility Resource Planning: Delivering Energy Efficiency through Distributed Utilities” (with Paul Chernick), International Association for Energy Economics Seventeenth Annual North American Conference (460–469). Cleveland, Ohio: USAEE. 1996.
Attachment JFW-1

Jonathan F. Wallach Resource Insight, Incorporated Page 2
“The Price is Right: Restructuring Gain from Market Valuation of Utility Generating Assets” (with Paul Chernick), International Association for Energy Economics Seventeenth Annual North American Conference (345–352). Cleveland, Ohio: USAEE. 1996.
“The Future of Utility Resource Planning: Delivering Energy Efficiency through Distribution Utilities” (with Paul Chernick), 1996 Summer Study on Energy Efficiency in Buildings 7(7.47–7.55). Washington: American Council for an Energy-Efficient Economy, 1996.
“Retrofit Economics 201: Correcting Common Errors in Demand-Side-Management Cost-Benefit Analysis” (with John Plunkett and Rachael Brailove). In proceedings of “Energy Modeling: Adapting to the New Competitive Operating Environment,” conference sponsored by the Institute for Gas Technology in Atlanta in April of 1995. Des Plaines, Ill.: IGT, 1995.
“The Transfer Loss is All Transfer, No Loss” (with Paul Chernick), Electricity Journal 6:6 (July, 1993).
“Benefit-Cost Ratios Ignore Interclass Equity” (with Paul Chernick et al.), DSM Quarterly, Spring 1992.
“Consider Plant Heat Rate Fluctuations,” Independent Energy, July/August 1991.
“Demand-Side Bidding: A Viable Least-Cost Resource Strategy” (with Paul Chernick and John Plunkett), Proceedings from the NARUC Biennial Regulatory Information Conference, September 1990.
“New Tools on the Block: Evaluating Non-Utility Supply Opportunities With The Power Analyst, (with John Plunkett), Proceedings of the Fourth National Conference on Micro-computer Applications in Energy, April 1990.
REPORTS
“Economic Benefits from Early Retirement of Reid Gardner” (with Paul Chernick) prepared for and filed by the Sierra Club in PUC of Nevada Docket No. 11-08019.
“Green Resource Portfolios: Development, Integration, and Evaluation” (with Paul Chernick and Richard Mazzini) report to the Green Energy Coalition presented as evidence in Ontario EB 2007-0707.
“Risk Analysis of Procurement Strategies for Residential Standard Offer Service” (with Paul Chernick, David White, and Rick Hornby) report to Maryland Office of People’s Counsel. 2008. Baltimore: Maryland Office of People’s Counsel.
“Integrated Portfolio Management in a Restructured Supply Market” (with Paul Chernick, William Steinhurst, Tim Woolf, Anna Sommers, and Kenji Takahashi). 2006. Columbus, Ohio: Office of the Ohio Consumers’ Counsel.
“First Year of SOS Procurement.” 2004. Prepared for the Maryland Office of People’s Counsel.
Attachment JFW-1

Jonathan F. Wallach Resource Insight, Incorporated Page 3
“Energy Plan for the City of New York” (with Paul Chernick, Susan Geller, Brian Tracey, Adam Auster, and Peter Lanzalotta). 2003. New York: New York City Economic Develop-ment Corporation.
“Peak-Shaving–Demand-Response Analysis: Load Shifting by Residential Customers” (with Brian Tracey). 2003. Barnstable, Mass.: Cape Light Compact.
“Electricity Market Design: Incentives for Efficient Bidding; Opportunities for Gaming.” 2002. Silver Spring, Maryland: National Association of State Consumer Advocates.
“Best Practices in Market Monitoring: A Survey of Current ISO Activities and Recommend-ations for Effective Market Monitoring and Mitigation in Wholesale Electricity Markets” (with Paul Peterson, Bruce Biewald, Lucy Johnston, and Etienne Gonin). 2001. Prepared for the Maryland Office of People’s Counsel, Pennsylvania Office of Consumer Advocate, Delaware Division of the Public Advocate, New Jersey Division of the Ratepayer Advocate, Office of the People’s Counsel of the District of Columbia.
“Comments Regarding Retail Electricity Competition.” 2001. Filed by the Maryland Office of People’s Counsel in U.S. FTC Docket No. V010003.
“Final Comments of the City of New York on Con Edison’s Generation Divestiture Plans and Petition.” 1998. Filed by the City of New York in PSC Case No. 96-E-0897.
“Response Comments of the City of New York on Vertical Market Power.” 1998. Filed by the City of New York in PSC Case Nos. 96-E-0900, 96-E-0098, 96-E-0099, 96-E-0891, 96-E-0897, 96-E-0909, and 96-E-0898.
“Preliminary Comments of the City of New York on Con Edison’s Generation Divestiture Plan and Petition.” 1998. Filed by the City of New York in PSC Case No. 96-E-0897.
“Maryland Office of People’s Counsel’s Comments in Response to the Applicants’ June 5, 1998 Letter.” 1998. Filed by the Maryland Office of People’s Counsel in PSC Docket No. EC97-46-000.
“Economic Feasibility Analysis and Preliminary Business Plan for a Pennsylvania Consumer’s Energy Cooperative” (with John Plunkett et al.). 1997. 3 vols. Philadelphia, Penn.: Energy Coordinating Agency of Philadelphia.
“Good Money After Bad” (with Charles Komanoff and Rachel Brailove). 1997. White Plains, N.Y.: Pace University School of Law Center for Environmental Studies.
“Maryland Office of People’s Counsel’s Comments on Staff Restructuring Report: Case No. 8738.” 1997. Filed by the Maryland Office of People’s Counsel in PSC Case No. 8738.
“Protest and Request for Hearing of Maryland Office of People’s Counsel.” 1997. Filed by the Maryland Office of People’s Counsel in PSC Docket Nos. EC97-46-000, ER97-4050-000, and ER97-4051-000.
“Restructuring the Electric Utilities of Maryland: Protecting and Advancing Consumer Interests” (with Paul Chernick, Susan Geller, John Plunkett, Roger Colton, Peter Bradford,
Attachment JFW-1

Jonathan F. Wallach Resource Insight, Incorporated Page 4
Bruce Biewald, and David Wise). 1997. Baltimore, Maryland: Maryland Office of People’s Counsel.
“Comments of the New Hampshire Office of Consumer Advocate on Restructuring New Hampshire’s Electric-Utility Industry” (with Bruce Biewald and Paul Chernick). 1996. Concord, N.H.: NH OCA.
“Estimation of Market Value, Stranded Investment, and Restructuring Gains for Major Massachusetts Utilities” (with Paul Chernick, Susan Geller, Rachel Brailove, and Adam Auster). 1996. On behalf of the Massachusetts Attorney General (Boston).
“Report on Entergy’s 1995 Integrated Resource Plan.” 1996. On behalf of the Alliance for Affordable Energy (New Orleans).
“Preliminary Review of Entergy’s 1995 Integrated Resource Plan.” 1995. On behalf of the Alliance for Affordable Energy (New Orleans).
“Comments on NOPSI and LP&L’s Motion to Modify Certain DSM Programs.” 1995. On behalf of the Alliance for Affordable Energy (New Orleans).
“Demand-Side Management Technical Market Potential Progress Report.” 1993. On behalf of the Legal Environmental Assistance Foundation (Tallahassee)
“Technical Information.” 1993. Appendix to “Energy Efficiency Down to Details: A Response to the Director General of Electricity Supply’s Request for Comments on Energy Efficiency Performance Standards” (UK). On behalf of the Foundation for International Environmental Law and Development and the Conservation Law Foundation (Boston).
“Integrating Demand Management into Utility Resource Planning: An Overview.” 1993. Vol. 1 of “From Here to Efficiency: Securing Demand-Management Resources” (with Paul Chernick and John Plunkett). Harrisburg, Pa.:Pennsylvania Energy Office
“Making Efficient Markets.” 1993. Vol. 2 of “From Here to Efficiency: Securing Demand-Management Resources” (with Paul Chernick and John Plunkett). Harrisburg, Pa.: Pennsylvania Energy Office.
“Analysis Findings, Conclusions, and Recommendations.” 1992. Vol. 1 of “Correcting the Imbalance of Power: Report on Integrated Resource Planning for Ontario Hydro” (with Paul Chernick and John Plunkett).
“Demand-Management Programs: Targets and Strategies.” 1992. Vol. 1 of “Building Ontario Hydro’s Conservation Power Plant” (with John Plunkett, James Peters, and Blair Hamilton).
“Review of the Elizabethtown Gas Company’s 1992 DSM Plan and the Demand-Side Management Rules” (with Paul Chernick, John Plunkett, James Peters, Susan Geller, Blair Hamilton, and Andrew Shapiro). 1992. Report to the New Jersey Department of Public Advocate.
“Comments of Public Interest Intervenors on the 1993–1994 Annual and Long-Range Demand-Side Management and Integrated Resource Plans of New York Electric Utilities” (with Ken Keating et al.) 1992.
Attachment JFW-1

Jonathan F. Wallach Resource Insight, Incorporated Page 5
“Review of Jersey Central Power & Light’s 1992 DSM Plan and the Demand-Side Management Rules” (with Paul Chernick et al.). 1992. Report to the New Jersey Department of Public Advocate.
“Review of Rockland Electric Company’s 1992 DSM Plan and the Demand-Side Manage-ment Rules” (with Paul Chernick et al.). 1992.
“Initial Review of Ontario Hydro’s Demand-Supply Plan Update” (with David Argue et al.). 1992.
“Comments on the Utility Responses to Commission’s November 27, 1990 Order and Proposed Revisions to the 1991–1992 Annual and Long Range Demand Side Management Plans” (with John Plunkett et al.). 1991.
“Comments on the 1991–1992 Annual and Long Range Demand-Side-Management Plans of the Major Electric Utilities” (with John Plunkett et al.). Filed in NY PSC Case No. 28223 in re New York utilities’ DSM plans. 1990.
“Profitability Assessment of Packaged Cogeneration Systems in the New York City Area.” 1989. Principal investigator.
“Statistical Analysis of U.S. Nuclear Plant Capacity Factors, Operation and Maintenance Costs, and Capital Additions.” 1989.
“The Economics of Completing and Operating the Vogtle Generating Facility.” 1985. ESRG Study No. 85-51A.
“Generating Plant Operating Performance Standards Report No. 2: Review of Nuclear Plant Capacity Factor Performance and Projections for the Palo Verde Nuclear Generating Facility.” 1985. ESRG Study No. 85-22/2.
“Cost-Benefit Analysis of the Cancellation of Commonwealth Edison Company’s Braidwood Nuclear Generating Station.” 1984. ESRG Study No. 83-87.
“The Economics of Seabrook 1 from the Perspective of the Three Maine Co-owners.” 1984. ESRG Study No. 84-38.
“An Evaluation of the Testimony and Exhibit (RCB-2) of Dr. Robert C. Bushnell Concerning the Capital Cost of Fermi 2.” 1984. ESRG Study No. 84-30.
“Electric Rate Consequences of Cancellation of the Midland Nuclear Power Plant.” 1984. ESRG Study No. 83-81.
“Power Planning in Kentucky: Assessing Issues and Choices—Project Summary Report to the Public Service Commission.” 1984. ESRG Study No. 83-51.
“Electric Rate Consequences of Retiring the Robinson 2 Nuclear Plant.” 1984. ESRG Study No. 83-10.
“Power Planning in Kentucky: Assessing Issues and Choices—Conservation as a Planning Option.” 1983. ESRG Study No. 83-51/TR III.
Attachment JFW-1

Jonathan F. Wallach Resource Insight, Incorporated Page 6
“Electricity and Gas Savings from Expanded Public Service Electric and Gas Company Conservation Programs.” 1983. ESRG Study No. 82-43/2.
“Long Island Without the Shoreham Power Plant: Electricity Cost and System Planning Consequences; Summary of Findings.” 1983. ESRG Study No. 83-14S.
“Long Island Without the Shoreham Power Plant: Electricity Cost and System Planning Consequences; Technical Report B—Shoreham Operations and Costs.” 1983. ESRG Study No. 83-14B.
“Customer Programs to Moderate Demand Growth on the Arizona Public Service Company System: Identifying Additional Cost-Effective Program Options.” 1982. ESRG Study No. 82-14C.
“The Economics of Alternative Space and Water Heating Systems in New Construction in the Jersey Central Power and Light Service Area, A Report to the Public Advocate.” 1982. ESRG Study No. 82-31.
“Review of the Kentucky-American Water Company Capacity Expansion Program, A Report to the Kentucky Public Service Commission.” 1982. ESRG Study No. 82-45.
“Long Range Forecast of Sierra Pacific Power Company Electric Energy Requirements and Peak Demands, A Report to the Public Service Commission of Nevada.” 1982. ESRG Study No. 81-42B.
“Utility Promotion of Residential Customer Conservation, A Report to Massachusetts Public Interest Research Group.” 1981. ESRG Study No. 81-47
PRESENTATIONS
“Office of People’s Counsel Case No. 9117” (with William Fields). Presentation to the Maryland Public Utilities Commission in Case No. 9117, December 2008.
“Electricity Market Design: Incentives for Efficient Bidding, Opportunities for Gaming.” NASUCA Northeast Market Seminar, Albany, N.Y., February 2001.
“Direct Access Implementation: The California Experience.” Presentation to the Maryland Restructuring Technical Implementation Group on behalf of the Maryland Office of People’s Counsel. June 1998.
“Reflecting Market Expectations in Estimates of Stranded Costs,” speaker, and workshop moderator of “Effectively Valuing Assets and Calculating Stranded Costs.” Conference sponsored by International Business Communications, Washington, D.C., June 1997.
Attachment JFW-1

Jonathan F. Wallach Resource Insight, Incorporated Page 7
EXPERT TESTIMONY
1989 Mass. DPU on behalf of the Massachusetts Executive Office of Energy Resources. Docket No. 89-100. Joint testimony with Paul Chernick relating to statistical analysis of U.S. nuclear-plant capacity factors, operation and main-tenance costs, and capital additions; and to projections of capacity factor, O&M, and capital additions for the Pilgrim nuclear plant.
1994 NY PSC on behalf of the Pace Energy Project, Natural Resources Defense Council, and Citizen’s Advisory Panel. Case No. 93-E-1123. Joint testimony with John Plunkett critiques proposed modifications to Long Island Lighting Company’s DSM programs from the perspective of least-cost-planning principles.
1994 Vt. PSB on behalf of the Vermont Department of Public Service. Docket No. 5270-CV-1 and 5270-CV-3. Testimony and rebuttal testimony discusses rate and bill effects from DSM spending and sponsors load shapes for measure- and program-screening analyses.
1996 New Orleans City Council on behalf of the Alliance for Affordable Energy. Docket Nos. UD-92-2A, UD-92-2B, and UD-95-1. Rates, charges, and integrated resource planning for Louisiana Power & Lights and New Orleans Public Service, Inc.
1996 New Orleans City Council Docket Nos. UD-92-2A, UD-92-2B, and UD-95-1. Rates, charges, and integrated resource planning for Louisiana Power & Lights and New Orleans Public Service, Inc.; Alliance for Affordable Energy. April, 1996.
Prudence of utilities’ IRP decisions; costs of utilities’ failure to follow City Council directives; possible cost disallowances and penalties; survey of penalties for similar failures in other jurisdictions.
1998 Massachusetts Department of Telecommunications and Energy Docket No. 97-111, Commonwealth Energy proposed restructuring; Cape Cod Light Compact. Joint testimony with Paul Chernick, January, 1998.
Critique of proposed restructuring plan filed to satisfy requirements of the electric-utility restructuring act of 1997. Failure of the plan to foster competition and promote the public interest.
Massachusetts Department of Telecommunications and Energy Docket No. 97-120, Western Massachusetts Electric Company proposed restructuring; Massachusetts Attorney General. Joint testimony with Paul Chernick, October, 1998. Joint surrebuttal with Paul Chernick, January, 1999.
Market value of the three Millstone nuclear units under varying assumptions of plant performance and market prices. Independent forecast of wholesale market prices. Value of Pilgrim and TMI-1 asset sales.
Attachment JFW-1

Jonathan F. Wallach Resource Insight, Incorporated Page 8
1999 Maryland PSC Case No. 8795, Delmarva Power & Light comprehensive restructuring agreement, Maryland Office of People’s Counsel. July 1999.
Support of proposed comprehensive restructuring settlement agreement
Maryland PSC Case Nos. 8794 and 8808, Baltimore Gas & Electric Company comprehensive restructuring agreement, Maryland Office of People’s Counsel. Initial Testimony July 1999; Reply Testimony August 1999; Surrebuttal Testimony August 1999.
Support of proposed comprehensive restructuring settlement agreement
Maryland PSC Case No. 8797, comprehensive restructuring agreement for Potomac Edison Company, Maryland Office of People’s Counsel. October 1999.
Support of proposed comprehensive restructuring settlement agreement
Connecticut DPUC Docket No. 99-03-35, United Illuminating standard offer, Connecticut Office of Consumer Counsel. November 1999.
Reasonableness of proposed revisions to standard-offer-supply energy costs. Implications of revisions for other elements of proposed settlement.
2000 U.S. FERC Docket No. RT01-02-000, Order No. 2000 compliance filing, Joint Consumer Advocates intervenors. Affidavit, November 2000.
Evaluation of innovative rate proposal by PJM transmission owners.
2001 Maryland PSC Case No. 8852, Charges for electricity-supplier services for Potomac Electric Power Company, Maryland Office of People’s Counsel. March 2001.
Reasonableness of proposed fees for electricity-supplier services.
Maryland PSC Case No. 8890, Merger of Potomac Electric Power Company and Delmarva Power and Light Company, Maryland Office of People’s Counsel. September 2001; surrebuttal, October 2001. In support of settlement: Supple-mental, December 2001; rejoinder, January 2002.
Costs and benefits to ratepayers. Assessment of public interest.
Maryland PSC Case No. 8796, Potomac Electric Power Company stranded costs and rates, Maryland Office of People’s Counsel. December 2001; surrebuttal, February 2002.
Allocation of benefits from sale of generation assets and power-purchase contracts.
2002 Maryland PSC Case No. 8908, Maryland electric utilities’ standard offer and supply procurement, Maryland Office of People’s Counsel. Direct, November 2002; Rebuttal December 2002.
Attachment JFW-1

Jonathan F. Wallach Resource Insight, Incorporated Page 9
Benefits of proposed settlement to ratepayers. Standard-offer service. Procurement of supply.
2003 Maryland PSC Case No. 8980, adequacy of capacity in restructured electricity markets; Maryland Office of People’s Counsel. Direct, December 2003; Reply December 2003.
Purpose of capacity-adequacy requirements. PJM capacity rules and practices. Implications of various restructuring proposals for system reliability.
2004 Maryland PSC Case No. 8995, Potomac Electric Power Company recovery of generation-related uncollectibles; Maryland Office of People’s Counsel. Direct, March 2004; Supplemental March 2004, Surrebuttal April 2004.
Calculation and allocation of costs. Effect on administrative charge pursuant to settlement.
Maryland PSC Case No. 8994, Delmarva Power & Light recovery of generation-related uncollectibles; Maryland Office of People’s Counsel. Direct, March 2004; Supplemental April 2004.
Calculation and allocation of costs. Effect on administrative charge pursuant to settlement.
Maryland PSC Case No. 8985, Southern Maryland Electric Coop standard-offer service; Maryland Office of People’s Counsel. Direct, July 2004.
Reasonableness and risks of resource-procurement plan.
2005 FERC Docket No. ER05-428-000, revisions to ICAP demand curves; City of New York. Statement, March 2005.
Net-revenue offset to cost of new capacity. Winter-summer adjustment factor. Market power and in-City ICAP price trends.
FERC Docket No. PL05-7-000, capacity markets in PJM; Maryland Office of People’s Counsel. Statement, June 2005.
Inefficiencies and risks associated with use of administratively determined demand curve. Incompatibility of four-year procurement plan with Maryland standard-offer service.
FERC Dockets Nos. ER05-1410-000 & EL05-148-000, proposed market-clearing mechanism for capacity markets in PJM; Coalition of Consumers for Reliability, Affidavit October 2005, Supplemental Affidavit October 2006.
Inefficiencies and risks associated with use of administratively determined demand curve. Effect of proposed reliability-pricing model on capacity costs.
2006 Maryland PSC Case No. 9052, Baltimore Gas & Electric rates and market-transition plan; Maryland Office of People’s Counsel, February 2006.
Attachment JFW-1

Jonathan F. Wallach Resource Insight, Incorporated Page 10
Transition to market-based residential rates. Price volatility, bill complexity, and cost-deferral mechanisms.
Maryland PSC Case No. 9056, default service for commercial and industrial customers; Maryland Office of People’s Counsel, April 2006.
Assessment of proposals to modify default service for commercial and industrial customers.
Maryland PSC Case No. 9054, merger of Constellation Energy Group and FPL Group; Maryland Office of People’s Counsel, June 2006.
Assessment of effects and risks of proposed merger on ratepayers.
Illinois Commerce Commission Docket No. 06-0411, Commonwealth Edison Company residential rate plan; Citizens Utility Board, Cook County State’s Attorney’s Office, and City of Chicago, Direct July 2006, Reply August 2006.
Transition to market-based rates. Securitization of power costs. Rate of return on deferred assets.
Maryland PSC Case No. 9064, default service for residential and small commercial customers; Maryland Office of People’s Counsel, Rebuttal Testimony, September 2006.
Procurement of standard-offer power. Structure and format of bidding. Risk and cost recovery.
FERC Dockets Nos. ER05-1410-000 & EL05-148-000, proposed market-clearing mechanism for capacity markets in PJM; Maryland Office of the People’s Counsel, Supplemental Affidavit October 2006.
Distorting effects of proposed reliability-pricing model on clearing prices. Economically efficient alternative treatment.
Maryland PSC Case No. 9063, optimal structure of electric industry; Maryland Office of People’s Counsel, Direct Testimony, October 2006; Rebuttal November 2006; surrebuttal November 2006.
Procurement of standard-offer power. Risk and gas-price volatility, and their effect on prices and market performance. Alternative procurement strategies.
Maryland PSC Case No. 9073, stranded costs from electric-industry restructuring; Maryland Office of People’s Counsel, Direct Testimony, December 2006.
Review of estimates of stranded costs for Baltimore Gas & Electric.
2007 Maryland PSC Case No. 9091, rate-stabilization and market-transition plan for the Potomac Edison Company; Maryland Office of People’s Counsel, Direct Testimony, March 2007.
Attachment JFW-1

Jonathan F. Wallach Resource Insight, Incorporated Page 11
Rate-stabilization plan.
Maryland PSC Case No. 9092, rates and rate mechanisms for the Potomac Electric Power Company; Maryland Office of People’s Counsel, Direct Testimony, March 2007.
Cost allocation and rate design. Revenue decoupling mechanism.
Maryland PSC Case No. 9093, rates and rate mechanisms for Delmarva Power & Light; Maryland Office of People’s Counsel, Direct Testimony, March 2007.
Cost allocation and rate design. Revenue decoupling mechanism.
Maryland PSC Case No. 9099, rate-stabilization plan for Baltimore Gas & Electric; Maryland Office of People’s Counsel, Direct, March 2007; Surrebuttal April 2007.
Review of standard-offer-service-procurement plan. Rate stabilization plan.
Connecticut DPUC Docket No. 07-04-24, review of capacity contracts under Energy Independence Act; Connecticut Office of Consumer Counsel, Joint Direct Testimony June 2007.
Assessment of proposed capacity contracts.
Maryland PSC Case No. 9117, residential and small-commercial standard-offer service; Maryland Office of People’s Counsel. Direct and Reply, September 2007; Supplemental Reply, November 2007; Additional Reply, December 2007; presentation, December 2008.
Benefits of long-term planning and procurement. Proposed aggregation of customers.
Maryland PSC Case No. 9117, Phase II, residential and small-commercial standard-offer service; Maryland Office of People’s Counsel. Direct, October 2007.
Energy efficiency as part of standard-offer-service planning and procurement. Procurement of generation or long-term contracts to meet reliability needs.
2008 Connecticut DPUC 08-01-01, peaking generation projects; Connecticut Office of Consumer Counsel. Direct (with Paul Chernick), April 2008.
Assessment of proposed peaking projects. Valuation of peaking capacity. Modeling of energy margin, forward reserves, other project benefits.
Ontario EB-2007-0707, Ontario Power Authority integrated system plan; Green Energy Coalition, Penimba Institute, and Ontario Sustainable Energy Association. Evidence (with Paul Chernick and Richard Mazzini), August 2008.
Critique of integrated system plan. Resource cost and characteristics; finance cost. Development of least-cost green-energy portfolio.
Attachment JFW-1

Jonathan F. Wallach Resource Insight, Incorporated Page 12
2009 Maryland PSC Case No. 9192, Delmarva Power & Lights rates; Maryland Office of People’s Counsel. Direct, August 2009; Rebuttal, Surrebuttal, September 2009.
Cost allocation and rate design.
Wisconsin PSC Docket No. 6630-CE-302, Glacier Hills Wind Park certificate; Citizens Utility Board of Wisconsin. Direct and Surrebuttal, October 2009.
Reasonableness of proposed wind facility.
PUC of Ohio Case No 09-906-EL-SSO, standard-service-offer bidding for three Ohio electric companies; Office of the Ohio Consumers’ Counsel. Direct, Decem-ber 2009.
Design of auctions for SSO power supply. Implications of migration of First-Energy from MISO to PJM.
2010 PUC of Ohio Case No 10-388-EL-SSO, standard-service offer for three Ohio electric companies; Office of the Ohio Consumers’ Counsel. Direct, July 2010.
Design of auctions for SSO power supply.
Maryland PSC Case No. 9232, Potomac Electric Power Co. administrative charge for standard-offer service; Maryland Office of People’s Counsel. Reply, Rebuttal, August 2010.
Proposed rates for components of the Administrative Charge for residential standard-offer service.
Maryland PSC Case No. 9226, Delmarva Power & Light administrative charge for standard-offer service; Maryland Office of People’s Counsel. Reply, Rebuttal, August 2010.
Proposed rates for components of the Administrative Charge for residential standard-offer service.
Maryland PSC Case No. 9221, Baltimore Gas & Electric cost recovery; Maryland Office of People’s Counsel. Reply, August 2010; Rebuttal, September 2010; Surrebuttal, November 2010
Proposed rates for components of the Administrative Charge for residential standard-offer service.
Wisconsin PSC Docket No. 3270-UR-117, Madison Gas & Electric gas and electric rates; Citizens Utility Board of Wisconsin. Direct, Rebuttal, Surrebuttal, September 2010.
Standby rate design. Treatment of uneconomic dispatch costs.
Attachment JFW-1
Jonathan F. Wallach Resource Insight, Incorporated Page 13
Nova Scotia UARB Case No. NSUARB P-887(2), fuel-adjustment mechanism; Nova Scotia Consumer Advocate. Direct, September 2010.
Effectiveness of fuel-adjustment incentive mechanism.
Manitoba PUB, Manitoba Hydro rates; Resource Conservation Manitoba and Time to Respect Earth’s Ecosystems. Direct, December 2010.
Assessment of drought-related financial risk.
2011 Mass. DPU 10-170, NStar–Northeast Utilities merger; Cape Light Compact. Direct, May 2011.
Merger and competitive markets. Competitively neutral recovery of utility investments in new generation.
Mass. DPU 11-5, -6, -7, NStar wind contracts; Cape Light Compact. Direct, May 2011.
Assessment of utility proposal for recovery of contract costs.
Wisc. PSC Docket No. 4220-UR-117, electric and gas rates of Northern States Power: Citizens Utility Board of Wisconsin. Direct, Rebuttals (2) October 2011; Surrebuttal, Oral Sur-Surrebutal November 2011;
Cost allocation and rate design. Allocation of DOE settlement payment.
Wisc. PSC Docket No. 6680-FR-104, fuel-cost-related rate adjustments for Wisconsin Power and Light Company: Citizens Utility Board of Wisconsin. Direct, October 2011; Rebuttal, Surrebuttal, November 2011
Costs to comply with Cross State Air Pollution Rule.
2012 Maryland PSC Case No. 9149, Maryland IOUs’ development of RFPs for new generation; Maryland Office of People’s Counsel. March 2012.
Failure of demand-response provider to perform per contract. Estimation of cost to ratepayers.
PUCO Case Nos. 11-346-EL-SSO, 11-348-EL-SSO, 11-349-EL-AAM, 11-350-EL-AAM, transition to competitive markets for Columbus Southern Power Company and Ohio Power Company; Ohio Consumers’ Counsel. May 2012
Structure of auctions, credits, and capacity pricing as part of transition to com-petitive electricity markets.
Wisconsin PSC Docket No. 3270-UR-118, Madison Gas & Electric rates, Wisconsin Citizens Utility Board. Direct, August 2012; Rebuttal, September 2012.
Cost allocation and rate design (electric).
Attachment JFW-1
Jonathan F. Wallach Resource Insight, Incorporated Page 14
Wisconsin PSC Docket No. 05-UR-106, We Energies rates, Wisconsin Citizens Utility Board. Direct, Rebuttal, September 2012.
Cost allocation and rate design (electric).
Wisconsin PSC Docket No. 4220-UR-118, Northern States Power rates, Wisconsin Citizens Utility Board. Direct, Rebuttal, October 2012; Surrebuttal, November 2012.
Recovery of environmental remediation costs at a manufactured gas plant. Cost allocation and rate design.
2013 Corporation Commission of Oklahoma Cause No. PUD 201200054, Public Service Company of Oklahoma environmental compliance and cost recovery, Sierra Club. Direct, January 2013; rebuttal, February 2013; surrebuttal, March 2013.
Economic evaluation of alternative environmental-compliance plans. Effects of energy efficiency and renewable resources on cost and risk.
Maryland PSC Case No. 9324, Starion Energy marketing, Maryland Office of People’s Counsel. September 2013.
Estimation of retail costs of electricity supply.
Wisconsin PSC Docket No. 6690-UR-122, Wisconsin Public Service Corpora-tion gas and electric rates, Wisconsin Citizens Utility Board. Direct, August 2013; Rebuttal, Surrebuttal September 2013.
Cost allocation and rate design; rate-stabilization mechanism.
Wisconsin PSC Docket No. 4220-UR-119, Northern States Power Company gas and electric rates, Wisconsin Citizens Utility Board. Direct, Rebuttal, Surrebuttal, October 2013.
Cost allocation and rate design.
Michigan PSC Case No. U-17429, Consumers Energy Company approval for new gas plant, Natural Resources Defense Council. Corrected Direct, October 2013.
Need for new capacity. Economic assessment of alternative resource options.
2014 Maryland PSC Case Nos. 9226 & 9232, administrative charge for standard-offer service; Maryland Office of People’s Counsel. Reply, April 2014; surrebuttal, May 2014.
Proposed rates for components of the Administrative Charge for residential standard-offer service.
Conn. PURA Docket No. 13-07-18, rules for retail electricity markets; Office of Consumer Counsel. Direct, April 2014.
Attachment JFW-1

Jonathan F. Wallach Resource Insight, Incorporated Page 15
Estimation of retail costs of power supply for residential standard-offer service.
PUC Ohio Case Nos. 13-2385-EL-SSO, 13-2386-EL-AAM; Ohio Power Company standard-offer service; Office of the Ohio Consumers’ Counsel. Direct, May 2014.
Allocation of distribution-rider costs.
Wisc. PSC Docket No. 6690-UR-123, Wisconsin Public Service Corporation electric and gas rates; Citizens Utility Board of Wisconsin. Direct, Rebuttal, August 2014; Surrebuttal, September 2014.
Cost allocation and rate design.
Wisc. PSC Docket No. 05-UR-107, We Energy biennial review of electric and gas costs and rates; Citizens Utility Board of Wisconsin. Direct, August 2014; Rebuttal, Surrebuttal September 2014.
Cost allocation and rate design.
Wisc. PSC Docket No. 3270-UR-120, Madison Gas and Electric Co. electric and gas rates; Citizens Utility Board of Wisconsin. Direct, Rebuttal, September 2014.
Cost allocation and rate design.
Nova Scotia UARB Case No. NSUARB P-887(6), Nova Scotia Power fuel-adjustment mechanism; Nova Scotia Consumer Advocate. Evidence, December 2014.
Allocation of fuel-adjustment costs.
2015 Maryland PSC Case No. 9221, Baltimore Gas & Electric cost recovery; Maryland Office of People’s Counsel. Second Reply, June 2015; Second Rebuttal, July 2015.
Proposed rates for components of the Administrative Charge for residential standard-offer service.
Wisconsin PSC Docket No. 6690-UR-124, Wisconsin Public Service Corporation electric and gas rates; Citizens Utility Board of Wisconsin. Direct, Rebuttal, September 2015; Surrebuttal, October 2015.
Cost allocation and rate design.
Wisconsin PSC Docket No. 4220-UR-121, Northern States Power Company gas and electric rates; Citizens Utility Board of Wisconsin. Direct, Rebuttal, Surrebuttal, October 2015.
Cost allocation and rate design.
Attachment JFW-1

Jonathan F. Wallach Resource Insight, Incorporated Page 16
Maryland PSC Cases Nos. 9226 & 9232, administrative charge for standard-offer service; Maryland Office of People’s Counsel. Third Reply, September 2015; Third Rebuttal, October 2015.
Proposed rates for components of the Administrative Charge for residential standard-offer service.
Nova Scotia UARB Case No. NSUARB P-887(7), Nova Scotia Power fuel-adjustment mechanism; Nova Scotia Consumer Advocate. Evidence, December 2015.
Accounting adjustment for estimated over-earnings. Proposal for modifying procedures for setting the Actual Adjustment.
2016 Maryland PSC Case No. 9406, Baltimore Gas & Electric base rate case; Maryland Office of People’s Counsel. Direct, February 2016; Rebuttal, March 2016; Surrebuttal, March 2016.
Allocation of Smart Grid costs. Recovery of conduit fees. Rate design.
Nova Scotia UARB Case No. NSUARB P-887(16), Nova Scotia Power 2017-2019 Fuel Stability Plan; Nova Scotia Consumer Advocate. Direct, May 2016; Reply, June 2016.
Base Cost of Fuel forecast. Allocation of Maritime Link capital costs. Fuel cost hedging plan.
Wisconsin PSC Docket No. 3270-UR-121, Madison Gas and Electric Company electric and gas rates; Citizens Utility Board of Wisconsin. Direct, August 2016; Rebuttal, Surrebuttal, September 2016.
Cost allocation and rate design.
Wisconsin PSC Docket No. 6680-UR-120, Wisconsin Power and Light Company electric and gas rates; Citizens Utility Board of Wisconsin. Direct, Rebuttal, Surrebuttal, Sur-surrebuttal, September 2016.
Cost allocation and rate design.
Minnesota PSC Docket No. E002/GR-15-826, Northern States Power Company electric rates; Clean Energy Organizations. Direct, June 2016; Rebuttal, September 2016; Surrebuttal, October 2016.
Cost basis for residential customer charges.
Nova Scotia UARB Case No. NSUARB M07611, Nova Scotia Power 2016 fuel adjustment mechanism audit; Nova Scotia Consumer Advocate. Direct, November 2016.
Sanctions for imprudent fuel-contracting practices.
Attachment JFW-1

Jonathan F. Wallach Resource Insight, Incorporated Page 17
2017 Kentucky PSC Case No. 2016-00370, Kentucky Utilities Company electric rates; Sierra Club. Direct, March 2017.
Cost basis for residential customer charges. Design of residential energy charges.
Kentucky PSC Case No. 2016-00371, Louisville Gas & Electric Company electric rates; Sierra Club. Direct, March 2017.
Cost basis for residential customer charges. Design of residential energy charges.
Massachusetts DPU 17-05, Eversource Energy electric rates; Cape Light Compact. Direct, April 2017; Supplemental Direct, Surrebuttal, August 2017.
Cost Allocation. Cost basis for residential customer charges. Demand charges for net metering customers.
Michigan PSC Case No. U-18255, DTE Electric Company electric rates; Natural Resources Defense Council, Michigan Environmental Council, and Sierra Club. Direct, August 2017.
Cost basis for residential customer charges.
North Carolina NCUC Docket No. E-2, Sub 1142, Duke Energy Progress electric rates; North Carolina Justice Center, North Carolina Housing Coalition, Natural Resources Defense Council, and Southern Alliance for Clean Energy. Direct, October 2017.
Cost basis for residential customer charges.
Indiana Utility Regulatory Commission Cause No. 44967, Indiana Michigan Power Company electric rates; Citizens Action Coalition of Indiana, Indiana Coalition for Human Services, Indiana Community Action Association, and Sierra Club. Direct, November 2017.
Cost basis for residential customer charges.
2018 North Carolina NCUC Docket No. E-7, Sub 1146, Duke Energy Carolinas electric rates; North Carolina Justice Center, North Carolina Housing Coalition, Natural Resources Defense Council, and Southern Alliance for Clean Energy. Direct, January 2018.
Cost basis for residential customer charges.
PUC Ohio Case Nos. 15-1830-EL-AIR, 15-1831-EL-AAM, 15-1832-EL-ATA; Dayton Power and Light Company electric rates; Natural Resources Defense Council. Direct, April 2018.
Cost basis for residential customer charges.
Attachment JFW-1

ATTACHMENT JFW-2

Attachment JFW-2Page 1 of 2
Residential Bill Impacts
RS Customers
Rates
Including Fuel Including Fuel & DSM Including Fuel Including Fuel & DSM
Energy ChargeCurrent
Rate
Proposed
Rate
Current
Rate
Proposed
Rate
Current
Rate
Cost-Based
RateCurrent Rate
Cost-Based
RateFirst 500 kWh 0.103895$ 0.105322$ 0.106422$ 0.107849$ 0.103895$ 0.123741$ 0.106422$ 0.126268$ Over 500 kWh 500 0.082960$ 0.084387$ 0.085487$ 0.086914$ 0.082960$ 0.102806$ 0.085487$ 0.105333$
Customer Charge
0 to 325 kWh 11.25$ 16.00$ 11.25$ 16.00$ 11.25$ 8.15$ 11.25$ 8.15$
Over 325 kWh 325 17.00$ 27.00$ 17.00$ 27.00$ 17.00$ 8.15$ 17.00$ 8.15$
DSM Charge ($/kWh) 0.002527$
Bill Impacts for RS Customers
Line
No. Monthly kWh
% of
Customers
Present
Rates
Proposed
Rates Amount Percent
Proposed
¢ / kWh
Present
Rates
Cost-Based
Rates Amount Percent
Proposed
¢ / kWh
(A) (B) (C) (D) (E) (F) (G) (H) (I) (J) (K) (L)
1 100 4.37% 21.89$ 26.78$ 4.89$ 22.34% 0.26780 21.89$ 20.78$ (1.11)$ -5.07% 0.20780
2 200 4.54% 32.53 37.57 5.04 15.49% 0.18785 32.53 33.40 0.87 2.67% 0.16700
3 400 15.72% 59.57 70.14 10.57 17.74% 0.17535 59.57 58.66 (0.91) -1.53% 0.14665
4 600 20.10% 78.76 89.61 10.85 13.78% 0.14935 78.76 81.81 3.05 3.87% 0.13635
5 800 18.25% 95.86 106.99 11.13 11.61% 0.13374 95.86 102.88 7.02 7.32% 0.12860
6 1,000 13.62% 112.95 124.38 11.43 10.12% 0.12438 112.95 123.95 11.00 9.74% 0.12395
7 1,200 8.80% 130.05 141.76 11.71 9.00% 0.11813 130.05 145.01 14.96 11.50% 0.12084
8 1,500 7.40% 155.70 167.83 12.13 7.79% 0.11189 155.70 176.61 20.91 13.43% 0.11774
9 1,800 3.54% 181.34 193.91 12.57 6.93% 0.10773 181.34 208.21 26.87 14.82% 0.11567
10 2,000 1.25% 198.44 211.29 12.85 6.48% 0.10565 198.44 229.28 30.84 15.54% 0.11464
11 2,400 1.24% 232.64 246.06 13.42 5.77% 0.10253 232.64 271.41 38.77 16.67% 0.11309
12 2,700 0.44% 258.28 272.13 13.85 5.36% 0.10079 258.28 303.01 44.73 17.32% 0.11223
13 3,000 0.25% 283.93 298.21 14.28 5.03% 0.09940 283.93 334.61 50.68 17.85% 0.11154
14 4,000 0.31% 369.41 385.12 15.71 4.25% 0.09628 369.41 439.95 70.54 19.10% 0.10999
15 5,000 0.09% 454.90 472.03 17.13 3.77% 0.09441 454.90 545.28 90.38 19.87% 0.10906
16 7,000 0.05% 625.88 645.86 19.98 3.19% 0.09227 625.88 755.95 130.07 20.78% 0.10799
17 >7,000 0.03%
Average
18 749 91.49 102.56 11.07 12.10% 0.13693 91.49 97.51 6.02 6.58% 0.13019
Rates with IPL Proposed Customer Charge Rates with Cost-Based Customer Charge
Monthly Bill Increase / <Decrease> Monthly Bill Increase / <Decrease>

Attachment JFW-2Page 2 of 2
Residential Bill Impacts
RH/RC Customers
Rates
Including Fuel Including Fuel & DSM Including Fuel Including Fuel & DSM
Energy ChargeCurrent
Rate
Proposed
RateCurrent Rate
Proposed
Rate
Current
Rate
Cost-Based
RateCurrent Rate
Cost-Based
RateFirst 500 kWh 0.103895$ 0.105322$ 0.106422$ 0.107849$ 0.103895$ 0.123741$ 0.106422$ 0.126268$
Over 500 kWh 500 0.082960$ 0.084387$ 0.085487$ 0.086914$ 0.082960$ 0.102806$ 0.085487$ 0.105333$
Over 1,000 1000 0.070357$ 0.071784$ 0.072884$ 0.074311$ 0.070357$ 0.090203$ 0.072884$ 0.092730$
Customer Charge
0 to 325 kWh 11.25$ 16.00$ 11.25$ 16.00$ 11.25$ 8.15$ 11.25$ 8.15$
Over 325 kWh 325 17.00$ 27.00$ 17.00$ 27.00$ 17.00$ 8.15$ 17.00$ 8.15$
DSM Charge ($/kWh) 0.002527$
Bill Impacts for RH/RC Customers
Line
No. Monthly kWh
% of
Customers
Present
Rates
Proposed
Rates Amount Percent
Proposed
¢ / kWh
Present
Rates
Cost-Based
Rates Amount Percent
Proposed
¢ / kWh
(A) (B) (C) (D) (E) (F) (G) (H) (I) (J) (K) (L)
1 100 2.71% 21.89$ 26.78$ 4.89$ 22.34% 0.26780 21.89$ 20.78$ (1.11)$ -5.07% 0.20780
2 200 2.84% 32.53 37.57 5.04 15.49% 0.18785 32.53 33.40 0.87 2.67% 0.16700
3 400 7.61% 59.57 70.14 10.57 17.74% 0.17535 59.57 58.66 (0.91) -1.53% 0.14665
4 600 11.32% 78.76 89.61 10.85 13.78% 0.14935 78.76 81.81 3.05 3.87% 0.13635
5 800 12.89% 95.86 106.99 11.13 11.61% 0.13374 95.86 102.88 7.02 7.32% 0.12860
6 1,000 12.22% 112.95 124.38 11.43 10.12% 0.12438 112.95 123.95 11.00 9.74% 0.12395
7 1,200 10.93% 127.53 139.24 11.71 9.18% 0.11603 127.53 142.50 14.97 11.74% 0.11875
8 1,500 13.54% 149.39 161.54 12.15 8.13% 0.10769 149.39 170.32 20.93 14.01% 0.11355
9 1,800 10.13% 171.26 183.83 12.57 7.34% 0.10213 171.26 198.13 26.87 15.69% 0.11007
10 2,000 4.65% 185.83 198.69 12.86 6.92% 0.09935 185.83 216.68 30.85 16.60% 0.10834
11 2,400 5.80% 214.99 228.42 13.43 6.25% 0.09518 214.99 253.77 38.78 18.04% 0.10574
12 2,700 2.22% 236.85 250.71 13.86 5.85% 0.09286 236.85 281.59 44.74 18.89% 0.10429
13 3,000 1.25% 258.72 273.00 14.28 5.52% 0.09100 258.72 309.41 50.69 19.59% 0.10314
14 4,000 1.42% 331.60 347.31 15.71 4.74% 0.08683 331.60 402.14 70.54 21.27% 0.10054
15 5,000 0.29% 404.49 421.62 17.13 4.23% 0.08432 404.49 494.87 90.38 22.34% 0.09897
16 7,000 0.13% 550.25 570.25 20.00 3.63% 0.08146 550.25 680.33 130.08 23.64% 0.09719
17 >7,000 0.06%
Average
18 1,134 122.73 134.35 11.62 9.47% 0.11845 122.73 136.39 13.66 11.13% 0.12025
Rates with IPL Proposed Customer Charge Rates with Cost-Based Customer Charge
Monthly Bill Increase / <Decrease> Monthly Bill Increase / <Decrease>

ATTACHMENT JFW-3

Works Cited
Acton, Jan, Bridger Mitchell, and Ragnhill Mowill. 1976. “Residential Demand for Electricity in Los Angeles: An Econometric Study of Disaggregate Data” Rand Report R-1899-NSF, Rand Corporation: Santa Monica, Cal., 1976. www.prgs.edu/content/dam/rand/pubs/reports/2008/R1899.pdf.
Barnes, Roberta, Robert Gillingham, and Robert Hagemann. 1981. “The Short-Run Residential Demand for Electricity” Review of Economics and Statistics 63(Nov. 1981):4 at 541–552; www.jstor.org/discover/10.2307/1935850
Espey, James, and Molly Espey. 2004. “Turning on the Lights: A Meta-Analysis of Residential Electricity Demand Elasticities” Journal of Agricultural and Applied Economics 36 (1), 65–81.
Henson, Steven. 1984. “Electricity Demand Estimates under Increasing-Block Rates” Southern Economic Journal 51(July 1984): 1 at 147–156. www.jstor.org/discover/10.2307/1058328
McFadden, Daniel, Carlos Puig, and Daniel Kirshner. 1977. “Determinants of the Long- Run Demand for Electricity,” Proceedings of the Business and Economic Statistics Section, American Statistical Association, 1977at 109–119. eml.berkeley.edu/reprints/mcfadden/7_2.pdf
Orans, Ren, Michael Li, Jenya Kahn-Lang, and Chi-Keung Woo. 2014. “Are Residential Customers Price-Responsive to an Inclining Block Rate? Evidence from British Columbia, Canada” Electricity Journal 27(1) 85–92. www.sciencedirect.com/science/article/pii/S1040619013002935
Reiss, Peter, and Matthew White. 2005 “Household Electricity Demand, Revisited” Review of Economic Studies 72:853–883. web.stanford.edu/~preiss/demand.pdf
Xcel Energy. 2012. “Impact Analysis of Residential Two Tier, Inverted Block Rates” 11/05/2012. Minneapolis: Xcel Energy. www.dora.state.co.us/pls/efi/efi_p2_v2_demo.show_document?p_dms_document_i d=190806.
Attachment JFW-3
Page 1 of 1

ATTACHMENT JFW-4

Attachment JFW-4
Page 1 of 7

Attachment JFW-4
Page 2 of 7

Attachment JFW-4
Page 3 of 7

Attachment JFW-4
Page 4 of 7

Attachment JFW-4
Page 5 of 7

Attachment JFW-4
Page 6 of 7

Attachment JFW-4
Page 7 of 7

ATTACHMENT JFW-5

A Manual Prepared by the NARUC Staff Subcommittee on Rate DesignNovember 2016
DISTRIBUTED ENERGY RESOURCES RATE DESIGN AND COMPENSATION
Attachment JFW-5
Page 1 of 4
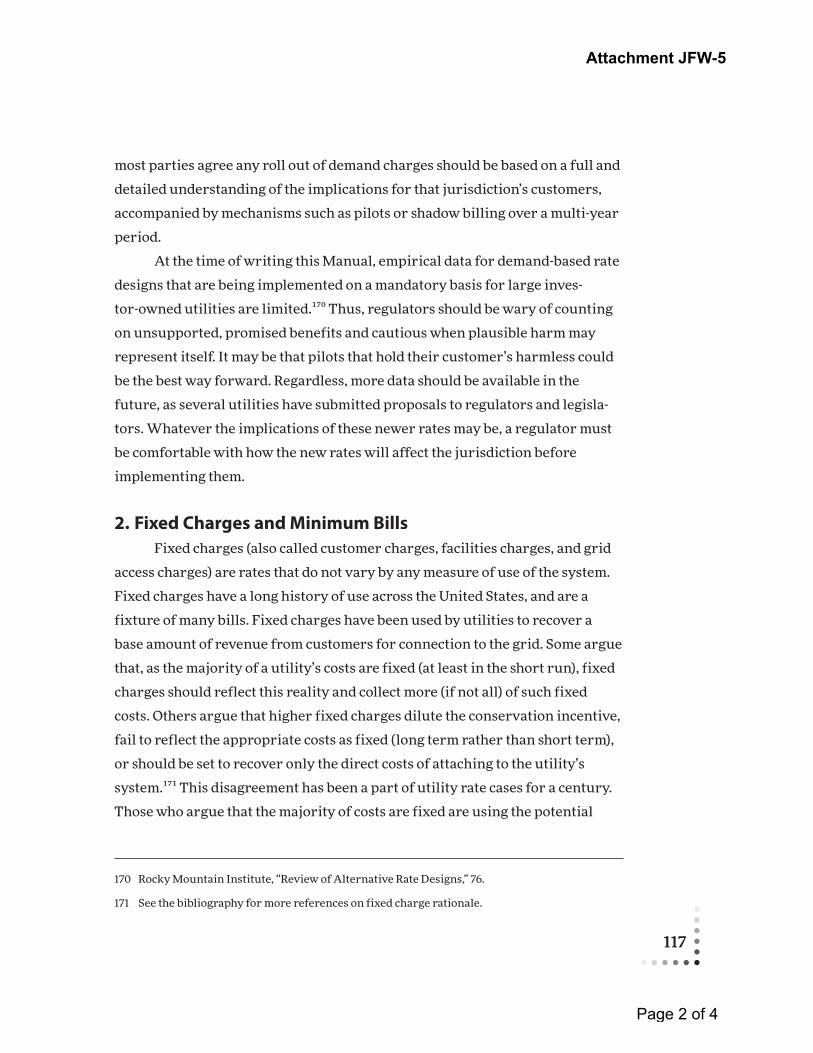
117
most parties agree any roll out of demand charges should be based on a full and
detailed understanding of the implications for that jurisdiction’s customers,
accompanied by mechanisms such as pilots or shadow billing over a multi-year
period.
At the time of writing this Manual, empirical data for demand-based rate
designs that are being implemented on a mandatory basis for large inves-
tor-owned utilities are limited.¹⁷⁰ Thus, regulators should be wary of counting
on unsupported, promised benefits and cautious when plausible harm may
represent itself. It may be that pilots that hold their customer’s harmless could
be the best way forward. Regardless, more data should be available in the
future, as several utilities have submitted proposals to regulators and legisla-
tors. Whatever the implications of these newer rates may be, a regulator must
be comfortable with how the new rates will affect the jurisdiction before
implementing them.
2. Fixed Charges and Minimum BillsFixed charges (also called customer charges, facilities charges, and grid
access charges) are rates that do not vary by any measure of use of the system.
Fixed charges have a long history of use across the United States, and are a
fixture of many bills. Fixed charges have been used by utilities to recover a
base amount of revenue from customers for connection to the grid. Some argue
that, as the majority of a utility’s costs are fixed (at least in the short run), fixed
charges should reflect this reality and collect more (if not all) of such fixed
costs. Others argue that higher fixed charges dilute the conservation incentive,
fail to reflect the appropriate costs as fixed (long term rather than short term),
or should be set to recover only the direct costs of attaching to the utility’s
system.¹⁷¹ This disagreement has been a part of utility rate cases for a century.
Those who argue that the majority of costs are fixed are using the potential
170 Rocky Mountain Institute, “Review of Alternative Rate Designs,” 76.
171 See the bibliography for more references on fixed charge rationale.
Attachment JFW-5
Page 2 of 4

118
increasing cost shift of what they view as fixed costs from DER customers to
other customers as an extension of previous justifications for fixed-charge
increases.¹⁷²
Higher fixed charges accomplish the goal of revenue stability for the
utility and, depending on the degree to which one agrees that utility costs are
fixed, match costs to causation. However, the interplay between collecting more
costs through a fixed charge and the volumetric rate may result in uneconomic
or inefficient price signals. Indeed, an increase in fixed charges should come
with an associated reduction in the volumetric rate. Lowering the volumetric
charge changes the price signal sent to a customer, and may result in more
usage than is efficient. This increased usage can lead to additional investments
by the utility, compounding the issue.¹⁷³
This potentiality also highlights the disconnect between costs and their
causation that a higher fixed charge may have. If higher usage leads to in-
creased investment, then it may be appropriate for the volumetric rate to
reflect the costs that will be necessary to serve it, which would point toward the
appropriateness of a lower fixed charge. In other words, it may be more reason-
able to lower the fixed costs and increase the volumetric rate, which would send
a more efficient price signal.
A related movement is the adoption of a minimum bill component.
California, which does not have a fixed charge component for residential
customer bills, adopted a minimum bill component to offset concerns raised by
its regulated utilities regarding the under-collection of revenue due to custom-
ers avoiding the costs of their entire electric bill and not having a balance owed
to the utility at the end of the month.¹⁷⁴ In other words, some NEM customers in
172 For details on fixed charge proposals and decisions across the country, see NC Clean Energy Technology Center’s The 50 States of Solar Report (https://nccleantech.ncsu.edu/?s=50+states+ of+solar&x=0&y=0), which is updated quarterly.
173 Synapse Energy Economics Inc., “Caught in a Fix: The Problem with Fixed Charges for Electricity” (Synapse Energy Economics Inc., Cambridge, MA, February 9, 2016), 18.
174 Order Instituting Rulemaking on the Commission’s Own Motion to Conduct a Comprehensive Examination of Investor Owned Electric Utilities’ Residential Rate Structures, the Transition to Time Varying and Dynamic Rates, and Other Statutory Obligations, “Decision on Residential
Attachment JFW-5
Page 3 of 4

119
California were able to zero out the entirety of their bill, and avoid paying the
distribution utility any grid costs.¹⁷⁵ In a decision revamping its rate design, the
California Public Utilities Commission (PUC) adopted a minimum bill compo-
nent, which ensures that all customers pay some amount to the utility for
service. The California PUC set a minimum bill amount at $10, which is col-
lected from customers that have bills under $10. In April 2016, Massachusetts
passed the Solar Energy Act (MA Solar Act).¹⁷⁶ The MA Solar Act allows distri-
bution companies to submit to the DPU proposals for a monthly minimum
reliability contribution to be included on electric bills for distribution utility
accounts that receive net metering credits. Proposals shall be filed in a base
rate case or a revenue-neutral rate design filing and supported by cost of
service data. On the other hand, minimum bills eliminate the conservation
signal by encouraging consumption up to the minimum bill amount.¹⁷⁷
In either event, distribution utilities often dispute which components
are fixed and should be recovered from customers in a fixed charge or mini-
mum bill. As discussed previously, there is a great deal of disagreement as to
what constitutes a fixed cost. Are overhead costs fixed? What portion of the
distribution system is fixed?¹⁷⁸ Understanding and identifying fixed costs is a
key component to determining compensation to DER, revenue recovery for the
utility, and how to best balance utility financial health and the growth of DER.
Rate Reform for Pacific Gas and Electric Company, Southern California Edison Company, and San Diego Gas & Electric Company and Transition to Time-of-Use Rates,” D.15-07-001, California Public Utilities Commission (July 13, 2015).
175 Due to the structure of NEM at the time, those customers also avoided paying “non-bypassable charges,” which included components like nuclear decommissioning costs and public purpose charges, which are used to fund energy efficiency programs in California. Subsequent changes to the NEM program have changed this situation.
176 Act Relative to Solar Energy. (2016, April 11). 2016 Mass. Acts, Chapter 75.
177 Lazar and Gonzalez, “Smart Rate Design.” See also Lisa Wood et al., Recovery of Utility Fixed Costs: Utility, Consumer, Environmental and Economist Perspectives, Future Electric Utility Regulation, Report No. 5 (Berkeley, CA: Lawrence Berkeley National Laboratory, June 2016), 58–59; Borenstein, “Economics of Fixed Cost Recovery,” 14–15.
178 See, e.g., the discussion of the minimum system and zero-intercept methods of cost allocation in NARUC, Electric Utility Cost Allocation Manual, 136–42.
Attachment JFW-5
Page 4 of 4

ATTACHMENT JFW-6

Principles of Public Utiliity Rates by James C. Bonbright
Reprinted by permission
© 2005 Powell Goldstein LLP, All Rights Reserved.
Attachment JFW-6
Page 1 of 4

Attachment JFW-6
Page 2 of 4
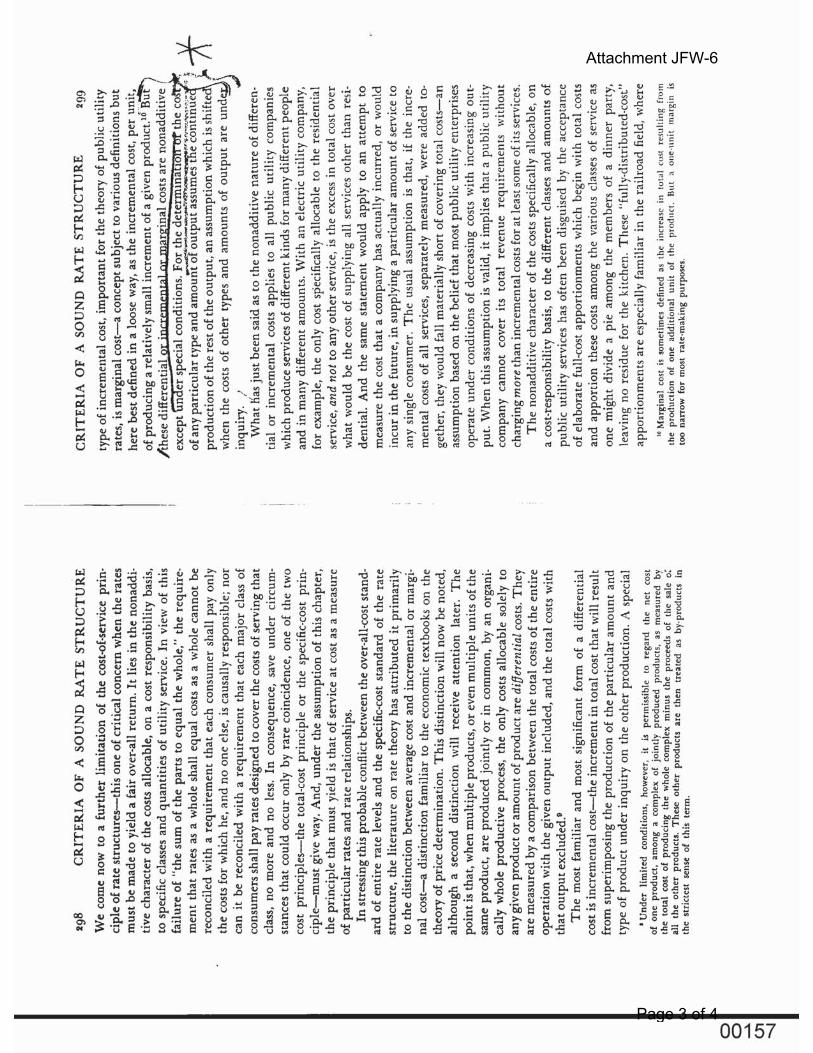
Attachment JFW-6
Page 3 of 4

Attachment JFW-6
Page 4 of 4

ATTACHMENT JFW-7

The Economics of Regulation Principles and Institutions
Volume I Economic Pr inciples Volume II Ins t i tu t ional I ssues
Alfred E. Kahn
The MIT Press Cambridge, Massachusetts
London, England
Attachment JFW-7
Page 1 of 3

Second Printing, 1989
© 1988 Massachusetts Institute of Technology
First published in two volumes in 1970—1971 under the title The Economics of Regulation: Principles and Institutions (volume I: Economic Principles, 1970; volume II: Institutional Issues, 1971) by John Wiley & Sons Inc., New York, copyright © 1970 and 1971 John Wiley & Sons Inc.
This book was printed and bound in the United States of America.
Library of Congress Cataloging-in-Publication Data
Kahn, Alfred E. (Alfred Edward) The economics of regulation.
Bibliography: p. Includes index. Contents: v. 1. Economic principles—v. 2. Institu
tional issues. 1. Industry and state—United States. 2. Trade regu
lation—United States. 3. Monopolies—United States. I. Title. HD3616.U47K28 1988 338.973 87-32484 ISBN 0-262-11129-2 ISBN 0-262-61052-3 (pbk.)
Attachment JFW-7
Page 2 of 3

ite Making 85 / I Marginal Cost Pricing
umerous
world of ;hanging 511 to be m either 'ary also it would J refined etail the also be
lation in ise to be e ability ould be
ricing is :ms elves remain
ie clear, ut since average icing is vays) a t strong mted at rentage ;r some
ler it is al costs etween ed out, tnd we /e tend :mands
more ATG
ely on up the •ility of
npetition aokings 40. m the dost of ariable for the
if an ample, nd its
permitting prices to fluctuate widely along the SRMG function, depending on the immediate relation of demand to capacity,49 the practically achievable benchmark for efficient pricing is more likely to be a type of average long-run incremental cost, computed for a large, expected incremental block of sales, instead of SRMG, estimated for a single additional sale. This long-run incremental cost (which we shall loosely refer to as long-run marginal cost as well) would be based on (1) the average incremental variable costs of those added sales and (2) estimated additional capital costs per unit, for the additional capacity that will have to be constructed if sales at that price are expected to continue over time or to grow.50 Both of these components would be estimated as averages over some period of years extending into the future.
5. The prevalence of common costs has similar implications. Service A bears a causal-responsibility for a share of common costs only if there is an economically realistic alternative use of the capacity now used to provide it, or if production of A requires the building of additional capacity. The marginal opportunity cost of serving A depends on how much the alternative users would be willing to pay for devoting the capacity to serving them instead. The sum of the separable marginal costs will therefore cover the common costs only if at separate prices less than this the claims on the capacity exceed the available supply.51
6. Long-run marginal costs are likely to be the preferred criterion also in competitive situations. Permitting rate reductions to a lower level of SRMG, which would prove to be unremunerative if the business thus attracted were to continue over time, might constitute predatory competition—driving out of business rivals whose long-run costs of production might well be lower than those of the price-cutter.
SRMC on the average equal to its composite ATG—running far above ATG when operations exceeded the 80% level and correspondingly below at other times. See pp. 94-97, Chapter 4, below. 48 If SRMC pricing did not cover ATG over time, capital would eventually be withdrawn and new capital, needed to meet the rising demand, repelled, until a recovering demand, moving up along a steeply rising MG curve, pushed prices up high enough and held them there long enough to attract new capital into the industry—with the possibility of a return of depressed prices with any temporary reemergence of excess capacity. In the case of the partly-empty airplane (see pp. 75-76), the "efficient price" would be zero as long as the response of travelers remained insufficient to fill the plane; then it would have to jump the moment the empty spaces fell one short of demand, possibly to the full cost of an added flight but in any case to whatever level necessary to equate the number of available seats with the number of would-be passengers. On each flight, the available seats would have to be auctioned, with the uniform price settling at the point required to clear the market. 50 See W. Arthur Lewis, Overhead Costs (New
York: Rinehart, 1949), 15-20; Marcel Boiteux, "Peak-Load Pricing" in James R. Nelson, Marginal Cost Pricing in Practice (Englewood Cliffs: Prentice-Hall, 1964), 70-72. 61 As we have just seen in another connection (pp. 82-83), the marginal opportunity cost of providing a cubic foot of warehouse space to any particular user, A, is the most valuable alternative use of that space excluded by serving A— what the most insistent excluded customer would have been willing to pay for it. If at any price per foot less than the proportionate share of the common costs (that is, less than ATC) of the warehouse, there are or would be unsatisfied customers—that is, more cubic feet demanded than were available—then clearly the marginal opportunity cost of each cubic foot would be at least equal to average total costs, and prices correctly set at SRMC would cover total costs. If, instead, at a price equal to ATG there is excess capacity, this demonstrates that price exceeds marginal opportunity costs: serving A is not preventing anyone else willing to pay that much from getting all the space he wants. In this circumstance, prices set lower, at true SRMG, would not provide enough revenue to cover total costs.
Attachment JFW-7
Page 3 of 3

ATTACHMENT JFW-8

P U B L I C U T I L I T Y E C O N O M I C S
PAUL J. GARFIELD, Ph.D. Economist, Foster Associates, Inc.
Washington, D.C. i
WALLACE F. LOVEJOY, Ph.D. Associate Professor of Economics,
Southern Methodist University Dallas, Texas
PRENTICE-HALL, INC., Englewood Cliffs, New Jersey
Attachment JFW-8
Page 1 of 4

© 1964 by PRENTICE-HALL, INC., Englewood Cliffs, N.J.
All rights reserved. No part of this book may be reproduced in any form, by mimeograph or any other means, without permission in writing from the publisher.
Library of Congress Catalog Card Number: 64-10255
Printed in the United States of America: C-73936
Current printing (last digit): 17 16 15 14 13
Attachment JFW-8
Page 2 of 4

°ntials of Rate nm
Rate Schedules. [uired to maintain rich contain schedul^
nsun
cics
les and: types of service
s are open to jmblic mnot be * ice and submission dk-rule changes to the rife'
ion for review al
*™<* Bn?by ""h*" uutitto. Their
tizfundrr circumstances which make JfiV most feasible form of pricing. WSti) Straight-Line Meter-Rate Sched-
A,, «,night-line meter-rate schedules ^t7«;We service at a constant charge per " Jeten-H unit of energy, regardless of
quantity of energy used. For ex-e, the rate schedule might provide
ibleness. The rate ' f* * «W of 4 ce"tS P? ^7?^' in public utility Sir' ,hl'S typE ,° fh6dU ' sis for pricing diff Sf • **9 rate per krlowatt-hour remains ich service of,Mfc f ,h* rt--rdleSS °f the am°Unt C°n"
in public utility
' ' ' | . information soecifv^t *«**' but the cust(,mer's bil1 increase3
of the rate schethg^:' proportionate!)' with the increase in : service to be provide -fe. used" This ^ of rate schedule
n charge for each billi» IT1 ® U3fd 'n some cast's ^or off-peak water — j.- • * '• healing aid special services; however, wing discussion suiveys
es of rate schedules used l4
irrently by electric anj J-es. ?<» ? Schedules. The first {•' ere in the form of th |f iharged the customer» j, given time period, sui f >nth, regardless of tin I of use. Another types? £ "fixture rate," charged k
r specified time period, lumber and size of the d appliances serving! her form, a flat rate the actual amount of
at rates were largely :he development of inflective meters whidt Iling on the basis o! flat rate is now littlt tilities except for street is possible to estimate
: with reasonable accu-flat-rate type of rate bill remains the same
! kilowatt-hours con* | average effective rate >
of electric energy u5e" I 'eased use. Flat rat' phone companies ftj
it IHI been largely abandoned for general use. The advantage of this type of rale schedule is its simplicity. The principal neatness is that it does not provide any rate reduction or incentive for larger volume use.
1 1 ) B l o c k M c t a -Rate Schedules. The block meter-rate schedule is now the type most widely used for residential and other small-volume consumers. This type of rate schedule offers a decreasing price per unit of energy for successive blocks (quantities) of consumption. .More specifically, this type of rate schedule offers suucssively lower rates per kilowatt-hour foi all or part of each block of energy consumed. The customers bill is lalculated by cumulating tbe charges incurred for each successive
ock of eneigy taken or. fraction ' ereof. lliis example illustrates a block '|lrr~rate scbedule for monthly billing; 'P minimum charge is $1.05.
! 10 Kwh or less $1.05 '"t 30 Kwh ^ e . xr •\«U0Kwh 4.5 cents per Kwh \«>i . 3.9 cents per Kwh -OI K ? h 2.7 cents per Kwh ilini °r more 2.0 cents per Kwh jir mum charge, $1.05 per month
155
The block meter-rate schedule is simple and easily understood by consumers. The average over-all rate charged per kilowatt-hour declines with increased use, thus promoting sales. The bill increases more or less proportionately to energy used within each block but less than proportionately when all consumption beyond the first block is considered.
The block meter-rate schedule, and others, may include either a "service charge" or a "minimum charge." There is an important difference between the two. The service charge is a fixed amount per month, say 75' cents, that a customer must pay, regardless of the consumption of energy, and for which he can use no energy. The minimum charge, on the other hand, is based upon a minimum amount of consumption which the customer will have to pay for—whether or not that amount is actually used. Thus,
- the minimum charge permits the utility to collect some amount from the convenience user without increasing the bill of the average customer. In the above illustration of a block meter-rate schedule, for example, a minimum charge of $1.05 per month is related to the first block of 10 kilowatt-hours. Any monthly total consumption of less than that amount would be billed at $1.05 nonetheless. In summary: (a) the service charge is a fixed monthly sum that is unrelated to any specified quantity of consumption; while (b) the minimum charge is a fixed monthly sum that is related to a specified minimum monthly consumption of energy which the customer must pay for whether it is used or not. Where the rate schedule calls for a service charge, the block charges are ordinarily lower than in rate schedules providing a minimum charge.
The purpose of both the service charge and the minimum " charge is to cover at least some of the costs incurred
Attachment JFW-8
Page 3 of 4

by the utility whether or not the customer uses energy in a particular month.
-For small customers uffderjthe block meter-rate schedule, a charge of this kind is intended to cover the expenses relating to meter service and maintenance, meter reading, accounting and collecting, return on the investment in meters "and the service lines connecting the'customer's premises to the distribution system, and others. Such expenses as these represent as a minimum the "readiness-to-serve" expenses incurred by the utility on behalf of each, customer. In the absence of a service charge or minimum charge, these expenses would be avoided by the con-
i venience user and transferred unfairly to those consuming service.
In some states there has been public protest against the service charge, largely on the ground that it permitted the utility to receive "something for nothing." This type of public opinion has arisen because no energy use is related to the service charge. Accordingly, some state commissions have prohibited the service charge in favor of the minimum charge. The New York commission, for example, has recognized that the basis of the public opposition to the service charge ". . .is not so much economic or accounting as it is psychological." A different attitude was found to exist with respect to the minimum charge.85
A predecessor of the block meter-rate schedule, called the step meter-rate schedule, is now almost never used. Under this type of rate schedule one price was charged per unit of energy for the entire amount of service consumed. That unit price was determined by the price attaching to the particular block in which the total consumption happened to fall; prices decreased with each sue-
35 Re Rates and Rate Schedules of Corpora-. tions Supplying Electricity, PUR 1931 C, 337, 347.
The Essentials of Rate Regukti0i
cessive block. Because of this feature was sometimes possible to reduce th over-all bill by wasting service so as | cause total consumption to come within the next, lower-priced energy block. The block meter-rate schedule, which cumu lates block charges, was a «uhs^antial improvement.
(4) Hopkinson Demand Rate Schii-ules. The Hopkinson-type rate .-ihedu'» is widely used for medium and large commercial and industrial customers, h was devised by Dr. John Hopkinson ic 1892. The Hopkinson rate schedule pro-vides for a two-part rate, consisting oi separate charges for maximum demand and energy consumption. The uhtomer'i bill under this type of rate -chedult therefore, is the sum of the two COE-
ponents—the demand charge and th energy charge. As the Hopkinson-type rate schedule has been adapted for ] ent-day use, either the demand chargo or the energy charge or boili may fce
graduated by blocks so as to proude
lower charges for larger volumes of con
sumption. The Hopkinson- type rate •
schedule requires a measurement of kilowatts of demand and kilowal t-houre cf energy. The rate schedule may providr
that the customer's maximum denaal be either measured or estimated. F* larger customers, the maximum demasf
for billing purposes is generally obtaiatf
through measurement by use of J b mand meter or demand indicator, fit. billing demand may be the niauii'** 15-minute or 30-minute demand ured in kilowatts as recorded in ing month, or some similar nieaiiw 6
demand, The following is an illustraSp ;
of a Hopkinson rate schedule _ ;•
monthly billing. ^ )
Demand Charge: i $2.25 per Kw .... first 2 Kw of ii $2.00 per Kw .... next 18 Kw ')[ ^ $1.50 per Kw .... next 80 Kw of $1.25 per Kw .... all over 100 1
Pricing Policies
Energy Charge: • 2.50c per Kwh.... fir • 00C per K w h . . . ne 1 60c per Kwh.... ne: I 40c per K w h . . . . ne: I 20f per K w h . . . . ne: 0.40c per K w h . . . . ne> 0 75"* per Kwh.... nex c 70c per Kwh all
There is ordinar pmvided in Hopki: which may cover n tustnmer costs, but co-sts. The minimu 1 lie form of a de r.iic.'iet provision s under the maximun purposes, and may maid tfi no less thai (folded in some s -•isne percentage thi
Hei.iiise the Hop • "Mains a demand (iiiies teimed a "lo load factor, which to peal; load duri jn'rioil. is automati. in I be Hopkinson necessarily follows is ia»w) upon ma kilwatl-hours of hours divided by JY-MI- aw rage loa k'a*'n rale schedui < usloiner increases tiHrea-e in niaximi
Hie «*nthlv
Attachment JFW-8
Page 4 of 4

ATTACHMENT JFW-9
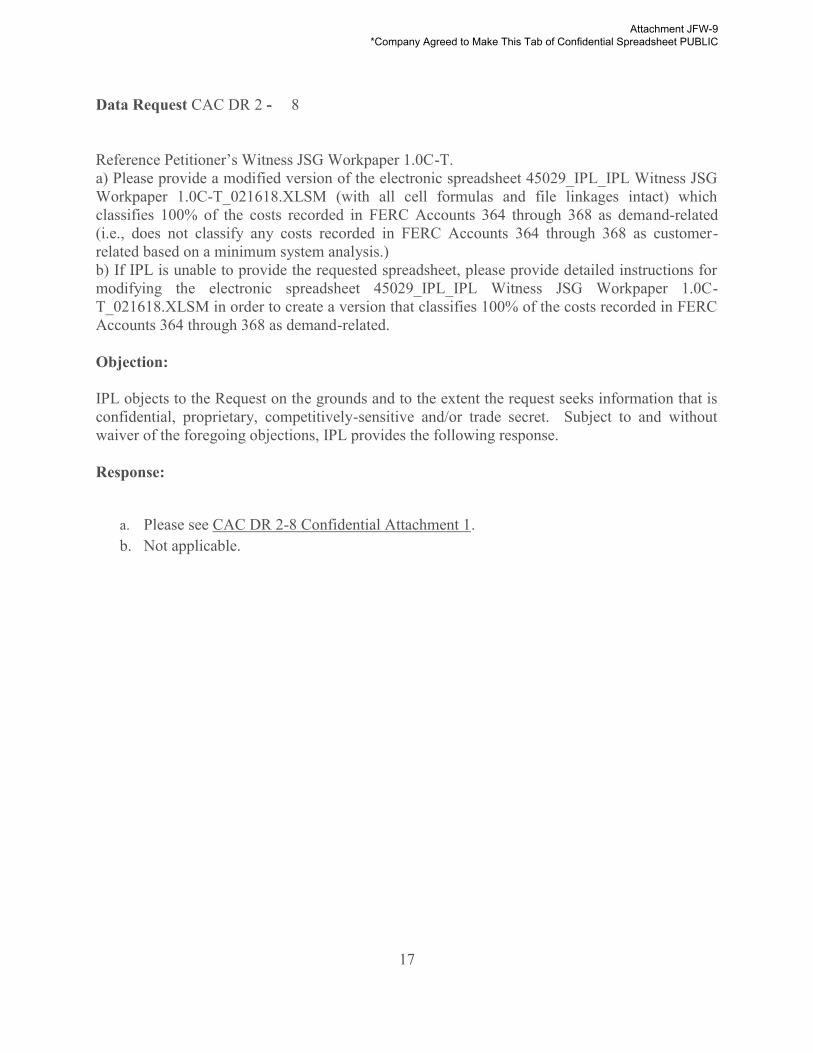
Attachment JFW-9 *Company Agreed to Make This Tab of Confidential Spreadsheet PUBLIC
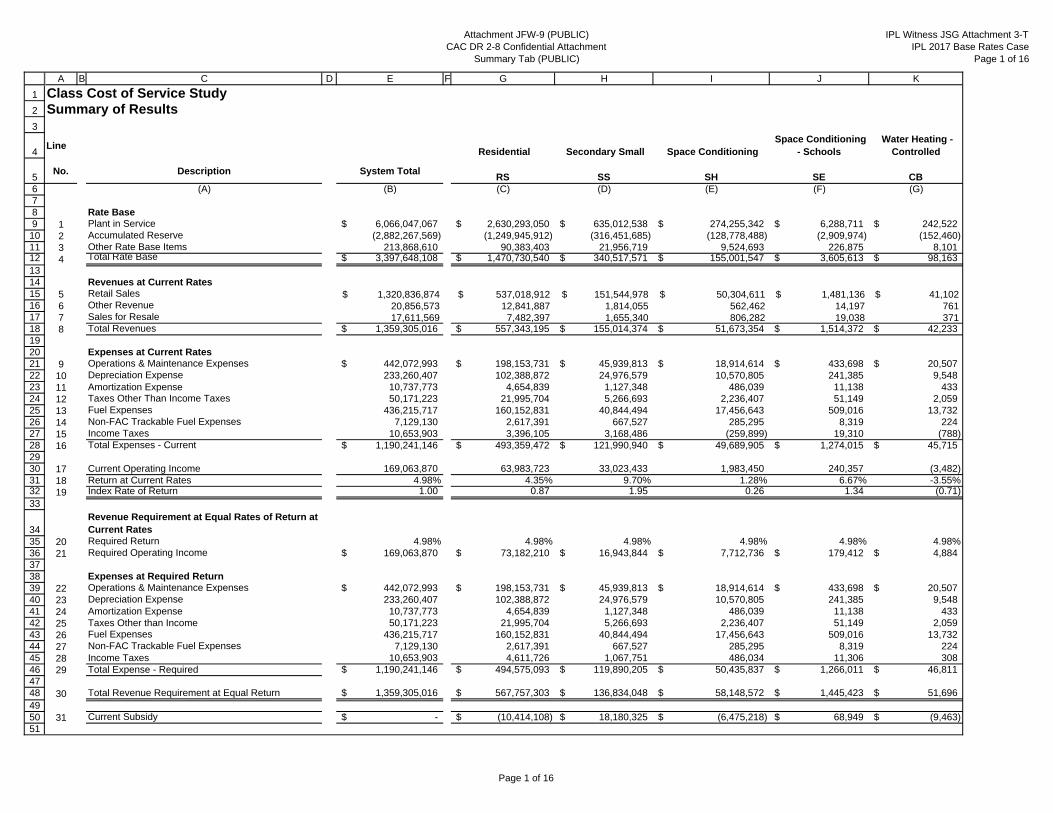
Attachment JFW-9 (PUBLIC)CAC DR 2-8 Confidential Attachment
Summary Tab (PUBLIC)
IPL Witness JSG Attachment 3-TIPL 2017 Base Rates Case
Page 1 of 16
1
2
3
4
56789
101112131415161718192021222324252627282930313233
343536373839404142434445464748495051
A B C D E F G H I J K
Class Cost of Service StudySummary of Results
Line Residential Secondary Small Space Conditioning
Space Conditioning - Schools
Water Heating - Controlled
No. Description System TotalRS SS SH SE CB
(A) (B) (C) (D) (E) (F) (G)
Rate Base1 Plant in Service 6,066,047,067$ 2,630,293,050$ 635,012,538$ 274,255,342$ 6,288,711$ 242,522$ 2 Accumulated Reserve (2,882,267,569) (1,249,945,912) (316,451,685) (128,778,488) (2,909,974) (152,460) 3 Other Rate Base Items 213,868,610 90,383,403 21,956,719 9,524,693 226,875 8,101 4 Total Rate Base 3,397,648,108$ 1,470,730,540$ 340,517,571$ 155,001,547$ 3,605,613$ 98,163$
Revenues at Current Rates5 Retail Sales $ 1,320,836,874 $ 537,018,912 $ 151,544,978 $ 50,304,611 $ 1,481,136 $ 41,102 6 Other Revenue 20,856,573 12,841,887 1,814,055 562,462 14,197 761 7 Sales for Resale 17,611,569 7,482,397 1,655,340 806,282 19,038 371 8 Total Revenues 1,359,305,016$ 557,343,195$ 155,014,374$ 51,673,354$ 1,514,372$ 42,233$
Expenses at Current Rates9 Operations & Maintenance Expenses 442,072,993$ 198,153,731$ 45,939,813$ 18,914,614$ 433,698$ 20,507$
10 Depreciation Expense 233,260,407 102,388,872 24,976,579 10,570,805 241,385 9,548 11 Amortization Expense 10,737,773 4,654,839 1,127,348 486,039 11,138 433 12 Taxes Other Than Income Taxes 50,171,223 21,995,704 5,266,693 2,236,407 51,149 2,059 13 Fuel Expenses 436,215,717 160,152,831 40,844,494 17,456,643 509,016 13,732 14 Non-FAC Trackable Fuel Expenses 7,129,130 2,617,391 667,527 285,295 8,319 224 15 Income Taxes 10,653,903 3,396,105 3,168,486 (259,899) 19,310 (788) 16 Total Expenses - Current 1,190,241,146$ 493,359,472$ 121,990,940$ 49,689,905$ 1,274,015$ 45,715$
17 Current Operating Income 169,063,870 63,983,723 33,023,433 1,983,450 240,357 (3,482) 18 Return at Current Rates 4.98% 4.35% 9.70% 1.28% 6.67% -3.55%19 Index Rate of Return 1.00 0.87 1.95 0.26 1.34 (0.71)
Revenue Requirement at Equal Rates of Return at Current Rates
20 Required Return 4.98% 4.98% 4.98% 4.98% 4.98% 4.98%21 Required Operating Income 169,063,870$ 73,182,210$ 16,943,844$ 7,712,736$ 179,412$ 4,884$
Expenses at Required Return22 Operations & Maintenance Expenses 442,072,993$ 198,153,731$ 45,939,813$ 18,914,614$ 433,698$ 20,507$ 23 Depreciation Expense 233,260,407 102,388,872 24,976,579 10,570,805 241,385 9,548 24 Amortization Expense 10,737,773 4,654,839 1,127,348 486,039 11,138 433 25 Taxes Other than Income 50,171,223 21,995,704 5,266,693 2,236,407 51,149 2,059 26 Fuel Expenses 436,215,717 160,152,831 40,844,494 17,456,643 509,016 13,732 27 Non-FAC Trackable Fuel Expenses 7,129,130 2,617,391 667,527 285,295 8,319 224 28 Income Taxes 10,653,903 4,611,726 1,067,751 486,034 11,306 308 29 Total Expense - Required 1,190,241,146$ 494,575,093$ 119,890,205$ 50,435,837$ 1,266,011$ 46,811$
30 Total Revenue Requirement at Equal Return 1,359,305,016$ 567,757,303$ 136,834,048$ 58,148,572$ 1,445,423$ 51,696$
31 Current Subsidy -$ (10,414,108)$ 18,180,325$ (6,475,218)$ 68,949$ (9,463)$
Page 1 of 16

Attachment JFW-9 (PUBLIC)CAC DR 2-8 Confidential Attachment
Summary Tab (PUBLIC)
IPL Witness JSG Attachment 3-TIPL 2017 Base Rates Case
Page 2 of 16
1
2
3
4
56789
101112131415161718192021222324252627282930313233
343536373839404142434445464748495051
A B C D E
Class Cost of Service StudySummary of Results
Line
No. Description System Total
(A) (B)
Rate Base1 Plant in Service 6,066,047,067$ 2 Accumulated Reserve (2,882,267,569) 3 Other Rate Base Items 213,868,610 4 Total Rate Base 3,397,648,108$
Revenues at Current Rates5 Retail Sales $ 1,320,836,874 6 Other Revenue 20,856,573 7 Sales for Resale 17,611,569 8 Total Revenues 1,359,305,016$
Expenses at Current Rates9 Operations & Maintenance Expenses 442,072,993$ 10 Depreciation Expense 233,260,407 11 Amortization Expense 10,737,773 12 Taxes Other Than Income Taxes 50,171,223 13 Fuel Expenses 436,215,717 14 Non-FAC Trackable Fuel Expenses 7,129,130 15 Income Taxes 10,653,903 16 Total Expenses - Current 1,190,241,146$
17 Current Operating Income 169,063,870 18 Return at Current Rates 4.98%19 Index Rate of Return 1.00
Revenue Requirement at Equal Rates of Return at Current Rates
20 Required Return 4.98%21 Required Operating Income 169,063,870$
Expenses at Required Return22 Operations & Maintenance Expenses 442,072,993$ 23 Depreciation Expense 233,260,407 24 Amortization Expense 10,737,773 25 Taxes Other than Income 50,171,223 26 Fuel Expenses 436,215,717 27 Non-FAC Trackable Fuel Expenses 7,129,130 28 Income Taxes 10,653,903 29 Total Expense - Required 1,190,241,146$
30 Total Revenue Requirement at Equal Return 1,359,305,016$
31 Current Subsidy -$
L M N O P Q
Water Heating - Uncontrolled Secondary Large Industrial Process Heating
Automatic Protective Lighting
Municipal Lighting
UW SL PL-HL PH APL MU1 (H) (I) (J) (K) (L) (M)
482,605$ 1,430,707,836$ 926,130,364$ 15,060,812$ 60,134,345$ 87,438,944$ (258,097) (651,249,276) (396,860,372) (7,128,781) (51,192,450) (77,340,074)
17,338 51,638,285 35,007,312 540,693 1,845,999 2,719,192 241,847$ 831,096,844$ 564,277,304$ 8,472,723$ 10,787,894$ 12,818,062$
$ 118,918 $ 325,364,155 $ 234,835,605 $ 3,305,535 $ 7,453,299 $ 9,368,623 2,128 3,104,225 1,920,973 34,772 228,509 332,604 1,114 4,427,027 3,102,957 44,131 33,067 39,846
122,160$ 332,895,408$ 239,859,535$ 3,384,437$ 7,714,875$ 9,741,073$
37,360$ 102,178,723$ 64,607,422$ 1,050,613$ 4,949,940$ 5,786,572$ 19,166 55,487,296 36,625,190 568,110 945,960 1,427,496
858 2,528,699 1,633,137 26,703 108,623 159,955 4,055 11,801,693 7,631,035 122,375 468,080 591,974
40,954 117,094,154 95,498,334 1,190,000 1,486,541 1,929,019 669 1,913,687 1,560,747 19,448 24,295 31,526
1,485 2,370,383 2,059,924 21,895 (63,185) (59,813) 104,546$ 293,374,634$ 209,615,790$ 2,999,145$ 7,920,254$ 9,866,730$
17,614 39,520,773 30,243,745 385,293 (205,380) (125,656) 7.28% 4.76% 5.36% 4.55% -1.90% -0.98%
1.46 0.96 1.08 0.91 (0.38) (0.20)
4.98% 4.98% 4.98% 4.98% 4.98% 4.98%12,034$ 41,354,621$ 28,077,924$ 421,595$ 536,796$ 637,815$
37,360$ 102,178,723$ 64,607,422$ 1,050,613$ 4,949,940$ 5,786,572$ 19,166 55,487,296 36,625,190 568,110 945,960 1,427,496
858 2,528,699 1,633,137 26,703 108,623 159,955 4,055 11,801,693 7,631,035 122,375 468,080 591,974
40,954 117,094,154 95,498,334 1,190,000 1,486,541 1,929,019 669 1,913,687 1,560,747 19,448 24,295 31,526 758 2,606,045 1,769,387 26,568 33,827 40,193
103,819$ 293,610,297$ 209,325,253$ 3,003,818$ 8,017,266$ 9,966,736$
115,853$ 334,964,918$ 237,403,177$ 3,425,412$ 8,554,062$ 10,604,551$
6,306$ (2,069,510)$ 2,456,358$ (40,975)$ (839,187)$ (863,477)$
Page 2 of 16

Attachment JFW-9 (PUBLIC)CAC DR 2-8 Confidential Attachment
Summary Tab (PUBLIC)
IPL Witness JSG Attachment 3-TIPL 2017 Base Rates Case
Page 3 of 16
4
567
A B C D E F G H I J K
Line Residential Secondary Small Space Conditioning
Space Conditioning - Schools
Water Heating - Controlled
No. Description System TotalRS SS SH SE CB
(A) (B) (C) (D) (E) (F) (G)
52535455565758596061626364656667686970717273747576777879808182838485868788899091929394959697
Revenue Requirement at Equal Rates of Return at Proposed Rates
32 Required Return 7.05% 7.05% 7.05% 7.05% 7.05% 7.05%33 Required Operating Income $ 239,574,000 $ 103,703,735 $ 24,010,478 $ 10,929,425 $ 254,238 $ 6,922 34 Operating Income (Deficiency)/Surplus $ (70,510,130) $ (39,720,012) $ 9,012,955 $ (8,945,975) $ (13,881) $ (10,404)
Expenses at Equal Rates of Return at Proposed Rates35 Operations & Maintenance Expenses $ 442,546,993 $ 198,470,904 $ 45,972,539 $ 18,922,007 $ 433,842 $ 20,550 36 Depreciation Expense 233,260,407 102,388,872 24,976,579 10,570,805 241,385 9,548 37 Amortization Expense 10,737,773 4,654,839 1,127,348 486,039 11,138 433 38 Taxes Other than Income 51,520,223 22,582,068 5,402,461 2,297,503 52,568 2,101 39 Fuel Expenses 436,215,717 160,152,831 40,844,494 17,456,643 509,016 13,732 40 Non-FAC Trackable Fuel Expenses 7,129,130 2,617,391 667,527 285,295 8,319 224 41 Income Taxes 35,053,000 15,173,295 3,513,066 1,599,127 37,199 1,013 42 Total Expense - Required 1,216,463,243$ 506,040,201$ 122,504,014$ 51,617,418$ 1,293,466$ 47,600$
43a Interruptble Power Credit - - - - - - 43 Total Revenue Requirement at Equal Return 1,456,037,243$ 609,743,935$ 146,514,493$ 62,546,844$ 1,547,704$ 54,522$
44 Revenue (Deficiency)/Surplus (96,732,227)$ (52,400,740)$ 8,499,881$ (10,873,489)$ (33,332)$ (12,289)$ 45 Total Revenues 1,359,305,016 557,343,195 155,014,374 51,673,354 1,514,372 42,233 46 Total Revenues as Proposed 1,456,037,243$ 609,743,935$ 146,514,493$ 62,546,844$ 1,547,704$ 54,522$
47 Less Total Other Revenues 20,856,573$ 12,841,887$ 1,814,055$ 562,462$ 14,197$ 761$ 48 Sales for Resale 17,611,569 7,482,397 1,655,340 806,282 19,038 371 49 Total Base Rate Revenues as Proposed 1,417,569,101$ 589,419,652$ 143,045,097$ 61,178,100$ 1,514,469$ 53,390$
Mitigation50 Mitigation 0$ (5,207,054)$ 9,090,163$ (3,237,609)$ 34,474$ (4,731)$ 51 Proposed Increase Post Mitigation 96,732,227 47,193,686 590,282 7,635,880 67,807 7,557
Revenue Requirement at Proposed Mitigated Rates52 Revenue Defficiency/Surplus 96,732,227$ 47,193,686$ 590,282$ 7,635,880$ 67,807$ 7,557$ 53 Total Revenues 1,359,305,016 557,343,195 155,014,374 51,673,354 1,514,372 42,233 54 Total Revenues as Proposed 1,456,037,243$ 604,536,882$ 155,604,655$ 59,309,235$ 1,582,178$ 49,790$
55 Less Total Other Revenues 20,856,573$ 12,841,887$ 1,814,055$ 562,462$ 14,197$ 761$ 56 Sales for Resale 17,611,569 7,482,397 1,655,340 806,282 19,038 371 57 Total Base Rate Revenues as Proposed 1,417,569,101$ 584,212,598$ 152,135,260$ 57,940,491$ 1,548,943$ 48,659$
58 Total Margin in Base Rates 201,105,858$ 78,172,398$ 29,631,246$ 6,323,072$ 255,477$ 1,059$
59 Expenses (excl. Income Taxes) 1,181,410,243$ 490,866,905$ 118,990,948$ 50,018,292$ 1,256,267$ 46,587$ 60 Interest Expense 85,621,000 37,062,525 8,581,070 3,906,051 90,862 2,474 61 Taxable Income 189,006,000$ 76,607,451$ 28,032,638$ 5,384,891$ 235,049$ 729$
Page 3 of 16

Attachment JFW-9 (PUBLIC)CAC DR 2-8 Confidential Attachment
Summary Tab (PUBLIC)
IPL Witness JSG Attachment 3-TIPL 2017 Base Rates Case
Page 4 of 16
4
567
A B C D E
Line
No. Description System Total
(A) (B)
52535455565758596061626364656667686970717273747576777879808182838485868788899091929394959697
Revenue Requirement at Equal Rates of Return at Proposed Rates
32 Required Return 7.05%33 Required Operating Income $ 239,574,000 34 Operating Income (Deficiency)/Surplus $ (70,510,130)
Expenses at Equal Rates of Return at Proposed Rates35 Operations & Maintenance Expenses $ 442,546,993 36 Depreciation Expense 233,260,407 37 Amortization Expense 10,737,773 38 Taxes Other than Income 51,520,223 39 Fuel Expenses 436,215,717 40 Non-FAC Trackable Fuel Expenses 7,129,130 41 Income Taxes 35,053,000 42 Total Expense - Required 1,216,463,243$
43a Interruptble Power Credit - 43 Total Revenue Requirement at Equal Return 1,456,037,243$
44 Revenue (Deficiency)/Surplus (96,732,227)$ 45 Total Revenues 1,359,305,016 46 Total Revenues as Proposed 1,456,037,243$
47 Less Total Other Revenues 20,856,573$ 48 Sales for Resale 17,611,569 49 Total Base Rate Revenues as Proposed 1,417,569,101$
Mitigation50 Mitigation 0$ 51 Proposed Increase Post Mitigation 96,732,227
Revenue Requirement at Proposed Mitigated Rates52 Revenue Defficiency/Surplus 96,732,227$ 53 Total Revenues 1,359,305,016 54 Total Revenues as Proposed 1,456,037,243$
55 Less Total Other Revenues 20,856,573$ 56 Sales for Resale 17,611,569 57 Total Base Rate Revenues as Proposed 1,417,569,101$
58 Total Margin in Base Rates 201,105,858$
59 Expenses (excl. Income Taxes) 1,181,410,243$ 60 Interest Expense 85,621,000 61 Taxable Income 189,006,000$
L M N O P Q Water Heating -
Uncontrolled Secondary Large Industrial Process Heating Automatic
Protective Lighting Municipal Lighting
UW SL PL-HL PH APL MU1 (H) (I) (J) (K) (L) (M)
7.05% 7.05% 7.05% 7.05% 7.05% 7.05% $ 17,053 $ 58,602,065 $ 39,788,161 $ 597,426 $ 760,673 $ 903,824 $ 561 $ (19,081,292) $ (9,544,416) $ (212,134) $ (966,053) $ (1,029,480)
$ 37,404 $ 102,268,342 $ 64,629,269 $ 1,051,311 $ 4,951,235 $ 5,789,591 19,166 55,487,296 36,625,190 568,110 945,960 1,427,496
858 2,528,699 1,633,137 26,703 108,623 159,955 4,153 12,129,569 7,851,960 125,720 473,609 598,511
40,954 117,094,154 95,498,334 1,190,000 1,486,541 1,929,019 669 1,913,687 1,560,747 19,448 24,295 31,526
2,495 8,574,295 5,821,560 87,412 111,297 132,242 105,698$ 299,996,043$ 213,620,198$ 3,068,705$ 8,101,560$ 10,068,340$
- - - - - - 122,751$ 358,598,108$ 253,408,359$ 3,666,131$ 8,862,233$ 10,972,164$
(592)$ (25,702,700)$ (13,548,823)$ (281,694)$ (1,147,359)$ (1,231,090)$ 122,160 332,895,408 239,859,535 3,384,437 7,714,875 9,741,073 122,751$ 358,598,108$ 253,408,359$ 3,666,131$ 8,862,233$ 10,972,164$
2,128$ 3,104,225$ 1,920,973$ 34,772$ 228,509$ 332,604$ 1,114 4,427,027 3,102,957 44,131 33,067 39,846
119,510$ 351,066,855$ 248,384,428$ 3,587,228$ 8,600,657$ 10,599,714$
3,153$ (1,034,755)$ 1,228,179$ (20,488)$ (419,594)$ (431,739)$ 3,745 24,667,945 14,777,003 261,206 727,765 799,352
3,745$ 24,667,945$ 14,777,003$ 261,206$ 727,765$ 799,352$ 122,160 332,895,408 239,859,535 3,384,437 7,714,875 9,741,073 125,905$ 357,563,353$ 254,636,538$ 3,645,643$ 8,442,639$ 10,540,425$
2,128$ 3,104,225$ 1,920,973$ 34,772$ 228,509$ 332,604$ 1,114 4,427,027 3,102,957 44,131 33,067 39,846
122,663$ 350,032,100$ 249,612,608$ 3,566,741$ 8,181,064$ 10,167,975$
16,965$ 50,036,058$ 35,992,410$ 498,036$ 79,503$ 99,635$
103,203$ 291,421,748$ 207,798,638$ 2,981,293$ 7,990,263$ 9,936,098$ 6,095 20,943,706 14,219,833 213,513 271,856 323,016
16,607$ 45,197,899$ 32,618,068$ 450,837$ 180,520$ 281,311$
Page 4 of 16
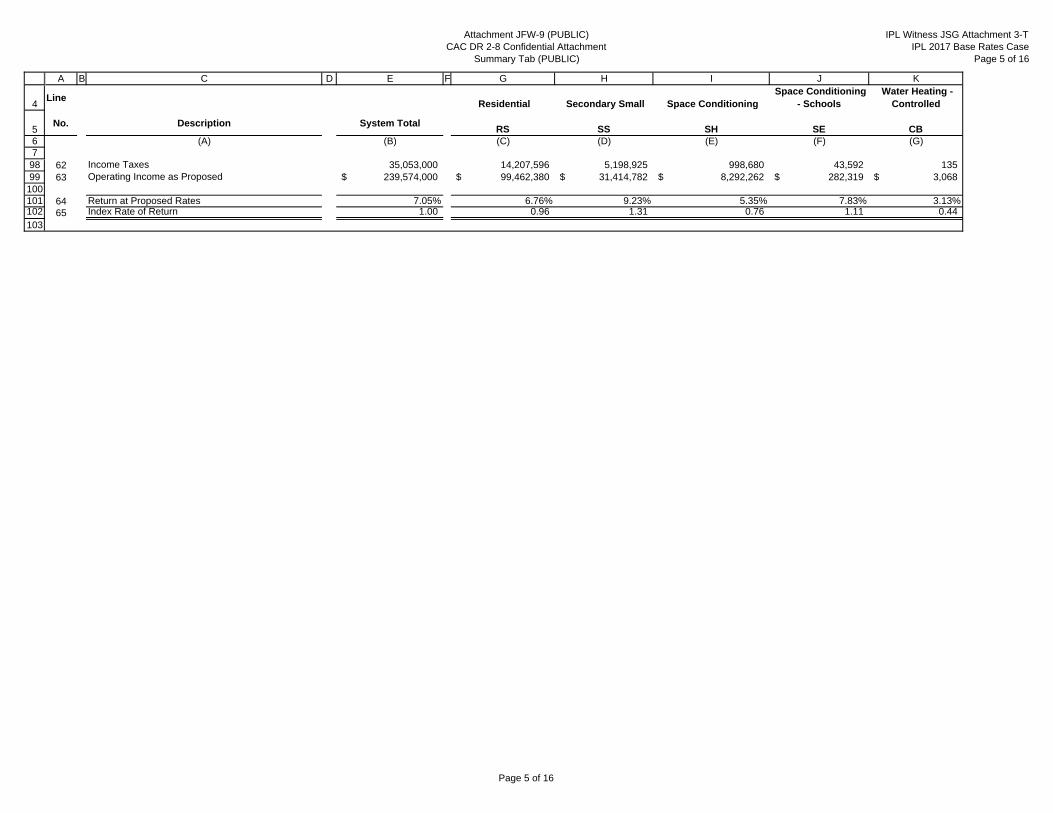
Attachment JFW-9 (PUBLIC)CAC DR 2-8 Confidential Attachment
Summary Tab (PUBLIC)
IPL Witness JSG Attachment 3-TIPL 2017 Base Rates Case
Page 5 of 16
4
567
A B C D E F G H I J K
Line Residential Secondary Small Space Conditioning
Space Conditioning - Schools
Water Heating - Controlled
No. Description System TotalRS SS SH SE CB
(A) (B) (C) (D) (E) (F) (G)
9899
100101102103
62 Income Taxes 35,053,000 14,207,596 5,198,925 998,680 43,592 135 63 Operating Income as Proposed 239,574,000$ 99,462,380$ 31,414,782$ 8,292,262$ 282,319$ 3,068$
64 Return at Proposed Rates 7.05% 6.76% 9.23% 5.35% 7.83% 3.13%65 Index Rate of Return 1.00 0.96 1.31 0.76 1.11 0.44
Page 5 of 16

Attachment JFW-9 (PUBLIC)CAC DR 2-8 Confidential Attachment
Summary Tab (PUBLIC)
IPL Witness JSG Attachment 3-TIPL 2017 Base Rates Case
Page 6 of 16
4
567
A B C D E
Line
No. Description System Total
(A) (B)
9899
100101102103
62 Income Taxes 35,053,000 63 Operating Income as Proposed 239,574,000$
64 Return at Proposed Rates 7.05%65 Index Rate of Return 1.00
L M N O P Q Water Heating -
Uncontrolled Secondary Large Industrial Process Heating Automatic
Protective Lighting Municipal Lighting
UW SL PL-HL PH APL MU1 (H) (I) (J) (K) (L) (M)
3,080 8,382,390 6,049,338 83,612 33,479 52,172 19,621$ 57,759,215$ 40,788,563$ 580,738$ 418,897$ 552,155$
8.11% 6.95% 7.23% 6.85% 3.88% 4.31%1.15 0.99 1.03 0.97 0.55 0.61
Page 6 of 16

Attachment JFW-9 (PUBLIC)CAC DR 2-8 Confidential Attachment
Summary Tab (PUBLIC)
IPL Witness JSG Attachment 3-TIPL 2017 Base Rates Case
Page 7 of 16
4
567
A B C D E F G H I J K
Line Residential Secondary Small Space Conditioning
Space Conditioning - Schools
Water Heating - Controlled
No. Description System TotalRS SS SH SE CB
(A) (B) (C) (D) (E) (F) (G)
403404405406407408409410411412413414415416417418419420421422423424425426427428429430431432433434435436437438439440441442443444445446447448449
Functional Revenue RequirementDemand
189 Production 690,949,615$ 293,554,709$ 64,943,494$ 31,632,610$ 746,916$ 14,541$ 190 Transmission 92,652,452$ 39,364,033$ 8,708,557$ 4,241,755$ 100,157$ 1,950$ 191 Distribution 32,152,911$ 14,949,512$ 3,371,454$ 1,558,512$ 35,401$ 602$ 192 Distribution Primary 70,400,188$ 32,732,603$ 7,381,945$ 3,412,430$ 77,512$ 1,319$ 193 Distribution Secondary 25,625,060$ 13,808,804$ 3,114,030$ 1,453,158$ 32,700$ 562$ 194 Customer -$ -$ -$ -$ -$ -$ 195 Customer Service -$ -$ -$ -$ -$ -$ 196 Fuel Expenses -$ -$ -$ -$ -$ -$ 197 Total 911,780,225$ 394,409,661$ 87,519,481$ 42,298,465$ 992,686$ 18,974$ 198 Zero-Check - - - - - -
Customer199 Production -$ -$ -$ -$ -$ -$ 200 Transmission -$ -$ -$ -$ -$ -$ 201 Distribution -$ -$ -$ -$ -$ -$ 202 Distribution Primary -$ -$ -$ -$ -$ -$ 203 Distribution Secondary -$ -$ -$ -$ -$ -$ 204 Customer 45,579,095$ 20,219,112$ 10,092,119$ 1,288,210$ 12,520$ 10,176$ 205 Customer Service 36,332,799$ 25,369,145$ 5,611,805$ 457,869$ 2,992$ 10,817$ 206 Fuel Expenses -$ -$ -$ -$ -$ -$ 207 Total 81,911,894$ 45,588,257$ 15,703,924$ 1,746,079$ 15,512$ 20,993$ 208 Zero-Check - - - - - -
Energy209 Production 26,129,407$ 9,593,186$ 2,446,593$ 1,045,656$ 30,490$ 823$ 210 Transmission -$ -$ -$ -$ -$ -$ 211 Distribution -$ -$ -$ -$ -$ -$ 212 Distribution Primary -$ -$ -$ -$ -$ -$ 213 Distribution Secondary -$ -$ -$ -$ -$ -$ 214 Customer -$ -$ -$ -$ -$ -$ 215 Customer Service -$ -$ -$ -$ -$ -$ 216 Fuel Expenses -$ -$ -$ -$ -$ -$ 217 Total 26,129,407$ 9,593,186$ 2,446,593$ 1,045,656$ 30,490$ 823$ 218 Zero-Check -$ -$ -$ -$ -$ -$
Fuel219 Fuel Expenses 436,215,717$ 160,152,831$ 40,844,494$ 17,456,643$ 509,016$ 13,732$ 220 Total 436,215,717$ 160,152,831$ 40,844,494$ 17,456,643$ 509,016$ 13,732$ 221 Zero-Check - - - - - -
222 Total 1,456,037,243 609,743,935 146,514,493 62,546,844 1,547,704 54,522
Total Revenue Requirement223 Demand 911,780,225$ 394,409,661$ 87,519,481$ 42,298,465$ 992,686$ 18,974$ 224 Customer 81,911,894$ 45,588,257$ 15,703,924$ 1,746,079$ 15,512$ 20,993$
Page 7 of 16

Attachment JFW-9 (PUBLIC)CAC DR 2-8 Confidential Attachment
Summary Tab (PUBLIC)
IPL Witness JSG Attachment 3-TIPL 2017 Base Rates Case
Page 8 of 16
4
567
A B C D E
Line
No. Description System Total
(A) (B)
403404405406407408409410411412413414415416417418419420421422423424425426427428429430431432433434435436437438439440441442443444445446447448449
Functional Revenue RequirementDemand
189 Production 690,949,615$ 190 Transmission 92,652,452$ 191 Distribution 32,152,911$ 192 Distribution Primary 70,400,188$ 193 Distribution Secondary 25,625,060$ 194 Customer -$ 195 Customer Service -$ 196 Fuel Expenses -$ 197 Total 911,780,225$ 198 Zero-Check -
Customer199 Production -$ 200 Transmission -$ 201 Distribution -$ 202 Distribution Primary -$ 203 Distribution Secondary -$ 204 Customer 45,579,095$ 205 Customer Service 36,332,799$ 206 Fuel Expenses -$ 207 Total 81,911,894$ 208 Zero-Check -
Energy209 Production 26,129,407$ 210 Transmission -$ 211 Distribution -$ 212 Distribution Primary -$ 213 Distribution Secondary -$ 214 Customer -$ 215 Customer Service -$ 216 Fuel Expenses -$ 217 Total 26,129,407$ 218 Zero-Check -$
Fuel219 Fuel Expenses 436,215,717$ 220 Total 436,215,717$ 221 Zero-Check -
222 Total 1,456,037,243
Total Revenue Requirement223 Demand 911,780,225$ 224 Customer 81,911,894$
L M N O P Q Water Heating -
Uncontrolled Secondary Large Industrial Process Heating Automatic
Protective Lighting Municipal Lighting
UW SL PL-HL PH APL MU1 (H) (I) (J) (K) (L) (M)
43,697$ 173,684,272$ 121,737,434$ 1,731,370$ 1,297,293$ 1,563,278$ 5,859$ 23,290,083$ 16,324,304$ 232,167$ 173,960$ 209,627$ 1,930$ 7,443,161$ 4,333,797$ 96,023$ 176,705$ 185,814$ 4,226$ 16,297,123$ 9,489,036$ 210,245$ 386,903$ 406,847$ 1,800$ 6,787,298$ -$ 88,696$ 164,760$ 173,253$ -$ -$ -$ -$ -$ -$ -$ -$ -$ -$ -$ -$ -$ -$ -$ -$ -$ -$
57,512$ 227,501,936$ 151,884,571$ 2,358,500$ 2,199,620$ 2,538,818$ - - - - - -
-$ -$ -$ -$ -$ -$ -$ -$ -$ -$ -$ -$ -$ -$ -$ -$ -$ -$ -$ -$ -$ -$ -$ -$ -$ -$ -$ -$ -$ -$
11,937$ 2,384,094$ 134,006$ 16,992$ 5,087,028$ 6,322,900$ 9,896$ 4,603,961$ 171,079$ 29,357$ -$ 65,878$ -$ -$ -$ -$ -$ -$
21,833$ 6,988,055$ 305,085$ 46,349$ 5,087,028$ 6,388,778$ - - - - - -
2,453$ 7,013,963$ 5,720,369$ 71,281$ 89,044$ 115,549$ -$ -$ -$ -$ -$ -$ -$ -$ -$ -$ -$ -$ -$ -$ -$ -$ -$ -$ -$ -$ -$ -$ -$ -$ -$ -$ -$ -$ -$ -$ -$ -$ -$ -$ -$ -$ -$ -$ -$ -$ -$ -$ 2,453$ 7,013,963$ 5,720,369$ 71,281$ 89,044$ 115,549$ -$ -$ -$ -$ -$ -$
40,954$ 117,094,154$ 95,498,334$ 1,190,000$ 1,486,541$ 1,929,019$ 40,954$ 117,094,154$ 95,498,334$ 1,190,000$ 1,486,541$ 1,929,019$
- - - - - -
122,751 358,598,108 253,408,359 3,666,131 8,862,233 10,972,164
57,512$ 227,501,936$ 151,884,571$ 2,358,500$ 2,199,620$ 2,538,818$ 21,833$ 6,988,055$ 305,085$ 46,349$ 5,087,028$ 6,388,778$
Page 8 of 16

Attachment JFW-9 (PUBLIC)CAC DR 2-8 Confidential Attachment
Summary Tab (PUBLIC)
IPL Witness JSG Attachment 3-TIPL 2017 Base Rates Case
Page 9 of 16
4
567
A B C D E F G H I J K
Line Residential Secondary Small Space Conditioning
Space Conditioning - Schools
Water Heating - Controlled
No. Description System TotalRS SS SH SE CB
(A) (B) (C) (D) (E) (F) (G)
450451452453454
225 Energy 26,129,407$ 9,593,186$ 2,446,593$ 1,045,656$ 30,490$ 823$ 226 Fuel 436,215,717$ 160,152,831$ 40,844,494$ 17,456,643$ 509,016$ 13,732$ 227 Total 1,456,037,243$ 609,743,935$ 146,514,493$ 62,546,844$ 1,547,704$ 54,522$ 228 Zero-Check - - - - - -
Page 9 of 16

Attachment JFW-9 (PUBLIC)CAC DR 2-8 Confidential Attachment
Summary Tab (PUBLIC)
IPL Witness JSG Attachment 3-TIPL 2017 Base Rates Case
Page 10 of 16
4
567
A B C D E
Line
No. Description System Total
(A) (B)
450451452453454
225 Energy 26,129,407$ 226 Fuel 436,215,717$ 227 Total 1,456,037,243$ 228 Zero-Check -
L M N O P Q Water Heating -
Uncontrolled Secondary Large Industrial Process Heating Automatic
Protective Lighting Municipal Lighting
UW SL PL-HL PH APL MU1 (H) (I) (J) (K) (L) (M)
2,453$ 7,013,963$ 5,720,369$ 71,281$ 89,044$ 115,549$ 40,954$ 117,094,154$ 95,498,334$ 1,190,000$ 1,486,541$ 1,929,019$
122,751$ 358,598,108$ 253,408,359$ 3,666,131$ 8,862,233$ 10,972,164$ - - - - - -
Page 10 of 16

Attachment JFW-9 (PUBLIC)CAC DR 2-8 Confidential Attachment
Summary Tab (PUBLIC)
IPL Witness JSG Attachment 3-TIPL 2017 Base Rates Case
Page 11 of 16
4
567
A B C D E F G H I J K
Line Residential Secondary Small Space Conditioning
Space Conditioning - Schools
Water Heating - Controlled
No. Description System TotalRS SS SH SE CB
(A) (B) (C) (D) (E) (F) (G)
455456457458459460461462463464465466467468469470471472473474
475476477478479480481482483484485486487488489490491492493494495496497498499
Billing Determinants229 Demand 15,292,746 0 0 0 0 0230 Customer Bills (Count *12) 6,042,488 5,338,932 585,216 47,748 312 1,128231 Energy 13,243,229,798 4,858,733,890 1,231,269,300 526,224,672 15,344,105 413,938232 Fuel 13,243,229,798 4,858,733,890 1,231,269,300 526,224,672 15,344,105 413,938
Unit Costs233 Demand . -$ -$ -$ -$ -$ 234 Customer . 82.41$ 176.39$ 922.44$ 3,231.40$ 35.43$ 235 Energy . 0.001974$ 0.001987$ 0.001987$ 0.001987$ 0.001987$ 236 Fuel . 0.032962$ 0.033173$ 0.033173$ 0.033173$ 0.033173$
237 Demand Revenue . -$ -$ -$ -$ -$ 238 Customer Revenue . 439,997,918 103,223,405 44,044,545 1,008,198 39,967 239 Energy Revenue . 9,593,186 2,446,593 1,045,656 30,490 823 240 Fuel Revenue . 160,152,831 40,844,494 17,456,643 509,016 13,732 241 Total Revenue . 609,743,935 146,514,493 62,546,844 1,547,704 54,522 242 Zero-Check . -$ -$ -$ -$ -$
Adjusted Revenue Requirement (Excluding Other Revenue and Sale for Resale Revenues)
243 Ratio of Base Revenue to Total Revenue 96.23% 95.48% 96.72% 96.96% 96.80% 97.23%
Total Revenue Requirement244 Demand 877,573,885$ 376,579,918$ 84,646,010$ 41,014,466$ 960,923$ 18,448$ 245 Customer 78,607,839$ 43,527,388$ 15,188,327$ 1,693,076$ 15,016$ 20,411$ 246 Energy 25,171,660$ 9,159,515$ 2,366,266$ 1,013,915$ 29,515$ 800$ 247 Fuel 436,215,717$ 160,152,831$ 40,844,494$ 17,456,643$ 509,016$ 13,732$ 248 Total 1,417,569,101$ 589,419,652$ 143,045,097$ 61,178,100$ 1,514,469$ 53,390$ 249 Zero-Check - - - - - -
Billing Determinants250 Demand 15,292,746 0 0 0 0 0251 Customer Bills (Count *12) 6,042,488 5,338,932 585,216 47,748 312 1,128252 Energy 13,243,229,798 4,858,733,890 1,231,269,300 526,224,672 15,344,105 413,938253 Fuel 13,243,229,798 4,858,733,890 1,231,269,300 526,224,672 15,344,105 413,938
Unit Costs254 Demand . -$ -$ -$ -$ -$ 255 Customer . 78.69$ 170.59$ 894.44$ 3,128.01$ 34.45$ 256 Energy . 0.001885$ 0.001922$ 0.001927$ 0.001924$ 0.001932$ 257 Fuel . 0.032962$ 0.033173$ 0.033173$ 0.033173$ 0.033173$
Page 11 of 16

Attachment JFW-9 (PUBLIC)CAC DR 2-8 Confidential Attachment
Summary Tab (PUBLIC)
IPL Witness JSG Attachment 3-TIPL 2017 Base Rates Case
Page 12 of 16
4
567
A B C D E
Line
No. Description System Total
(A) (B)
455456457458459460461462463464465466467468469470471472473474
475476477478479480481482483484485486487488489490491492493494495496497498499
Billing Determinants229 Demand 15,292,746230 Customer Bills (Count *12) 6,042,488231 Energy 13,243,229,798232 Fuel 13,243,229,798
Unit Costs233 Demand .234 Customer .235 Energy .236 Fuel .
237 Demand Revenue .238 Customer Revenue .239 Energy Revenue .240 Fuel Revenue .241 Total Revenue .242 Zero-Check .
Adjusted Revenue Requirement (Excluding Other Revenue and Sale for Resale Revenues)
243 Ratio of Base Revenue to Total Revenue 96.23%
Total Revenue Requirement244 Demand 877,573,885$ 245 Customer 78,607,839$ 246 Energy 25,171,660$ 247 Fuel 436,215,717$ 248 Total 1,417,569,101$ 249 Zero-Check -
Billing Determinants250 Demand 15,292,746251 Customer Bills (Count *12) 6,042,488252 Energy 13,243,229,798253 Fuel 13,243,229,798
Unit Costs254 Demand .255 Customer .256 Energy .257 Fuel .
L M N O P Q Water Heating -
Uncontrolled Secondary Large Industrial Process Heating Automatic
Protective Lighting Municipal Lighting
UW SL PL-HL PH APL MU1 (H) (I) (J) (K) (L) (M)
0 9,307,348 5,985,398 0 0 01,032 54,576 2,028 348 0 11,168
1,234,531 3,509,506,542 2,961,899,933 35,641,963 44,811,290 58,149,6331,234,531 3,509,506,542 2,961,899,933 35,641,963 44,811,290 58,149,633
-$ 24.44$ 25.38$ -$ -$ -$ 76.88$ 128.04$ 150.44$ 6,910.49$ -$ 799.39$
0.001987$ 0.001999$ 0.001931$ 0.002000$ 0.164595$ 0.001987$ 0.033173$ 0.033365$ 0.032242$ 0.033388$ 0.033173$ 0.033173$
-$ 227,501,936$ 151,884,571$ -$ -$ -$ 79,345 6,988,055 305,085 2,404,850 - 8,927,596
2,453 7,013,963 5,720,369 71,281 7,375,692 115,549 40,954 117,094,154 95,498,334 1,190,000 1,486,541 1,929,019
122,751 358,598,108 253,408,359 3,666,131 8,862,233 10,972,164 -$ -$ -$ -$ -$ -$
96.04% 96.88% 96.82% 96.81% 96.45% 95.88%
55,233$ 220,407,334$ 147,052,341$ 2,283,346$ 2,121,611$ 2,434,255$ 20,968$ 6,770,134$ 295,379$ 44,872$ 4,906,619$ 6,125,650$
2,356$ 6,795,234$ 5,538,375$ 69,010$ 85,886$ 110,790$ 40,954$ 117,094,154$ 95,498,334$ 1,190,000$ 1,486,541$ 1,929,019$
119,510$ 351,066,855$ 248,384,428$ 3,587,228$ 8,600,657$ 10,599,714$ - - - - - -
0 9,307,348 5,985,398 0 0 01,032 54,576 2,028 348 0 11,168
1,234,531 3,509,506,542 2,961,899,933 35,641,963 44,811,290 58,149,6331,234,531 3,509,506,542 2,961,899,933 35,641,963 44,811,290 58,149,633
-$ 23.68$ 24.57$ -$ -$ -$ 73.84$ 124.05$ 145.65$ 6,690.28$ -$ 766.47$
0.001908$ 0.001936$ 0.001870$ 0.001936$ 0.158757$ 0.001905$ 0.033173$ 0.033365$ 0.032242$ 0.033388$ 0.033173$ 0.033173$
Page 12 of 16

Attachment JFW-9 (PUBLIC)CAC DR 2-8 Confidential Attachment
Summary Tab (PUBLIC)
IPL Witness JSG Attachment 3-TIPL 2017 Base Rates Case
Page 13 of 16
4
567
A B C D E F G H I J K
Line Residential Secondary Small Space Conditioning
Space Conditioning - Schools
Water Heating - Controlled
No. Description System TotalRS SS SH SE CB
(A) (B) (C) (D) (E) (F) (G)
500501502503504505506507508509
258 Demand Revenue . -$ -$ -$ -$ -$ 259 Customer Revenue . 420,107,306 99,834,337 42,707,542 975,939 38,859 260 Energy Revenue . 9,159,515 2,366,266 1,013,915 29,515 800 261 Fuel Revenue . 160,152,831 40,844,494 17,456,643 509,016 13,732 262 Total Revenue . 589,419,652 143,045,097 61,178,100 1,514,469 53,390 263 Zero-Check . -$ -$ -$ -$ -$
Grid Facility264 Grid Facility - Revenue Requirement 291,076,067$ 139,823,076$ 37,023,091$ 12,035,161$ 252,922$ 24,721$ 265 Grid Facility - Unit Costs 48.17$ 26.19$ 63.26$ 252.06$ 810.65$ 21.92$
Page 13 of 16
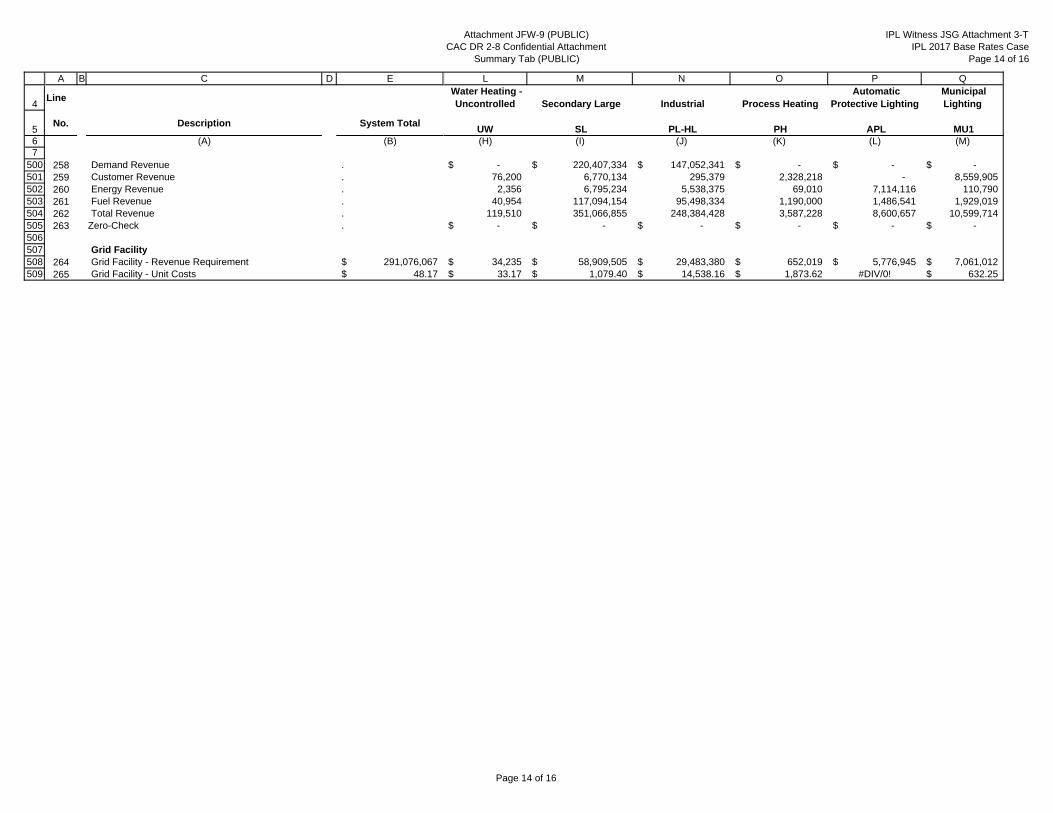
Attachment JFW-9 (PUBLIC)CAC DR 2-8 Confidential Attachment
Summary Tab (PUBLIC)
IPL Witness JSG Attachment 3-TIPL 2017 Base Rates Case
Page 14 of 16
4
567
A B C D E
Line
No. Description System Total
(A) (B)
500501502503504505506507508509
258 Demand Revenue .259 Customer Revenue .260 Energy Revenue .261 Fuel Revenue .262 Total Revenue .263 Zero-Check .
Grid Facility264 Grid Facility - Revenue Requirement 291,076,067$ 265 Grid Facility - Unit Costs 48.17$
L M N O P Q Water Heating -
Uncontrolled Secondary Large Industrial Process Heating Automatic
Protective Lighting Municipal Lighting
UW SL PL-HL PH APL MU1 (H) (I) (J) (K) (L) (M)
-$ 220,407,334$ 147,052,341$ -$ -$ -$ 76,200 6,770,134 295,379 2,328,218 - 8,559,905
2,356 6,795,234 5,538,375 69,010 7,114,116 110,790 40,954 117,094,154 95,498,334 1,190,000 1,486,541 1,929,019
119,510 351,066,855 248,384,428 3,587,228 8,600,657 10,599,714 -$ -$ -$ -$ -$ -$
34,235$ 58,909,505$ 29,483,380$ 652,019$ 5,776,945$ 7,061,012$ 33.17$ 1,079.40$ 14,538.16$ 1,873.62$ #DIV/0! 632.25$
Page 14 of 16

Attachment JFW-9 (PUBLIC)CAC DR 2-8 Confidential Attachment
Summary Tab (PUBLIC)
IPL Witness JSG Attachment 3-TIPL 2017 Base Rates Case
Page 15 of 16
4
567
A B C D E F G H I J K
Line Residential Secondary Small Space Conditioning
Space Conditioning - Schools
Water Heating - Controlled
No. Description System TotalRS SS SH SE CB
(A) (B) (C) (D) (E) (F) (G)
510
511512
513514515516517518519520521522523524525526527528529530531532533534535536537538539540541542543544545546547548549550551
Mitigated Revenue Requirement (Excluding Other Revenue and Sale for Resale Revenues)
266 Ratio of Unmitigated Revenue to Mitigated Revenue 100.00% 98.76% 109.11% 92.42% 103.53% 87.82%
267 Mitigated Amount 0 (5,207,054) 9,090,163 (3,237,609) 34,474 (4,731)
Total Revenue Requirement268 Demand 877,490,554$ 371,912,368$ 92,353,238$ 37,905,207$ 994,867$ 16,202$ 269 Customer 78,691,171$ 42,987,884$ 16,571,262$ 1,564,726$ 15,546$ 17,926$ 270 Energy 25,171,660$ 9,159,515$ 2,366,266$ 1,013,915$ 29,515$ 800$ 271 Fuel 436,215,717$ 160,152,831$ 40,844,494$ 17,456,643$ 509,016$ 13,732$ 272 Total 1,417,569,101$ 584,212,598$ 152,135,260$ 57,940,491$ 1,548,943$ 48,659$ 273 Zero-Check - - - - - -
Billing Determinants274 Demand 15,292,746 0 0 0 0 0275 Customer Bills (Count *12) 6,042,488 5,338,932 585,216 47,748 312 1,128276 Energy 13,243,229,798 4,858,733,890 1,231,269,300 526,224,672 15,344,105 413,938277 Fuel 13,243,229,798 4,858,733,890 1,231,269,300 526,224,672 15,344,105 413,938
Unit Costs278 Demand . -$ -$ -$ -$ -$ 279 Customer . 77.71$ 186.13$ 826.63$ 3,238.50$ 30.25$ 280 Energy . 0.001885$ 0.001922$ 0.001927$ 0.001924$ 0.001932$ 281 Fuel . 0.032962$ 0.033173$ 0.033173$ 0.033173$ 0.033173$
282 Demand Revenue . -$ -$ -$ -$ -$ 283 Customer Revenue . 414,900,252 108,924,500 39,469,933 1,010,413 34,128 284 Energy Revenue . 9,159,515 2,366,266 1,013,915 29,515 800 285 Fuel Revenue -$ 160,152,831 40,844,494 17,456,643 509,016 13,732 286 Total Revenue . 584,212,598 152,135,260 57,940,491 1,548,943 48,659 287 Zero-Check . -$ -$ -$ -$ -$
Total Revenue Requirement (Excluding Fuel)288 Demand 877,490,554$ 371,912,368$ 92,353,238$ 37,905,207$ 994,867$ 16,202$ 289 Customer 78,691,171$ 42,987,884$ 16,571,262$ 1,564,726$ 15,546$ 17,926$ 290 Energy 25,171,660$ 9,159,515$ 2,366,266$ 1,013,915$ 29,515$ 800$ 291 Total 981,353,384$ 424,059,767$ 111,290,766$ 40,483,848$ 1,039,928$ 34,927$ 292 Percent of Total 100.00% 43.21% 11.34% 4.13% 0.11% 0.00%293 Zero-Check - - - - - -
Page 15 of 16

Attachment JFW-9 (PUBLIC)CAC DR 2-8 Confidential Attachment
Summary Tab (PUBLIC)
IPL Witness JSG Attachment 3-TIPL 2017 Base Rates Case
Page 16 of 16
4
567
A B C D E
Line
No. Description System Total
(A) (B)
510
511512
513514515516517518519520521522523524525526527528529530531532533534535536537538539540541542543544545546547548549550551
Mitigated Revenue Requirement (Excluding Other Revenue and Sale for Resale Revenues)
266 Ratio of Unmitigated Revenue to Mitigated Revenue 100.00%
267 Mitigated Amount 0
Total Revenue Requirement268 Demand 877,490,554$ 269 Customer 78,691,171$ 270 Energy 25,171,660$ 271 Fuel 436,215,717$ 272 Total 1,417,569,101$ 273 Zero-Check -
Billing Determinants274 Demand 15,292,746275 Customer Bills (Count *12) 6,042,488276 Energy 13,243,229,798277 Fuel 13,243,229,798
Unit Costs278 Demand .279 Customer .280 Energy .281 Fuel .
282 Demand Revenue .283 Customer Revenue .284 Energy Revenue .285 Fuel Revenue -$ 286 Total Revenue .287 Zero-Check .
Total Revenue Requirement (Excluding Fuel)288 Demand 877,490,554$ 289 Customer 78,691,171$ 290 Energy 25,171,660$ 291 Total 981,353,384$ 292 Percent of Total 100.00%293 Zero-Check -
L M N O P Q Water Heating -
Uncontrolled Secondary Large Industrial Process Heating Automatic
Protective Lighting Municipal Lighting
UW SL PL-HL PH APL MU1 (H) (I) (J) (K) (L) (M)
104.14% 99.54% 100.83% 99.12% 94.03% 94.96%3,153 (1,034,755) 1,228,179 (20,488) (419,594) (431,739)
57,518$ 219,403,416$ 148,278,059$ 2,263,253$ 1,994,948$ 2,311,478$ 21,835$ 6,739,297$ 297,841$ 44,477$ 4,613,688$ 5,816,689$
2,356$ 6,795,234$ 5,538,375$ 69,010$ 85,886$ 110,790$ 40,954$ 117,094,154$ 95,498,334$ 1,190,000$ 1,486,541$ 1,929,019$
122,663$ 350,032,100$ 249,612,608$ 3,566,741$ 8,181,064$ 10,167,975$ - - - - - -
0 9,307,348 5,985,398 0 0 01,032 54,576 2,028 348 0 11,168
1,234,531 3,509,506,542 2,961,899,933 35,641,963 44,811,290 58,149,6331,234,531 3,509,506,542 2,961,899,933 35,641,963 44,811,290 58,149,633
-$ 23.57$ 24.77$ -$ -$ -$ 76.89$ 123.48$ 146.86$ 6,631.41$ -$ 727.81$
0.001908$ 0.001936$ 0.001870$ 0.001936$ 0.149394$ 0.001905$ 0.033173$ 0.033365$ 0.032242$ 0.033388$ 0.033173$ 0.033173$
-$ 219,403,416$ 148,278,059$ -$ -$ -$ 79,354 6,739,297 297,841 2,307,731 - 8,128,166 2,356 6,795,234 5,538,375 69,010 6,694,522 110,790
40,954 117,094,154 95,498,334 1,190,000 1,486,541 1,929,019 122,663 350,032,100 249,612,608 3,566,741 8,181,064 10,167,975
-$ -$ -$ -$ -$ -$
57,518$ 219,403,416$ 148,278,059$ 2,263,253$ 1,994,948$ 2,311,478$ 21,835$ 6,739,297$ 297,841$ 44,477$ 4,613,688$ 5,816,689$
2,356$ 6,795,234$ 5,538,375$ 69,010$ 85,886$ 110,790$ 81,709$ 232,937,946$ 154,114,274$ 2,376,740$ 6,694,522$ 8,238,956$
0.01% 23.74% 15.70% 0.24% 0.68% 0.84%- - - - - -
Page 16 of 16

ATTACHMENT JFW-10

IURCCause
No.44945
Petitioner’sAttachmen
tZE
1S
Page1of3
2018Summary
Program
Budget
EnergySavings
Deman
dSavings
Gross
kWh
NetkW
hGross
kWNetkW
Appliance
Recycling
$741,032
3,094,111
2,134,755
435
303
CommunityBased
Lighting
$886,206
6,810,512
6,810,512
00
Residen
tialDem
andResponse
$3,449,024
271,500
271,500
45,013
45,013
IncomeQualifiedWeatherization
$1,796,283
2,075,379
2,050,612
349
333
Lighting&Appliances
$2,857,486
20,101,826
16,081,461
1,662
1,329
Multifam
ily$2,162,507
5,712,946
5,668,546
732
702
PeerComparison
$1,466,814
32,000,000
32,000,000
7,008
7,008
SchoolEducation
$765,616
3,645,329
3,645,329
459
459
WholeHome
$3,654,230
7,217,828
6,351,689
1,968
1,732
BusinessCustom
$3,117,009
20,423,307
16,338,646
4,077
3,261
BusinessDem
andResponse
$155,600
10,500
10,500
1,400
1,400
BusinessPrescriptive
$6,535,566
57,697,862
38,657,568
11,125
7,454
SBDI
$1,157,202
4,787,315
4,543,480
543
515
RES
$17,779,197
80,929,431
75,014,402
57,626
56,879
C&I
$10,965,377
82,918,984
59,550,194
17,145
12,631
DirectSubtotal
$28,744,574
163,848,415
134,564,596
74,771
69,509
IndirectSubtotal
$1,655,000
Portfolio
Total
$30,399,574
163,848,415
134,564,596
74,771
69,509
Attachment JFW-10
Page 1 of 3

IURCCause
No.44945
Petitioner’sAttachmen
tZE
1S
Page2of3
2019Summary
Program
Budget
EnergySavings
Deman
dSavings
Gross
kWh
NetkW
hGross
kWNetkW
Appliance
Recycling
$742,623
3,094,111
2,134,755
435
303
CommunityBased
Lighting
$842,613
6,810,512
6,810,512
00
Residen
tialDem
andResponse
$3,591,243
240,900
240,900
47,637
47,637
IncomeQualifiedWeatherization
$1,730,803
2,075,379
2,050,612
349
333
Lighting&Appliances
$2,686,088
20,210,358
16,168,286
1,672
1,337
Multifam
ily$2,108,419
5,712,946
5,668,546
732
702
PeerComparison
$1,466,814
32,000,000
32,000,000
7,008
7,008
SchoolEducation
$783,518
3,749,481
3,749,481
472
472
WholeHome
$3,598,047
7,217,828
6,351,689
1,968
1,732
BusinessCustom
$3,623,009
25,376,337
20,301,070
4,655
3,724
BusinessDem
andResponse
$155,600
10,500
10,500
1,400
1,400
BusinessPrescriptive
$6,296,532
52,959,206
35,482,668
10,219
6,847
SBDI
$1,184,594
4,787,315
4,543,480
543
515
RES
$17,550,168
81,111,515
75,174,780
60,273
59,524
C&I
$11,259,734
83,133,359
60,337,718
16,817
12,486
DirectSubtotal
$28,809,902
164,244,874
135,512,498
77,090
72,010
IndirectSubtotal
$1,655,000
Portfolio
Total
$30,464,902
164,244,874
135,512,498
77,090
72,010
Attachment JFW-10
Page 2 of 3

IURCCause
No.44945
Petitioner’sAttachmen
tZE
1S
Page3of3
2020Summary
Program
Budget
EnergySavings
Deman
dSavings
Gross
kWh
NetkW
hGross
kWNetkW
Appliance
Recycling
$757,096
3,016,303
2,092,738
430
300
CommunityBased
Lighting
$445,249
2,043,824
2,043,824
00
Residen
tialDem
andResponse
$3,722,554
210,312
210,312
50,286
50,286
IncomeQualifiedWeatherization
$1,741,330
1,918,623
1,897,215
349
333
Lighting&Appliances
$2,584,972
10,210,527
8,168,422
630
504
Multifam
ily$2,128,545
4,855,313
4,817,008
622
593
PeerComparison
$1,466,814
32,000,000
32,000,000
7,008
7,008
SchoolEducation
$852,761
3,160,849
3,160,849
363
363
WholeHome
$3,627,003
6,618,468
5,824,252
1,890
1,664
BusinessCustom
$4,187,062
30,921,770
24,737,416
4,338
3,470
BusinessDem
andResponse
$155,600
10,500
10,500
1,400
1,400
BusinessPrescriptive
$6,321,391
39,143,050
26,225,844
7,002
4,692
SBDI
$1,242,885
3,586,338
3,403,424
321
304
RES
$17,326,323
64,034,220
60,214,621
61,579
61,051
C&I
$11,906,938
73,661,659
54,377,184
13,061
9,866
DirectSubtotal
$29,233,261
137,695,878
114,591,805
74,640
70,917
IndirectSubtotal
$1,655,000
Portfolio
Total
$30,888,261
137,695,878
114,591,805
74,640
70,917
Attachment JFW-10
Page 3 of 3

ATTACHMENT JFW-11
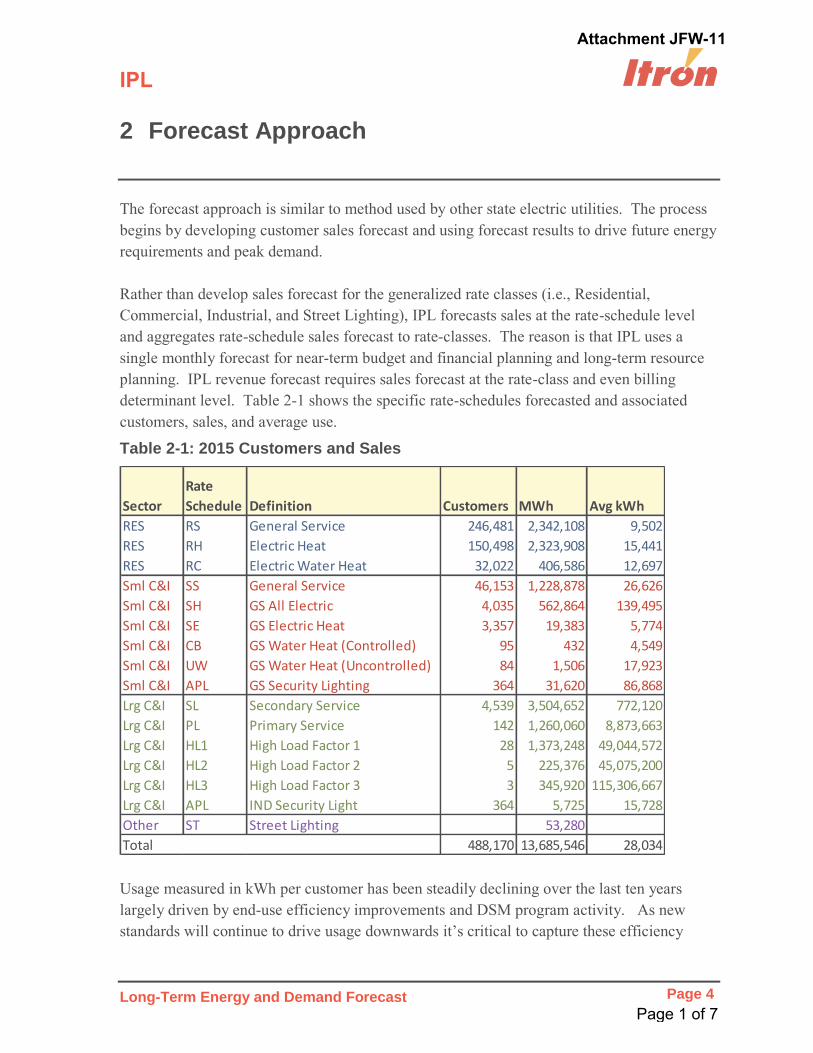
IPL
Long-Term Energy and Demand Forecast Page 4
2 Forecast Approach
Table 2-1: 2015 Customers and Sales
SectorRate Schedule Definition Customers MWh Avg kWh
RES RS General Service 246,481 2,342,108 9,502RES RH Electric Heat 150,498 2,323,908 15,441RES RC Electric Water Heat 32,022 406,586 12,697Sml C&I SS General Service 46,153 1,228,878 26,626Sml C&I SH GS All Electric 4,035 562,864 139,495Sml C&I SE GS Electric Heat 3,357 19,383 5,774Sml C&I CB GS Water Heat (Controlled) 95 432 4,549Sml C&I UW GS Water Heat (Uncontrolled) 84 1,506 17,923Sml C&I APL GS Security Lighting 364 31,620 86,868Lrg C&I SL Secondary Service 4,539 3,504,652 772,120Lrg C&I PL Primary Service 142 1,260,060 8,873,663Lrg C&I HL1 High Load Factor 1 28 1,373,248 49,044,572Lrg C&I HL2 High Load Factor 2 5 225,376 45,075,200Lrg C&I HL3 High Load Factor 3 3 345,920 115,306,667Lrg C&I APL IND Security Light 364 5,725 15,728Other ST Street Lighting 53,280Total 488,170 13,685,546 28,034
Attachment JFW-11
Page 1 of 7

IPL
Long-Term Energy and Demand Forecast Page 5
Figure 3: Residential Forecast Model Framework
Attachment JFW-11
Page 2 of 7
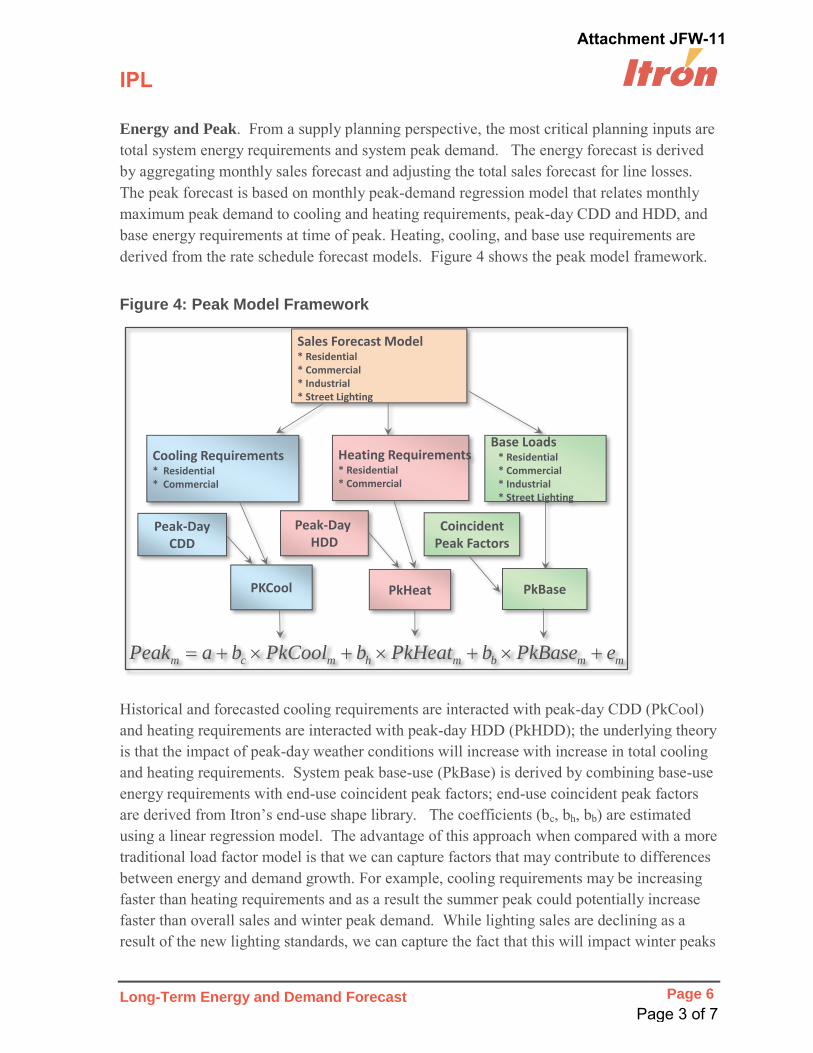
IPL
Long-Term Energy and Demand Forecast Page 6
Energy and Peak
Figure 4: Peak Model Framework
Cooling Requirements* Residential* Commercial
Heating Requirements* Residential* Commercial
Base Loads* Residential* Commercial* Industrial* Street Lighting
Peak-Day HDD
Peak-DayCDD
PKCool PkHeat PkBase
mmbmhmcm ePkBasebPkHeatbPkCoolbaPeak
Sales Forecast Model* Residential* Commercial* Industrial* Street Lighting
CoincidentPeak Factors
Attachment JFW-11
Page 3 of 7

IPL
Long-Term Energy and Demand Forecast Page 7
2.1 Residential Models
Average Use.
Figure 5: Residential Weather Response Curves
Attachment JFW-11
Page 4 of 7

IPL
Long-Term Energy and Demand Forecast Page 8
Figure 6: Residential Average Use (Excluding DSM Program Savings)
Customer Forecast
Forecast
RS
RC
RH
Total Rate Class
Attachment JFW-11
Page 5 of 7

IPL
Long-Term Energy and Demand Forecast Page 9
Figure 7: Residential Customers
Attachment JFW-11
Page 6 of 7

IPL
Long-Term Energy and Demand Forecast Page 10
Table 2-2: Residential Forecast (Excluding Future DSM Savings)
2.2 Nonresidential Commercial and Industrial Models
YearSales
(MWh) CustomersAvg. Use
(kWh)2016 5,044,959 431,927 11,6802017 5,143,168 1.9% 433,312 0.3% 11,869 1.6%2018 5,158,436 0.3% 436,053 0.6% 11,830 -0.3%2019 5,172,841 0.3% 438,998 0.7% 11,783 -0.4%2020 5,200,609 0.5% 441,877 0.7% 11,769 -0.1%2021 5,210,360 0.2% 444,712 0.6% 11,716 -0.5%2022 5,237,255 0.5% 447,074 0.5% 11,715 0.0%2023 5,272,924 0.7% 449,772 0.6% 11,724 0.1%2024 5,325,273 1.0% 452,719 0.7% 11,763 0.3%2025 5,358,336 0.6% 455,803 0.7% 11,756 -0.1%2026 5,399,202 0.8% 458,957 0.7% 11,764 0.1%2027 5,445,053 0.8% 461,977 0.7% 11,786 0.2%2028 5,503,149 1.1% 464,906 0.6% 11,837 0.4%2029 5,548,440 0.8% 468,010 0.7% 11,855 0.2%2030 5,596,246 0.9% 471,305 0.7% 11,874 0.2%2031 5,647,282 0.9% 474,723 0.7% 11,896 0.2%2032 5,709,122 1.1% 478,071 0.7% 11,942 0.4%2033 5,754,021 0.8% 481,341 0.7% 11,954 0.1%2034 5,811,200 1.0% 484,556 0.7% 11,993 0.3%2035 5,870,805 1.0% 487,634 0.6% 12,039 0.4%2036 5,937,316 1.1% 490,584 0.6% 12,103 0.5%2037 5,981,896 0.8% 493,391 0.6% 12,124 0.2%
16-37 0.8% 0.6% 0.2%
Attachment JFW-11
Page 7 of 7

ATTACHMENT JFW-12

Attachment JFW-12
Page 1 of 1