2018-070 florida gateway college - florida auditor … of trustees and president during the 2016-17...
TRANSCRIPT

Sherrill F. Norman, CPA
Auditor General
Report No. 2018-070
December 2017
FLORIDA GATEWAY COLLEGE
For the Fiscal Year Ended
June 30, 2017
Finan
cial Audit
Board of Trustees and President
During the 2016-17 fiscal year, Dr. Lawrence M. Barrett served as President of Florida Gateway
College and the following individuals served as Members of the Board of Trustees: a
CountySuzanne M. Norris, Chair from 8-9-16 Columbia Lindsey Lander, Vice Chair GilchristDr. Athena Randolph, Chair through 8-8-16 Columbia Carolyn Renae Allen UnionRobert C. Brannan III BakerKathryn L. McInnis DixieDr. Miguel J. Tepedino Columbia
a Two Member positions were vacant during the 2016-17 fiscal year.
The Auditor General conducts audits of governmental entities to provide the Legislature, Florida’s citizens, public entity
management, and other stakeholders unbiased, timely, and relevant information for use in promoting government
accountability and stewardship and improving government operations.
The team leader was M. Cecilia Brown, and the audit was supervised by Glenda K. Hart, CPA.
Please address inquiries regarding this report to Jaime N. Hoelscher, CPA, Audit Manager, by e-mail at
[email protected] or by telephone at (850) 412-2868.
This report and other reports prepared by the Auditor General are available at:
FLAuditor.gov
Printed copies of our reports may be requested by contacting us at:
State of Florida Auditor General
Claude Pepper Building, Suite G74 ∙ 111 West Madison Street ∙ Tallahassee, FL 32399-1450 ∙ (850) 412-2722

FLORIDA GATEWAY COLLEGE
TABLE OF CONTENTS
Page No.
SUMMARY ........................................................................................................................................... i
INDEPENDENT AUDITOR’S REPORT ................................................................................................ 1
Report on the Financial Statements ................................................................................................. 1
Other Reporting Required by Government Auditing Standards ....................................................... 2
MANAGEMENT’S DISCUSSION AND ANALYSIS .............................................................................. 4
BASIC FINANCIAL STATEMENTS
Statement of Net Position ................................................................................................................ 14
Statement of Revenues, Expenses, and Changes in Net Position .................................................. 16
Statement of Cash Flows ................................................................................................................. 18
Notes to Financial Statements ......................................................................................................... 20
OTHER REQUIRED SUPPLEMENTARY INFORMATION
Schedule of Funding Progress – Other Postemployment Benefits Plan .......................................... 41
Schedule of the College’s Proportionate Share of the Net Pension Liability – Florida Retirement System Pension Plan ................................................................................................... 41
Schedule of College Contributions – Florida Retirement System Pension Plan .............................. 42
Schedule of the College’s Proportionate Share of the Net Pension Liability – Health Insurance Subsidy Pension Plan.... ................................................................................................ 42
Schedule of College Contributions – Health Insurance Subsidy Pension Plan ................................ 42
Notes to Required Supplementary Information ................................................................................ 43
INDEPENDENT AUDITOR’S REPORT ON INTERNAL CONTROL OVER FINANCIAL REPORTING AND ON COMPLIANCE AND OTHER MATTERS BASED ON AN AUDIT OF FINANCIAL STATEMENTS PERFORMED IN ACCORDANCE WITH GOVERNMENT AUDITING STANDARDS ................................................ 44
Internal Control Over Financial Reporting ........................................................................................ 44
Compliance and Other Matters ........................................................................................................ 45
Purpose of this Report ..................................................................................................................... 45
FINDING AND RECOMMENDATION ................................................................................................... 46

Report No. 2018-070 December 2017 Page i
SUMMARY
SUMMARY OF REPORT ON FINANCIAL STATEMENTS
Our audit disclosed that the basic financial statements of Florida Gateway College (a component unit of
the State of Florida) were presented fairly, in all material respects, in accordance with prescribed financial
reporting standards.
SUMMARY OF REPORT ON INTERNAL CONTROL AND COMPLIANCE
We noted a certain matter involving the College’s internal control over financial reporting and its operation
that we consider to be a significant deficiency, as summarized below. However, this significant deficiency
is not considered to be a material weakness.
Significant Deficiency
The College’s financial reporting procedures need improvement to ensure that
notes payable, contractual services expense, and related account balances and transactions are properly
reported in the correct period.
The results of our tests disclosed no instances of noncompliance or other matters that are required to be
reported under Government Auditing Standards issued by the Comptroller General of the United States.
AUDIT OBJECTIVES AND SCOPE
Our audit objectives were to determine whether Florida Gateway College and its officers with
administrative and stewardship responsibilities for College operations had:
Presented the College’s basic financial statements in accordance with generally accepted accounting principles;
Established and implemented internal control over financial reporting and compliance with requirements that could have a direct and material effect on the financial statements; and
Complied with the various provisions of laws, rules, regulations, contracts, and grant agreements that are material to the financial statements.
The scope of this audit included an examination of the College’s basic financial statements as of and for
the fiscal year ended June 30, 2017. We obtained an understanding of the College’s environment,
including its internal control, and assessed the risk of material misstatement necessary to plan the audit
of the basic financial statements. We also examined various transactions to determine whether they
were executed, in both manner and substance, in accordance with governing provisions of laws, rules,
regulations, contracts, and grant agreements.
An examination of Federal awards administered by the College is included within the scope of our
Statewide audit of Federal awards administered by the State of Florida.
AUDIT METHODOLOGY
The methodology used to develop the finding in this report included the examination of pertinent College
records in connection with the application of procedures required by auditing standards generally
Report No. 2018-070 Page ii December 2017
accepted in the United States of America and applicable standards contained in Government Auditing
Standards, issued by the Comptroller General of the United States.
Report No. 2018-070 December 2017 Page 1
Phone: (850) 412-2722 Fax: (850) 488-6975
Sherrill F. Norman, CPA Auditor General
AUDITOR GENERAL STATE OF FLORIDA Claude Denson Pepper Building, Suite G74
111 West Madison Street Tallahassee, Florida 32399-1450
The President of the Senate, the Speaker of the House of Representatives, and the Legislative Auditing Committee
INDEPENDENT AUDITOR’S REPORT
Report on the Financial Statements
We have audited the accompanying financial statements of Florida Gateway College, a component unit
of the State of Florida, and its discretely presented component unit as of and for the fiscal year ended
June 30, 2017, and the related notes to the financial statements, which collectively comprise the College’s
basic financial statements as listed in the table of contents.
Management’s Responsibility for the Financial Statements
Management is responsible for the preparation and fair presentation of these financial statements in
accordance with accounting principles generally accepted in the United States of America; this includes
the design, implementation, and maintenance of internal control relevant to the preparation and fair
presentation of financial statements that are free from material misstatement, whether due to fraud or
error.
Auditor’s Responsibility
Our responsibility is to express opinions on these financial statements based on our audit. We did not
audit the financial statements of the discretely presented component unit, which represent 100 percent
of the transactions and account balances of the discretely presented component unit’s column. Those
statements were audited by other auditors whose report has been furnished to us, and our opinion, insofar
as it relates to the amounts included for the discretely presented component unit, is based solely on the
report of the other auditors. We conducted our audit in accordance with auditing standards generally
accepted in the United States of America and the standards applicable to financial audits contained in
Government Auditing Standards, issued by the Comptroller General of the United States. Those
standards require that we plan and perform the audit to obtain reasonable assurance about whether the
financial statements are free from material misstatement.
An audit involves performing procedures to obtain audit evidence about the amounts and disclosures in
the financial statements. The procedures selected depend on the auditor’s judgment, including the

Report No. 2018-070 Page 2 December 2017
assessment of the risks of material misstatement of the financial statements, whether due to fraud or
error. In making those risk assessments, the auditor considers internal control relevant to the entity’s
preparation and fair presentation of the financial statements in order to design audit procedures that are
appropriate in the circumstances, but not for the purpose of expressing an opinion on the effectiveness
of the entity’s internal control. Accordingly, we express no such opinion. An audit also includes
evaluating the appropriateness of accounting policies used and the reasonableness of significant
accounting estimates made by management, as well as evaluating the overall presentation of the
financial statements.
We believe that the audit evidence we have obtained is sufficient and appropriate to provide a basis for
our audit opinions.
Opinions
In our opinion, based on our audit and the report of other auditors, the financial statements referred to
above present fairly, in all material respects, the respective financial position of Florida Gateway College
and of its discretely presented component unit as of June 30, 2017, and the respective changes in
financial position and, where applicable, cash flows thereof for the fiscal year then ended in accordance
with accounting principles generally accepted in the United States of America.
Other Matter
Required Supplementary Information
Accounting principles generally accepted in the United States of America require that MANAGEMENT’S
DISCUSSION AND ANALYSIS, the Schedule of Funding Progress – Other Postemployment
Benefits Plan, Schedule of the College’s Proportionate Share of the Net Pension Liability – Florida
Retirement System Pension Plan, Schedule of College Contributions – Florida Retirement System
Pension Plan, Schedule of the College’s Proportionate Share of the Net Pension Liability – Health
Insurance Subsidy Pension Plan, Schedule of College Contributions – Health Insurance Subsidy
Pension Plan, and Notes to Required Supplementary Information, as listed in the table of contents,
be presented to supplement the basic financial statements. Such information, although not a part of the
basic financial statements, is required by the Governmental Accounting Standards Board who considers
it to be an essential part of financial reporting for placing the basic financial statements in an appropriate
operational, economic, or historical context. We and other auditors have applied certain limited
procedures to the required supplementary information in accordance with auditing standards generally
accepted in the United States of America, which consisted of inquiries of management about the methods
of preparing the information and comparing the information for consistency with management’s
responses to our inquiries, the basic financial statements, and other knowledge we obtained during our
audit of the basic financial statements. We do not express an opinion or provide any assurance on the
information because the limited procedures do not provide us with sufficient evidence to express an
opinion or provide any assurance.
Other Reporting Required by Government Auditing Standards
In accordance with Government Auditing Standards, we have also issued a report dated
December 15, 2017, on our consideration of the Florida Gateway College’s internal control over financial
reporting and on our tests of its compliance with certain provisions of laws, rules, regulations, contracts,
Report No. 2018-070 December 2017 Page 3
and grant agreements and other matters included under the heading INDEPENDENT AUDITOR’S
REPORT ON INTERNAL CONTROL OVER FINANCIAL REPORTING AND ON COMPLIANCE AND
OTHER MATTERS BASED ON AN AUDIT OF FINANCIAL STATEMENTS PERFORMED IN
ACCORDANCE WITH GOVERNMENT AUDITING STANDARDS. The purpose of that report is to
describe the scope of our testing of internal control over financial reporting and compliance and the results
of that testing, and not to provide an opinion on the effectiveness of the internal control over financial
reporting or on compliance. That report is an integral part of an audit performed in accordance with
Government Auditing Standards in considering the Florida Gateway College’s internal control over
financial reporting and compliance.
Respectfully submitted,
Sherrill F. Norman, CPA Tallahassee, Florida December 15, 2017
Report No. 2018-070 Page 4 December 2017
MANAGEMENT’S DISCUSSION AND ANALYSIS
Management’s discussion and analysis (MD&A) provides an overview of the financial position and
activities of the College for the fiscal year ended June 30, 2017, and should be read in conjunction with
the financial statements and notes thereto. The MD&A, and financial statements and notes thereto, are
the responsibility of College management. The MD&A contains financial activity of the College for the
fiscal years ended June 30, 2017, and June 30, 2016, and its component unit, The Foundation for Florida
Gateway College, Inc., for the fiscal years ended March 31, 2017 and March 31, 2016.
FINANCIAL HIGHLIGHTS
The College’s assets totaled $50.6 million at June 30, 2017. This balance reflects a $5.9 million, or
13.2 percent increase as compared to the 2015-16 fiscal year, resulting from unexpended note payable
proceeds obtained to finance an energy performance contract. Liabilities increased by $12.3 million, or
119.8 percent, totaling $22.6 million at June 30, 2017, resulting from an increase in net pension liability
and issuance of the note payable. As a result, the College’s net position decreased by $3.6 million,
resulting in a year-end balance of $32.2 million. Deferred outflows of resources increased by $2.2 million
and deferred inflows of resources decreased by $636,000.
The College’s operating revenues totaled $5.6 million for the 2016-17 fiscal year, representing a
0.9 percent increase compared to the 2015-16 fiscal year due mainly to an increase in student and tuition
fee revenue and auxiliary enterprise revenue. Operating expenses totaled $29.8 million for the
2016-17 fiscal year, representing an increase of 9.9 percent as compared to the 2015-16 fiscal year due
mainly to an increase in personnel expenses and an increase of contractual services related to an energy
performance based project.
Net position represents the residual interest in the College’s assets and deferred outflows of resources
after deducting liabilities and deferred inflows of resources. The College’s comparative total net position
by category for the fiscal years ended June 30, 2017, and June 30, 2016, is shown in the following graph:

Report No. 2018-070 December 2017 Page 5
Net Position
(In Thousands)
The following chart provides a graphical presentation of College revenues by category for the
2016-17 fiscal year:
Total Revenues
OVERVIEW OF FINANCIAL STATEMENTS
Pursuant to GASB Statement No. 35, the College’s financial report consists of three basic financial
statements: the statement of net position; the statement of revenues, expenses, and changes in net
position; and the statement of cash flows. The financial statements, and notes thereto, provide
information on the College as a whole, present a long-term view of the College’s finances, and include
activities for the following entities:
$0
$15,000
$30,000
Investment inCapital Assets
Restricted Unrestricted
$28,567
$621$3,057
$29,267
$2,995 $3,591
2017 2016
Operating Revenues
21%
Nonoperating Revenues
75%
Other Revenues4%

Report No. 2018-070 Page 6 December 2017
Florida Gateway College (Primary Institution) – Most of the programs and services generally associated with a college fall into this category, including instruction, public service, and support services.
The Foundation for Florida Gateway College, Inc. (Component Unit) – Although legally separate, this component unit is important because the College is financially accountable for it, as the College reports its financial activities to the State of Florida. The Foundation’s fiscal year differs from the College and covers the period April through March.
The Statement of Net Position
The statement of net position reflects the assets, deferred outflows of resources, liabilities, and deferred
inflows of resources of the College, using the accrual basis of accounting, and presents the financial
position of the College at a specified time. Assets, plus deferred outflows of resources, less liabilities,
less deferred inflows of resources, equals net position, which is one indicator of the College’s current
financial condition. The changes in net position that occur over time indicate improvement or deterioration
in the College’s financial condition.
The following summarizes the College’s assets, deferred outflows of resources, liabilities, deferred
inflows of resources, and net position at June 30:
Condensed Statement of Net Position at June 30
(In Thousands)
6-30-17 6-30-16 3-31-17 3-31-16
AssetsCurrent Assets 15,076$ 7,931$ 11,989$ 10,746$ Capital Assets, Net 28,567 29,267 216 231 Other Noncurrent Assets 6,908 7,472 4,332 4,190
Total Assets 50,551 44,670 16,537 15,167
Deferred Outflows of Resources 4,666 2,468 - -
LiabilitiesCurrent Liabilities 2,654 2,011 315 65 Noncurrent Liabilities 19,952 8,272 - -
Total Liabilities 22,606 10,283 315 65
Deferred Inflows of Resources 366 1,002 - -
Net PositionInvestment in Capital Assets 28,567 29,267 216 231 Restricted 621 2,995 15,270 14,216 Unrestricted 3,057 3,591 736 655
Total Net Position 32,245$ 35,853$ 16,222$ 15,102$
College Component Unit
Total assets increased by $5.9 million primarily due to unexpended proceeds from issuance of note
payable issued to finance an energy performance contract. Total liabilities increased $12.3 million
primarily from a $3.4 million increase in the net pension liability and the issuance of the $8.6 million note

Report No. 2018-070 December 2017 Page 7
payable. The net effect of the increase in assets and increase in deferred outflows of resources, coupled
with the increase in liabilities and decrease in deferred inflows of resources resulted in a decrease of
$3.6 million in total net position.
The Statement of Revenues, Expenses, and Changes in Net Position
The statement of revenues, expenses, and changes in net position presents the College’s revenue and
expense activity, categorized as operating and nonoperating. Revenues and expenses are recognized
when earned or incurred, regardless of when cash is received or paid.
The following summarizes the College’s activity for the 2016-17 and 2015-16 fiscal years:
Condensed Statement of Revenues, Expenses, and Changes in Net Position For the Fiscal Years
(In Thousands)
6-30-17 6-30-16 3-31-17 3-31-16
Operating Revenues 5,622$ 5,573$ 963$ 752$ Less, Operating Expenses 29,782 27,090 1,588 1,089
Operating Loss (24,160) (21,517) (625) (337) Net Nonoperating Revenues 19,526 18,569 1,542 (386)
Income (Loss) Before Other Revenues, Expenses, Gains, or Losses (4,634) (2,948) 917 (723) Other Revenues 1,026 842 203 63
Net Increase (Decrease) In Net Position (3,608) (2,106) 1,120 (660)
Net Position, Beginning of Year 35,853 37,959 15,102 15,762
Net Position, End of Year 32,245$ 35,853$ 16,222$ 15,102$
College Component Unit
Operating Revenues
GASB Statement No. 35 categorizes revenues as either operating or nonoperating. Operating revenues
generally result from exchange transactions where each of the parties to the transaction either gives or
receives something of equal or similar value.
The following summarizes the operating revenues by source that were used to fund operating activities
for the 2016-17 and 2015-16 fiscal years:
Report No. 2018-070 Page 8 December 2017
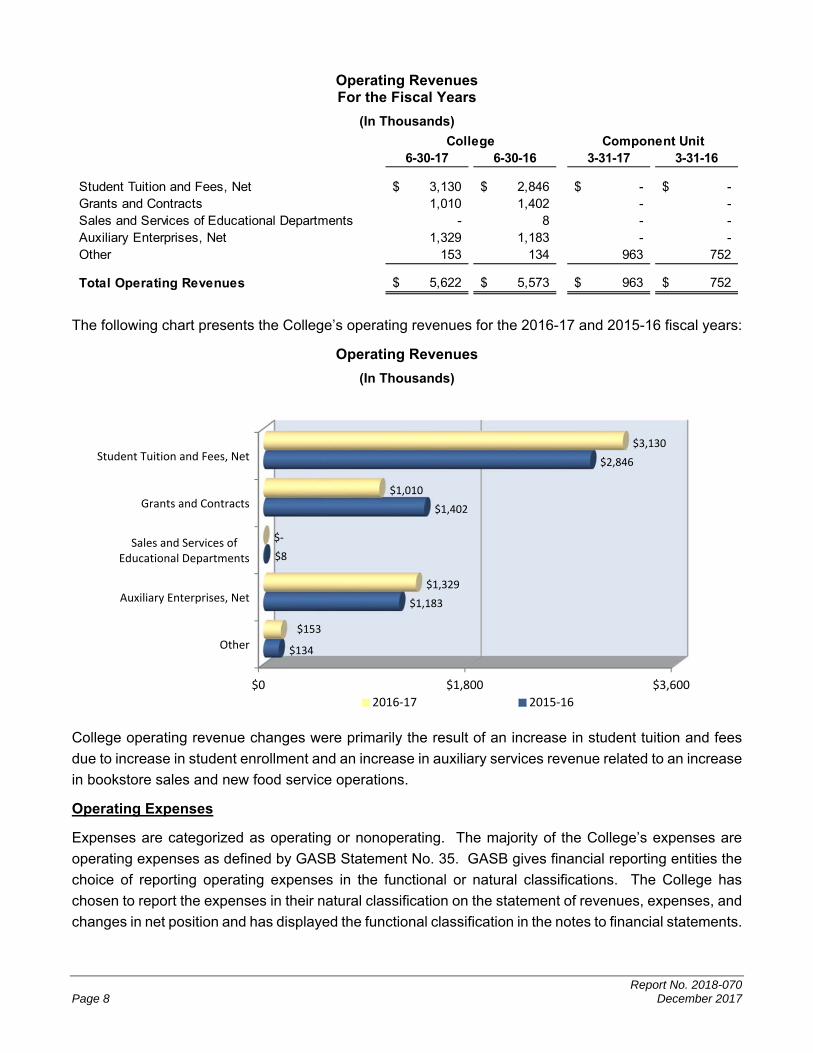
Operating Revenues For the Fiscal Years
(In Thousands)
6-30-17 6-30-16 3-31-17 3-31-16
Student Tuition and Fees, Net 3,130$ 2,846$ -$ -$ Grants and Contracts 1,010 1,402 - - Sales and Services of Educational Departments - 8 - - Auxiliary Enterprises, Net 1,329 1,183 - - Other 153 134 963 752
Total Operating Revenues 5,622$ 5,573$ 963$ 752$
College Component Unit
The following chart presents the College’s operating revenues for the 2016-17 and 2015-16 fiscal years:
Operating Revenues
(In Thousands)
College operating revenue changes were primarily the result of an increase in student tuition and fees
due to increase in student enrollment and an increase in auxiliary services revenue related to an increase
in bookstore sales and new food service operations.
Operating Expenses
Expenses are categorized as operating or nonoperating. The majority of the College’s expenses are
operating expenses as defined by GASB Statement No. 35. GASB gives financial reporting entities the
choice of reporting operating expenses in the functional or natural classifications. The College has
chosen to report the expenses in their natural classification on the statement of revenues, expenses, and
changes in net position and has displayed the functional classification in the notes to financial statements.
$0 $1,800 $3,600
Other
Auxiliary Enterprises, Net
Sales and Services ofEducational Departments
Grants and Contracts
Student Tuition and Fees, Net
$134
$1,183
$8
$1,402
$2,846
$153
$1,329
$‐
$1,010
$3,130
2016‐17 2015‐16

Report No. 2018-070 December 2017 Page 9
The following summarizes operating expenses by natural classification for the 2016-17 and 2015-16 fiscal
years:
Operating Expenses For the Fiscal Years
(In Thousands)
6-30-17 6-30-16 3-31-17 3-31-16
Personnel Services 16,780$ 15,440$ -$ -$ Scholarships and Waivers 1,963 2,050 655 543 Utilities and Communications 917 935 - - Contractual Services 3,851 1,753 654 61 Other Services and Expenses 2,084 2,170 273 461 Materials and Supplies 2,484 2,981 - 18 Depreciation 1,703 1,761 6 6
Total Operating Expenses 29,782$ 27,090$ 1,588$ 1,089$
College Component Unit
The following chart presents the College’s operating expenses for the 2016-17 and 2015-16 fiscal years:
Operating Expenses
(In Thousands)
College operating expense changes were the result of the following factors:
Personnel services increased $1.3 million primarily related to an increase in pension expense.
Contractual services increased $2.1 million primarily related to contract payments for an energy performance based project.
$0 $10,000 $20,000
Depreciation
Materials and Supplies
Other Services andExpenses
Contractual Services
Utilities andCommunications
Scholarships and Waivers
Personnel Services
$1,761
$2,981
$2,170
$1,753
$935
$2,050
$15,440
$1,703
$2,484
$2,084
$3,851
$917
$1,963
$16,780
2016‐17 2015‐16
Report No. 2018-070 Page 10 December 2017
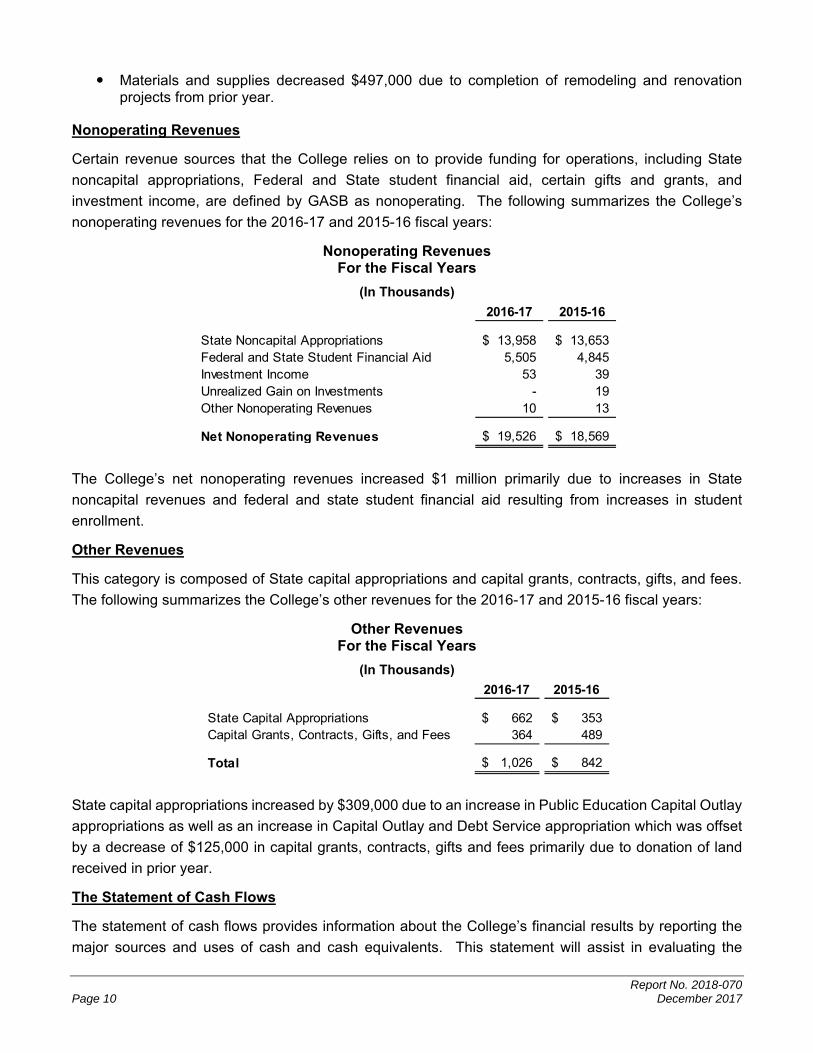
Materials and supplies decreased $497,000 due to completion of remodeling and renovation projects from prior year.
Nonoperating Revenues
Certain revenue sources that the College relies on to provide funding for operations, including State
noncapital appropriations, Federal and State student financial aid, certain gifts and grants, and
investment income, are defined by GASB as nonoperating. The following summarizes the College’s
nonoperating revenues for the 2016-17 and 2015-16 fiscal years:
Nonoperating Revenues For the Fiscal Years
(In Thousands)
2016-17 2015-16
State Noncapital Appropriations 13,958$ 13,653$ Federal and State Student Financial Aid 5,505 4,845 Investment Income 53 39 Unrealized Gain on Investments - 19 Other Nonoperating Revenues 10 13
Net Nonoperating Revenues 19,526$ 18,569$
The College’s net nonoperating revenues increased $1 million primarily due to increases in State
noncapital revenues and federal and state student financial aid resulting from increases in student
enrollment.
Other Revenues
This category is composed of State capital appropriations and capital grants, contracts, gifts, and fees.
The following summarizes the College’s other revenues for the 2016-17 and 2015-16 fiscal years:
Other Revenues For the Fiscal Years
(In Thousands)
2016-17 2015-16
State Capital Appropriations 662$ 353$ Capital Grants, Contracts, Gifts, and Fees 364 489
Total 1,026$ 842$
State capital appropriations increased by $309,000 due to an increase in Public Education Capital Outlay
appropriations as well as an increase in Capital Outlay and Debt Service appropriation which was offset
by a decrease of $125,000 in capital grants, contracts, gifts and fees primarily due to donation of land
received in prior year.
The Statement of Cash Flows
The statement of cash flows provides information about the College’s financial results by reporting the
major sources and uses of cash and cash equivalents. This statement will assist in evaluating the

Report No. 2018-070 December 2017 Page 11
College’s ability to generate net cash flows, its ability to meet its financial obligations as they come due,
and its need for external financing. Cash flows from operating activities show the net cash used by the
operating activities of the College. Cash flows from capital financing activities include all plant funds and
related long-term debt activities. Cash flows from investing activities show the net source and use of
cash related to purchasing or selling investments, and earning income on those investments. Cash flows
from noncapital financing activities include those activities not covered in other sections.
The following summarizes the College’s cash flows for the 2016-17 and 2015-16 fiscal years:
Condensed Statement of Cash Flows For the Fiscal Years
(In Thousands)
2016-17 2015-16
Cash Provided (Used) by:Operating Activities (21,537)$ (20,178)$ Noncapital Financing Activities 18,786 18,505 Capital and Related Financing Activities 8,207 701 Investing Activities 53 58
Net Increase (Decrease) in Cash and Cash Equivalents 5,509 (914) Cash and Cash Equivalents, Beginning of Year 8,731 9,645
Cash and Cash Equivalents, End of Year 14,240$ 8,731$
Major sources of funds came from State noncapital appropriations ($14 million), net student tuition and
fees ($3.1 million), Federal and State financial aid ($5 million), grants and contracts ($1.1 million),
proceeds from capital debt ($8.6 million), and auxiliary enterprises, net (bookstore receipts) ($1.3 million).
Major uses of funds were for payments to employees and for employee benefits ($16.1 million), payments
for scholarships ($2 million), and payments to providers of goods and services ($8.2 million).
Cash and cash equivalents increased by $5.5 million during the 2016-17 fiscal year, primarily due to the
issuance of a note payable to finance an energy performance contract.
CAPITAL ASSETS AND DEBT ADMINISTRATION
Capital Assets
At June 30, 2017, the College had $65.5 million in capital assets, less accumulated depreciation of
$36.9 million, for net capital assets of $28.6 million. Depreciation charges for the current fiscal year
totaled $1.7 million. The following table summarizes the College’s capital assets, net of accumulated
depreciation, at June 30:

Report No. 2018-070 Page 12 December 2017
Capital Assets, Net at June 30
(In Thousands)
2017 2016
Land 408$ 408$ Buildings 25,905 26,336 Other Structures and Improvements 1,524 1,826 Furniture, Machinery, and Equipment 730 697
Capital Assets, Net 28,567$ 29,267$
Additional information about the College’s capital assets is presented in the notes to the financial
statements.
Debt Administration
As of June 30, 2017, the College had $8.6 million in outstanding long-term debt versus none at the end
of the prior fiscal year. This debt consists of a note payable issued during the fiscal year to finance an
energy performance contract. Additional information about the College’s long-term debt is presented in
the notes to financial statements.
ECONOMIC FACTORS THAT WILL AFFECT THE FUTURE
The College’s economic condition is closely tied to that of the State of Florida. Because of limited
economic growth and increased demand for State resources, only a modest increase in State funding is
anticipated in the 2017-18 fiscal year. The College’s current financial and capital plans indicate that the
infusion of additional financial resources from an increase in tuition rates will be necessary to maintain
its present level of services.
REQUESTS FOR INFORMATION
Questions concerning information provided in the MD&A or other required supplementary information,
and financial statements and notes thereto, or requests for additional financial information should be
addressed to Michelle Holloway, the Vice President for Financial Services, Florida Gateway College,
149 SE College Place, Lake City, Florida 32025.

Report No. 2018-070 December 2017 Page 13
THIS PAGE INTENTIONALLY LEFT BLANK
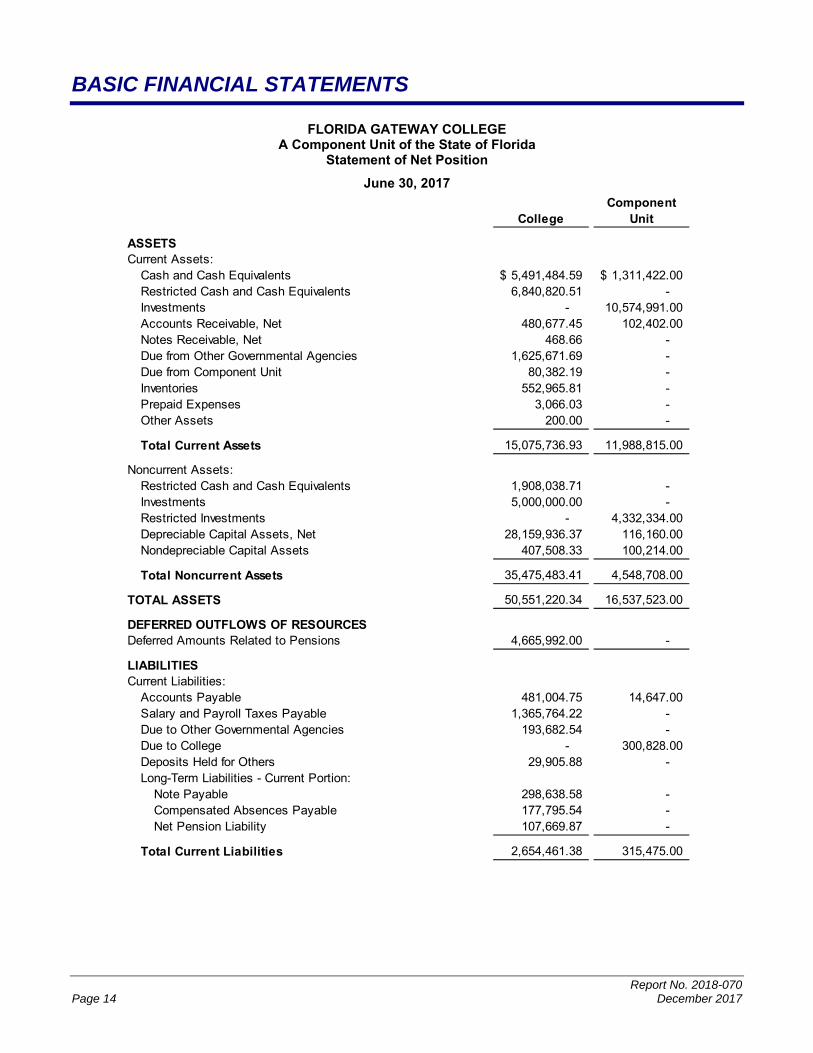
Report No. 2018-070 Page 14 December 2017
BASIC FINANCIAL STATEMENTS
FLORIDA GATEWAY COLLEGE A Component Unit of the State of Florida
Statement of Net Position
June 30, 2017
ComponentCollege Unit
ASSETSCurrent Assets:
Cash and Cash Equivalents 5,491,484.59$ 1,311,422.00$ Restricted Cash and Cash Equivalents 6,840,820.51 - Investments - 10,574,991.00 Accounts Receivable, Net 480,677.45 102,402.00 Notes Receivable, Net 468.66 - Due from Other Governmental Agencies 1,625,671.69 - Due from Component Unit 80,382.19 - Inventories 552,965.81 - Prepaid Expenses 3,066.03 - Other Assets 200.00 -
Total Current Assets 15,075,736.93 11,988,815.00
Noncurrent Assets:Restricted Cash and Cash Equivalents 1,908,038.71 - Investments 5,000,000.00 - Restricted Investments - 4,332,334.00 Depreciable Capital Assets, Net 28,159,936.37 116,160.00 Nondepreciable Capital Assets 407,508.33 100,214.00
Total Noncurrent Assets 35,475,483.41 4,548,708.00
TOTAL ASSETS 50,551,220.34 16,537,523.00
DEFERRED OUTFLOWS OF RESOURCESDeferred Amounts Related to Pensions 4,665,992.00 -
LIABILITIESCurrent Liabilities:
Accounts Payable 481,004.75 14,647.00 Salary and Payroll Taxes Payable 1,365,764.22 - Due to Other Governmental Agencies 193,682.54 - Due to College - 300,828.00 Deposits Held for Others 29,905.88 - Long-Term Liabilities - Current Portion:
Note Payable 298,638.58 - Compensated Absences Payable 177,795.54 - Net Pension Liability 107,669.87 -
Total Current Liabilities 2,654,461.38 315,475.00

Report No. 2018-070 December 2017 Page 15
FLORIDA GATEWAY COLLEGE A Component Unit of the State of Florida
Statement of Net Position (Continued)
June 30, 2017
ComponentCollege Unit
2,654,461 LIABILITIES (Continued)Noncurrent Liabilities:
Note Payable 8,333,477.42 - Compensated Absences Payable 1,175,057.72 - Other Postemployment Benefits Payable 230,697.00 - Net Pension Liability 10,212,943.13 -
Total Noncurrent Liabilities 19,952,175.27 -
TOTAL LIABILITIES 22,606,636.65 315,475.00
DEFERRED INFLOWS OF RESOURCESDeferred Amounts Related to Pensions 365,705.00 -
NET POSITIONInvestment in Capital Assets 28,567,444.70 216,374.00 Restricted:
Nonexpendable: Endowment - 4,340,332.00
Expendable:Grants and Loans 284,770.71 10,929,466.00 Scholarships 89,983.40 - Capital Projects 246,107.67 -
Unrestricted 3,056,564.21 735,876.00
TOTAL NET POSITION 32,244,870.69$ 16,222,048.00$
The accompanying notes to financial statements are an integral part of this statement.

Report No. 2018-070 Page 16 December 2017
FLORIDA GATEWAY COLLEGE A Component Unit of the State of Florida
Statement of Revenues, Expenses, and Changes in Net Position
For the Fiscal Year Ended June 30, 2017
ComponentCollege Unit
REVENUESOperating Revenues:
Student Tuition and Fees, Net of Scholarship Allowances of $2,572,394.49 3,129,998.58$ -$ Federal Grants and Contracts 512,651.76 - State and Local Grants and Contracts 10,478.30 - Nongovernmental Grants and Contracts 487,661.16 - Auxiliary Enterprises, Net of Scholarship Allowances of $466,591.47 1,328,783.30 - Other Operating Revenues 152,912.20 963,424.00
Total Operating Revenues 5,622,485.30 963,424.00
EXPENSESOperating Expenses:
Personnel Services 16,780,181.82 - Scholarships and Waivers 1,962,979.31 655,145.00 Utilities and Communications 916,595.04 - Contractual Services 3,851,271.66 654,537.00 Other Services and Expenses 2,084,230.35 272,551.00 Materials and Supplies 2,484,110.95 - Depreciation 1,702,592.30 6,016.00
Total Operating Expenses 29,781,961.43 1,588,249.00
Operating Loss (24,159,476.13) (624,825.00)
NONOPERATING REVENUES (EXPENSES)State Noncapital Appropriations 13,957,903.27 - Federal and State Student Financial Aid 5,504,826.13 - Investment Income 52,899.47 233,068.00 Other Nonoperating Revenues 10,000.00 1,372,729.00 Loss on Disposal of Capital Assets - (10,960.00) Other Nonoperating Expenses - (52,655.00)
Net Nonoperating Revenues (Expenses) 19,525,628.87 1,542,182.00
Income (Loss) Before Other Revenues (4,633,847.26) 917,357.00
State Capital Appropriations 662,372.88 - Capital Grants, Contracts, Gifts, and Fees 363,422.92 202,896.00
Total Other Revenues 1,025,795.80 202,896.00
Increase (Decrease) in Net Position (3,608,051.46) 1,120,253.00
Net Position, Beginning of Year 35,852,922.15 15,101,795.00
Net Position, End of Year 32,244,870.69$ 16,222,048.00$
The accompanying notes to financial statements are an integral part of this statement.

Report No. 2018-070 December 2017 Page 17
THIS PAGE INTENTIONALLY LEFT BLANK

Report No. 2018-070 Page 18 December 2017
FLORIDA GATEWAY COLLEGE A Component Unit of the State of Florida
Statement of Cash Flows
For the Fiscal Year Ended June 30, 2017
College
CASH FLOWS FROM OPERATING ACTIVITIESStudent Tuition and Fees, Net 3,061,519.00$ Grants and Contracts 1,105,720.90 Payments to Suppliers (8,167,462.38) Payments for Utilities and Communications (916,595.04) Payments to Employees (12,787,585.33) Payments for Employee Benefits (3,345,178.35) Payments for Scholarships (1,962,979.31) Collection on Loans to Students 383.72 Auxiliary Enterprises, Net 1,333,652.91 Other Receipts 141,964.11
Net Cash Used by Operating Activities (21,536,559.77)
CASH FLOWS FROM NONCAPITAL FINANCING ACTIVITIESState Noncapital Appropriations 13,957,903.27 Federal and State Student Financial Aid 4,978,551.80 Federal Direct Loan Program Receipts 980,682.67 Federal Direct Loan Program Disbursements (1,130,704.00)
Net Cash Provided by Noncapital Financing Activities 18,786,433.74
CASH FLOWS FROM CAPITAL AND RELATED FINANCING ACTIVITIESProceeds from Capital Debt 8,632,116.00 State Capital Appropriations 204,173.26 Capital Grants and Gifts 363,422.92 Purchases of Capital Assets (1,002,981.59) Other Nonoperating Receipts 10,000.00
Net Cash Provided by Capital and Related Financing Activities 8,206,730.59
CASH FLOWS FROM INVESTING ACTIVITIESInvestment Income 52,899.47
Net Cash Provided by Investing Activities 52,899.47
Net Increase in Cash and Cash Equivalents 5,509,504.03 Cash and Cash Equivalents, Beginning of Year 8,730,839.78
Cash and Cash Equivalents, End of Year 14,240,343.81$

Report No. 2018-070 December 2017 Page 19
FLORIDA GATEWAY COLLEGE A Component Unit of the State of Florida
Statement of Cash Flows (Continued)
For the Fiscal Year Ended June 30, 2017
College
RECONCILIATION OF OPERATING LOSS TO NET CASH USED BY OPERATING ACTIVITIESOperating Loss (24,159,476.13)$ Adjustments to Reconcile Operating Loss to Net Cash Used by Operating Activities:
Depreciation Expense 1,702,592.30 Changes in Assets, Liabilities, Deferred Outflows of Resources, and Deferred Inflows of Resources:
Accounts Receivables, Net (49,156.14) Notes Receivable, Net 383.72 Due from Other Governmental Agencies 80,475.85 Inventories 31,640.54 Prepaid Expenses (174.94) Accounts Payable 220,684.98 Salary and Payroll Taxes Payable 213,147.95 Due to Other Governmental Agencies (16,367.56) Unearned Revenue (470.88) Deposits Held for Others 5,890.35 Compensated Absences Payable (177,994.81) Other Postemployment Benefits Payable 5,498.00 Net Pension Liability 3,441,232.00 Deferred Outflows of Resources Related to Pensions (2,197,703.00) Deferred Inflows of Resources Related to Pensions (636,762.00)
NET CASH USED BY OPERATING ACTIVITIES (21,536,559.77)$
The accompanying notes to financial statements are an integral part of this statement.

Report No. 2018-070 Page 20 December 2017
NOTES TO FINANCIAL STATEMENTS
1. Summary of Significant Accounting Policies
Reporting Entity. The governing body of Florida Gateway College, a component unit of the State of
Florida, is the College Board of Trustees. The Board of Trustees constitutes a corporation and is
composed of nine members appointed by the Governor and confirmed by the Senate. The Board of
Trustees is under the general direction and control of the Florida Department of Education, Division of
Florida Colleges, and is governed by State law and State Board of Education (SBE) rules. However, the
Board of Trustees is directly responsible for the day-to-day operations and control of the College within
the framework of applicable State laws and SBE rules. The College serves Baker, Columbia, Dixie,
Gilchrist, and Union Counties.
Criteria for defining the reporting entity are identified and described in the Governmental Accounting
Standards Board’s (GASB) Codification of Governmental Accounting and Financial Reporting Standards,
Sections 2100 and 2600. These criteria were used to evaluate potential component units for which the
Board of Trustees is financially accountable and other organizations for which the nature and significance
of their relationship with the Board of Trustees are such that exclusion would cause the College’s financial
statements to be misleading. Based on the application of these criteria, the College is a component unit
of the State of Florida, and its financial balances and activities are reported in the State’s Comprehensive
Annual Financial Report by discrete presentation.
Discretely Presented Component Unit. Based on the application of the criteria for determining
component units, The Foundation for Florida Gateway College, Inc. (Foundation), a legally separate
entity, is included within the College’s reporting entity as a discretely presented component unit and is
governed by a separate board.
The Foundation is also a direct-support organization, as defined in Section 1004.70, Florida Statutes,
and although legally separate from the College, is financially accountable to the College. The Foundation
is managed independently, outside the College’s budgeting process, and its powers generally are vested
in a governing board pursuant to various State statutes. The Foundation receives, holds, invests, and
administers property, and makes expenditures to or for the benefit of the College.
The Foundation is audited by other auditors pursuant to Section 1004.70(6), Florida Statutes. The
Foundation’s audited financial statements are available to the public at the College. The financial data
reported on the accompanying financial statements was derived from the Foundation’s audited financial
statements for the fiscal year ended March 31, 2017.
Basis of Presentation. The College’s accounting policies conform with accounting principles generally
accepted in the United States of America applicable to public colleges and universities as prescribed by
GASB. The National Association of College and University Business Officers (NACUBO) also provides
the College with recommendations prescribed in accordance with generally accepted accounting
principles promulgated by GASB and the Financial Accounting Standards Board (FASB). GASB allows
public colleges various reporting options. The College has elected to report as an entity engaged in only
business-type activities. This election requires the adoption of the accrual basis of accounting and
entitywide reporting including the following components:
Report No. 2018-070 December 2017 Page 21
Management’s Discussion and Analysis
Basic Financial Statements:
o Statement of Net Position
o Statement of Revenues, Expenses, and Changes in Net Position
o Statement of Cash Flows
o Notes to Financial Statements
Other Required Supplementary Information
Measurement Focus and Basis of Accounting. Basis of accounting refers to when revenues,
expenses, assets, deferred outflows of resources, liabilities, and deferred inflows of resources are
recognized in the accounts and reported in the financial statements. Specifically, it relates to the timing
of the measurements made, regardless of the measurement focus applied. The College’s financial
statements are presented using the economic resources measurement focus and the accrual basis of
accounting. Revenues, expenses, gains, losses, assets, deferred outflows of resources, liabilities, and
deferred inflows of resources resulting from exchange and exchange-like transactions are recognized
when the exchange takes place. Revenues, expenses, gains, losses, assets, deferred outflows of
resources, liabilities, and deferred inflows of resources resulting from nonexchange activities are
generally recognized when all applicable eligibility requirements, including time requirements, are met.
The College follows GASB standards of accounting and financial reporting.
The College’s component unit uses the economic resources measurement focus and accrual basis of
accounting whereby revenues are recognized when earned and expenses are recognized when incurred,
and follows GASB standards of accounting and financial reporting.
Significant interdepartmental sales between auxiliary service departments and other institutional
departments have been accounted for as reductions of expenses and not revenues of those departments.
The College’s principal operating activity is instruction. Operating revenues and expenses generally
include all fiscal transactions directly related to instruction as well as administration, academic support,
student services, physical plant operations, and depreciation of capital assets. Nonoperating revenues
include State noncapital appropriations, Federal and State student financial aid, and investment income.
Other revenues generally include revenues for capital construction projects.
The statement of net position is presented in a classified format to distinguish between current and
noncurrent assets and liabilities. When both restricted and unrestricted resources are available to fund
certain programs, it is the College’s policy to first apply the restricted resources to such programs followed
by the use of the unrestricted resources.
The statement of revenues, expenses, and changes in net position is presented by major sources and is
reported net of tuition scholarship allowances. Tuition scholarship allowances are the difference between
the stated charge for goods and services provided by the College and the amount that is actually paid by
the student or the third party making payment on behalf of the student. The College applied “The
Alternate Method” as prescribed in NACUBO Advisory Report 2000-05 to determine the reported net
tuition scholarship allowances. Under this method, the College computes these amounts by allocating
Report No. 2018-070 Page 22 December 2017
the cash payments to students, excluding payments for services, on a ratio of total aid to the aid not
considered third-party aid.
The statement of cash flows is presented using the direct method in compliance with GASB Statement
No. 9, Reporting Cash Flows of Proprietary and Nonexpendable Trust Funds and Governmental Entities
That Use Proprietary Fund Accounting.
Cash and Cash Equivalents. The amount reported as cash and cash equivalents consists of cash on
hand, cash in demand accounts, cash with escrow agent, cash with the State Treasury Special Purpose
Investment Account (SPIA) and with State Board of Administration (SBA) Florida PRIME investments.
For reporting cash flows, the College considers all highly liquid investments with original maturities of
3 months or less to be cash equivalents. Under this definition, the College considers amounts invested
in the State Treasury SPIA and SBA Florida PRIME investment pools to be cash equivalents.
College cash deposits are held in banks qualified as public depositories under Florida law, except for
cash with escrow agent as noted below. All such deposits are insured by Federal depository insurance,
up to specified limits, or collateralized with securities held in Florida’s multiple financial institution
collateral pool required by Chapter 280, Florida Statutes. Cash and cash equivalents that are externally
restricted to make debt service payments, maintain sinking or reserve funds, or to purchase or construct
capital or other restricted assets are classified as restricted.
At June 30, 2017, the College reported as restricted cash $6,655,886.51 held in escrow to provide for
the acquisition and installation of equipment related to an energy performance contract. These funds are
held in trust by the escrow agent and are exempt from the requirement to be insured by Federal
depository insurance.
At June 30, 2017, the College reported as cash equivalents at fair value $22,889.48 in the State Treasury
SPIA investment pool representing ownership of a share of the pool, not the underlying securities
(Level 3 inputs, as discussed in Note 2.). Pooled investments with the State Treasury are not registered
with the Securities and Exchange Commission. Oversight of the pooled investments with the State
Treasury is provided by the Treasury Investment Committee per Section 17.575, Florida Statutes. The
authorized investment types are set forth in Section 17.57, Florida Statutes. The State Treasury SPIA
investment pool carried a credit rating of A+f by Standard & Poor’s, had an effective duration of 2.8 years
and fair value factor of 0.9923 at June 30, 2017. Participants contribute to the State Treasury SPIA
investment pool on a dollar basis. These funds are commingled and a fair value of the pool is determined
from the individual values of the securities. The fair value of the securities is summed and a total pool
fair value is determined. A fair value factor is calculated by dividing the pool’s total fair value by the pool
participant’s total cash balances. The fair value factor is the ratio used to determine the fair value of an
individual participant’s pool balance. The College relies on policies developed by the State Treasury for
managing interest rate risk or credit risk for this investment pool. Disclosures for the State Treasury SPIA
investment pool are included in the notes to financial statements of the State’s Comprehensive Annual
Financial Report.
At June 30, 2017, the College reported as cash equivalents $18,807.16 in the Florida PRIME investment
pool administered by the SBA pursuant to Section 218.405, Florida Statutes. The College’s investments
in the Florida PRIME investment pool, which the SBA indicates is a Securities and Exchange Commission

Report No. 2018-070 December 2017 Page 23
Rule 2a7-like external investment pool, are similar to money market funds in which shares are owned in
the fund rather than the underlying investments. The Florida PRIME investment pool carried a credit
rating of AAAm by Standard & Poor’s and had a weighted-average days to maturity (WAM) of 39 days
as of June 30, 2017. A portfolio’s WAM reflects the average maturity in days based on final maturity or
reset date, in the case of floating-rate instruments. WAM measures the sensitivity of the Florida PRIME
investment pool to interest rate changes. The investments in the Florida PRIME investment pool are
reported at amortized cost. Section 218.409(8)(a), Florida Statutes, states that “the principal, and any
part thereof, of each account constituting the trust fund is subject to payment at any time from the moneys
in the trust fund. However, the executive director may, in good faith, on the occurrence of an event that
has a material impact on liquidity or operations of the trust fund, for 48 hours limit contributions to or
withdrawals from the trust fund to ensure that the Board [State Board of Administration] can invest
moneys entrusted to it in exercising its fiduciary responsibility. Such action must be immediately
disclosed to all participants, the trustees, the Joint Legislative Auditing Committee, the Investment
Advisory Council, and the Participant Local Government Advisory Council. The trustees shall convene
an emergency meeting as soon as practicable from the time the executive director has instituted such
measures and review the necessity of those moratorium on contributions and withdrawals, the
moratorium may be extended by the executive director until the trustees are able to meet to review the
necessity for the moratorium. If the trustees agree with such measures, the trustees shall vote to continue
the measures for up to an additional 15 days. The trustees must convene and vote to continue any such
measures before the expiration of the time limit set, but in no case may the time limit set by the trustees
exceed 15 days.” As of June 30, 2017, there were no redemption fees or maximum transaction amounts,
or any other requirements that serve to limit a participant’s daily access to 100 percent of their account
value.
Inventories. Inventories consist of items for resale by the campus bookstore and the food service
operations, and are valued using the last invoice cost, which approximates the first-in, first-out, method
of inventory valuation. In addition, inventories consist of various types of centrally stored consumable
teaching materials and other materials and supplies, which are valued using the average cost or last
invoice price, which approximates the first-in, first-out method of inventory valuation.
Capital Assets. College capital assets consist of land, buildings, other structures and improvements,
furniture, machinery, and equipment, and software. These assets are capitalized and recorded at cost at
the date of acquisition or at acquisition value at the date received in the case of gifts and purchases of
State surplus property. Additions, improvements, and other outlays that significantly extend the useful
life of an asset are capitalized. Other costs incurred for repairs and maintenance are expensed as
incurred. The College has a capitalization threshold of $5,000 for tangible personal property and
$25,000 for buildings and other structures and improvements. Depreciation is computed on the
straight-line basis over the following estimated useful lives:
Buildings – 40 years
Other Structures and Improvements – 10 years
Furniture, Machinery, and Equipment:
o Computer Equipment – 3 years
Report No. 2018-070 Page 24 December 2017
o Vehicles, Office Machines, and Educational Equipment – 5 years
o Furniture – 7 years
Software– 5 years
Noncurrent Liabilities. Noncurrent liabilities include note payable, compensated absences payable,
other postemployment benefits payable, and net pension liability that are not scheduled to be paid within
the next fiscal year.
Pensions. For purposes of measuring the net pension liability, deferred outflows of resources and
deferred inflows of resources related to pensions, and pension expense, information about the fiduciary
net position of the Florida Retirement System (FRS) defined benefit plan and the Health Insurance
Subsidy (HIS) defined benefit plan and additions to/deductions from the FRS’s and the HIS’s fiduciary
net position have been determined on the same basis as they are reported by the FRS and the HIS plans.
For this purpose, benefit payments (including refunds of employee contributions) are recognized when
due and payable in accordance with benefit terms. Investments are reported at fair value.
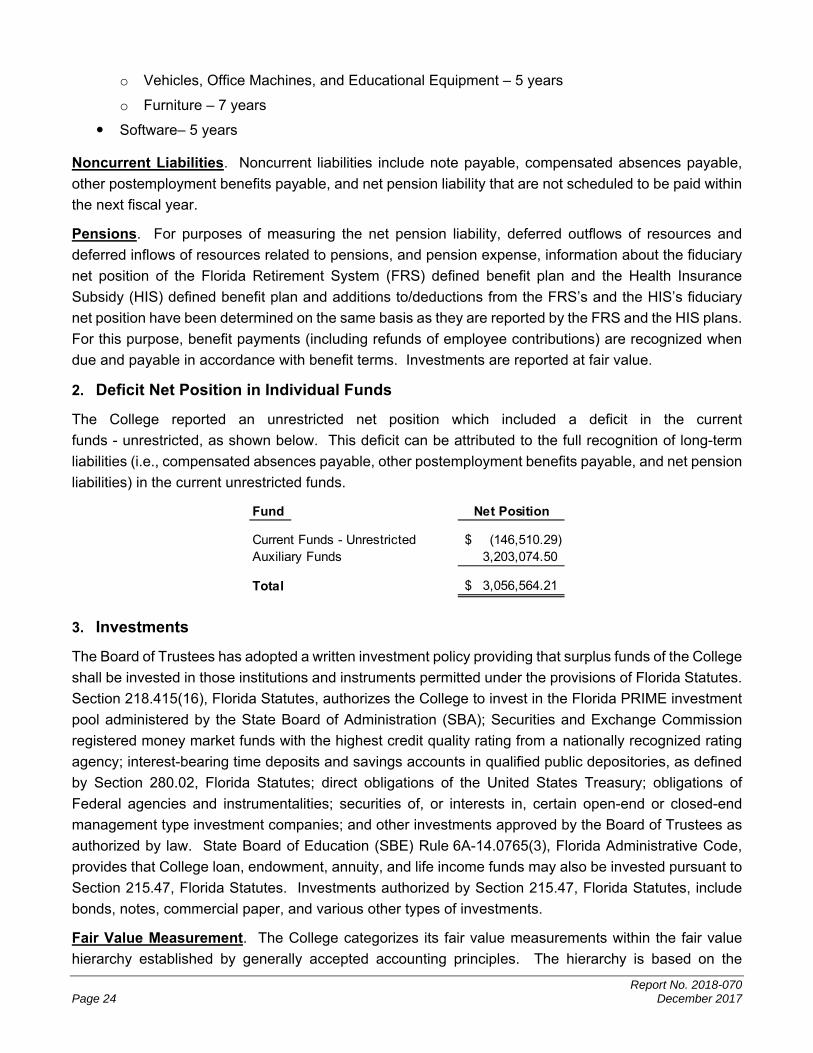
2. Deficit Net Position in Individual Funds
The College reported an unrestricted net position which included a deficit in the current
funds - unrestricted, as shown below. This deficit can be attributed to the full recognition of long-term
liabilities (i.e., compensated absences payable, other postemployment benefits payable, and net pension
liabilities) in the current unrestricted funds.
Fund Net Position
Current Funds - Unrestricted (146,510.29)$ Auxiliary Funds 3,203,074.50
Total 3,056,564.21$
3. Investments
The Board of Trustees has adopted a written investment policy providing that surplus funds of the College
shall be invested in those institutions and instruments permitted under the provisions of Florida Statutes.
Section 218.415(16), Florida Statutes, authorizes the College to invest in the Florida PRIME investment
pool administered by the State Board of Administration (SBA); Securities and Exchange Commission
registered money market funds with the highest credit quality rating from a nationally recognized rating
agency; interest-bearing time deposits and savings accounts in qualified public depositories, as defined
by Section 280.02, Florida Statutes; direct obligations of the United States Treasury; obligations of
Federal agencies and instrumentalities; securities of, or interests in, certain open-end or closed-end
management type investment companies; and other investments approved by the Board of Trustees as
authorized by law. State Board of Education (SBE) Rule 6A-14.0765(3), Florida Administrative Code,
provides that College loan, endowment, annuity, and life income funds may also be invested pursuant to
Section 215.47, Florida Statutes. Investments authorized by Section 215.47, Florida Statutes, include
bonds, notes, commercial paper, and various other types of investments.
Fair Value Measurement. The College categorizes its fair value measurements within the fair value
hierarchy established by generally accepted accounting principles. The hierarchy is based on the

Report No. 2018-070 December 2017 Page 25
valuation inputs used to measure the fair value of the asset. Level 1 inputs are quoted prices in active
markets for identical assets, Level 2 inputs are significant other observable inputs, and Level 3 inputs are
significant unobservable inputs.
The College’s investments of $5,000,000 in certificates of deposit are valued using level 1 inputs.
Certificates of Deposit
The College invested in certificates of deposit from a financial institution. The certificates have original
maturity dates of 12 to 18 months with annual percentage rates ranging from 0.4 to 0.5 percent. The
College’s investments in certificates of deposit are in a qualified depository.
Component Unit Investments
The Foundation for Florida Gateway College Inc. (Foundation) investments are managed by investments
brokerage houses. There are no legal restrictions on the types of investments that can be made. The
Foundation’s investment policy provides that investments are to be limited to premium investment grade
mutual funds, equity securities, and debt securities from companies located throughout the United States.
The policy also provides that debt securities should be maintained from 10 to 30 percent of the total
investment portfolio. Foundation investments at March 31, 2017, are recorded at fair value based on
quoted market prices as follows:
MarketInvestment Type Price
Commonfund: Multi-Strategy Bond Funds 3,716,524$ Multi-Strategy Equity Funds 9,902,412 Capital Partners V and VI 995,264 Raymond James Mutual Funds 293,125
Total Component Unit Investments 14,907,325$
Interest Rate Risk: Interest rate risk is the risk that changes in the interest rates will adversely affect the
fair value of an investment. The Foundation has no formal policy that limits investment maturities.
However, the Foundation manages its exposure to fair value losses arising from increasing interest rates
through the weighted average maturity method. As of March 31, 2017, the weighted average maturity
for the Commonfund bond mutual fund was 7.5 years and the effective duration of Raymond James
Mutual Funds at March 31, 2017 was 2.63 years.
Credit Risk: Credit risk is the risk that an insurer or other counterparty to an investment will not fulfill its
obligations. The Foundation has no formal policy on credit risk. As of March 31, 2017, the credit quality
for Commonfund bond mutual fund was AA- and A+f for the Raymond James Mutual Funds Investments.
Custodial Credit Risk: Custodial credit risk is the risk that in the event of the failure of the counterparty,
the Foundation will not be able to recover the value of its investments or collateral securities that are in
the possession of an outside party. Investments in corporate stocks are held in counterparty accounts
as custodian for the Foundation.

Report No. 2018-070 Page 26 December 2017
Concentration of Credit Risk: Concentration of credit risk is the risk of loss attributed to the magnitude of
the Foundation’s investments in a single issuer. The Foundation’s investment policy does not limit the
amount that may be invested in any type of investments.
4. Accounts Receivable
Accounts receivable represent amounts for student fee deferments, various student services provided by
the College, uncollected commissions for food service and vending machine sales, unused credit memos,
and contract and grant reimbursements due from third parties. These receivables are reported net of a
$154,920.65 allowance for doubtful accounts.
5. Notes Receivable
Notes receivable represent student loans made under the short-term loan program of $1,295.24. Notes
receivable are reported net of a $826.58 allowance for doubtful notes.
6. Due From Other Governmental Agencies
The amount due from other governmental agencies primarily consists of $715,677.56 of Public Education
Capital Outlay allocations due from the State for construction of College facilities and $632,749.07 due
under cash advance agreements for Federal grants.
7. Due From and To Component Unit/College
The $80,382.19 reported as due from component unit consists of amounts owed to the College by the
Foundation for scholarships and student aid. The College’s financial statements are reported for the
fiscal year ended June 30, 2017. The Foundation’s financial statements are reported for the fiscal year
ended March 31, 2017. Accordingly, amounts reported by the College as due from component unit on
the statement of net position do not agree with amounts reported by the component unit as due to the
College.
8. Capital Assets
Capital assets activity for the fiscal year ended June 30, 2017, is shown in the following table:

Report No. 2018-070 December 2017 Page 27
Beginning EndingDescription Balance Additions Reductions Balance
Nondepreciable Capital Assets:Land 407,508.33$ -$ -$ 407,508.33$
Total Nondepreciable Capital Assets 407,508.33 - - 407,508.33
Depreciable Capital Assets:Buildings 48,773,278.07$ 726,193.35$ 208,911.37$ 49,290,560.05$ Other Structures and Improvements 7,613,872.79 - - 7,613,872.79 Furniture, Machinery, and Equipment 6,377,711.28 276,788.24 - 6,654,499.52 Software 1,472,407.25 - - 1,472,407.25
Total Depreciable Capital Assets 64,237,269.39 1,002,981.59 208,911.37 65,031,339.61
Less, Accumulated Depreciation:Buildings 22,437,423.37 1,156,898.78 208,911.37 23,385,410.78 Other Structures and Improvements 5,787,854.02 301,065.66 - 6,088,919.68 Furniture, Machinery, and Equipment 5,680,037.67 244,627.86 - 5,924,665.53 Software 1,472,407.25 - - 1,472,407.25
Total Accumulated Depreciation 35,377,722.31 1,702,592.30 208,911.37 36,871,403.24
Total Depreciable Capital Assets, Net 28,859,547.08$ (699,610.71)$ -$ 28,159,936.37$
9. Long-Term Liabilities
Long-term liabilities activity for the fiscal year ended June 30, 2017, is shown below:
Beginning Ending CurrentDescription Balance Additions Reductions Balance Portion
Note Payable -$ 8,632,116.00$ -$ 8,632,116.00$ 298,638.58$ Compensated Absences Payable 1,530,848.07 42,668.71 220,663.52 1,352,853.26 177,795.54 Other Postemployment Benefits Payable 225,199.00 19,739.00 14,241.00 230,697.00 - Net Pension Liability 6,879,381.00 4,885,057.00 1,443,825.00 10,320,613.00 107,669.87
Total Long-Term Liabilities 8,635,428.07$ 13,579,580.71$ 1,678,729.52$ 20,536,279.26$ 584,103.99$
Note Payable. The College entered into an energy savings installment note with a bank in the aggregate
principal amount of $8,632,116.00 on January 13, 2017, under the provisions of Section 1013.23,
Florida Statutes. The note included a stated interest rate of 3.15 percent. Proceeds were used to fund
an energy performance-based contract for energy management facility upgrade projects. The principal
and interest on the note are payable in 80 quarterly installments consisting of 2 payments of accrued
interest for 2 quarters, and then 78 payments of principal and interest in the amount of $149,319.29, with
the first payment commencing on January 13, 2018. The note matures on October 13, 2037. Annual
requirements to amortize the outstanding note as of June 30, 2017, are as follows:

Report No. 2018-070 Page 28 December 2017
Fiscal YearEnding June 30 Principal Interest Total
2018 -$ 298,638.58$ 298,638.58$ 2019 286,995.89 310,281.27 597,277.16 2020 338,376.83 258,900.33 597,277.16 2021 349,162.27 248,114.89 597,277.16 2022 360,291.48 236,985.68 597,277.16 2023-2027 1,981,214.71 1,005,171.09 2,986,385.80 2028-2032 2,317,741.50 668,644.30 2,986,385.80 2033-2037 2,711,430.35 274,955.45 2,986,385.80 2038 286,902.97 3,360.62 290,263.59
Total 8,632,116.00$ 3,305,052.21$ 11,937,168.21$
Compensated Absences Payable. College employees may accrue annual and sick leave based on
length of service, subject to certain limitations regarding the amount that will be paid upon termination.
The College reports a liability for the accrued leave; however, State noncapital appropriations fund only
the portion of accrued leave that is used or paid in the current fiscal year. Although the College expects
the liability to be funded primarily from future appropriations, generally accepted accounting principles do
not permit the recording of a receivable in anticipation of future appropriations. At June 30, 2017, the
estimated liability for compensated absences, which includes the College’s share of the
Florida Retirement System and FICA contributions, totaled $1,352,853.26. The current portion of the
compensated absences liability, $177,795.54, is the amount expected to be paid in the coming fiscal
year, and was determined based on the anticipated payout in the next fiscal year.
Other Postemployment Benefits Payable. The College follows GASB Statement No. 45, Accounting
and Financial Reporting by Employers for Postemployment Benefits Other Than Pensions, for other
postemployment benefits provided by the Florida College System Risk Management Consortium
(Consortium).
Plan Description. The College contributes to an agent multiple-employer defined-benefit plan
administered by the Consortium for postemployment benefits. Pursuant to the provisions of Section
112.0801, Florida Statutes, former employees who retire from the College are eligible to participate in
the College’s healthcare benefits. The College subsidizes the premium rates paid by retirees by allowing
them to participate in the Other Postemployment Benefits Plan (OPEB Plan) at reduced or blended group
(implicitly subsidized) premium rates for both active and retired employees. These rates provide an
implicit subsidy for retirees because, on an actuarial basis, their current and future claims are expected
to result in higher costs to the OPEB Plan on average than those of active employees. The College does
not offer any explicit subsidies for retiree coverage. Retirees are required to enroll in the Federal
Medicare (Medicare) program for their primary coverage as soon as they are eligible. Neither the College
nor the Consortium issue a stand-alone report for the OPEB Plan and the OPEB Plan is not included in
the annual report of a public employee retirement system or another entity.
Funding Policy. OPEB Plan benefits are pursuant to the provisions of Section 112.0801, Florida Statutes,
and the Board of Trustees can amend OPEB Plan benefits and contribution rates. The College has not
advance-funded or established a funding methodology for the annual other postemployment benefit
Report No. 2018-070 December 2017 Page 29
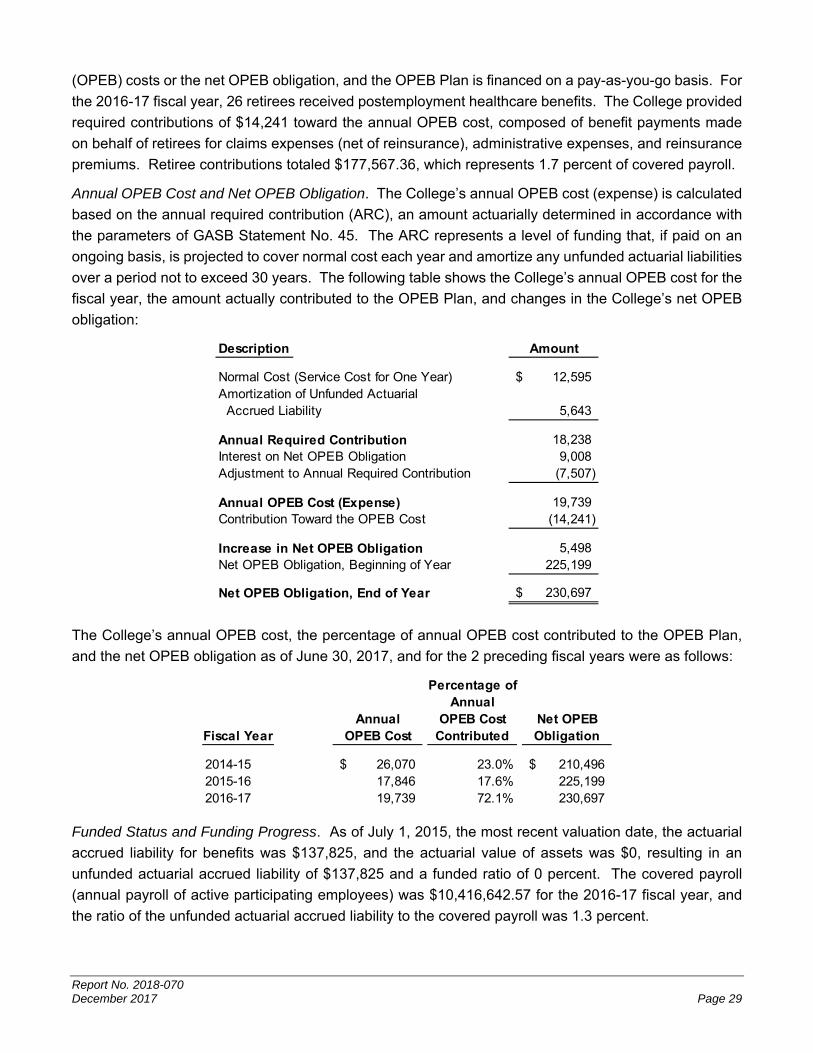
(OPEB) costs or the net OPEB obligation, and the OPEB Plan is financed on a pay-as-you-go basis. For
the 2016-17 fiscal year, 26 retirees received postemployment healthcare benefits. The College provided
required contributions of $14,241 toward the annual OPEB cost, composed of benefit payments made
on behalf of retirees for claims expenses (net of reinsurance), administrative expenses, and reinsurance
premiums. Retiree contributions totaled $177,567.36, which represents 1.7 percent of covered payroll.
Annual OPEB Cost and Net OPEB Obligation. The College’s annual OPEB cost (expense) is calculated
based on the annual required contribution (ARC), an amount actuarially determined in accordance with
the parameters of GASB Statement No. 45. The ARC represents a level of funding that, if paid on an
ongoing basis, is projected to cover normal cost each year and amortize any unfunded actuarial liabilities
over a period not to exceed 30 years. The following table shows the College’s annual OPEB cost for the
fiscal year, the amount actually contributed to the OPEB Plan, and changes in the College’s net OPEB
obligation:
Description Amount
Normal Cost (Service Cost for One Year) 12,595$ Amortization of Unfunded Actuarial Accrued Liability 5,643
Annual Required Contribution 18,238 Interest on Net OPEB Obligation 9,008 Adjustment to Annual Required Contribution (7,507)
Annual OPEB Cost (Expense) 19,739 Contribution Toward the OPEB Cost (14,241)
Increase in Net OPEB Obligation 5,498 Net OPEB Obligation, Beginning of Year 225,199
Net OPEB Obligation, End of Year 230,697$
The College’s annual OPEB cost, the percentage of annual OPEB cost contributed to the OPEB Plan,
and the net OPEB obligation as of June 30, 2017, and for the 2 preceding fiscal years were as follows:
Percentage ofAnnual
Annual OPEB Cost Net OPEBFiscal Year OPEB Cost Contributed Obligation
2014-15 26,070$ 23.0% 210,496$ 2015-16 17,846 17.6% 225,199 2016-17 19,739 72.1% 230,697
Funded Status and Funding Progress. As of July 1, 2015, the most recent valuation date, the actuarial
accrued liability for benefits was $137,825, and the actuarial value of assets was $0, resulting in an
unfunded actuarial accrued liability of $137,825 and a funded ratio of 0 percent. The covered payroll
(annual payroll of active participating employees) was $10,416,642.57 for the 2016-17 fiscal year, and
the ratio of the unfunded actuarial accrued liability to the covered payroll was 1.3 percent.
Report No. 2018-070 Page 30 December 2017
Actuarial valuations for an OPEB Plan involve estimates of the value of reported amounts and
assumptions about the probability of occurrence of events far into the future. Examples include
assumptions about future employment and termination, mortality, and healthcare cost trends. Actuarially
determined amounts regarding the funded status of the OPEB Plan and the annual required contributions
of the employer are subject to continual revision as actual results are compared with past expectations
and new estimates are made about the future. The Schedule of Funding Progress, presented as required
supplementary information following the notes to financial statements, presents multiyear trend
information that shows whether the actuarial value of OPEB Plan assets is increasing or decreasing over
time relative to the actuarial accrued liabilities for benefits.
Actuarial Methods and Assumptions. Projections of benefits for financial reporting purposes are based
on the substantive OPEB Plan provisions, as understood by the employer and participating members,
and include the types of benefits provided at the time of each valuation and the historical pattern of
sharing of benefit costs between the employer and participating members. The actuarial calculations of
the OPEB Plan reflect a long-term perspective. Consistent with this perspective, the actuarial valuations
used actuarial methods and assumptions that include techniques that are designed to reduce the effects
of short-term volatility in actuarial accrued liabilities and the actuarial value of assets.
The College’s OPEB actuarial valuation as of July 1, 2015, used the entry age normal actuarial method
to estimate the actuarial accrued liability as of June 30, 2017, and the College’s 2016-17 fiscal year ARC.
Because the OPEB liability is currently unfunded, the actuarial assumptions included a 4 percent rate of
return on invested assets, which is the College’s expectation of investment returns under its investment
policy. The actuarial assumptions also included a payroll growth rate of 3.25 percent per year, an inflation
rate of 2.6 percent, and an annual healthcare cost trend rate of 7.5 percent pre-Medicare and 5.5 percent
Medicare for the 2016-17 fiscal year, reduced by decrements to an ultimate rate of 5 percent in 2020 for
pre-Medicare and in 2017 for Medicare. The unfunded actuarial accrued liability is being amortized as a
level percentage of projected payroll amortized over 30 years on an open basis.
Net Pension Liability. As a participating employer in the Florida Retirement System, the College
recognizes its proportionate share of the collective net pension liabilities of the FRS cost-sharing
multiple-employer defined benefit plans. As of June 30, 2017, the College’s proportionate share of the
net pension liabilities totaled $10,320,613. Note 10. includes a complete discussion of defined benefit
pension plans.
10. Retirement Plans – Defined Benefit Pension Plans
General Information about the Florida Retirement System (FRS)
The FRS was created in Chapter 121, Florida Statutes, to provide a defined benefit pension plan for
participating public employees. The FRS was amended in 1998 to add the Deferred Retirement Option
Program (DROP) under the defined benefit plan and amended in 2000 to provide a defined contribution
plan alternative to the defined benefit plan for FRS members effective July 1, 2002. This integrated
defined contribution pension plan is the FRS Investment Plan. Chapter 112, Florida Statutes, established
the HIS Program, a cost-sharing multiple-employer defined benefit pension plan to assist retired
members of any State-administered retirement system in paying the costs of health insurance. Chapter
121, Florida Statutes, also provides for nonintegrated, optional retirement programs in lieu of the FRS to

Report No. 2018-070 December 2017 Page 31
certain members of the Senior Management Service Class employed by the State and faculty and
specified employees of State colleges.
Essentially all regular employees of the College are eligible to enroll as members of the
State-administered FRS. Provisions relating to the FRS are established by Chapters 121 and 122,
Florida Statutes; Chapter 112, Part IV, Florida Statutes; Chapter 238, Florida Statutes; and FRS Rules,
Chapter 60S, Florida Administrative Code; wherein eligibility, contributions, and benefits are defined and
described in detail. Such provisions may be amended at any time by further action from the Florida
Legislature. The FRS is a single retirement system administered by the Florida Department of
Management Services, Division of Retirement, and consists of two cost-sharing multiple-employer
defined benefit plans and other nonintegrated programs. A comprehensive annual financial report of the
FRS, which includes its financial statements, required supplementary information, actuarial report, and
other relevant information, is available from the Florida Department of Management Services’ Web site
(www.dms.myflorida.com).
The College’s FRS and HIS pension expense totaled $1,443,825 for the fiscal year ended June 30, 2017.
FRS Pension Plan
Plan Description. The FRS Pension Plan (Plan) is a cost-sharing multiple-employer defined benefit
pension plan, with a DROP for eligible employees. The general classes of membership are as follows:
Regular Class – Members of the FRS who do not qualify for membership in the other classes.
Senior Management Service Class (SMSC) – Members in senior management level positions.
Employees enrolled in the Plan prior to July 1, 2011, vest at 6 years of creditable service and employees
enrolled in the Plan on or after July 1, 2011, vest at 8 years of creditable service. All vested members,
enrolled prior to July 1, 2011, are eligible for normal retirement benefits at age 62 or at any age after
30 years of service. All members enrolled in the Plan on or after July 1, 2011, once vested, are eligible
for normal retirement benefits at age 65 or any time after 33 years of creditable service. Employees
enrolled in the Plan may include up to 4 years of credit for military service toward creditable service. The
Plan also includes an early retirement provision; however, there is a benefit reduction for each year a
member retires before his or her normal retirement date. The Plan provides retirement, disability, death
benefits, and annual cost-of-living adjustments to eligible participants.
DROP, subject to provisions of Section 121.091, Florida Statutes, permits employees eligible for normal
retirement under the Plan to defer receipt of monthly benefit payments while continuing employment with
an FRS-participating employer. An employee may participate in DROP for a period not to exceed
60 months after electing to participate. During the period of DROP participation, deferred monthly
benefits are held in the FRS Trust Fund and accrue interest. The net pension liability does not include
amounts for DROP participants, as these members are considered retired and are not accruing additional
pension benefits.
Benefits Provided. Benefits under the Plan are computed on the basis of age and/or years of service,
average final compensation, and service credit. Credit for each year of service is expressed as a
percentage of the average final compensation. For members initially enrolled before July 1, 2011, the
average final compensation is the average of the 5 highest fiscal years’ earnings; for members initially
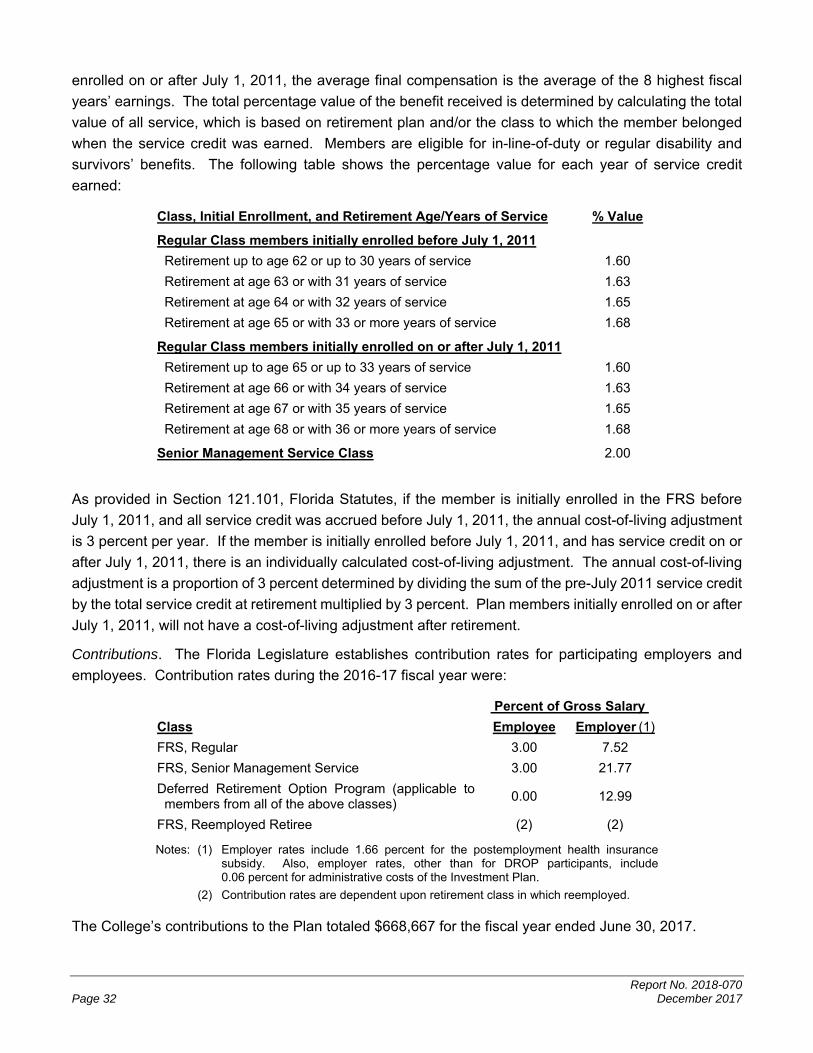
Report No. 2018-070 Page 32 December 2017
enrolled on or after July 1, 2011, the average final compensation is the average of the 8 highest fiscal
years’ earnings. The total percentage value of the benefit received is determined by calculating the total
value of all service, which is based on retirement plan and/or the class to which the member belonged
when the service credit was earned. Members are eligible for in-line-of-duty or regular disability and
survivors’ benefits. The following table shows the percentage value for each year of service credit
earned:
Class, Initial Enrollment, and Retirement Age/Years of Service % Value
Regular Class members initially enrolled before July 1, 2011
Retirement up to age 62 or up to 30 years of service 1.60
Retirement at age 63 or with 31 years of service 1.63
Retirement at age 64 or with 32 years of service 1.65
Retirement at age 65 or with 33 or more years of service 1.68
Regular Class members initially enrolled on or after July 1, 2011
Retirement up to age 65 or up to 33 years of service 1.60
Retirement at age 66 or with 34 years of service 1.63
Retirement at age 67 or with 35 years of service 1.65
Retirement at age 68 or with 36 or more years of service 1.68
Senior Management Service Class 2.00
As provided in Section 121.101, Florida Statutes, if the member is initially enrolled in the FRS before
July 1, 2011, and all service credit was accrued before July 1, 2011, the annual cost-of-living adjustment
is 3 percent per year. If the member is initially enrolled before July 1, 2011, and has service credit on or
after July 1, 2011, there is an individually calculated cost-of-living adjustment. The annual cost-of-living
adjustment is a proportion of 3 percent determined by dividing the sum of the pre-July 2011 service credit
by the total service credit at retirement multiplied by 3 percent. Plan members initially enrolled on or after
July 1, 2011, will not have a cost-of-living adjustment after retirement.
Contributions. The Florida Legislature establishes contribution rates for participating employers and
employees. Contribution rates during the 2016-17 fiscal year were:
Percent of Gross Salary
Class Employee Employer (1)
FRS, Regular 3.00 7.52
FRS, Senior Management Service 3.00 21.77
Deferred Retirement Option Program (applicable to members from all of the above classes)
0.00 12.99
FRS, Reemployed Retiree (2) (2)
Notes: (1) Employer rates include 1.66 percent for the postemployment health insurance subsidy. Also, employer rates, other than for DROP participants, include 0.06 percent for administrative costs of the Investment Plan.
(2) Contribution rates are dependent upon retirement class in which reemployed.
The College’s contributions to the Plan totaled $668,667 for the fiscal year ended June 30, 2017.
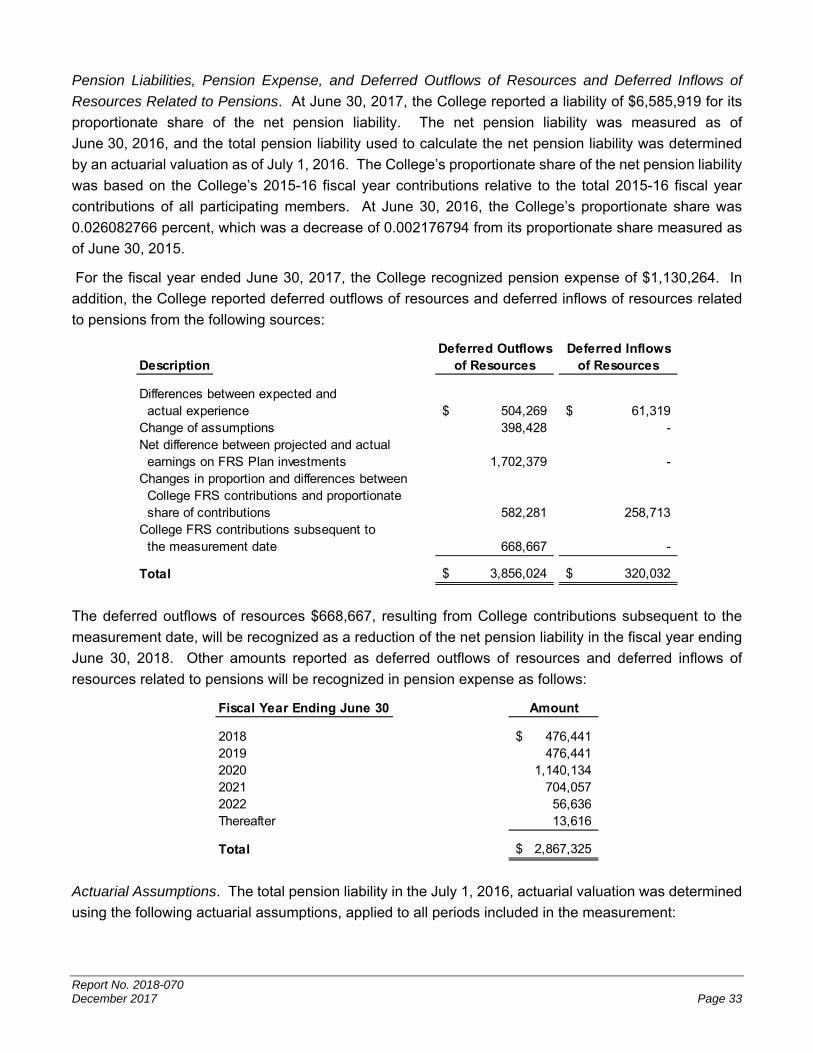
Report No. 2018-070 December 2017 Page 33
Pension Liabilities, Pension Expense, and Deferred Outflows of Resources and Deferred Inflows of
Resources Related to Pensions. At June 30, 2017, the College reported a liability of $6,585,919 for its
proportionate share of the net pension liability. The net pension liability was measured as of
June 30, 2016, and the total pension liability used to calculate the net pension liability was determined
by an actuarial valuation as of July 1, 2016. The College’s proportionate share of the net pension liability
was based on the College’s 2015-16 fiscal year contributions relative to the total 2015-16 fiscal year
contributions of all participating members. At June 30, 2016, the College’s proportionate share was
0.026082766 percent, which was a decrease of 0.002176794 from its proportionate share measured as
of June 30, 2015.
For the fiscal year ended June 30, 2017, the College recognized pension expense of $1,130,264. In
addition, the College reported deferred outflows of resources and deferred inflows of resources related
to pensions from the following sources:
Deferred Outflows Deferred InflowsDescription of Resources of Resources
Differences between expected and actual experience 504,269$ 61,319$ Change of assumptions 398,428 - Net difference between projected and actual earnings on FRS Plan investments 1,702,379 - Changes in proportion and differences between College FRS contributions and proportionate share of contributions 582,281 258,713 College FRS contributions subsequent to the measurement date 668,667 -
Total 3,856,024$ 320,032$
The deferred outflows of resources $668,667, resulting from College contributions subsequent to the
measurement date, will be recognized as a reduction of the net pension liability in the fiscal year ending
June 30, 2018. Other amounts reported as deferred outflows of resources and deferred inflows of
resources related to pensions will be recognized in pension expense as follows:
Fiscal Year Ending June 30 Amount
2018 476,441$ 2019 476,441 2020 1,140,134 2021 704,057 2022 56,636 Thereafter 13,616
Total 2,867,325$
Actuarial Assumptions. The total pension liability in the July 1, 2016, actuarial valuation was determined
using the following actuarial assumptions, applied to all periods included in the measurement:
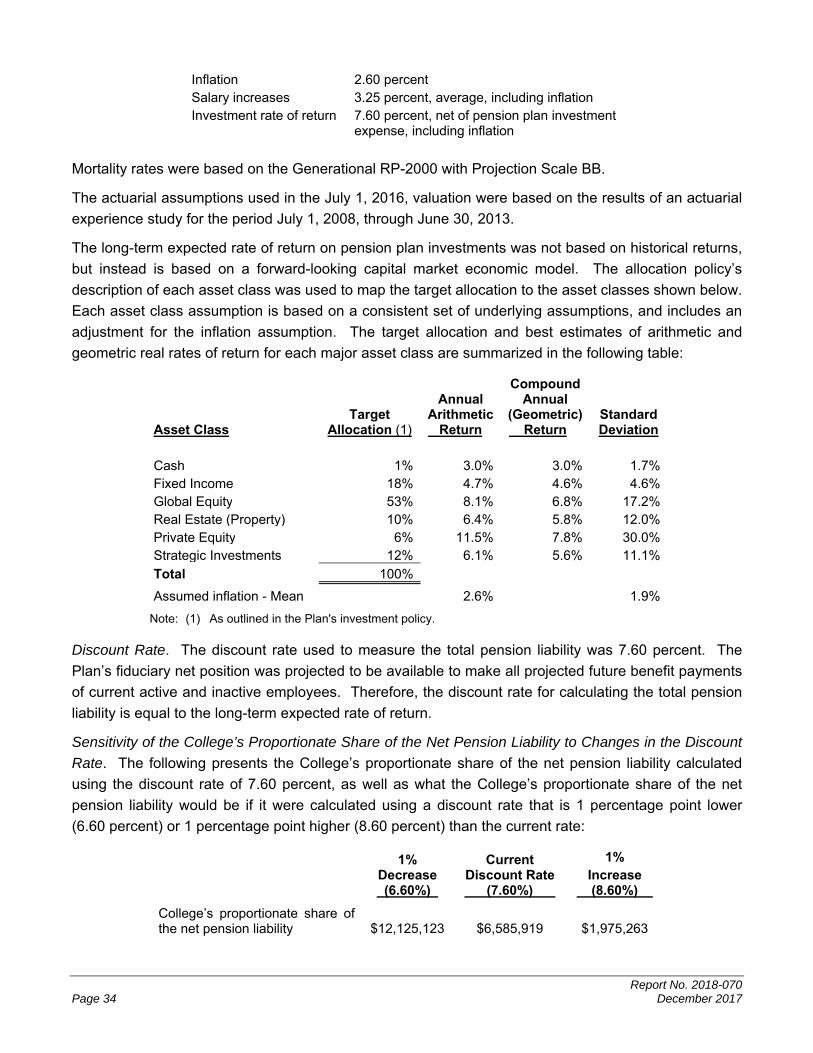
Report No. 2018-070 Page 34 December 2017
Inflation 2.60 percent Salary increases 3.25 percent, average, including inflation Investment rate of return 7.60 percent, net of pension plan investment
expense, including inflation
Mortality rates were based on the Generational RP-2000 with Projection Scale BB.
The actuarial assumptions used in the July 1, 2016, valuation were based on the results of an actuarial
experience study for the period July 1, 2008, through June 30, 2013.
The long-term expected rate of return on pension plan investments was not based on historical returns,
but instead is based on a forward-looking capital market economic model. The allocation policy’s
description of each asset class was used to map the target allocation to the asset classes shown below.
Each asset class assumption is based on a consistent set of underlying assumptions, and includes an
adjustment for the inflation assumption. The target allocation and best estimates of arithmetic and
geometric real rates of return for each major asset class are summarized in the following table:
Asset Class Target
Allocation (1)
Annual Arithmetic Return
Compound Annual
(Geometric) Return
Standard Deviation
Cash 1% 3.0% 3.0% 1.7%Fixed Income 18% 4.7% 4.6% 4.6%Global Equity 53% 8.1% 6.8% 17.2%Real Estate (Property) 10% 6.4% 5.8% 12.0%Private Equity 6% 11.5% 7.8% 30.0%Strategic Investments 12% 6.1% 5.6% 11.1%
Total 100%
Assumed inflation - Mean 2.6% 1.9%
Note: (1) As outlined in the Plan's investment policy.
Discount Rate. The discount rate used to measure the total pension liability was 7.60 percent. The
Plan’s fiduciary net position was projected to be available to make all projected future benefit payments
of current active and inactive employees. Therefore, the discount rate for calculating the total pension
liability is equal to the long-term expected rate of return.
Sensitivity of the College’s Proportionate Share of the Net Pension Liability to Changes in the Discount
Rate. The following presents the College’s proportionate share of the net pension liability calculated
using the discount rate of 7.60 percent, as well as what the College’s proportionate share of the net
pension liability would be if it were calculated using a discount rate that is 1 percentage point lower
(6.60 percent) or 1 percentage point higher (8.60 percent) than the current rate:
1% Decrease (6.60%)
Current Discount Rate (7.60%)
1% Increase
(8.60%)
College’s proportionate share of the net pension liability $12,125,123 $6,585,919 $1,975,263
Report No. 2018-070 December 2017 Page 35
Pension Plan Fiduciary Net Position. Detailed information about the Plan’s fiduciary net position is
available in the separately issued FRS Pension Plan and Other State Administered Systems
Comprehensive Annual Financial Report.
Payables to the Pension Plan. At June 30, 2017, the College reported a payable of $144,315.23 for the
outstanding amount of contributions to the Plan required for the fiscal year ended June 30, 2017.
HIS Pension Plan
Plan Description. The HIS Pension Plan (HIS Plan) is a cost-sharing multiple-employer defined benefit
pension plan established under Section 112.363, Florida Statutes, and may be amended by the Florida
Legislature at any time. The benefit is a monthly payment to assist retirees of State-administered
retirement systems in paying their health insurance costs and is administered by the Florida Department
of Management Services, Division of Retirement.
Benefits Provided. For the fiscal year ended June 30, 2017, eligible retirees and beneficiaries received
a monthly HIS payment of $5 for each year of creditable service completed at the time of retirement with
a minimum HIS payment of $30 and a maximum HIS payment of $150 per month, pursuant to
Section 112.363, Florida Statutes. To be eligible to receive a HIS benefit, a retiree under a
State-administered retirement system must provide proof of health insurance coverage, which can
include Medicare.
Contributions. The HIS Plan is funded by required contributions from FRS participating employers as set
by the Florida Legislature. Employer contributions are a percentage of gross compensation for all active
FRS members. For the fiscal year ended June 30, 2017, the contribution rate was 1.66 percent of payroll
pursuant to Section 112.363, Florida Statutes. The College contributed 100 percent of its statutorily
required contributions for the current and preceding 3 years. HIS Plan contributions are deposited in a
separate trust fund from which HIS payments are authorized. HIS Plan benefits are not guaranteed and
are subject to annual legislative appropriation. In the event the legislative appropriation or available funds
fail to provide full subsidy benefits to all participants, benefits may be reduced or canceled.
The College’s contributions to the HIS Plan totaled $168,391 for the fiscal year ended June 30, 2017.
Pension Liabilities, Pension Expense, and Deferred Outflows of Resources and Deferred Inflows of
Resources Related to Pensions. At June 30, 2017, the College reported a net pension liability of
$3,734,694 for its proportionate share of the net pension liability. The current portion of the net pension
liability is the College’s proportionate share of benefit payments expected to be paid within one year, net
of the College’s proportionate share of the HIS Plan’s fiduciary net position available to pay that amount.
The net pension liability was measured as of June 30, 2016, and the total pension liability used to
calculate the net pension liability was determined by an actuarial valuation as of July 1, 2016. The
College’s proportionate share of the net pension liability was based on the College’s 2015-16 fiscal year
contributions relative to the total 2015-16 fiscal year contributions of all participating members.
At June 30, 2016, the College’s proportionate share was 0.032044835 percent, which was an increase
of 0.000380347 from its proportionate share measured as of June 30, 2015.
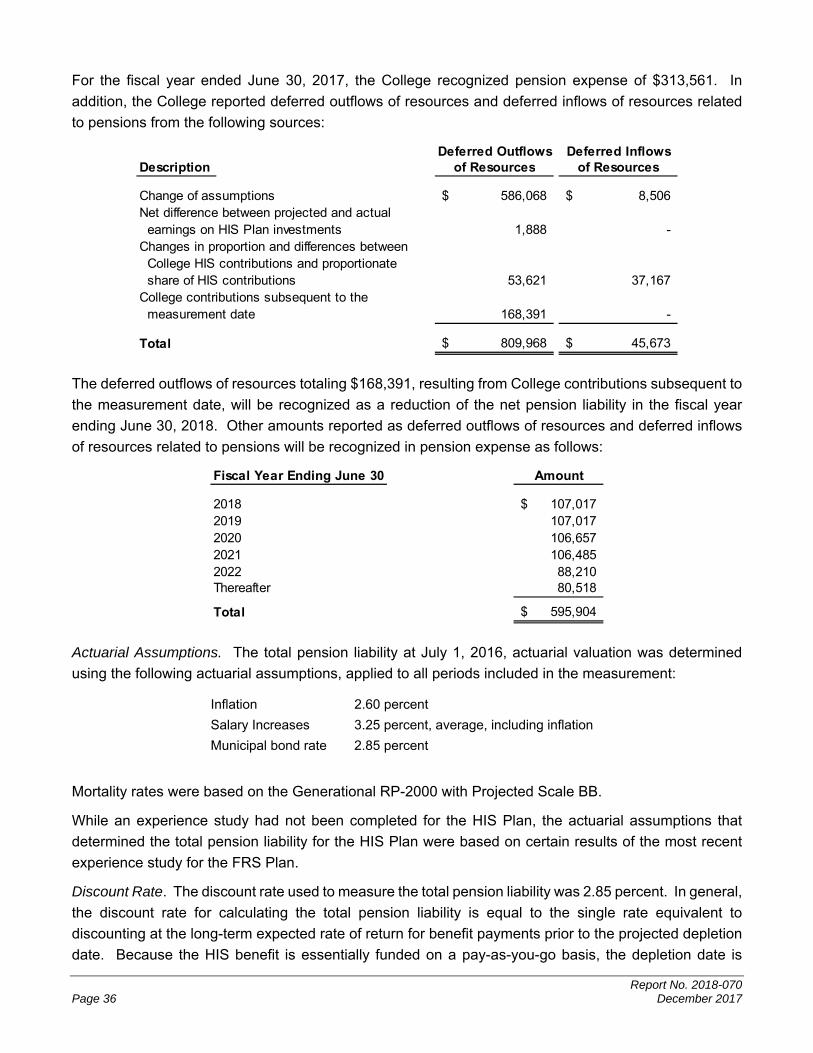
Report No. 2018-070 Page 36 December 2017
For the fiscal year ended June 30, 2017, the College recognized pension expense of $313,561. In
addition, the College reported deferred outflows of resources and deferred inflows of resources related
to pensions from the following sources:
Deferred Outflows Deferred InflowsDescription of Resources of Resources
Change of assumptions 586,068$ 8,506$ Net difference between projected and actual earnings on HIS Plan investments 1,888 - Changes in proportion and differences between College HIS contributions and proportionate share of HIS contributions 53,621 37,167 College contributions subsequent to the measurement date 168,391 -
Total 809,968$ 45,673$
The deferred outflows of resources totaling $168,391, resulting from College contributions subsequent to
the measurement date, will be recognized as a reduction of the net pension liability in the fiscal year
ending June 30, 2018. Other amounts reported as deferred outflows of resources and deferred inflows
of resources related to pensions will be recognized in pension expense as follows:
Fiscal Year Ending June 30 Amount
2018 107,017$ 2019 107,017 2020 106,657 2021 106,485 2022 88,210 Thereafter 80,518
Total 595,904$
Actuarial Assumptions. The total pension liability at July 1, 2016, actuarial valuation was determined
using the following actuarial assumptions, applied to all periods included in the measurement:
Inflation 2.60 percent
Salary Increases 3.25 percent, average, including inflation
Municipal bond rate 2.85 percent
Mortality rates were based on the Generational RP-2000 with Projected Scale BB.
While an experience study had not been completed for the HIS Plan, the actuarial assumptions that
determined the total pension liability for the HIS Plan were based on certain results of the most recent
experience study for the FRS Plan.
Discount Rate. The discount rate used to measure the total pension liability was 2.85 percent. In general,
the discount rate for calculating the total pension liability is equal to the single rate equivalent to
discounting at the long-term expected rate of return for benefit payments prior to the projected depletion
date. Because the HIS benefit is essentially funded on a pay-as-you-go basis, the depletion date is

Report No. 2018-070 December 2017 Page 37
considered to be immediate, and the single equivalent discount rate is equal to the municipal bond rate
selected by the plan sponsor. The Bond Buyer General Obligation 20-Bond Municipal Bond Index was
adopted as the applicable municipal bond index. The discount rate used to determine the total pension
liability decreased from 3.80 percent from the prior measurement date.
Sensitivity of the College’s Proportionate Share of the Net Pension Liability to Changes in the Discount
Rate. The following presents the College’s proportionate share of the net pension liability calculated
using the discount rate of 2.85 percent, as well as what the College’s proportionate share of the net
pension liability would be if it were calculated using a discount rate that is 1 percentage point lower
(1.85 percent) or 1 percentage point higher (3.85 percent) than the current rate:
1% Decrease (1.85%)
Current Discount Rate (2.85%)
1% Increase
(3.85%)
College’s proportionate share of the net pension liability $4,284,541 $3,734,694 $3,278,349
Pension Plan Fiduciary Net Position. Detailed information about the HIS Plan’s fiduciary net position is
available in the separately issued FRS Pension Plan and Other State Administered Systems
Comprehensive Annual Financial Report.
Payables to the Pension Plan. At June 30, 2017, the College reported a payable of $9,563.54 for the
outstanding amount of contributions to the HIS Plan required for the fiscal year ended June 30, 2017.
11. Retirement Plans – Defined Contribution Pension Plans
FRS Investment Plan. The SBA administers the defined contribution plan officially titled the FRS
Investment Plan (Investment Plan). The Investment Plan is reported in the SBA’s annual financial
statements and in the State of Florida Comprehensive Annual Financial Report.
As provided in Section 121.4501, Florida Statutes, eligible FRS members may elect to participate in the
Investment Plan in lieu of the FRS defined benefit plan. College employees already participating in the
State College System Optional Retirement Program or DROP are not eligible to participate in the
Investment Plan. Employer and employee contributions are defined by law, but the ultimate benefit
depends in part on the performance of investment funds. Service retirement benefits are based upon
the value of the member’s account upon retirement. Benefit terms, including contribution requirements,
are established and may be amended by the Florida Legislature. The Investment Plan is funded with the
same employer and employee contributions rates, that are based on salary and membership class
(Regular Class, Senior Management Service Class, etc.), as the FRS defined benefit plan. Contributions
are directed to individual member accounts, and the individual members allocate contributions and
account balances among various approved investment choices. Costs of administering the Investment
Plan, including the FRS Financial Guidance Program, are funded through an employer contribution of
0.06 percent of payroll and by forfeited benefits of Investment Plan members. Allocations to the
Investment Plan member accounts during the 2016-17 fiscal year were as follows:
Report No. 2018-070 Page 38 December 2017
Class
Percent of Gross
Compensation
FRS, Regular 6.30
FRS, Senior Management Service 7.67
For all membership classes, employees are immediately vested in their own contributions and are vested
after 1 year of service for employer contributions and investment earnings regardless of membership
class. If an accumulated benefit obligation for service credit originally earned under the FRS Pension
Plan is transferred to the Investment Plan, the member must have the years of service required for FRS
Pension Plan vesting (including the service credit represented by the transferred funds) to be vested for
these funds and the earnings on the funds. Nonvested employer contributions are placed in a suspense
account for up to 5 years. If the employee returns to FRS-covered employment within the 5-year period,
the employee will regain control over their account. If the employee does not return within the 5-year
period, the employee will forfeit the accumulated account balance. For the fiscal year ended
June 30, 2017, the information for the amount of forfeitures was unavailable from the SBA; however,
management believes that these amounts, if any, would be immaterial to the College.
After termination and applying to receive benefits, the member may rollover vested funds to another
qualified plan, structure a periodic payment under the Investment Plan, receive a lump-sum distribution,
leave the funds invested for future distribution, or any combination of these options. Disability coverage
is provided in which the member may either transfer the account balance to the FRS Pension Plan when
approved for disability retirement to receive guaranteed lifetime monthly benefits under the FRS Pension
Plan, or remain in the Investment Plan and rely upon that account balance for retirement income.
The College’s Investment Plan pension expense totaled $274,720.56 for the fiscal year ended
June 30, 2017.
State College System Optional Retirement Program. Section 1012.875, Florida Statutes, provides
for an Optional Retirement Program (Program) for eligible college instructors and administrators. The
Program is designed to aid colleges in recruiting employees by offering more portability to employees not
expected to remain in the FRS for 8 or more years.
The Program is a defined contribution plan, which provides full and immediate vesting of all contributions
submitted to the participating companies on behalf of the participant. Employees in eligible positions can
make an irrevocable election to participate in the Program, rather than the FRS, and purchase retirement
and death benefits through contracts provided by certain insurance carriers. The employing college
contributes 5.15 percent of the participant’s salary to the participant’s account, 2.83 percent to cover the
unfunded actuarial liability of the FRS pension plan, and 0.01 percent to cover the administrative costs,
for a total of 7.99 percent, and employees contribute 3 percent of the employee’s salary. Additionally,
the employee may contribute, by payroll deduction, an amount not to exceed the percentage contributed
by the college to the participant’s annuity account. The contributions are invested in the company or
companies selected by the participant to create a fund for the purchase of annuities at retirement.
The College’s contributions to the Program totaled $36,464.20 and employee contributions totaled
$13,708.32 for the 2016-17 fiscal year.
Report No. 2018-070 December 2017 Page 39
Senior Management Service Local Annuity Program. Section 121.055(1)(b)2., Florida Statutes, and
Florida Retirement System Rule 60S-1.0057, Florida Administrative Code, provide that local agency
employees eligible for the FRS, Senior Management Service Class, may elect to withdraw from the FRS
altogether and participate in a local annuity program. Pursuant thereto, the College established the
Senior Management Service Class Local Annuity Program (Local Annuity Program). Employees in
eligible positions are allowed to make an irrevocable election to participate in the Local Annuity Program,
rather than the FRS.
The Local Annuity Program is a defined contribution plan, which provides full and immediate vesting of
all contributions submitted to the participating companies on behalf of the employee. The College
contributes 6.27 percent of the employee’s salary to the Local Annuity Program. The participants may
make contributions toward the Local Annuity Program by way of salary reduction or by deduction of a
percentage of the employee’s gross compensation not to exceed the percentage contributed by the
employer.
The College’s contributions to the Local Annuity Program totaled $16,153.73 and employee contributions
totaled $7,729.09 for the 2016-17 fiscal year.
12. Risk Management Programs
The College is exposed to various risks of loss related to torts; theft of, damage to, and destruction of
assets; errors and omissions; injuries to employees; and natural disasters. The College provided
coverage for these risks primarily through the Florida College System Risk Management Consortium
(Consortium), which was created under authority of Section 1001.64(27), Florida Statutes, by the boards
of trustees of the Florida public colleges for the purpose of joining a cooperative effort to develop,
implement, and participate in a coordinated Statewide college risk management program. The
Consortium is self-sustaining through member assessments (premiums) and purchases excess
insurance through commercial companies for claims in excess of specified amounts. Excess insurance
from commercial companies provided coverage of up to $200 million for property insurance. Insurance
coverage obtained through the Consortium included fire and extended property, general and automobile
liability, workers’ compensation, health, life, and other liability coverage. Settled claims resulting from
these risks have not exceeded commercial coverage in any of the past 3 fiscal years.
13. Functional Distribution of Operating Expenses
The functional classification of an operating expense (instruction, academic support, etc.) is assigned to
a department based on the nature of the activity, which represents the material portion of the activity
attributable to the department. For example, activities of an academic department for which the primary
departmental function is instruction may include some activities other than direct instruction such as
public service. However, when the primary mission of the department consists of instructional program
elements, all expenses of the department are reported under the instruction classification. The operating
expenses on the statement of revenues, expenses, and changes in net position are presented by natural
classifications. The following are those same expenses presented in functional classifications as
recommended by NACUBO:
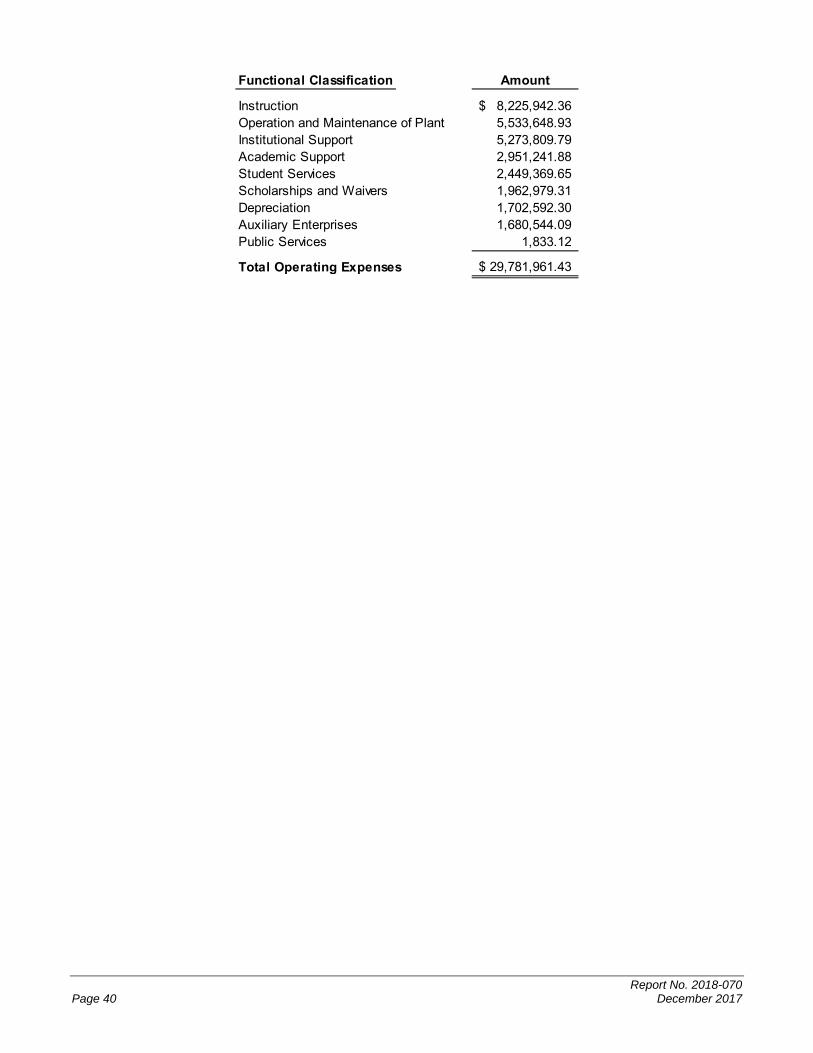
Report No. 2018-070 Page 40 December 2017
Functional Classification Amount
Instruction 8,225,942.36$ Operation and Maintenance of Plant 5,533,648.93 Institutional Support 5,273,809.79 Academic Support 2,951,241.88 Student Services 2,449,369.65 Scholarships and Waivers 1,962,979.31 Depreciation 1,702,592.30 Auxiliary Enterprises 1,680,544.09 Public Services 1,833.12
Total Operating Expenses 29,781,961.43$

Report No. 2018-070 December 2017 Page 41
OTHER REQUIRED SUPPLEMENTARY INFORMATION
Schedule of Funding Progress – Other Postemployment Benefits Plan
Actuarial UAAL as aActuarial Accrued Unfunded Percentage
Actuarial Value of Liability (AAL) AAL Funded Covered of CoveredValuation Assets (1) (UAAL) Ratio Payroll Payroll
Date (a) (b) (b-a) (a/b) (c) [(b-a)/c]
7/1/2011 -$ 169,949$ 169,949$ 0% 8,546,686$ 2.0%7/1/2013 - 152,348 152,348 0% 9,218,160 1.7%7/1/2015 - 137,825 137,825 0% 9,170,817 1.5%
Note: (1) The OPEB actuarial valuation used the projected unit credit actuarial method in the 7/1/2011 and 7/1/2013 valuations and the entry age normal actuarial valuation method in the 7/1/2015 valuation to estimate the actuarial accrued liability.
Schedule of the College’s Proportionate Share of the Net Pension Liability –
Florida Retirement System Pension Plan
2016 (1) 2015 (1) 2014 (1) 2013 (1)College's proportion of the FRS net pension liability 0.026082766% 0.02825956% 0.027927995% 0.021862005%
College's proportionate share of the FRS net pension liability 6,585,919$ 3,650,101$ 1,704,017$ 3,763,424$
College's covered payroll (2) 10,628,042$ 10,680,858$ 10,934,420$ 11,011,239$
College's proportionate share of the FRS net pension liability as a percentage of its covered payroll 61.97% 34.17% 15.58% 34.18%
FRS Plan fiduciary net position as a percentage of the total pension liability 84.88% 92.00% 96.09% 88.54%
Notes: (1) The amounts presented for each fiscal year were determined as of June 30.
(2) Covered payroll includes defined benefit plan actives, investment plan members, State college optional retirement program members, and members in DROP because total employer contributions are determined on a uniform basis (blended rate) as required by Part III of Chapter 121, Florida Statutes.
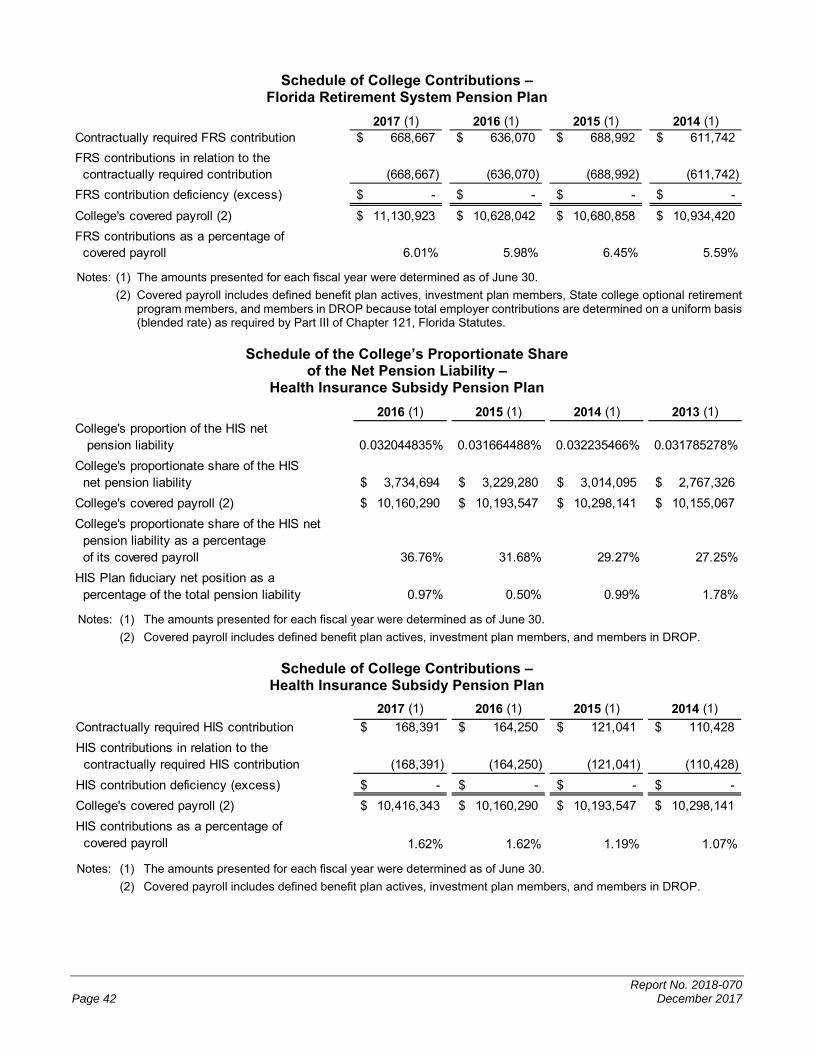
Report No. 2018-070 Page 42 December 2017
Schedule of College Contributions – Florida Retirement System Pension Plan
2017 (1) 2016 (1) 2015 (1) 2014 (1)Contractually required FRS contribution $ 668,667 $ 636,070 $ 688,992 $ 611,742
FRS contributions in relation to the contractually required contribution (668,667) (636,070) (688,992) (611,742)
FRS contribution deficiency (excess) -$ -$ -$ -$
College's covered payroll (2) 11,130,923$ 10,628,042$ 10,680,858$ 10,934,420$
FRS contributions as a percentage of covered payroll 6.01% 5.98% 6.45% 5.59%
Notes: (1) The amounts presented for each fiscal year were determined as of June 30.
(2) Covered payroll includes defined benefit plan actives, investment plan members, State college optional retirement program members, and members in DROP because total employer contributions are determined on a uniform basis (blended rate) as required by Part III of Chapter 121, Florida Statutes.
Schedule of the College’s Proportionate Share of the Net Pension Liability –
Health Insurance Subsidy Pension Plan
2016 (1) 2015 (1) 2014 (1) 2013 (1)College's proportion of the HIS net pension liability 0.032044835% 0.031664488% 0.032235466% 0.031785278%
College's proportionate share of the HIS net pension liability 3,734,694$ 3,229,280$ 3,014,095$ 2,767,326$
College's covered payroll (2) 10,160,290$ 10,193,547$ 10,298,141$ 10,155,067$
College's proportionate share of the HIS net pension liability as a percentage of its covered payroll 36.76% 31.68% 29.27% 27.25%
HIS Plan fiduciary net position as a percentage of the total pension liability 0.97% 0.50% 0.99% 1.78%
Notes: (1) The amounts presented for each fiscal year were determined as of June 30.
(2) Covered payroll includes defined benefit plan actives, investment plan members, and members in DROP.
Schedule of College Contributions – Health Insurance Subsidy Pension Plan
2017 (1) 2016 (1) 2015 (1) 2014 (1)
Contractually required HIS contribution $ 168,391 $ 164,250 $ 121,041 $ 110,428
HIS contributions in relation to the contractually required HIS contribution (168,391) (164,250) (121,041) (110,428)
HIS contribution deficiency (excess) -$ -$ -$ -$
College's covered payroll (2) 10,416,343$ 10,160,290$ 10,193,547$ 10,298,141$
HIS contributions as a percentage of covered payroll 1.62% 1.62% 1.19% 1.07%
Notes: (1) The amounts presented for each fiscal year were determined as of June 30.
(2) Covered payroll includes defined benefit plan actives, investment plan members, and members in DROP.

Report No. 2018-070 December 2017 Page 43
NOTES TO REQUIRED SUPPLEMENTARY INFORMATION
1. Schedule of Net Pension Liability and Schedule of Contributions – Florida Retirement System Pension Plan
Changes of Assumptions. The long-term expected rate of return was decreased from 7.65 percent to
7.60 percent, and the active member mortality assumption was updated.
2. Schedule of Net Pension Liability and Schedule of Contributions – Health Insurance Subsidy Pension Plan
Changes of Assumptions. The municipal rate used to determine total pension liability decreased from
3.80 percent to 2.85 percent.

Report No. 2018-070 Page 44 December 2017
Phone: (850) 412-2722 Fax: (850) 488-6975
Sherrill F. Norman, CPA Auditor General
AUDITOR GENERAL STATE OF FLORIDA Claude Denson Pepper Building, Suite G74
111 West Madison Street Tallahassee, Florida 32399-1450
The President of the Senate, the Speaker of the House of Representatives, and the Legislative Auditing Committee
INDEPENDENT AUDITOR’S REPORT ON INTERNAL CONTROL OVER
FINANCIAL REPORTING AND ON COMPLIANCE AND OTHER MATTERS
BASED ON AN AUDIT OF FINANCIAL STATEMENTS PERFORMED
IN ACCORDANCE WITH GOVERNMENT AUDITING STANDARDS
We have audited, in accordance with the auditing standards generally accepted in the United States of
America and the standards applicable to financial audits contained in Government Auditing Standards
issued by the Comptroller General of the United States, the financial statements of the Florida Gateway
College, a component unit of the State of Florida, and its discretely presented component unit as of and
for the fiscal year ended June 30, 2017, and the related notes to the financial statements, which
collectively comprise the College’s basic financial statements, and have issued our report thereon dated
December 15, 2017, included under the heading INDEPENDENT AUDITOR’S REPORT. Our report
includes a reference to other auditors who audited the financial statements of the discretely presented
component unit, as described in our report on the College’s financial statements. This report does not
include the results of the other auditors’ testing of internal control over financial reporting or compliance
and other matters that are reported on separately by those auditors.
Internal Control Over Financial Reporting
In planning and performing our audit of the financial statements, we considered the College’s internal
control over financial reporting (internal control) to determine audit procedures that are appropriate in the
circumstances for the purpose of expressing our opinions on the financial statements, but not for the
purpose of expressing an opinion on the effectiveness of the College’s internal control. Accordingly, we
do not express an opinion on the effectiveness of the College’s internal control.
A deficiency in internal control exists when the design or operation of a control does not allow
management or employees, in the normal course of performing their assigned functions, to prevent, or
detect and correct, misstatements on a timely basis. A material weakness is a deficiency, or a
combination of deficiencies, in internal control such that there is a reasonable possibility that a material
misstatement of the College’s financial statements will not be prevented, or detected and corrected on a
Report No. 2018-070 December 2017 Page 45
timely basis. A significant deficiency is a deficiency, or a combination of deficiencies, in internal control
that is less severe than a material weakness, yet important enough to merit attention by those charged
with governance.
Our consideration of internal control was for the limited purpose described in the first paragraph of this
section and was not designed to identify all deficiencies in internal control that might be material
weaknesses or significant deficiencies and, therefore, material weaknesses or significant deficiencies
may exist that were not identified. Given these limitations, during our audit we did not identify any
deficiencies in internal control that we consider to be material weaknesses. We did identify a certain
deficiency in internal control, described in the accompanying FINDING AND RECOMMENDATION
section of this report as Financial Statement Finding No. 2017-001 that we consider to be a significant
deficiency.
Compliance and Other Matters
As part of obtaining reasonable assurance about whether the College’s financial statements are free from
material misstatement, we performed tests of its compliance with certain provisions of laws, rules,
regulations, contracts, and grant agreements, noncompliance with which could have a direct and material
effect on the determination of financial statement amounts. However, providing an opinion on compliance
with those provisions was not an objective of our audit and, accordingly, we do not express such an
opinion. The results of our tests disclosed no instances of noncompliance or other matters that are
required to be reported under Government Auditing Standards.
Management’s Response to Finding
Management’s response to the finding identified in our audit is included as Management’s Response in
Financial Statement Finding No. 2017-001. Management’s response was not subjected to the auditing
procedures applied in the audit of the financial statements and, accordingly, we express no opinion on it.
Purpose of this Report
The purpose of this report is solely to describe the scope of our testing of internal control and compliance
and the results of that testing, and not to provide an opinion on the effectiveness of the College’s internal
control or on compliance. This report is an integral part of an audit performed in accordance with
Government Auditing Standards in considering the College’s internal control and compliance.
Accordingly, this report is not suitable for any other purpose.
Respectfully submitted,
Sherrill F. Norman, CPA Tallahassee, Florida December 15, 2017

Report No. 2018-070 Page 46 December 2017
FINANCIAL STATEMENT FINDING
SIGNIFICANT DEFICIENCY
FINANCIAL REPORTING
Finding Number 2017-001
Opinion Unit Florida Gateway College
Financial Statements Account Titles
Restricted Cash and Cash Equivalents; Accounts Payable; Note Payable - Current Portion; Note Payable – Noncurrent; Contractual Services – Operating Expenses; and Investment Income
Adjustment Amounts Adjustments to increase: Restricted Cash and Cash Equivalents - $6,655,887 Accounts Payable - $366,846 Note Payable – Current Portion - $298,639 Note Payable – Noncurrent - $8,333,478 Contractual Services – Operating Expenses - $2,346,121 Investment Income - $3,045
Prior Year Finding Not Applicable
Finding College procedures need improvement to ensure that transactions and account
balances associated with long-term debt are properly recorded and reported.
Criteria State Board of Education (SBE) Rule 6A-14.072, Florida Administrative Code, requires the College to keep financial records according to the Department of Education publication “Accounting Manual for Florida’s Public Community Colleges, 2007” (Manual). The Manual requires the College to comply with generally accepted accounting principles (GAAP) by appropriately recording and reporting long-term debt, expenses, and other related transactions and account balances in the period incurred.
Condition On January 13, 2017, the College entered into a contract for energy management facility upgrade projects and an escrow agreement and related Note Payable for the projects totaling $8,632,117. As of June 30, 2017, the College had proceeds totaling $6,655,887 in an escrow account from the Note Payable, had expended $2,346,121 for these projects, owed $8,998,963 (Accounts Payable of $366,846; Note Payable – Current Portion of $298,639; and Note Payable - Noncurrent of $8,333,478), and had accrued Investment Income of $3,045. However, the College did not record the Note Payable and related transactions and account balances for the energy management contract or report this information on the annual financial report (AFR) for the fiscal year ended June 30, 2017.
Cause College personnel misunderstood the requirements for recording and reporting the Note Payable and related transactions and account balances in the period the debt was incurred. The College disclosed information related to the Note Payable as a subsequent event note in the AFR because the first payment for the Note Payable was due after June 30, 2017 (i.e., January 2018). However, as the note was executed in January 2017 and, prior to June 30, 2017, funds were deposited in an escrow account for the College and expenses were incurred, GAAP and the Manual require these transactions and account balances be reported in the 2016-17 fiscal year.
In addition, College procedures did not provide for documented supervisory review and approval of financial reporting to ensure that the AFR properly presented this information. In response to our inquiry, College personnel indicated that, due to
Report No. 2018-070 December 2017 Page 47
personnel vacancies, supervisory review and approval of the transactions and account balances reported on the AFR was not performed and documented.
Effect The College understated Restricted Cash and Cash Equivalents, Accounts Payable, Notes Payable – Current Portion, Notes Payable - Noncurrent, Contractual Services – Operating Expenses, and Investment Income. Reporting errors such as these may cause financial statement users to misunderstand the College’s financial activities and incorrectly assess the College’s financial position.
We extended our audit procedures to determine the adjustments necessary to properly report these transactions and account balances, and College personnel accepted the adjustments. However, our audit procedures cannot substitute for management’s responsibility for proper financial recording and reporting.
Recommendation The College should enhance procedures to ensure that transactions and account balances associated with long-term debt are properly recorded and reported. Such procedures should require documented supervisory review, to detect and correct errors and omissions during AFR preparation, and approval of the completed AFR.
Management’s Response The College accepts this finding and has recorded the adjustments. The College has added a procedure to detail the requirement of supervisory review of the AFR prior to submission.
Estimated Corrective Action Date
November 6, 2017
Institution Contact and Telephone Number
Michelle Holloway, Vice President for Business Services (386)754-4364