2018-2019 special services budget - suffield public schools€¦ · · 2018-01-192018-2019...
TRANSCRIPT
2018-2019
Special Services Budget
Natalie Donais, Director of Special Services
Dianna Kolodziey, Supervisor of Special Education
January 16, 2018
Building Staff Capacity Leads to Student Success

Special Services Mission & Vision
Statement
The mission of the Suffield Public Schools Special Services Department is to provide high quality education programs whereby all students are empowered to reach their individual potential, develop independence, respect and value themselves and others and become lifelong learners.
The Special Services Department will strive to:
• Teach students with disabilities the effective tools and compensatory strategies
necessary to access their education
• Adopt practices that encourage self-advocacy and independence across settings
• Utilize data driven decision making to adapt to the changing needs of students
• Provide professional development and opportunities for staff to stay updated with best
practices and current research related to state mandates, assessment, and interventions
• Work collaboratively with parents to support students
• Increase community awareness of district programming and activities to engage
students, families and community members as supportive partners
• Strengthen social-emotional wellness and character development

Special Services/Pupil Services Accomplishments/
Alignment to District Improvement Plan Curriculum & Instruction Educator Growth = Student Growth Organizational Health
SHS-Human Relations/Social Skills:
focus on literacy, numeracy, SEL (credit
bearing)
Development of Special Services
Governance Team
Systemic implementation of IEP/PPT process
written protocols and procedures district wide
ACHIEVE: Programming for highly
complex profiles
Development of Special Services
Improvement Plan
Special Education Parent Advisory Council
focused on topics including parent education
and training. Opened up to nearby districts.
Development of a collaborative
community based 18-21 transition
program with Windsor Locks (RISE)
Paraprofessionals: increased trainings and
assessments
Roll out of DESSA-SEL universal screener
grades K-8
SMS: restructure of special education
improved model to focus on
individualized literacy and numeracy
instruction
Focus Groups for Increased Efficiency &
Effectiveness: Special Education Teachers,
Counselors & Psychologists
Improved Annual review PPTs process:
scheduling and format
Grades 6-12 school counseling based on
counseling standards; increased student
and parent contact and outreach; the
creation of student intervention groups
Structured monthly meetings with SLPs,
Psychologists, Counselors, Social Worker
Updated 504 forms, legal training and future
roll out of 504 Direct
English Language Tutor
Functional Behavior Assessment/ Behavior
Intervention Plans (FBA/BIP) training and
systemic implementation
SEDAC reports: timely and accurate
Improved progress monitoring, data
collection and reporting Weekly department collaboration/meetings
Crisis response teams identified and trained
in each school yearly
Increased social emotional learning
across the district by school counselors,
psychologists and social worker
Developing district-based Assistive Tech
team
School teams trained in CPI and PMT by
district BCBA yearly

Special Ed Population K-12 (in-district)
Five Year Comparison
Suffield
2013-14
Oct. 2013
K-12
Suffield
2014-15
Oct. 2014
K-12
Suffield
2015-16
Jan. 2016
K-12
Suffield
2016-17
Jan. 2017
K-12
Suffield
2017-18
Jan. 2018
K-12
Total Special
Education
Students
250 244 303 305 300
Prevalence
Rate: 10.2% 10.3% 12.6% 13.2% 13.5%

Disability AWS
Pre-K
AWS
K-2
MIS
3-5
SMS
6-8
SHS
9-12 Totals
I.D. 1 1 0 2 3 7
Hearing Impairments 2 0 1 0 0 3
Speech/ Language Impairments 5 16 8 4 0 33
Visual Impairments 0 1 0 0 0 1
E.D. 0 0 4 4 19 27
OHI 0 1 1 2 4 8
OHI-ADD/ADHD 0 5 8 6 16 35
Specific Learning Disabilities 0 6 20 34 39 99
SLD/Dyslexia 0 1 11 6 0 18
Multiple Disabilities 0 1 0 0 1 2
Autism 8 13 10 9 10 50
Developmental Delay (3-5) 12 5 0 0 0 17
Totals 28 50 63 67 92 300
Special Education Population by
Disability Designation as of January 2, 2018
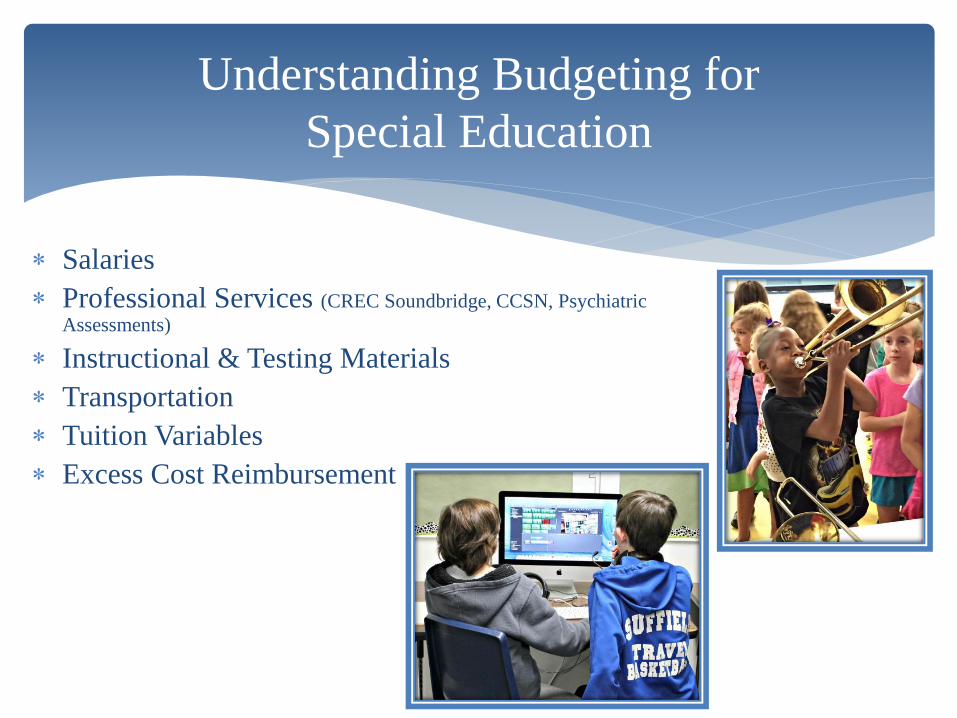
Salaries
Professional Services (CREC Soundbridge, CCSN, Psychiatric
Assessments)
Instructional & Testing Materials
Transportation
Tuition Variables
Excess Cost Reimbursement
Understanding Budgeting for
Special Education

Focusing on Goals/Finding Efficiencies
Identify and serve students with impairments according
to IDEA criteria implementing focused specialized
instruction
Build district capacity through expert training of all
teaching staff and paraprofessionals
Refer, assess and identify students with disabilities
Align resources to identified needs
Educate and collaborate with families
Collaborative programming with surrounding districts

Human Relations Suffield High School
Kelli Conroy, School Psychologist
Erin Shea, Special Education Teacher
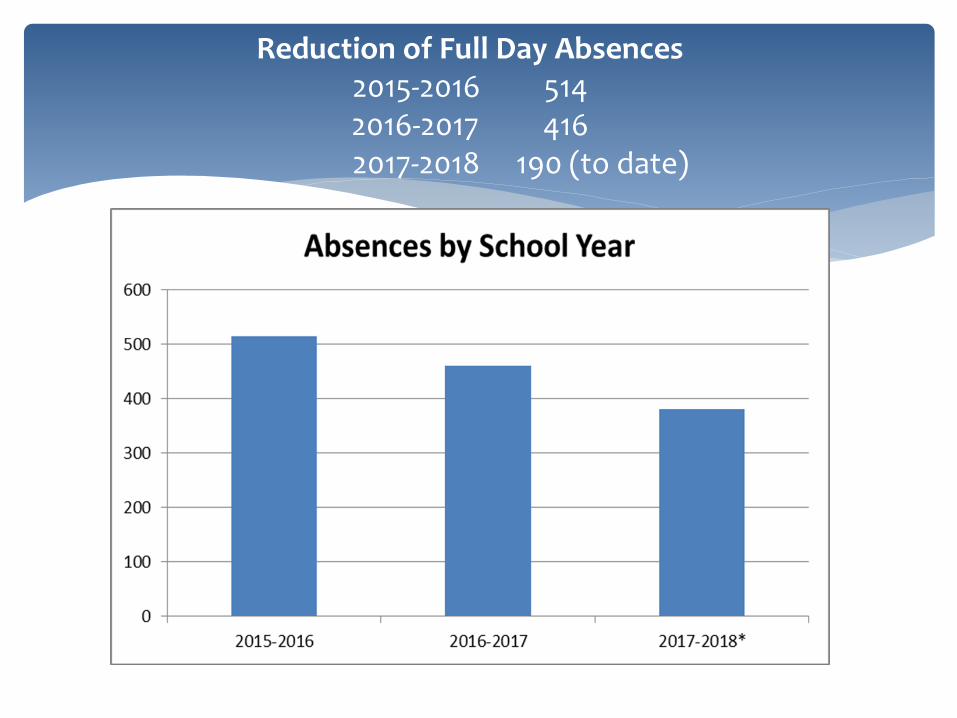
Reduction of Full Day Absences 2015-2016 514 2016-2017 416
2017-2018 190 (to date)

72% of students who participated in Human Relations for the 2016-2017 school year increased school
attendance.


STUDENT FEEDBACK
“I was going to drop out last year, I had given up. I know all of you guys are so proud of me, but I’m even more proud of myself!”
“I was nervous going into this class, but now I feel comfortable and I love it. It's where I can relax and deal with things that are difficult and stressful for me.” “I love human relations. It is a place I can go to when I am upset or anxious so that I do not have to end up leaving school. Not to mention the teachers in here also help me focus to make sure my grades are where they need to be.

• “Since the middle of my freshmen year i could barely go to any of my classes. I had horrible anxiety that prevented me from so many things in my life. I am now a junior finishing my first semester, attending all my classes, and was just exited from Special Education. I could not have been able to do this if it weren't for this class. I learned so much, formed so many bonds and improved my mental health immensely.”
• “This room is important to me because it gives me a safe
space to come during the school day, and it has helped me because it makes coming to school easier.”
• “Human relations has been very beneficial for all the students in the class. It has become a close-knit group and everyone feels comfortable with each other. It's made it a lot easier for me to attend school and not have as much anxiety.”

BUDGET SUMMARY SPECIAL EDUCATION
Budget Summary Special Education
2016-2017
Actual
Expenditures
2017-2018
Approved
Budget
2018-2019
Proposed
Budget
$
Change
Percent
Change
Tuition
(incl. mediations and RISE) 2,049,707 2,172,289 2,098,629 (73,660) -3.4%
Professional Services 591,549 519,081 564,243 45,162 8.7%
Tutoring & Homebound
(Special Ed) 27,007 50,000 42,550 (7,450) -14.9%
Legal Fees 56,130 50,000 50,000 ― 0%
Salaries 3,537,867 3,538,553 3,560,934 22,381 0.6%
Other 49,968 18,290 41,700 23,410 128.0%
ECR and Other
Reimbursements (1,257,541) (1,155,420) (1,097,248) 59,702 -5.2%
Total Special Ed 5,054,688 5,192,793 5,260,809 69,545 1.3%
Special Ed Transportation 522,427 573,713 613,495 37,140 6.9%
Total Special Ed Cost 5,577,115 5,766,506 5,874,304 106,685 1.9%

Budget Summary Pupil Personnel 2016-2017
Actual
Expenditures
2017-2018
Approved
Budget
2018-2019
Proposed
Budget
$
Change
Percent
Change
Psychologists: Pre-K –
12th 278,671 289,071 299,130 10,059 3.5%
Evaluation Consult
Psychological 55,276 45,000 45,000 — 0.0%
Tutoring Expulsion
Outplacement 9,130 30,000 20,000 (10,000) -33.3%
Nurses 208,882 222,818 226,939 4,121 1.8%
Other Guidance/Social
Worker Salaries 678,052 674,851 696,708 21,857 3.2%
Other 26,117 65,295 46,345 (18,950) -29.0%
Total Pupil Personnel Cost 1,256,128 1,327,035 1,334,123 7,088 0.5%

Special Education, Related Services &
Paraprofessional Staffing (See Class Size Report)
Spaulding
Elementary
School
McAlister
Intermediate
School
Suffield
Middle
School
Suffield
High
School
Totals
Special Education Teachers 7 4 5 6 22
Speech Therapists 2 1 0.5 0.5 4
Psychologists 1 1 1 2 5
BCBA 0.34 0.5 0.16 0 1
Occupational Therapists 0.8 0.4 0.2 0.1 1.5
Physical Therapists 0.2 0.2 0.1 0.1 0.6
Nurses 1 1 1 1 4
Paraprofessionals 21.6 12 5 5 43.6

ACHIEVE
Building Team Capacity & Improving Student Outcomes
for Students with Complex Learning Profiles
Program Structure
Weekly:
Multidisciplinary meetings
BCBA consultations (1 District; 1 CCSN BCBA)
Teacher/Paraprofessional trainings and consultations
Designated parent meetings
Bi-Monthly consultations
(administrative and case conferences)
Consistent use of individualized Program books across all classrooms to
track student data and progress towards goals and objectives
ACHIEVE is a collaboration of school staff with training and facilitation
from CCSN for students with complex needs.
2017: 4 homebase classes (PreK-K), (K-1), (1-2) & (3-4) 28 students
2018: expanding to 5th cohort (4-5) 36 students

Special Education Achieve
Ashley Sheridan, Special Education Teacher
Denise Rigby, Speech and Language Pathologist

The Achieve Philosophy
1:1 and small group direct instruction Programming is designed from individualized assessments Principles of Applied Behavioral Analysis (ABA) Discrete Trial Instruction and Direct Instruction
Assessments used to drive instruction:
Examples: FBA – ABC data collection VBMAPP AFLS Social Skills Solution Checklist Language for Learning, Thinking and Writing Connecting Math, Touch Math

“Generalization” Mastery of Skills
High Expectations for all students We review and analyze student data on a daily/weekly basis
Teaching for “Independence”
Prompt hierarchy - data collection indicating % of independent responses
All lessons indicate criteria for mastery
Generalization = 95% accuracy or above in most cases and students must demonstrate the skill across settings and people to truly master a skill.
Review of mastered skills: Maintenance
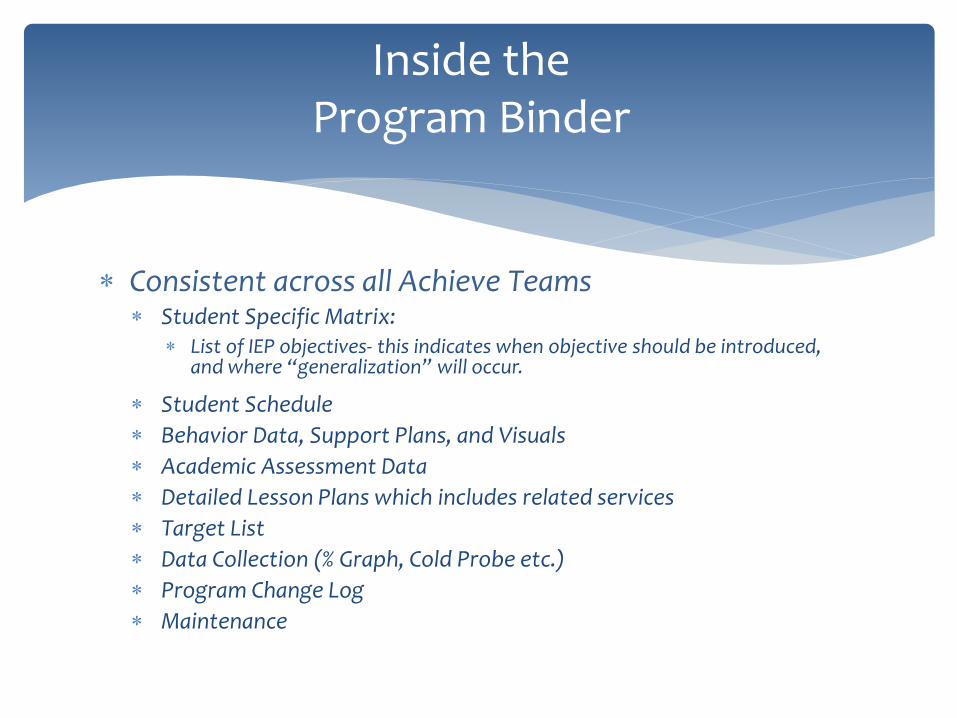
Inside the Program Binder
Consistent across all Achieve Teams Student Specific Matrix:
List of IEP objectives- this indicates when objective should be introduced, and where “generalization” will occur.
Student Schedule
Behavior Data, Support Plans, and Visuals
Academic Assessment Data
Detailed Lesson Plans which includes related services
Target List
Data Collection (% Graph, Cold Probe etc.)
Program Change Log
Maintenance

FBA Process
Replacement Skills
Special Education Staff, in consultation with the BCBA, are able to design intervention strategies for students
Consistent format for Behavior Support Plans
All staff members are able to implement the strategies written in the behavior support documents
Strong emphasis on replacement skills and functional communication
Frequent fidelity checks
BSP (Behavior Support Plans) are fluid documents and are frequently being adjusted ensure student success
Parents are part of this process with regular pre-scheduled meetings every 6-8 weeks.

ACHIEVE Team Strengths
BCBA support and consultation
Embedded Professional Development Modeling the implementation of strategies
Provides extensive training using methods of applied behavior analysis
Consults with team on the development of programs Helps teachers to plan for and guide instruction using a
systematic approach (i.e. target lists)
Provides feedback to staff
The team analyzes trends in data

Examples of Training in Action
Training Received Brief Example of
How we use it
Student Impact
Functional
Communication
Non- vocal student
Step 1: Case manager
and SLP partner to design
communication system
Step 2: SLP and Case
manger create visuals,
set up target list, and run
program in resource
room.
Step 3: Generalization in
general education
(teacher training)
The non-vocal student
now has a voice in his or
her classroom.
The student is able to
participate in morning
meeting and answer the
question of the day. The
other non-disabled peers
engage in the
communication system as
well.
The non-vocal student is
meaningfully engaged
with their peers.

Assistive Technology
SLPS and OT are attending trainings on utilizing assistive technology in the classroom
How it is used in the classroom:
Speech to text
Word prediction
Clicker6
AAC devices
New iPads & Communication apps are being used to give non-vocal students a voice across the school day.

Impact on Students Participation with Non-disabled Peers
after Learning Replacement Skills
0%
20%
40%
60%
80%
100%
120%
MorningMeeting
Reading Writing Math Special Recess Lunch
2016
2017

STAR Reading Snapshot Scaled Scores
0
100
200
300
400
500
600
700
800
900
STUDENT A STUDENT B
FALL 2016
SPRING 2017
Progress of Students Receiving Reading Intervention who
took the STAR

STAR Math Snapshot Scaled Scores
0
50
100
150
200
250
300
350
400
450
500
Student A Student B
FALL 2016
SPRING 2017
Progress of Students Receiving Math Intervention who took the STAR

Summary
The success these students had in just one year of programing is due to the structure of this team and the extensive training staff have received.
With continuation of this team approach students will continue to grow in their overall academic skills and social emotional wellbeing.
Staff continue to grow in their capacity to program for students with complex profiles
Teacher Growth = Student Growth

Tuition Cost Variables
New & Unplanned Enrollments
Severity of Disability
Residential Placements
Unilateral Parent Placements - Mediations
Tuition Increases
Students Aging Out of Program
Students Graduating

Excess Cost Factors
Out of District and In District
STUDENT
Tuition Extended School Year
Professional Services
Transportation
Staff salary & benefits
Nurse
Equipment
Materials
Other
Outside Evaluations
4.5 x $16,049=
(NCEP per CSDE)
$72,221
(deductible)

Excess Cost Factors NOT included
General education teacher salary & benefits
Materials used for grade level program
Legal fees
Facilities cost
Students unilaterally outplaced for whom the District
does not hold responsibility for the IEP
IDEA Grant expenditures

Example of Student Excess Cost
Reimbursement (ECR) Claim
Special Ed Teacher Cost $ 9,900
Occupational Therapist Cost $ 5,950
Physical Therapist Cost $ 5,950
Speech-Language Pathologist Cost $ 5,700
Special Transportation $25,795
Augmentative Communication Device $ 8,000
Physical Adaptive Equipment $ 2,000
Paraprofessional Cost $40,000
Evaluations $ 2,000
Total Submitted $105,295
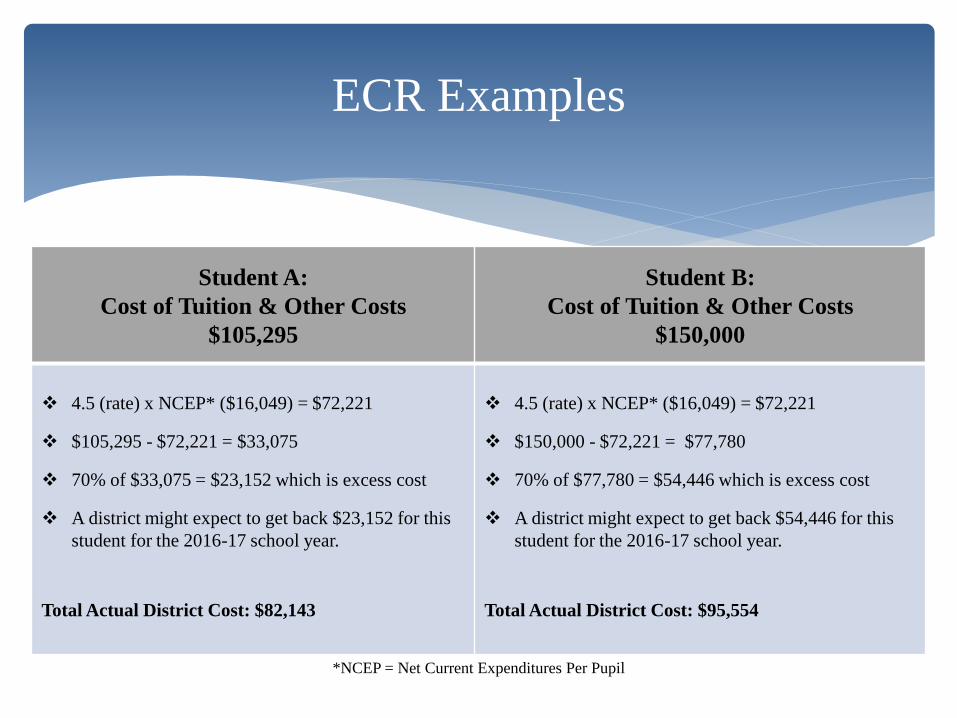
ECR Examples
Student A:
Cost of Tuition & Other Costs
$105,295
Student B:
Cost of Tuition & Other Costs
$150,000
4.5 (rate) x NCEP* ($16,049) = $72,221
$105,295 - $72,221 = $33,075
70% of $33,075 = $23,152 which is excess cost
A district might expect to get back $23,152 for this
student for the 2016-17 school year.
Total Actual District Cost: $82,143
4.5 (rate) x NCEP* ($16,049) = $72,221
$150,000 - $72,221 = $77,780
70% of $77,780 = $54,446 which is excess cost
A district might expect to get back $54,446 for this
student for the 2016-17 school year.
Total Actual District Cost: $95,554
*NCEP = Net Current Expenditures Per Pupil

Range of Tuition & Additional Costs (All special education students including outplaced, magnet and 18-21 transition students.)
$72,222 –
Over 4.5 x NCEP* 0 - $72,221
# of Students 2013-14 19 221
# of Students 2014-15 15 206
# of Students 2015-16 12 280
# of Students 2016-17 15 290
# of Students 2017-18 27 301
*NCEP = Net Current Expenditures Per Pupil
2018-2019
Special Service Budget
Questions?