2018 annual statistical report - torontopolice.on.ca
TRANSCRIPT

2018
Annual Statistical Report
Toronto Police Service
Glossary of Terms 6Introduction 9Summary 10
Statistics at a Glance 12
Crimes Against Person 14Crimes Against Property 14Criminal Code Traffic 14Other Crime 15Controlled Drug and Substances Act by Age and Gender 15Other Federal 15Hate/Bias Crime 15Crimes Against Person, Crimes Against Property, Criminal Code 16
Homicides 18Sexual Violations 18Non-Sexual Assaults 18Robberies - Financial 18Robberies - Other 18Distribution of Crimes Against Persons 18Distribution of Violent Crime 18
Break and Enter - Houses 19Break and Enter - Apartments 19Break and Enter - Business Premises 19Stolen Vehicles 19Distribution of Crimes Against Property 19Distribution of Break & Enter 19
Reported Crime by Command 20Reported Crime by Division ( D11, D12, D13, D14) 21Reported Crime by Division ( D22, D23, D31, D32, D33) 22
Reported Crime by Command & Division
Table of Contents
Crimes Against Person - Violent Crime
Crimes Against Property
Reported Crime Overview
Reported Crime
Breakdown of Reported Crime
2 2018 Annual Statistical Report

Table of ContentsReported Crime by Division ( D41, D42, D43) 23Reported Crime by Division ( D51, D52, D53, D54, D55) 24
Non-Sexual Assaults by Age and Gender 26Sexual Violations by Age and Gender 26Break and Enter by Age & Gender 26Robberies by Age and Gender 27Controlled Drug and Substances Act by Age and Gender 27Drinking and Driving Offences by Age and Gender 27Persons Charged Violent Crime by Age and Gender 27Persons Charged by Accused Age Category & Gender 28Persons Charged by Division 29
Sexual Violations by Age and Gender 31Non-Sexual Assaults by Age and Gender 31Robberies by Age and Gender 31Crimes Against Person by Age and Gender 32Selected Offences Against Police Officers 32
Level 3 Searches 34Level 4 Searches 34Transgender Searches 34Items Found During Search 34
Firearms Seizure 36Guns Reported Stolen to Toronto Police Service 36Firearm Thefts by Premise Type 36Gun Seizures 37Crime Guns - Firearm Type 37Crime Guns - Firearm Classification 37Stolen Firearms - Recovered by Toronto Police Service 37Top 10 Manufacturers by Firearm Type 38Top 5 Calibres by Firearm Type 38Types of Firearms Stolen and Recovered in Toronto 38
Firearms
Persons Charged
Victims of Crime
Search of Persons
3 2018 Annual Statistical Report
Table of ContentsTop 20 Offences Related to Firearms Seized 39Shooting Locations (Map) 39
Total Collisions 41Fatal Collisions and Persons Killed 41Injury Collisions and Persons Injured 41Fail to Remain - Injury & Property Damage Collisions 41Property Damage Collisions 41Traffic - Persons Charged by Division 42R.I.D.E. Information 42
Uniform Staff 44Civilian Staff 44Other Staff 44Distribution of Personnel by Branches of the Service 44Personnel by Division 45Uniform Strength and Expenditures 46Gross Operating Budget by Distribution 46Divisional Population/Area (km²) / Gross Expenditures by Division 46
Calls Received 48Alarm Calls 48Dispatched Calls by Division 48Calls Dispatched vs Not Dispatched 48AT&T Language Line Service 48
Public Complaints Filed with the O.I.P.R.D. 50
Number of Regulated Interactions 52Demographics 53
Regulated Interactions
Traffic
Personnel and Budget
Calls for Service
Public Complaints Filed with the O.I.P.R.D.
4 2018 Annual Statistical Report
Table of Contents
Community Mobilization (Divisional Policing Support Unit) 55Volunteer Resources 55Victims Services 55Industrial Liaison 55Crime Stoppers 56Fleet 56
Firearms Classification Definitions 57Appendix - A
Administrative
5 2018 Annual Statistical Report

Glossary
6 2018 Annual Statistical Report

Glossary of Terms
% Change:The percent increase or decrease from the previous year.
% Clear:The percent of offences reported in a given year which have been cleared.
Adult: A person who is 18 years of age or older.
E.F.C.: East Field Command (includes Divisions: D13, D32, D33, D41, D42, D43, D53, D54/D55)
C.D.S.A.:Violations under the Controlled Drugs and Substances Act.
W.F.C.: West Field Command (includes Divisions: D11, D12, D14, D22, D23, D31, D51, D52)
Cleared: An offence can be considered cleared when a charge is laid, recommended or the person(s) who committed the offence has been identified and no charge has been laidfor some reason.
Crimes Against Person:
Crimes Against Property:
Crime Gun: The National Weapons Enforcement Support Team (NWEST) defines a crime gun as “any firearm that is illegally possessed, used in crime or suspected to have been used in a crime, or has an obliterated serial number.”
Level 3 Search:A search that includes the removal of some or all of a person's clothing and a visual inspection of the body. More specifically, a Level 3 search involves removal of clothing that fully exposes the undergarments or an area of the body normally covered by undergarments (genitalia, buttocks, women's breasts). NOTE: The mere fact that portions of a person's body normally covered by undergarments are exposed because of the way the person was dressed when taken into custody does not constitute a Level 3 search, if the removal of such clothing was not caused by the police (e.g. the arrest of a naked person does not constitute a Level 3 search).
Crimes involving aggressive action (with the intent to do harm) or threat of such action by one person against another.
Unlawful acts with respect to property but which do not involve the use or threat of violence against an individual.
7 2018 Annual Statistical Report
Glossary of Terms
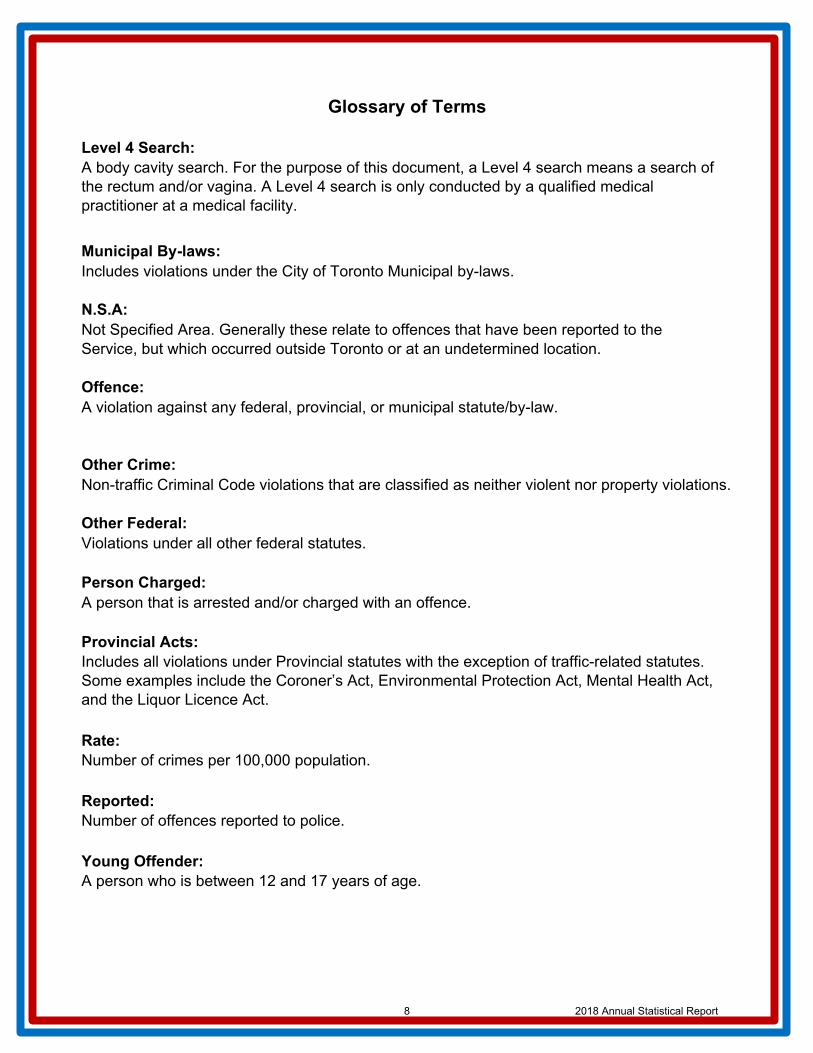
Level 4 Search:A body cavity search. For the purpose of this document, a Level 4 search means a search of the rectum and/or vagina. A Level 4 search is only conducted by a qualified medical practitioner at a medical facility.
Municipal By-laws: Includes violations under the City of Toronto Municipal by-laws.
N.S.A: Not Specified Area. Generally these relate to offences that have been reported to the Service, but which occurred outside Toronto or at an undetermined location.
Offence: A violation against any federal, provincial, or municipal statute/by-law.
Other Crime:Non-traffic Criminal Code violations that are classified as neither violent nor property violations.
Other Federal:Violations under all other federal statutes.
Person Charged: A person that is arrested and/or charged with an offence.
Provincial Acts:
Rate: Number of crimes per 100,000 population.
Reported: Number of offences reported to police.
Young Offender: A person who is between 12 and 17 years of age.
Includes all violations under Provincial statutes with the exception of traffic-related statutes. Some examples include the Coroner’s Act, Environmental Protection Act, Mental Health Act, and the Liquor Licence Act.
8 2018 Annual Statistical Report

Introduction
Source Data:The crime related data contained in this report are derived from the Versadex records management system.
This system is continuously being updated and, as a result, some changes to statistics published in previous statistical reports should be expected.
Crime statistics contained in this report are based on the date that the information was reported or became known to police. This is done to minimize changes in reported statistics year over year and to enable some degree of comparability with statistics reported by Statistics Canada.
Other data comes from a combination of an automated and manual systems maintained by the individual units responsible.
Comparing Crime Statistics:The Crime statistics in this report may be compared with previous Annual Statistical Reports however it is important to note that changes in methodology may occur over time.
The crime statistics in this report may not be directly comparable with crime statistics prepared by other agencies as differing methods of categorization, geographic, technical, data, and time constraints may affect comparability.
Detailed information pertaining to Statistics Canada crime reporting methodology can be found in the Uniform Crime Reporting Survey documents posted on the Statistics Canada website, http://www.statcan.gc.ca.
9 2018 Annual Statistical Report
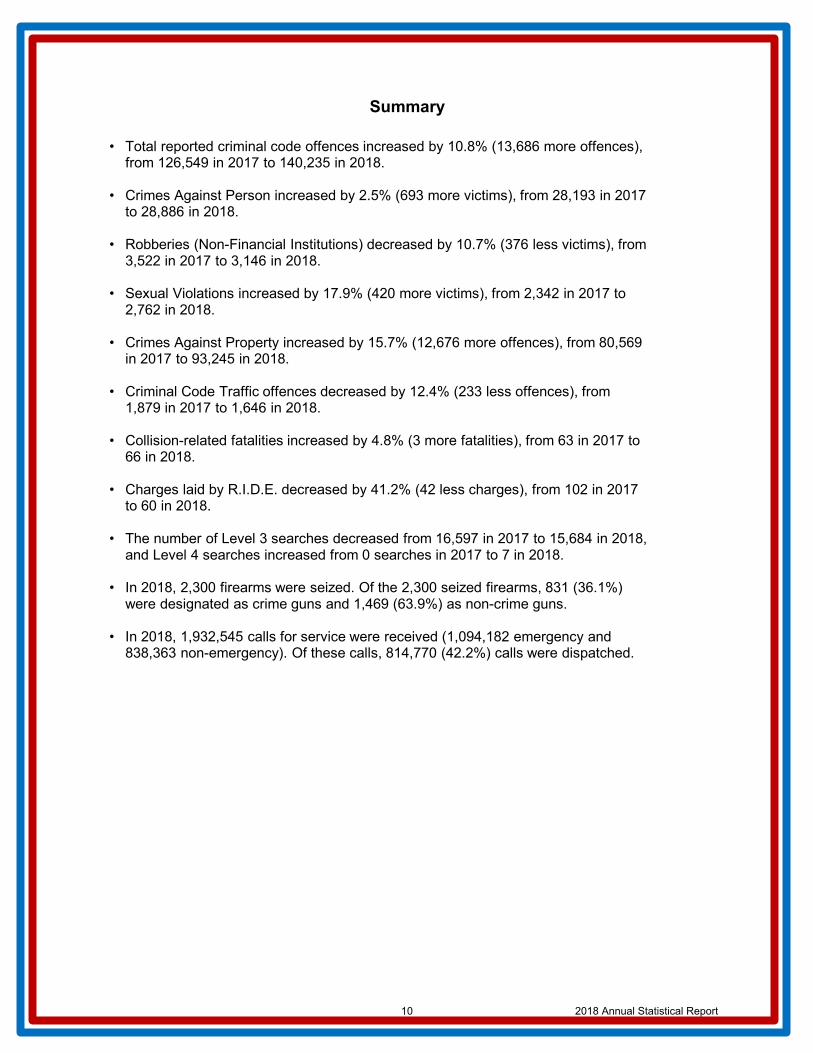
Summary
• Total reported criminal code offences increased by 10.8% (13,686 more offences),from 126,549 in 2017 to 140,235 in 2018.
• Crimes Against Person increased by 2.5% (693 more victims), from 28,193 in 2017to 28,886 in 2018.
• Robberies (Non-Financial Institutions) decreased by 10.7% (376 less victims), from3,522 in 2017 to 3,146 in 2018.
• Sexual Violations increased by 17.9% (420 more victims), from 2,342 in 2017 to2,762 in 2018.
• Crimes Against Property increased by 15.7% (12,676 more offences), from 80,569in 2017 to 93,245 in 2018.
• Criminal Code Traffic offences decreased by 12.4% (233 less offences), from1,879 in 2017 to 1,646 in 2018.
• Collision-related fatalities increased by 4.8% (3 more fatalities), from 63 in 2017 to66 in 2018.
• Charges laid by R.I.D.E. decreased by 41.2% (42 less charges), from 102 in 2017to 60 in 2018.
• The number of Level 3 searches decreased from 16,597 in 2017 to 15,684 in 2018,and Level 4 searches increased from 0 searches in 2017 to 7 in 2018.
• In 2018, 2,300 firearms were seized. Of the 2,300 seized firearms, 831 (36.1%)were designated as crime guns and 1,469 (63.9%) as non-crime guns.
• In 2018, 1,932,545 calls for service were received (1,094,182 emergency and838,363 non-emergency). Of these calls, 814,770 (42.2%) calls were dispatched.
10 2018 Annual Statistical Report
Reported CrimesOverview
11 2018 Annual Statistical Report
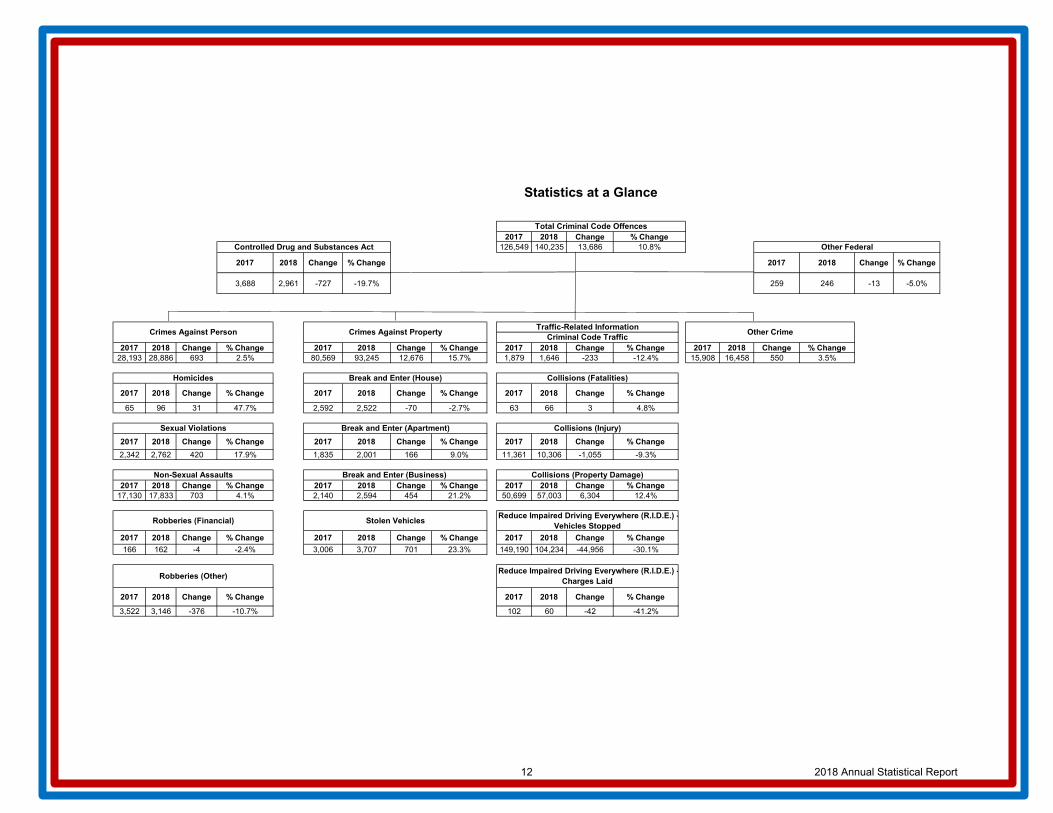
2017 2018 Change126,549 140,235 13,686
2017 2018 Change % Change 2017 2018 Change % Change
3,688 2,961 -727 -19.7% 259 246 -13 -5.0%
2017 2018 Change % Change 2017 2018 Change % Change 2017 2018 Change % Change 2017 2018 Change % Change28,193 28,886 693 2.5% 80,569 93,245 12,676 15.7% 1,879 1,646 -233 -12.4% 15,908 16,458 550 3.5%
2017 2018 Change % Change 2017 2018 Change % Change 2017 2018 Change % Change
65 96 31 47.7% 2,592 2,522 -70 -2.7% 63 66 3 4.8%
2017 2018 Change % Change 2017 2018 Change % Change 2017 2018 Change % Change
2,342 2,762 420 17.9% 1,835 2,001 166 9.0% 11,361 10,306 -1,055 -9.3%
2017 2018 Change % Change 2017 2018 Change % Change 2017 2018 Change % Change17,130 17,833 703 4.1% 2,140 2,594 454 21.2% 50,699 57,003 6,304 12.4%
2017 2018 Change % Change 2017 2018 Change % Change 2017 2018 Change % Change
166 162 -4 -2.4% 3,006 3,707 701 23.3% 149,190 104,234 -44,956 -30.1%
2017 2018 Change % Change 2017 2018 Change % Change
3,522 3,146 -376 -10.7% 102 60 -42 -41.2%
Robberies (Other)
Homicides
Stolen Vehicles
Break and Enter (Business)
Reduce Impaired Driving Everywhere (R.I.D.E.) -Charges Laid
Collisions (Property Damage)Non-Sexual Assaults
Robberies (Financial)
Sexual Violations Break and Enter (Apartment)
Statistics at a Glance
Reduce Impaired Driving Everywhere (R.I.D.E.) -Vehicles Stopped
Other Federal
Other Crime
Collisions (Fatalities)
Collisions (Injury)
Crimes Against Person Crimes Against Property
Break and Enter (House)
Total Criminal Code Offences
Traffic-Related InformationCriminal Code Traffic
10.8%% Change
Controlled Drug and Substances Act
12 2018 Annual Statistical Report

Reported Crime(Crimes Against Persons, Crimes Against Property, Criminal Code Traffic,
Other Crime, Controlled Drug Substances Act and Other Federal)
13 2018 Annual Statistical Report
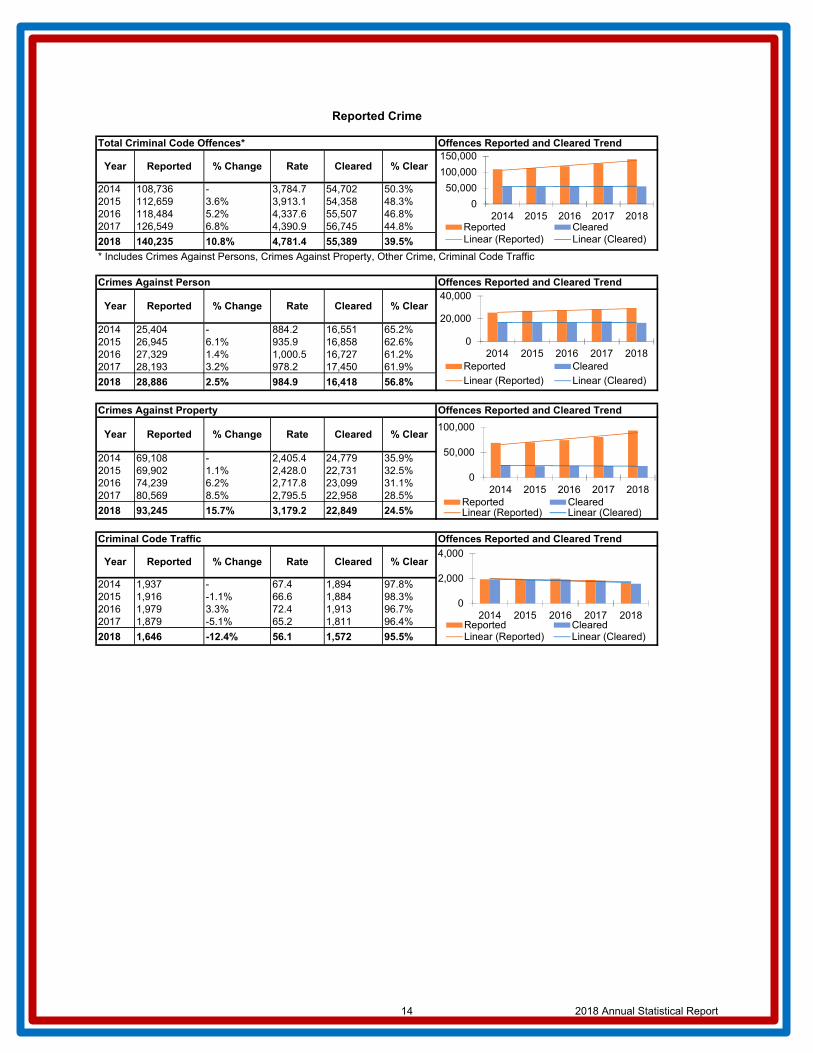
2014 108,736 - 3,784.7 54,702 50.3%2015 112,659 3.6% 3,913.1 54,358 48.3%2016 118,484 5.2% 4,337.6 55,507 46.8%2017 126,549 6.8% 4,390.9 56,745 44.8%
2018 140,235 10.8% 4,781.4 55,389 39.5%
2014 25,404 - 884.2 16,551 65.2%2015 26,945 6.1% 935.9 16,858 62.6%2016 27,329 1.4% 1,000.5 16,727 61.2%2017 28,193 3.2% 978.2 17,450 61.9%
2018 28,886 2.5% 984.9 16,418 56.8%
2014 69,108 - 2,405.4 24,779 35.9%2015 69,902 1.1% 2,428.0 22,731 32.5%2016 74,239 6.2% 2,717.8 23,099 31.1%2017 80,569 8.5% 2,795.5 22,958 28.5%
2018 93,245 15.7% 3,179.2 22,849 24.5%
2014 1,937 - 67.4 1,894 97.8%2015 1,916 -1.1% 66.6 1,884 98.3%2016 1,979 3.3% 72.4 1,913 96.7%2017 1,879 -5.1% 65.2 1,811 96.4%
2018 1,646 -12.4% 56.1 1,572 95.5%
Year % Clear
Year
Year
% ClearCleared
Offences Reported and Cleared Trend
Reported
Cleared
Cleared
Rate% ChangeReported
Crimes Against Person
Reported Crime
RateReported
Rate
% ClearClearedRate
% ChangeReported
Year % Change
% Change
% Clear
Total Criminal Code Offences* Offences Reported and Cleared Trend
Criminal Code Traffic Offences Reported and Cleared Trend
* Includes Crimes Against Persons, Crimes Against Property, Other Crime, Criminal Code Traffic
Crimes Against Property Offences Reported and Cleared Trend
0
50,000
100,000
150,000
2014 2015 2016 2017 2018Reported ClearedLinear (Reported) Linear (Cleared)
0
20,000
40,000
2014 2015 2016 2017 2018Reported Cleared
Linear (Reported) Linear (Cleared)
0
50,000
100,000
2014 2015 2016 2017 2018Reported ClearedLinear (Reported) Linear (Cleared)
0
2,000
4,000
2014 2015 2016 2017 2018Reported ClearedLinear (Reported) Linear (Cleared)
14 2018 Annual Statistical Report
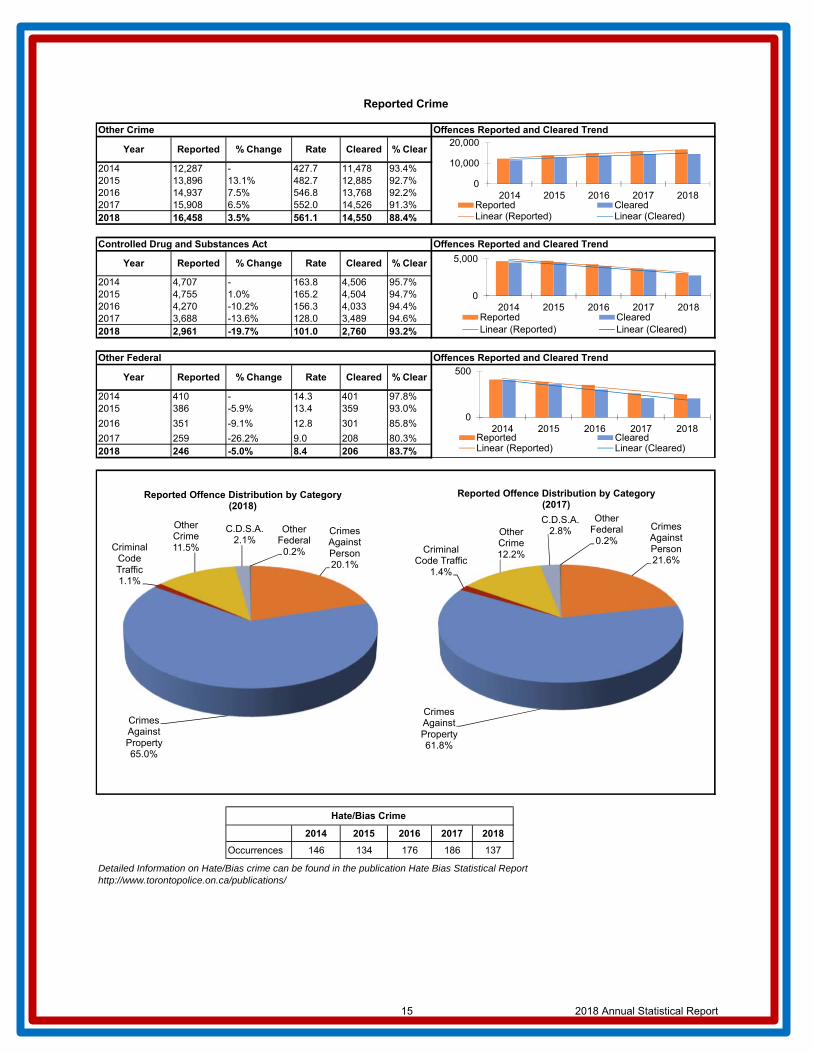
2014 12,287 - 427.7 11,478 93.4%2015 13,896 13.1% 482.7 12,885 92.7%2016 14,937 7.5% 546.8 13,768 92.2%2017 15,908 6.5% 552.0 14,526 91.3%2018 16,458 3.5% 561.1 14,550 88.4%
2014 4,707 - 163.8 4,506 95.7%2015 4,755 1.0% 165.2 4,504 94.7%2016 4,270 -10.2% 156.3 4,033 94.4%2017 3,688 -13.6% 128.0 3,489 94.6%2018 2,961 -19.7% 101.0 2,760 93.2%
2014 410 - 14.3 401 97.8%2015 386 -5.9% 13.4 359 93.0%
2016 351 -9.1% 12.8 301 85.8%
2017 259 -26.2% 9.0 208 80.3%2018 246 -5.0% 8.4 206 83.7%
2014 2015 2016 2017 2018
Occurrences 146 134 176 186 137
Detailed Information on Hate/Bias crime can be found in the publication Hate Bias Statistical Report http://www.torontopolice.on.ca/publications/
Reported % Change Rate Cleared % Clear
Controlled Drug and Substances Act Offences Reported and Cleared Trend
Other Federal Offences Reported and Cleared Trend
Hate/Bias Crime
Year Reported % Change
Reported Crime
% ClearClearedYear Reported % Change Rate
Other Crime Offences Reported and Cleared Trend
Rate Cleared % Clear
Year
0
10,000
20,000
2014 2015 2016 2017 2018Reported ClearedLinear (Reported) Linear (Cleared)
0
5,000
2014 2015 2016 2017 2018Reported ClearedLinear (Reported) Linear (Cleared)
0
500
2014 2015 2016 2017 2018Reported ClearedLinear (Reported) Linear (Cleared)
Crimes Against Person20.1%
Crimes Against Property65.0%
Criminal Code Traffic 1.1%
Other Crime11.5%
C.D.S.A.2.1%
Other Federal
0.2%
Reported Offence Distribution by Category (2018)
Crimes Against Person21.6%
Crimes Against Property61.8%
Criminal Code Traffic
1.4%
Other Crime12.2%
C.D.S.A.2.8%
Other Federal
0.2%
Reported Offence Distribution by Category (2017)
15 2018 Annual Statistical Report

Reported Rate % Clear Reported Rate % Clear Reported Rate % Clear Reported Rate % Clear Reported Rate % ClearD13 965 697.6 75.4% 2,883 2,084.3 28.8% 73 52.8 95.9% 507 366.5 85.6% 4,428 3,201.2 46.6%
D32 1,961 715.3 67.0% 7,044 2,569.4 25.9% 93 33.9 92.5% 957 349.1 85.9% 10,055 3,667.6 40.2%
D33 1,072 517.5 69.9% 3,856 1,861.5 21.3% 90 43.4 94.4% 332 160.3 83.1% 5,350 2,582.7 36.1%
D41 2,113 1,138.2 82.9% 5,438 2,929.4 29.6% 113 60.9 95.6% 1,521 819.3 88.6% 9,185 4,947.8 52.5%
D42 1,574 576.5 71.2% 4,589 1,680.9 18.2% 123 45.1 97.6% 501 183.5 86.2% 6,787 2,485.9 36.9%
D43 2,383 1,108.3 81.7% 5,059 2,352.8 37.1% 175 81.4 92.6% 1,575 732.5 91.3% 9,192 4,275.0 59.0%
D53 1,154 567.3 64.5% 5,660 2,782.5 19.9% 58 28.5 91.4% 493 242.4 83.4% 7,365 3,620.7 31.7%
D54 & D55 2,409 934.4 80.6% 7,754 3,007.5 26.1% 120 46.5 99.2% 1,132 439.1 87.4% 11,415 4,427.5 44.4%
E. F. C. 13,631 776.9 75.5% 42,283 2,409.9 25.9% 845 48.2 95.0% 7,018 400.0 87.6% 63,777 3,635.0 44.2%
D11 1,099 808.0 70.9% 4,489 3,300.2 27.1% 59 43.4 93.2% 622 457.3 87.6% 6,269 4,608.8 41.4%
D12 1,133 871.9 79.4% 2,922 2,248.7 29.7% 92 70.8 96.7% 624 480.2 92.1% 4,771 3,671.6 51.0%
D14 2,088 1,225.7 74.7% 7,694 4,516.7 20.8% 92 54.0 95.7% 1,029 604.1 88.8% 10,903 6,400.5 38.2%
D22 1,629 720.0 65.1% 5,445 2,406.7 26.7% 94 41.5 93.6% 1,271 561.8 92.5% 8,439 3,730.0 44.8%
D23 1,466 894.0 71.8% 4,432 2,702.8 18.5% 79 48.2 93.7% 429 261.6 87.4% 6,406 3,906.6 36.2%
D31 2,049 1,341.5 77.8% 4,400 2,880.8 23.1% 123 80.5 93.5% 915 599.1 86.4% 7,487 4,901.9 47.0%
D51 2,771 2,381.4 64.8% 10,980 9,436.3 19.7% 70 60.2 92.9% 1,503 1,291.7 84.8% 15,324 13,169.6 34.6%
D52 2,136 2,580.2 68.3% 9,313 11,249.8 27.4% 68 82.1 98.5% 2,571 3,105.7 86.0% 14,088 17,017.8 44.6%
W. F. C. 14,371 1,219.5 71.0% 49,675 4,215.4 23.5% 677 57.5 94.7% 8,964 760.7 87.7% 73,687 6,253.1 41.2%
N.S.A. 884 N/A 51.2% 1,287 N/A 22.5% 124 N/A 96.8% 476 N/A 92.2% 2,771 N/A 47.0%
Toronto 28,886 984.9 72.5% 93,245 3,179.2 24.6% 1,646 56.1 95.0% 16,458 561.1 87.8% 140,235 4,781.4 42.7%
Crimes Against Person / Crimes Against Property / Criminal Code Traffic / Other Criminal Code Offences
UnitCrimes Against Person Crimes Against Property Criminal Code Traffic Other Crime Total Criminal Code
Crimes Against Person, Crimes Against Property, Criminal Code Traffic and Other Crime Offences
2018 Divisional Comparison
W.F.C. = West Field CommandE.F.C. = East Field CommandN.S.A. = No Specified Address
16 2018 Annual Statistical Report

Breakdown of Reported Crime
17 2018 Annual Statistical Report

Year Reported % Change Rate Cleared % Clear
2014 58 - 2.0 41 70.7%2015 59 1.7% 2.0 41 69.5%2016 75 27.1% 2.7 41 54.7%2017 65 -13.3% 2.3 33 50.8%2018 96 47.7% 3.3 63 65.6%
Year Reported % Change Rate Cleared % Clear
2014 2,097 - 73.0 1,273 60.7%2015 2,174 3.7% 75.5 1,346 61.9%2016 2,187 0.6% 80.1 1,361 62.2%2017 2,342 7.1% 81.3 1,405 60.0%2018 2,762 17.9% 94.2 1,462 52.9%
Year Reported % Change Rate Cleared % Clear
2014 15,157 - 527.6 10,842 71.5%2015 15,910 5.0% 552.6 10,976 69.0%2016 16,575 4.2% 606.8 10,992 66.3%2017 17,130 3.3% 594.4 11,375 66.4%2018 17,833 4.1% 608.0 10,971 61.5%
Year Reported % Change Rate Cleared % Clear
2014 130 - 4.5 108 83.1%2015 135 3.8% 4.7 115 85.2%2016 139 3.0% 5.1 116 83.5%2017 166 19.4% 5.8 126 75.9%2018 162 -2.4% 5.5 129 79.6%
Year Reported % Change Rate Cleared % Clear
2014 3,245 - 112.9 1,398 43.1%2015 3,079 -5.1% 106.9 1,278 41.5%2016 3,312 7.6% 121.2 1,334 40.3%2017 3,522 6.3% 122.2 1,451 41.2%2018 3,146 -10.7% 107.3 1,262 40.1%
Crimes Against Person Breakdown
Robberies (Financial)
Robberies (Other)
Homicides
Sexual Violations
Non-Sexual Assaults
0255075
100
2014 2015 2016 2017 2018Reported ClearedLinear (Reported) Linear (Cleared)
0
2,000
4,000
2014 2015 2016 2017 2018Reported ClearedLinear (Reported) Linear (Cleared)
0
1,000
2,000
3,000
2014 2015 2016 2017 2018Reported ClearedLinear (Reported) Linear (Cleared)
0
10,000
20,000
2014 2015 2016 2017 2018Reported ClearedLinear (Reported) Linear (Cleared)
04080
120160200
2014 2015 2016 2017 2018Reported ClearedLinear (Reported) Linear (Cleared)
Other Crimes Against Person
16.9%
Violent Crime*83.1%
Distribution of Crimes Against Person (2018)Homicides
0.4% Sexual Violations
11.5%
Non Sexual Assaults74.3%
Robberies13.8%
Distribution of Violent Crime (2018)
*Violent Crime = Homicides + Sexual Violations + Non-Sexual Assaults + Robberies
18 2018 Annual Statistical Report
Year Reported % Change Rate Cleared % Clear
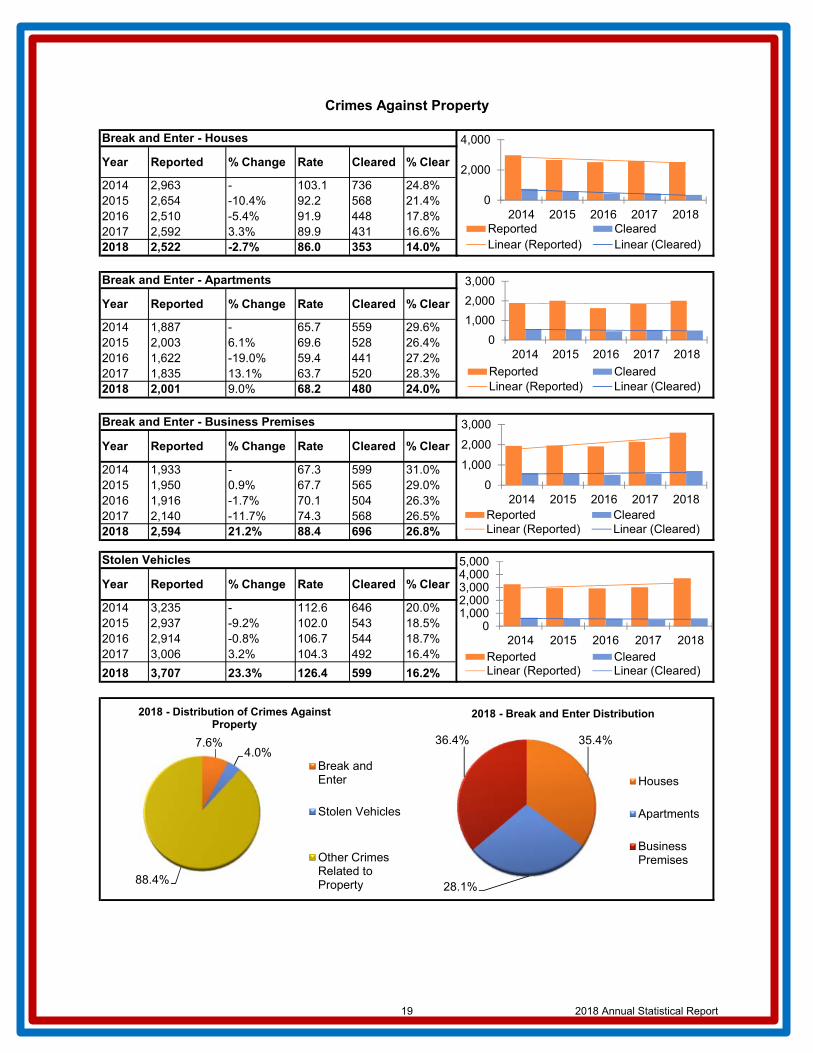
2014 2,963 - 103.1 736 24.8%2015 2,654 -10.4% 92.2 568 21.4%2016 2,510 -5.4% 91.9 448 17.8%2017 2,592 3.3% 89.9 431 16.6%2018 2,522 -2.7% 86.0 353 14.0%
Year Reported % Change Rate Cleared % Clear
2014 1,887 - 65.7 559 29.6%2015 2,003 6.1% 69.6 528 26.4%2016 1,622 -19.0% 59.4 441 27.2%2017 1,835 13.1% 63.7 520 28.3%2018 2,001 9.0% 68.2 480 24.0%
Year Reported % Change Rate Cleared % Clear
2014 1,933 - 67.3 599 31.0%2015 1,950 0.9% 67.7 565 29.0%2016 1,916 -1.7% 70.1 504 26.3%2017 2,140 -11.7% 74.3 568 26.5%2018 2,594 21.2% 88.4 696 26.8%
Year Reported % Change Rate Cleared % Clear
2014 3,235 - 112.6 646 20.0%2015 2,937 -9.2% 102.0 543 18.5%2016 2,914 -0.8% 106.7 544 18.7%2017 3,006 3.2% 104.3 492 16.4%
2018 3,707 23.3% 126.4 599 16.2%
Crimes Against Property
Stolen Vehicles
Break and Enter - Business Premises
Break and Enter - Apartments
Break and Enter - Houses
0
2,000
4,000
2014 2015 2016 2017 2018Reported ClearedLinear (Reported) Linear (Cleared)
0
1,000
2,000
3,000
2014 2015 2016 2017 2018
Reported ClearedLinear (Reported) Linear (Cleared)
0
1,000
2,000
3,000
2014 2015 2016 2017 2018Reported ClearedLinear (Reported) Linear (Cleared)
01,0002,0003,0004,0005,000
2014 2015 2016 2017 2018Reported ClearedLinear (Reported) Linear (Cleared)
7.6%4.0%
88.4%
2018 - Distribution of Crimes Against Property
Break andEnter
Stolen Vehicles
Other CrimesRelated toProperty
35.4%
28.1%
36.4%
2018 - Break and Enter Distribution
Houses
Apartments
BusinessPremises
19 2018 Annual Statistical Report
Breakdown of Reported Crime by Command
Mur
der*
Atte
mpt
ed M
urde
rSe
xual
Vio
latio
nA
ssau
lt
Rob
bery
Bre
ak a
nd E
nter
**M
otor
Veh
icle
The
ft
Thef
t Ove
r $50
00Th
eft U
nder
$50
00Fr
aud
Offe
nsiv
e W
eapo
nsC
rimin
al C
ode
Traf
fic
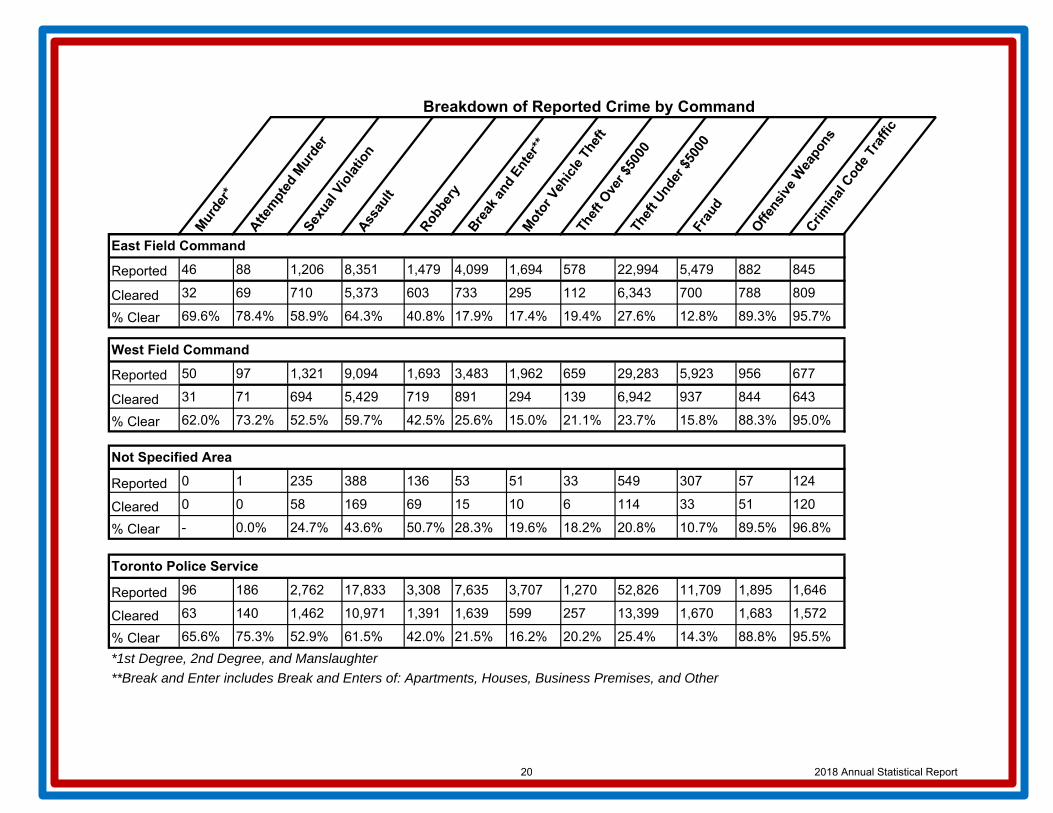
Reported 46 88 1,206 8,351 1,479 4,099 1,694 578 22,994 5,479 882 845
Cleared 32 69 710 5,373 603 733 295 112 6,343 700 788 809
% Clear 69.6% 78.4% 58.9% 64.3% 40.8% 17.9% 17.4% 19.4% 27.6% 12.8% 89.3% 95.7%
Reported 50 97 1,321 9,094 1,693 3,483 1,962 659 29,283 5,923 956 677
Cleared 31 71 694 5,429 719 891 294 139 6,942 937 844 643
% Clear 62.0% 73.2% 52.5% 59.7% 42.5% 25.6% 15.0% 21.1% 23.7% 15.8% 88.3% 95.0%
Reported 0 1 235 388 136 53 51 33 549 307 57 124
Cleared 0 0 58 169 69 15 10 6 114 33 51 120
% Clear - 0.0% 24.7% 43.6% 50.7% 28.3% 19.6% 18.2% 20.8% 10.7% 89.5% 96.8%
Reported 96 186 2,762 17,833 3,308 7,635 3,707 1,270 52,826 11,709 1,895 1,646
Cleared 63 140 1,462 10,971 1,391 1,639 599 257 13,399 1,670 1,683 1,572
% Clear 65.6% 75.3% 52.9% 61.5% 42.0% 21.5% 16.2% 20.2% 25.4% 14.3% 88.8% 95.5%
**Break and Enter includes Break and Enters of: Apartments, Houses, Business Premises, and Other
*1st Degree, 2nd Degree, and Manslaughter
Toronto Police Service
East Field Command
West Field Command
Not Specified Area
20 2018 Annual Statistical Report
Breakdown of Reported Crime by Division
Mur
der*
Atte
mpt
ed M
urde
rSe
xual
Vio
latio
nA
ssau
lt
Rob
bery
Bre
ak a
nd E
nter
**M
otor
Veh
icle
The
ft
Thef
t Ove
r $50
00Th
eft U
nder
$50
00Fr
aud
Offe
nsiv
e W
eapo
nsC
rimin
al C
ode
Traf
fic
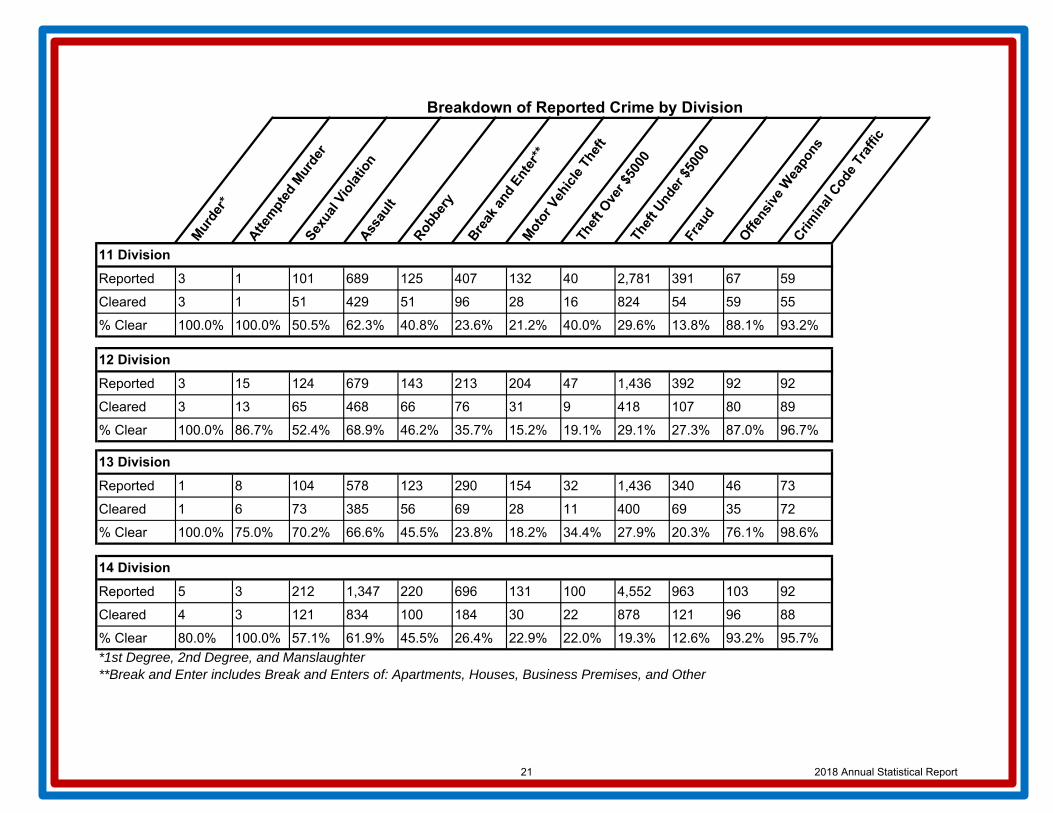
Reported 3 1 101 689 125 407 132 40 2,781 391 67 59
Cleared 3 1 51 429 51 96 28 16 824 54 59 55
% Clear 100.0% 100.0% 50.5% 62.3% 40.8% 23.6% 21.2% 40.0% 29.6% 13.8% 88.1% 93.2%
Reported 3 15 124 679 143 213 204 47 1,436 392 92 92
Cleared 3 13 65 468 66 76 31 9 418 107 80 89
% Clear 100.0% 86.7% 52.4% 68.9% 46.2% 35.7% 15.2% 19.1% 29.1% 27.3% 87.0% 96.7%
Reported 1 8 104 578 123 290 154 32 1,436 340 46 73
Cleared 1 6 73 385 56 69 28 11 400 69 35 72
% Clear 100.0% 75.0% 70.2% 66.6% 45.5% 23.8% 18.2% 34.4% 27.9% 20.3% 76.1% 98.6%
Reported 5 3 212 1,347 220 696 131 100 4,552 963 103 92
Cleared 4 3 121 834 100 184 30 22 878 121 96 88
% Clear 80.0% 100.0% 57.1% 61.9% 45.5% 26.4% 22.9% 22.0% 19.3% 12.6% 93.2% 95.7%
**Break and Enter includes Break and Enters of: Apartments, Houses, Business Premises, and Other*1st Degree, 2nd Degree, and Manslaughter
11 Division
12 Division
13 Division
14 Division
21 2018 Annual Statistical Report

Breakdown of Reported Crime by Division
Mur
der*
Atte
mpt
ed M
urde
rSe
xual
Vio
latio
nA
ssau
lt
Rob
bery
Bre
ak a
nd E
nter
**M
otor
Veh
icle
The
ft
Thef
t Ove
r $50
00Th
eft U
nder
$50
00Fr
aud
Offe
nsiv
e W
eapo
nsC
rimin
al C
ode
Traf
fic
Reported 7 14 121 1,077 153 450 278 108 3,002 742 87 94
Cleared 6 10 64 559 65 123 46 26 889 120 82 89
% Clear 85.7% 71.4% 52.9% 51.9% 42.5% 27.3% 16.5% 24.1% 29.6% 16.2% 94.3% 94.7%
Reported 12 17 127 869 211 377 625 72 1,928 648 66 79
Cleared 6 10 82 536 72 59 63 13 381 125 59 74
% Clear 50.0% 58.8% 64.6% 61.7% 34.1% 15.6% 10.1% 18.1% 19.8% 19.3% 89.4% 93.7%
Reported 8 25 190 1,248 246 302 358 71 2,161 626 167 123
Cleared 1 18 124 771 118 72 44 9 538 91 136 115
% Clear 12.5% 72.0% 65.3% 61.8% 48.0% 23.8% 12.3% 12.7% 24.9% 14.5% 81.4% 93.5%
Reported 14 25 159 1,165 243 726 349 115 3,514 1,060 101 93
Cleared 11 22 87 711 74 71 70 20 1,034 132 89 88
% Clear 78.6% 88.0% 54.7% 61.0% 30.5% 9.8% 20.1% 17.4% 29.4% 12.5% 88.1% 94.6%
Reported 3 3 90 662 112 468 125 61 1,999 664 50 90
Cleared 1 0 51 429 34 51 24 7 561 52 41 86
% Clear 33.3% 0.0% 56.7% 64.8% 30.4% 10.9% 19.2% 11.5% 28.1% 7.8% 82.0% 95.6%
**Break and Enter includes Break and Enters of: Apartments, Houses, Business Premises, and Other*1st Degree, 2nd Degree, and Manslaughter
33 Division
22 Division
23 Division
31 Division
32 Division
22 2018 Annual Statistical Report
Breakdown of Reported Crime by Division
Mur
der*
Atte
mpt
ed M
urde
rSe
xual
Vio
latio
nA
ssau
lt
Rob
bery
Bre
ak a
nd E
nter
**M
otor
Veh
icle
The
ft
Thef
t Ove
r $50
00Th
eft U
nder
$50
00Fr
aud
Offe
nsiv
e W
eapo
nsC
rimin
al C
ode
Traf
fic
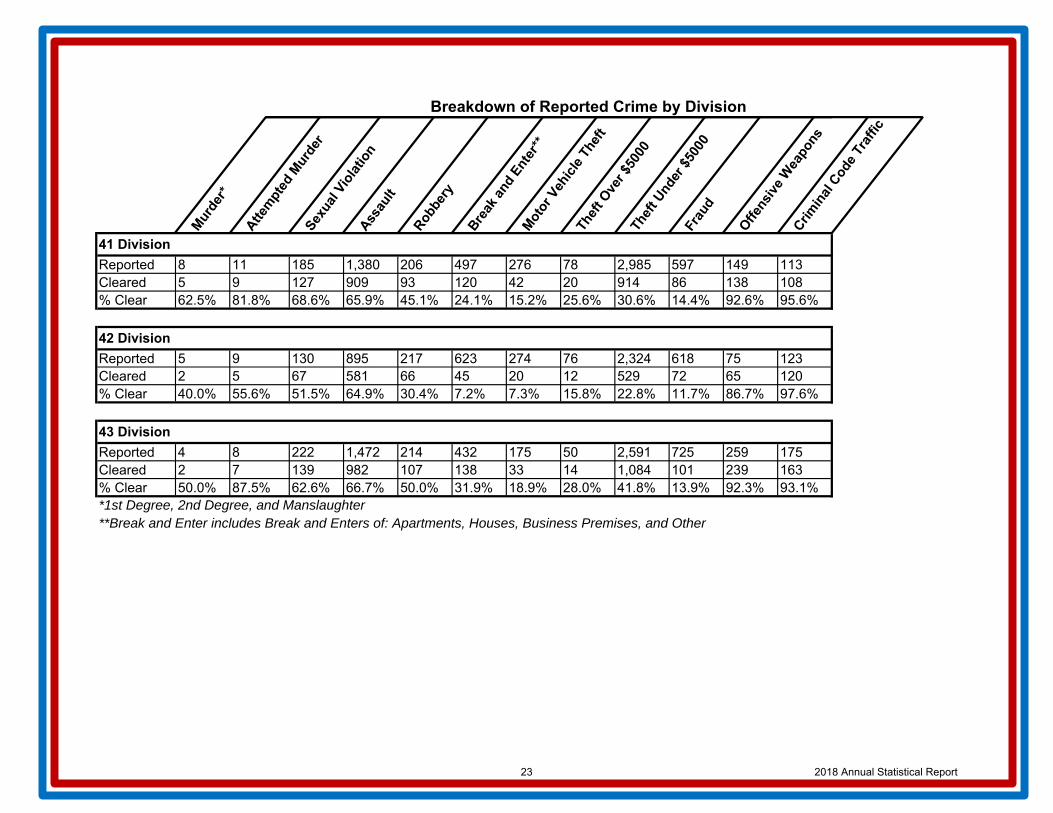
Reported 8 11 185 1,380 206 497 276 78 2,985 597 149 113Cleared 5 9 127 909 93 120 42 20 914 86 138 108% Clear 62.5% 81.8% 68.6% 65.9% 45.1% 24.1% 15.2% 25.6% 30.6% 14.4% 92.6% 95.6%
Reported 5 9 130 895 217 623 274 76 2,324 618 75 123Cleared 2 5 67 581 66 45 20 12 529 72 65 120% Clear 40.0% 55.6% 51.5% 64.9% 30.4% 7.2% 7.3% 15.8% 22.8% 11.7% 86.7% 97.6%
Reported 4 8 222 1,472 214 432 175 50 2,591 725 259 175Cleared 2 7 139 982 107 138 33 14 1,084 101 239 163% Clear 50.0% 87.5% 62.6% 66.7% 50.0% 31.9% 18.9% 28.0% 41.8% 13.9% 92.3% 93.1%
**Break and Enter includes Break and Enters of: Apartments, Houses, Business Premises, and Other
43 Division
41 Division
42 Division
*1st Degree, 2nd Degree, and Manslaughter
23 2018 Annual Statistical Report

Breakdown of Reported Crime by Division
Mur
der*
Atte
mpt
ed M
urde
rSe
xual
Vio
latio
nA
ssau
lt
Rob
bery
Bre
ak a
nd E
nter
**M
otor
Veh
icle
The
ft
Thef
t Ove
r $50
00Th
eft U
nder
$50
00Fr
aud
Offe
nsiv
e W
eapo
nsC
rimin
al C
ode
Traf
fic
Reported 8 16 250 1,743 392 546 153 110 7,239 999 210 70
Cleared 6 10 103 953 138 105 34 22 1,317 147 179 66
% Clear 75.0% 62.5% 41.2% 54.7% 35.2% 19.2% 22.2% 20.0% 18.2% 14.7% 85.2% 94.3%
Reported 4 6 196 1,442 203 492 81 111 6,184 1,162 164 68
Cleared 2 6 84 879 109 176 18 22 1,697 172 153 67
% Clear 50.0% 100.0% 42.9% 61.0% 53.7% 35.8% 22.2% 19.8% 27.4% 14.8% 93.3% 98.5%
Reported 2 1 109 695 122 513 151 89 3,393 730 61 58
Cleared 1 1 54 355 45 71 23 12 740 71 50 53
% Clear 50.0% 100.0% 49.5% 51.1% 36.9% 13.8% 15.2% 13.5% 21.8% 9.7% 82.0% 91.4%
Reported 6 21 114 825 116 228 84 30 1,466 386 58 77
Cleared 6 17 64 546 59 73 26 6 363 55 53 77
% Clear 100.0% 81.0% 56.1% 66.2% 50.9% 32.0% 31.0% 20.0% 24.8% 14.2% 91.4% 100.0%
Reported 3 2 93 679 126 322 106 47 3,286 359 83 43
Cleared 3 2 48 475 69 95 29 10 718 62 78 42
% Clear 100.0% 100.0% 51.6% 70.0% 54.8% 29.5% 27.4% 21.3% 21.9% 17.3% 94.0% 97.7%
**Break and Enter includes Break and Enters of: Apartments, Houses, Business Premises, and Other
*1st Degree, 2nd Degree, and Manslaughter
55 Division
51 Division
52 Division
53 Division
54 Division
24 2018 Annual Statistical Report
Persons Charged
25 2018 Annual Statistical Report

Age Males Females Total % Total
12-17 334 130 464 5.5%
18-24 1,334 315 1,649 19.7%
25-34 1,983 585 2,568 30.7%
35-44 1,538 352 1,890 22.6%
45+ 1,555 235 1,790 21.4%
Total 6,744 1,617 8,361 100.0%
Note: A person can be charged with multiple offences and may be included in more than one category.
Age Males Females Total % Total
12-17 63 3 66 7.8%
18-24 180 8 188 22.1%
25-34 226 5 231 27.2%
35-44 146 5 151 17.8%
45+ 210 4 214 25.2%
Total 825 25 850 100.0%
Note: A person can be charged with multiple offences and may be included in more than one category.
Age Males Females Total % Total
12-17 46 8 54 6.1%
18-24 115 13 128 14.5%
25-34 239 39 278 31.5%
35-44 190 35 225 25.5%
45+ 179 19 198 22.4%
Total 769 114 883 100.0%
Note: A person can be charged with multiple offences and may be included in more than one category.The information contained in these tables are based on the 'charged information year'.
Persons Charged by Accused Age and Gender
Break and Enter
Non-Sexual Assaults
Sexual Violations
0
50
100
150
200
250
300
12-17 18-24 25-34 35-44 45+
0
500
1,000
1,500
2,000
2,500
3,000
12-17 18-24 25-34 35-44 45+
0
50
100
150
200
250
12-17 18-24 25-34 35-44 45+
26 2018 Annual Statistical Report
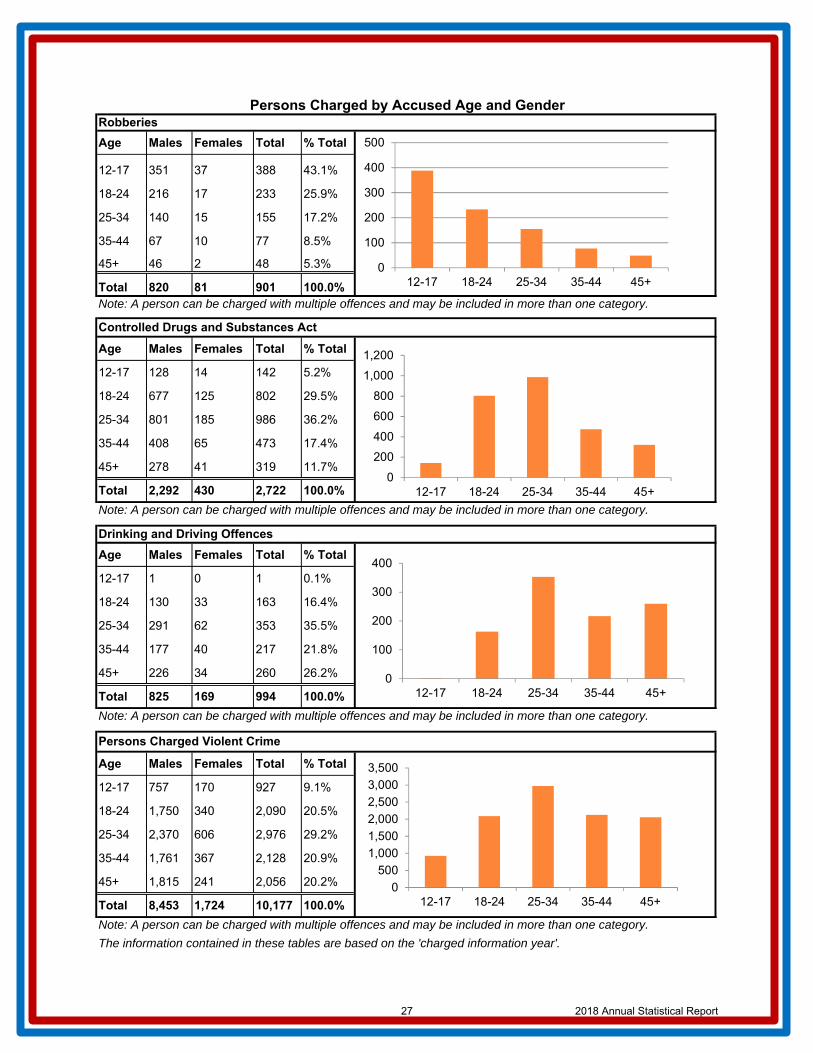
Age Males Females Total % Total
12-17 351 37 388 43.1%
18-24 216 17 233 25.9%
25-34 140 15 155 17.2%
35-44 67 10 77 8.5%
45+ 46 2 48 5.3%
Total 820 81 901 100.0%Note: A person can be charged with multiple offences and may be included in more than one category.
Age Males Females Total % Total
12-17 128 14 142 5.2%
18-24 677 125 802 29.5%
25-34 801 185 986 36.2%
35-44 408 65 473 17.4%
45+ 278 41 319 11.7%
Total 2,292 430 2,722 100.0%
Note: A person can be charged with multiple offences and may be included in more than one category.
Age Males Females Total % Total
12-17 1 0 1 0.1%
18-24 130 33 163 16.4%
25-34 291 62 353 35.5%
35-44 177 40 217 21.8%
45+ 226 34 260 26.2%
Total 825 169 994 100.0%
Note: A person can be charged with multiple offences and may be included in more than one category.
Age Males Females Total % Total
12-17 757 170 927 9.1%
18-24 1,750 340 2,090 20.5%
25-34 2,370 606 2,976 29.2%
35-44 1,761 367 2,128 20.9%
45+ 1,815 241 2,056 20.2%
Total 8,453 1,724 10,177 100.0%
Note: A person can be charged with multiple offences and may be included in more than one category.
The information contained in these tables are based on the 'charged information year'.
Persons Charged Violent Crime
Persons Charged by Accused Age and GenderRobberies
Controlled Drugs and Substances Act
Drinking and Driving Offences
0
100
200
300
400
500
12-17 18-24 25-34 35-44 45+
0
200
400
600
800
1,000
1,200
12-17 18-24 25-34 35-44 45+
0
100
200
300
400
12-17 18-24 25-34 35-44 45+
0
500
1,000
1,500
2,000
2,500
3,000
3,500
12-17 18-24 25-34 35-44 45+
27 2018 Annual Statistical Report
Persons Charged by Accused Age and Gender
Mur
der*
Atte
mpe
d M
urde
rSex
ual V
iola
tion
Ass
ault
Oth
erR
obbe
ryB
reak
& E
nter
Thef
t Ove
r $50
00Th
eft U
nder
$50
00Fr
aud
Offe
nsiv
e W
eapo
ns
Oth
er C
rimin
al C
ode
Crim
inal
Cod
e Tr
affic
C.D
.S.A
.Fe
dera
l Oth
er
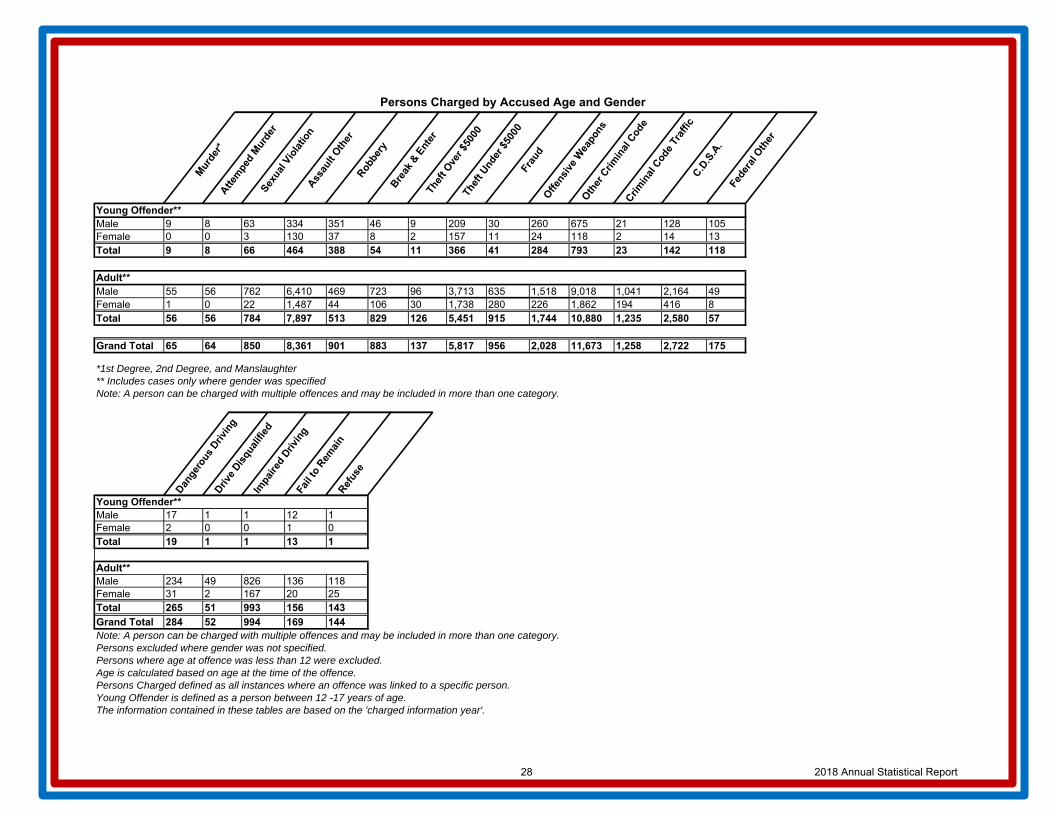
Male 9 8 63 334 351 46 9 209 30 260 675 21 128 105Female 0 0 3 130 37 8 2 157 11 24 118 2 14 13Total 9 8 66 464 388 54 11 366 41 284 793 23 142 118
Male 55 56 762 6,410 469 723 96 3,713 635 1,518 9,018 1,041 2,164 49Female 1 0 22 1,487 44 106 30 1,738 280 226 1,862 194 416 8Total 56 56 784 7,897 513 829 126 5,451 915 1,744 10,880 1,235 2,580 57
Grand Total 65 64 850 8,361 901 883 137 5,817 956 2,028 11,673 1,258 2,722 175
*1st Degree, 2nd Degree, and Manslaughter** Includes cases only where gender was specifiedNote: A person can be charged with multiple offences and may be included in more than one category.
Young Offender**
Adult**
Dan
gero
us D
rivin
gD
rive
Dis
qual
ified
Impa
ired
Driv
ing
Fail
to R
emai
nR
efus
e
Male 17 1 1 12 1Female 2 0 0 1 0Total 19 1 1 13 1
Male 234 49 826 136 118Female 31 2 167 20 25Total 265 51 993 156 143
Grand Total 284 52 994 169 144Note: A person can be charged with multiple offences and may be included in more than one category. Persons excluded where gender was not specified.Persons where age at offence was less than 12 were excluded.Age is calculated based on age at the time of the offence.Persons Charged defined as all instances where an offence was linked to a specific person.Young Offender is defined as a person between 12 -17 years of age.The information contained in these tables are based on the 'charged information year'.
Young Offender**
Adult**
28 2018 Annual Statistical Report

Persons Charged by Division
Murd
er*
Attem
pted M
urder
Sexual
Vio
latio
nAss
ault
Other
Robbery
Break
and E
nter
Theft O
ver $
5000
Theft U
nder $
5000
Fraud
Offensi
ve W
eapons
Other
Crim
inal
Code
Crimin
al C
ode Tra
ffic
C.D.S
.A.
Other
Fed
eral
Sta
tute
s
D13 1 3 31 298 20 24 5 118 40 48 358 65 125 4D32 3 4 60 703 12 36 11 546 72 103 686 80 49 10D33 1 4 9 121 45 36 5 148 28 56 183 18 74 5D41 5 4 83 701 88 91 11 420 52 145 890 63 80 9D42 2 4 32 467 36 37 6 165 42 77 366 82 49 5D43 3 4 73 801 62 87 6 544 76 246 1,284 115 217 32D53 1 1 43 223 15 18 5 349 34 37 334 28 36 4D54/D55 10 2 52 766 64 92 7 465 56 159 899 77 230 16
D11 5 3 41 555 27 67 7 470 50 93 830 58 132 7D12 3 2 19 326 22 34 1 192 54 91 490 59 132 13D14 5 6 59 609 49 97 16 406 69 105 929 49 213 8D22 6 0 19 207 40 61 10 187 51 49 398 28 70 4D23 7 7 47 453 38 29 6 134 45 73 396 51 87 14D31 2 8 56 583 86 45 6 227 41 142 607 89 141 8D51 7 6 50 662 62 56 7 571 78 173 1,116 36 336 14D52 3 28 639 42 64 14 797 83 131 1,210 24 120 12
TSV 0 0 0 16 2 0 0 2 4 0 36 326 10 0Other Unit 0 3 148 231 191 9 14 76 81 300 661 10 621 10Grand Total 61 64 850 8,361 901 883 137 5,817 956 2,028 11,673 1,258 2,722 175
*1st Degree, 2nd Degree, and Manslaughter ** Includes only cases where gender was specifiedNote: A person can be charged with multiple offences and may be included in more than one category.Persons excluded where gender was not specified.Persons where age at offence was less than 12 were excluded.Age is calculated based on age at the time of the offence.
Age is calculated based on age at the time of the offence.
Persons Charged is defined as all instances where an offence was linked to a specific person.
West Field
East Field
Other**
29 2018 Annual Statistical Report
Victims of Crime
30 2018 Annual Statistical Report

Age Males Females Unknown Total % Total
1-11 394 272 0 666 3.7%
12-17 579 500 0 1,079 6.1%
18-24 1,287 1,419 0 2,706 15.2%
25-34 2,156 2,237 2 4,395 24.6%
35-44 1,577 1,572 0 3,149 17.7%
45+ 2,926 2,006 2 4,934 27.7%
Unknown 657 222 25 904 5.1%
Total 9,576 8,228 29 17,833 100.0%
Age Males Females Unknown Total % Total
1-11 76 190 1 267 9.7%
12-17 73 498 0 571 20.7%
18-24 56 656 0 712 25.8%
25-34 56 534 1 591 21.4%
35-44 35 238 0 273 9.9%
45+ 31 261 1 293 10.6%
Unknown 10 41 4 55 2.0%
Total 337 2,418 7 2,762 100.0%
Age Males Females Unknown Total % Total
1-11 4 4 0 8 0.2%
12-17 459 50 0 509 15.4%
18-24 745 195 1 941 28.4%
25-34 492 189 0 681 20.6%
35-44 255 118 0 373 11.3%
45+ 504 258 0 762 23.0%
Unknown 24 10 0 34 1.0%
Total 2,483 824 1 3,308 100.0%
Sexual Violations
Non-Sexual Assaults
Robberies
Offence Totals by Victim Age and Gender
0100200300400500600700800900
1,000
1-11 12-17 18-24 25-34 35-44 45+Unknown
0
1,000
2,000
3,000
4,000
5,000
6,000
1-11 12-17 18-24 25-34 35-44 45+Unknown
0
100
200
300
400
500
600
700
800
1-11 12-17 18-24 25-34 35-44 45+Unknown
31 2018 Annual Statistical Report
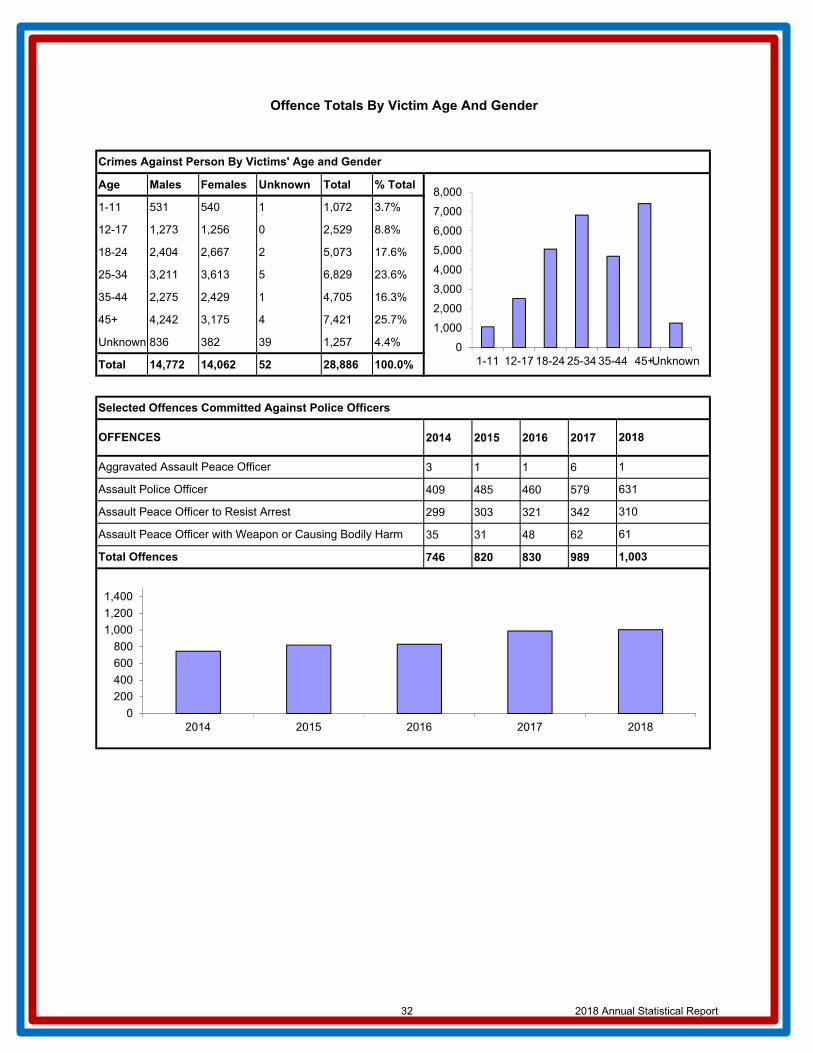
Age Males Females Unknown Total % Total
1-11 531 540 1 1,072 3.7%
12-17 1,273 1,256 0 2,529 8.8%
18-24 2,404 2,667 2 5,073 17.6%
25-34 3,211 3,613 5 6,829 23.6%
35-44 2,275 2,429 1 4,705 16.3%
45+ 4,242 3,175 4 7,421 25.7%
Unknown 836 382 39 1,257 4.4%
Total 14,772 14,062 52 28,886 100.0%
2014 2015 2016 2017
3 1 1 6
409 485 460 579
299 303 321 342
35 31 48 62
746 820 830 989 1,003
61
310
Offence Totals By Victim Age And Gender
Crimes Against Person By Victims' Age and Gender
Assault Peace Officer with Weapon or Causing Bodily Harm
2018
1
631
Selected Offences Committed Against Police Officers
Total Offences
OFFENCES
Aggravated Assault Peace Officer
Assault Police Officer
Assault Peace Officer to Resist Arrest
0
200
400
600
800
1,000
1,200
1,400
2014 2015 2016 2017 2018
0
1,000
2,000
3,000
4,000
5,000
6,000
7,000
8,000
1-11 12-17 18-24 25-34 35-44 45+Unknown
32 2018 Annual Statistical Report
Search of Persons
33 2018 Annual Statistical Report
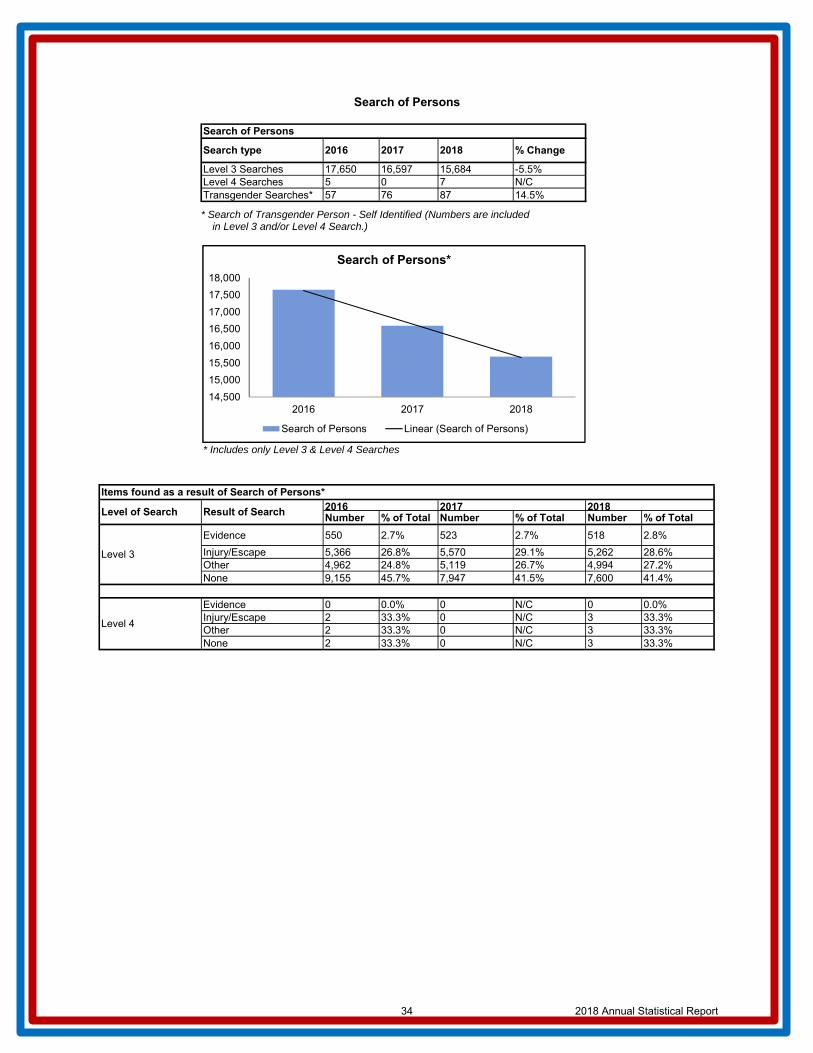
Level 3 Searches 17,650 16,597 15,684 -5.5%Level 4 Searches 5 0 7 N/CTransgender Searches* 57 76 87 14.5%
* Includes only Level 3 & Level 4 Searches
Number % of Total Number % of Total Number % of Total
Evidence 550 2.7% 523 2.7% 518 2.8%
Injury/Escape 5,366 26.8% 5,570 29.1% 5,262 28.6%Other 4,962 24.8% 5,119 26.7% 4,994 27.2%None 9,155 45.7% 7,947 41.5% 7,600 41.4%
Evidence 0 0.0% 0 N/C 0 0.0%Injury/Escape 2 33.3% 0 N/C 3 33.3%Other 2 33.3% 0 N/C 3 33.3%None 2 33.3% 0 N/C 3 33.3%
Level 4
Level 3
Items found as a result of Search of Persons*
2017 2018Level of Search Result of Search 2016
Search of Persons
% Change
Search of Persons
Search type 2016 2017 2018
* Search of Transgender Person - Self Identified (Numbers are includedin Level 3 and/or Level 4 Search.)
14,500
15,000
15,500
16,000
16,500
17,000
17,500
18,000
2016 2017 2018
Search of Persons*
Search of Persons Linear (Search of Persons)
34 2018 Annual Statistical Report
Firearms
35 2018 Annual Statistical Report
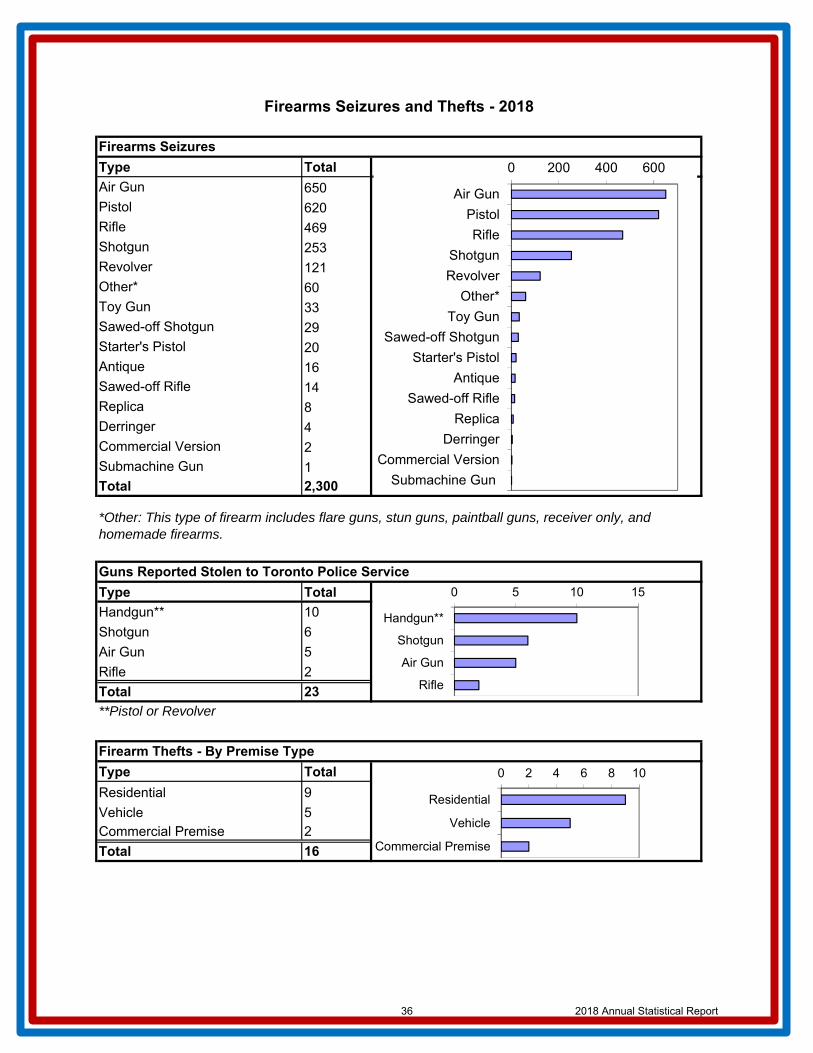
Type Total
Air Gun 650
Pistol 620
Rifle 469
Shotgun 253
Revolver 121
Other* 60
Toy Gun 33
Sawed-off Shotgun 29
Starter's Pistol 20
Antique 16
Sawed-off Rifle 14
Replica 8
Derringer 4
Commercial Version 2
Submachine Gun 1Total 2,300
Type Total
Handgun** 10
Shotgun 6
Air Gun 5
Rifle 2
Total 23
Type Total
Residential 9
Vehicle 5Commercial Premise 2
Total 16
Firearm Thefts - By Premise Type
Guns Reported Stolen to Toronto Police Service
*Other: This type of firearm includes flare guns, stun guns, paintball guns, receiver only, andhomemade firearms.
Firearms Seizures and Thefts - 2018
Firearms Seizures
**Pistol or Revolver
0 5 10 15
Handgun**
Shotgun
Air Gun
Rifle
0 200 400 600
Air Gun
Pistol
Rifle
Shotgun
Revolver
Other*
Toy Gun
Sawed-off Shotgun
Starter's Pistol
Antique
Sawed-off Rifle
Replica
Derringer
Commercial Version
Submachine Gun
0 2 4 6 8 10
Residential
Vehicle
Commercial Premise
36 2018 Annual Statistical Report
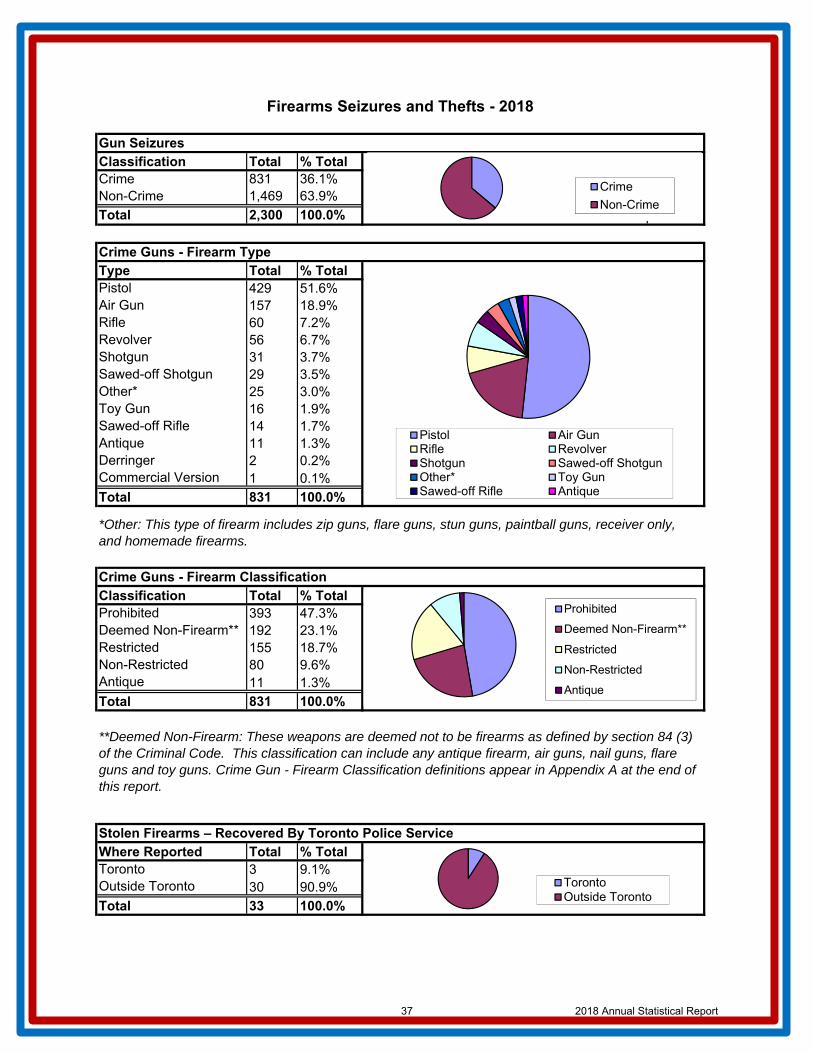
Classification Total % TotalCrime 831 36.1%Non-Crime 1,469 63.9%
Total 2,300 100.0%
Type Total % TotalPistol 429 51.6%Air Gun 157 18.9%Rifle 60 7.2%Revolver 56 6.7%Shotgun 31 3.7%Sawed-off Shotgun 29 3.5%Other* 25 3.0%Toy Gun 16 1.9%Sawed-off Rifle 14 1.7%Antique 11 1.3%Derringer 2 0.2%Commercial Version 1 0.1%
Total 831 100.0%
Classification Total % TotalProhibited 393 47.3%Deemed Non-Firearm** 192 23.1%Restricted 155 18.7%Non-Restricted 80 9.6%Antique 11 1.3%
Total 831 100.0%
Where Reported Total % TotalToronto 3 9.1%Outside Toronto 30 90.9%
Total 33 100.0%
Crime Guns - Firearm Type
Gun Seizures
Stolen Firearms – Recovered By Toronto Police Service
Firearms Seizures and Thefts - 2018
Crime Guns - Firearm Classification
**Deemed Non-Firearm: These weapons are deemed not to be firearms as defined by section 84 (3) of the Criminal Code. This classification can include any antique firearm, air guns, nail guns, flare guns and toy guns. Crime Gun - Firearm Classification definitions appear in Appendix A at the end of this report.
*Other: This type of firearm includes zip guns, flare guns, stun guns, paintball guns, receiver only,and homemade firearms.
Pistol Air GunRifle RevolverShotgun Sawed-off ShotgunOther* Toy GunSawed-off Rifle Antique
Crime
Non-Crime
Prohibited
Deemed Non-Firearm**
Restricted
Non-Restricted
Antique
TorontoOutside Toronto
37 2018 Annual Statistical Report

*Includes pistols and revolvers
**Includes rifles, shotguns, sawed-off shotguns and sawed-off rifles
Shotgun Pistol Revolver
12 GA X 3" 9MM LUGER 357 MAG
12 GA 40 S&W 38 SPL
12 GA X 2 ¾" 45 AUTO 22 LR
410 GA 22 LR 32 S&W / 44 MAG / 44 Percussion
12 GA X 3 ½" 9MM 22 SHORT
Type Total
Pistol 21
Rifle 6
Revolver 5
Shotgun 1
Total 33
Ruger
Colt
Polymer 80
Taurus Simonov
Mossberg
Winchester
Firearms Seizures and Thefts - 2018
Top 5 Calibres by Firearm Type
Top 10 Manufacturers by Firearm Type
Handguns* Long guns**
Glock
Sig Sauer
Browning
Beretta / Iver Johnson / Kel Tec
Springfield Armory / Walther
Remington
RugerSmith & Wesson
Rifle
Types of Firearms Stolen and Recovered in Toronto
7.62X39 RUSSIAN
22 LR
308 WIN / 5.56MM NATO
17 HMR
9MM LUGER
0 5 10 15 20 25
Pistol
Rifle
Revolver
Shotgun
38 2018 Annual Statistical Report
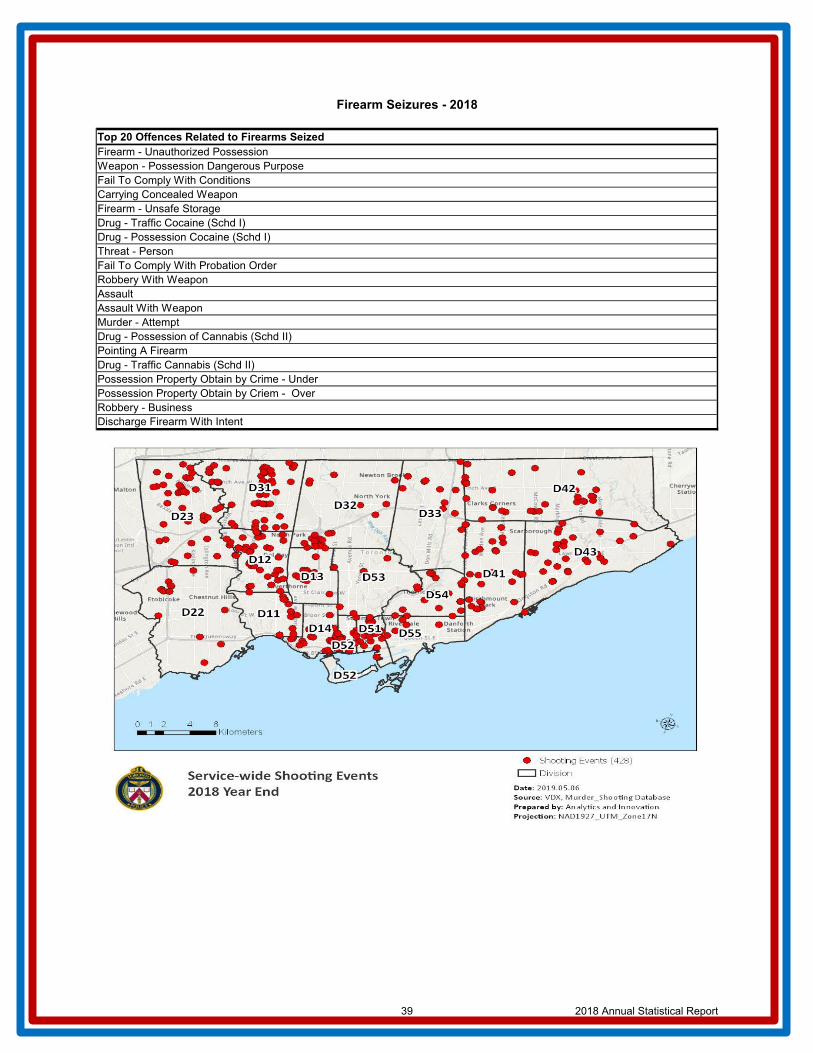
Firearm Seizures - 2018
Top 20 Offences Related to Firearms SeizedFirearm - Unauthorized PossessionWeapon - Possession Dangerous PurposeFail To Comply With ConditionsCarrying Concealed WeaponFirearm - Unsafe StorageDrug - Traffic Cocaine (Schd I)Drug - Possession Cocaine (Schd I)Threat - PersonFail To Comply With Probation OrderRobbery With WeaponAssaultAssault With WeaponMurder - AttemptDrug - Possession of Cannabis (Schd II)Pointing A FirearmDrug - Traffic Cannabis (Schd II)Possession Property Obtain by Crime - UnderPossession Property Obtain by Criem - OverRobbery - BusinessDischarge Firearm With Intent
39 2018 Annual Statistical Report
Traffic
40 2018 Annual Statistical Report

Year Total % Change2014 75,156 -2015 77,539 3.2%2016 73,416 -5.3%2017 74,712 1.8%2018 79,765 6.8%
Year Collisions % Change2014 51 -2015 65 27.5%2016 78 20.0%2017 63 -19.2%2018 66 4.8%
Year Collisions % Change2014 7,542 -2015 8,149 8.0%2016 11,181 37.2%2017 11,361 1.6%2018 10,306 -9.3%
Year Collisions % Change2014 11,132 -2015 11,660 4.7%2016 12,236 4.9%2017 12,590 2.9%2018 12,390 -1.6%*Personal Injuary (PI) & Property Damage together included in this category of collisions
Year Collisions % Change2014 56,431 -2015 57,665 2.2%2016 49,922 -13.4%2017 50,699 1.6%2018 57,003 12.4%*Property damage collisions include reportable & non-reportable collisions
Traffic Collisions and Offences
Property Damage Collisions*
Injury Collisions
Fatal Collisions and Persons Killed
Total Collisions
Fail to Remain - Injury & Property Damage Collisions*
0255075
2014 2015 2016 2017 2018
0
5,000
10,000
15,000
2014 2015 2016 2017 2018
0
20,000
40,000
60,000
2014 2015 2016 2017 2018
60,000
80,000
2014 2015 2016 2017 2018
-5,000
5,000
15,000
2014 2015 2016 2017 2018
41 2018 Annual Statistical Report
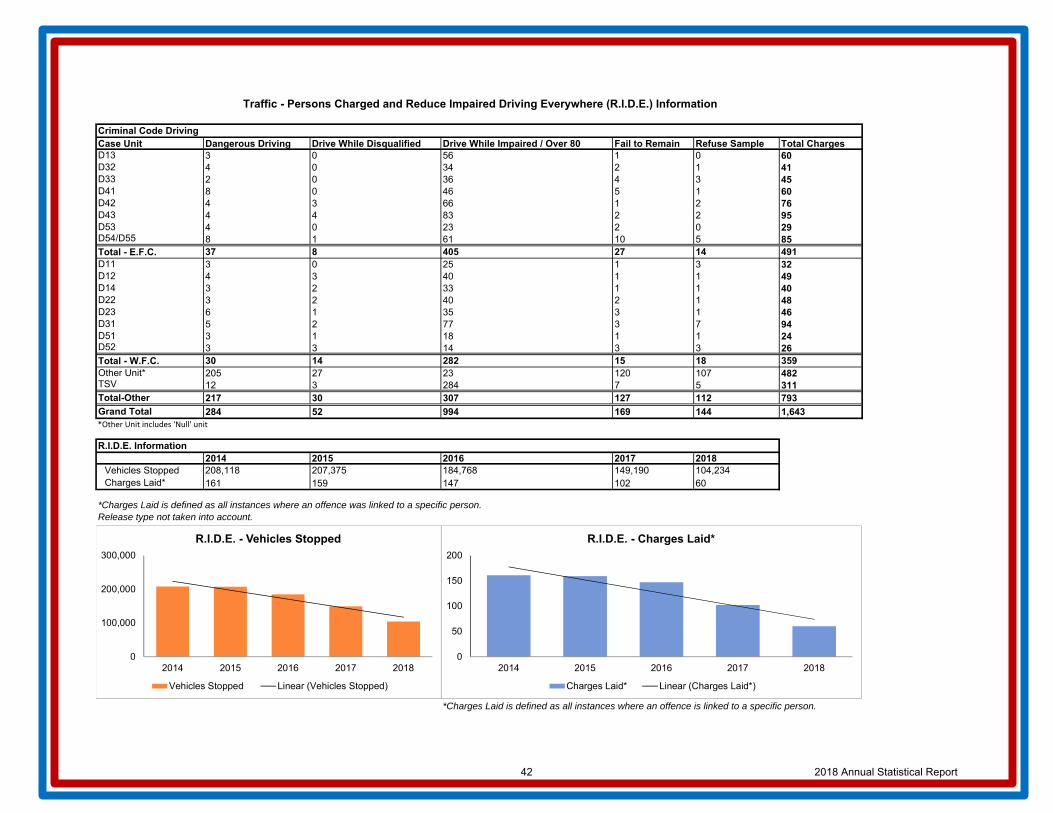
Case Unit Dangerous Driving Drive While Disqualified Drive While Impaired / Over 80 Fail to Remain Refuse Sample Total ChargesD13 3 0 56 1 0 60D32 4 0 34 2 1 41D33 2 0 36 4 3 45D41 8 0 46 5 1 60D42 4 3 66 1 2 76D43 4 4 83 2 2 95D53 4 0 23 2 0 29D54/D55 8 1 61 10 5 85Total - E.F.C. 37 8 405 27 14 491D11 3 0 25 1 3 32D12 4 3 40 1 1 49D14 3 2 33 1 1 40D22 3 2 40 2 1 48D23 6 1 35 3 1 46D31 5 2 77 3 7 94D51 3 1 18 1 1 24D52 3 3 14 3 3 26Total - W.F.C. 30 14 282 15 18 359Other Unit* 205 27 23 120 107 482TSV 12 3 284 7 5 311Total-Other 217 30 307 127 112 793
Grand Total 284 52 994 169 144 1,643
2014 2015 2016 2017 2018Vehicles Stopped 208,118 207,375 184,768 149,190 104,234Charges Laid* 161 159 147 102 60
*Charges Laid is defined as all instances where an offence was linked to a specific person.Release type not taken into account.
*Charges Laid is defined as all instances where an offence is linked to a specific person.
R.I.D.E. Information
Criminal Code Driving
Traffic - Persons Charged and Reduce Impaired Driving Everywhere (R.I.D.E.) Information
*Other Unit includes 'Null' unit
0
100,000
200,000
300,000
2014 2015 2016 2017 2018
R.I.D.E. - Vehicles Stopped
Vehicles Stopped Linear (Vehicles Stopped)
0
50
100
150
200
2014 2015 2016 2017 2018
R.I.D.E. - Charges Laid*
Charges Laid* Linear (Charges Laid*)
42 2018 Annual Statistical Report
Personnel & Budget
43 2018 Annual Statistical Report
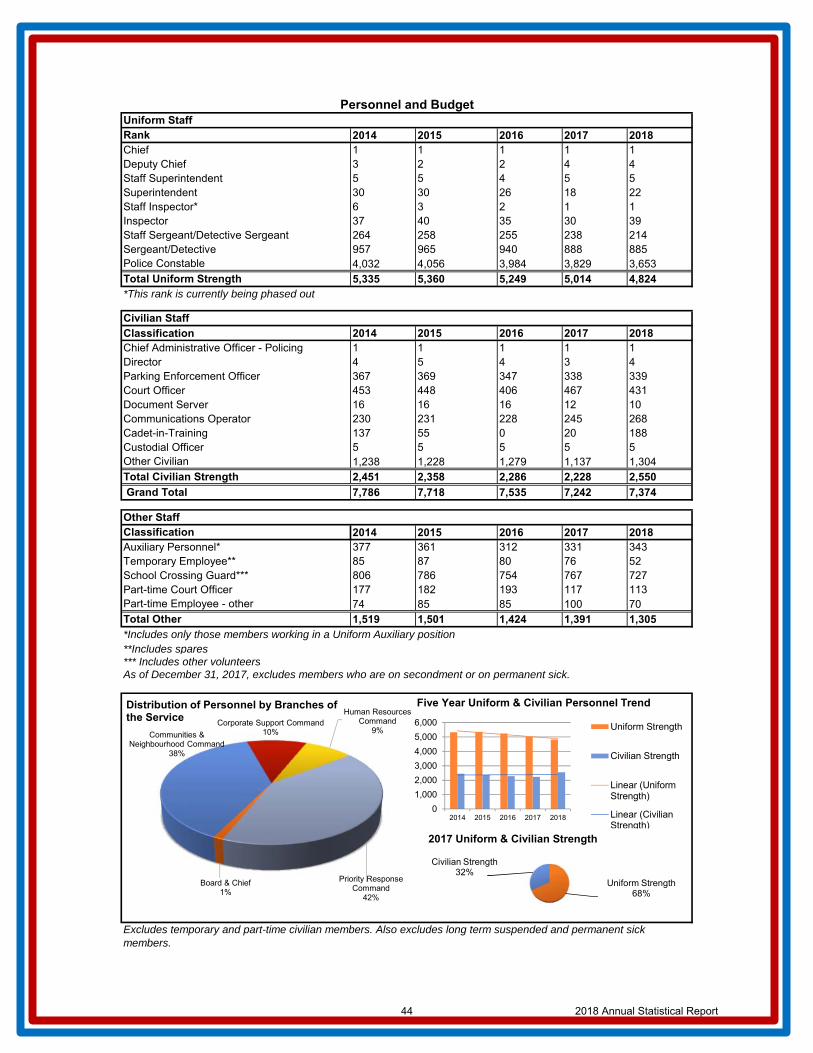
2014 2015 2016 2017 2018Chief 1 1 1 1 1Deputy Chief 3 2 2 4 4Staff Superintendent 5 5 4 5 5Superintendent 30 30 26 18 22Staff Inspector* 6 3 2 1 1Inspector 37 40 35 30 39Staff Sergeant/Detective Sergeant 264 258 255 238 214Sergeant/Detective 957 965 940 888 885Police Constable 4,032 4,056 3,984 3,829 3,653
5,335 5,360 5,249 5,014 4,824*This rank is currently being phased out
Classification 2014 2015 2016 2017 2018Chief Administrative Officer - Policing 1 1 1 1 1
4 5 4 3 4367 369 347 338 339453 448 406 467 431
Document Server 16 16 16 12 10Communications Operator 230 231 228 245 268Cadet-in-Training 137 55 0 20 188Custodial Officer 5 5 5 5 5Other Civilian 1,238 1,228 1,279 1,137 1,304
2,451 2,358 2,286 2,228 2,550
7,786 7,718 7,535 7,242 7,374
2014 2015 2016 2017 2018Auxiliary Personnel* 377 361 312 331 343Temporary Employee** 85 87 80 76 52School Crossing Guard*** 806 786 754 767 727Part-time Court Officer 177 182 193 117 113Part-time Employee - other 74 85 85 100 70
1,519 1,501 1,424 1,391 1,305
**Includes spares*** Includes other volunteersAs of December 31, 2017, excludes members who are on secondment or on permanent sick.
*Includes only those members working in a Uniform Auxiliary position
Excludes temporary and part-time civilian members. Also excludes long term suspended and permanent sick members.
Other Staff
Total Other
DirectorParking Enforcement Officer
Classification
Court Officer
Total Civilian Strength
Grand Total
Personnel and BudgetUniform Staff
Civilian Staff
Rank
Total Uniform Strength
0
1,000
2,000
3,000
4,000
5,000
6,000
2014 2015 2016 2017 2018
Uniform Strength
Civilian Strength
Linear (UniformStrength)
Linear (CivilianStrength)
Uniform Strength68%
Civilian Strength32%
2017 Uniform & Civilian Strength
Five Year Uniform & Civilian Personnel Trend
Board & Chief1%
Communities & Neighbourhood Command
38%
Corporate Support Command10%
Human Resources Command
9%
Priority Response Command
42%
Distribution of Personnel by Branches of the Service
44 2018 Annual Statistical Report
Superintendent, S/Supertintendent & Deputy Chief
InspectorStaff/ Det. Sergeant
Sergeant/ Detective
ConstableUniform Strength
Civilian Strength*
Total Strength
School Crossing Guard
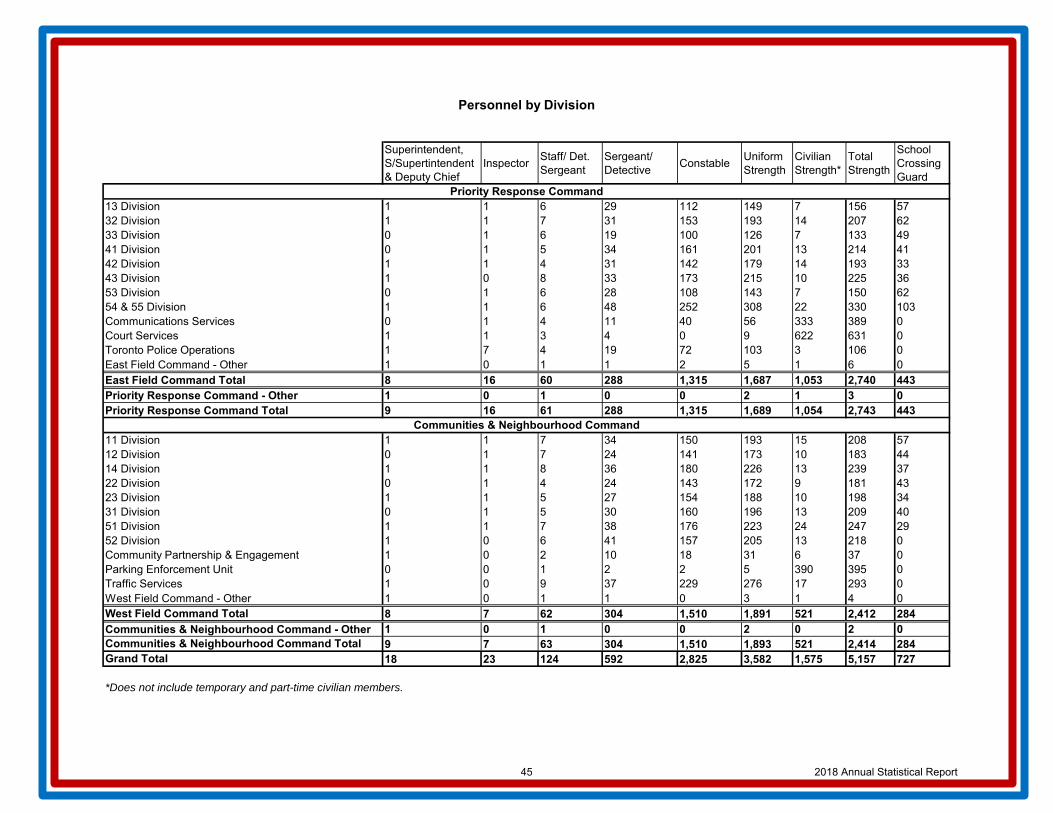
13 Division 1 1 6 29 112 149 7 156 5732 Division 1 1 7 31 153 193 14 207 6233 Division 0 1 6 19 100 126 7 133 4941 Division 0 1 5 34 161 201 13 214 4142 Division 1 1 4 31 142 179 14 193 3343 Division 1 0 8 33 173 215 10 225 3653 Division 0 1 6 28 108 143 7 150 6254 & 55 Division 1 1 6 48 252 308 22 330 103Communications Services 0 1 4 11 40 56 333 389 0Court Services 1 1 3 4 0 9 622 631 0Toronto Police Operations 1 7 4 19 72 103 3 106 0East Field Command - Other 1 0 1 1 2 5 1 6 0East Field Command Total 8 16 60 288 1,315 1,687 1,053 2,740 443Priority Response Command - Other 1 0 1 0 0 2 1 3 0Priority Response Command Total 9 16 61 288 1,315 1,689 1,054 2,743 443
11 Division 1 1 7 34 150 193 15 208 5712 Division 0 1 7 24 141 173 10 183 4414 Division 1 1 8 36 180 226 13 239 3722 Division 0 1 4 24 143 172 9 181 4323 Division 1 1 5 27 154 188 10 198 3431 Division 0 1 5 30 160 196 13 209 4051 Division 1 1 7 38 176 223 24 247 2952 Division 1 0 6 41 157 205 13 218 0Community Partnership & Engagement 1 0 2 10 18 31 6 37 0Parking Enforcement Unit 0 0 1 2 2 5 390 395 0Traffic Services 1 0 9 37 229 276 17 293 0West Field Command - Other 1 0 1 1 0 3 1 4 0West Field Command Total 8 7 62 304 1,510 1,891 521 2,412 284Communities & Neighbourhood Command - Other 1 0 1 0 0 2 0 2 0Communities & Neighbourhood Command Total 9 7 63 304 1,510 1,893 521 2,414 284Grand Total 18 23 124 592 2,825 3,582 1,575 5,157 727
*Does not include temporary and part-time civilian members.
Communities & Neighbourhood Command
Priority Response Command
Personnel by Division
45 2018 Annual Statistical Report

2014 2015 2016 2017 2018 Year Budget ($) Change ($) % ChangePopulation Served 2,873,017 2,879,019 2,731,571 2,882,102 2,932,944 2014 1,086,001,700 − −
5,335 5,360 5,249 5,014 4,824 2015 1,103,217,900 17,216,200 1.6%Uniform Strength:Population* 1:539 1:537 1:520 1:575 1:608 2016 1,131,884,200 28,666,300 2.6%Actual Expenditures 1,084,194,103 1,106,525,755 1,123,841,764 1,120,556,233 1,147,508,983 2017 1,128,616,900 -3,267,300 -0.3%Per Capita Cost 377.4 384.3 411.4 388.8 391.2 2018 1,136,826,700 8,209,800 0.7%*Estimate (based on projected population, except for 2016 which is based on the Census).
Units Population** Area (km²)Estimated Gross Expenditures($)
13 Division 138,322 18.6 21,832,61732 Division 274,154 60.7 27,032,39733 Division 207,149 52.5 20,772,92141 Division 185,637 43.9 28,213,12542 Division 273,016 84.4 26,940,69443 Division 215,018 59.0 31,387,61853 Division 203,414 31.4 21,654,24054 & 55 Division 257,823 37.7 45,918,361East Field Total 1,754,533 388.2 223,751,973
11 Division 136,021 18.2 25,553,06512 Division 129,943 24.7 26,394,43914 Division 170,345 13.6 33,809,64422 Division 226,245 66.9 25,078,53923 Division 163,978 57.1 27,553,16931 Division 152,736 42.7 29,266,02351 Division 116,359 7.1 32,519,19152 Division 82,784 8.2 30,407,956West Field Total 1,178,411 238.5 230,582,026Field Totals 2,932,944 626.7 454,333,999**Estimate based on the 2016 Census**Percentages reflect the organizational structure approved on January 1, 2015
Budget
Percent of Gross Operating Budget by Distribution
Uniform Strength and Expenditures
Uniform Strength
Gross Expenditures
Gross Operating Budget
East Field
West Field
Salaries And Benefits88.3%
Services And Rent9.9%
Material1.6%
Equipment0.2%
Feature
Corporate Support10.2%
Human Resources
4.5%
Priority Response
37.3%
Communities & Neighbourhoods
29.6%
Specialized Operations
17.2%Chief1.2%
Appropriation**
46 2018 Annual Statistical Report

Calls for Service
47 2018 Annual Statistical Report

Unit Area (km²) Dispatched Calls
Year EmergencyNon-Emergency
Total
2014 1,075,770 850,420 1,926,190 13 Division 18.6 24,0312015 991,872 806,024 1,797,896 32 Division 60.7 36,5772016 962,722 843,538 1,806,260 33 Division 52.5 26,9922017 996,467 848,711 1,845,178 41 Division 43.9 37,2512018 1,094,182 838,363 1,932,545 42 Division 84.4 33,555
43 Division 59 38,80853 Division 31.4 27,39954 & 55 Division 37.7 56,300
Status 2014 2015 2016 2017 2018 East Field Total 388.2 280,913Valid Alarms 436 509 526 608 787False Alarms 23,914 22,653 21,538 18,120 11,629 11 Division 18.2 29,142Total 24,350 23,162 22,064 18,728 12,416 12 Division 24.7 25,286
14 Division 13.6 54,81022 Division 66.9 35,078
Language Line* 2014 2015 2016 2017 2018 23 Division 57.1 30,231Arabic 98 110 144 201 188 31 Division 42.7 30,878Chinese (1) 2,069 2,335 2,420 2,474 2,895 51 Division 7.1 50,566Croatian 12 5 11 7 8 52 Division 8.2 37,792Farsi (8) 165 149 165 214 216 West Field Total 238.5 293,783French (4) 171 212 265 276 336 Other Unit - 6,529German 7 5 13 10 4 Field Total 626.7 581,225Greek 25 58 46 79 57 PRIME - 81,478Hindi 12 34 38 57 40 Parking - 152,067Hungarian (10) 173 148 277 217 191 Service Total 626.7 814,770Italian 110 110 135 129 126Japanese 43 28 27 28 43Korean 175 174 233 194 190Polish 69 98 123 94 89Portuguese (6) 147 149 229 190 243Punjabi (7) 46 59 57 72 232Russian (5) 201 245 220 223 246Somali 30 39 70 106 87Spanish (2) 493 468 492 588 666Tamil (3) 235 308 278 343 394Turkish 39 42 43 32 64Urdu 19 17 20 31 51Vietnamese (9) 157 154 143 161 205Total 4,496 4,947 5,449 5,726 6,571
West Field
Communications
Top ten ranking shown in brackets.
AT&T Language Line Service (other than English)
Alarm Calls
East Field
Dispatched CallsCalls Received at Communications Centre
Dispatched Calls
802,158817,953848,716841,572814,770
*Numbers provided represent calls received at Communications via 9-1-1 or the non-emergency number that used Language Line Services.
2014 2015 2016 2017 2018% Dispatched 41.6% 45.5% 47.0% 45.6% 42.2%% Not Dispatched 58.4% 54.5% 53.0% 54.4% 57.8%
0.0%
10.0%
20.0%
30.0%
40.0%
50.0%
60.0%
70.0%
% o
f D
isp
atc
hed
vs
No
t D
isp
atc
he
d C
alls
1,700,000
1,750,000
1,800,000
1,850,000
1,900,000
1,950,000
2014 2015 2016 2017 2018
Calls For Service
Calls Received at Communications Centre
Linear (Calls Received at CommunicationsCentre)
Percent of Calls Dispatched vs Not Dispatched
48 2018 Annual Statistical Report
Public Complaints Filed with the O.I.P.R.D.
49 2018 Annual Statistical Report
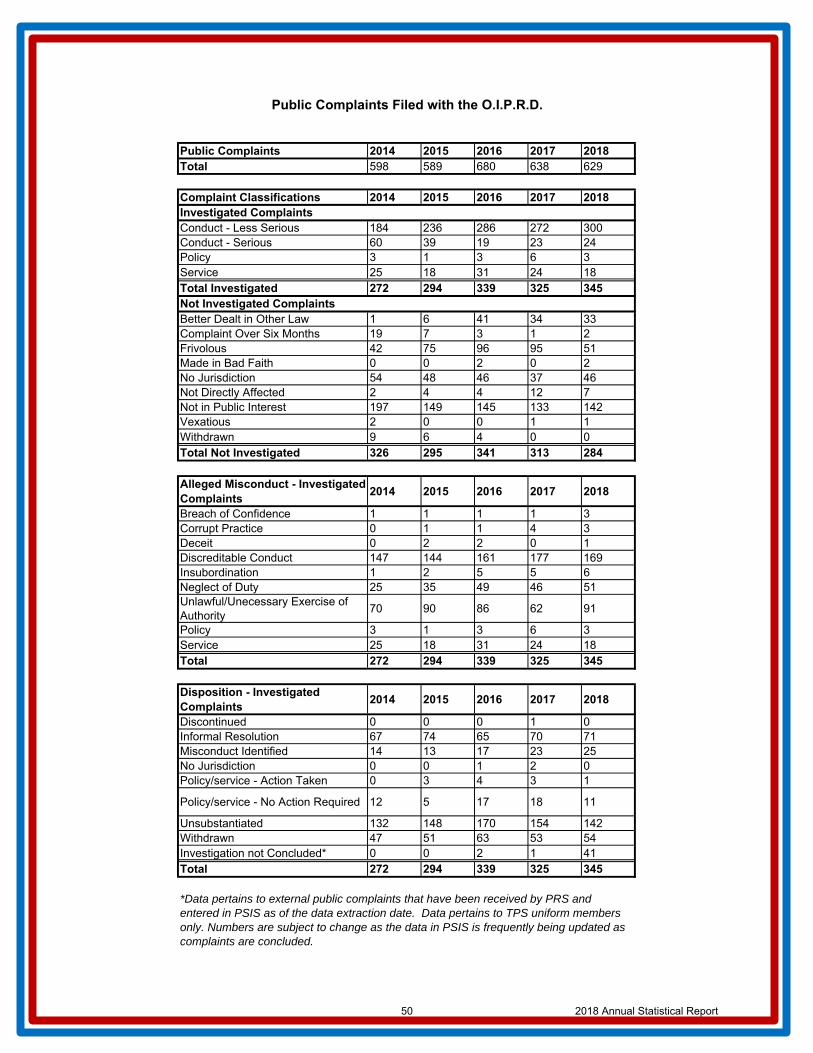
Public Complaints 2014 2015 2016 2017 2018Total 598 589 680 638 629
Complaint Classifications 2014 2015 2016 2017 2018
Conduct - Less Serious 184 236 286 272 300Conduct - Serious 60 39 19 23 24Policy 3 1 3 6 3Service 25 18 31 24 18Total Investigated 272 294 339 325 345
Better Dealt in Other Law 1 6 41 34 33Complaint Over Six Months 19 7 3 1 2Frivolous 42 75 96 95 51Made in Bad Faith 0 0 2 0 2No Jurisdiction 54 48 46 37 46Not Directly Affected 2 4 4 12 7Not in Public Interest 197 149 145 133 142Vexatious 2 0 0 1 1Withdrawn 9 6 4 0 0Total Not Investigated 326 295 341 313 284
Alleged Misconduct - Investigated Complaints
2014 2015 2016 2017 2018
Breach of Confidence 1 1 1 1 3Corrupt Practice 0 1 1 4 3Deceit 0 2 2 0 1Discreditable Conduct 147 144 161 177 169Insubordination 1 2 5 5 6Neglect of Duty 25 35 49 46 51Unlawful/Unecessary Exercise of Authority
70 90 86 62 91
Policy 3 1 3 6 3Service 25 18 31 24 18Total 272 294 339 325 345
Disposition - Investigated Complaints
2014 2015 2016 2017 2018
Discontinued 0 0 0 1 0Informal Resolution 67 74 65 70 71Misconduct Identified 14 13 17 23 25No Jurisdiction 0 0 1 2 0Policy/service - Action Taken 0 3 4 3 1
Policy/service - No Action Required 12 5 17 18 11
Unsubstantiated 132 148 170 154 142Withdrawn 47 51 63 53 54Investigation not Concluded* 0 0 2 1 41Total 272 294 339 325 345
Investigated Complaints
Not Investigated Complaints
Public Complaints Filed with the O.I.P.R.D.
*Data pertains to external public complaints that have been received by PRS and entered in PSIS as of the data extraction date. Data pertains to TPS uniform members only. Numbers are subject to change as the data in PSIS is frequently being updated as complaints are concluded.
50 2018 Annual Statistical Report

Regulated Interactions
51 2018 Annual Statistical Report
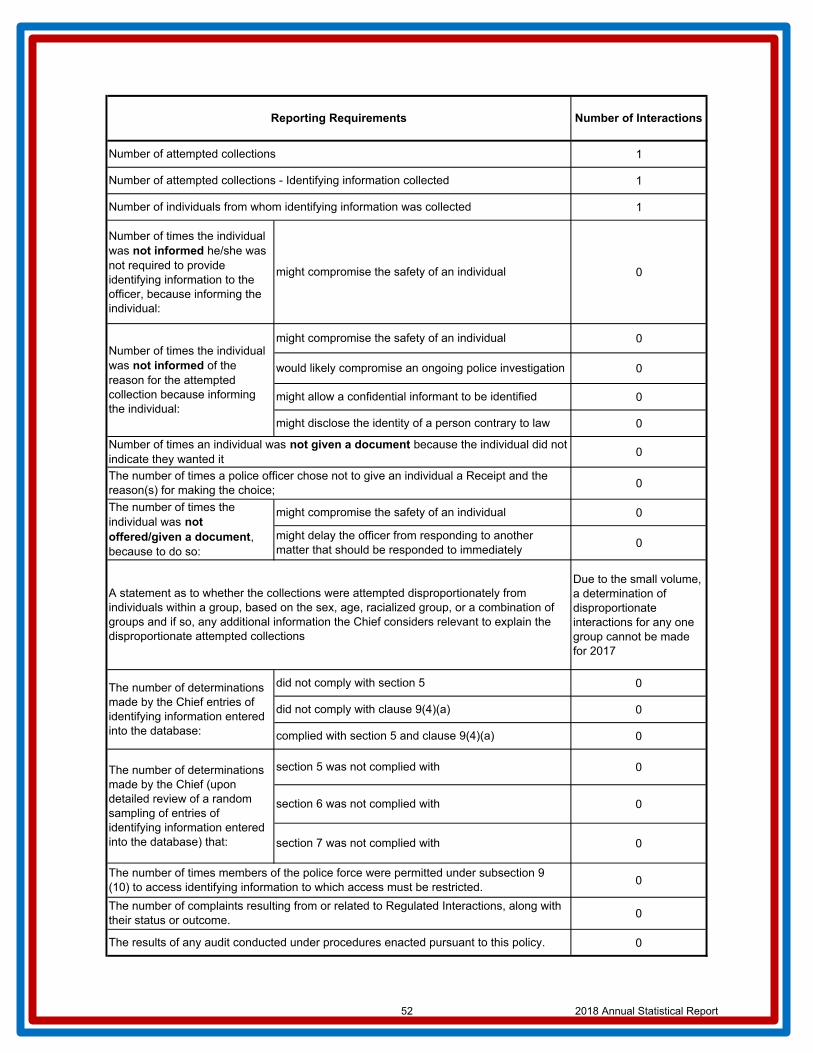
1
1
1
Number of times the individual was not informed he/she was not required to provide identifying information to the officer, because informing the individual:
0
0
0
0
0
0
0
0
0
Due to the small volume, a determination of disproportionate interactions for any one group cannot be made for 2017
0
0
0
0
0
0
0
0
0
The number of times members of the police force were permitted under subsection 9 (10) to access identifying information to which access must be restricted.
The number of complaints resulting from or related to Regulated Interactions, along with their status or outcome.
The results of any audit conducted under procedures enacted pursuant to this policy.
A statement as to whether the collections were attempted disproportionately from individuals within a group, based on the sex, age, racialized group, or a combination of groups and if so, any additional information the Chief considers relevant to explain the disproportionate attempted collections
The number of determinations made by the Chief entries of identifying information entered into the database:
did not comply with section 5
did not comply with clause 9(4)(a)
complied with section 5 and clause 9(4)(a)
The number of determinations made by the Chief (upon detailed review of a random sampling of entries of identifying information entered into the database) that:
section 5 was not complied with
section 6 was not complied with
section 7 was not complied with
Number of times an individual was not given a document because the individual did not indicate they wanted it
The number of times a police officer chose not to give an individual a Receipt and the reason(s) for making the choice;
The number of times the individual was not offered/given a document, because to do so:
might compromise the safety of an individual
might delay the officer from responding to another matter that should be responded to immediately
Reporting Requirements Number of Interactions
Number of attempted collections
Number of attempted collections - Identifying information collected
Number of individuals from whom identifying information was collected
might compromise the safety of an individual
Number of times the individual was not informed of the reason for the attempted collection because informing the individual:
might compromise the safety of an individual
would likely compromise an ongoing police investigation
might allow a confidential informant to be identified
might disclose the identity of a person contrary to law
52 2018 Annual Statistical Report

Number of Interaction
s
1000001000000000000000000001
1O'Connor-Parkview (54)
Gender
Age
Ethnicity
Interactions by Neighbourhood
AboriginalArab
Multiple Racialized PersonRacialized Person not included elsewhereSouth AsianSoutheast AsianWest AsianWhite
70 - 79 yrs
40 - 49 yrs
Reporting Requirements
The number of attempted collections from indivuduals, perceived by the officer to be:
MaleFemaleIndividuals who self-identify as transgender0-9 yrs10-19 yrs
FilipinoJapaneseKoreanLatin American
Black
20-29 yrs
50 - 59 yrs
Chinese
30 - 39 yrs
Demographics
80 - 89 yrs90 - 99 yrs100 yrs and above
60 - 69 yrs
53 2018 Annual Statistical Report

Administrative
54 2018 Annual Statistical Report

Events*
1,5069434,049671317402891,9041,226
192231,721
1119173824100
*Events attended. **Excludes family/relationship violence.***Events related to major cultural occasions planned, coordinated, assisted or attended.
2014 2015 2016 2017 2018Hours Volunteered 50,087 30,326 88,594 74,698 79,702
2014 2015 2016 2017 2018Total Incidents 8,527 8,668 7,718 7,889 7,808Telephone Assisted 20,222 19,719 20,279 20,184 19,847On Scene 3,997 4,045 3,704 3,921 3,727Domestic Related 5,823 5,756 4,970 4,886 4,673*Based on the fiscal reporting year (April 1 - March 31)
2014 2015 2016 2017 2018Labour disputes attended 12 18 12 7 15Potential dispute contacts 26 22 30 9 4
*In 2017, the reporting process was revised. The count for 2017 refers to partial year. As of 2018,count of events refer to only those responded to or attended by the Emergency Management &Public Order Unit.
Pride Toronto
Industrial Liason*
Volunteer Resources
Toronto Caribbean CarnivalOther cultural events
Victim Services*
Khalsa DayNational Aboriginal Day
Personal safety crime prevention lectures/presentations Lectures/presentations given regarding family/relationship violenceChild abuse/child protection lectures/presentations (includes internet safety)Elder abuse and senior safety lectures/presentations
Community Events***
Total number of lectures/presentations given on crime prevention topicsCrime Prevention Through Environmental Design (CPTED) and community safety
Divisional Community Police Liaison Committee MeetingsCMU Police Consultative Committee MeetingsCommunity meetings (excluding CPLC and CPCC)
Meetings
Lectures or Presentations
Black History MonthU.N.Day for the Elimination of Racial Discrimination
Administrative
Presentations to community members, organizations, agencies, or groupsPolice Officer lectures/presentations (platoons, divisions, or units)School lectures/presentations**
Community Partnerships & Engagement Unit
55 2018 Annual Statistical Report

Stats Canada Hate Crime
2014 2015 2016 2017 2018Arrests 95 105 121 126 83Charges Laid 306 434 364 463 261
Vehicles 2014 2015 2016 2017 2018Cars 1,470 1,477 1,474 1,343 1,387Support vehicles 127 127 124 151 137Motorcycles 40 40 40 40 40Other* 50 50 50 54 54Boats 24 24 24 24 19Total Vehicles 1,711 1,718 1,712 1,612 1,637Bicyles 376 376 376 376 420Horses 26 27 27 24 26
*Includes trailers and museum heritage vehicles
Fleet
Kilometres Driven by Toronto Police Fleet
Administrative
Crime Stoppers
36,979,880
37,594,869
38,032,080
31,611,892
29,213,575
2014
2015
2016
2017
2018
56 2018 Annual Statistical Report

Appendix A: Firearms Classification Definitions
Ammunition: a cartridge containing a projectile designed to be discharged from a firearm and, without restricting the generality of the foregoing, includes a caseless cartridge and a shot shell (Source: Criminal Code of Canada S.84)
Antique Firearm:
(a) any firearm manufactured before 1898 that was not designed to discharge rim-fire or centre-fire ammunition and that has not been re-designed to discharge such ammunition or
(b) any firearm that is prescribed to be an antique firearm.
(Source: Criminal Code of Canada S.84)
Automatic Firearm: a firearm that is capable of, or assembled or designed and manufactured with the capability of, discharging projectiles in rapid succession during one pressure of the trigger (Source: Criminal Code of Canada S.84)
Deemed Non-Firearm: firearms that do not fall within any of these other classes, including: pellet guns, BB guns, toy guns, and replica firearms (Source: Criminal Code of Canada S.84)
Handgun: a firearm that is designed, altered, or intended to be aimed and fired by the action of one hand, whether or not it has been redesigned or subsequently altered to be aimed and fired by the action of both hands (Source: Criminal Code of Canada S.84)
Imitation Firearm: anything that imitates a firearm, including a replica firearm
Non-Restricted: not a defined term in the Criminal Code, it covers all the guns not otherwise prohibited or restricted, including hunting and sporting guns (rifles and shotguns) (Source: Toronto Police Service Gun and Gang Unit)
Prescribed: prescribed by regulations (Source: Criminal Code of Canada S.84)
Prohibited Ammunition means ammunition, or a projectile of any kind, that is prescribed to be prohibited ammunition (Source: Criminal Code of Canada S.84).
57 2018 Annual Statistical Report

Appendix A: Firearms Classification Definitions
Prohibited Firearm
(a) a handgun that,
(i) has a barrel equal to or less than 105 mm (approx. 5 7/8") in length, or
(ii) is designed or adapted to discharge a 25 or 32 calibre cartridge, but does not include any such handgun that is prescribed, where the handgun is for use in international sporting competitions governed by the rules of the International Shooting Union,
(b) a firearm that is adapted from a rifle or shotgun, whether by sawing, cutting or any other alteration, and that, as so adapted,
(i) is less than 660 mm in length (26 inches), or
(ii) is 660 mm (26 inches) or greater in length and has a barrel less than 457 mm
(c) an automatic firearm, whether or not it has been altered to discharge only one projectile with one pressure of the trigger, or (d) any firearm that is prescribed to be a prohibited firearm by Parliament.
(Source: Criminal Code of Canada S.84). This classification would include but not be limited to sawed-off shotguns and fully automatic sub-machine guns.
Prohibited Weapon:
(a) a knife that has a blade that opens automatically by gravity or centrifugal force or by hand pressure applied to a button, spring or other device in or attached to the handle of the knife [flick knife or switchblade], or
(b) any weapon, other than a firearm, that is prescribed to be a prohibited weapon by Parliament;
The key prohibited weapons (this list is not exhaustive) are:
(1) Tear gas, mace, or other gas designed to injure, immobilize, or otherwise incapacitate a person; (2) Liquid, spray or powder or other substance capable of injuring, immobilizing, or otherwise incapacitating a person; (3) Nunchaku, Shuriken, Manrikigusari (these items are described in the regulations);
58 2018 Annual Statistical Report
Appendix A: Firearms Classification Definitions
(4) Finger ring (which is capable of projecting a blade);
(5) Cattle-prod or hand-held Taser;
(6) One-handed or short (under 500 mm) cross-bow (whether designed or modified); (7) Constant companion – blade concealed in belt buckle;
(8) Push dagger – blade is perpendicular to the handle [looks like an old fashioned corkscrew]; (9) “Knife comb” or similar device (under 30 cm);
(10) Spiked wristband;
(11) Blowgun;
(12) Spring-loaded Asp (telescoping baton);
(13) Morning Star: A spiked metal ball at the end of a stick;
(14) Brass knuckles (Source: Criminal Code of Canada S.84).
Replica Firearm: any device that is designed or intended to exactly resemble, or to resemble with near precision, a firearm, and that itself is not a firearm, but does not include any such device that is designed or intended to exactly resemble, or to resemble with near precision, an antique firearm.
Restricted Firearm:
(ii) has a barrel less than 470 mm (approx 18 1/2"), and
(iii) is capable of discharging centre-fire ammunition in a semi-automatic manner,
(b) a firearm that:
(i) is not a prohibited firearm,
(a) any handgun that is a not a prohibited firearm,
59 2018 Annual Statistical Report

Appendix A: Firearms Classification Definitions
(c) a firearm that is designed or adapted to be fired when reduced to a length of less than 660 mm by folding, telescoping, or otherwise, or
(d) a firearm of any other kind that is prescribed to be a restricted weapon.
This classification would include, but not be limited to, a Glock 22 pistol, Smith and
Unknown: through an exhaustive investigation and research the firearm cannot beidentified (Source: Toronto Police Service Gun and Gang Unit)
For the purposes of Sections 91 to 95, 99 to 101, 103 to 107 and 117.03 of theCriminal Code of Canada and the provisions of the Firearms Act, the followingweapons are deemed not to be firearms:
(ii) intended by the person in possession of it to be used exclusively for the purpose for which it is designed;
(ii) a shot, bullet, or other projectile that is designed or adapted to attain a velocity exceeding 152.4 m per second or an energy exceeding 5.7 joules.
(d) any other barrelled weapon, where it is proved that the weapon is not designed or adapted to discharge:
(i) a shot, bullet, or other projectile at a muzzle velocity exceeding 152.4 m per second or at a muzzle energy exceeding 5.7 Joules, or
(i) designed exclusively for signalling, for notifying of distress, for firing blank cartridges or for firing stud cartridges, explosive-driven rivets or other industrial projectiles, and
(c) any shooting device that is:
(i) designed exclusively for the slaughtering of domestic animals, the tranquillizing of animals or the discharging of projectiles with lines
(a) any antique firearm:
(ii) intended by the person in possession of it to be used exclusively for the purpose for which it is designed;
60 2018 Annual Statistical Report
Appendix A: Firearms Classification Definitions
Notwithstanding subsection (3), an antique firearm is a firearm for the purposes of regulations made under paragraph 117(h) of the Firearms Act and subsection 86(2) of this Act (Source: Criminal Code of Canada S.84)
61 2018 Annual Statistical Report