2018 - bonnier · norway’s cappelen damm, 50-percent owned by bonnier, had a weak year in the...
TRANSCRIPT

B O N N I E R S Å R S B E R ÄT T E L S E 2 0 1 7 12018BONNIER ANNUAL REPORT

2bonnier ab annual report 2018
Table of Contents
Board of Directors’ Report 3
Consolidated Income Statements 14
Consolidated Statements of Comprehensive Income 14
Consolidated Statements of Financial Position 15
Consolidated Statements of Changes in Equity 17
Consolidated Statements of Cash Flow 18
Notes to the Consolidated Financial Statements 19
The Parent Company’s Income Statements 48
The Parent Company’s Statements of Comprehensive Income 48
The Parent Company’s Balance Sheets 49
The Parent Company’s Statements of Changes in Equity 50
The Parent Company’s Statements of Cash Flow 50
Notes to the Parent Company’s Financial Statements 51
Auditor’s Report 61
Multi-year Summary 63
Translation from the Swedish original

3bonnier ab annual report 2018
Board of Directors’ ReportThe Board of Directors and the CEO of Bonnier AB, corporate registration no. 556508-3663, herewith submit the annual report and consolidated financial statements for the 2018 financial year on pages 3-60.
The Group’s business area and business modelBonnier AB is a parent company in a media group with companies in TV, daily newspapers, business media, magazines, film production, books, e-commerce and digital media and services. The group con-ducts operations in 12 countries with its base in the Nordic countries and significant operations in the United States, Germany, United Kingdom and Eastern Europe.
The Group’s revenue comes from two main categories: partly user revenue from consumers and B2B costumers in the form of subscriptions, occasional purchases and events, and partly adver-tising revenues, primarily from all digital media services, linear TV and print advertising.
The largest external supplier categories are within purchases of rights, printing, books and other goods for sale through e-commerce and IT.
OwnershipBonnier AB is a wholly-owned subsidiary of Bonnier Group AB (formerly Bonnier Holding AB), a subsidiary of Albert Bonnier AB, which is owned by more than 90 members of the Bonnier family.
Significant events during the financial year In 2018, Bonnier carried out in particular two changes of great impact to the business.
Agreement on the sale of Bonnier Broadcasting to Telia Company In June, it was announced that Bonnier AB had signed an agree-ment with Telia Company to divest Bonnier Broadcasting, includ-ing the television businesses TV4, C More and Finnish MTV. The deal is being reviewed by the European Competition Commission and is expected to be completed in the second half of 2019. The purchase price for a debt-free company has been agreed at SEK 9.2 billion.
The deal will strengthen Bonnier financially and will provide increased stability for Bonnier’s businesses and room for maneu-ver going forward. At the same time, the new owner of Bonnier Broadcasting will have very good conditions for its future develop-ment of TV4, MTV and C More.
New governance model and organizational structure In September, Bonnier announced a change in corporate gover-nance, in which the present business areas within Bonnier were to become independent companies. As of January 1, 2019, the governance of companies is primarily conducted through the Board of Directors for each company instead of through the Group company Bonnier AB. As a result, on January 1, 2019, the role of Group CEO was ended. Bonnier AB’s CEO, Tomas Franzén, will continue his commitment within Bonnier as board chairman for Adlibris, Bonnier News and Bonnier Broadcasting. Operationally, the organization of Bonnier AB is combined with Bonnier Group (formerly Bonnier Holding) into a smaller parent company. The CEO of Bonnier Group is Erik Haegerstrand.
During the fall of 2018, it was also decided that the business area Business to Business and the operations within Magazines & Brands (formerly Bonnier Tidskrifter) would become a part of Bonnier News as of January 1, 2019.
Development of the operations, financial position and profit or loss (Group)
SEK million (unless stated otherwise) 2018 2017 2016Net sales 26,447 25,740 25,492EBITA1) 824 625 731Operating profit/loss -225 -1,423 630 3)
Net financial items -157 -212 -239Profit/loss before tax -382 -1,635 391 3)
Profit/loss for the year -872 -2,239 276 3)
EBITA margin 3.1% 2.4% 2.9%Return on operating capital -1.9% -11.0% 4.8% 3)
Net debt at year end 7,743 8,553 7,376Net debt/equity, multiple 2.12 2.18 1.25 3)
Business areasNet sales per business areaSEK million 2018 2017 Change, %Books 2) 6,334 6,274 0.9%E-Commerce 2) 2,247 2,002 12.3%Broadcasting 8,253 7,497 10.1%Film Studios 2) 1,256 1,389 -9.6%Ventures 2) 358 402 -10.9%Magazines 3,060 3,455 -11.4%Business to Business 1,202 1,130 6.4%News 5,004 4,890 2.3%Other and eliminations -1,267 -1,299 n/aBonnier AB, total 26,447 25,740 2.7%
EBITA1) per business areaSEK million 2018 2017 Change Books 2) 154 74 80E-Commerce 2) -125 31 -157Broadcasting 1,027 423 604Film Studios 2) 17 -14 31Ventures 2) -18 -93 75Magazines 34 168 -134Business to Business 104 131 -28News 159 303 -144Other -528 -397 -130Bonnier AB, total 824 625 199
Books includes the Group’s book businesses. It includes Bonnier-förlagen, Pocket Shop, Bonnier Media Deutschland, Bonnier UK in England, Finnish WSOY, Akateeminen (Academic Bookstore) in Finland, 50% in Cappelen Damm in Norway and BookBeat. Books’ EBITA amounted to SEK 154 million (74) with a signifi-cant improvement in cash flow. The book publishing operations altogether had positive growth, driven both by physical and digital growth, although the physical book retailers, primarily in Finland and Norway, had a very weak year.
The group’s biggest book publishing business, Bonnier Media Deutschland, had an extremely strong year, with powerful growth and record profits. The Swedish publishing group Bonnierförla-gen had yet another stable year, with results comparable to the previous year’s. In the U.K., Bonnier Books UK led by new CEO Perminder Mann have come quite a ways in turning around the company, after a very weak 2017. In Finland, WSOY performed admirably with market improvement in profitability and after a number of tough years, had profits of SEK 23 million. However Norway’s Cappelen Damm, 50-percent owned by Bonnier, had a weak year in the shrinking Norwegian book market, with signifi-cant losses in the bookstore chain Tanum.
During the year, a number of smaller publishing and distribu-tion companies were divested, to make Books more profitable and increase focus on the publishers and on audio- and e-book service
1) A description of the Group’s definitions of key ratios may be found on page 59. 2) As of 2018, the Group has eight business areas, compared with six previously. E-Commerce, which includes the Adlibris Group, was formerly part of Books. The business area Ventures has changed its name from Growth Media, and Film Studios, which was previously part of Growth Media, is now, as of 2018, a separate business area. Operations have also been trans-ferred from Growth Media to Magazines. As a result, figures presented for comparison.3) Figures for 2016 were restated in 2017 due to a reevaluation of the Group’s accounting for intangible assets and inventory relating to development costs and publishing rights, and correction of errors.

4bonnier ab annual report 2018
BookBeat. During 2018, BookBeat showed a 150 percent increase in paid subscriptions, and at the end of the year was released in the German market.
E-Commerce is the business area that brings together Bonnier’s Nordic online retail investments. The business area includes Adlibris Group, one of the Nordic region’s leading online retail-ers with operations in Sweden, Norway and Finland. The Adlibris Group also has three physical shops, two in Stockholm and one in Gothenburg, under the concept Adlibris Market. Adlibris Group increased its revenues by 12 percent. The EBITA was SEK -125 (31), weighed down by large investments in warehousing and lo-gistics and weak sales in December. Adlibris expanded its product portfolio during the year, in areas such as toys, games, DIY and cooking supplies.
Broadcasting includes TV4 Group, C More, Nyhetsbolaget and MTV Media in Finland. Broadcasting increased profits by more than 140 percent, with EBITA profits of SEK 1.02 billion (423). Revenues grew by 10 percent, to SEK 8.25 billion. Swedish network TV4 had a record year and is now, with operating profits of SEK 1.38 billion (1.02) and an operating margin of 29.2 percent, one of Europe’s most profitable commercial TV companies. Through strong growth in the on-demand service TV4 Play, TV4 continues with its broad reach. Advertising revenues increased both for linear and digital TV, despite the downward market trend. Streaming-on-demand subscription service C More, with significant increases in its subscriber base and consumer revenues, had strong improve-ment in financial results compared to 2017: SEK -99 million (-296). Finland’s MTV has, after a number of years with a challeng-ing Finnish TV market, definitely broke the downward trend with financial results of SEK -211 million (-218).
Film Studios one of the world’s oldest film companies and celebrating its 100th anniversary in 2019, is the leading produc-tion and distribution company for film and TV series in the Nordic region. During 2018, it had a marked improvement in profitability with an EBITA of SEK 17 million (-14). The production business had strong growth with productions such as the feature films Britt-Marie Was Here and Lasse-Maja – the First Mystery, as well as the TV productions Alex, The Lawyer and The Hunters. As a step towards further strengthening the production of Nordic content, at the end of 2018 SF Studios bought one of Norway’s leading production companies, Paradox. Consumer services SF Anytime and SF Kids Play showed strong growth, with consumer revenues increasing by 154 percent during the year.
Ventures focuses on digital companies with global potential. Ventures’ portfolio had another strong year and now has an aver-age internal rate of return (IRR) of 30 percent since its start. In particular, shares in podcast platform Acast and VR gaming studio Resolution Games were particularly positive in terms of increase in value, and both closed out additional funding rounds during the year. Fertility app Natural Cycles took an important step in the U.S. market, getting approval as a form of birth control by the U.S. Food and Drug Administration (FDA).
New investments were made during the year in the virtual real estate agency Blok, design marketplace Pamono, digital funeral agency Lavendla and in Heja, a content and communication plat-form for sports clubs with a focus on the U.S. market. During the year, gaming company Evoke Gaming (wholly owned) and video network United Screens (minority owned) were divested, which contributed to a positive cash flow for the year for Ventures. EBITA was in total SEK 18 million (-93).
Magazines , which until the end of 2018 included the Swedish Bonnier Magazines & Brands (previously Bonnier Tidskrifter), the Copenhagen-based Bonnier Publications and Bonnier Corporation in the U.S., had an EBITA of SEK 34 million (168).
Bonnier Corporation started the year with a big reorganization and, despite the U.S. magazine industry’s rapidly diminishing print market, achieved a positive operating profit. Bonnier Corporation continued its diversification with businesses adjacent to its maga-zine titles. One example is Working Mother Media, which grew with its profitable consulting business for companies.
Bonnier Publications has a very strong and profitable cross-border model for titles such as Science Illustrated and History, and had EBITA margin of over 9 percent. A push for digital reader revenues has been launched, with Science Illustrated first out. The Norwegian subsidiary was shut down during the year and the Nor-wegian titles will be managed via Denmark from here on in.
Bonnier Magazines & Brands’ business in Sweden had big challenges, with a faster market downturn than expected and a transition to a new subscriber system that had a negative effect on the subscription business. During the fall, a decision was made to integrate Magazines & Brands with Bonnier News as of January 1, 2019. In conjunction with the integration, both the number of staff and the office space will be reduced, resulting in extra structural costs for 2018. This, together with structural costs for shutting down the Norwegian operations and moving offices in the U.S., affects the profits for the business area with additional costs of SEK 100 million.
Business to Business consists of Børsen, the leading business newspaper in Denmark, and business newspapers and digital B2B-services and products in the Nordic region, as well as in Central and Eastern Europe. Business to Business grew during the year propelled by increased digital revenues, with an EBITA of SEK 104 million (131), which corresponds to an EBITA margin of 9 percent.
Profits were affected by significant investments, including the continued growth of digital educational materials company Clio in the Swedish market and the rollout of the clinical decisionmaking tool Deximed in the German market. The business area’s single biggest business, Denmark’s leading business news daily, Børsen, had a stable year financially.
During the fall, a decision was made to integrate Business to Business with Bonnier News as of January 1, 2019. The reason-ing behind the integration is that by gathering all B2B businesses under one roof, greater resources can be mobilized for technology and product development, and therefore for growth.
News comprises the Group’s Swedish newspapers, including Dagens industri, Expressen, Dagens Nyheter and HD- Sydsvenskan, as well as Bonnier Business Media and daily press operations in Stockholm and Malmö. News had yet another year of revenue growth. The push for digital subscribers continued to give positive results, and the total number of digital subscribers amounted to 270,000 at the end of 2018. The digital growth re-sulted in an increase of total reader revenues, while total advertis-ing revenues decreased. In December, Expressen launched the Premium pay service, which is expected to further increase digital reader revenues for 2019.
The EBITA fell to SEK 159 million (303), a decrease due to increased paper costs, falling print advertising revenues as well as impairment in the printer operations, but even due to expensive initiatives within editorial content and channels, as well as in dis-tribution in the form of startup print distributors Nim in Southern Sweden and Premo in Stockholm.
From January 1, 2019, Magazines & Brands and Bonnier Busi-ness to Business were integrated with News, which now includes the vast majority of Bonnier’s journalism business in Sweden and Eastern Europe.
Other and eliminations consists of common Group activities and functions. The effect on EBITA from these activities was SEK -528 million (-397).
B O A R D O F D I R E C TO R S’ R E P O RT
5bonnier ab annual report 2018
1) Including non-controlling interests.
Sustainability Report
The Sustainability Report covers the Parent Company Bonnier AB and subsidiaries as specified in the Parent Company’s Note 25, Group Companies.
Bonnier’s work on sustainabilityBonnier has a history of over 200 years as a family-owned media company. Planning for the long-term is a core value and a starting point for how we run our businesses. It’s through this thinking over the long-term that we want to have a positive effect on those communities we operate in and contribute to a sustainable society. We want our communities to be more open, more interesting, more entertaining and more well informed.
As a part of society and as a company, Bonnier has a respon-sibility for the influence, negative and positive, that we have in the world. Our world has distinct challenges related to health, equality, climate change and much more, where the 17 Global Goals offer a way forward in terms of the three dimensions of sustainable development: economic, social and environmental. Bonnier has identified the following five areas that are especially central to our work with sustainability and long-term social benefit:
Freedom of Speech. Bonnier shall be Sweden’s leading force for wide-ranging freedom of expression and for free media. Freedom of speech and openness should even define our internal corporate culture.
Governance. As a family-owned media company, we are aware that our businesses are run in a sustainable fashion, with well-known ethical guidelines and a functioning warning system for when ethical guidelines are broken.
Our employees. To attract, develop and retain the right compe-tences is a deciding success factor. Creating environments where people can develop and successfully handle the push for change the media industry is experiencing are central challenges for our businesses.
Diversity. Our companies shall offer fair employment condi-tions regardless of sex or background, and our businesses should contribute to an inclusive society where more can take an active part.
Environment and Effective Use of Resources. Global and local challenges connected to the environment and the impact on the climate affect all companies. Even if Bonnier’s own environmental impact is limited and varies considerably given the broad portfolio of businesses, we shall work to minimize our direct impact on the climate and where relevant, in our value chain.
What we are doingBonnier AB historically has been a decentralized group. During 2017, work was begun on creating a common structure for efforts on sustainability. From 2018, the planning and implementation of an agenda for sustainability issues has been an integral part of the regular strategy work conducted by the business areas, with an an-nual review. Each business area has a contact person responsible for sustainability issues, who also sits in the respective executive management of the business, and in most businesses there is also a cross-functional group that is responsible for coordinating the sustainability efforts conducted in different areas of the respec-tive organizations. Central responsibility for sustainability issues during 2018 were under Bonnier AB’s Director of Communica-tions, reporting to the CEO. The direction of Bonnier’s work on sustainability, including the five central areas of focus, has been determined by group management.
Sustainability efforts have followed the general governance structure within Bonnier, with the business areas and companies having a strong local mandate to carry out the work. To manage the overall work, Bonnier AB has set up group-wide frameworks and policies. In some cases, these are directly applied, and in other
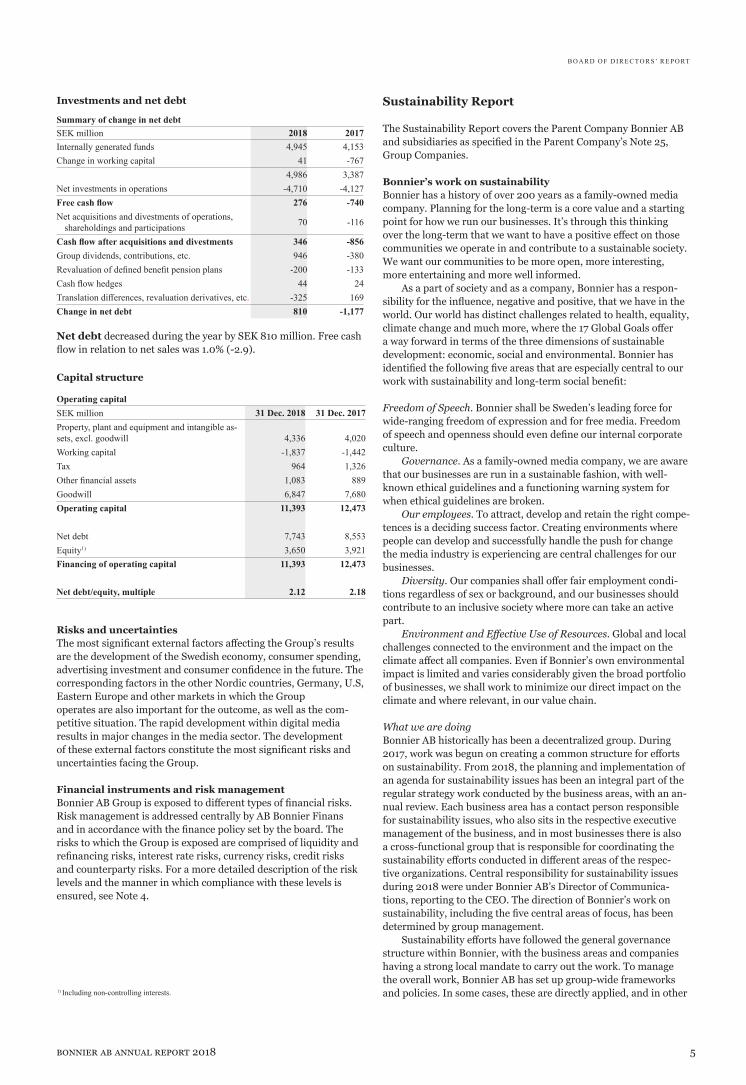
Investments and net debt
Summary of change in net debtSEK million 2018 2017Internally generated funds 4,945 4,153Change in working capital 41 -767
4,986 3,387Net investments in operations -4,710 -4,127Free cash flow 276 -740Net acquisitions and divestments of operations,
shareholdings and participations 70 -116
Cash flow after acquisitions and divestments 346 -856Group dividends, contributions, etc. 946 -380Revaluation of defined benefit pension plans -200 -133Cash flow hedges 44 24Translation differences, revaluation derivatives, etc. -325 169Change in net debt 810 -1,177
Net debt decreased during the year by SEK 810 million. Free cash flow in relation to net sales was 1.0% (-2.9).
Capital structure
Operating capitalSEK million 31 Dec. 2018 31 Dec. 2017Property, plant and equipment and intangible as-sets, excl. goodwill 4,336 4,020Working capital -1,837 -1,442Tax 964 1,326Other financial assets 1,083 889Goodwill 6,847 7,680Operating capital 11,393 12,473
Net debt 7,743 8,553Equity1) 3,650 3,921Financing of operating capital 11,393 12,473
Net debt/equity, multiple 2.12 2.18
Risks and uncertaintiesThe most significant external factors affecting the Group’s results are the development of the Swedish economy, consumer spending, advertising investment and consumer confidence in the future. The corresponding factors in the other Nordic countries, Germany, U.S, Eastern Europe and other markets in which the Group operates are also important for the outcome, as well as the com-petitive situation. The rapid development within digital media results in major changes in the media sector. The development of these external factors constitute the most significant risks and uncertainties facing the Group.
Financial instruments and risk managementBonnier AB Group is exposed to different types of financial risks. Risk management is addressed centrally by AB Bonnier Finans and in accordance with the finance policy set by the board. The risks to which the Group is exposed are comprised of liquidity and refinancing risks, interest rate risks, currency risks, credit risks and counterparty risks. For a more detailed description of the risk levels and the manner in which compliance with these levels is ensured, see Note 4.
B O A R D O F D I R E C TO R S’ R E P O RT
6bonnier ab annual report 2018
cases, the work must be adapted to the company’s own conditions within the given framework.
Work within the identified key areas is conducted within existing and functional contexts to the greatest possible extent; for example, work on HR is run within the HR Council and data pro-tection issues through Bonnier’s Data Protection Council, which comprises our companies’ personal data representatives.
From 2018 onwards, planning and implementing the sustain-ability agenda has been an integrated element in Bonnier’s recur-ring strategy work that is carried out in all business areas, with an annual review. Internal control in the form of monitoring risks associated with compliance and sustainability, among other things, is carried out annually and followed up by auditors and an audit committee.
In September 2018, a change in corporate governance was announced in which the business areas within Bonnier AB were to become independent companies. As of January 1, 2019, the governance of the companies is primarily conducted through the Board of Directors for each respective company instead of through the group company Bonnier.
This will also, from 2019, affect the sustainability work. For the fiscal year 2019, the intention is for our businesses to report their own respective work on sustainability issues, as we believe that this will mean both the work and the reporting will lie closer to the business and thus be of the greatest possible value.
Stakeholders Our primary stakeholders include shareholders, customers, em-ployees and suppliers. Given Bonnier’s broad customer base and the nature of our products, our social impact extends far beyond this.
During the year, Bonnier conducted informal stakeholder dialogues, in encounters with primary stakeholder groups, which also covered sustainability aspects. These discussions confirmed Bonnier’s initial analysis of which sustainability issues are crucial.
Based on, among other things, increased interest from readers and customers, a number of editorial efforts have been made in journalism related to sustainability issues, not least in the envi-ronmental and climate area, something which has been very well received by readers (see examples from News below). Bonnier News: Editorial efforts on sustainability in 2018 Within Bonnier News, the major titles have concentrated on sus-tainability issues in 2018.
Swedish morning news daily Dagens Nyheter has chosen climate and sustainability as one of the editorial side’s four priority areas under the heading “The World Is Changing” and has also launched new policies for travel and driving for its journalistic work, with among other things, fewer long journeys by air and a clearer focus on sustainability, climate change and more hybrid/electric vehicles in its car tests. In parallel, the launch of the “DN Train,” an initiative to offer DN’s readers the opportunity to travel to the Mediterranean by train, was a big success and the two trips planned for 2019 quickly became fully booked.
Swedish business daily Dagens industri launched the verti-cal “Sustainable Business” in the spring in collaboration with environmental trade title Aktuell Hållbarhet. The initiative spans everything from round-table discussions where top managers such as Ericsson’s Börje Ekholm and Volvo’s Martin Lundstedt discuss opportunities and challenges with sustainability issues in the busi-ness sector, to a unique sustainability ranking of listed companies that were presented at a profiled full-day conference.
During the year, Swedish afternoon news daily Expressen strengthened its investment in climate journalism with its own site “Climate.” The topic has also been placed at the heart of digital investments in TV and audio, where a profiled report on the impact of the climate crisis on the Arctic was Expressen’s first product where the reader can switch seamlessly between reading
and listening to a reading of the report. Climate journalism has its own section in the newspaper each day, and it will be highlighted in 2019 under an extensive collaboration with Unicef, through a series of reports focusing on how the world’s children are affected by climate change.
In August 2018, HD-Sydsvenskan presented a new climate journalism initiative by devoting a whole print paper to basically only climate- and environment-related material and has since con-tinued to focus on the subject and even on broader sustainability issues such as diversity and gender equality.
Freedom of speech
Ambition and relevance Our operations are to contribute to strengthening freedom of speech and freedom of the press, and towards a transparent, open and inclusive society in which public debate and culture are acces-sible to as many people as possible. Our ambition is to continue to be the Nordic company that is associated with free journalism more than any other.
Bonnier’s contribution to society in this area naturally lies at the heart of our operations; in the journalism, the storytelling and the knowledge services that our companies develop.
Independence is a key principle for Bonnier’s media. The most important safeguard for independent journalism in Bonnier’s me-dia is the guarantee derived from the clear line taken by the owners and the strong culture and tradition characterized by respect for editorial independence, the unimpeded power of our editorial executives on publishing decisions, and the value of wide-ranging freedom of speech. Our view of media ownership is described fur-ther in the owners’ vision for journalism, see page 6. In early 2019, Bonnier’s long-term commitment to journalism was manifested by an agreement to acquire MittMedia with its 28 local newspapers. The deal also received a predominantly positive response in the light of the trust that exists for Bonnier as a journalistic player in Sweden, and for Bonnier’s respect for editorial independence.
Risks and challengesThe crucial challenge in work to produce high-quality journal-ism that contributes towards an open and extremely transparent society is the market. On the advertising side, competition mainly comes from the global technology platforms that are seizing virtu-ally all growth in digital advertising worldwide, and, on the con-sumer side, by forceful competition on every front for consumers’ time and willingness to pay. We judge that for the vast majority of journalism products, succeeding in creating a willingness to pay for digital journalism products will be critical. Therefore, it is highly gratifying to see that Bonnier’s digital subscriptions within News experienced strong growth in 2018, which stood at 270,000 at the end of 2018, a figure which only a few years ago was at just a few tens of thousands.
Based on the central importance of digital subscriptions for both the journalistic products’ long-term viability and for our business, Bonnier has worked during 2018 towards changing the digital VAT on publishing products (currently 25%) to instead be the same as VAT on printed products (6%). A change that Bonnier, along with other industry representatives, has pushed publicly for during 2018, and which to all appearances looks to finally become reality in 2019.
Another challenge concerns increased threats against journal-ists, in the Swedish market described in a survey by Swedish in-dustry organization Utgivarna. Besides being an important health and safety issue, in the long run, this trend threatens freedom of speech, scrutiny and transparency.

7bonnier ab annual report 2018
How We Work Bonnier’s culture is imbued with protecting freedom of speech and respect for editorial independence. These principles are well known in our operations. Editorial independence is also high-lighted in the mutual examination of Bonnier-owned media by each other, and also by Bonnier AB as a parent company.
In the Swedish market in particular, Bonnier’s media thus reach a very large proportion of the population, not least through media with a broad audience such as TV4 and Expressen. Some measurements that illustrate this reach in 2018 include the follow-ing: • TV4 Play surpassed 4.7 million registered users during 2018. • Expressen can reach up to 8 million unique users (units) with more than 180 million page views in the space of a week. • The publishers within Bonnier Books sold more than 117 mil-lion books in 2018.
Vision for journalism“Bonnier protects freedom of speech, freedom of the press and the free flow of information. We stand for journalistic diversity and create opportunities for people to be heard. Readers, viewers and listeners are the clients of our media. Through journalism, storytelling and knowledge-sharing, we want to make the societies in the countries we work in more open, more interesting, more well-informed and more entertaining. Our informing public opinion must be free of ties to political par-ties, financial power spheres and other organised social interests, and the news we provide must be independent. A diversity of voices and perspectives should be heard in our media. We believe in professional journalism with the legal responsibility that entails; this is our cornerstone.
Bonnier’s businesses have always been driven by the market. Inde-pendence, high quality and longevity are predicated on commercial success and economic viability. The editorial content must also be independent from us, the own-ers. In our media, editorial executives own their journalism and editorial decisions. Editorial executives and managers are free to develop their media from their perspective of the traditions and missions of each respective media channel. We respect our businesses’ individual identities and guarantee their freedom and independence. Bonnier has a liberal tradition. But it’s liberal with a small “l,” without ties to a political party. This is characterised by a belief in the freedom of the individual, in free speech that is broadly and freely practised, and in an open society. Our media safeguard democracy, equality and fundamental human rights and freedoms.”
Carl-Johan Bonnier, Chairman of the Board Albert Bonnier AB, owner representative.
Threats to journalists In recent years we have seen a significant rise in the number of threats made to journalists and against journalism.
This has led to increasing investments in security by journal-ism operations. The investments made by Bonnier since 2015 have been many times higher than in the preceding years.
Investments in our employees’ safety are also an investment in the social function of investigative journalism. By ensuring a good level of safety, we make it easier for editorial teams to continue to carry out investigative journalism even in cases where this may
lead to violent reactions and to threats. Bonnier’s companies are responsible for their own work on safety and find forms of coop-eration as appropriate.
Bonnier also has a central coordinator for security issues who primarily works with Bonnier’s Swedish operations.
Highlighting and rewarding outstanding journalism Alongside the journalism work carried out in our operations, Bonnier supports a number of awards to highlight and reward out-standing journalism and initiatives for freedom of speech. These include:
Swedish Grand Prize for Journalism: Bonnier has run the Grand Prize for Journalism in Sweden since 1967. The prize is Sweden’s most important journalism award and the winners are selected by an independent jury comprising 12 prominent journal-ists from different parts of the media industry.
The Finnish Grand Prize for Journalism awarded by Bonnier since 2001.
The Bonnier Award in Estonia, given each year for outstand-ing investigative journalism.
Prix Voltaire, an international award to a person or organiza-tion that has particularly acted for free speech, backed by Albert Bonniers förlag, Bonnier Media Deutschland and a number of other publishers. Lobbying to promote freedom of speech and on behalf of impris-oned journalists. The leading media outlets at Bonnier are important voices on freedom of expression in public debate.
For example, Expressen in particular has worked consistently for many years to draw attention to abuse of freedom of speech and freedom of the press. This is particularly true in cases where Swedish citizens have been imprisoned for asserting and exercising freedom of speech. Two people whose cases are still sadly relevant are:
Dawit Isaak, Swedish-Eritrean journalist, and co-founder of Eritrea’s first independent magazine Setit, who in 2001 was jailed by the regime in Eritrea for alleged crimes against national security.
Gui Minhai, Swedish publisher of Chinese origin who was kidnapped in Thailand in 2016 and taken to a prison in China. In winter 2018-2019 his case has been in the news following investi-gations in the actions of the Swedish ambassador in Beijing.
Both Dawit Isaak and Gui Minhai are currently imprisoned. Expressen is constantly monitoring the cases of these political prisoners, following and helping to keep up pressure on the politi-cal process to secure their release. This touches on Bonnier’s core values, partly regarding personal rights, in this case the two im-prisoned individuals, partly regarding the principle commitment to freedom of expression and to ensure that the Swedish government does its utmost to preserve the rights of Swedish citizens, since their right to freedom of expression and physical freedom is being deeply violated.
Contemporary artBonnier AB’s parent company Bonnier Group AB (previously Bonnier Holding AB) founded Bonniers Konsthall as a space for Swedish and international contemporary art in central Stock-holm. Jeanette Bonnier, one of the most active owners from the Bonnier family, was a driving force behind the creation of this art venue. Every year Bonniers Konsthall showcases winners of the Maria Bonnier Dahlin Foundation grant for young Swedish artists, founded in memory of Jeanette Bonnier’s daughter. Stipend recipi-ents for 2018 were Liva Isakson Lundin and Linnéa Sjöberg.
Jeanette Bonnier herself died in 2016, and bequeathed funds that will safeguard Bonniers Konsthall’s continuous development, together with continued financing from Bonnier Group.

8bonnier ab annual report 2018
Swartling. The single most important change is that there is now an opportunity for reports to be made anonymously, and that there is also an opportunity to solely have one’s report received and dealt with by an external lawyer if the one reporting wishes. In parallel with the improvements to the system, Bonnier’s employees and managers were also given additional information about whistle-blowing.
Improving the whistleblowing service has resulted in greater awareness and a larger number of cases coming in during 2018.
Anti-corruptionBonnier’s internal regulations on corruption are set out in the Group’s anti-bribery policy. This lays down that all operations are to be conducted in compliance with applicable bribery legislation and in line with press ethics and good journalistic practice.
The main principle is that it is forbidden to directly or indirectly offer, promise, grant or authorize the giving of money or anything else of value to anyone in order to inappropriately influence the recipient or anyone else performing their duties at work or in order to obtain or retain an inappropriate commercial advantage. Giving gifts and entertaining must be characterized by moderation and restraint, and this is particularly relevant in rela-tion to representatives of the public sector.
Equivalent principles apply to receiving benefits. It is forbid-den for anyone acting on behalf of Bonnier to accept, accept a promise of or demand an inappropriate benefit in return for doing his or her job.
Suspected breaches of Bonnier’s policy are to be reported in line with the ordinary reporting procedure within the organization or through the Group’s whistleblowing channel. Implementation of and compliance with the anti-bribery policy is followed up in the Group’s annual risk survey.
Bonnier also expects suppliers to comply with applicable bribery legislation.
GDPRIn the beginning of 2018, extensive work was carried out to prepare Bonnier for the implementation of the EU’s General Data Protection Regulation (GDPR), which went into effect in May 2018. Handling customer data effectively in a manner that complies with the law is a central success factor for a media company. The customer’s trust depends on it.
Bonnier carefully follows the development of practice in this area, adjusting as necessary to developments from the relevant authorities (in Sweden, the Swedish Data Protection Authority), whose decisions and supervision result in evolving guidelines and practices.
Before the implementation of GDPR 2018, the majority of Bonnier employees in countries covered by the GDPR have com-pleted online training on the requirements of the legislation when handling personal data. Sales and acquisitions As part of our sales and acquisitions process, an assessment of risks associated with sustainability is to be routinely included, both in terms of product and market risks and internal/organizational risks. If, on an initial examination, there are judged to be signifi-cant risks or questions, in-depth due diligence is to be carried out regarding the material risks or questions identified.
When selling journalism operations, particular consideration is to be paid to whether the new owners can be considered to respect the principles of press independence that characterize Bonnier’s media. An example from 2018 is the agreement on the divestment of Bonnier Broadcasting to Telia Company, a process in which the importance of Bonnier Broadcasting’s journalistic independence was central, and Bonnier believes that Bonnier Broadcasting will have very good conditions for its future develop-ment with Telia as owner.
Governance Ambition and relevanceBonnier has an established long-term perspective. As a family-owned company, we are keen for our companies to act in a far-sighted way, and not risk damaging Bonnier’s reputation by taking the short view. This is manifested in the following approaches: • Our companies must have clear ethical guidelines that all em-ployees are familiar with, and also properly functioning channels to raise the alarm, as well as processes for proper handling when these guidelines are breached. • When acquiring and selling businesses, we need to incorporate sustainability aspects in our analysis and considerations and en-sure that businesses we acquire and the business partners we have are in tune with Bonnier’s core values. • We are to put our customers in the center and strive for transpar-ent contractual relationships with our users.
Risks and challengesOne challenge for Bonnier as an owner of a decentralized group whose local company leaders have a wide-ranging mandate, is to find the correct balance between overarching principles and apply-ing these locally on the ground.
One particular compliance area with a particularly significant bearing on the media sector in 2018 was issues regarding user data, with the implementation of the EU’s General Data Protection Regulation (GDPR) in May 2018. Safe, effective and legally compli-ant management of user data is of great commercial importance for Bonnier, both to be able to develop attractive products for users and advertisers and to safeguard the privacy and the trust of our users.
Another area to which particular attention has been paid during the year is IT security, a critical area for many Bonnier companies, partly from a general operational security and business perspective, but also from the industry-specific perspective of protecting our sources.
What we are doingEach company within Bonnier is to comply with Bonnier’s Code of Conduct and a number of additional guideline policies in areas such as IT security, HR issues, purchasing, data protection and whistleblowing. Policy documents are supplemented by instruc-tions and manuals that provide guidance on implementing the policy documents.
Within the bounds set out by Bonnier’s steering documents, the companies as a general rule are free to develop steering docu-ments tailored to the situation in their own operations. This con-cerns, for example, Bonnier’s Code of Conduct, where the compa-nies’ respective codes are to reflect the principles of Bonnier’s code while modifying the language and emphasis to reflect the nature of their own businesses and particularly relevant risk areas. The business area and company management in each respective case are responsible for safeguarding adequate processes and activities for compliance with Bonnier’s policies and standards.
Implementation of policies is mainly followed up through the annual risk survey (see below) and by awareness among employees being measured in annual employee surveys.
Annual risk survey Every year, Bonnier AB (from 2019 the Bonnier Group) conducts a survey of risks linked to compliance and sustainability. This incor-porates ensuring that Group-wide policies are being implemented. The survey is then examined by the audit committee and auditors.
WhistleblowingBonnier’s central whistleblowing system was strengthened during the fall 2017. Reports are made through an external web-based ser-vice and received by the CEO of the Bonnier Group AB (previously Bonnier Holding AB) and a lawyer at the law firm Mannheimer &
9bonnier ab annual report 2018
replaces a number of manual and fragmented tools, mail, Excel documents etc., and assists with automated support for develop-ment and pay talks and onboarding and offboarding. The new system and working method also facilitate compliance with current data protection legislation (GDPR).
Another focus is on exchanging knowledge and cooperation within HR administration. In order to ensure that decisions are made on the best possible grounds and to facilitate working pro-cesses, a number of Group-wide procurement projects have been completed during the year. The Group has also reached a decision on a joint employee survey and a joint pay survey system, drawn up a common approach to the GDPR, etc.
On December 31, 2018 Bonnier had 8,515 (8,599) employees, 3,485 (3,905) of whom worked outside Sweden. The business areas Books, News and Broadcasting have the highest number of employees.
The majority of Bonnier’s employees, 5,030 (4,694) people, work in Sweden. Gender distribution among employees in Sweden is evenly divided between women and men. Sick leave within Bonnier Sweden amounted to three percent of total working hours during the year. Joint employee surveyIn 2017, a joint employee survey was conducted for the first time, covering all Bonnier’s Swedish companies, a survey that was expanded in 2018 to include more companies, including a number outside Sweden. The results of the survey are used as a basis for evaluating the working environment and leadership at every level in our companies. The results have been discussed in Bonnier’s executive management group and HR Council, and concrete activi-ties formulated for areas in which action is required.
Union representation and cooperationBonnier’s operations must respect employees’ right to work and negotiate collectively, irrespective of geographical location.
In addition to representation on the Board of Directors, Bonnier also has a Group union council. Bonnier’s Group union council (BKR) monitors issues such as HR policy, training issues, conditions and rights for employees of Bonnier’s companies. The council comprises a group of employee representatives from dif-ferent occupations and companies in the Nordic countries. They meet a couple of times a year, where they join Group management to exchange information and discuss overarching strategy issues, such as technical initiatives and major investments. In 2018, BKR comprised twelve members selected at an annual conference of representatives of the white-collar union Unionen, the Swedish Union of Journalists (SJF) and the Swedish Union of Forestry, Wood and Graphical Workers (GS), and equivalents from other countries.
The best format under Bonnier’s new subsidiary structure that is optimal for ensuring good cooperation is under investigation. Structural change in no way changes our goal, which is to have trustworthy contact with the trade unions, which is particularly important in this time of rapid changes in the industry.
Example: A new industry standard for employees in the field After Dagens Nyheter’s (DN) employee, photographer Paul Han-sen, was shot and wounded in Mosul in Iraq in 2016, DN took the initiative to spearhead an industry collaboration on the conditions for employees working in high-risk areas. This work involved seven leading Swedish media companies, including the Bonnier-owned companies DN, Expressen and TV4, and resulted in common guidelines for employees working in the field. Bonnier’s companies have implemented the guidelines and work on the basis of these.
1. Each journey to a high-risk area is to be preceded by a thorough risk analysis before the decision to travel is made. It is the duty of the respective company to carry out the risk analysis in the manner it finds best.
Our employees
Ambition and relevance Bonnier’s development as a company depends on being able to attract skilled employees, offering stimulating work and providing a good working environment in which employees can grow and develop.
It is of vital strategic importance that our companies are able to offer attractive contexts in which to work. This involves having the right skills to successfully drive our transformation at any given time. The rapid changes in the media market create new workplace challenges and opportunities. Competition is tough, especially for expertise linked to digital product development.
Our ambition is that our companies are to be attractive em-ployers and thus able to compete for the foremost talent. On key metrics in the employee survey, we want our companies to be in the top decile when benchmarked against comparable employers. In 2018, the key metrics of our companies generally moved in a positive direction, but work still remains to achieve our high goals for Bonnier’s companies as workplaces.
Risks and challenges We operate in industries subject to extreme pressure to change. Great change involves opportunities for development but also makes huge demands of employees at all levels in the company, with a risk of psychosocial ill-health, stress, etc. Bonnier generally has a limited risk of work-related injuries. At Bonnier, responsibil-ity for a good, healthy and safe working environment largely rests with the respective company. Country-specific rules and Bonnier’s values are incorporated in HR-related policies in the majority of our companies.
There is a health and safety risk linked to the increase in the number of threats made against journalists and journalism, both in the form of these threats being realized and the stress such threats can cause in their own right. Bonnier carries out ongoing risk assessments that steer this work and has contributed towards com-monly adopted standards in the industry. Investments in safety have also increased considerably in recent years.
Employer responsibility in partnerships and complex relation-ships makes particular demands. In film and TV productions, for example, those involved are often employed by production companies or working on a freelance basis. This can risk creating a lack of clarity regarding responsibility and a lack of checks in contexts in which our companies act as commissioning clients. In 2018, a number of projects were carried out in our companies to improve the working environment in conjunction with film and TV productions.
What we are doing Founded on Bonnier’s overarching values, work on recruitment, talent development and other employee issues is mainly conducted at company level.
The Group’s Swedish operations especially have long collabo-rated on these issues. In the day-to-day work, this involves partly monitoring risk indicators and acting on these, and partly creating shared support systems and methods to exchange knowledge.
Bonnier’s HR Council, which brings together HR managers from the majority of the different business areas within the Bon-nier Group, meets regularly. The group’s main focus is discussing and exchanging experiences on HR issues such as recruitment, development, education, health and safety, gender equality, legis-lation, contracts, mentoring and sustainable work life. Meetings of the HR Council are called by the head of HR for Bonnier AB, from January 1, 2019 the Bonnier Group.
In 2018, joint work in the HR area has to a large extent focused on the implementation of the HR system Workday in Bonnier’s Swedish operations. The purpose is to modernize and improve both the HR work and the ability of each individual employee to systematically develop competence and follow up. The system

10bonnier ab annual report 2018
2. Each employee sent to a high-risk area must have undergone high-quality safety training in which emergency medical training in the field is an important component. It is the duty of the compa-nies to ensure that all employees active in high-risk areas have the relevant training.
3. Every employee sent to a high-risk area is to have relevant and up-to-date emergency medical equipment in the field and other appropriate safety equipment. It is the duty of the employees to ensure that all travelers have the relevant equipment.
4. It is the duty of every employee sent to a high-risk area to comply with the agreements made with the management. This also covers the use of social media, including private use.
5. Each employee sent to a high-risk area must maintain contact with the home editorial team in the manner that was agreed when deciding on the journey in question. The companies have a duty to ensure that there is a functioning organization with the capacity to communicate with employees in high-risk areas.
6. In the event of a serious and life-threatening security incident, such as kidnapping or personal injury, responsibility may be shifted from the editorial team to a representative of the company management.
7. In cases where the companies send contracted freelance journal-ists or photographers to high-risk destinations, the companies take the same responsibility for them and make the same demands of them as for employed personnel.
Diversity
Ambition and relevanceBonnier strives to offer employees good career and development opportunities, and an interesting and welcoming work environ-ment. Central to this work is creating fair career opportunities, which do not involve advantages or disadvantages based on irrelevant factors such as sex, ethnicity, age, sexual orientation or religion.
On the product side, this also involves our products contribut-ing to an inclusive society in which more people have an oppor-tunity to participate in public debate and engage with culture and making products that are inclusive for as many as possible within the intended target groups.
Risks and challengesThe risks in the area are partly related to compliance with laws and regulations, but above all there is a risk of not managing the poten-tial of existing or prospective employees in the best way possible, and the development of the company being damaged by this. As a company, we cannot afford not to make the most of the potential of every individual employee.
We are operating in an increasingly complex and multifac-eted world, in which a diversity of perspectives and angles and innovation is needed, and this is aided by greater diversity among employees. Furthermore, Bonnier has diversity in its customer base, which should be reflected by a diversity of experiences and perspectives also among our own employees.
What we are doingBonnier’s executive management decided on a target of reaching equal gender distribution (at least 40 percent of the underrepre-sented gender) in all management posts at Bonnier by 2020.
Bonnier also adopted a recruitment policy to avoid distor-tion based on gender, which has or will be implemented by all companies in the year ahead. On an annual basis, all companies at Bonnier are to report gender distribution in management posts,
the gap that remains before the target of equal gender distribution is reached, and the measures that the company has taken – and intends to take – to close that gap. The exact structure of the work in moving towards this target is up to each individual business area and company.
At the end of 2018, executive management in Bonnier’s management and business areas as well as its largest companies comprised 34 (37) percent women and 66 (63) percent men. Over 40 percent of the management groups at the business area and company level already met Bonnier’s target of equal gender dis-tribution at management levels in 2018 (at least 40 percent of the underrepresented gender).
Distribution of Men and Women, %
Percentage
Women Men
Bonnier total 53% 47%
Management business areas and companies 34% 66%
Board Bonnier AB 25% 75%
Bonnier AB works consistently on awareness of gender distribution among participants and those involved in all the activities, training and conferences we arrange, internally and externally.
Bonnier is also involved as a partner in a number of initiatives during 2018 to highlight work on gender equality issues and career opportunities both internally and externally, such as Women in Tech and VA Kvinna. Post #metoo: Efforts against harassment In 2017, Bonnier’s businesses were affected by the #metoo debate and disclosures, both in covering it as media and in the workplace. Based on these experiences, Bonnier’s businesses have worked with both raising the level of knowledge and strengthening warn-ing systems in order to be able to respond to harassment where it occurs and to ensure that rule breaking can be discovered to the greatest possible extent with quick and clear consequences.
During the fall of 2017, Bonnier carried out an in-depth inves-tigation of harassment in our businesses, which was followed up on in 2018. Results show that incidences of harassment have de-creased, and that Bonnier’s businesses are at a comparatively low level regarding perceived vulnerability to harassment. At the same time, the #metoo debate, also within our businesses, showed that systematic and continuous work is needed to prevent and monitor the occurrence of harassment and discrimination. One example is Bonnier Broadcasting’s work on its “Mission Zero” initiative, which has been ongoing during 2018 (see below).
Bonnier Broadcasting: Follow-up of Mission Zero After having been criticized in fall 2017 for not having acted earlier on information on harassment and discrimination in one produc-tion, criticism also confirmed by an independent inquiry ordered by TV4, TV4 launched an overarching action plan, Mission Zero, with ten action points.
Mission Zero primarily seeks to prevent and combat harass-ment, bullying and discrimination, and secondly to identify and tackle such kinds of behavior should they occur. In 2018, the initiative has continued working in all areas of the Mission Zero, and with positive results. Below are a number of examples of completed activities:• Recurring industry meetings to exchange experiences and discuss what can be done as a group. We initiated the first meeting, which has been followed up by more meetings at other TV networks, media companies and production companies. There are as well industry meetings specifically for TV drama productions.• Leadership training for all of Bonnier Broadcasting’s managers, covering both our own guidelines on harassment and offences as

11bonnier ab annual report 2018
well as on the relevant legislation. The managers have dissemi-nated this knowledge to their groups and held workshops. The in-troduction for new employees was also improved by raising issues about harassment and offences.• Meetings with advertisers and media agencies for discussions on work environment, offences and harassment in the industry, where Bonnier Broadcasting described how it decided to work with the issues, with its action plan Mission Zero.• Training for project managers and workshops with our cultural ambassadors to work with the activities.• TV personalities invited to participate on the intranet and in activities with staff• Mandatory e-learning on “An Inclusive Workplace” for employees and the introduction of a whistleblower channel for employees and production companies.• Results from the 2018 employee survey show positive develop-ment on all indices, and that the proportion of highly committed employees has increased. Confidence in management has also improved.• Regarding the issues in an investigation concerning discrimina-tion and abusive behavior, things have improved compared with the previous year. 90 percent of the employees at Bonnier Broad-casting, TV4 and C More consider themselves free from discrimi-nation at work. This is an improvement of 10 percentage points compared with the previous year (2017).
Diversity surveyIn 2019, Bonnier’s Swedish businesses will carry out a first diver-sity survey in the Swedish operations based on the anonymized personal identification service from Statistics Sweden, which co-ordinates official statistics for the country. The purpose is to make the proportion of employees with an international background visible, in order to be able to monitor the extent to which Bonnier’s organization reflects the diversity that exists in Swedish society and the customer base.
Bonnier Books UK: Measures for fair and meritocratic recruitmentBonnier Books UK - Bonnier’s U.K.-based publishing business - is a publishing house that, compared to Bonnier’s book publishers in Sweden, has a greater focus on mass market literature. It has an explicit ambition to be as broad and inclusive a publishing house for as large a group of readers as possible, and wants that ambition to be reflected in its own organization.
In 2018, a new recruitment model was introduced to minimize the risk of bias due to factors such as gender, age or ethnic back-ground in the recruitment process.
One element of this model is that for all positions under the corporate management level, applications are accepted exclusively through a web-based form where the applicants are anonymized. This ensures that all applicants enter via the same path, and that extraneous factors can be completely eliminated in the initial selec-tion phase. (Recruitment of senior positions are done to ensure a fair and inclusive process, but as these are often done through recruiters, the anonymized web form isn’t used.)
Inclusion and participation Bonnier Social Impact: Filmtegration In 2017 Bonnier AB launched the Bonnier Social Impact initiative, which together with the companies in the Group, funds invest-ments that strengthen every individual’s opportunity to be an active citizen of society and participate in public debate.
One such project that was underway during 2018 is Filmtegra-tion, which makes it easier and more entertaining for newly arrived Swedes to learn the language and also gain an introduction to Swedish culture and society through Swedish film classics. In 2015, 163,000 asylum seekers came to Sweden, but it was not until 2017 and 2018 that many of them started courses in Swedish for Immi-grants, SFI. To make learning the language and culture easier and
more fun, C More created the Filmtegration project, which enables SFI to use Swedish films in teaching free of charge, for example Sällskapsresan (The Charter Trip) and Så som i himmelen (As It Is in Heaven). New educational material produced by C More with SFI teachers also accompanies the films. In these first few months, the material has been used by up to 2,000 SFI teachers, so reach-ing tens of thousands of students. Bonnierförlagen: From Fall Break to Book Break Bonnierförlagen organizes a number of initiatives to encourage and increase reading, not least among young people. Changing the name of the traditional Swedish fall break (höstlov) to “Book Break” (Läslov) came up as an idea in 2014 to highlight reading and develop new readers. To give reading a week of its own and filled with activities, in the same way winter sport break (sportlov) draws attention to sports and physical activity. By linking arms with the non-profit reading organization Läsrörelsen and shaping a network with about 80 organizations and companies, we man-aged to draw attention to and have an impact on the issue, which resulted in Prime Minister Stefan Löfven in 2016 introducing Book Break as the government’s initiative on reading. Since then, the initiative has continued with new funds, and the National Agency for Education has now been given the task of communicating the concept of Book Break. With this, Swedish book publisher Bon-nierförlagen’s objective with the project has been fulfilled, but we are continuing the work of populating Book Break with reading pleasure and activities, through our own campaigns and through the network’s combined power.
Bonnierförlagen is also, together with Bonnier’s family foundation, partner with Berättarministeriet, which runs writing workshops in disadvantaged areas. The writing workshops offer school programs free of charge to years 2–5, with the vision of a Sweden in which everyone is confident with the written word and is equipped to actively participate in society.
Environmental and resource efficiency
Ambition and relevanceGlobal and local challenges linked to environmental and climate impact concern all companies. All Bonnier’s operations must be characterized by intelligent and effective use of physical and financial resources such as employees’ time, as well as complying with relevant international and local environmental legislation and standards. Bonnier’s direct environmental impact is limited and varies considerably, given the broad portfolio of operations. Based on the respective businesses situations, we are to work to reduce our direct impact, and in our value chain where relevant.
Risks and challengesBonnier’s risks associated with the environment are limited. The printers use certain chemicals where the industry has jointly worked to reduce consumption and a permit is not currently required. Established procedures and controls on handling ensure minimal risks of wastage.
The media industry is undergoing major changes. Newspaper products are increasingly read digitally. The environmental impact of making paper and energy consumption at printers are thus expected to fall in the long term, while the impact from digital con-tent is expected to increase. It is more difficult to measure, monitor and influence the environmental impact of digital products as this requires a value chain perspective.
What we are doing In 2018, Bonnier developed an environmental policy with overall principles for environmental responsibility, which also describes the respective business area’s responsibility to conduct adequate environmental efforts. Responsible use of resources also includes responsible purchasing, where Bonnier through its code of conduct aimed at suppliers sets expectations regarding resource efficiency,

12bonnier ab annual report 2018
environmental responsibility and responsibility for employees.With the exception of the printing companies, Bonnier’s opera-
tions are generally not very resource-intensive or energy-intensive. The printing operations therefore have a greater focus on environ-mental efforts.
Office operations The majority of Bonnier’s operations are office based and have a limited environmental and climate impact in the form of business travel and certain energy use. A new travel policy was adopted in 2018; Bonnier encourages responsible travel and facilitates meet-ings via phone and video. Travel in Sweden in particular can be done by rail or replaced with video meetings. All Bonnier’s offices and editorial teams must have an environmental plan describing how environmental responsibility is taken and how the awareness of employees can be raised.
Printers In the operations that are more resource-intensive, mainly our printers, we work constantly on quality and the environment and strive to minimize material consumption and environmental impact. The same work applies to external print orders and dis-tribution. The majority of the paper raw material Bonnier uses in printers is produced in Scandinavia with very high environmental performance. Intermediate goods, waste, energy, etc. are followed up to ensure efficiency. Read more about our printers’ work below, in the section on Bonnier News and Bold.
Suppliers The majority of Bonnier’s suppliers are based in Europe. The suppliers Bonnier works with in printing operations, i.e. suppliers of paper, metal plates and ink, have had a high standard for their environmental work for many years.
In 2018, we developed Bonnier’s Code of Conduct for sup-pliers, clarifying the requirements regarding environmental and social sustainability.
Example: Bonnier News - printing and distributionAs of January 1, 2019, Bonnier News comprises Bonnier’s Swedish news and business dailies, magazines, B2B media and B2B services as well as the printing companies within Bold Printing. Sustainability in the printing operationsThe printing operations today consists of a printing company in Stockholm (Bold Printing Stockholm), two printing companies in Malmö (Bold Printing Malmö) and a partly owned printing com-pany in Borås (Borås Tidning Tryckeri).
All printers are certified in accordance with ISO 14 001 (envi-ronmental management system), all of them also carry the Nordic Swan Ecolabel. Bonnier’s printing companies produce internal and external newspapers, free newspapers and a small proportion of direct mail advertising. Certain editions of some of Bonnier’s daily newspapers (DN, DI and Expressen) are also produced at the externally contracted Daily Print printer in Umeå, with the same requirements for certifications and environmental follow-up as our own printing business.
In our printing operations, as in previous years, we use pro-duction resources as efficiently as possible. Paper efficiency is a key figure that is followed up at each printing company, i.e. used/print-ed paper in relation to shredded paper, waste, trim and shrinkage. The key figure is in line with industry standards and is followed up every year, comparing to similar production at competing print-ing companies in Sweden and Norway. It also involves cyclical thinking on a fundamental level for employees and management regarding materials such as newsprint, packaging and printing plates. This also includes how much waste is loaded in transport vehicles that collect waste each week. Bold Printing Malmö has managed to reduce the number of transports by half over a five-
year period, despite the fact that today it has operations at two printing operations and previously had only one. Bold Printing Malmö has also found a solution for cleaning/filtering water that has been contaminated with detergents and now has permission to release the water directly into the sewage system. Previously, water had to be destroyed. This will further reduce the number of transports in 2019.
We also put great emphasis on following up on the possibility of utilizing materials that end up as waste and are taken care of by our waste supplier and can become new products, including in pa-per mills (recycled newspapers/magazines) or in the construction industry as insulation (recycled daily newspapers/waste paper), and aluminum components for the automotive industry (used printing plates). Every month we meet with the waste supplier to ensure the sale of recycled material to various markets, including paper, plastic and aluminum. In 2018, about half of our recycled newspapers/shredded paper have ended up as insulation for the construction industry, and half has gone to Swedish paper mills to produce new newsprint.
In addition to the key ratio of paper efficiency, we also continu-ously monitor energy use and previously introduced an action program for reducing electricity use over time, mainly in produc-tion but also in property management systems.
Distribution operations within Bonnier NewsDistribution operations have undergone major changes during the year; a new wholly owned distribution company was formed in Skåne (Nim Distribution) and a new partly owned distribution company (Premo - Pressens Morgontjänst) was re-established in the Stockholm region after a few years being run by Bring Citymail.
In other regions, distribution is purchased. The evening news-paper Expressen uses Tidsam (partly owned by Bonnier), which has operations in Värnamo, as distributor and manager of returned newspapers. Tidsam also handles most of the magazines that are distributed to retailers and sold in Sweden.
In order to secure the distribution of newspapers through the complex network of newspaper distributors who deliver subscrib-ers’ morning newspapers every night, the business has evolved to also include delivery of letters, magazines, government informa-tion, direct mail and packages. This places new demands on work tools, such as distribution vehicles, carts and bicycles. During the fall, Nim Distribution received its first deliveries of electric bicycles, which means that new, more efficient distribution loops are formed and that the number of items that can be distributed simultaneously increases. This redevelopment work is also ongoing in 2019. Premo plans for a similar arrangement in parts of the Stockholm region, also including electric cars for future distribu-tion networks.
Other distributors’ contracts are being negotiated during 2018 and into 2019 to ensure fulfillment of Bonnier’s Code of Conduct and that requirements may be added with the possibility of an independent environmental audit. The goal is to find additional synergies through the co-delivery of Bonnier’s products where pos-sible. We expect contracted hauliers/distributors to take an active part in the work to increase efficiency and fill levels in distribution cars/vehicles. Bonnier also works to ensure that hauliers/distribu-tors use vehicles that comply with Euroclass 6.
Examples: E-commerce (Adlibris Group) The Adlibris Group has a sustainability group that has developed guidelines for environmental work in areas such as recycling, transport and energy supply.
Recycling and packaging: The Adlibris group is connected to the packaging and newspaper recycling company FTI for handling recycling, and the corrugated board used for mailing to customers is made on recycled material. In order to further reduce the use of disposable materials such as corrugated board and wrapping, Adli-bris already produced crates in hard plastic 15 years ago, which are

13bonnier ab annual report 2018
still used today for deliveries of books from the Adlibris Group’s largest suppliers.
Energy supply: The Adlibris Group’s logistics center is located in Morgongåva outside Uppsala and during 2018 has been exten-sively expanded to include premises of 32,000 square meters. In 2018, solar cells were installed on the roof of the premises; the production from these makes the logistics facility self-sufficient on electricity.
Transport: Adlibris is a retailer and buys its products from suppliers in Europe, the U.S. and Asia. From Asia, transport is by boat (following an internal investigation which concluded that by boat is better than by train from a sustainability perspective) while products from Europe and the Nordic countries are usually transported by truck. In order to make fast deliveries to custom-ers, the Adlibris Group sometimes transports products from the U.S. by air. The company works actively to reduce the proportion of products transported by air, among other things by further developing purchasing algorithms to better anticipate needs and plan purchases.
Human rightsThrough Bonnier’s companies, we contribute to the safeguarding of human rights by covering poor conditions and abuses. Bonnier supports international conventions regarding respect for human rights and the principles of the UN Global Compact.
Bonnier’s direct business is conducted primarily in the Nordic region and other countries with clear standards and rules regard-ing human rights. Standards regarding respect for human rights are also required in our supplier policy. We believe that violations of human rights are a very limited risk in our business and thus do not constitute an important area of sustainability for accounting.
By examining how political and economic power is exercised and by describing people’s living conditions, bringing attention to and revealing crimes against them, our activities contribute to promoting the safeguarding of human rights.
Expected future developmentIn our plan for the years to 2020 we have determined to develop Bonnier on the basis of a long-term perspective, where the aim is to build a group that is strong and well-positioned for the future. Bonnier’s companies are working to convert operations to a greater proportion of new and sustainable income. Investments in technology and business development in our existing operations and in adjoining sectors where we see opportunities for growth continue. In the years ahead, growth in digital services is expected to increase and the group’s main income focus lies in increased user income.
The increase in resources from the divestment of Bonnier Broadcasting creates a stronger financial position, for investment in growth, both in and outside existing operations. The change of the organizational structure (see page 3, “Significant events during the financial year”) does not have an impact of the strategic direc-tion of the operations.
The Parent CompanyThe Parent Company mainly contains Group-wide functions. Net turnover amounted to SEK 35 (42) million, of which invoicing to other companies in the Group amounted to SEK 33 (40) million. Results before appropriations amounted to SEK -1,070 (-672) million.
In 2018 the corporate governance within Bonnier AB has been changed in which the business areas within the Group, were to become independent companies. As a result, some parts of the common Group functions have been discontinued.
Proposed appropriation of profits The Parent CompanyThe following earnings are at the disposal of the Annual General Meeting:
(SEK)Retained earnings 17,926,234,799Profit/loss for the year -531,883,800
17,394,350,999
The Board of Directors propose the following appropriation of the funds:To be carried forward 17,394,350,999
17,394,350,999
For additional information regarding the financial position and performance of the Parent Company and the Group, see the follow-ing financial reports. All amounts are expressed in SEK millions unless stated otherwise.

14bonnier ab annual report 2018
Consolidated Income Statements SEK million
Note 2018 2017
Net sales 5 26,447 25,740Other operating revenues 167 33Total revenues 26,614 25,773
Raw materials and consumables -1,903 -2,140Goods for resale -5,554 -5,557Personnel costs 6, 7 -6,725 -6,490Other external costs 7, 8, 9 -7,127 -7,045Depreciation, amortization and impairment losses 14, 15 -4,434 -3,956Profit or loss from participations in associated companies and
joint ventures 10 22 71Other operating expenses -69 -31EBITA 824 625
Items related to acquisitions, divestments and close-downs together with amortization/impairment losses of group excess values 11 -1,049 -2,049
-1,049 -2,049
Operating profit/loss -225 -1,423
Interest income 13 12Interest expenses -186 -202Other financial income and expenses 21 -15Net financial income/expenses from participations
in associated companies and joint ventures 10 -5 -7Net financial income/expenses 12 -157 -212
Profit/loss before tax -382 -1,635
Tax 13 -490 -604
Profit/loss for the year -872 -2,239
Profit/loss for the year attributable to: -Shareholders of the Parent Company -875 -2,268-Non-controlling interests 3 29
Consolidated Statements of Comprehensive Income SEK million
2018 2017
Profit/loss for the year -872 -2,239
Other comprehensive incomeItems which are not reclassified to profit or lossRevaluation of defined benefit pension plans -216 -134Items which may subsequently be reclassified to profit or lossTranslation differences -111 87Cash flow hedges 33 19Translation differences attributable to participations
in associated companies and joint ventures 0 0Other comprehensive income for the year, net after tax -294 -29TOTAL COMPREHENSIVE INCOME FOR THE YEAR -1,166 -2,268
Total comprehensive income attributable to:-Shareholders of the Parent Company -1,170 -2,302-Non-controlling interests 4 34
15bonnier ab annual report 2018
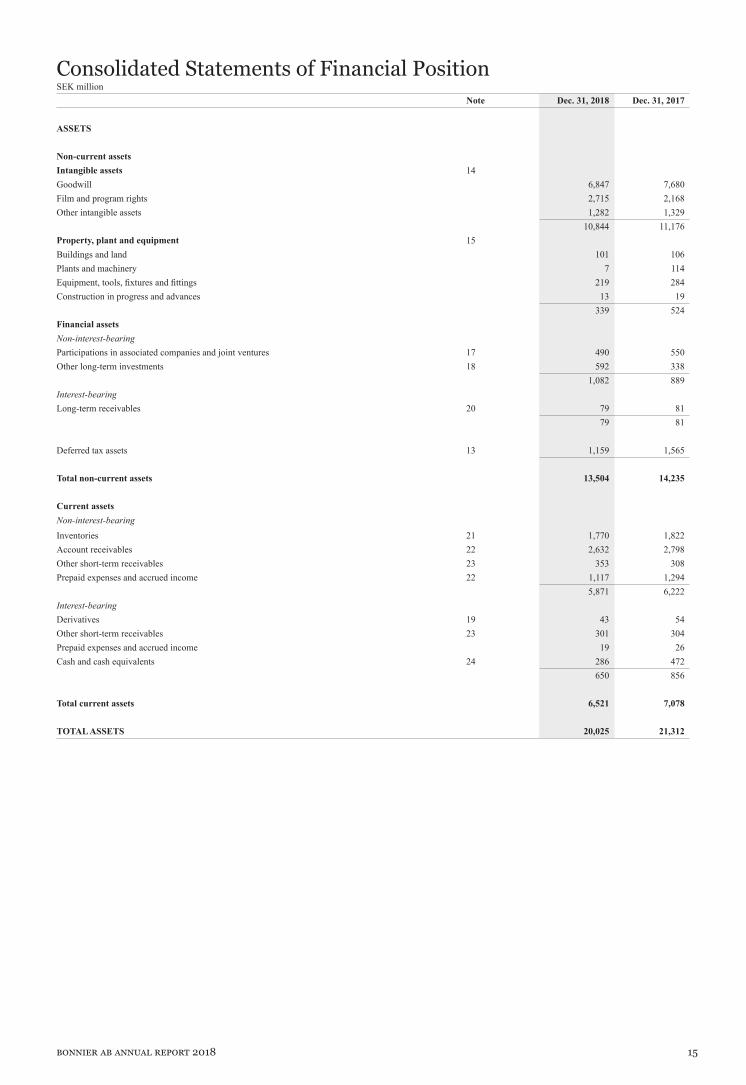
Consolidated Statements of Financial Position SEK million
Note Dec. 31, 2018 Dec. 31, 2017
ASSETS
Non-current assetsIntangible assets 14Goodwill 6,847 7,680Film and program rights 2,715 2,168Other intangible assets 1,282 1,329
10,844 11,176Property, plant and equipment 15Buildings and land 101 106Plants and machinery 7 114Equipment, tools, fixtures and fittings 219 284Construction in progress and advances 13 19
339 524Financial assetsNon-interest-bearing Participations in associated companies and joint ventures 17 490 550Other long-term investments 18 592 338
1,082 889Interest-bearingLong-term receivables 20 79 81
79 81
Deferred tax assets 13 1,159 1,565
Total non-current assets 13,504 14,235
Current assetsNon-interest-bearing Inventories 21 1,770 1,822Account receivables 22 2,632 2,798Other short-term receivables 23 353 308Prepaid expenses and accrued income 22 1,117 1,294
5,871 6,222Interest-bearingDerivatives 19 43 54Other short-term receivables 23 301 304Prepaid expenses and accrued income 19 26Cash and cash equivalents 24 286 472
650 856
Total current assets 6,521 7,078
TOTAL ASSETS 20,025 21,312

16bonnier ab annual report 2018
Consolidated Statements of Financial Position SEK million
Note Dec. 31, 2018 Dec. 31, 2017
EQUITY AND LIABILITIES
Equity attributable to shareholdersof the Parent Company
Share capital 25 300 300Other contributed capital 1,232 232Reserves 25 -113 -29Retained earnings including profit/loss for the year 2,130 3,281Total equity attributable to shareholders
of the Parent Company 3,549 3,784Non-controlling interests 25 101 137Total equity 3,650 3,921
Non-current liabilities Interest-bearingLiabilities to credit institutions 26 1,863 1,488Derivatives 19 0 0Provisions for pensions 27 2,365 2,426Provisions 28 42 93Other non-current liabilities 29 123 347
4,393 4,353Non-interest-bearingDeferred tax liabilities 13 260 312Provisions 28 59 38Derivatives 19 65 108
384 459
Total non-current liabilities 4,777 4,812
Current liabilitiesInterest-bearingLiabilities to credit institutions 26 2,308 2,057Derivatives 19 7 9Provisions 28 193 116Other current liabilities 30 1,549 2,916Accrued expenses and deferred income 31 22 39
4,079 5,137Non-interest-bearingAccount payables 2,247 1,942Subscription liabilities and other advances from customers 32 978 990Current tax liabilities 74 41Provisions 28 103 411Other current liabilities 30 705 688Accrued expenses and deferred income 31, 32 3,413 3,388
7,519 7,443
Total current liabilities 11,598 12,580
TOTAL EQUITY AND LIABILITIES 20,025 21,312
For information concerning the Group’s pledged assets and contingent liabilities, see Note 33.

17bonnier ab annual report 2018
Consolidated Statements of Changes in EquitySEK million
Share capitalOther contri-buted capital Reserves
Retained earnings
including profit/loss
for the year
Total equity attributable
to share-holders of the Parent Company
Non-control-ling interests Total Equity
Opening balance, Jan. 1, 2018 300 232 -29 3,281 3,784 137 3,921Adjustment for changed accounting policy 1) -5 -11 -17 -3 -20Adjusted opening balance, Jan. 1, 2018 1) 300 232 -34 3,270 3,767 134 3,901Comprehensive incomeProfit/loss for the year -875 -875 3 -872Other comprehensive incomeCash flow hedges 44 44 - 44Translation differences -112 -112 1 -111Revaluation of defined benefit pension plans -251 -251 - -251Other comprehensive income attributable
to participations in associated companies andjoint ventures 0 - 0 - 0
Tax on items in other comprehensive income -10 35 24 - 24Total Other comprehensive income, after tax -79 -216 -295 1 -294Total comprehensive income -79 -1,091 -1,170 4 -1,166Transactions with shareholders Dividends to non-controlling interests -43 -43Change in conjunction with acquisitions and
divestments of non-controlling interests -16 -16 5 -11Change in value of options attributable to
acquisitions of non-controlling interests 6 6 - 6Shareholder contributions 1,000 - 1,000 - 1,000Group contributions -50 -50 -50Tax on group contributions 11 11 11Total transactions with shareholders 1,000 -48 952 -37 914Closing balance, Dec. 31, 2018 300 1,232 -113 2,130 3,549 101 3,650
Opening balance, Jan. 1, 2017 300 232 -129 5,425 5,828 88 5,916Comprehensive incomeProfit/loss for the year -2,268 -2,268 29 -2,239Other comprehensive incomeCash flow hedges 24 24 - 24Translation differences 82 82 5 87Revaluation of defined benefit pension plans -166 -166 - -166Other comprehensive income attributable
to participations in associated companies andjoint ventures 0 - 0 - 0
Tax on items in other comprehensive income -5 31 26 - 26Total Other comprehensive income, after tax 100 -134 -34 5 -29Total comprehensive income 100 -2,402 -2,302 34 -2,268Transactions with shareholders Dividends to owners of the Parent Company -280 -280 - -280Dividends to non-controlling interests -43 -43Change in conjunction with acquisitions and
divestments of non-controlling interests 582 582 58 640Change in value of options attributable to
acquisitions of non-controlling interests -34 -34 - -34Group contributions -13 -13 - -13Tax on group contributions 3 3 - 3Total transactions with shareholders 258 258 15 273Closing balance, Dec. 31, 2017 300 232 -29 3,281 3,784 137 3,921
1) Adjusted to reflect the impact of changed accounting policy for revenue and financial instruments. For further information, see Note 2.

18bonnier ab annual report 2018
Consolidated Statements of Cash FlowSEK million
Note 2018 2017
Operating activitiesProfit/loss before tax -382 -1,635Adjustments for items in cash flow 34 4,841 6,134Paid income tax -138 -161Cash flow from operating activities before change
in working capital 4,322 4,338
Change in inventories -61 -317Change in account receivables 75 -123Change in other short-term receivables -141 -16Change in account payables 317 -146Change in subscription debt and advances from customers -24 -41Change in other current liabilities -145 -24Change in working capital 21 -667
Cash flow from operating activities 4,342 3,671
Investing activitiesAcquisition of shares in subsidiaries, net debt effect 16 -30 -641Reversal of net debt items in the acquisition of shares in
subsidiaries that are not cash or cash equivalents -246 91Investments in other financial assets -143 -141Acquisition of property, plant and equipment -155 -166Acquisition of intangible assets -4,544 -3,973Divestments of shares in subsidiaries, net debt effect 265 0Reversal of net debt items on divestments of shares in subsidiaries and
other financial assets that are not cash or cash equivalents 1 -4Divestments of other financial assets 136 26Divestments of property, plant and equipment 2 5Divestments of intangible assets - 1Cash flow from investing activities -4,713 -4,803
Financing activitiesDivestments to non-controlling interests, net debt effect - 642Repayments/lending of interest-bearing receivables 7 313Change in current financing -1,379 2,262Borrowings 2,381 1,585Amortization of debt -1,771 -3,021Group contributions -13 -58Shareholder’s contribution recieved 1,000 -Dividends to owners of the Parent Company - -280Dividends to non-controlling interests -43 -43Cash flow from financing activities 183 1,401
CASH FLOW FOR THE YEAR -188 270Cash and cash equivalents at the beginning of the year 472 274Translation differences in cash and cash equivalents 2 -72Cash and cash equivalents at the end of the year 286 472
19bonnier ab annual report 2018
Notes to the Consolidated Financial Statements
The consolidated financial statements for Bonnier AB have been prepared in accordance with International Financial Reporting Standards (IFRS) as approved by the EU and the interpretations of the IFRS Interpretations Committee (IFRIC).
In addition, the Group applies the Swedish Annual Accounts Act and the Swedish Financial Reporting Board’s recommendation RFR 1 “Supplementary rules for group accounting”.
The financial statements are presented in millions of Swed-ish krona (SEK). Rounding may apply in tables and calculations, which means that the stipulated total amounts are not always an exact amount of the rounded amounts. Items in the consolidated financial statements have been prepared on a cost basis, except for certain financial instruments which are stated at fair value. The significant accounting principles applied in the preparation of these consolidated financial statements are described below.
Changed standards that were effective in 2018 The Group applied IFRS 9 and IFRS 15 as per January 1, 2018. IFRS 9 Financial Instruments IFRS 9 Financial Instruments addresses classification, measure-ment and derecognition of financial assets and liabilities, and introduces new rules for hedge accounting and a new impairment model for financial assets. IFRS 9 has replaced IAS 39 Financial Instruments: Recognition and Measurement. The Group applied IFRS 9 prospectively, with an initial application date of January 1, 2018 and the comparatives, according to IFRS 9, for 2017 or earlier are not restated.
The effects on the financial statements according to IFRS 9 refer to measurement of other investments (equity instruments) and presentation of hedging of film and program rights. The effect of fair value measurement of other investments have impacted the opening balance as of January 1, 2018 by SEK 54 million. The changes in fair value are presented in “Net financial income/expenses” in the line Other financial income and expenses. The Group has used cash flow hedging for purchase of film and pro-gram rights. According to the earlier accounting policy choice in IAS 39, the cumulative amount in the hedging reserve was retained in equity and reclassified to income statement during the useful life of the asset. According to IFRS 9, the accumulated amount in the hedging reserve is included in the initial cost of the film and program rights. As of January 1, 2018 SEK 7 million was removed from the hedging reserve and reduced the cost of film and program rights. The deferred tax related to these items amounted to SEK 2 million and increased the deferred tax assets. Additionally, the Group has adopted consequential amendments to IFRS 7 Financial Instruments: Disclosures that are applied to disclosures about 2018 but have not been generally applied to comparative informa-tion.
IFRS 15 Revenue from Contracts with Customers IFRS 15 Revenue from Contracts with Customers has superseded all previous standards and interpretations addressing revenue recognition. Bonnier has applied IFRS 15 in accordance with the modified retrospective approach. IFRS 15 has had an impact related to revenues for sale of information services. The service is transferred to the customers over time and the method for measuring the progress has been changed. As of January 1, 2018 the “Retained earnings” has been adjusted by SEK -65 million and “Non-controlling interest” by SEK -3 million. “Accrued expenses and deferred income” has been adjusted by SEK 68 million. Net sales for 2018 has been affected by SEK 9 million compared to IAS 18. In addition, IFRS 15 also has required new disclosures. New and revised standards and interpretations are not yet effective and have not been adopted early by the Group The International Accounting Standards Board (IASB) has issued the following new and revised standards which will have an effect on the consolidated financial statements when applied for the first time. IFRS 16 Leases: The new standard for the accounting of leases means for the Group as lessee that all lease contracts, with the ex-ception of leases of low value and short-term leases shorter than 12 months, will be recognized as assets and liabilities in the statement of financial position. The statement of financial position total will increase. Income statement will also be affected since the lease ex-pense will consist of depreciation which is included in EBITA and interest expenses, included within net finance income/expenses, on the lease liability. This recognition means a front-loaded effect on income statement for each lease agreement. According to IAS 17 lease payments for operational leases are recognized as “Other operating expenses,” included in EBITA, on a straight-line basis. There will also be extensive disclosures. The Group has performed a detailed assessment of IFRS 16. IFRS 16 will be effective for financial years beginning on or after January 1, 2019. The Group intends to apply the simplified transition approach and will not restate comparative amounts for the year prior to first adoption. Right-of-use assets will be measured at the amount of the lease liability on adoption adjusted for any prepaid or accrued lease expenses. The Group will also apply the practical expedient to grandfather the definition of a lease on transition. This means that it will apply IFRS 16 to all contracts entered before January 1, 2019 and identified as leases in accordance with IAS 17 and IFRIC 4.
In summary the impact of IFRS 16 adoption is expected to be as follows: Impact on the statement of financial position (increase/(decrease)) as at 1 January 2019: Assets Property, plant and equipment (right-of-use assets) 2,920 Lease receivables 74 Prepayments -94 Equity and Liabilities Retained earnings 1 Lease liabilities 2,899
Due to the adoption of IFRS 16, the Group’s operating profit will improve, while its interest expense will increase. This is due to the change in the accounting for expenses of leases that were classified as operating leases under IAS 17.
Operating cash flows will increase and financing cash flows de-crease as repayment of the principal portion of the lease liabilities will be classified as cash flows from financing activities.
Other new and revised IFRS and interpretations not yet effec-tive are not expected to have any significant impact on the Group’s consolidated financial statements.
NOTE 1 General Information
Bonnier AB (”Bonnier”), Corporate Registration No. 556508-3663, is a limited liability company incorporated in Sweden with its registered office in Stockholm. The address of the headquarters is Torsgatan 21, 113 21 Stockholm. The mailing address to Bonnier AB is SE-113 90 Stockholm. The internet address is www.bonnier.se.
Bonnier AB is a wholly-owned subsidiary of Bonnier Group AB (formerly Bonnier Holding AB), Corporate Registration No. 556576-7463, a subsidiary of Albert Bonnier AB, which is owned by more than 90 members of the Bonnier family.
The parent company for the largest and smallest group in which Bonnier AB is a subsidiary and for which consolidated ac-counts are prepared is Albert Bonnier AB, Corporate Registration No. 556520-0341.
NOTE 2 Significant accounting policies
20bonnier ab annual report 2018
N O T E S TO T H E C O N S O L I D AT E D F I N A N C I A L S TAT E M E N T S
Consolidated Financial StatementThe consolidated financial statements cover the Parent Company Bonnier AB and all companies over which the Parent Company has control (subsidiaries). Control is achieved when the Group is exposed to, or has rights to, variable returns from its involvement with another company and has the ability to affect the returns through its power over that company.
Subsidiaries are consolidated from the acquisition date until the date when control ceases.
Profit or loss and each component of other comprehensive income are attributable to shareholders in the Parent Company and to non-controlling interests, even if this results in the non-controlling interests having a deficit balance.
When necessary, adjustments are made to the financial state-ments of subsidiaries in order to bring their accounting principles in line with the Group’s accounting principles. All intra-group transactions, balances and unrealized gains and losses attribut-able to intra-group transactions have been eliminated in full on consolidation.
Transactions with holdings with non-controlling interestsChanges in the Parent Company’s participations in subsidiaries that do not result in a loss of control are accounted for as equity transactions, i.e. as transactions with the Group’s owners. Any dif-ference between the amount by which the non-controlling interest is adjusted and the fair value of the consideration paid or received is recognized directly in equity and allocated to shareholders of the Parent Company.
When the Parent Company loses control of a subsidiary, the gain or loss on the sale is calculated as the difference between:
i) the aggregate of the fair value of the consideration received and the fair value of any retained participation, and ii) the previous carrying amount of the subsidiary’s assets (in-cluding goodwill), liabilities and any non-controlling interests.
The fair value of any investment retained in the former subsidiary on the date when control is lost is regarded as the fair value on ini-tial recognition for subsequent accounting under IAS 39 “Financial Instruments: Recognition and Measurement” or, when applicable, as the cost on initial recognition of an investment in an associated or a jointly-controlled entity.
Business combinationsBusiness combinations are accounted for using the acquisition method.
The consideration transferred in a business combination is measured at fair value, which is calculated as the sum of the acquisition-date fair values of the assets transferred, the liabilities incurred by the former owners of the acquiree and the equity in-terests issued in exchange for control of the acquiree. Acquisition-related costs are recognized in the income statement as incurred.
The consideration transferred by the Group in a business com-bination also includes the fair value of any assets and liabilities re-sulting from a contingent consideration arrangement. Changes in the fair value of contingent consideration qualifies as measurement period adjustments, with corresponding adjustment against good-will. Measurement period adjustments are adjustments that arise from additional information obtained during the measurement period about facts and circumstances that existed at the acquisi-tion date. Contingent consideration that is classified as equity is not remeasured at subsequent reporting dates and its subsequent settlement is accounted for within equity. In other cases, subse-quent changes in the fair value of the contingent consideration are recognized in profit for the year.
On the acquisition date, the identifiable assets acquired and the liabilities assumed, as well as any contingent assets, are recog-
nized at their fair value. Goodwill is measured as the excess of the sum of the consider-
ation transferred, the amount of any non-controlling interests, and the acquisition-date fair value of any previous held equity interests in the acquiree over the identifiable net assets acquired. If, after reassessment, this difference is negative, it is recognized directly in the income statement as a bargain purchase gain.
For each business combination, any non-controlling interest in the acquiree is measured either at fair value or at the non-control-ling interests’ proportional share of the recognized amounts of the acquiree’s identifiable net assets.
When a business combination is achieved in stages, previ-ously held equity interest in the acquiree is remeasured to its acquisition-date fair value (i.e. when control is achieved) and the resulting gain or loss, if any, is recognized in the income statement. Amounts arising from interests in the acquiree prior to the acquisi-tion date that have previously been recognized in other compre-hensive income are classified to the income statement where such treatment would be appropriate if that interest were disposed of.
GoodwillGoodwill is carried at cost as established at the date of acquisition of the company less any impairment losses.
For the purpose of impairment testing, goodwill is allocated to each of the cash-generating units that is expected to benefit from the acquisitions’ goodwill. These units are the Group’s business areas.
Goodwill is tested for impairment annually or more often if there is an indication. If the recoverable amount of a cash-generating unit is less than its carrying amount, the impairment loss is allocated first to reduce the carrying amount of any goodwill allocated to the unit and then the carrying amount of goodwill at-tributable to other assets in a unit is reduced. A recognized impair-ment loss for goodwill is not reversed in subsequent periods.
On disposal of a subsidiary, the attributable amount of good-will is included in the determination of the capital gain or loss.
Participations in associated companies and joint venturesAn associated company is a company over which the Group has a significant influence, generally accompanying a shareholding, directly or indirectly, of between 20-50% of the voting rights.
A joint venture is a joint arrangement whereby the parties that have joint control of the arrangement have rights to the net assets of the joint arrangement. Joint control exists when two or more parties contractually agree to exercise joint control over an arrangement.
Associated companies and joint ventures are accounted for in accordance with the equity method. Under the equity method, the initial recognized cost is adjusted to recognize changes in the Group’s share of the associated company’s or joint venture’s net assets, as well as consolidated goodwill and any other remaining consolidated surplus and deficit values. When the Group’s share of losses in an associated company or a joint venture equals or exceeds its interest in the associated company or joint venture, the Group does not recognize further losses, unless it has incurred legal or constructive obligations or made payments on behalf of the associated company or joint venture. On acquisition of the invest-ment in an associated company or joint venture, any excess of the cost of the investment over the Group’s share of the net fair value of the identifiable assets and liabilities of the investee is recognized as goodwill, which is included in the carrying amount of the invest-ment. When necessary, the carrying amount of the investment (including goodwill), is tested for impairment.
When a group company transacts with an associated company or a joint venture of the Group, unrealized gains or losses cor-responding to the Group’s investments in the associated company
NOTE 2 cont.

21bonnier ab annual report 2018
or joint venture are eliminated. Dividends received from associated companies or joint ventures reduce the carrying amount of the investment.
Revenue recognition The Group recognizes revenue when it transfers control over a product or service to a customer. Revenue is measured based on the consideration specified in the contract with the customer to which the Group expects to be entitled, and excludes amounts col-lected on behalf of third parties; e.g. value added tax.
The Group has generally concluded that it is the principal in its revenue arrangements because it typically controls the goods or services before transferring them to the customer.
For the policies for revenue recognition for the Group’s main types of products and services, see below.
Advertising The performance obligation for advertising is satisfied when the advertisement is actually shown, published or displayed and the revenue is recognized at that time. A receivable is recognized when the advertisement is actually shown, published or displayed as this is the point in time that the consideration is unconditional because only the passage of time is required before the payment is due. The revenue is reduced for volume rebates; see heading “Volume rebates.” The payment is generally due within 14-30 days.
For some sales of advertising the Group involves a third party as seller of the advertisement; for policies, see heading “Agent versus principal.”
Subscription The performance obligation is satisfied when the newspaper or magazine is delivered to the customer and revenue is recognized upon delivery. For digital subscriptions the revenue is recognized when the newspaper or magazine is published on the web or when the content is available for the user. The payment for subscription is in advance, 1-12 months, or on ongoing basis. A subscription liability is recognized until the newspaper or magazine is delivered to the customer.
Goods (chiefly books, magazines and newspaper - newsstands) The performance obligation is satisfied upon delivery of the goods and the revenue is recognized at that time. The payment is gen-erally due within 30 to 90 days from delivery. A receivable is recog-nized when the goods are delivered as this is the point in time that the consideration is unconditional, because only the passage of time is required before the payment is due. Some contracts provide customers with a right of return and volume rebates, which give rise to variable consideration; for description, see heading “Rights of return” and “Volume rebates.”
For newsstand sales of magazines and newspapers the Group involve a third party as seller of the magazines and newspapers. The Group pays commissions to the third party which are rec-ognized as cost, while the Group assesses that the Group acts as principal while it controls the goods before transferring them to the customer and records the revenue on a gross basis.
Digital distribution The performance obligation is satisfied over time and the revenue is recognized at the same time as the customer uses the services, because the customer simultaneously receives and consumes the benefits provided by the Group. In general the payment is due 30 days after the performance is satisfied.
For distribution of TV the revenue is recognized on net basis; see heading “Agent versus principal.”
Film Revenue for film includes distribution and production of films. The performance obligation for distribution is when the rights to the film are transmitted to the customer. The revenue is royalty sales-based for the theatrical and home entertainment windows, but for the other windows (TV/SVOD/EXPORT) the revenues are license-based. The revenue is recognized when the sale occurs respectively when the film is delivered.
The performance obligation for production of film is satisfied over time because the Group does not create an asset with alterna-tive use and has an enforceable right to payment for the perfor-mance completed to date. The output method is used for measur-ing the progress toward complete satisfaction of the performance obligation, i.e., the revenue is based on the value to the customer relative to the remainder of the goods promised in the contract. The Group considers that this output method is an appropriate measure of the progress toward complete satisfaction of the perfor-mance obligations.
Payment is made at set times during the production period, such as signing of agreement, first day of principal photography, last day of shooting and premiere.
Any amount previously recognized as a contract asset is reclas-sified to trade receivables at the point at which it is invoiced to the customer.
Variable consideration For contracts that include a variable consideration, for example discounts, the Group estimates the amount of consideration to which it will be entitled.
Information about the consideration allocated to performance obligations that are unsatisfied is not disclosed due to the fact that the majority of the contracts have a duration of one year or less.
Rights of return Certain contracts provide a customer with a right to return the goods within a specified period. The Group uses the expected value method to estimate the goods that will not be returned based on historical returns because this method best predicts the amount of variable consideration to which the Group will be entitled. For goods that are expected to be returned, instead of revenue the ac-counts receivables are reduced; for further information see note 22 “Accounts receivable and accrued income.”
Volume rebates The Group provides volume rebates once the quantity of products purchased during the period exceeds a threshold specified in the contract. Volume rebates are typically offered to all high-volume customers and reflect the stand-alone selling price. The volume rebates are recognized as reduced revenue when the customer reaches the certain volume and are offset against amounts payable by the customer.
Royalties For license of book rights and distribution of film the Group receives royalties which are sales-based. The revenue is recognized when the sales occur; see also heading “Film.” In general, the Group receives a fixed amount for license of book rights that is not contingent on future sales and is not subject to clawback. The fixed payment is recognized as revenue when the license is granted.
Financing components For certain goods and services, the Group receives short-term ad-vances (one year or less between the transfer of goods and services and the received payment). The Group uses the practical expedi-ent, so it does not adjust any of the transaction prices for the time value of money.
NOTE 2 cont.
N O T E S TO T H E C O N S O L I D AT E D F I N A N C I A L S TAT E M E N T S
22bonnier ab annual report 2018
Agent versus principal For revenue related to advertising, sales of newspapers and maga-zines and distribution of TV there are other parties involved in providing the goods and services.
The Group is assessed to be principal for sales of advertising, while the Group controls the promised service before transferring that service to the customer and therefore records revenue on a gross basis, except for sales of advertising to media agencies which are recognized based on the invoiced amount.
For newsstand sales the Group involves a third party in provid-ing the newspapers or magazines. The Group is assessed to be principal, while revenue is recognized as gross and the commission to the third party is recognized as cost. The assessment is based on the fact that the Group has the risk in that the newspapers or magazines will not be sold and the right to establish the price.
The Group is acting as a principal for the distribution of film while the Group controls the film before distribution to the cus-tomer and therefore records royalty on a gross basis.
Revenue from distribution of TV is recognized on the invoiced amount from the operator.
The Group recognizes royalties for sale of rights of books on a gross basis, i.e., the royalties which are paid to authors are rec-ognized as costs and received royalties are recognized as revenue. The assessment is based on the fact that the Group has the right to decide the price and the risk for that the right should not be sold.
Receivables Receivables represents the Group’s right to an amount of con-sideration that is unconditional (i.e., only the passage of time is required before payment of the consideration is due). Receivables consists of Accounts receivables and Accrued income.
Contract liability If a customer pays consideration before the Group transfers goods or services to the customer, a contract liability is recognized. Contract liabilities are recognized for prepaid subscription, other advances from customers and deferred income.
Lease agreements – Group as lesseeLeases are classified as finance leases whenever the terms of the lease transfer substantially all the risks and rewards of ownership to the lessee. Other lease agreements are classified as operational leases.
Assets held under financial leases are initially recognized as non-current assets of the Group’s statement of financial position at their fair value at the inception of the lease or, if lower, at the present value of the minimum lease payments. The corresponding liability to the lessor is included in the statement of financial posi-tion as a finance lease obligation. Lease payments are apportioned between interest and the reduc-tion of the lease obligation so as to achieve a constant rate of inter-est on the remaining balance of the liability. The interest expense is recognized directly in the income statement. Non-current assets are depreciated over each asset’s useful life.
Foreign currencies Transactions in foreign currencies are recognized at the rates of exchange prevailing at the dates of the transactions. At the end of each reporting period, monetary items denominated in foreign currencies are translated at the rates prevailing at that date. Non-monetary items carried at fair value that are denominated in foreign currencies are translated at the rates prevailing at that date when the fair value was determined. Non-monetary items measured in terms of historical cost in a foreign currency are not translated.
Currency futures that are used for hedging and meet the re-quirements for hedge accounting are recognized at fair value in the
statement of financial position. The changes in fair value are recog-nized in other comprehensive income and are accumulated in the hedging reserve. When the hedged item is recognized in profit or loss, the accumulated fair value changes in the hedging reserve are reclassified to profit or loss through other comprehensive income.
For the purpose of presenting the consolidated financial state-ment, the assets and liabilities of the Group’s foreign subsidiaries are translated into Swedish krona using the exchange rates prevail-ing at the end of each reporting period. Income and expense items are translated at the average exchange rate for the period, unless the exchange rate has fluctuated significantly during that period, in which case the exchange rate at the date of transaction is used. Ex-change differences arising, are recognized in other comprehensive income and accumulated in the translation reserve. On disposal of a foreign subsidiary, such translation differences are recognized in the income statement as a part of the capital gain or loss.
Goodwill and fair value adjustments to identify assets acquired and liabilities assumed through acquisition of a foreign entity are treated as though these were assets and liabilities held by this entity and translated at the rate of exchange prevailing at the end of each reporting period.
Employee benefitsEmployee benefits including salaries, bonuses, holiday pay, paid sick leave, etc., and pensions are recognized as the related service is rendered. Pensions are classified as defined contribution or defined benefit pension plans.
The defined contribution planFor defined contribution pension plans, the Company pays fixed contributions into a separate, independent legal entity and the Group has no legal or constructive obligations to pay further con-tributions. Payments are recognized as an expense when employ-ees have rendered service entitling them to the contributions, this usually corresponds to when the contributions are due.
Defined benefit retirement benefit planFor defined benefit pension plans, the cost of providing benefits is determined using actuarial calculations in accordance with the Projected Unit Credit Method. Remeasurement, including actu-arial gains and losses, effects of changes to the asset ceiling and the return on plan assets (excluding the interest, which is recognized in the income statement), are reflected in other comprehensive income in the period in which they occur.
Remeasurement recognized in other comprehensive income is reflected directly in retained earnings and profit brought forward and will not be reclassified to the income statement. Past service cost is recognized in the income statement in the period of plan amendment. Net interest is calculated by applying the discount rate at the beginning of the period on the net defined liability or asset.
Defined benefit costs are categorized as follows:
- Service cost (including current service cost, past service costs as well as gains and losses on curtailments and/or settlements)
- Net interest expense or income
- Remeasurement
The first two categories are presented as personnel cost (current service cost) and as net financial income (net interest expense) in the income statement. Gains and losses referring to curtailments and settlements are accounted for as past service costs. Remea-surements are recognized in other comprehensive income.
The defined benefit pension obligation recognized in the state-ment of financial position represent the actual surplus or deficit in
NOTE 2 cont.
N O T E S TO T H E C O N S O L I D AT E D F I N A N C I A L S TAT E M E N T S

23bonnier ab annual report 2018
N O T E S TO T H E C O N S O L I D AT E D F I N A N C I A L S TAT E M E N T S
NOTE 2 cont.
the Group’s defined benefit plans. Any surplus resulting from this calculation is limited to the present value of any economic benefits available in the form of refunds from the plans or reductions in future contributions to the plans.
TaxThe tax expense comprises current and deferred tax.
Current tax Current tax is based on taxable profit for the period. Taxable profit differs from ‘profit before tax’ as reported in the income statements because of items of income or expense that are taxable or deduct-ible in other periods and items that are never taxable or deductible. The Group’s current tax is calculated using tax rates that have been enacted or substantively enacted by the end of the reporting period.
Deferred tax The carrying amount of deferred tax assets is reviewed at the end of each reporting period and reduced to the extent that it is no longer probable that sufficient taxable profits will be available to allow all or part of the asset to be recovered.
Intangible assetsSeparately acquired intangible assets Intangible assets with finite useful lives that have been acquired separately are carried at cost less accumulated amortization and any impairment losses. The estimated useful life and amortization method are reviewed at the end of each reporting period, with the effect of any changes in estimate being accounted for on a prospec-tive basis.
Film and program rights are usually accounted for as intan-gible assets when the program is available for viewing. The useful life for these rights is based on the license period or views and the useful life for these rights is based on license period or views, and normally amounts to no more than three years, but in certain cases to no more than five years. Intangible assets acquired through business combinationsIntangible assets acquired in a business combination are identi-fied and recognized separately from goodwill when they meet the definition of an intangible asset and when their fair value can be reliably measured. The cost of such intangible assets are comprised of their fair value at the acquisition date. Intangible assets with definite useful lives are amortized over the estimated useful life, usually a period of 2-10 years. Identified intangible assets with indefinite useful lives such as, for example, trademarks and dis-tribution rights are not amortized, but are tested for impairment annually or more frequently when there is an indication that the asset may be impaired. Subsequent to initial recognition, intan-gible assets acquired in a business combination are carried at cost less accumulated amortization and any accumulated impairment losses, on the same basis as separately acquired intangible assets.
Property, plant and equipmentProperty, plant and equipment are carried at cost less accumulated depreciation and any impairment losses.
Depreciation is recognized so as to write off the cost or valua-tion of assets less their residual values over their useful lives, using the straight-line method. The estimated useful lives are as follows:
Buildings and land improvements 20-100 yearsPlants and machinery 3-20 yearsEquipment, tools, fixtures and fittings 2-20 years
Impairment of property, plant and equipment and intangible assets other than goodwill At the end of each reporting period, the Group reviews the carrying amount of its property, plant and equipment and intangible assets, to determine whether there is any indication that those assets have suffered an impairment loss. If any such indication exists, the recoverable amount of the asset is estimated in order to determine the extent of the impairment loss (if any). When it is not possible to estimate the recoverable amount for an individual asset, the Group estimates the recoverable amount for the cash-generating unit to which the asset belongs.
Intangible assets with indefinite useful lives and intangible assets not yet available for use are tested for impairment at least annually, and whenever there is an indication that the asset may be impaired.
The recoverable amount is the higher of the fair value less cost of disposal and the value in use. In assessing the value in use, the estimated future cash flows are discounted to their present value, using a pre-tax discount rate that reflects current market assess-ment of the time value of money and the risks specific to the asset.
If the recoverable amount of an asset (or cash-generating unit) is determined to be an amount below the carrying amount, the carrying amount of the asset (or cash-generating unit) is reduced to its recoverable amount. An impairment loss is recognized in the income statements.
If an impairment loss subsequently reverses, the carrying amount of the asset (or the cash-generating unit) is increased to the revised estimate of its recoverable amount, but so that the increased carrying amount does not exceed the carrying amount that would have been determined if no impairment loss had been recognized for the asset (or the cash-generating unit) in prior years. A reversal of an impairment loss is recognized immediately in the income statement.
Financial instruments Recognition and derecognition Accounts receivables are initially recognized in the statement of financial position when they are originated. All other financial assets and financial liabilities are initially recognized in the state-ment of financial position when the Group becomes a party to the contractual provisions of the instrument. A financial asset or a part of a financial asset is derecognized when the contractual rights to the cash flows from the asset expire or when it transfers the financial asset and substantially all the risks and rewards of owner-ship of the asset to another party. A financial liability or a part of a financial liability is derecognized when the obligations have been discharged, cancelled or they expire.
Measurement Financial assets and financial liabilities that are not subsequently measured at fair value through the income statement are initially carried at fair value with additions and deductions for transaction costs. Accounts receivables are initially measured at the transac-tion price. Financial assets and financial liabilities that are subse-quently measured at fair value through the income statement are initially carried at fair value.
Equity instruments Investments in equity instruments are recognized at fair value to the income statement, “Other financial income and expenses.”
Accounts receivables Accounts receivables are amounts due from customers for goods sold or services performed in the ordinary course of business. Ac-counts receivables are initially measured at the transaction price and subsequently at amortized cost.

24bonnier ab annual report 2018
Liabilities to credit institutions and other borrowings Interest-bearing bank loans, credit lines and other liabilities are measured at amortized cost in accordance with the effective inter-est method. Any difference between the proceeds (net of transac-tion costs) and the redemption value is recognized in the income statement over the period of the borrowings.
Policy applicable before January 1,2018 Financial instruments are subsequently carried at amortized cost or fair value, depending on the instrument’s initial categorization in accordance with IAS 39.
Impairment Policy applicable before January 1, 2018 Financial assets are assessed for indicators of impairment at the end of each reporting period. Financial assets are considered to be impaired when there is objective evidence that, as a result of one or more events that occurred after the initial recognition of the financial asset, the estimated cash flows have been affected. Objec-tive evidence of impairment could include a significant financial difficulty of the counterparty or default in payment of outstanding amounts due.
Policy applicable from January 1, 2018 Accounts receivables The Group uses the historical observed default rates to calculate expected credit losses for trade receivables. The historical observed default rates are adjusted with current conditions and forward-looking information. At every reporting date, the historical observed default rates are updated and changes in the forward-looking estimates are analyzed.
Derivative instruments and hedge accounting The Group enters into derivative transactions to manage foreign exchange risk and interest risks. When possible, the Group applies hedge accounting. Derivatives are initially measured at fair value. Changes in the fair value of derivatives are recognized in either the net financial income/expenses or the operating profit, depending on the instrument’s purpose.
When a derivative is designated as a cash flow hedging instru-ment, the effective portion of changes in the fair value of the derivative is recognized in other comprehensive income and accu-mulated in the hedging reserve. Any ineffective portion of changes in the fair value of the derivative is recognized immediately in income statement.
Policy applicable before January 1, 2018 For hedged forecast transactions related to film and program rights, the accumulated amount in the hedging reserve is reclassi-fied to income statement in the same period which the assets are amortized.
Policy applicable from January 1, 2018 When the hedged forecast transaction subsequently results in the recognition of a nonfinancial item such as film and program rights, the amount accumulated in the hedging reserve and the cost of hedging reserve are included directly in the initial cost of the film and program rights when it is recognized. For all other hedged forecast transactions, the amount accumulated in the hedging reserve and the cost of hedging reserve are reclassified to income statement in the same period or periods during which the hedged expected future cash flows affect income statement.
Interest income or expense is recognized using the effective interest method. Dividend income is recognized in income state-ment on the date on which the Group’s right to receive payment is established. The “effective interest rate” is the rate that exactly
discounts estimated future cash payments or receipts through the expected life of the financial instrument.
Inventories Inventories are stated at the lower of cost and net realizable value. The cost is determined using the first-in, first-out method (FIFO). The cost of finished goods and work in progress consists of the purchase price, direct salary expenses, other direct manufacturing expenses and indirect expenses attributable to the item (based on normal manufacturing capacity). An item’s purchase price also includes transport expenses and other expenses attributable to moving the item to its current location and bringing the item to its current condition.
Net realizable value represent the estimated selling price less estimated cost of completion and cost necessary to make the sale.
ProvisionsProvisions are recognized when the Group has a present obligation (legal or constructive) as a result of a past event, it is probable that an outflow of resources will be required to settle the obligation and a reliable estimate can be made of the amount of the obligation.
The amount recognized as a provision is the best estimate of the consideration required to settle the present obligation at the end of the reporting period, taking into account the risks and uncertainties surrounding the obligation. When a provision is measured using the payments expected to be required to settle the obligation, its carrying amount is the present value of these payments.
When some or all of the economic benefits required to settle a provision are expected to be recovered from a third party, a receiv-able is recognized as an asset if it is virtually certain that reim-bursement will be received and the amount of the receivable can be measured reliably.
Group contributionGroup contribution received or paid to the parent company is recognized directly in equity with related tax effect.
Key definitionsA description of the Group’s definitions of key ratios may be found on page 59.
NOTE 2 cont.
N O T E S TO T H E C O N S O L I D AT E D F I N A N C I A L S TAT E M E N T S
25bonnier ab annual report 2018
The Bonnier Group is exposed to various types of financial risks. The Group’s financial risks are managed by Bonnier Finans in accordance with the financial policy that is reviewed and adopted by the Board. The financial policy strives to minimize the financial risks to which the Group is exposed, primarily liquidity and refinancing risks, interest rate risks, currency risks, credit risks and counterparty risks. Within Bonnier Finans there are instruc-tions, systems and a division of duties in place to achieve good in-ternal control and monitoring of the operations. Risk is monitored on Group level and is reported to the Board.
Liquidity and refinancing risks Liquidity risk refers to the risk that the Group will have difficulty in meeting future liquidity requirements in the form of payment obligations and will be unable to finance or refinance the Group’s assets. Refinancing risk refers to the inability of the Group to refi-nance outstanding debt at a given point in time and on acceptable terms.
In order to optimize the Group’s liquidity, there is a central-ized cash-management function. As of December 31, 2018, the Group achieved its liquidity goals, cash and cash equivalents, and unutilezed credit facility amounting to SEK 6,386 million (6,955).
Refinancing risk is managed by ensuring that no more than 33% of external borrowings1) mature within 12 months and by ensuring
that no more than 66% of external borrowings1) mature within 24 months. As of December 31, 2018, the maturity structure2) was 4% (24) within 12 months and 8% (29) within 24 months. The Group complies with these goals. The Group’s external loans include financial covenants which as of December 31, 2018 are complied with.
Information on current loans and credit facilities is also pro-vided in Note 26 Liabilities to credit institutions.
The terms to maturity for all contractual payment obligations related to the Group’s financial liabilities are presented in the following tables. The amounts refer to the contractual, undis-counted cash flows of the Group’s financial liabilities based on the remaining contracted maturities as of December 31, 2018. Variable interest flows are derived from interest rates at the end of reporting period. Cash flows in foreign currencies are converted to SEK at closing rate.
1) “External borrowings” means external liabilities including the unutilized portion of the credit facilities equal to the required liquidity goals.2) Loans that may be extended past the set due date, within the framework of the credit facilities, are deducted from external loans.
NOTE 4 Financial risk management and financial instruments
NOTE 3 Key sources of uncertainty in estimations
Below are the key assumptions concerning future development, as well as other important sources of uncertainty in the estimations at the balance sheet date which imply a significant risk of major adjustments in the carrying amount of assets and liabilities during the upcoming financial year.
Pension obligationsThe value of pension obligations for defined benefit pension plans is determined on the basis of actuarial calculations and is based on assumptions regarding the discount rate, expected return on plan assets, future salary increases, inflation and demographic circum-stances. Any change in these assumptions affects the calculated value of pension obligations.
The discount rate is the most significant assumption and is based on the market yields of high-quality corporate bonds with maturity dates matching those of the pension obligations. The Group’s defined benefit pension plans are primarily found in Swe-den and the Group has determined that mortgage bonds are com-parable with first-class corporate bonds, and therefore a selection of AAA-rated mortgage bonds are being used. A lower discount rate increases the present value of the pension obligation and their costs, while a higher discount rate has the opposite effect. Due to changing market conditions and economic circumstances, the underlying assumptions can deviate from the actual development and lead to significant changes in pension provisions.
The defined benefit pension plans, with deduction for any plan assets, are reported under Provisions for pensions. The reported net debt of the Group’s pension obligations amounted at the bal-ance sheet date to SEK 2,365 million (2,426). For more informa-tion, see Note 27 Pensions.
Testing for impairment of goodwill The carrying amount for consolidated goodwill is SEK 6,487 mil-lion (7,680). Goodwill is tested annually or whenever events or changes in circumstances indicate that the value of goodwill may have decreased. Recoverable amounts for cash-generating units have been determined by calculation of the value in use. These calculations involve certain estimates, above all regarding sales growth, operating margin and discount rate. The assumptions used are described in Note 15, Intangible assets.
Deferred tax assets Calculation of deferred tax assets necessarily involves assump-tions with regard to future taxable income. An assessment has been made of nondeductible expenses and nontaxable revenue in accordance with current tax rules. Changes in tax legislation in the countries in which the Group operates, as well as changes in inter-pretations and implementations under current legislation, may af-fect the amounts of the deferred tax assets. At every balance sheet date, an assessment is made of the likelihood as to whether the tax asset arising will be utilized. Where required, the carrying amount of the deferred tax asset is adjusted. The assessment may affect income for the period, either negatively or positively. Deferred tax assets amount to SEK 1,159 million (1,565). See also Note 13, Tax.
N O T E S TO T H E C O N S O L I D AT E D F I N A N C I A L S TAT E M E N T S
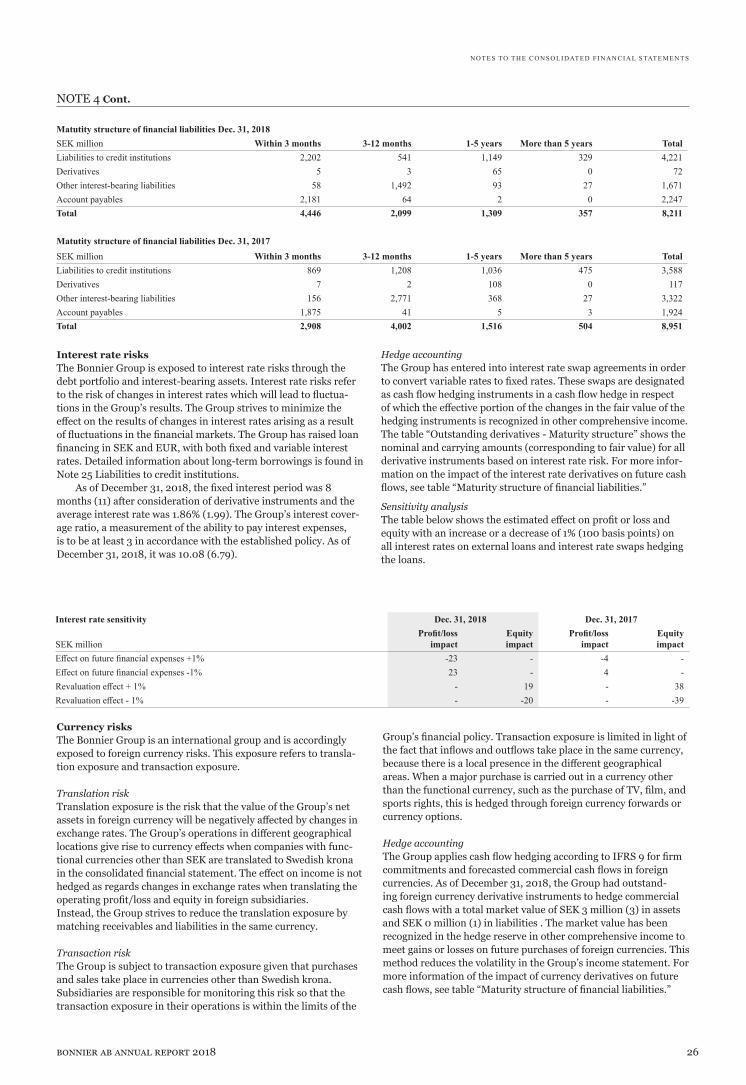
26bonnier ab annual report 2018
NOTE 4 Cont.
Currency risksThe Bonnier Group is an international group and is accordingly exposed to foreign currency risks. This exposure refers to transla-tion exposure and transaction exposure.
Translation riskTranslation exposure is the risk that the value of the Group’s net assets in foreign currency will be negatively affected by changes in exchange rates. The Group’s operations in different geographical locations give rise to currency effects when companies with func-tional currencies other than SEK are translated to Swedish krona in the consolidated financial statement. The effect on income is not hedged as regards changes in exchange rates when translating the operating profit/loss and equity in foreign subsidiaries.Instead, the Group strives to reduce the translation exposure by matching receivables and liabilities in the same currency.
Transaction riskThe Group is subject to transaction exposure given that purchases and sales take place in currencies other than Swedish krona. Subsidiaries are responsible for monitoring this risk so that the transaction exposure in their operations is within the limits of the
Hedge accountingThe Group has entered into interest rate swap agreements in order to convert variable rates to fixed rates. These swaps are designated as cash flow hedging instruments in a cash flow hedge in respect of which the effective portion of the changes in the fair value of the hedging instruments is recognized in other comprehensive income. The table “Outstanding derivatives - Maturity structure” shows the nominal and carrying amounts (corresponding to fair value) for all derivative instruments based on interest rate risk. For more infor-mation on the impact of the interest rate derivatives on future cash flows, see table “Maturity structure of financial liabilities.”
Interest rate risksThe Bonnier Group is exposed to interest rate risks through the debt portfolio and interest-bearing assets. Interest rate risks refer to the risk of changes in interest rates which will lead to fluctua-tions in the Group’s results. The Group strives to minimize the effect on the results of changes in interest rates arising as a result of fluctuations in the financial markets. The Group has raised loan financing in SEK and EUR, with both fixed and variable interest rates. Detailed information about long-term borrowings is found in Note 25 Liabilities to credit institutions.
As of December 31, 2018, the fixed interest period was 8 months (11) after consideration of derivative instruments and the average interest rate was 1.86% (1.99). The Group’s interest cover-age ratio, a measurement of the ability to pay interest expenses, is to be at least 3 in accordance with the established policy. As of December 31, 2018, it was 10.08 (6.79).
Interest rate sensitivity Dec. 31, 2018 Dec. 31, 2017
SEK millionProfit/loss
impactEquityimpact
Profit/lossimpact
Equityimpact
Effect on future financial expenses +1% -23 - -4 -Effect on future financial expenses -1% 23 - 4 -Revaluation effect + 1% - 19 - 38Revaluation effect - 1% - -20 - -39
Sensitivity analysis The table below shows the estimated effect on profit or loss and equity with an increase or a decrease of 1% (100 basis points) on all interest rates on external loans and interest rate swaps hedging the loans.
N O T E S TO T H E C O N S O L I D AT E D F I N A N C I A L S TAT E M E N T S
Group’s financial policy. Transaction exposure is limited in light of the fact that inflows and outflows take place in the same currency, because there is a local presence in the different geographical areas. When a major purchase is carried out in a currency other than the functional currency, such as the purchase of TV, film, and sports rights, this is hedged through foreign currency forwards or currency options.
Hedge accountingThe Group applies cash flow hedging according to IFRS 9 for firm commitments and forecasted commercial cash flows in foreign currencies. As of December 31, 2018, the Group had outstand-ing foreign currency derivative instruments to hedge commercial cash flows with a total market value of SEK 3 million (3) in assets and SEK 0 million (1) in liabilities . The market value has been recognized in the hedge reserve in other comprehensive income to meet gains or losses on future purchases of foreign currencies. This method reduces the volatility in the Group’s income statement. For more information of the impact of currency derivatives on future cash flows, see table “Maturity structure of financial liabilities.”
Matutity structure of financial liabilities Dec. 31, 2018SEK million Within 3 months 3-12 months 1-5 years More than 5 years TotalLiabilities to credit institutions 2,202 541 1,149 329 4,221Derivatives 5 3 65 0 72Other interest-bearing liabilities 58 1,492 93 27 1,671Account payables 2,181 64 2 0 2,247Total 4,446 2,099 1,309 357 8,211
Matutity structure of financial liabilities Dec. 31, 2017SEK million Within 3 months 3-12 months 1-5 years More than 5 years TotalLiabilities to credit institutions 869 1,208 1,036 475 3,588Derivatives 7 2 108 0 117Other interest-bearing liabilities 156 2,771 368 27 3,322Account payables 1,875 41 5 3 1,924Total 2,908 4,002 1,516 504 8,951

27bonnier ab annual report 2018
Sensitivity analysisThe table below shows the effect of a weakening or strengthening of ten basis points of SEK against EUR and USD, and also EUR against USD which are the currencies to which the Group is most exposed in terms of transaction exposure.
Sensitivity to transaction exposureDec. 31, 2018 Dec. 31, 2017
SEK million Profit/loss impact Equity impact Profit/loss impact Equity impactEUR/SEK + 10% -4 - -1 3EUR/SEK - 10% 4 - 1 -3USD/SEK + 10% 6 10 14 13USD/SEK - 10% -5 -9 -13 -12USD/EUR + 10% - 7 -1 -USD/EUR - 10% - -6 2 -
NOTE 4 Cont.
Credit risks and counterparty risks Credit risk refers to the risk of that a counterparty will default on its obligations to the Group, resulting in credit losses. Credit risk is divided into financial credit risks and operational risks.
Financial credit risk is the risk that banks or other financial institutions with which the Group has financial investments, liquidity or other investments in financial assets will be unable to meet their obligations to the Group, which can lead to a credit loss. The Group’s policy regarding credit risks associated with financial transactions provides that only well established counter-parties with high credit ratings may be used. Each counterparty is assigned a separate credit limit to decrease risk concentration.
During the year, the credit losses amounted to SEK 0 million (11).The credit risk on accounts receivable is that the Group would not receive payment for recognized account receivables. To prevent this, there are procedures for the follow up of these items and, for larger sales amounts, credit information is obtained. The Group’s accounts receivable are spread among a large number of custom-ers, both private individuals and businesses. An age analysis for accounts receivable is presented in Note 22.
The Group’s maximum exposure to credit risks is deemed to correspond to the carrying value of all financial assets and, on December 31, 2018, amounted to SEK 4,092 million (4,149).
Outstanding derivatives - Maturity structureFair value Dec. 31, 2018 Dec. 31, 2017SEK million
AssetsNominal amount Liabilities
Nominal amount Assets Liabilities
Interest rate derivatives Within 3 months - - - 400 - 1Between 3-12 months - - - - - -Between 1-5 years - - 65 1,400 - 108More than 5 years - - - - - -Total - 65 - 109
of which cash flow hedges - 65 - 109
Currency derivativesWithin 3 months 32 3,048 4 635 51 6Between 3-12 months 11 179 3 94 3 2Between 1-5 years - - - - - -More than 5 years - - - - - -Total 43 7 54 9
of which cash flow hedges 3 0 3 1
Dec. 31, 2018 Dec. 31, 2017SEK million Assets Liabilities Assets LiabilitiesGross value of derivatives recognized in the
statement of financial position 43 72 54 117Offset amount -42 -42 -37 -37Net position 1 30 17 80
Offset of financial assets and liabilitiesAll financial assets or liabilities are recognized gross in the statement of financial position. Derivatives are covered by ISDA agreements, which implies the right of offset between assets and
liabilities with the same counterparty, e.g. insolvency under certain conditions. Derivatives subject to netting agreements are shown in the table below.
N O T E S TO T H E C O N S O L I D AT E D F I N A N C I A L S TAT E M E N T S

28bonnier ab annual report 2018
NOTE 4 Cont.
Fair valueFinancial assets and financial liabilities carried at fair value are classified in one of the three levels in the fair-value hierarchy, based on the information used to determine the fair value. All of the Group’s financial assets and liabilities carried at fair value are classified according to Level 2, with the exceptions of contingent considerations and liabilities attributable to put options in non-controlling interests and unlisted equity instruments classified at Level 3.
For the Group’s other financial assets and liabilities, the car-rying amounts are deemed to comprise a good approximation of the fair values, except for the bond loans, where the fair value in the preceding year was SEK 1,205 million. A calculation of fair value based on discounted future cash flows, where a discount rate reflecting the counterparty’s credit risks represents the most significant input data, is not expected to result in any significant difference, compared with the carrying value.
Valuation of derivatives (Level 2)Valuation in accordance with Level 2 is performed by using observ-able market data at the end of the reporting period. The fair value of interest rate swaps is determined by discounting estimated future cash flows, based on yield curves at the closing date. The fair value of each foreign currency contract is determined by the interest rate differential in the spot rate and the rate at the future date in each currency at closing date. The value is determined by discounting the actual forward rates at the closing date.
Measurement of unlisted equity instruments (Level 3) The fair value of unlisted equity instruments is based on discount-ing future cash flows using a risk-adjusted interest rate and the val-ue of the most recent transactions or capital raises in the holdings. Important assumptions in discounting are the discount rate and future cash flows. Measurements are performed continuously dur-ing the year and on the occasions of transactions and capital raises. The fair value would increase/decrease if the anticipated cash flows were to be higher/lower, or if the risk-adjusted interest rate were to be lower/higher.
Capital managementThe capital management objectives of the Group are to minimize the effect on its financial position of fluctuations on the financial markets by securing the Group’s short- and long-term capital re-quirement by ensuring that liquidity management is as efficient as possible, and by hedging interest rate and currency risks in order to minimize the effect on the Group’s profit/loss and cash flow by minimizing fluctuations in profit/loss due to volatility in the financial markets. The Group defines capital as net debt and equity including non-controlling interests. Net debt amounted on Decem-ber 31, 2018, to SEK 7,743 million (8,553) and equity amounted to SEK 3,650 million (3,921).
The Group monitors capital management by following various key ratios such as debt ratios and interest coverage ratios.
1) The revaluation effect of foreign exchange derivatives that are not used for ahedging relationship are shown in Note 12.
2) During the year, SEK 0 million (24) of the foreign exchange derivatives designatedas cash flow hedges of commercial cash flows was realized and recognized in operating profit. As regards interest rate derivatives, the total effect on the profit or loss total to SEK -51 million (-62), see Note 12 for more information. Ineffective cash flow hedges reported in Financial income and expenses amount to SEK 0 million (-2).
3) The impact of measuring equity instruments at fair value was SEK 54 million on opening balances January 1, 2018
There have been no transfers between the levels during the periods.
N O T E S TO T H E C O N S O L I D AT E D F I N A N C I A L S TAT E M E N T S
Carrying amounts and fair values of financial assets and liabilitiesDec. 31, 2018 Dec. 31, 2017
SEK millionCarrying
amountCarrying
amountFINANCIAL ASSETS IFRS 9/IAS 39 Measured at amortized cost/ Loan receivables and account receivables Account receivables 2,632 2,798Other receivables 536 484Cash and cash equivalents 286 472
Measured at fair value through income statement or other comprehensive income/ Financial assets measured at fair value Derivatives 1) 2) Level 2 43 54
Measured at fair value through income statement/ Loan receivables and account receivables Equity instruments 3) Level 3 595 341
Total financial assets 4,092 4,149
FINANCIAL LIABILITIES IFRS 9/IAS 39 Measured at amortized cost/ Financial liabili-ties measured at amortized cost Liabilities to credit institutions Level 2 4,171 3,544
Measured at fair value through income statement or other comprehensive income/ Financial liabilities measured at fair value Derivatives 1) 2) Level 2 72 117Contingent considerations Level 3 72 107
Measured at fair value through income statement or equity liabilities attributable to put options in noncontrolling interests Level 3 61 276
Measured at amortized cost/ Financial liabili-ties measured at amortized cost Account payables 2,247 1,924Subscription liabilities and other advance payments from customers 978 990Other liabilities 2,013 3,339
Total financial liabilities 9,614 10,297

29bonnier ab annual report 2018
N O T E S TO T H E C O N S O L I D AT E D F I N A N C I A L S TAT E M E N T S
NOTE 5 Distribution of net sales
BooksSweden Other Nordic countries1) Europe Other Total
SEK million 2018 2017 2018 2017 2018 2017 2018 2017 2018 2017Advertising - - - - - - - - - -Subscription 251 255 232 185 6 0 0 0 489 441Goods 733 835 1,052 1,067 2,950 2,664 317 485 5,052 5,051Digital distribution 160 140 66 58 327 269 1 4 554 472Film - - - - - - - - - -Other 21 34 46 85 4 5 2 1 72 125Net sales, external 1,165 1,264 1,395 1,395 3,286 2,940 321 490 6,167 6,089
Net sales, group 167 186Total net sales 6,334 6,274
1) Business area Books includes 50% of the revenue at Cappelen Damm. Cappelen Damm is recognized as a joint venture within the Group using the equity method and the revenue is eliminated in Other.
E-commerceSweden Other Nordic countries Europe Other Total
SEK million 2018 2017 2018 2017 2018 2017 2018 2017 2018 2017Advertising - - - - - - - - - -Subscription - - - - - - - - - -Goods 1,587 1,398 589 528 - - - - 2,176 1,926Digital distribution 29 35 8 8 - - - - 37 43Film - - - - - - - - - -Other 23 24 5 1 1 0 - - 28 25Net sales, external 1,638 1,457 602 537 1 0 - - 2 ,242 1,994
Net sales, group 6 8Total net sales 2,247 2,002
BroadcastingSweden Other Nordic countries Europe Other Total
SEK million 2018 2017 2018 2017 2018 2017 2018 2017 2018 2017Advertising 3,972 3,615 1,305 1,216 24 40 21 12 5,323 4,883Subscription 558 365 183 105 - - - - 741 469Goods 23 17 2 4 - - - - 25 21Digital distribution 941 813 544 536 - - - - 1,486 1,349Film 27 51 0 4 - - - - 27 55Other 503 567 35 59 1 3 - - 539 629Net sales, external 6,024 5,427 2,070 1,923 25 43 21 12 8,140 7,405
Net sales, group 113 92Total net sales 8,253 7,497
Film StudiosSweden Other Nordic countries Europe Other Total
SEK million 2018 2017 2018 2017 2018 2017 2018 2017 2018 2017Advertising - - - - - - - - - -Subscription 11 6 2 2 - - - - 13 7Goods 37 45 43 34 - 0 0 - 80 79Digital distribution 230 168 145 153 12 12 - - 386 333Film 200 195 418 576 40 40 14 24 671 835Other 54 41 10 32 0 1 0 0 64 73Net sales, external 531 455 618 796 52 54 14 24 1,215 1,329
Net sales, group 41 60Total net sales 1,256 1,389
VenturesSweden Other Nordic countries Europe Other Total
SEK million 2018 2017 2018 2017 2018 2017 2018 2017 2018 2017Advertising 7 12 - 0 - 0 - - 7 12Subscription - - - - - - - - - -Goods 0 5 - - 0 - - - 1 5Digital distribution 10 101 - - - - - - 10 101Film - - - - - - - - - -Other 264 224 65 54 2 1 0 1 330 279Net sales, external 282 342 65 54 2 1 0 1 349 397
Net sales, group 10 5Total net sales 358 402
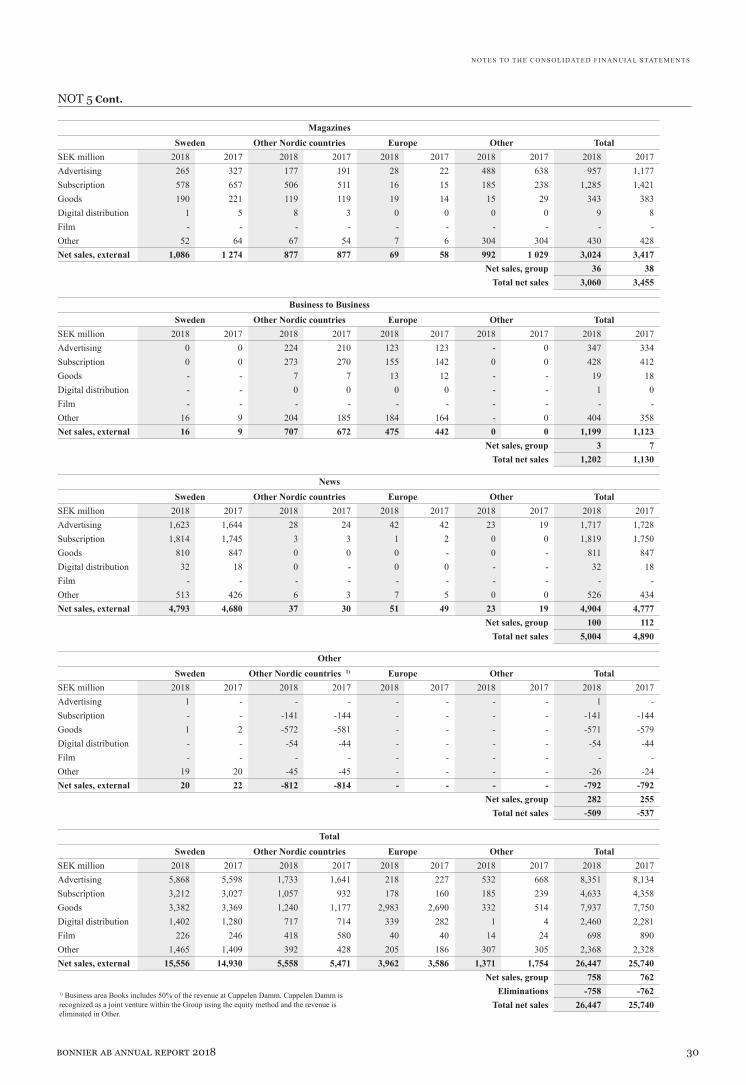
30bonnier ab annual report 2018
NOT 5 Cont.
MagazinesSweden Other Nordic countries Europe Other Total
SEK million 2018 2017 2018 2017 2018 2017 2018 2017 2018 2017Advertising 265 327 177 191 28 22 488 638 957 1,177Subscription 578 657 506 511 16 15 185 238 1,285 1,421Goods 190 221 119 119 19 14 15 29 343 383Digital distribution 1 5 8 3 0 0 0 0 9 8Film - - - - - - - - - -Other 52 64 67 54 7 6 304 304 430 428Net sales, external 1,086 1 274 877 877 69 58 992 1 029 3,024 3,417
Net sales, group 36 38Total net sales 3,060 3,455
Business to BusinessSweden Other Nordic countries Europe Other Total
SEK million 2018 2017 2018 2017 2018 2017 2018 2017 2018 2017Advertising 0 0 224 210 123 123 - 0 347 334Subscription 0 0 273 270 155 142 0 0 428 412Goods - - 7 7 13 12 - - 19 18Digital distribution - - 0 0 0 0 - - 1 0Film - - - - - - - - - -Other 16 9 204 185 184 164 - 0 404 358Net sales, external 16 9 707 672 475 442 0 0 1,199 1,123
Net sales, group 3 7Total net sales 1,202 1,130
NewsSweden Other Nordic countries Europe Other Total
SEK million 2018 2017 2018 2017 2018 2017 2018 2017 2018 2017Advertising 1,623 1,644 28 24 42 42 23 19 1,717 1,728Subscription 1,814 1,745 3 3 1 2 0 0 1,819 1,750Goods 810 847 0 0 0 - 0 - 811 847Digital distribution 32 18 0 - 0 0 - - 32 18Film - - - - - - - - - -Other 513 426 6 3 7 5 0 0 526 434Net sales, external 4,793 4,680 37 30 51 49 23 19 4,904 4,777
Net sales, group 100 112Total net sales 5,004 4,890
Other Sweden Other Nordic countries 1) Europe Other Total
SEK million 2018 2017 2018 2017 2018 2017 2018 2017 2018 2017Advertising 1 - - - - - - - 1 -Subscription - - -141 -144 - - - - -141 -144Goods 1 2 -572 -581 - - - - -571 -579Digital distribution - - -54 -44 - - - - -54 -44Film - - - - - - - - - -Other 19 20 -45 -45 - - - - -26 -24Net sales, external 20 22 -812 -814 - - - - -792 -792
Net sales, group 282 255Total net sales -509 -537
TotalSweden Other Nordic countries Europe Other Total
SEK million 2018 2017 2018 2017 2018 2017 2018 2017 2018 2017Advertising 5,868 5,598 1,733 1,641 218 227 532 668 8,351 8,134Subscription 3,212 3,027 1,057 932 178 160 185 239 4,633 4,358Goods 3,382 3,369 1,240 1,177 2,983 2,690 332 514 7,937 7,750Digital distribution 1,402 1,280 717 714 339 282 1 4 2,460 2,281Film 226 246 418 580 40 40 14 24 698 890Other 1,465 1,409 392 428 205 186 307 305 2,368 2,328Net sales, external 15,556 14,930 5,558 5,471 3,962 3,586 1,371 1,754 26,447 25,740
Net sales, group 758 762Eliminations -758 -762
Total net sales 26,447 25,7401) Business area Books includes 50% of the revenue at Cappelen Damm. Cappelen Damm is recognized as a joint venture within the Group using the equity method and the revenue is eliminated in Other.
N O T E S TO T H E C O N S O L I D AT E D F I N A N C I A L S TAT E M E N T S

31bonnier ab annual report 2018
Average number of employees 2018 2017Number of employees
of whom women, %
Number of employees
of whom women, %
Bonnier AB 47 58 45 51SubsidiariesSweden 5,067 47 4,443 49Denmark 765 52 768 52Germany 632 75 591 74Finland 538 66 592 65United States 378 51 522 51United Kingdom 349 67 353 65Poland 281 57 266 42Estonia 210 69 203 73Norway 130 62 133 61Lithuania 125 70 128 70Slovenia 103 68 104 67France 56 50 59 54Australia 14 79 32 81Croatia 14 43 6 33Malta 13 30 83 30China 3 67 3 67Luxembourg 3 33 3 33Austria 1 0 9 22Subsidiaries 8,681 53 8,298 54Group 8,727 53 8,343 54
NOTE 6 Personnel
Board members and senior executives Dec. 31, 2018 Dec. 31, 2017Number of employees
of whom women, %
Number of employees
of whom women, %
Bonnier ABBoard members 4 25 10 30CEO and other senior executives 6 17 11 18Group totalBoard members 660 22 664 25CEO and other senior executives 461 34 479 37
Wages, salaries, other remuneration and social security costs2018 2017
SEK million
Wages/salaries and other
remunerationSocial
security costs
Special payroll tax and tax
return on pension Pension costs
Wages/salaries and other
remunerationSocial
security costs
Special payroll tax and tax
return on pension Pension costs
Bonnier AB 69 22 7 19 70 22 5 14Subsidiaries 4,999 1,114 27 238 4,665 1,012 81 443Group total 5,068 1,136 33 257 4,735 1,035 85 457
Remuneration to Board members, CEO, and other employees2018 2017
SEK millionBoard members
and CEO 2)Of which
variable salaries Other employeesBoard members
and CEO Of which
variable salaries Other employeesBonnier AB 1) 10 1 59 13 4 57Subsidiaries 212 46 4,787 210 45 4,455Group total 222 47 4,846 223 49 4,5121) The composition of the Board of Directors changed considerably during 2018. Total remunera-tion to the Board of Directors and CEO includes remuneration to the present and former Board of Directors and CEO.
2) For information regarding restructuring costs relating to the CEO of Bonnier AB, see Note 7.
N O T E S TO T H E C O N S O L I D AT E D F I N A N C I A L S TAT E M E N T S

32bonnier ab annual report 2018
NOTE 8 Lease agreements
Operational lease agreementsOperational lease agreements, costs for the yearSEK million 2018 2017Minimum lease fees 767 702Total 767 702
The lease contracts mainly refer to rental of premises. As at the balance sheet date, there were outstanding commit-
ments in the form of minimum leasing fees under non-cancellable operating lease contracts, with maturity dates as follows:
SEK million Dec. 31, 2018 Dec. 31, 2017Within 1 year 562 604Between 1-5 years 1,324 1,418More than 5 years 570 424Total 2,457 2,446
NOTE 7 Restructuring cost
SEK million 2018 2017Restructuring costs, employees 114 124Restructuring costs, other 92 32Total 205 156
N O T E S TO T H E C O N S O L I D AT E D F I N A N C I A L S TAT E M E N T S
Severance pay and term of notice The period of notice for the CEO is 12 months when initiated by both the company and the CEO. No severance pay is paid. For oth-er senior executives, the period of notice varies, mainly between 6 and 12 months. The term of notice is regulated by agreements and, in addition, there are severance pay agreements in some cases.
PensionsThe retirement age for the CEO is 65 years and the pension premi-ums shall amount to 30% of pensionable salary. Pensionable salary means base salary. For other senior executives, the retirement age varies between 60 and 65 years.
The Parent Company’s pension costs for present and former Boards of Directors and CEOs amount to SEK 0.9 million (3.1).The Parent Company’s pension commitments to these individuals amounts to SEK 85.9 million (89.7).
The Group’s pension costs for the Board of Directors and CEOs amount to SEK 17 million (26). The Group’s pension commitments to these individuals amount to SEK 167 million (199).
During the year, pension amounts were adjusted and frozen; see also Note 27.
NOTE 6 cont.
The restructuring costs related to personnel in 2018 were SEK 38 million attributable to the Parent Company Bonnier AB, including SEK 7 million in salaries and other remuneration and SEK 2 mil-lion in pensions for the company’s former CEO.

33bonnier ab annual report 2018
NOTE 10 Profit or loss from participations in associated companies and joint ventures
NOTE 11 Items related to acquisitions, divestments and close-downs together with amortization/impairment losses of group excess values NOTE 12 Financial income and expenses
Operating profit or loss Net financials Tax TotalSEK million 2018 2017 2018 2017 2018 2017 2018 2017Associated companiesBorås Tidning Tryckeri AB 5 7 0 0 -1 -2 4 5Other 43 17 0 0 -7 -8 35 9
48 24 0 0 -9 -9 39 15
Joint venturesCappelen Damm Holding AS -25 46 -5 -7 8 -11 -23 29
-25 46 -5 -7 8 -11 -23 29
Total associated companies andjoint ventures 22 71 -5 -7 -1 -20 16 44
SEK million 2018 2017Capital gains on divestments and
close-downs of operations 226 23Capital losses on divestments and
close-downs of operations -196 -Transaction costs on acquisitions -2 -4Change of future consideration 1 36Restructuring costs attributable to acquisitions and divestments - -16Impairment losses of operations during
close-downs 1) -112 -372Depreciation, amortization and
impairment losses of group excess values -18 -122Impairment losses of goodwill 2) -853 -1,627Other -94 33Total -1,049 -2,049
SEK million 2018 2017Interest income on assets measured at
amortized cost 13 12 Interest income 13 12
Interest expenses on financial liabilitiesmeasured at amortized cost -69 -77
Interest expenses on derivatives designated ashedging instruments -51 -62
Interest expenses on pensions, net -66 -63 Interest expenses -186 -202Net interest income/expenses -173 -190
Derivatives, non-hedge accounting,changes in fair value -15 18
Ineffective cash flow hedges 0 -2Gains/losses on equity instruments
measured at fair value through the income statement 58 -
Impairment losses on financial assets - -11Other -22 -21Other financial income and expenses 21 -15Net financial income/expenses from
participations in associated companies and joint ventures -5 -7
Net financial income/expenses -157 -212
NOTE 9 Fees to auditors
SEK million 2018 2017PricewaterhouseCoopers Audit assignment 26 21Audit-related activities in addition to
audit assignment 2 1Tax advice 0 1Other services 10 10
Other auditorsAudit assignment 3 3Audit-related activities in addition to
audit assignment 0 0Tax advice 3 2Other services 0 0Total 44 39
N O T E S TO T H E C O N S O L I D AT E D F I N A N C I A L S TAT E M E N T S
2) For information about impairment losses of goodwill, see Note 14, Intangible assets.
1) In 2017, impairment losses were made attributable to the Group’s operations in Australia and France within the business area Books. The impairment losses amount to SEK 372 million and were mainly attributable to inventory. The impairment losses were mainly due to the fact that the operations in Australia and France are under the process of close-down. In 2018 additional impair-ment losses were made, mainly in Australia.
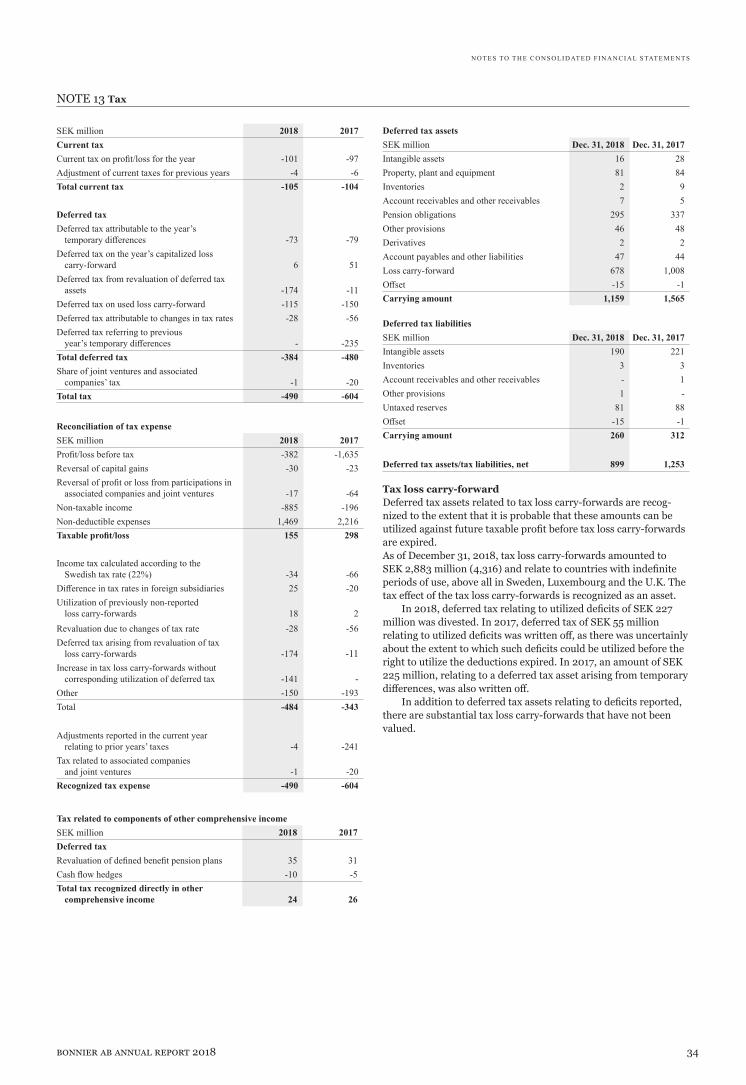
34bonnier ab annual report 2018
NOTE 13 Tax
SEK million 2018 2017Current taxCurrent tax on profit/loss for the year -101 -97Adjustment of current taxes for previous years -4 -6Total current tax -105 -104
Deferred taxDeferred tax attributable to the year’s
temporary differences -73 -79Deferred tax on the year’s capitalized loss
carry-forward 6 51Deferred tax from revaluation of deferred tax
assets -174 -11Deferred tax on used loss carry-forward -115 -150Deferred tax attributable to changes in tax rates -28 -56Deferred tax referring to previous
year’s temporary differences - -235Total deferred tax -384 -480Share of joint ventures and associated
companies’ tax -1 -20Total tax -490 -604
Reconciliation of tax expenseSEK million 2018 2017Profit/loss before tax -382 -1,635Reversal of capital gains -30 -23Reversal of profit or loss from participations in
associated companies and joint ventures -17 -64Non-taxable income -885 -196Non-deductible expenses 1,469 2,216Taxable profit/loss 155 298
Income tax calculated according to theSwedish tax rate (22%) -34 -66
Difference in tax rates in foreign subsidiaries 25 -20Utilization of previously non-reported
loss carry-forwards 18 2Revaluation due to changes of tax rate -28 -56Deferred tax arising from revaluation of tax
loss carry-forwards -174 -11Increase in tax loss carry-forwards without
corresponding utilization of deferred tax -141 -Other -150 -193Total -484 -343
Adjustments reported in the current yearrelating to prior years’ taxes -4 -241
Tax related to associated companiesand joint ventures -1 -20
Recognized tax expense -490 -604
Tax related to components of other comprehensive incomeSEK million 2018 2017Deferred taxRevaluation of defined benefit pension plans 35 31Cash flow hedges -10 -5Total tax recognized directly in other
comprehensive income 24 26
Deferred tax assetsSEK million Dec. 31, 2018 Dec. 31, 2017Intangible assets 16 28Property, plant and equipment 81 84Inventories 2 9Account receivables and other receivables 7 5Pension obligations 295 337Other provisions 46 48Derivatives 2 2Account payables and other liabilities 47 44Loss carry-forward 678 1,008Offset -15 -1Carrying amount 1,159 1,565
Deferred tax liabilitiesSEK million Dec. 31, 2018 Dec. 31, 2017Intangible assets 190 221Inventories 3 3Account receivables and other receivables - 1Other provisions 1 -Untaxed reserves 81 88Offset -15 -1Carrying amount 260 312
Deferred tax assets/tax liabilities, net 899 1,253
Tax loss carry-forward Deferred tax assets related to tax loss carry-forwards are recog-nized to the extent that it is probable that these amounts can be utilized against future taxable profit before tax loss carry-forwards are expired.As of December 31, 2018, tax loss carry-forwards amounted to SEK 2,883 million (4,316) and relate to countries with indefinite periods of use, above all in Sweden, Luxembourg and the U.K. The tax effect of the tax loss carry-forwards is recognized as an asset.
In 2018, deferred tax relating to utilized deficits of SEK 227 million was divested. In 2017, deferred tax of SEK 55 million relating to utilized deficits was written off, as there was uncertainly about the extent to which such deficits could be utilized before the right to utilize the deductions expired. In 2017, an amount of SEK 225 million, relating to a deferred tax asset arising from temporary differences, was also written off.
In addition to deferred tax assets relating to deficits reported, there are substantial tax loss carry-forwards that have not been valued.
N O T E S TO T H E C O N S O L I D AT E D F I N A N C I A L S TAT E M E N T S

35bonnier ab annual report 2018
NOTE 14 Intangible assets
GoodwillFilm and program
rightsOther intangible
assets Total SEK million 2018 2017 2018 2017 2018 2017 2018 2017CostOpening balance 9,465 9,003 3,750 4,581 2,900 2,671 16,115 16,255Adjustment for changed accounting policy 1) - - -46 - - - -46 -Adjusted opening balance 1) 9,465 9,003 3,703 4,581 2,900 2,671 16,069 16,255Investments 58 603 4,175 3,545 369 428 4,602 4,576Sales and disposals -224 - -3,920 -4,502 -34 -220 -4,178 -4,722Acquisitions and divestments
of companies 3 - -139 12 -136 12Reclassifications - - 1,908 55 70 16 1,978 71Translation differences 276 -140 124 71 68 -7 468 -76Closing balance1) 9,575 9,465 5,994 3,750 3,235 2,900 18,804 16,115
AmortizationOpening balance -1,582 -2,626 -1,430 -1,279 -3,012 -3,905Adjustment for changed accounting policy 1) 39 - - - 39 -Adjusted opening balance 1) -1,542 -2,626 -1,430 -1,279 -2,972 -3,905Sales and disposals 3,917 4,502 29 188 3,945 4,690Acquisitions and divestments
of companies - - 41 -3 41 -3Amortization for the year -3,881 -3,405 -366 -348 -4,247 -3,753Reclassifications -1,675 - -19 7 -1,693 7Translation differences -97 -53 -40 5 -137 -48Closing balance -3,279 -1,582 -1,784 -1,430 -5,063 -3,012
ImpairmentOpening balance -1,785 -175 0 0 -141 -33 -1,927 -208Sales and disposals 103 - - - 0 31 103 31Acquisitions and divestments
of companies - - 3 -1 3 -1Impairment losses for the year and reversed impairments -853 -1,627 - - -24 -138 -877 -1,765Reclassifications -38 - - - 1 - -37 -Translation differences -154 16 - - -7 0 -161 16Closing balance -2,728 -1,785 0 0 -169 -141 2,897 -1,927
Carrying amount, December 31 6,847 7,680 2,715 2,168 1,282 1,328 10,844 11,176
GoodwillBusiness area Dec. 31, 2018 Dec. 31, 2017Books 2) 642 1,016E-commerce 2) 203 -Broadcasting 4,720 4,673Film Studios 2) 19 -Growth Media 2) - 27Ventures 2) 0 -Magazines 381 899Business to Business 3) 448 519News 3) 434 545Carrying amount 6,847 7,680
The Group’s contractual commitments regarding future payments for contractual rights amounted to SEK 7,552 million (8,435) as of December 31, 2018. The carrying amount of intangible assets with indefinite useful lives, excluding goodwill, amounted to SEK 390 million (421). These assets in the form of trademarks have a strong position in each of their markets and the cash flows are not expected to change within the forseeable future. Film and program rights include advance payments of SEK 1,070 million (1,236).
Impairment testGoodwill and other intangible assets with indefinite useful lives acquired in a business combination is allocated to each cash-gen-erating unit of the Group expected to benefit from the acquisition. Goodwill has been allocated as follows:
The recoverable value for a cash-generating unit at impairment testing of goodwill and other intangible assets with indefinite use-ful lives are determined based on a value-in-use. The calculation which uses cash flow projections based on financial budgets ap-proved by management covering a 5-year period. The key assump-
N O T E S TO T H E C O N S O L I D AT E D F I N A N C I A L S TAT E M E N T S
TrademarkBusiness area Dec. 31, 2018 Dec. 31, 2017Broadcasting 350 350Growth Media 2) - 71Film Studios 2) 40 -Carrying amount 390 421
3) In 2017, goodwill was transferred from Business to Business to News attributable to a transfer between the business areas.
2) As of January 1, 2018, the Group consists of eight business areas. E-commerce was formerly part of Books and the former Growth Media has been split into Film Studios and Ventures.
1) Adjusted to reflect the impact of changed accounting policy for financial instruments. For further information, see Note 2.
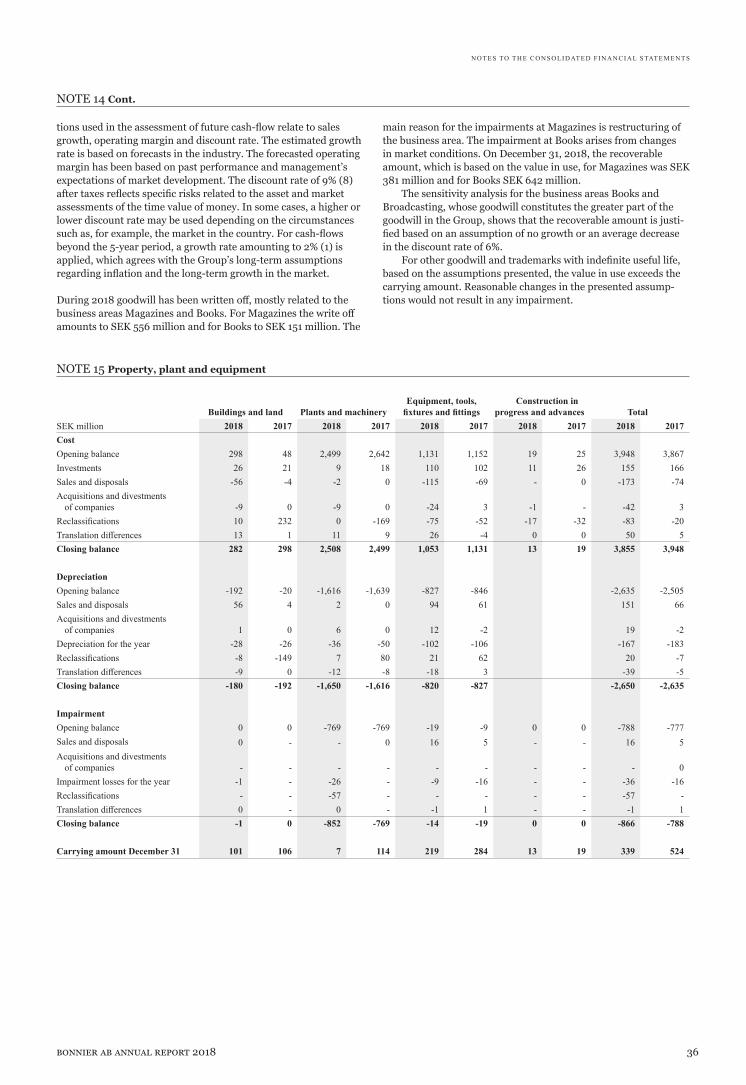
36bonnier ab annual report 2018
NOTE 15 Property, plant and equipment
Buildings and land Plants and machineryEquipment, tools,
fixtures and fittingsConstruction in
progress and advances TotalSEK million 2018 2017 2018 2017 2018 2017 2018 2017 2018 2017CostOpening balance 298 48 2,499 2,642 1,131 1,152 19 25 3,948 3,867Investments 26 21 9 18 110 102 11 26 155 166Sales and disposals -56 -4 -2 0 -115 -69 - 0 -173 -74Acquisitions and divestments
of companies -9 0 -9 0 -24 3 -1 - -42 3Reclassifications 10 232 0 -169 -75 -52 -17 -32 -83 -20Translation differences 13 1 11 9 26 -4 0 0 50 5Closing balance 282 298 2,508 2,499 1,053 1,131 13 19 3,855 3,948
DepreciationOpening balance -192 -20 -1,616 -1,639 -827 -846 -2,635 -2,505Sales and disposals 56 4 2 0 94 61 151 66Acquisitions and divestments
of companies 1 0 6 0 12 -2 19 -2Depreciation for the year -28 -26 -36 -50 -102 -106 -167 -183Reclassifications -8 -149 7 80 21 62 20 -7Translation differences -9 0 -12 -8 -18 3 -39 -5Closing balance -180 -192 -1,650 -1,616 -820 -827 -2,650 -2,635
ImpairmentOpening balance 0 0 -769 -769 -19 -9 0 0 -788 -777Sales and disposals 0 - - 0 16 5 - - 16 5Acquisitions and divestments
of companies - - - - - - - - - 0Impairment losses for the year -1 - -26 - -9 -16 - - -36 -16Reclassifications - - -57 - - - - - -57 -Translation differences 0 - 0 - -1 1 - - -1 1Closing balance -1 0 -852 -769 -14 -19 0 0 -866 -788
Carrying amount December 31 101 106 7 114 219 284 13 19 339 524
N O T E S TO T H E C O N S O L I D AT E D F I N A N C I A L S TAT E M E N T S
tions used in the assessment of future cash-flow relate to sales growth, operating margin and discount rate. The estimated growth rate is based on forecasts in the industry. The forecasted operating margin has been based on past performance and management’s expectations of market development. The discount rate of 9% (8) after taxes reflects specific risks related to the asset and market assessments of the time value of money. In some cases, a higher or lower discount rate may be used depending on the circumstances such as, for example, the market in the country. For cash-flows beyond the 5-year period, a growth rate amounting to 2% (1) is applied, which agrees with the Group’s long-term assumptions regarding inflation and the long-term growth in the market.
During 2018 goodwill has been written off, mostly related to the business areas Magazines and Books. For Magazines the write off amounts to SEK 556 million and for Books to SEK 151 million. The
main reason for the impairments at Magazines is restructuring of the business area. The impairment at Books arises from changes in market conditions. On December 31, 2018, the recoverable amount, which is based on the value in use, for Magazines was SEK 381 million and for Books SEK 642 million.
The sensitivity analysis for the business areas Books and Broadcasting, whose goodwill constitutes the greater part of the goodwill in the Group, shows that the recoverable amount is justi-fied based on an assumption of no growth or an average decrease in the discount rate of 6%.
For other goodwill and trademarks with indefinite useful life, based on the assumptions presented, the value in use exceeds the carrying amount. Reasonable changes in the presented assump-tions would not result in any impairment.
NOTE 14 Cont.

37bonnier ab annual report 2018
NOTE 16 Business combinations and divestments
Business combinations In 2018, the Bonnier AB Group acquired a number of minor busi-ness combinations. The acquisitions correspond to net assets of SEK 6 million (157). Acquisition-related costs amounting to SEK 2 million (4) are recognized as “Items related to acquisitions, divest-ments and close-downs together with amortization/impairment losses of group excess values” in the income statement.
The acquisition calculations are preliminary and subject for final adjustment occuring within one year after the acquisition date.
The Carrying amount of net assets acquiredSEK million 2018 2017Non-current assets 5 23Interest-bearing current assets 10 102Interest-bearing non-current liabilities -11 -4Non-interest-bearing non-current liabilities -5 -3Interest-bearing current liabilities 0 -11Non-interest-bearing operating capital, net 7 57Deferred tax liabilities 0 -8Net assets acquired 6 157Non-controlling interests - -8Goodwill 58 603Fair value on previously owned share 0 -26Total consideration 64 726
Consideration paid in cash -58 -608Paid in cash, contingent
considerations -37 -36Paid in cash for put options and
step acquisitions -191 -9Less cash and cash equivalent balances
acquired 10 103Net cash flow -276 -550
Net debt items, excluding cash andcash equivalents, and contingent consideration and put options -10 -13
Transaction costs -2 -4Changes in contingent consideration and
put options 258 -75Net debt effect -30 -641
Impact of acquisitions on the profit or loss of the Group The Group’s revenues for the year include SEK 22 million (287) at-tributable to business combinations in 2018, and these acquisitions have contributed SEK -12 million (-4) to the Group’s profit or loss. If the acquisitions had been made on January 1, 2018, the Group’s revenues would have amounted to SEK 26,695 million (25,969) and the Group’s profit or loss to SEK -874 million (-2,247).
Divestments of subsidiaries/businesses During 2018, the Bonnier Group made a number of minor divest-ments of subsidiaries/businesses. The divestments generated a capital gain of SEK 1 million and the divestment of assets during the year led to a tax expense of SEK 177 million. The net effect on debt of these divestments was SEK 265 million.
N O T E S TO T H E C O N S O L I D AT E D F I N A N C I A L S TAT E M E N T S

38bonnier ab annual report 2018
The Group’s share of net assets in significant associated companies Dec. 31, 2018 Dec. 31, 2017
SEK millionBorås Tidning
Tryckeri ABBorås Tidning
Tryckeri AB
Non-current assets 6 10Current assets 81 86Non-current and current liabilities -31 -31Net assets (100%) 57 65Ownership 50% 50%The Group’s share of net assets 28 33
The Group’s share of profit or loss in significant associated companies2018 2017
SEK millionBorås Tidning
Tryckeri ABBorås Tidning
Tryckeri ABRevenues 135 137
NOTE 17 Participations in associated companies and joint ventures
Associated companies Joint ventures TotalSEK million 2018 2017 2018 2017 2018 2017Carrying amount, opening balance 285 302 265 250 550 552Profit/loss before tax 48 24 -30 40 17 64Tax -9 -9 8 -11 -1 -20Other comprehensive income -2 0 8 -14 6 -14Dividends -25 -20 - - -25 -20Acquisitions 20 52 - - 20 52Divestments -72 -14 - - -72 -14Reclassifications -5 -49 0 0 -5 -49Other - 0 - - 0 0Carrying amount, closing balance 240 285 250 265 490 550
Participations in associated companies Dec. 31, 2018 Dec. 31, 2017 Dec. 31, 2018 Dec. 31, 2017
Ownership Ownership Carrying amount Carrying amountBorås Tidning Tryckeri AB, Sweden 50% 50% 28 33Other associated companies 212 252Participations in associated companies 240 285
N O T E S TO T H E C O N S O L I D AT E D F I N A N C I A L S TAT E M E N T S
Amortization and depreciation -4 -5Interest income 0 0Interest expenses 0 0Tax -3 -3Profit or loss for the year 8 10
Other comprehensive income - -Total comprehensive income for the year (100%) 8 10Ownership 50% 50%The Group’s share of total comprehensive income for the year 4 5
Dividends received 8 4
The financial information in respect of the associated companies represents the amounts shown in the associated companies’ financial statements.

39bonnier ab annual report 2018
Participations in joint ventures Dec. 31, 2018 Dec. 31, 2017 Dec. 31, 2018 Dec. 31, 2017Ownership Ownership Carrying amount Carrying amount
Cappelen Damm Holding AS, Norway 50% 50% 250 265Participations in joint ventures 250 265
The operations in Cappelen Damm Holding AS include bookstores, book clubs, distribution and publishing in Norway. The business is equally owned by Bonnier AB and Egmont Media Group.
The Group’s share of net assets in significant joint ventures Dec. 31, 2018 Dec. 31, 2017
SEK millionCappelen Damm
Holding ASCappelen Damm
Holding ASCurrent assets 630 653Non-current assets 764 718Current liabilities 669 625Non-current liabilities 64 65Net assets (100%) 660 682Ownership 50% 50%The Group’s share of net assets 330 341
The Group’s share of profit in significant joint ventures 2018 2017
SEK millionCappelen Damm
Holding ASCappelen Damm
Holding ASRevenues 1,624 1,627Amortization and depreciation -43 -37Interest income 1 1Interest expenses -11 -14Tax 15 -21Profit or loss for the year -46 59
Other comprehensive income - -Total comprehensive income for the year (100%) -46 59Ownership 50% 50%The Group’s share of total comprehensive income for the year -23 29
Dividends received - -
NOTE 17 Cont.
The financial information in respect of the joint ventures represents the amounts shown in the respective joint venture’s financial state-ments. Joint ventures apply IFRS in their reporting to the Group.
N O T E S TO T H E C O N S O L I D AT E D F I N A N C I A L S TAT E M E N T S

40bonnier ab annual report 2018
NOTE 18 Other long-term investments
SEK million 2018 2017CostOpening balance 338 178Adjustment for changed accounting policy 1) 54 -Investments 121 91Divestments -24 6Reclassification 64 122Change in fair value 2) 41 -Closing balance 592 397
Impairment Opening balance -42Impairment losses for the year -11Other -6Closing balance -58
Carrying amount 592 338
NOTE 19 Derivatives
Dec. 31, 2018 Dec. 31, 2017SEK million Nominal amount Carrying amount Nominal amount Carrying amountInterest rate swaps-Liabilities 1,800 -65 2,200 -109Foreign exchange derivatives-Assets 3,227 43 3,076 54-Liabilities 729 -7 262 -9Carrying amount, net -28 -63
In the statement of financial position, the above derivative instru-ments have been classified as:
Dec. 31, 2018 Dec. 31, 2017
Current assets 43 54
Non-current liabilities -65 -108Current liabilities -7 -9Carrying amount, net -28 -63
For more information regarding derivative instruments, see Note 4.
N O T E S TO T H E C O N S O L I D AT E D F I N A N C I A L S TAT E M E N T S
SEK million 2018 2017CostOpening balance 107 73Investments 5 38Divestments/amortization -2 -2Reclassification -6 -2Other 2 1Closing balance 105 107
Impairment Opening balance -26 -26Other 0 0Closing balance -26 -26
Carrying amount 79 81
NOTE 20 Long-term receivables
1) Adjusted to reflect the impact of changed accounting policy for financial instruments. For further information, see Note 2.
2) The change in fair value is recognized in the income statement under the heading Other financial income and expense.

41bonnier ab annual report 2018
SEK million Dec. 31, 2018 Dec. 31, 2017Raw materials and consumables 54 42Semi-finished goods 280 280Finished goods 463 426Goods for resale 534 509Advance payments to suppliers 439 565Carrying amount 1,770 1,822
SEK million Dec. 31, 2018 Dec. 31, 2017Account receivables, gross 3,038 3,219Reserve for doubtful debt -127 -192Reserve for returned products -280 -229Carrying amount 2,632 2,798
Reserve for doubtful debtSEK million 2018 2017Reserve for doubtful debt, opening balance 192 178Reported reserves for doubtful debt 74 55Reversal of unutilized reserves -25 -16Utilized reserves -46 -25Reclassification -74 -Translation differences 6 -Reserve for doubtful account receivables,
closing balance 127 192
Reserve for returned productsSEK million 2018 2017Reserve for returned products, opening balance 229 207Reserve for the year 246 212Reversal for the year -215 -191Reclassification 15 -Translation differences 6 -Reserve for returned products,
closing balance 280 229
NOTE 22 Account receivables
Age analysis Dec. 31, 2018
SEK million GrossReserve for
doubtful debtReserve for
returned productsAccount
receivablesNot overdue 2,264 -3 -261 2,000Overdue 1-7 days 317 -15 0 302Overdue 8-30 days 217 -2 -1 214Overdue 31-90 days 103 -12 -1 90Overdue > 90 days 138 -95 -17 26Total 3,038 -127 -280 2,632
Age analysis Dec. 31, 2017
SEK million GrossReserve for
doubtful debtReserve for
returned productsAccount
receivablesNot overdue 2,466 -55 -208 2,203Overdue 1-7 days 203 -13 - 190Overdue 8-30 days 230 -5 -2 223Overdue 31-90 days 144 -16 -1 128Overdue > 90 days 175 -103 -18 54Total 3,219 -192 -229 2,798
The Group’s assessment is that payments will be received for ac-count receivables which are due but which have not been written-down. These receivables refer to a large number of geographically dispersed customers.
Noninvoiced income amounts to SEK 729 million (627), which is included in non-interest-bearing “Prepaid expenses and accrued income” for a total of SEK 1,117 million (1,294).
N O T E S TO T H E C O N S O L I D AT E D F I N A N C I A L S TAT E M E N T S
There was an impairment loss on inventory in Australia and France of SEK 372 million in 2017, see Note 11, “Items related to acquisitions, divestments and close-downs together with amortiza-tion/impairment losses of group excess values.”
NOTE 21 Inventories
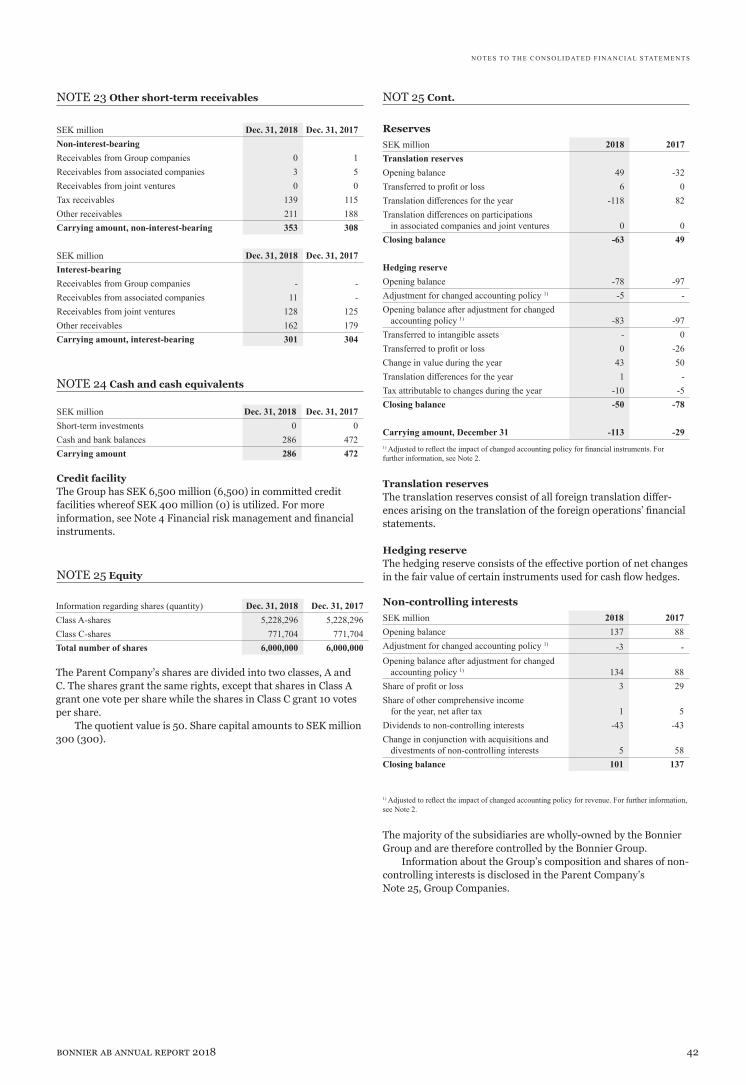
42bonnier ab annual report 2018
NOTE 23 Other short-term receivables
NOTE 25 Equity
NOTE 24 Cash and cash equivalents
SEK million Dec. 31, 2018 Dec. 31, 2017Non-interest-bearingReceivables from Group companies 0 1Receivables from associated companies 3 5Receivables from joint ventures 0 0Tax receivables 139 115Other receivables 211 188Carrying amount, non-interest-bearing 353 308
SEK million Dec. 31, 2018 Dec. 31, 2017Interest-bearingReceivables from Group companies - -Receivables from associated companies 11 -Receivables from joint ventures 128 125Other receivables 162 179Carrying amount, interest-bearing 301 304
SEK million Dec. 31, 2018 Dec. 31, 2017Short-term investments 0 0Cash and bank balances 286 472Carrying amount 286 472
Credit facilityThe Group has SEK 6,500 million (6,500) in committed credit facilities whereof SEK 400 million (0) is utilized. For more information, see Note 4 Financial risk management and financial instruments.
Information regarding shares (quantity) Dec. 31, 2018 Dec. 31, 2017Class A-shares 5,228,296 5,228,296Class C-shares 771,704 771,704Total number of shares 6,000,000 6,000,000
The Parent Company’s shares are divided into two classes, A and C. The shares grant the same rights, except that shares in Class A grant one vote per share while the shares in Class C grant 10 votes per share.
The quotient value is 50. Share capital amounts to SEK million 300 (300).
ReservesSEK million 2018 2017Translation reservesOpening balance 49 -32Transferred to profit or loss 6 0Translation differences for the year -118 82Translation differences on participations
in associated companies and joint ventures 0 0Closing balance -63 49
Hedging reserve Opening balance -78 -97Adjustment for changed accounting policy 1) -5 -Opening balance after adjustment for changed
accounting policy 1) -83 -97Transferred to intangible assets - 0Transferred to profit or loss 0 -26Change in value during the year 43 50Translation differences for the year 1 -Tax attributable to changes during the year -10 -5Closing balance -50 -78
Carrying amount, December 31 -113 -29
Translation reservesThe translation reserves consist of all foreign translation differ-ences arising on the translation of the foreign operations’ financial statements.
Hedging reserve The hedging reserve consists of the effective portion of net changes in the fair value of certain instruments used for cash flow hedges.
Non-controlling interestsSEK million 2018 2017Opening balance 137 88Adjustment for changed accounting policy 1) -3 -Opening balance after adjustment for changed
accounting policy 1) 134 88Share of profit or loss 3 29Share of other comprehensive income
for the year, net after tax 1 5Dividends to non-controlling interests -43 -43Change in conjunction with acquisitions and
divestments of non-controlling interests 5 58Closing balance 101 137
1) Adjusted to reflect the impact of changed accounting policy for revenue. For further information, see Note 2.
The majority of the subsidiaries are wholly-owned by the Bonnier Group and are therefore controlled by the Bonnier Group.
Information about the Group’s composition and shares of non-controlling interests is disclosed in the Parent Company’s Note 25, Group Companies.
N O T E S TO T H E C O N S O L I D AT E D F I N A N C I A L S TAT E M E N T S
NOT 25 Cont.
1) Adjusted to reflect the impact of changed accounting policy for financial instruments. For further information, see Note 2.

43bonnier ab annual report 2018
NOTE 26 Liabilities to credit institutions
Dec. 31, 2018 Dec. 31, 2017
(Amounts in SEK millionunless otherwise stated) Due
Confirmed facility
and loansBorrowed
nominal amount CurrencyInterest rate
type1) Carrying amount Carrying amountBond loan 2018 896 MSEK 896 SEK Fixed - 896Bond loan 2018 300 MSEK 300 SEK Variable - 300Private placement 2019 250 MSEK 250 SEK Variable 250 250Commercial paper 2019 SEK Variable 1,939 599Syndicated bank loan 2021 6,500 MSEK 400 SEK Variable 400 -Private placement 2021 250 MSEK 250 SEK Variable 250 250Private placement 2023 250 MSEK 250 SEK Variable 250 250Private placement 2025 2) 100 MEUR 100 EUR Variable 1,026 984Other bank loans 19 4Less short-term portion of
long-term loans -2,271 -2,045
Non-current liabilities to credit institutions, total 1,863 1,488
Short-term portion of long-term loans 2,271 2,045Short-term loans 37 12Current liabilities to credit institutions, total 2,038 2,057
Liabilities to credit institutions, total 4,171 3,5451) Refers to the contractual interest rate prior to the interest rate swaps.
2) The liability is amortized starting from year 2019, which has been taken into consideration in the maturity structure note 4.
The average interest rate for all loans is 1.37% (1.76). The fair value equals the carrying amount for all liabilities to credit institutions. See Note 4 for more information regarding the Group’s exposure to interest rate risk.
NOTE 27 Pensions
The Group’s pension obligations include both defined contribution and defined benefit pension plans. Most of the Group’s pension plans are defined contribution pension plans and these are used in Sweden and other countries. The defined benefit pension plans are primarily used in Sweden.
Defined benefit pension plans In Sweden, white collar workers born in or before 1978 are covered by ITP 2. Pension plans secured through policies issued by Alecta are reported as defined contribution plans and are described in the next section. Other ITP 2 plans are reported as defined benefit where the obligations remain within the Group or are secured through Group pension foundations. The ITP 2 plans cover retire-ment pension, disability pension and survivor’s pension. The retirement pension within ITP 2 is defined benefit, and the benefit is based on the employee’s final salary. The Group has settled three ITP 2 pension plans during the year. The Group has also frozen the remaining ITP 2 pension plans in PRI, for remaining active employees, and the Group has switched over to pay pension premiums to Alecta. The effect of the settlements and freezing is included in “Past service cost, previous year.”
The ITP 2 plans are partly funded through foundations and are partly unfunded. The present value of the funded and un-funded obligations, and the present value of the plan assets, are summarized in this note.
The present value of the defined benefit obligation, the related current service costs, and past service costs have been calculated
Reported liability for pension obligations
SEK million Dec. 31, 2018 Dec. 31, 2017Present value of funded obligations 994 981Present value of unfunded obligations 2,177 2,305Total present value of defined pension
obligations 3,170 3,287Fair value of plan assets -531 -569Less advance for pension insurance premiums -41 -40Less liabilities for special payroll tax
included in other current liabilities1) -233 -252Reported liabilities for pension obligations 2,365 2,4261) Bonnier Group recognizes special payroll tax as an other current liability
Expenses for defined benefit pension plans reported in the profit or loss forthe year
SEK million 2018 2017Current service costs 13 62Past service costs -240 -5Net interest income/expenses 66 63Total -162 120
by external actuaries based on the Project Unit Credit Method.
N O T E S TO T H E C O N S O L I D AT E D F I N A N C I A L S TAT E M E N T S

44bonnier ab annual report 2018
Expenses reported in other comprehensive incomeSEK million 2018 2017Revaluations: Return on plan assets 1) -24 14Actuarial gains and losses arising from
changes in demographic assumptions 0 -Actuarial gains and losses arising from
changes in financial assumptions -252 -208Actuarial gains and losses arising from
experience gains/losses 26 28Reported in other comprehensive
income, total -251 -1661) Excluding amounts included in net interest expenses
Changes in obligations for defined benefit pension plansSEK million 2018 2017Obligations for defined benefit plans,
opening balance 3,287 3,109Current service costs, incl. special payroll tax 13 62Net interest expense 80 78Past service cost, previous year, and gains/losses from settlement -240 -5Actuarial gains (-) and losses (+) relating to:
Changes in demographic assumptions 0 -Changes in financial assumptions 252 208Gains/losses based on experience -26 -28
Pension payments, incl. special payroll tax -139 -123Pension payments in correlation with
settlement -61 -Exchange rate differences 4 3Other 0 -16Obligations for defined benefit plans,
closing balance 3,170 3,287
Changes in plan assets’ fair valueSEK million 2018 2017Plan assets’ fair value, opening balance 569 569Net interest income 15 15Actuarial gains (-) and losses (+) relating to:Return on plan assets, excluding amounts
included in net interest income -24 14Pension payments -29 -29Fair value of plan assets,
closing balance 531 569
Plan assets divided by class of assets Dec. 31, 2018 Dec. 31, 2017
(%) Share ShareShares1) 39 40Interest-bearing securities2) 47 47Properties - 3Risk capital and hedge funds 13 9Cash and cash equivalents 1 1Total 100 1001) Quoted prices in an active market are available for 100% (100) of the share portion.2) Quoted prices in an active market are available for 100% (100) of the interest-bearing
securities portion.
NOT 27 Cont.
FundingThe weighted average maturity for the defined benefit obligation is 19 years. Expected pension payments for the upcoming year amount to SEK 94 million (91).
Multi-employer defined benefit pension plan - Alecta plan For white collar workers in Sweden, the defined benefit pension obligation for combined retirement and family pension (or family pension) under ITP 2 is secured through a policy issued by Alecta. According to a statement by the Swedish Financial Reporting Board - UFR 10 Reporting for Pension Scheme ITP 2 that are financed through insurance with Alecta - this is a multi-employer plan.
For the 2018 financial year, the Company did not have access to information needed to report its proportional share of the plan’s obligations, managed assets or costs, making it impossible to re-port the plan as a defined benefit plan. The ITP 2 pension plan that is secured through a policy issued by Alecta is accordingly reported as a defined contribution plan.
The premium for the defined benefit retirement and fam-ily pension is individually calculated and is dependent on salary, previously earned pensions and expected remaining working time. The expected premiums for the next reporting period for ITP 2 insurance with Alecta amounts to SEK 102 million (56). The Group’s share of the total contributions to the plan and the Group’s share of the total number of active members in the plan amounts to 0.60% (0.32) and 0.33% (0.36).
The collective consolidation level is the market value of Alecta’s assets as a percentage of the insurance commitments, calculated according to Alecta’s actuarial methods and assump-tions, which are not consistent with IAS 19. Usually, the collective consolidation level may vary between 125% and 175%.
If Alecta’s collective consolidation level is below 125% or above 175%, measures must be taken in order to create conditions for the consolidation level to return to normal. With low consolidation, one measure can be to increase the agreed price for new subscrip-tions and the expansion of existing benefits. In conjunction with high consolidation, one measure can be to introduce premium reductions. At the end of 2018, Alecta’s surplus at the collective consolidation level amounted to 142% (154).
Defined contribution pension plansThe defined contribution pension plans are plans for which the Group has paid premiums to independent organizations which then assume the obligations towards the employees. Payments to defined contribution plans are continuous according to the plan rules. Defined contribution pension plans in Sweden are primarily for employees born 1979 or later who are linked to ITP 1. Pension plans in other countries are primarily defined contribution plans.
SEK million 2018 2017Expenses for defined contribution pension plans 485 400
The ITP-plans financed in Alecta are also included in the defined contribution pension plans reported above.
Assumptions applied in the actuarial calculations(%) Dec. 31, 2018 Dec. 31, 2017Discount rate 2.45 2.62Future salary growth 1.92-3.92 1.79-3.79Pension growth 1.92 1.79Mortality assumptions used DUS14 tjm DUS14 tjmInflation 1.92 1.79
Sensitivity analysisThe table below shows the manner in which possible changes in the actuarial assumptions at period end, with other assumptions unchanged, would affect the defined benefit pension obligations.
SEK million Dec. 31, 2018 Dec. 31, 2017
Discount rate - increase of 1% -537 -572Discount rate - decrease of 1% 714 752Inflation - increase of 0.5% 354 390Inflation - decrease of 0.5% -302 -341
Expenses related to service are recognized as ”Personnel costs” in the consolidated income statement. Amounts exclude the costs for the defined benefit pension obligations financed by a policy with Alecta (see below).
N O T E S TO T H E C O N S O L I D AT E D F I N A N C I A L S TAT E M E N T S
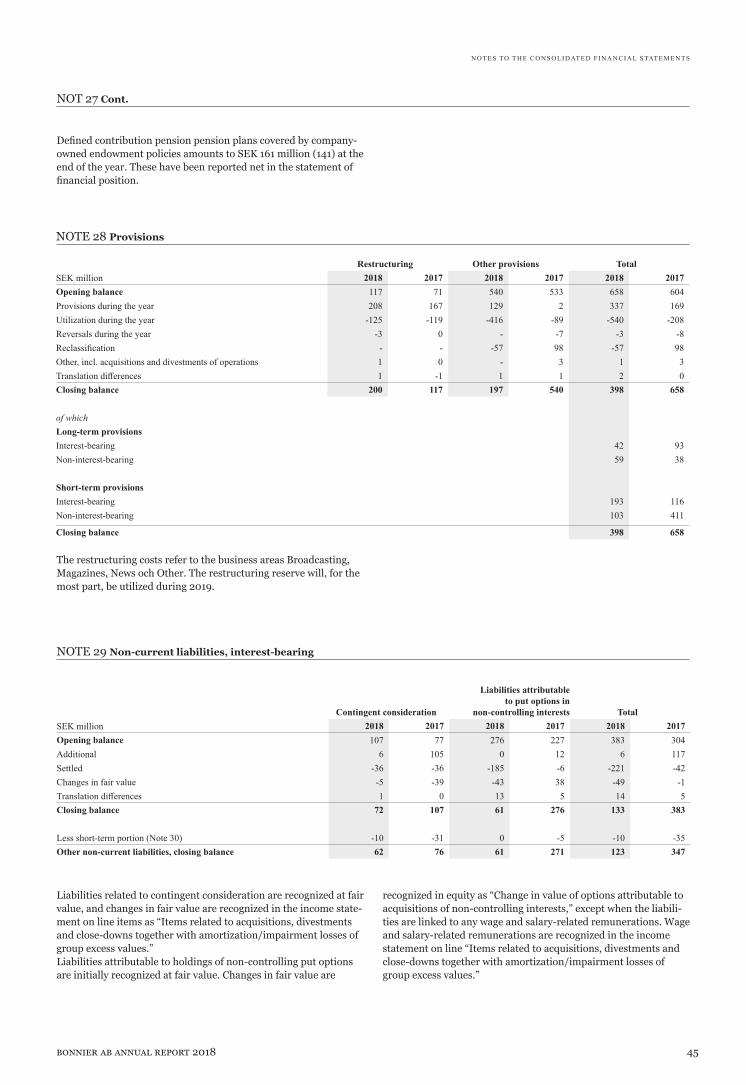
45bonnier ab annual report 2018
NOT 27 Cont.
Defined contribution pension pension plans covered by company-owned endowment policies amounts to SEK 161 million (141) at the end of the year. These have been reported net in the statement of financial position.
NOTE 28 Provisions
Restructuring Other provisions TotalSEK million 2018 2017 2018 2017 2018 2017Opening balance 117 71 540 533 658 604Provisions during the year 208 167 129 2 337 169Utilization during the year -125 -119 -416 -89 -540 -208Reversals during the year -3 0 - -7 -3 -8Reclassification - - -57 98 -57 98Other, incl. acquisitions and divestments of operations 1 0 - 3 1 3Translation differences 1 -1 1 1 2 0Closing balance 200 117 197 540 398 658
of which Long-term provisionsInterest-bearing 42 93Non-interest-bearing 59 38
Short-term provisionsInterest-bearing 193 116Non-interest-bearing 103 411
Closing balance 398 658
The restructuring costs refer to the business areas Broadcasting, Magazines, News och Other. The restructuring reserve will, for the most part, be utilized during 2019.
N O T E S TO T H E C O N S O L I D AT E D F I N A N C I A L S TAT E M E N T S
NOTE 29 Non-current liabilities, interest-bearing
Contingent consideration
Liabilities attributable to put options in
non-controlling interests TotalSEK million 2018 2017 2018 2017 2018 2017Opening balance 107 77 276 227 383 304Additional 6 105 0 12 6 117Settled -36 -36 -185 -6 -221 -42Changes in fair value -5 -39 -43 38 -49 -1Translation differences 1 0 13 5 14 5Closing balance 72 107 61 276 133 383
Less short-term portion (Note 30) -10 -31 0 -5 -10 -35Other non-current liabilities, closing balance 62 76 61 271 123 347
Liabilities related to contingent consideration are recognized at fair value, and changes in fair value are recognized in the income state-ment on line items as “Items related to acquisitions, divestments and close-downs together with amortization/impairment losses of group excess values.” Liabilities attributable to holdings of non-controlling put options are initially recognized at fair value. Changes in fair value are
recognized in equity as “Change in value of options attributable to acquisitions of non-controlling interests,” except when the liabili-ties are linked to any wage and salary-related remunerations. Wage and salary-related remunerations are recognized in the income statement on line “Items related to acquisitions, divestments and close-downs together with amortization/impairment losses of group excess values.”
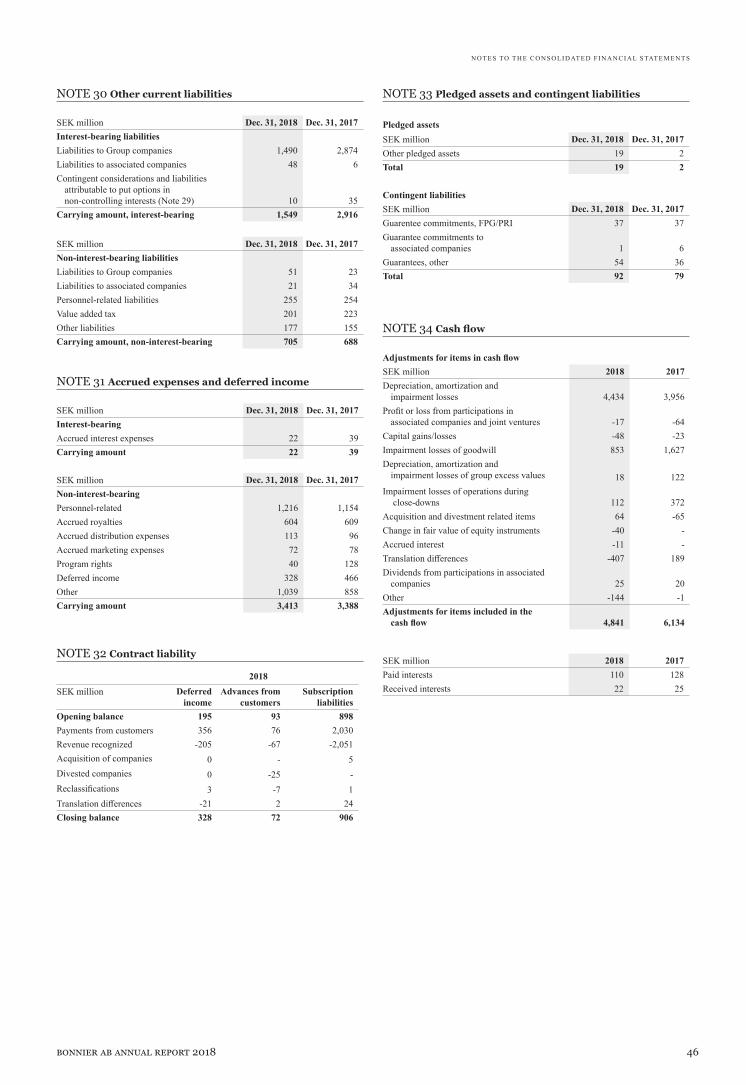
46bonnier ab annual report 2018
SEK million Dec. 31, 2018 Dec. 31, 2017Interest-bearing liabilitiesLiabilities to Group companies 1,490 2,874Liabilities to associated companies 48 6Contingent considerations and liabilities
attributable to put options in non-controlling interests (Note 29) 10 35
Carrying amount, interest-bearing 1,549 2,916
SEK million Dec. 31, 2018 Dec. 31, 2017Non-interest-bearing liabilitiesLiabilities to Group companies 51 23Liabilities to associated companies 21 34Personnel-related liabilities 255 254Value added tax 201 223Other liabilities 177 155Carrying amount, non-interest-bearing 705 688
NOTE 30 Other current liabilities
N O T E S TO T H E C O N S O L I D AT E D F I N A N C I A L S TAT E M E N T S
NOTE 33 Pledged assets and contingent liabilities
Pledged assetsSEK million Dec. 31, 2018 Dec. 31, 2017Other pledged assets 19 2Total 19 2
Contingent liabilitiesSEK million Dec. 31, 2018 Dec. 31, 2017Guarentee commitments, FPG/PRI 37 37Guarantee commitments to
associated companies 1 6Guarantees, other 54 36Total 92 79
NOTE 34 Cash flow
Adjustments for items in cash flowSEK million 2018 2017Depreciation, amortization and
impairment losses 4,434 3,956Profit or loss from participations in
associated companies and joint ventures -17 -64Capital gains/losses -48 -23Impairment losses of goodwill 853 1,627Depreciation, amortization and
impairment losses of group excess values 18 122Impairment losses of operations during
close-downs 112 372Acquisition and divestment related items 64 -65Change in fair value of equity instruments -40 -Accrued interest -11 -Translation differences -407 189Dividends from participations in associated
companies 25 20Other -144 -1Adjustments for items included in the
cash flow 4,841 6,134
SEK million 2018 2017Paid interests 110 128Received interests 22 25
NOTE 31 Accrued expenses and deferred income
SEK million Dec. 31, 2018 Dec. 31, 2017Interest-bearingAccrued interest expenses 22 39Carrying amount 22 39
SEK million Dec. 31, 2018 Dec. 31, 2017Non-interest-bearingPersonnel-related 1,216 1,154Accrued royalties 604 609Accrued distribution expenses 113 96Accrued marketing expenses 72 78Program rights 40 128Deferred income 328 466Other 1,039 858Carrying amount 3,413 3,388
2018SEK million Deferred
incomeAdvances from
customersSubscription
liabilitiesOpening balance 195 93 898Payments from customers 356 76 2,030Revenue recognized -205 -67 -2,051Acquisition of companies 0 - 5Divested companies 0 -25 -Reclassifications 3 -7 1Translation differences -21 2 24Closing balance 328 72 906
NOTE 32 Contract liability

47bonnier ab annual report 2018
Transactions between Bonnier AB and its subsidiaries have been eliminated in the consolidated financial statements and informa-tion about these transactions is, therefore, not disclosed in this Note. Remuneration to senior executives is disclosed in Note 6.
All transactions with related parties are performed on market conditions.
IncomeSEK million 2018 2017Albert Bonnier AB 1 1AB Boninvest 0 0Bonnier Fastigheter AB, incl. subsidiaries 2 3Bonnier Group AB (formerly Bonnier Holding AB)incl. subsidiaries 4 7Associated companies 35 90Joint ventures 10 11Total 52 111
ExpensesSEK million 2018 2017Bonnier Fastigheter AB, incl. subsidiaries 136 145Bonnier Group AB (formerly Bonnier Holding AB)incl. subsidiaries 24 24Associated companies 457 469Total 618 639
Receivables from related partiesSEK million Dec. 31,
2018Dec. 31,
2017Bonnier Fastigheter AB incl. subsidiaries 0 1Bonnier Group AB (formerly Bonnier Holding AB)incl. subsidiaries 0 0Associated companies 46 36Joint ventures 128 125Carrying amount 174 162
Liabilities to related partiesSEK million Dec. 31,
2018Dec. 31,
2017Albert Bonnier AB 7 7AB Boninvest 150 207Bonnier Fastigheter AB, incl. subsidiaries 2 195Bonnier Group AB (formerly Bonnier Holding AB)incl. subsidiaries 1,383 2,488Associated companies 69 40Carrying amount 1,610 2,937
Bonnier Group AB (formerly Bonnier Holding AB) provides a guarantee for AB Bonnier Finans’ credit facility (AB Bonnier Finans is a subsidiary of Bonnier AB), see Note 24.
NOTE 35 Transactions with related parties NOTE 36 Events after balance sheet date
At the beginning of February 2019, Bonnier and the Norwegian Amedia announced their acquisition of Mittmedia. Mittmedia’s operations consist of 28 titles and local brands in central Sweden. The focus of the deal is to drive digital growth for high-quality and independent journalism. Bonnier will have 80% ownership and Amedia 20%. The acquisition was approved by the Swedish Com-petition Authority on March 26, 2019.
On January 1, 2019, Bonnier changed its operational struc-ture to the effect that Bonnier AB’s business areas will be run as independent companies in the Bonnier Group. These are Bon-nier Books, Adlibris, Bonnier Broadcasting, SF Studios, Bonnier Ventures, Bonnier Corporation, Bonnier Publications and Bonnier News. The companies previously operating as E-Commerce and Film Studios were renamed Adlibris and SF Studios, respectively.
The Magazines business area was split into the U.S.-based Bonnier Corporation and the Copenhagen-based Bonnier Publica-tions, while the Swedish magazine business was merged into Bonnier News. Business to Business was also merged into Bonnier News.
N O T E S TO T H E C O N S O L I D AT E D F I N A N C I A L S TAT E M E N T S
Change in liabilities within financing activitiesLiabilities to credit
institutions Liabilities to Group
companiesLiabilities to associated
companiesSEK million 2018 2017 2018 2017 2018 2017
Opening balance 3,545 4,950 2,874 614 6 7
Cash itemsAmortization of debt -1,765 -3,019 -6 - - -1Borrowings 2,339 1,585 - - 42 -Change in current financing 0 2 -1,379 2,260 - -
Non-cash items
Remitted debt - -5 - - - -Acquisitions of companies 10 4 - - - -Translation differences 42 27 - 0 - -Closing balance 4,171 3,545 1,490 2,874 48 6
NOTE 34 Cont.

48bonnier ab annual report 2018
The Parent Company’s Income Statements SEK million
Note 2018 2017
Net sales 2,3 35 42Total revenues 35 42
Other external costs 3,4,5 -372 -271Personnel costs 6 -157 -115Depreciation, amortization and impairment losses of
intangible assets and property, plant and equipment -1 -1Operating loss -495 -344
Profit or loss from shares in Group companies 7 -512 -265Interest income and similar items 8 1 2Interest expenses and similar items 9 -63 -65Profit/loss after financial items -1,070 -672
Appropriations 10 538 406Profit/loss before tax -532 -266
Tax 11 0 0
PROFIT/LOSS FOR THE YEAR -532 -266
The Parent Company’s Statements of Comprehensive Income SEK million
2018 2017
Profit/loss for the year -532 -266Other comprehensive income - -TOTAL COMPREHENSIVE INCOME FOR THE YEAR -532 -266

49bonnier ab annual report 2018
The Parent Company’s Balance SheetsSEK million
Note Dec. 31, 2018 Dec. 31, 2017ASSETS
Non-current assetsIntangible assetsOther intangible assets 12 12 -Property, plant and equipmentEquipment 13 3 3Financial assetsShares in Group companies 14, 25 19,570 19,570Deferred tax assets 11 35 35Other long-term receivables 15 - 28Total non-current assets 19,620 19,636
Current assetsShort-term receivablesReceivables from Group companies 1,356 793Current tax assets 7 5Other receivables 20 22Prepaid expenses and accrued income 16 11 9Total current assets 1,394 829
TOTAL ASSETS 21,014 20,465
EQUITY AND LIABILITIES
EquityRestricted equityShare capital 30 300Statutory reserves 92 92
392 392Non-restricted equityRetained earnings 17,926 17,192Profit/loss for the year -532 -266
17,394 16,926
Total equity 17,786 17,318
Untaxed reserves0 0
ProvisionsProvisions for pensions and similar obligations 17 180 178Other provisions 18 77 37Total provisions 256 216
Non-current liabilitiesLiabilities to credit institutions 19 - 500Total non-current liabilities 20 0 500
Current liabilitiesLiabilities to credit institutions 19 - 250Account payables 35 50Liabilities to Group companies 2,844 2,054Current tax liabilities 0 3Other liabilities 9 9Accrued expenses and deferred income 21 83 65Total current liabilities 20 2,972 2,431
TOTAL EQUITY AND LIABILITIES 21,014 20,465

50bonnier ab annual report 2018
The Parent Company’s Cash Flow StatementSEK million
Note 2018 2017
Operating activitiesProfit/loss after financial items -1,070 -672Adjustments for items in cash flow 23 610 1,017Paid income tax - -Cash flow from operating activities before change
in working capital -460 345
Change in other short-term receivables -429 -388Change in account payables -15 15Change in other current liabilities -13 7Cash flow from operating activities -917 -20
Investing activitiesDivestments of shares in subsidiaries 10 -Acquisition and sales of non-current assets -13 -Shareholder contribution provided -451 -13Amortization received - 482Cash flow from investing activities -454 470
Financing activitiesProceeds from borrowings 715 -Amortization of debt -750 -536Dividends - -280Shareholder’s contribution recieved 1,000 -Group contributions 406 366Cash flow from financing activities 1,371 -449
CASH FLOW FOR THE YEAR 0 0Cash and cash equivalents at the beginning of the year - -Cash and cash equivalents at the end of the year - -
The Parent Company’s Statements of Change in EquitySEK million
Restricted equity Non-restricted equityShare capital Statutory reserves Retained earnings Profit/loss for the year Total equity
Opening balance, Jan. 1, 2017 300 92 17,180 291 17,863Comprehensive incomeProfit/loss for the year1) -266 -266Total comprehensive income -266 -266Appropriation of profit 291 -291 0Transactions with shareholdersDividends -280 -280Total transactions with shareholders -280 -280Closing balance, Dec. 31, 2017 300 92 17,192 -266 17,318
Opening balance, Jan. 1, 2018 300 92 17,192 -266 17,318Comprehensive incomeProfit/loss for the year1) -532 -532Total comprehensive income -532 -532Appropriation of profit -266 266 0Transactions with shareholdersDividends 1,000 1,000Total transactions with shareholders 1,000 1,000Closing balance, Dec. 31, 2018 300 92 17,926 -532 17,786
1) Profit/loss for the year corresponds with comprehensive income.
Additional information to cash flow statement 2018 2017Dividends received - 755Interests received 0 2Paid interests 56 58

51bonnier ab annual report 2018
The Annual Accounts Act and RFR 2 Accounting for Legal Entities has been applied for the Parent Company. The accounting policies have not changed in comparison with previous year.
Classification and layoutThe Parent Company’s income statement and balance sheet are presented in accordance with the Swedish Annual Accounts Act’s schedule. The difference compared to IAS 1 Presentation of Financial Statements mainly refer to the presentation of financial income and expenses, non-current assets, equity and provisions as a separate heading.
SubsidiariesShares in subsidiaries are accounted for at cost in the Parent Com-pany’s financial statement. Acquisition related costs for subsidiar-ies which are expensed in the consolidated financial statements are included as a part of the cost of shares in subsidiaries.
Group contributionsGroup contributions are recognized according to the alternative rule which implies that both received and paid group contributions are recognized as an appropriation.
PensionsThe Parent Company follows the Pension Obligations Vesting Act since its is a prerequisite for tax deductibility. RFR 2’s simplifica-tion rules for accounting of defined benefit plans apply.
Lease agreementsAll lease agreements are recognized in accordance with the rules for operating lease agreements.
Share capitalFor more information regarding share capital see note 25 Group companies.
New and revised standards and interpretations but not yet effective and have not been adopted early by the Parent Company It is assessed that the RFR 2 – IFRS 16 regulations will not af-fect the accounting of leases, with respect to that leases could be expensed on a straight-line basis over the leasing period, due to the current tax rules.
Other new and revised IFRSs and interpretations not yet effec-tive are not expected to have any significant impact on the Parent Company´s financial statements.
NOTE 1 Accounting policies NOTE 4 Lease agreements
NOTE 5 Fees to auditors
NOTE 2 Net sales
NOTE 3 Purchases and sales within the same Group
Net sales by geographic marketSEK million 2018 2017Sweden 30 40Other countries 5 2Total 35 42
2018 2017Purchases 25.2% 26.9%Sales 95.9% 95.3%
LesseeOperational lease agreements costs for the year
SEK million 2018 2017Minimum lease fees 10 17Total 10 17
The lease agreements mainly refer to the rental of premises.On the balance sheet date, outstanding commitments in the
form of minimum lease payments in accordance with non-termina-ble operating leases, had the following terms to maturity: SEK million 2018 2017Within 1 year 8 7Between 1-5 years 86 16More than 5 years 73 -Total 166 24
SEK million 2018 2017PricewaterhouseCoopers ABAudit assignment 4 4Audit-related activities in addition to audit
assignment0 -
Tax advisory services - 0Other fees 4 8Total 8 12
Notes to the Parent Company’s Financial Statements
Wages and salaries, other remuneration and social security costsSEK million 2018 2017Wages, salaries and remuneration 96 70Social security costs 28 22Special payroll tax and tax return on pension 8 5Pension costs 23 14Total 154 111
Personnel costs include provision of SEK 38 million for restructur-ing costs.
See Group Note 6 for more information regarding average number of employees, salaries and remuneration and gender dis-tribution of the Board of Directors and senior management.
NOTE 6 Personnel
NOTE 8 Interest income and similar items
SEK million 2018 2017Interest income, Group companies - 2Other interest income 0 0Exchange rate differences 1 -Total 1 2
SEK million 2018 2017SubsidiariesDividends - 2,332Impairment losses -522 -2,598Profit or loss on divestment of shares in
Group companies10 1
Total -512 -265
NOTE 7 Profit or loss from shares in Group companies
All interest income refers to items that are not recognized at fair value through income statement.

52bonnier ab annual report 2018
NOTE 12 Other intangible assets
NOTE 13 Equipment
NOTE 14 Shares in Group companies
NOTE 9 Interest expenses and similar items
NOTE 10 Appropriations
NOTE 11 Tax
SEK million 2018 2017Interest expenses, Group companies -53 -45Other interest expenses -10 -21Exchange rate differences - 1Total -63 -65
SEK million 2018 2017Group contributions received 538 406Total 538 406
SEK million 2018 2017Current taxCurrent tax on profit or loss for the year 0 0Adjustment for previous years 0 0Total current tax 0 0
Deferred taxDeferred tax attributable to temporary
differences1 0
Deferred tax on tax loss carry-forwards 2 -Deferred tax relating to change in tax rate -2 -Total deferred tax 0 0
Total tax 0 0
Reconciliation of effective taxSEK million 2018 2017Profit/loss before tax -532 -266
Income tax calculated according to theSwedish tax rate (22%) 117 58
Tax effect of:-Non-deductible expenses -117 -572-Non-taxable income 2 513Tax relating to income recognized in
previous years 0 0Effect of change in tax rate -2 -Other - 0Tax expenses for the year 0 0
Deferred tax assetsSEK million Dec. 31, 2018 Dec. 31, 2017Provisions 34 35Tax loss carry-forwards 2 -Total 35 35
SEK million 2018 2017CostOpening balance 1 1Investments 12 -Closing balance 12 1
AmortizationOpening balance -1 0Amortization for the year - 0Closing balance -1 -1
Carrying amount, Dec. 31 12 0
SEK million 2018 2017CostOpening balance 16 16Investments 1 -Closing balance 17 16
DepreciationOpening balance -13 -13Depreciation for the year -1 -1Closing balance -14 -13
Carrying amount, Dec. 31 3 3
SEK million 2018 2017CostOpening balance 20,333 33,460Received distribution in kind - 358Shareholder contribution provided 522 14,500Divestments - -27,985Closing balance 20,855 20,333
ImpairmentOpening balance -763 -12,870Divestments - 14,706Impairment for the year -522 -2,598Closing balance -1,285 -763
Carrying amount, 31 Dec. 19,570 19,570
For more information, see Note 25 Group companies.
N O T E S TO T H E PA R E N T C O M PA N Y’S F I N A N C I A L S TAT E M E N T S
NOTE 15 Other long-term receivables
SEK million 2018 2017CostOpening balance 28 25Additional - 4Reclassification -28 -Closing balance 0 28
Carrying amount, Dec. 31 0 28
All Interest expenses refers to items that are not recognized at fair value through income statement.

53bonnier ab annual report 2018
NOTE 16 Prepaid expenses and accrued income
NOTE 17 Provisions for pensions and similar obligations
NOTE 19 Liabilities to credit institutions
SEK million Dec. 31, 2018 Dec. 31, 2017Prepaid rents 2 2Accrued interest income 0 0Other 9 7Carrying amount, Dec. 31 11 9
SEK million Dec. 31, 2018 Dec. 31, 2017PRI-pensions 58 57Other pensions 121 121Carrying amount, Dec. 31 180 178
Changes in obligations for defined benefit pension plansSEK million 2018 2017Obligations for defined benefit plans,
opening balance 178 181Service costs 2 1Net interest expense 7 7Pension payments -7 -11Carrying amount, Dec. 31 180 178
Non-current liabilities Dec. 31, 2018 Dec. 31, 2017
SEK million DueCarrying
amountCarrying
amountPrivate placement 2019 - 250Private placement 2021 - 250Carrying amount, Dec. 31 - 500
Current liabilities Dec. 31, 2018 Dec. 31, 2017
SEK million DueCarrying
amountCarrying
amountPrivate placement 2018 - 250Carrying amount - 250
Liabilities to credit institutions, total - 750
N O T E S TO T H E PA R E N T C O M PA N Y’S F I N A N C I A L S TAT E M E N T S
Defined-contribution pension plans covered by Company-owned endowment insurance policies totalled SEK 34 million (28) at year-end. As of 2018, these have been recognized net on the bal-ance sheet.
For more information regarding pensions, see Note 6, Personnel and Note 26 Pensions in the Group.
Restructuring Other Provisions Total
SEK million 2018 2017 2018 2017 2018 2017Opening balance 0 - 37 32 37 32Provisions during the year 66 - 1 5 68 5Reclassification -28 - -28 -Closing balance 66 0 10 37 77 37
of which:Long-term provisionsInterest-bearing 2 2Non-interest-bearing 8 35
Long-term provisionsInterest-bearing - -Non-interest-bearing 66 -
Closing balance 77 37 The restructuring reserve will be utilized during 2019.
NOT 18 Provisions
During the year, liabilities to credit institutions were taken over by AB Bonnier Finans. See Note 26, Liabilities to credit institutions for the Group, for more information.

54bonnier ab annual report 2018
NOTE 20 Maturity structure of financial liabilities
NOTE 21 Accrued expenses and deferred income
NOTE 23 Cash flow
NOTE 24 Transactions with related parties
Maturity structure of financial liabilities Dec. 31, 2018SEK million Within 3 months 3-12 months 1-5 years More than 5 years TotalLiabilities to credit institutions - - - - -Liabilities to Group companies 2,850 - - - 2,850Account payables 35 - - - 35Total 2,885 - - - 2,885
Maturity structure of financial liabilities Dec. 31, 2017SEK million Within 3 months 3-12 months 1-5 years More than 5 years TotalLiabilities to credit institutions 253 5 501 - 769Liabilities to Group companies 2,401 11 - - 2,412Account payables 50 - - - 50Total 2,704 16 510 - 3,231
SEK million Dec. 31, 2018 Dec. 31, 2017Vacation pay liability 12 11Accrued salaries 7 9Accrued interest expenses
from Group companies 48 19Other 16 27Carrying amount 83 65
Adjustments for items in cash flowSEK million 2018 2017Depreciation, amortization and
impairment losses of assets 513 2,599Anticipated dividends from Group companies - -1,578Provision for restructuring 66 -Accrued interests 29 -1Other 1 -3Adjustments for items not included in
cash flow610 1,017
Sales of goods and servicesSEK million 2018 2017Albert Bonnier AB Group 2 2Subsidiaries in the Group 31 38Total 33 40
Purchases of goods and servicesSEK million 2018 2017Albert Bonnier AB Group 31 38Subsidiaries in the Group 83 40Total 114 78
Receivables from related parties SEK million Dec. 31, 2018 Dec. 31, 2017Albert Bonnier AB Group - 1Subsidiaries in the Group 1,356 792Carrying amount 1,356 792
Liabilities to related partiesSEK million Dec. 31, 2018 Dec. 31, 2017Subsidiaries in the Group 2,809 2,053Carrying amount 2,809 2,053
All transactions with related parties are performed on market terms and conditions.
Remuneration to senior executives is presented in Group Note 6.
N O T E S TO T H E PA R E N T C O M PA N Y’S F I N A N C I A L S TAT E M E N T S
NOTE 22 Pledged assets and contingent liabilities
Pledged assetsSEK million Dec. 31, 2018 Dec. 31, 2017Endowment insurance - 28Total - 28
Contingent liabilitiesSEK million Dec. 31, 2018 Dec. 31, 2017Guarantee commitments to subsidiaries 6,918 6,008Guarantee commitments, FPG/PRI 4 4Contingent liabilities, other 31 30Total 6,953 6,0411) This item also includes associated companies within the Albert Bonnier Group.
For risk and information on fair value, see note 4 for the Group.
Change in liabilities within financing activitiesLiabilities to credit
institutions Liabilities to Group
companiesSEK million 2018 2017 2018 2017
Opening balance 750 1,191 2,035 2,131
Cash itemsAmortization of
debt -750 -441 - -96New borrowings - - 715 -
Non-cash items
Translation differences - 0 - 0
Closing balance 0 750 2,750 2,035

55bonnier ab annual report 2018
NOTE 25 Group companies
N O T E S TO T H E PA R E N T C O M PA N Y’S F I N A N C I A L S TAT E M E N T S
Dec. 31, 2018
Dec. 31, 2017
Company Corp. Reg. No. Reg. OfficeHoldings,
%Number of
shares
Carrying amount,
SEK million
Carrying amount,
SEK million
1. Bonnier Finans, AB 556026-9549 Stockholm 100 1,000,000 6,290 6,290Bonnier Financial Services AB 556067-9887 Stockholm 100Bonnier Luxembourg S.à r.l. B 57013 Luxembourg 100Bonnier Treasury S.A. B 161605 Luxembourg 100Bonnier World S.à r.l. B 164843 Luxembourg 100
2. Bonnier Media Holding AB 556655-4555 Stockholm 100 1,200 13,280 13,280Adlibris AB 556261-3512 Stockholm 100 AdLibris Finland Oy 0195663-7 Helsinki 100 Adlibris Kök AB 559017-7589 Stockholm 100 Bamba AB 556801-7635 Stockholm 100 Discshop Svenska Näthandel AB 556604-9952 Stockholm 100 Discshop Alandia Ab 1932506-7 Mariehamn 100 Makujakauppa Oy 2840501-8 Helsinki 100 Odlanu i Sverige AB 556725-9493 Stockholm 100Bonnier Books Holding AB (former Bonnier Books) 556233-3111 Stockholm 100 Bonnier Books AB (former Bonnier Books Nova) 559080-9090 Stockholm 100 Bonnier Books Kauppa Suomi Oy 2699781-4 Helsinki 100 Bonnier Books Polska Sp. z o.o. KRS 0000565742 Warsaw 100 Wydawnictwo Jaguar Sp. z o.o. KRS 0000627127 Warsaw 70 1)
Wydawnictwo Marginesy Sp. z o.o. KRS 0000416091 Warsaw 51 Bonnier Holding Norway AS 990212880 Oslo 100 adlibris.com AS 990335214 Oslo 100 Bonnier Publishing Limited 01273558 London 100 Blink Publishing Limited 07724898 London 100 Bonnier Media Limited 05311887 London 100 Bonnier Publishing Australia Pty Ltd. 005966245 Melbourne 100 Bonnier Zaffre Limited 07735953 London 95 Totally Entwined Group Limited 06032552 Lincoln 60 1)
Editions Piccolia, S.A. 380771733 St Michel s.Orge 100 Igloo Books Group Holdings Limited 07435642 Sywell 100 Igloo Holdings Limited 06454887 Sywell 100 Igloo Books Limited 04845098 Sywell 100 Igloo Books GmbH HRB 211838 Hannover 100 Red Kite Fulfilment Limited 09142201 Sywell 100 Kings Road Publishing Limited 01549157 London 100 John Blake Publishing Limited 03919495 London 100 Weldon Owen Limited 07891331 London 100 Bonnierförlagen AB 556023-8445 Stockholm 100 Albert Bonniers Förlag AB 556203-3752 Stockholm 100 Bokförlaget Maxström AB 556526-8918 Stockholm 100 BookBeat AB 556560-4583 Stockholm 100 BookBeat Oy 1655221-3 Helsinki 100 Chapter 3 Culture (Beijing) Co. Ltd 91110108MA00964G9E Peking 100 Homeenter AB 556293-3381 Stockholm 100 Jultidningsförlaget Semic AB 556166-9572 Sundbyberg 100 Pandaförsäljningen AB 556369-7720 Karlstad 100 Pocket Shop AB 556479-4609 Stockholm 100 Pocket Shop GmbH HRB 109043 B Berlin 100 Pocket Shop Loves Booooks Ltd. 10062282 London 100 SEMIC International AB 556046-1336 Stockholm 100 Werner Söderström Osakeyhtiö 0599340-0 Helsinki 100 Kustannusosakeyhtiö Kosmos 2675233-1 Helsinki 100 Readme.fi Oy 2160350-5 Helsinki 100Bonnier Deutschland GmbH HRB 156443 Munich 100 Bonnier Media Deutschland GmbH HRB 136800 Munich 100 Aladin Verlag GmbH HRB 103563 Hamburg 100 arsEdition GmbH HRB 145362 Munich 100 Bonnier 3. Beteiligungs- und Verwaltungs GmbH HRB 199466 Munich 100 Buch Vertrieb Blank GmbH HRB 92253 Vierkirchen 100

56bonnier ab annual report 2018
Dec. 31, 2018
Dec. 31, 2017
Company Corp. Reg. No. Reg. Office Holdings, %Number of
shares
Carrying amount,
SEK million
Carrying amount,
SEK million
NOTE 25 Cont.
N O T E S TO T H E PA R E N T C O M PA N Y’S F I N A N C I A L S TAT E M E N T S
Carlsen Verlag GmbH HRB 43092 Hamburg 100 Nelson Verlag GmbH HRB 113971 Hamburg 100 Hörbuch Hamburg HHV GmbH HRB 142856 Hamburg 100 Münchner Verlagsgruppe GmbH HRB 118729 Munich 100 Piper Verlag GmbH HRB 71118 Munich 100 Readers First GmbH HRB 199468 Munich 100 Thienemann-Esslinger Verlag GmbH HRB 3287 Stuttgart 70 1)
Ullstein Buchverlage GmbH HRB 91717 B Berlin 100 Gesinform GmbH HRB 713116 Freiburg 100Bonnier Entertainment AB 556047-0667 Stockholm 100 Evoke Gaming Holding AB 556096-9411 Stockholm 100 Svensk Filmindustri, AB 556003-5213 Stockholm 94 1)
SF Anytime AB 556748-2616 Stockholm 100 SF Film Finland Oy 1571957-9 Helsinki 100 SF Norge AS 947714732 Oslo 100 Paradox Holding AS 980184234 Oslo 100 Paradox Film 1 AS 998068290 Oslo 100 Paradox Film 2 AS 998092701 Oslo 100 Paradox Film 3 AS 998092566 Oslo 100 Paradox Film 4 - Knerten AS 916102372 Oslo 100 Paradox Film 5 - Knerten AS 918753702 Oslo 100 Paradox Film 7 AS 918054421 Oslo 100 Paradox Rettigheter AS 980523691 Oslo 100 PDX Production Services AS 990889279 Oslo 100 SF Studios Production AB 556600-3397 Stockholm 100 SF Studios Production Talent AB 559062-1024 Stockholm 100Bonnier Euro Holding AB 556725-8644 Stockholm 100 Bonnier Broadcasting Holding AB 556906-0824 Stockholm 100 Bonnier Broadcasting Sweden AB 556246-8164 Stockholm 100 Bonnier Broadcasting AB 556802-5646 Stockholm 100 C More Entertainment AB 556053-7309 Stockholm 100 C More Entertainment Finland Oy 1530976-4 Helsinki 100 Scandinavian Talents AB 556854-2855 Stockholm 100 TV4 AB 556242-7152 Stockholm 100 Mediahub Helsinki Oy 2618182-3 Helsinki 100 MTV Oy 1093944-1 Helsinki 100Bonnier Magazine Group A/S 53376614 Copenhagen 100 Bonnier Magazine Data A/S 26340136 Copenhagen 100 Bonnier Publications A/S 12376405 Copenhagen 100 Allt om Historia AB 556745-4722 Malmö 100 Benjamin Media A/S 25796829 Copenhagen 100 Bonnier Publications AB 556105-0351 Stockholm 100 Bonnier Lottery AB 556525-5535 Stockholm 100 Svenska Lotteribolaget AB 559111-6172 Stockholm 100 Bonnier Publications Försäljning AB 556548-7096 Stockholm 100 Bonnier Publications International AS 977041066 Oslo 100 Bonnier Media AS 998551676 Oslo 100 Børsen Associated Media A/S 20052678 Copenhagen 50 Dagbladet Børsen A/S 76156328 Copenhagen 50 SF Film A/S 21388939 Copenhagen 100 SF Studios Production ApS 26390168 Copenhagen 100Bonnier US AB 556262-5052 Stockholm 100 Spring Media Inc. 20-4505209 Delaware 100 Bonnier Growth Investments, Inc. 82-1826148 Delaware 100 Bonnier Publishing USA, Inc 46-5608735 Delaware 100 Bonnier US Holding Inc. 98-0494191 Delaware 100
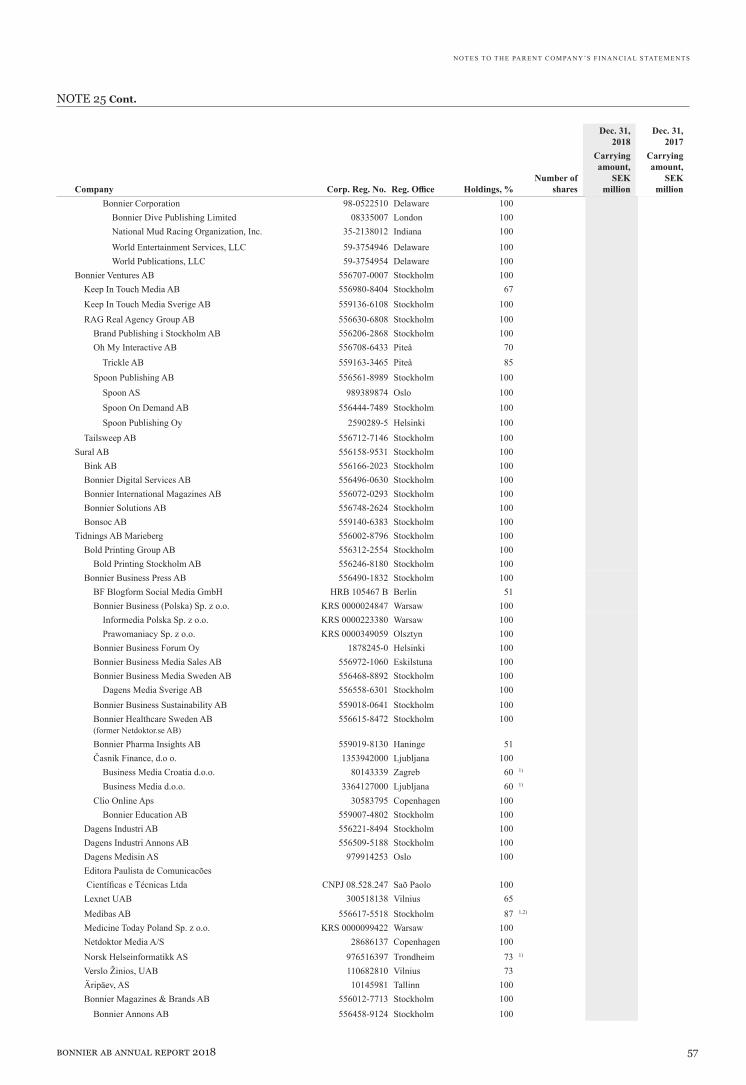
57bonnier ab annual report 2018
Dec. 31, 2018
Dec. 31, 2017
Company Corp. Reg. No. Reg. Office Holdings, %Number of
shares
Carrying amount,
SEK million
Carrying amount,
SEK million
NOTE 25 Cont.
N O T E S TO T H E PA R E N T C O M PA N Y’S F I N A N C I A L S TAT E M E N T S
Bonnier Corporation 98-0522510 Delaware 100 Bonnier Dive Publishing Limited 08335007 London 100 National Mud Racing Organization, Inc. 35-2138012 Indiana 100
World Entertainment Services, LLC 59-3754946 Delaware 100 World Publications, LLC 59-3754954 Delaware 100Bonnier Ventures AB 556707-0007 Stockholm 100 Keep In Touch Media AB 556980-8404 Stockholm 67 Keep In Touch Media Sverige AB 559136-6108 Stockholm 100 RAG Real Agency Group AB 556630-6808 Stockholm 100
Brand Publishing i Stockholm AB 556206-2868 Stockholm 100 Oh My Interactive AB 556708-6433 Piteå 70 Trickle AB 559163-3465 Piteå 85 Spoon Publishing AB 556561-8989 Stockholm 100 Spoon AS 989389874 Oslo 100 Spoon On Demand AB 556444-7489 Stockholm 100 Spoon Publishing Oy 2590289-5 Helsinki 100 Tailsweep AB 556712-7146 Stockholm 100Sural AB 556158-9531 Stockholm 100 Bink AB 556166-2023 Stockholm 100 Bonnier Digital Services AB 556496-0630 Stockholm 100 Bonnier International Magazines AB 556072-0293 Stockholm 100 Bonnier Solutions AB 556748-2624 Stockholm 100 Bonsoc AB 559140-6383 Stockholm 100Tidnings AB Marieberg 556002-8796 Stockholm 100 Bold Printing Group AB 556312-2554 Stockholm 100 Bold Printing Stockholm AB 556246-8180 Stockholm 100 Bonnier Business Press AB 556490-1832 Stockholm 100 BF Blogform Social Media GmbH HRB 105467 B Berlin 51 Bonnier Business (Polska) Sp. z o.o. KRS 0000024847 Warsaw 100 Informedia Polska Sp. z o.o. KRS 0000223380 Warsaw 100 Prawomaniacy Sp. z o.o. KRS 0000349059 Olsztyn 100 Bonnier Business Forum Oy 1878245-0 Helsinki 100 Bonnier Business Media Sales AB 556972-1060 Eskilstuna 100 Bonnier Business Media Sweden AB 556468-8892 Stockholm 100 Dagens Media Sverige AB 556558-6301 Stockholm 100 Bonnier Business Sustainability AB 559018-0641 Stockholm 100 Bonnier Healthcare Sweden AB (former Netdoktor.se AB)
556615-8472 Stockholm 100
Bonnier Pharma Insights AB 559019-8130 Haninge 51 Časnik Finance, d.o o. 1353942000 Ljubljana 100 Business Media Croatia d.o.o. 80143339 Zagreb 60 1)
Business Media d.o.o. 3364127000 Ljubljana 60 1)
Clio Online Aps 30583795 Copenhagen 100 Bonnier Education AB 559007-4802 Stockholm 100 Dagens Industri AB 556221-8494 Stockholm 100 Dagens Industri Annons AB 556509-5188 Stockholm 100 Dagens Medisin AS 979914253 Oslo 100 Editora Paulista de Comunicacões Científicas e Técnicas Ltda CNPJ 08.528.247 Saõ Paolo 100 Lexnet UAB 300518138 Vilnius 65 Medibas AB 556617-5518 Stockholm 87 1,2)
Medicine Today Poland Sp. z o.o. KRS 0000099422 Warsaw 100 Netdoktor Media A/S 28686137 Copenhagen 100 Norsk Helseinformatikk AS 976516397 Trondheim 73 1)
Verslo Žinios, UAB 110682810 Vilnius 73 Äripäev, AS 10145981 Tallinn 100 Bonnier Magazines & Brands AB 556012-7713 Stockholm 100 Bonnier Annons AB 556458-9124 Stockholm 100
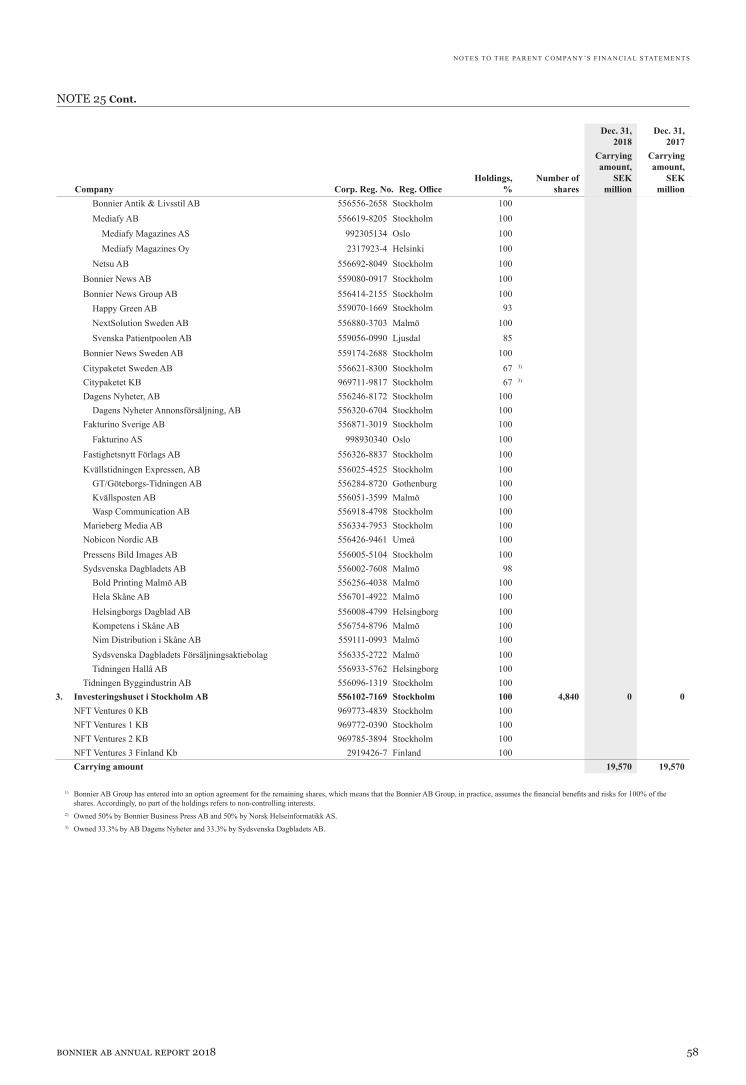
58bonnier ab annual report 2018
NOTE 25 Cont.
Dec. 31, 2018
Dec. 31, 2017
Company Corp. Reg. No. Reg. OfficeHoldings,
%Number of
shares
Carrying amount,
SEK million
Carrying amount,
SEK million
N O T E S TO T H E PA R E N T C O M PA N Y’S F I N A N C I A L S TAT E M E N T S
Bonnier Antik & Livsstil AB 556556-2658 Stockholm 100 Mediafy AB 556619-8205 Stockholm 100 Mediafy Magazines AS 992305134 Oslo 100 Mediafy Magazines Oy 2317923-4 Helsinki 100 Netsu AB 556692-8049 Stockholm 100 Bonnier News AB 559080-0917 Stockholm 100 Bonnier News Group AB 556414-2155 Stockholm 100 Happy Green AB 559070-1669 Stockholm 93 NextSolution Sweden AB 556880-3703 Malmö 100 Svenska Patientpoolen AB 559056-0990 Ljusdal 85 Bonnier News Sweden AB 559174-2688 Stockholm 100 Citypaketet Sweden AB 556621-8300 Stockholm 67 3)
Citypaketet KB 969711-9817 Stockholm 67 3)
Dagens Nyheter, AB 556246-8172 Stockholm 100 Dagens Nyheter Annonsförsäljning, AB 556320-6704 Stockholm 100 Fakturino Sverige AB 556871-3019 Stockholm 100 Fakturino AS 998930340 Oslo 100 Fastighetsnytt Förlags AB 556326-8837 Stockholm 100 Kvällstidningen Expressen, AB 556025-4525 Stockholm 100 GT/Göteborgs-Tidningen AB 556284-8720 Gothenburg 100 Kvällsposten AB 556051-3599 Malmö 100 Wasp Communication AB 556918-4798 Stockholm 100 Marieberg Media AB 556334-7953 Stockholm 100 Nobicon Nordic AB 556426-9461 Umeå 100 Pressens Bild Images AB 556005-5104 Stockholm 100 Sydsvenska Dagbladets AB 556002-7608 Malmö 98 Bold Printing Malmö AB 556256-4038 Malmö 100 Hela Skåne AB 556701-4922 Malmö 100 Helsingborgs Dagblad AB 556008-4799 Helsingborg 100 Kompetens i Skåne AB 556754-8796 Malmö 100 Nim Distribution i Skåne AB 559111-0993 Malmö 100 Sydsvenska Dagbladets Försäljningsaktiebolag 556335-2722 Malmö 100 Tidningen Hallå AB 556933-5762 Helsingborg 100 Tidningen Byggindustrin AB 556096-1319 Stockholm 100
3. Investeringshuset i Stockholm AB 556102-7169 Stockholm 100 4,840 0 0NFT Ventures 0 KB 969773-4839 Stockholm 100NFT Ventures 1 KB 969772-0390 Stockholm 100NFT Ventures 2 KB 969785-3894 Stockholm 100NFT Ventures 3 Finland Kb 2919426-7 Finland 100Carrying amount 19,570 19,570
1) Bonnier AB Group has entered into an option agreement for the remaining shares, which means that the Bonnier AB Group, in practice, assumes the financial benefits and risks for 100% of the shares. Accordingly, no part of the holdings refers to non-controlling interests.
2) Owned 50% by Bonnier Business Press AB and 50% by Norsk Helseinformatikk AS.3) Owned 33.3% by AB Dagens Nyheter and 33.3% by Sydsvenska Dagbladets AB.

59bonnier ab annual report 2018
Definition of key ratios
EBITAOperating profit or loss (including associated companies and joint ventures) before items related to acquisitions, divestments and close-downs together with amortization/impairment losses of group excess values.
EBITA marginEBITA as a percentage of net sales.
Operating CapitalTotal assets less non-interest-bearing liabilities and interest-bearing assets.
Net debt/equity ratio (gearing)Interest-bearing liabilities less interest-bearing assets divided by total equity (i.e. including non-controlling interests).
Return on Operating CapitalOperating profit or loss as a percentage of the average total assets, less non-interest-bearing liabilities, and less interest-bearing assets.
Operating marginOperating profit as a percentage of net sales.
Equity/assets ratioEquity including non-controlling interests divided by total assets.
Internally generated funds EBITA, excluding depreciation, amortization and impairment losses, earnings from associated companies and joint ventures, and capital gain from intangible assets and property, plant and equipment, with the addition of dividends received from associated companies and joint ventures, net financial items (excluding items not included in cash flow) and taxes paid.
60bonnier ab annual report 2018
The Annual Report and consolidated financial statements were approved for issue by the Board of Directors on April 24, 2019. The Consolidated Income Statement and Statement of Financial Position, and the Parent Company’s Income Statement and Balance Sheet are subject to approval by the Annual General Meeting on May 16 , 2019.
The Board of Directors and CEO hereby certify that the annual report has been prepared according to the Swedish Annual Accounts Act and RFR 2 Accounting for Legal Entities and provides a true and fair view of the Company’s financial position and results, and that the Board of Directors’ Report gives a true and fair view of the progress of the Company’s operations, financial position and results, and describes significant risks and uncertainties facing the Company. The Board of Directors and CEO certify that the consolidated financial statements have been prepared in accordance with International Financial Reporting Standards (IFRS), as adopted by the EU, and provide a true and fair picture of the Group’s position and results, and that the Board of Directors’ Report for the Group provide a true and fair view of the progress of the Group’s operations, position and results, and describe significant risks and uncertainties which the companies included in the Group may face.
Stockholm, April 24, 2019
Bengt Braun Chairman
Åsa Wirén Göran Öhrn Board member Board member
Erik Haegerstrand Chief executive officer
Our audit report was issued on April 25, 2019
PricewaterhouseCoopers AB
Michael BengtssonAuthorized public accountant

61bonnier ab annual report 2018
To the general meeting of the shareholders of Bonnier AB, corporate identity number 556508-3663
Report on the annual accounts and consolidated accounts
Opinions We have audited the annual accounts and consolidated accounts of Bonnier AB for 2018 with the exception of the sustainability report found on pages 5-13.
In our opinion, the annual accounts have been prepared in ac-cordance with the Annual Accounts Act and present fairly, in all material respects, the financial position of parent company as of 31 December 2018 and its financial performance and cash flow for the year then ended in accordance with the Annual Accounts Act. The consolidated accounts have been prepared in accordance with the Annual Accounts Act and present fairly, in all material respects, the financial position of the group as of 31 December 2018 and their financial performance and cash flow for the year then ended in accordance with International Financial Reporting Standards (IFRS), as adopted by the EU, and the Annual Accounts Act. Our opinions do not cover the sustainability report found on pages 5-13. The statutory administration report is consistent with the other parts of the annual accounts and consolidated accounts.
We therefore recommend that the general meeting of share-holders adopts the income statement and balance sheet for the parent company and the group.
Basis for OpinionsWe conducted our audit in accordance with International Stan-dards on Auditing (ISA) and generally accepted auditing standards in Sweden. Our responsibilities under those standards are further described in the Auditor’s Responsibilities section. We are inde-pendent of the parent company and the group in accordance with professional ethics for accountants in Sweden and have otherwise fulfilled our ethical responsibilities in accordance with these requirements.
We believe that the audit evidence we have obtained is suf-ficient and appropriate to provide a basis for our opinions.
Other Information than the annual accounts and consolidated accounts It is the Board of Directors and Managing Director who has responsibility for the other information. The other information is comprised of the sustainability report on pages 5-13 in the annual accounts and information found in the “Bonnier Annual Review 2018”.
Our opinions regarding the annual accounts and consolidated accounts do not include this information and we provide no assur-ance regarding this other information.
In connection with our audit of the annual accounts and consolidated accounts, our responsibility is to read the information identified above and consider whether the information is materi-ally inconsistent with the annual accounts and consolidated ac-counts. In this procedure we also take into account our knowledge otherwise obtained in the audit and assess whether the informa-tion otherwise appears to be materially misstated.
If we, based on the work performed concerning this informa-tion, conclude that there is a material misstatement of this other information, we are required to report that fact. We have nothing to report in this regard.
Responsibilities of the Board of Directors and the Managing Director The Board of Directors and the Managing Director are respon-sible for the preparation of the annual accounts and consolidated accounts and that they give a fair presentation in accordance with the Annual Accounts Act and, concerning the consolidated ac-counts, in accordance with IFRS as adopted by the EU. The Board
of Directors and the Managing Director are also responsible for such internal control as they determine is necessary to enable the preparation of annual accounts and consolidated accounts that are free from material misstatement, whether due to fraud or error.
In preparing the annual accounts and consolidated accounts, The Board of Directors and the Managing Director are responsible for the assessment of the company’s and the group’s ability to continue as a going concern. They disclose, as applicable, matters related to going concern and using the going concern basis of ac-counting. The going concern basis of accounting is however not ap-plied if the Board of Directors and the Managing Director intends to liquidate the company, to cease operations, or has no realistic alternative but to do so. Auditor’s responsibility Our objectives are to obtain reasonable assurance about whether the annual accounts and consolidated accounts as a whole are free from material misstatement, whether due to fraud or error, and to issue an auditor’s report that includes our opinions. Reasonable assurance is a high level of assurance, but is not a guarantee that an audit conducted in accordance with ISAs and generally accepted auditing standards in Sweden will always detect a material mis-statement when it exists. Misstatements can arise from fraud or error and are considered material if, individually or in the aggre-gate, they could reasonably be expected to influence the economic decisions of users taken on the basis of these annual accounts and consolidated accounts. As a part of our audit according to ISA, we undertake professional judgments and have a professionally skeptical approach during the entire audit. In addition, we execute the following activities:
• We identify and assess the risk of material misstatement in the annual accounts and consolidated accounts, whether due to fraud or error, design and execute audit measures based, amongst other things, on these risks and obtain audit evidence which is sufficient and appropriate to comprise the basis of our opinion. The risk for failing to identify material misstatements arising due to fraud is greater as regards a material misstatement due to error, as fraud can include engagement in collusion, forgery, in-tentional omission, incorrect information or disregard of internal control.
• We obtain an understanding of that portion of the company’s internal control having significance to our audit to design audit measures which are appropriate with regard to the circumstances but we do not express an opinion on the effectiveness of the internal control.
• We evaluate the appropriateness of the accounting policies applied and the reasonability of the Board of Director’s and Managing Director’ estimations in the accounts and associated disclosures.
• We test the appropriateness of the Board and Director’s and Managing Director’s application of the assumption of going concern in preparing the annual accounts. We test, based on the audit evidence obtained, whether there are significant factors of uncertainty referring to such events or circumstances that can lead to significant doubt as to the company’s capacity to continue its operations. If we come to the conclusion that there are significant factors of uncertainty, we are requested to provide a statement in the Auditor’s Report, noting that the disclosures in the annual accounts and consolidated accounts involve factors of uncertainty, provided that such information is insufficient, modifying our opinion regarding the annual and consolidated accounts. Our conclusions are based on the auditor’s evidence obtained up until the date of the Auditor’s Report. However, future events or circumstances can imply that the company can no longer continue its operations.
Auditor’s Report

62bonnier ab annual report 2018
• We evaluate the overall presentation, structure and content of the annual and consolidated accounts, including the disclosures, and if the annual and consolidated accounts reflect the underly-ing transactions and events in a manner providing a true and fair view.
We are required to inform the Board of Directors of, amongst other things, the planned scope of the audit and its focus, and the time schedule for the audit. We are also required to inform on any sig-nificant observations made during the audit, including identified significant deficiencies in the internal control.
Report on other legal and regulatory requirements Opinions In addition to our audit of the annual accounts and consolidated accounts, we have also audited the administration of the Board of Directors and the Managing Director of Bonnier AB for 2016 and the proposed appropriations of the company’s profit or loss.
We recommend to the general meeting of shareholders that the profit be appropriated in accordance with the proposal in the statutory administration report and that the members of the Board of Directors and the Managing Director be discharged from liabil-ity for the financial year.
Basis for Opinions We conducted the audit in accordance with generally accepted auditing standards in Sweden. Our responsibilities under those standards are further described in the Auditor’s Responsibilities section. We are independent of the parent company and the group in accordance with professional ethics for accountants in Sweden and have otherwise fulfilled our ethical responsibilities in accor-dance with these requirements.
We believe that the audit evidence we have obtained is suf-ficient and appropriate to provide a basis for our opinions.
Responsibilities of the Board of Directors and the Managing Director The Board of Directors is responsible for the proposal for ap-propriations of the company’s profit or loss. At the proposal of a dividend, this includes an assessment of whether the dividend is justifiable considering the requirements which the company’s and the group’s type of operations, size and risks place on the size of the parent company’s and the group’s equity, consolidation requirements, liquidity and position in general.
The Board of Directors is responsible for the company’s organization and the administration of the company’s affairs. This includes among other things continuous assessment of the company’s and the group’s financial situation and ensuring that the company’s organization is designed so that the accounting, management of assets and the company’s financial affairs other-wise are controlled in a reassuring manner. The Managing Director shall manage the ongoing administration according to the Board of Directors’ guidelines and instructions and among other matters take measures that are necessary to fulfil the company’s accounting in accordance with law and handle the management of assets in a reassuring manner.
Auditor’s responsibilityOur objective concerning the audit of the administration, and thereby our opinion about discharge from liability, is to obtain audit evidence to assess with a reasonable degree of assurance whether any member of the Board of Directors or the Managing Director in any material respect:
• has undertaken any action or been guilty of any omission which can give rise to liability to the company, or
• in any other way has acted in contravention of the Companies Act, the Annual Accounts Act or the Articles of Association. Our objective concerning the audit of the proposed appropriations of the company’s profit or loss, and thereby our opinion about this, is to assess with reasonable degree of assurance whether the proposal is in accordance with the Companies Act.
Reasonable assurance is a high level of assurance, but is not a guarantee that an audit conducted in accordance with generally accepted auditing standards in Sweden will always detect actions or omissions that can give rise to liability to the company, or that the proposed appropriations of the company’s profit or loss are not in accordance with the Companies Act.As part of an audit in accordance with generally accepted auditing standards in Sweden we exercise professional judgment and main-tain professional skepticism throughout the audit. The examina-tion of the administration and the proposed appropriations of the company’s profit or loss is based primarily on the audit of the accounts. Additional audit procedures performed are based on our professional judgement with starting point in risk and materiality. This means that we focus the examination on such actions, areas and relationships that are material for the operations and where deviations and violations would have particular importance for the company’s situation. We examine and test decisions undertaken, support for decisions, actions taken and other circumstances that are relevant to our opinion concerning discharge from liability. As a basis for our opinion on the Board of Directors’ proposed appropriations of the company’s profit or loss, we examined The Board of Director’s Directors’ reasoned statement and a selection of supporting evidence in order to be able to assess whether the proposal is in accordance with the Companies Act. Auditor’s statement regarding the statutory sustainability reportIt is the Board of Directors who has responsibility for the sustain-ability report on pages 5-13 and that it has been prepared in ac-cordance with the Annual Accounts Act.
Our audit has been performed in accordance FAR’s statement RevR 12, Auditor’s statement on the statutory sustainability report. This implies that our audit of the statutory sustainability report has another focus and is significantly more limited in scope compared with the focus and scope of an audit according to International Standards on Auditing and generally accepted auditing standards in Sweden. We believe that this audit provides us with sufficient grounds for our opinion.
A sustainability report has been prepared.
Stockholm April 25, 2019
PricewaterhouseCoopers AB
Michael BengtssonAuthorized Public Accountant

63bonnier ab annual report 2018
Multi-year Summary
From the income statementSEK million 2018 2017 2016 2015 2014 2013 2012Net sales 26,447 25,740 25,492 25,906 23,702 24,354 26,931Growth 2.7% 1.0% -1.6% 9.3% -2.7% -9.6% -2.4%EBITA 824 625 731 1,008 1,103 1,172 918EBITA margin 3.1% 2.4% 2.9% 3.9% 4.7% 4.8% 3.4%Operating profit/loss -225 -1,423 630 3) 939 892 2,888 802Operating margin -0.9% 5.5% 2.5% 3) 3.6% 3.8% 11.9% 3.0%Profit/loss before tax -382 -1,635 391 3) 709 527 2,591 500Profit/loss for the year -872 -2,239 276 3) 43 310 2,204 289
From the statements of financial position December 31, SEK million 2018 2017 2016 2015 2014 2013 2012Operating capital 11,393 12,473 13,292 3) 12,924 12,002 13,554 13,833Return on operating capital -1.9% -11.0% 4.8% 3) 7.5% 7.0% 21.1% 5.9%Net debt 7,743 8,553 7,376 6,613 5,395 6,526 9,271Equity incl. non-controlling interests 3,650 3,921 5,916 3) 6,311 6,607 7,028 4,562Total assets 20,025 21,312 22,548 3) 22,560 21,624 21,166 22,281Net debt / equity, multiple 2.12 2.18 1.25 3) 1.05 0.82 0.93 2.03
From change in net debtSEK million 2018 2017 2016 2015 2014 2013 2012Cash flow after operating investments 276 -740 -354 87 1,609 1,547 -30Net acquisitions and divestments of
operations, shares and participations70 -116 128 -615 941 928 -206
Cash flow after acquisitions and divestments 346 -856 -226 -528 2,550 2,475 -236Change in net debt (–=increased debt) 810 -1,177 -763 -1,218 1,131 2,745 -611
From the business areas’ financial reportsSEK million 1, 2) 2018 2017 2016 2015 2014Net salesBooks 6,334 6,274 6,064 5,621 5,303E-Commerce 2,247 2,002 1,775 1,470 1,282Broadcasting 8,253 7,497 7,397 7,738 6,448Film Studios 1,256 1,389 1,334 1,521 1,408Ventures 358 402 457 621 538Magazines 3,060 3,455 3,799 4,072 3,968Business to Business 1,202 1,130 1,111 1,141 977News 5,004 4,890 4,679 4,856 4,874
2) In 2017, business was transferred from Business to Business to News. Comparative figures for 2014 - 2016 have therefore been adjusted.3) Figures for 2016 were restated in 2017 due to a reevaluation of the Group’s accounting for intangible assets and inventory relating to development costs and publishing rights, and correction of errors.
1) As of 2018, the Group has eight business areas, compared with six previously. E-Commerce, which includes the Adlibris Group, was formerly part of Books. The business area Ventures has changed its name from Growth Media, and Film Studios, which was previously part of Growth Media, is now, as of 2018, a separate business area. Operations have also been transferred from Growth Media to Magazines. As a result, figures presented for comparison for the years 2014-2017 have been restated.
Other and eliminations -1,267 -1,299 -1,124 -1,135 -1,095Bonnier AB, total 26,447 25,740 25,492 25,906 23,702
SEK million 1, 2) 2018 2017 2016 2015 2014EBITABooks 154 74 380 406 409E-Commerce -125 31 47 17 27Broadcasting 1,027 423 373 417 589Film Studios 17 -14 -29 6 -145Ventures -18 -93 -175 -135 -43Magazines 34 168 265 253 310Business to Business 104 131 164 165 123News 159 303 294 369 341Other -528 -397 -589 -488 -508Bonnier AB, total 824 625 731 1,008 1,103

64bonnier ab annual report 2018
Bonnier AB SE-113 90 Stockholm, Sweden
+46 8 736 40 00 www.bonnier.se