2018 business intelligence buyer’s guide is a business intelligence software provider that...
TRANSCRIPT
1
2018BUSINESS INTELLIGENCEBUYER’S GUIDE
© 2018 | Solutions Review | 500 West Cummings Park | Woburn, Massachusetts 01801 | USA
BUSINESS INTELLIGENCE BUYER’S GUIDE
2
MARKET OVERVIEWThe lines that used to define solution categories in the enterprise are beginning to blur. Technologies that were once considered staples of BI and analytics software are no longer adequate in the age of big data. As a result, solution providers have had to alter to their product portfolios to meet the needs of companies dealing with pressure associated with an increase in data volumes. In order to fill the gaps that larger vendors have left due to this market shift, innovative startups have emerged to offer capabilities once left to specialized software providers.
Traditional BI providers continue to offer dashboard and reporting capabilities that have remained staples to the market since widespread adoption of data analytics began more than a decade ago. Disruptive newcomers are bringing new technologies to the table so that organizations can take full advantage of data. These product capabilities are prevalent among the lesser known providers in this buyer’s guide.
Chief amongst these new use cases is data discovery, a technology that provides business users the ability to locate data that is relevant to a specific task. This capability can come in a variety of forms, but data source connectivity is a key attribute. Data preparation is also a major tenant to the modern BI platform. With end-user self-service a prominent focus for analytics vendors, providing organizations with the ability to discover and prepare data for analysis are important considerations.
As you read through the vendor profiles in this buyer’s guide, you’ll begin to notice commonalities in the key features. Support for many data sources, including various database setups, data lake, big data sources like Hadoop, and cloud platforms, are mainstream. Readers will also see that advanced analytic methods utilizing AI algorithms and machine learning are quietly becoming the industry standard. The ability to embed analytics into OEM applications and deploy BI to the cloud are not new, but hold firm as popular features. As big data grows, so too does the need for regulatory compliance and security. In this way, data governance is emerging as a staple technology in many of the top tools listed.
The BI and analytics marketplace is mature and crowded with excellent software tools for a variety of use cases, verticals, deployment methods, and budgets. There are very large providers we refer to as ‘mega-vendors’, like Microsoft, Tableau, Qlik, SAP, and IBM. There are also lesser-known innovators with interesting products that play in niche areas, such as ThoughtSpot, Logi Analytics, Pyramid Analytics, and ClearStory Data.
BI and analytics has been a top-trending priority for global CIOs for more than six years. Solutions Review has developed this buyer’s guide to assist buyers in search of the best possible tool to fit the needs of their organization. This resource features 10 important questions to ask during the buying process, and full, one-page vendor profiles that provide a solution overview, three key features, contact information, and our own ‘Bottom Line’ analysis. Companion research, including our popular BI Buyer’s Matrix Report, can be found at Solutionsreview.com.
Tim King, Senior EditorSolutions Review
© 2018 | Solutions Review | 500 West Cummings Park | Woburn, Massachusetts 01801 | USA
BUSINESS INTELLIGENCE BUYER’S GUIDE
3
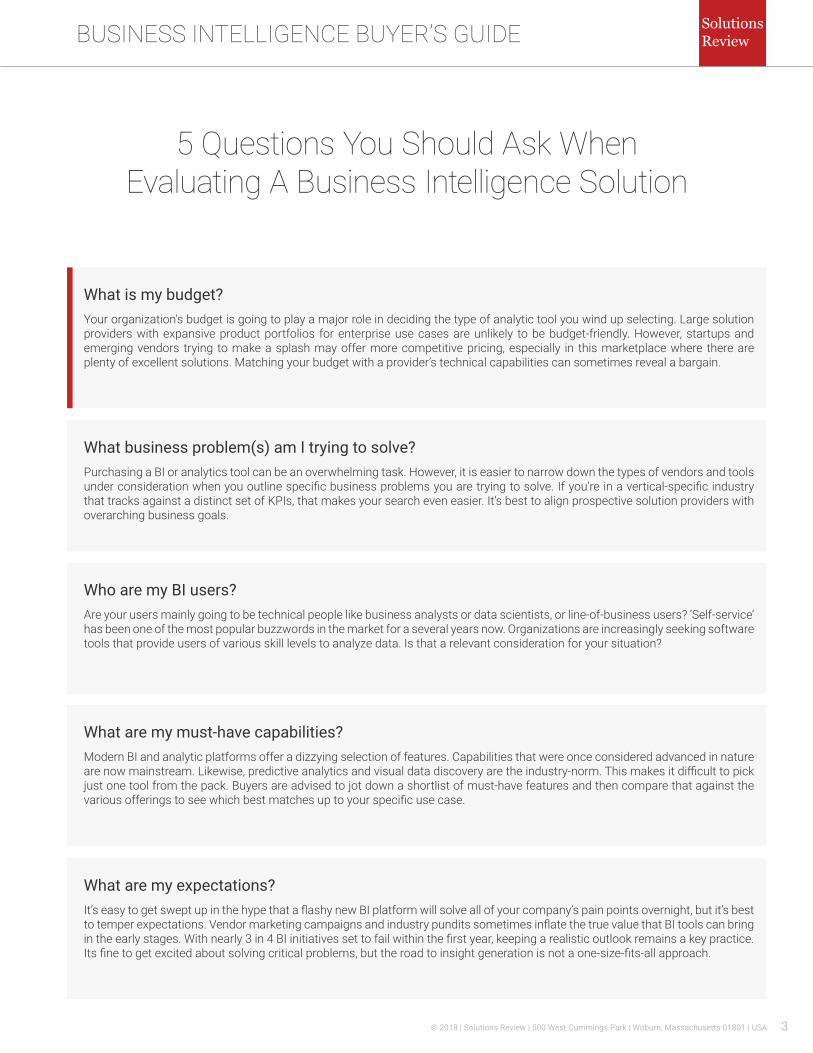
5 Questions You Should Ask When Evaluating A Business Intelligence Solution
Your organization’s budget is going to play a major role in deciding the type of analytic tool you wind up selecting. Large solution providers with expansive product portfolios for enterprise use cases are unlikely to be budget-friendly. However, startups and emerging vendors trying to make a splash may offer more competitive pricing, especially in this marketplace where there are plenty of excellent solutions. Matching your budget with a provider’s technical capabilities can sometimes reveal a bargain.
Are your users mainly going to be technical people like business analysts or data scientists, or line-of-business users? ‘Self-service’ has been one of the most popular buzzwords in the market for a several years now. Organizations are increasingly seeking software tools that provide users of various skill levels to analyze data. Is that a relevant consideration for your situation?
Purchasing a BI or analytics tool can be an overwhelming task. However, it is easier to narrow down the types of vendors and tools under consideration when you outline specific business problems you are trying to solve. If you’re in a vertical-specific industry that tracks against a distinct set of KPIs, that makes your search even easier. It’s best to align prospective solution providers with overarching business goals.
Modern BI and analytic platforms offer a dizzying selection of features. Capabilities that were once considered advanced in nature are now mainstream. Likewise, predictive analytics and visual data discovery are the industry-norm. This makes it difficult to pick just one tool from the pack. Buyers are advised to jot down a shortlist of must-have features and then compare that against the various offerings to see which best matches up to your specific use case.
It’s easy to get swept up in the hype that a flashy new BI platform will solve all of your company’s pain points overnight, but it’s best to temper expectations. Vendor marketing campaigns and industry pundits sometimes inflate the true value that BI tools can bring in the early stages. With nearly 3 in 4 BI initiatives set to fail within the first year, keeping a realistic outlook remains a key practice. Its fine to get excited about solving critical problems, but the road to insight generation is not a one-size-fits-all approach.
What is my budget?
Who are my BI users?
What business problem(s) am I trying to solve?
What are my must-have capabilities?
What are my expectations?
© 2018 | Solutions Review | 500 West Cummings Park | Woburn, Massachusetts 01801 | USA
BUSINESS INTELLIGENCE BUYER’S GUIDE
4
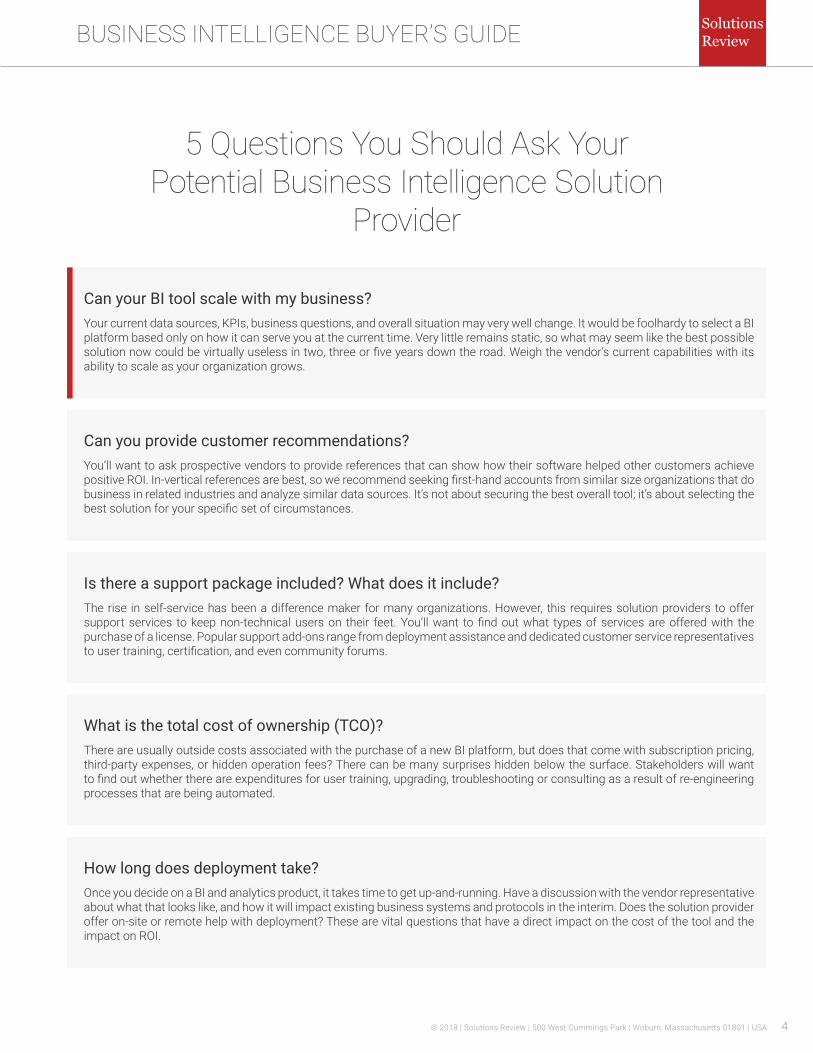
5 Questions You Should Ask Your Potential Business Intelligence Solution
Provider
Your current data sources, KPIs, business questions, and overall situation may very well change. It would be foolhardy to select a BI platform based only on how it can serve you at the current time. Very little remains static, so what may seem like the best possible solution now could be virtually useless in two, three or five years down the road. Weigh the vendor’s current capabilities with its ability to scale as your organization grows.
The rise in self-service has been a difference maker for many organizations. However, this requires solution providers to offer support services to keep non-technical users on their feet. You’ll want to find out what types of services are offered with the purchase of a license. Popular support add-ons range from deployment assistance and dedicated customer service representatives to user training, certification, and even community forums.
You’ll want to ask prospective vendors to provide references that can show how their software helped other customers achieve positive ROI. In-vertical references are best, so we recommend seeking first-hand accounts from similar size organizations that do business in related industries and analyze similar data sources. It’s not about securing the best overall tool; it’s about selecting the best solution for your specific set of circumstances.
There are usually outside costs associated with the purchase of a new BI platform, but does that come with subscription pricing, third-party expenses, or hidden operation fees? There can be many surprises hidden below the surface. Stakeholders will want to find out whether there are expenditures for user training, upgrading, troubleshooting or consulting as a result of re-engineering processes that are being automated.
Once you decide on a BI and analytics product, it takes time to get up-and-running. Have a discussion with the vendor representative about what that looks like, and how it will impact existing business systems and protocols in the interim. Does the solution provider offer on-site or remote help with deployment? These are vital questions that have a direct impact on the cost of the tool and the impact on ROI.
Can your BI tool scale with my business?
Is there a support package included? What does it include?
Can you provide customer recommendations?
What is the total cost of ownership (TCO)?
How long does deployment take?
© 2018 | Solutions Review | 500 West Cummings Park | Woburn, Massachusetts 01801 | USA
BUSINESS INTELLIGENCE BUYER’S GUIDE
5
7 .......................................................................................
8 .......................................................................................
9 .......................................................................................
10 .....................................................................................
11 .....................................................................................
12 .....................................................................................
13 .....................................................................................
14 .....................................................................................
15 .....................................................................................
16 .....................................................................................
17 .....................................................................................
18 .....................................................................................
19 .....................................................................................
20 .....................................................................................
21 .....................................................................................
22 .....................................................................................
23 .....................................................................................
24 .....................................................................................
Alteryx
Birst
BOARD
ClearStory Data
Datameer
Domo
Exago
Hitachi Vantara
IBM
icCube
Information Builders
Logi Analytics
Looker
Microsoft
MicroStrategy
Oracle
Phocas Software
Pyramid Analytics
Solution Provider Profiles
© 2018 | Solutions Review | 500 West Cummings Park | Woburn, Massachusetts 01801 | USA
BUSINESS INTELLIGENCE BUYER’S GUIDE
6
25 .....................................................................................
26 .....................................................................................
27 .....................................................................................
28 .....................................................................................
29 .....................................................................................
30 .....................................................................................
31 .....................................................................................
32 .....................................................................................
33 .....................................................................................
34 .....................................................................................
Qlik
SAP
SAS
Sisense
Tableau
TARGIT
ThoughtSpot
TIBCO
Yellowfin
Zoomdata
Solution Provider Profiles
© 2018 | Solutions Review | 500 West Cummings Park | Woburn, Massachusetts 01801 | USA
BUSINESS INTELLIGENCE BUYER’S GUIDE
7
Alteryx is a publically traded self-service analytics software company that specializes in data preparation and data blending. Alteryx Analytics allows users to organize, clean, and analyze data in a repeatable workflow. Business analysts find this tool particularly useful for connecting to and cleansing data from data warehouses, cloud applications, spreadsheets and other sources. The platform features tools to run a variety of analytic jobs (predictive, statistical,
spatial) inside a single interface.
Key Features
Data Preparation and BlendingAlteryx Designer provides access to all relevant data by connecting to and cleansing data from data warehouses, cloud applications, spreadsheets and more. Users can create datasets for analysis or visualization using data quality, integration, and transformation tools.
Scalable Sharing and CollaborationAlteryx Server provides a flexible server architecture that can be deployed on-prem or in the cloud. It allows users to schedule and automate workflow execution for data delivery, and offload data preparation, blending, and analytics into a production-ready environment. Analysts can store, share and publish analytic workflows and applications cross-organization while extending Alteryx processes with APIs and macros into internal apps.
Data DiscoveryAlteryx Connect contains a variety of data discovery tools. It allows users to work with metadata to better understand where data comes from and how it is being used. Included search capabilities provide analysts with the ability to find and reuse information contained in analytic apps, workflows, macros, visualizations, dashboards, and data science models.
230 CommerceIrvine, CA 92602
United States+1 (714) 516-2400www.alteryx.com
Contact Info
Bottom Line
Shortly after going public in the first quarter of 2017, Alteryx acquired data science tools provider Yhat. The company followed up on that acquisition by launching Alteryx Promote, a component that enables data scientists to deploy predictive models directly into business systems. Alteryx offers an expansive platform with many noteworthy analytic features, and their foray into data science tools figures to be a boon to citizen data scientists.
© 2018 | Solutions Review | 500 West Cummings Park | Woburn, Massachusetts 01801 | USA
BUSINESS INTELLIGENCE BUYER’S GUIDE
8
Birst offers a cloud-based analytics solution that connects an organization using a network of interwoven virtualized BI instances. The provider’s flagship product is its Networked BI platform. The tool features an adaptive user experience, multi-tenant cloud architecture, user data tier, and a completely virtualized data ecosystem. These capabilities enable use of BI across multiple regions, product lines, departments, and customers. Birst was acquired by
Infor April 2017.
Key Features
Adaptive User ExperienceThe platform combines dashboards and data discovery into an integrated HTML5 interface. The interface is the same weather it is viewed on the desktop or mobile version. Birst’s 2-tier analytics allow extension to other tools like Excel, R, and Tableau.
User Data TierBirst automates data unification and refining from any enterprise source. The Infinite Connectivity Framework allows scalable access to the chosen source. It uses ‘smart’ technologies to create a Unified Business Model (or business-ready Data Tier) that all users can utilize.
Multi-tenant Cloud ArchitectureBirst automates data unification and refining from any enterprise source. The Infinite Connectivity Framework allows scalable access to the chosen source. It uses ‘smart’ technologies to create a Unified Business Model (or business-ready Data Tier) that all users can utilize.
153 Kearny StreetSan Francisco, CA 94108
United States+1 (866) 940-1496
www.birst.com
Contact Info
Bottom Line
Birst received among the four-highest scores in four of the five use cases assessed in Gartner’s 2017 Critical Capabilities report. The company’s Fall Networked BI update featured enhancements to connectivity, data transformation, networking, interactivity, and administration. Birst is a cloud-first BI and analytic offering, and their merger with Infor back in June figures to bring considerable punch to the platform in the months ahead.
© 2018 | Solutions Review | 500 West Cummings Park | Woburn, Massachusetts 01801 | USA
BUSINESS INTELLIGENCE BUYER’S GUIDE
9
BOARD combines business intelligence, performance management, and predictive analytics into one platform. As a result, any change to data, data models, security profiles or business rules is immediately propagated to every application. The solution provides all the tools required to create and update databases, data presentations, analyses, and process models. The company also offers BOARD Cloud, a SaaS version of the platform, backed by Microsoft
Azure.
Key Features
Data DiscoveryInteractive search-based data discovery works across screens, data, metadata, and applications. BOARD allows any search result to be used immediately as a driver for further analyses or as an element for creating new reports using the tool’s drag-and-drop self-service analysis UI.
SimulationUsers can translate business processes into sophisticated analytical models that enable users to assess the impact of decisions on their organization’s performance. BOARD offers the capability to manage real-time changes to models, data allocation across dimension and hierarchies, and data calculation and aggregation. The Reverse Algorithm extends these features also to calculated fields.
ScorecardingBOARD offers all the functionalities needed to translate company strategy into scorecards and strategy maps so organizations can communicate and roll out key objectives. The unified BI and Performance Management environment allows users to analyze any trend highlighted by the scorecard and explore events affecting KPIs the lowest level of detail.
Piazza Bernasconi 5Palazzo Mercuri
6830 ChiassoSwitzerland
+41 91 911 6020www.board.com
Contact Info
Bottom Line
BOARD is offered on-prem or in the cloud, and the platform unifies any data source into a single logical view. BOARD is based on a proprietary data management technology called HBMP that was designed to enhance the performance of in-memory computing. The company’s flagship solution offers two authentication layers and advanced security management so users can delegate security administration to other key users. BOARD was founded in 1994 and has customers in a wide array of verticals.
© 2018 | Solutions Review | 500 West Cummings Park | Woburn, Massachusetts 01801 | USA
BUSINESS INTELLIGENCE BUYER’S GUIDE
10
ClearStory Data’s flagship platform is loaded with modern data tools, including smart data discovery, automated data preparation, data blending and integration, and advanced analytics. The tool is delivered in the cloud and based off a Spark-centric distributed processing system. ClearStory connects to a wide variety of data sources, including structured and semi-structured data, cloud and web applications, Hadoop, and more. The company was recently awarded a US patent for smart data inference and harmonization. Solutions Review has named ClearStory
Data a Data Preparation Vendor to Watch in 2018.
Key Features
Automated Data PreparationClearStory’s Data Inference automates data preparation by intelligently inferring semantics inside data, reading values, and automating transformations. Users can prepare data on any data source, API-based apps, files or Hadoop. Data Harmonization automatically blends data without rigid modeling by identifying relationships across all data dimensions.
Smart Data DiscoverySmart Data Discovery allows users to instantly discover all data values, patterns, and correlations within a single data source or across blended data. This allows users to focus in on the most critical and relevant data.
StoryBoardsStoryBoards combine insights from one or more analysis in a storyline. Dashboards reveal new insights as data updates, and allow business users to explore and uncover hidden insights with the ‘Explore Insights’ capability.
4300 Bohannon DriveMenlo Park, CA 94025
United States+1 (650) 322-2408
www.clearstorydata.com
Contact Info
Bottom Line
ClearStory Data’s product offers ways for organizations to discover, prepare, and blend data from structured and unstructured sources. ClearStory’s Data Inference tool automates the data preparation process for any data source by inferring semantics in business data, reading values, and automating transformations. The platform is an excellent choice for organizations keen on data access and integration. Users also report that the software is easy to use. However, ClearStory lacks hybrid connectivity, and small deployment sizing may be an issue for larger organizations.
© 2018 | Solutions Review | 500 West Cummings Park | Woburn, Massachusetts 01801 | USA
BUSINESS INTELLIGENCE BUYER’S GUIDE
11
Datameer offers a big data analytics platform that utilizes the native query engines for Hadoop and Spark. The company uses Hadoop for both storage and compute. Datameer is a fully extensible solution that can integrate with existing data warehouse or business intelligence tools. The San Francisco-based vendor specializes in assisting organizations that invest in data lakes and other big data environments that support analytics for four main use cases: customer analytics, operational analytics, enterprise data warehouse (EDW) optimization, and
fraud and compliance.
Key Features
Big Data IntegrationDatameer connects to data from any source, manages how the data is accessed, and offers schema flexibility upon ingestion. The tool features more than 70 connectors to common data sources, and an SDK to the less-common. The integration process is optimized with sampling, parsing, scheduling, and data retention capabilities.
Big Data PreparationDatameer’s data preparation catalogue features more than 270 functions, including extraction, text analytics, sessionization, and geo-location mapping. Users can visually profile data and see steps before performing them. Data preparation, exploration, and analysis are combined into a single interface.
Big Data GovernanceThe multi-stage big data analytics pipeline uses secure data views and apply policies at every stage of the pipeline. These can be configured to expose a subset of fields and apply masking and anonymization to sensitive data fields. Users can also determine how long to keep data and when to purge. Security rules allow retired data to be removed, retained for a time, or manually removed after administrator approval.
1550 Bryant StreetSan Francisco, CA 94103
United States+1 (415) 817-9558
www.datameer.com
Contact Info
Bottom Line
Datameer has moved away from traditional BI and analytic functionality over the last few years. However, the provider has emerged as a major player in the big data analytics market. Datameer is recommended for organizations whose main challenge is data curation or discovery, and their platform is great for those who have complex analytic requirements on big data. The company recently added dynamic visuals to their flagship analytics tool, and a new AWS-based data preparation platform allows organizations to process data closer to where it lives.
© 2018 | Solutions Review | 500 West Cummings Park | Woburn, Massachusetts 01801 | USA
BUSINESS INTELLIGENCE BUYER’S GUIDE
12
Domo, founded in 2010, is designed to provide access to data without the requirement of IT involvement. Their platform can monitor sales and inventories in real time, and integrate with Salesforce, Google Analytics, Box, LinkedIn, Instagram, among others. Their native data source connectors exceed 300, and their Workbench feature allows you to move on-premise data security using their software. Their platform is highly customizable, and their Analyzer feature
can be tailored to filter out unnecessary information.
Key Features
DomoBuzzGives you the ability to have conversations with your workforce where your data is to more effectively communicate, loop in key stakeholders, etc. This includes notifications, preserving historical context, looping in specific employees, and remote collaboration.
Domo MagicEnables you to clean your data, combine datasets, transform and prepare your data without SQL knowledge. Also enables scheduling transformation jobs via ETL capability.
Card BuilderProvides flexible options for data visualization, creative tools, and a simple drag-and-drop interface.
772 E. Utah Valley Dr.American Fork, UT 84003
United States+1 (800) 899-1000www.domo.com
Contact Info
Bottom Line
Domo is a cloud-based executive management platform that enables businesses to see key data in real time from across the entire organization—sales, operations, marketing, HR, finance and more—in one place, on any device.
© 2018 | Solutions Review | 500 West Cummings Park | Woburn, Massachusetts 01801 | USA
BUSINESS INTELLIGENCE BUYER’S GUIDE
13
Exago is a Business Intelligence software provider that provides self-service ad hoc reporting, dashboards and analytics to applications. Headquartered in Shelton, Connecticut, Exago is privately owned, self-funded and profitable. The company’s Embedded Analytics tool, Exago BI, features an open API, extensibility and a fully customizable UI that allows technical staff to further integrate the solution within their environment and across multiple applications and
data sources.
Key Features
100 percent web-basedEnd-users require only an internet browser for full functionality, with no plug-ins required.
Single Sign-OnDesigned as a single sign-on through host application.
Highly CustomizableEach user can configure the features, look, feel, language and data access.
Flexible Deployment OptionsCan be deployed on-site, in the cloud or both.
2 Enterprise DriveShelton, CT 06484
United States+1 (203) 225-0876
www.exagoinc.com
Contact Info
Bottom Line
Exago BI is completely web-based and a prime embedded solution for software companies looking to provide ad hoc reporting, dashboards and business analysis to their clients. Integration with web-based SaaS and or on-prem applications allows non-technical users to create reports and dashboards with no IT intervention. Exago BI offers a wide variety of advanced features including interactive data visualizations, geo-maps, drilldowns, user-defined formulas, and data merging into predefined templates.
© 2018 | Solutions Review | 500 West Cummings Park | Woburn, Massachusetts 01801 | USA
BUSINESS INTELLIGENCE BUYER’S GUIDE
14
Pentaho was acquired by Hitachi Data Systems (HDS) in 2015. Post-merger, Pentaho had been offered as a standalone software platform until recently when Hitachi combined the Pentaho, HDS and Hitachi Insight Groups into a new unit called Hitachi Vantara. Future releases of the Pentaho platform will be released under the Hitachi Vantara branding. The Pentaho platform offers a range of capabilities for big data integration, analytics, and data preparation. The solution is popularly deployed for embedded use cases. Pentaho is offered in on-prem and
cloud versions.
Key Features
Embedded AnalyticsThe Pentaho platform is purpose-built for embedding into and integrating with applications, portals, and processes. Organizations can embed a range of analytics, including visualizations, reports, ad hoc analysis, and tailored dashboards. It also extends to third party charts, graphs, and visualizations via an open API for a wider selection of embeddable analytics.
Data IntegrationData integration allows users to blend, orchestrate, and analyze data from virtually any source. Pentaho can be deployed on a variety of public or private cloud providers, including Amazon Web Services and Microsoft Azure. Users can also integrate and analyze Amazon Redshift, Hadoop, and other big data sources in the cloud.
Graphical DashboardsGraphical dashboards are web-based and feature a drag-and-drop design that includes rich navigation, drilling, and a library of filter controls. Users can custom-build dashboards that are uniquely tailored to their organization, and portal and mash-up integration connects business analytics with other applications.
2845 Lafayette StreetSanta Clara, CA 95050
United States+1 (866) 660-7555
www.hitachivantara.com
Contact Info
Bottom Line
The Pentaho data platform is unique because it encompasses data integration and BI and analytic capabilities. Hitachi Vantara unveiled Pentaho 8 in October, adding support for Spark and Kafka to improve stream processing. The update also included security feature add-ons and a way for users to match compute resources with business demands in real-time. Organizations are increasingly deploying Pentaho for embedded use cases. However, self-contained ETL and integration, data preparation, data storage, and security make this tool an excellent choice for companies that want to implement only a single product.
© 2018 | Solutions Review | 500 West Cummings Park | Woburn, Massachusetts 01801 | USA
BUSINESS INTELLIGENCE BUYER’S GUIDE
15
IBM offers an expansive range of BI and analytic capabilities under two distinct product lines. The Cognos Analytics platform is an integrated self-service solution that allows users to access data to create dashboards and reports. IBM Watson Analytics offers a machine learning-enabled user experience that includes automated pattern detection, support for natural language query and generation, and embedded advanced analytics capabilities. Cognos is IBM’s ‘flagship’ BI and analytics tool, where Watson is the vendor’s entry into the emerging AI-powered tools
arena.
Key Features
Reporting and VisualizationIBM’s intuitive interface enables any user to author content on the fly, and dashboards can be created using drag-and-drop on desktop or mobile. The visual data explorer automatically recommends the best visualizations for particular data templates. Users can take advantage of on-demand menus for access to full capabilities within one interface in order to create ad hoc reports without IT oversight.
Data ModelingUsers can do data modeling via a completely web-based experience that features direct reporting from data sources and automatic data model generation based on keywords.
Data GovernanceData is protected with layers of permissions, authentication, and history. Data protection controls are including whether a user is creating one report for many or many are creating one report. Additional capabilities include scheduling and alerts.
1 New Orchard RoadArmonk, NY 10504
United States+1 (877) 426-3774
www.ibm.com
Contact Info
Bottom Line
IBM has made real strides to modernize its analytic offerings, and with great success. Cognos remains one of the most widely adopted BI platforms in the enterprise, and Watson Analytics is on the cutting edge of AI-influenced tools. IBM’s BI software can be deployed both on-prem or as a hosted solution via the IBM Cloud. The company’s complete analytics portfolio also includes its SPSS Predictive Analytics, IBM Data Science Experience, and IBM Planning Analytics tools.
© 2018 | Solutions Review | 500 West Cummings Park | Woburn, Massachusetts 01801 | USA
BUSINESS INTELLIGENCE BUYER’S GUIDE
16
icCube is a Swiss BI and analytics company that offers reporting and dashboard tools for software companies looking to embed analytics into their product. They support standard languages such as Java, R, and MDX++, which they extended with a broad range of custom functions. The user interfaces are web-based, and dashboards can be graphically designed from to fit brand experience. icCube offers its capabilities in both on-prem and cloud versions.
Key Features
Embedded AnalyticsicCube was purpose-built to be embedded. Enterprise or OEM integration is fast with the use of JSON APIs, XMLA standard, predefined sources, and on-the-fly authentication and authorization.
Custom BrandingUsers can graphically design dashboards from scratch via a built-in dashboard editor or with Javascript, HTML, and CSS. icCube provides control of click behavior on every widget and data point. Users can also apply filters, configure drill down and drill through actions, and define action permissions.
Flexible ArchitectureicCube works in a single Java process with a modular design that is used across a wide array of industries. It features natively embedded analytical languages such as R. icCube also offers expert dashboard design assistance to shorten development time.
Route de la Pierre 22, 1024 Ecublens
Switzerland+41 21 534 87 43www.iccube.com
Contact Info
Bottom Line
icCube’s embedded analytics platform is flexible and features a multi-tenant architecture. It also takes future growth into account, offering scalable functions and widgets. OEMs may find the white labeling, on-the-fly authentication, and authorization capabilities particularly attractive. icCube should be a high consideration for organizations moving toward production-oriented analytics.
© 2018 | Solutions Review | 500 West Cummings Park | Woburn, Massachusetts 01801 | USA
BUSINESS INTELLIGENCE BUYER’S GUIDE
17
Information Builders is a New York-based solution provider that offers a wide range of BI and data management software tools. The company’s WebFOCUS platform features self-service analytics and data discovery, a visual discovery insight mode, predictive capabilities, and more. WebFOCUS can deploy secure applications to millions of users, and governance functionality enables metadata-driven delivery across an organization. The platform also extends beyond dashboards for executives and analysts by operationalizing data and analytics for line-of-
business users.
Key Features
InfoAppsInfoApps are business-driven analytical apps for non-technical users. They typically focus on a specific business context, and are often embedded within another application’s screen or portal. This feature allows user access to actionable information without having to understand the underlying data and analytics.
Embedded AnalyticsWebFOCUS provides embedded analytics via data integration, ease of branding, advanced content options, and security. Organizations can choose between two embedded analytics use cases (internal and external). Embedded BI requires flexible security and multi-tenancy, white-labeling for OEM use, and comprehensive support of recognized embedded capabilities and techniques.
Data DiscoveryThe visual data discovery tool allows non-technical business users to conduct data preparation, visually analyze complex data, generate sophisticated data visualizations, and share content with others. “Insight” mode enables instant visual discovery from a standard chart.
Two Penn PlazaNew York, NY 10121
United States+1 (212) 736-4433
www.informationbuilders.com
Contact Info
Bottom Line
Information Builders received a growth equity investment from Goldman Sachs in May. The company unveiled feature enhancements to InfoSearch, Omni Data Quality Workbench, prescriptive analytics, and usage monitor shortly after. In October, Information Builders released a new set of analytic accelerators aimed at reducing the time it takes to deploy the WebFOCUS platform. For organizations looking to enhance governed data discovery, Information Builders is an excellent choice. However, ease of use and slower than average product development are factors to consider.
© 2018 | Solutions Review | 500 West Cummings Park | Woburn, Massachusetts 01801 | USA
BUSINESS INTELLIGENCE BUYER’S GUIDE
18
Logi Analytics offers a development platform that allows users to create BI applications, deploy dashboards and reports, and embed analytics into existing applications. The Logi Suite is made up of Logi Info, Logi Vision, and DataHub. There is tight integration between the three tools, and the platform connects to any relational database, big data source, web service or cloud application. Logi Analytics provides data visualizations, self-service dashboards, and reports as well. The vendor also enables users to maintain total control over branding, style, and views
within its embedded analytics framework.
Key Features
Embedded AnalyticsLogi Info gives users total control to match an application’s design and integrate data visualizations with flexible themes. Users can also make changes to the database directly from their dashboards. The embedded API ensures that end-user experiences can be curated on-demand.
Self-service Dashboards and ReportsThe self-service framework enables customers to help themselves without sending ad hoc requests to IT. In addition, services team, partners, application owners, and end-users can create and share visualizations independently. New features include responsive dashboards, associate filtering, combination charts, conditional formatting, and crosstabs.
Logi ElementsLogi Elements are pre-built features that users can configure to meet custom requirements and create unique intellectual property. There are currently hundreds of different elements that include data, visual, analysis, security, input, process/acrion, styling, formatting, layout, and design. Elements shorten development speed and training time since organizations can use development languages, technology frameworks, security, and skills that are already in place.
7900 Westpark Drive McLean, VA, 22102
United States+1 (888) 564-4965
www.logianalyics.com
Contact Info
Bottom Line
Logi Analytics specializes in embedding modern BI and analytics within applications. The company improved its self-service capabilities during the last year, and customer support is a strength of the platform. However, Logi does not offer a cloud-specific version of their BI and analytics platform, and advanced analytics capabilities are lackluster. The Virginia-based software provider was acquired by Marlin Equity Partners in November 2017.
© 2018 | Solutions Review | 500 West Cummings Park | Woburn, Massachusetts 01801 | USA
BUSINESS INTELLIGENCE BUYER’S GUIDE
19
Looker offers a BI and data analytics platform that is built on LookML, the company’s proprietary modeling language. Looker connects to any relational database like Amazon Redshift or Google BigQuery, and automatically generates data models for specific schemas. Users can refine the models to reflect company-specific metrics and business logic to build KPI dashboards and departmental reports. Looker also offers an embedded analytics platform, Powered by Looker.
Key Features
Embedded AnalyticsEmbedded analytics: Powered by Looker utilizes modern database technologies, and an agile modeling layer allows users to easily define data and control who can access it. Analytics can be deployed as an embedded iFrame or using Javascript. Organizations can use Looker’s full RESTful API or the scheduler feature to deliver reports by email or webhook.
Data ModelingLookML lets users define specific data models and reference it in other locations. Any complex join logic that can be specified in SQL can be done in LookML once and be used by any user. The language also allows users to define their organization’s business logic so it can be used by the entire company.
Looker BlocksLooker Blocks are pre-built pieces of code that organizations can leverage to accelerate analytics projects. Users can reuse the work others have already done instead of starting from scratch, then customize the blocks to exact specifications. Some examples include optimize SQL patterns, fully built-out data models, and weather and demographic data.
101 Church St. #400Santa Cruz, CA, 95060
United States+1 (888) 960-2331www.looker.com
Contact Info
Bottom Line
After raising significant funding led by Google’s venture capital arm in March, Looker added a slew of new features to its flagship analytics tool. The company made version 5 of the platform available in October, and updated the data integration capabilities in Powered by Looker shortly after. Looker uses a secure connection to query a data warehouse directly, and puts the answer in an encrypted, local disk cache that is stored for a maximum of 30 days. As a result, the Looker platform pairs well with a robust governance infrastructure for security-minded organizations.
© 2018 | Solutions Review | 500 West Cummings Park | Woburn, Massachusetts 01801 | USA
BUSINESS INTELLIGENCE BUYER’S GUIDE
20
Microsoft is one of a handful of major players in enterprise BI and analytics. The company’s flagship platform, Power BI, is cloud-based and delivered on the Azure Cloud. On-prem capabilities also exist for individual users or when power users are authoring complex data mashups using in-house data sources. Power BI is unique because it enables users to do data preparation, data discovery, and dashboards with the same design tool. The platform integrates with Excel and Office 365, and has a very active user community that extends the
tool’s capabilities.
Key Features
Embedded AnalyticsPower BI offers embedded analytics in two different iterations, first for ISVs and developers, and another for enterprises. The platform’s Azure-based API set enables organizations to embed organizations even when they’ve already designed an app. No matter where the data lies, Power BI allows users to embed visuals into apps, portals, SharePoint, and Microsoft Teams.
Self-service BI and Enterprise ReportingPower BI Server provides organizations access to SQL Server Reporting Services in a single, on-prem solution. Users can author reports with Power BI Desktop, publish them with Power BI Report Server, and share reports for users to consume on the web and across a range of devices.
Community SupportMicrosoft has an expansive web of partners, resellers, and individual users. The company’s products, including the Power BI Suite, are extended as a result of this community framework. Prominent community resources include prebuilt apps, video tutorials, visualizations, and individual user forums.
One Microsoft WayRedmond, WA 98052
United States+1 (425) 882-8080
www.microsoft.com
Contact Info
Bottom Line
Microsoft offers perhaps the most robust BI and analytic product portfolio of any provider included in this buyer’s guide. The company’s Power BI platform is offered in ‘desktop’ and ‘premium’ versions, and connects to Excel spreadsheets, on-prem data sources, big data, streaming data, and cloud services. Microsoft enables organizations ease of use when running complex data analysis, and cost is a major strength of the platform. However, its cloud-only approach and inability to handle very large data volumes is a caution buyers should be aware of.
© 2018 | Solutions Review | 500 West Cummings Park | Woburn, Massachusetts 01801 | USA
BUSINESS INTELLIGENCE BUYER’S GUIDE
21
MicroStrategy is a publicly traded BI provider that provides out-of-the-box gateways and native drivers that connect to any enterprise resource, including databases, mobile device management (MDM) systems, enterprise directories, cloud applications, and physical access control systems. The MicroStrategy platform enables developers and administrators to simplify and accelerate processes at every level of an analytics deployment. A built-in metadata repository stores and catalogs logical business definitions of enterprise data and forms reusable building
blocks for every report, dashboard, and application.
Key Features
Advanced AnalyticsMicroStrategy provides an extensive library of native analytical functions and scoring algorithms, along with an SDK to integrate with 3rd-party and open source statistical and data mining products. Users can also utilize historical data, create real-time forecasts, and take advantage of more than 300 OLAP, mathematical, financial, and data mining functions.
Data ConnectivityThe platform can connect to any enterprise resource, including more than 100 enterprise database and other information assets. MicroStrategy enables users to analyze every kind of data.
Data DiscoveryOrganizations can access, explore, and analyze data with self-service analytics. The platform employs a variety of native connectors that allows users to connect to any type of data from spreadsheets to Salesforce and Hadoop. In addition, data from multiple sources can be blended, and users can define relationships across tables or sources with drag-and-drop controls.
1850 Towers Crescent PlazaTysons Corner, VA 22182
United States+1 (703) 848-8600
www.microstrategy.com
Contact Info
Bottom Line
The MicroStrategy merges self-service data preparation and visual data discovery in an enterprise BI and analytics platform. The company released a new Dossier feature in its most recent product update that brings together data from across an organization in intuitive, interactive analytical applications. Ease of use is not a strength of MicroStrategy’s expansive BI toolset. However, the company offers a rock-solid BI platform that is trusted in the enterprise sphere, and a new free desktop version of the platform is a great way for users who are curious about the tool to give it a try.
© 2018 | Solutions Review | 500 West Cummings Park | Woburn, Massachusetts 01801 | USA
BUSINESS INTELLIGENCE BUYER’S GUIDE
22
Oracle offers a broad range of BI and analytic tools that can be deployed on-prem or in the Oracle Cloud. The company offers traditional BI capabilities inside its Business Intelligence 12c solution. Oracle Data Visualization provides more advanced features, and allows users to automatically visualize data as drag-and-drop attributes, charts, and graphs. The tool also enables users to save snapshots of an analytical moment-in-time via story points. Oracle has greatly expanded their feature capabilities in recent years to include data discovery and data
science tools as well.
Key Features
Advanced AnalyticsAdvanced analytics: Oracle extends its database into an advanced analytics platform through two components: Oracle R Enterprise and Oracle Data Mining. These capabilities allow users to do real-time analytics that delivers insight into key areas such as churn prediction, product recommendations, and fraud alerting.
Data VisualizationOracle Data Visualization provides a simple point-and-click data upload function that allows users to see data visualized automatically. As a result, visuals are presented contextually. Users can add new data and see intelligent updates in real-time, and highlighting one visual automatically enables viewing related information.
Oracle Big Data DiscoveryBig Data Discovery allows organizations to find, explore, transform, and analyze big data. Users can browse an interactive big data catalog and use familiar keyword search and guided navigation. The tool provides access to personal and shared big data projects, and provisioning of personal data via self-service.
500 Oracle ParkwayRedwood Shores, CA 94065
United States+1 (650) 506-7000www.oracle.com
Contact Info
Bottom Line
Oracle offers traditional reporting and dashboards via the Business Intelligence 12c tool. Modern product capabilities are included in Oracle Data Visualization, which provides advanced data visualization, data preparation, self-service, and advanced analytics. The company’s Big Data Discovery feature set is a Hadoop-based data science platform that supports both on-prem and web-based authoring. Oracle’s software is largely available in both desktop and cloud versions. However, organizations that are not already “Oracle shops” may have trouble with deployment.
© 2018 | Solutions Review | 500 West Cummings Park | Woburn, Massachusetts 01801 | USA
BUSINESS INTELLIGENCE BUYER’S GUIDE
23
Phocas Software is a UK-based business intelligence provider that specializes in the manufacturing, distribution, and retail verticals. The company’s BI platform pays special attention to ease of use, and customers rave about vendor responsiveness. Phocas offers traditional BI capabilities like visualizations, dashboards, and reporting, as well as data integration. The solution can be deployed on-prem or in the cloud. In addition to connectivity to all ODBC and JDBC compliant databases, Phocas provides connectors to many ERP and
CRUM systems.
Key Features
Data IntegrationPhocas allows organizations to connect varied data sources with an included extract, transform, load (ETL) tool called Database Designer. Alternatively, users can leverage out-of-the-box integrations for popular ERPs used by manufacturing, wholesale distribution and retail.
VisualizationsThe platform features a variety of different visualization types, including all the basics, but also dual axis charts that animate when opening and filtering. Users can combine geospatial data with heat maps and circle markers to make an even stronger impression.
DashboardsPhocas dashboards allow users to see at a glance how the business is performing. Power users and non-technical people can build interactive dashboards, customize them, apply permissions, collaborate, and print without assistance from IT.
2020 House Siskin Drive Coventry
CV3 4FJ United Kingdom
+44 1865-364-103www.phocassoftware.com
Contact Info
Bottom Line
Phocas provides many traditional BI and analytic capabilities, and the included Database Designer allows for data integration out-of-the-box. However, the platform lacks advanced analytic features, and there is virtually no mention of big data on the company’s website or support materials. Access to the application is available on any HTML5 web browser, including on mobile, and governed data analytics options are available with all deployment options. Still, Phocas is probably best left for medium-sized enterprise companies or organizations implementing BI for the first time.
© 2018 | Solutions Review | 500 West Cummings Park | Woburn, Massachusetts 01801 | USA
BUSINESS INTELLIGENCE BUYER’S GUIDE
24
Pyramid Analytics offers its data and analytics tool through its flagship platform, Pyramid 2018. The solution touts a server-based, multi-user analytics OS environment that provides self-service capabilities. Pyramid 2018 features a platform-agnostic architecture that allows users to manage data across any environment, regardless of technology. The tool enables those users to prepare, model, visualize, analyze, publish, and present data from web browsers and mobile devices. The company’s product portfolio remains highly integrated with Microsoft’s BI tools, offering an enterprise front end to Microsoft SQL Server Analyses Services (SSAS).
However, Pyramid has attempted to differentiate itself with its new product portfolio.
Key Features
Analytics OSPyramid 2018 is an adaptive platform that provides different capabilities and experiences based on user needs and skills. It manages content as a shared resource, and is designed to support self-service analytics. The platform is agnostic and can be deployed in any environment on any device. It features six analytics modules: model, formulate, discover, illustrate, present, and publish.
Hybrid DeploymentThe platform can be deployed in any environment. It features an open, flexible, multi-tiered architecture that can be scaled out and up by tier. Analytics OS can run on any Java-based platform, and offers a scalable repository that uses optimized container images that can be deployed in any ANSI SQL-compliant setting.
Data ModelingPyramid 2018 features modeling on any ANSI-SQL-compliant source, big data engine, Microsoft engine, or Pyramid’s internal in-memory engine. In-place modeling allows users to model data where it lives via shared queries to SQL, Apache/Hadoop engines, ANSI SQL, or to centralized locations like Pyramid’s in-memory (IMDB) or SQL Analysis Services.
Jollenmanhof 221019GW Amsterdam
Netherlands+1 (203) 202-3500
www.pyramidanalytics.com
Contact Info
Bottom Line
Pyramid 2018 offers multiple AI engines and language support (R, Python, TensorFlow, Weka, MLIB, SAS runtime and others), which enables organizations to integrate machine learning algorithms into their data activities. Users can write and share their own calculations and algorithms, or use existing algorithms from an online marketplace available within the product. Tight Microsoft integration is a boon to certain environments, and BI Office was recently updated with a similar framework for SAP. However, such reliance on Microsoft hampers relevance for wider range of use cases.
© 2018 | Solutions Review | 500 West Cummings Park | Woburn, Massachusetts 01801 | USA
BUSINESS INTELLIGENCE BUYER’S GUIDE
25
Qlik offers a broad spectrum of BI and analytics tools, which is headlined by the company’s flagship offering, Qlik Sense. The solution allows organizations to combine all their data sources into a single view. The in-memory engine and associative analytics indexes every possible relationship to data, and the platform is available on-prem (Qlik Sense Enterprise) or in the cloud (Qlik Sense Cloud). Qlik’s product portfolio is rounded out by its Qlik Analytics Platform (embedded and custom tools), and Qlik View, the company’s first-generation data discovery
tool. Qlik was acquired by Thoma Bravo in 2016.
Key Features
Associative EngineThe in-memory engine allows users to combine an organization’s entire library of data. Users can index every possible relationship with data to explore relationships in any direction. There are no pre-aggregated data and predefined queries, and users can create analytics without having to build new queries.
Embedded AnalyticsThe Qlik Analytics Platform allows users to develop, extend, and embed visual analytics in existing applications and portals. Embedded functionality is done within a common governance and security framework. Users can build and embed Qlik as simple mashups or integrate within applications, information services, or IoT platforms.
Data DiscoveryQlikView allows organizations to create business-driven data discoveries with guided analysis paths that are customizable and tightly governed. It features top-down control of analytics apps, permissions, and data management. In addition, granular control of dashboards, layouts, and design allows for centralization of applications. QlikView also offers data integration, advanced reporting, and global search.
150 N. Radnor Chester RdRadnor, PA 19087
United States+1 (888) 828-9768
www.qlik.com
Contact Info
Bottom Line
Qlik added a number of updates to Qlik Sense in June. The solution now includes several new visualization types, including a Box Plot, Distribution Chart, and Histogram that allows users to make better sense of their data. Users will also be able to apply custom coloring to particular data values within master dimensions. The updated tool also provides smart data preparation capabilities so users can load, transform and enrich their data without the need for scripting. Qlik is noted as one of the top tools due to rapid deployment and a robust partner network. The vendor is not without caution though, as technical support is subpar and cost is high.
© 2018 | Solutions Review | 500 West Cummings Park | Woburn, Massachusetts 01801 | USA
BUSINESS INTELLIGENCE BUYER’S GUIDE
26
SAP offers a broad range of BI and analytics tools in both enterprise and business-user driven editions. The company’s flagship BI portfolio is delivered via on-prem (BusinessObjects Enterprise), and cloud (BusinessObjects Cloud) deployments atop the SAP HANA Cloud. SAP also offers a suite of traditional BI capabilities for dashboards and reporting. The vendor’s data discovery tools are housed in the BusinessObjects solution, while additional functionality, including self-service visualization, are available through the SAP Lumira tool set. SAP is popularly chosen as a company-wide BI standard, especially if an organization also plans to
use the company’s application offerings.
Key Features
DashboardsBusinessObjects dashboards allow users to personalize drag-and-drop functionality and interactive gauges, charts, and widgets. In addition, dashboards provide IT and business users with direct connectivity to live data sources. Dashboards can also be embedded so users can view them wherever necessary.
Self-service Data VisualizationSAP Lumira allows organizations to create interactive maps, charts, and infographics. Users can import data from Excel and many other sources, perform visual BI analysis using intuitive dashboards and securely share insights and data stories cross-enterprise.
Predictive AnalyticsSAP offers predictive analytics in both on-prem and cloud versions. The capability allows organizations to automate data preparation, predictive modeling, and deployment via in-database predictive scoring for a wide variety of target systems. Users can also leverage advanced visualization capabilities and integrate with R.
Dietmar-Hopp-Allee 1669190 Walldorf Germany+49 (0) 6227 / 7-47474
www.sap.com
Contact Info
Bottom Line
SAP’s wide variety of BI and analytics tools are available through a number of deployment channels. As a result, the company’s legacy BI functionality can be integrated into its newer offerings. SAP is available on-prem and in the cloud via their own HANA cloud platform. Organizations typically deploy SAP via a ‘vendor stack which is not a major issue. According to Gartner, product quality is a problem given the company’s attempt at developing two parallel product lines (BusinessObjects Enterprise, BusinessObjects Cloud). However, SAP remains a rock solid choice for enterprise organizations in a crowded marketplace.
© 2018 | Solutions Review | 500 West Cummings Park | Woburn, Massachusetts 01801 | USA
BUSINESS INTELLIGENCE BUYER’S GUIDE
27
SAS is the largest independent vendor in the BI marketplace. The company’s flagship platform, SAS Visual Analytics, is available on-prem or in the cloud. Visual Analytics allows users to visually explore data to automatically highlight key relationships, outliers, and clusters. Users can also utilize advanced visualizations and guided analysis through autocharting. SAS has made its name as a result of its advanced analytics, as the tool can ingest data from diverse data sources and handle complex models. In addition to BI, SAS offers data management, IoT,
personal data protection, and Hadoop tools. The company was founded in 1976.
Key Features
Advanced AnalyticsDynamic charts and graphs enable fast data interaction via automated and interactive processes that work in both batch and real-time environments. Users can apply quality-tested algorithms that are constantly updated to reflect the latest statistical methodologies. SAS features analysis a wide variety of analysis methods as well.
Visual Data DiscoverySAS Visual Analytics provides visual data exploration that automatically highlights key relationships, outliers, and clusters. Users can create interactive reports and dashboards that summarize key performance metrics, and share them via the web and on mobile.
Microservices ArchitectureSAS Viya is the company’s microservice architecture that will allow users to easily navigate between on-prem cloud data stores and deployments. This update is a boon to existing customers, as one of the cautions with the SAS platform was poor interoperability between cloud and on-prem implementations.
100 SAS Campus DriveCary, NC 27513United States
+1 919-677-8000www.sas.com
Contact Info
Bottom Line
SAS is a major player in enterprise BI and analytics software. The company’s advanced and predictive analytic technologies, which include forecasting, text analytics, and decision trees, are excellent. Data scientists can extend these capabilities using the integrated Visual Statistics tool. SAS caters to a wide range of verticals, and users particularly enjoy ease of use in accessing Hadoop and NoSQL data. However, the platform’s UI is lacking, and interoperability between separate SAS products could be better. The hope is that its expanded Viya rollout will help to quell some of these issues.
© 2018 | Solutions Review | 500 West Cummings Park | Woburn, Massachusetts 01801 | USA
BUSINESS INTELLIGENCE BUYER’S GUIDE
28
Sisense is a global business analytics software company with offices in New York City, Phoenix, Tokyo, and Tel Aviv. The company’s BI software makes it easy for organizations to reveal business insight from complex data in any size, and from any source. Sisense allows users to combine data and uncover insights in a single interface without scripting, coding or assistance from IT. Their BI and analytics platform is sold as a single-stack solution with a backend for preparing and modeling data. It also features robust analytical capabilities, and a front end for
dashboarding and visualization.
Key Features
Data PreparationOrganizations can prepare, manage, and secure data without supplemental technology or IT involvement. Users can access information from any data source, drag-and-drop to combine, and clean up defects for error-free analysis and better insights.
Interactive AnalyticsSisense turns any user into an analytics expert with advanced capabilities, instant response time, and smart shortcuts. Organizations can filter, explore, and mine data for answers to important business questions.
Data EngineSisense hastens data connection so organizations can get up-and-running with ease. The solution is offered on a single-stack, browser basis. Users are enabled to take advantage of accessibility and mobility on data, and data and dashboards can be shared with everyone inside an organization.
1359 Broadway 4th FloorNew York, NY 10018
United States+1 (646) 432-1507www.sisense.com
Contact Info
Bottom Line
Sisense offers a single platform that runs on in-chip technology for visual data discovery on web-based dashboards. Due to unique technology and an emphasis on end-user experience, Sisense is most appropriate for organizations that want to analyze large amounts of data from multiple sources. The company’s OEM partner network is strong, and users report high praise for customer experience. The ability for organizations to white label Sisense and use APIs to extend analytic content are also major value-adds.
© 2018 | Solutions Review | 500 West Cummings Park | Woburn, Massachusetts 01801 | USA
BUSINESS INTELLIGENCE BUYER’S GUIDE
29
Tableau offers an expansive visual BI and analytics platform, and is widely regarded as the major player in the marketplace. The company’s analytic software portfolio is available through three main channels: Tableau Desktop, Tableau Server, and Tableau Online. Tableau connects to hundreds of data sources and is available on-prem or in the cloud. The vendor also offers embedded analytics capabilities, and users can visualize and share data with Tableau Public.
Tableau is publicly traded and headquartered in Seattle, Washington.
Key Features
Tableau DesktopTableau Desktop provides visual data discovery, and connects to big data, an SQL database, or cloud apps like Google Analytics and Salesforce. Users can access and combine disparate data without writing code, and power users can pivot split, and manage metadata to optimize data sources.
Tableau ServerTableau Server offers a governed approach to self-service analytics that allows central management of metadata and security rules. Tableau integrates with existing security protocols, and users can maintain database security with pass-through data connection permissions and row-level filtering. Flexible deployment is a also a key tenant.
Tableau OnlineTableau Online is fully hosted in the cloud, so organizations can avoid configuring servers, managing software upgrades, and scaling hardware capacity. Users can connect to cloud databases like Amazon Redshift and Google BigQuery, and live query on-prem databases or schedule extract refreshes.
837 North 34th StreetSeattle, WA 98103
United States+1 (206) 633-3400
www.tableausoftware.com
Contact Info
Bottom Line
After what Bloomberg referred to as a ‘rocky’ 2016, Tableau added subscription pricing to its entire line of BI and analytics products. According to Gartner, maturity in the BI marketplace has placed increasing pressure on the vendor to expand its investment large-scale enterprise deployments. Tableau features a rich visual user experience, and flexible deployment options on-prem or in the cloud are a big plus. However, many of the promised enterprises capabilities are a work in progress, and software pricing models are complex.
© 2018 | Solutions Review | 500 West Cummings Park | Woburn, Massachusetts 01801 | USA
BUSINESS INTELLIGENCE BUYER’S GUIDE
30
TARGIT’s flagship BI platform is Decision Suite, an integrated platform that offers visual data discovery, self-service analytics, reporting, and dashboards. The solution features a range of deployment options, and users can access the tool through Windows, web, or mobile clients. Organizations can also embed TARGIT into the applications they use most. TARGIT touts an in-memory database and back-end tool set, which means the platform can be run as a complete
end-to-end solution.
Key Features
Data IntegrationTARGIT offers four data integration delivery types: self-service, in-memory databases, multidimensional databases, and direct to data source. In addition to connecting to a range of dat sources with TARGIT InMemory drag-and-dropETL, users can utilize complex ETL with the vendor’s proprietary scripting language (only SQL skills needed).
Embedded AnalyticsDecision Suite capabilities can be accessed on applications that organizations use most with embedded BI via TARGIT Anywhere. Users can embed the solution on company portals, business applications, or public-facing websites. The client is lightweight and provides the same dashboards, reports, and analyses that are present within the tool itself.
Data DiscoveryTARGIT includes out-of-the-box connectors to CSV, Excel, Google Dogs, and more. Users can also add other popular providers for additional access to in-house data sources. The tool features both personal and enterprise modes of the module, and the user interface is built for business users with no SQL or programming skills required.
Aalborgvej 949800 Hjørring
Denmark +45 96 23 19 00www.targit.com
Contact Info
Bottom Line
TARGIT offers a modern BI and analytics platform that includes built-in data integration capabilities. The solution runs securely on-prem, in the cloud or in a hosted environment. TARGIT Decision Suite supports all major relational and multidimensional database technologies. The vendor has added a slew of product enhancements in recent months, and features a long list of support content and community resources. TARGIT is a rock solid option for organizations in need of an all-encompassing platform for data integration, discovery, and analytics.
© 2018 | Solutions Review | 500 West Cummings Park | Woburn, Massachusetts 01801 | USA
BUSINESS INTELLIGENCE BUYER’S GUIDE
31
ThoughtSpot offers an artificial intelligence-driven analytics platform that features what the company dubs the world’s first relational search engine. The tool combines relational search with a custom-built, in-memory relational data cache to speed up queries that are run over many lines of data. ThoughtSpot connects with any on-prem, cloud, big data, or desktop data
source. The company is located in Palo Alto, CA, and was founded in 2012.
Key Features
Relational SearchUse search to build charts and dashboards for even the most complex queries. The tool always shares how a search is computed, so there is no end-user interpretation. An automatic search index, guided search suggestions, and search inspector are integral parts of the relational engine.
SpotIQ AI EngineSpotIQ uses built-in artificial intelligence to run advanced analytics algorithms on many data points and automatically spot insights that are uniquely actionable. Users guide machine logic to ensure relevant machine-discovered conclusions.
BI & Visualization ServerIntelligent query generation allows any user to search across complex schemas using natural language. Automatic visualizations provide every user the ability to create their own interactive visuals. Users can also create shared metadata models complete with business logic on combined datasets so answers remain consistent.
1 Palo Alto Square, Bldg 1Palo Alto, CA 94306
United States+1 (800) 508-7008
www.thoughtspot.com
Contact Info
Bottom Line
ThoughtSpot’s analytics platform is heavily influenced by artificial intelligence and automation. While it may seem complex, ease of use is actually a strength of the product. It features a full-stack architecture and intuitive insight-generation capabilities via the in-memory calculation engine. A distributed cluster manager provides customizable scaling options, and support for existing ETL solutions ensures proper connectivity to desired data sources.
© 2018 | Solutions Review | 500 West Cummings Park | Woburn, Massachusetts 01801 | USA
BUSINESS INTELLIGENCE BUYER’S GUIDE
32
TIBCO’s product capabilities are expansive, and range from data integration and API management to visual analytics, reporting, and data science. The company’s BI and analytics portfolio comes in two main iterations: TIBCO Spotfire and TIBCO Jaspersoft. TIBCO Spotfire is the company’s more modern platform. It features interactive visualization, data preparation, enterprise-class governance, and advanced analytic capabilities. TIBCO Jaspersoft supports traditional reporting and embedded BI functionality. TIBCO is publicly traded and based in Palo
Alto, California.
Key Features
AI-driven Search and Data DiscoverySpotfire Smart Data Catalog allows users to visually interact with data to automatically discover relationships, sentiments, and recommendations via built-in artificial intelligence. Any user can create best practice visualizations via the Recommendations wizard so anyone can view a guided experience that helps to communicate complex concepts.
Data AccessUsers can connect to and blend data from files, relational and NoSWL databases, OLAP, Hadoop, and web services. Cloud applications like Google Analytics and Salesforce are also supported. Streaming data sources like IoT, social, and messaging can be integrated with at-rest data for real-time contextual analysis.
Big Data AnalyticsTIBCO’s Insight Platform combines live streaming data with queries on large-at-rest volumes. Spotfire can identify historical patterns running directly against Hadoop and Spark. Patterns can also be applied to streaming data for predictive analysis. StreamBase and BusinessEvents support many approaches to insight execution including R code running from many modeling environments.
212 Elm StreetSomerville, MA 02144
United States+1 (617) 702-1600
www.tibco.com
Contact Info
Bottom Line
TIBCO offers what is perhaps the most feature-rich BI and analytics portfolio of any provider listed in this resource. In addition the traditional BI functionality offered in Jaspersoft, Spotfire provides expert users with the capabilities they need to run complex analysis. Spotfire users report satisfaction with the integration of TIBCO’s data science tools, and a growing user community helps to offset what some see as an increasingly complex product to use. However, license costs are a barrier to deployment. As a result, organizations commonly utilize other BI and analytic tools alongside TIBCO.
© 2018 | Solutions Review | 500 West Cummings Park | Woburn, Massachusetts 01801 | USA
BUSINESS INTELLIGENCE BUYER’S GUIDE
33
Yellowfin is an Australia-based BI and analytics company that specializes in providing organizations with dashboards and data visualization capabilities. Their platform features a machine learning algorithm called Assisted Insights that provides automatic answers in the form of easy-to-understand best practice visualizations and narratives. Yellowfin comes pre-built with a variety of dashboards, and users can embed interactive reports into third-party platforms, such as a web page, wiki, or company intranet. The company also offers native apps
for mobile devices.
Key Features
Assisted InsightsMachine learning capabilities included inside Yellowfin provide immediate answers without the user having to dig through data. Users ask the question they’re trying to answer, and the tool finds the data to analyze, runs it through a series of steps to find the most statistically relevant results, and presents the answer.
DashboardsYellowfin allows users to see all their different data sources in one dashboard with high-level summary reports and KPIs. The platform is built to include pre-built dashboards for web applications, and uses can embed them into third-party platforms. Users can monitor important metrics on any device with native mobile applications.
Data VisualizationYellowfin includes more than 50 chart types, from trellis charts to GIS maps and infographics. The company’s Location Intelligence capabilities allow users to merge spatial and traditional business data, and GeoPacks are available to organizations who don’t have location information.
Level 46360 Elizabeth StreetMelbourne VIC 3000
Australia+61 2-8404-4150
www.yellowfinbi.com
Contact Info
Bottom Line
Yellowfin has high customer ratings for ease of use and feature functionality. The company’s data platform is a viable option for organizations that wish to deploy BI and analytics in the cloud. The most prominent use case for Yellowfin is embedded BI, and the tool offers a completely web-based user interface. Yellowfin is an ideal option for midsized organizations, while the platform offers some of the best social sharing and collaboration features of any of the tools mentioned in this buyer’s guide.
© 2018 | Solutions Review | 500 West Cummings Park | Woburn, Massachusetts 01801 | USA
BUSINESS INTELLIGENCE BUYER’S GUIDE
34
Zoomdata offers a range of BI and analytic tools highlighted by big data exploration and data visualization. The platform features a patented micro-query architecture that allows organizations to bridge old and new data in a single pane of glass. Zoomdata enables connection, interaction, and visualization with data on browsers and mobile devices. The company’s DataDVR capabilities allow users to fast-forward, rewind, and compare real-time streaming and historical data as well. Zoomdata has amassed more than $47 million in venture
funding since its founding in 2012.
Key Features
Big Data Discovery Zoomdata’s micro-query architecture provides results on billions of records and gives users a single pane of glass for bridging old and new data. Data discovery can span a data ecosystem that includes traditional relational databases and new sources like NoSQL, search, and streaming data.
DataDVRDataDVR lets users interact with data the same way they would use streaming video technology to interact with live video or replay movies. It provides capabilities that allow for pause, rewind, and fast-forward on data streams. This helps users identify and track anomalies in near real-time. DataDVR continuously computes rolling or static windows, enabling users to monitor trends across real-time and historical data streams.
Multi-source AnalysisZoomdata Fusion enables interactive blending and analysis across disparate data sources, bridging modern and legacy data architectures, combining real-time streams and historical data, and unifying enterprise data on-prem and in the cloud. Smart Connectors also combine and analyze data from multiple sources while leaving the data in place.
401 E 3rd AvenueSan Mateo, CA 94401
United States+1 (650) 399-0024
www.zoomdata.com
Contact Info
Bottom Line
Zoomdata touts a number of unique and interactive product capabilities, spanning fast visual analytics and ‘data sharpening’. The Zoomdata platform is purpose-built for big data by using native APIs and leveraging source-specific functionality. Analytic features can also be embedded or extended via white labeling or the Javascript API. All of the solution’s front end controls are available through published APIs, and Zoomdata can be deployed on-prem or in the cloud.
© 2018 | Solutions Review | 500 West Cummings Park | Woburn, Massachusetts 01801 | USA
BUSINESS INTELLIGENCE BUYER’S GUIDE
35
ABOUTSOLUTIONS REVIEW
Solutions Review is a collection of technology news sites that aggregates, curates, and creates the best content within leading technology categories. Solutions Review’s mission is to connect buyers of enterprise technology with the best solution sellers.
Over the past four years, Solutions Review has launched ten technology buyer’s guide sites in categories ranging from cybersecurity to wireless 802.11, as well as mobility management, business intelligence and data analytics, data integration, and cloud platforms.
Information for this report was gathered via a meta-analysis of available online materials and reports, conversations with vendor representatives, and examinations of product demonstrations and free trials. Solutions Review does not endorse any vendor, product or service depicted in this publication and does not advise technology users to base their vendor selection entirely on this research. Solutions Review disclaims all warranties, expressed or implied, regarding this research, including any warranties of merchantability or fitness for a particular purpose.