2018 - capital markets u.s. net lease group · agst 2018 florida net lease report 7-eleven is one...
TRANSCRIPT
Florida Net Lease Report 2018

2Page 2
QSR, dollar stores, convenience stores (C-stores), and casual dining were the sectors with the most single tenant transactions. These sectors have been shielded from the effect of online competition by providing products or services that online retailers cannot replicate. Due to the continued strength of these types of tenants, they have traded at a premium to the rest of the country.
The big-box stores, who have faced fierce competition from online, have struggled to keep up and demand has significantly fallen. In the past year, we have captured very few big-box transactions,
accounting for less than half of one percent in this report.
Florida has seen strong growth in the state’s GDP over the past two decades. Today, Florida is the fourth largest state by GPD, and has been since 1999. Trailing only California, Texas, and New York, Florida is near the $1 trillion mark. This strong and sustained economic strength is due to a perfect storm of factors drawing people and resources to the state. The warm climate, beautiful beaches, and no state income tax have been strong attractions for many retirees. While six other states have no individual income tax, Florida has consistently been a top retirement destination. Both consumers and investors have aided the increased demand for real estate, goods and services.
The weather and beaches also attract large numbers of tourists. An estimated 116,491,000 visitors came to the Sunshine State during 2017 bringing an estimated $111.7 billion in direct spending to the state. This large influx of capital to the Florida economy helps drive employment and demand for goods and services. The high demand for goods and services create business opportunities for tenants of net lease properties.
$0
$200,000
$400,000
$600,000
$800,000
$1,000,000
$1,200,000Florida GDP (Millions of $)
$967,337
Population 20,984,400
Unemployment Rate 3.80%
# People Moving to FL 1,000 per day
Introduction
Florida Sales by Sector Automotive9%
Bank5%
Big-Box0%
Casual Dining
12%
C-Store14%
Dollar Store16%
Educational1%
Medical3%
Pharmacy9%
QSR24%
Other Retail7%

Page 3
AUGUST 2018 | Florida Net Lease Report
7-Eleven is one of the world’s largest convenience store (C-store) chains with over 63,000 locations worldwide. 7-Eleven recently expanded their reach with the acquisition of 1,030 Sunoco stores. With this acquisition, 7-Eleven now has 807 locations across the Sunshine State, second most in the nation, behind only California with 1,729 stores.
7-Elevens are unique net lease assets that come in all shapes and sizes ranging from freestanding locations to smaller inline stores in strip centers. The particular format is used to fit with the local area and its needs. Freestanding locations will often have gas pumps, a way to help drive traffic to the retail portion of the property. The inline strip center locations will typically not have gas but will be located in densely populated areas with higher foot traffic.
The strong corporate guarantee has been a draw for net lease investors. This strong credit is well above the investment grade threshold.
7-Elevens typically operate in 2,500 – 3,500 square foot buildings, their typical lot size depends on if they have gas pumps or
not. In the state of Florida, 7-Elevens have traded at an average cap rate of 5.51% with the average price near $2.8 million.
5.51%
5.85%
5.21%
5.51%
4.80%
5.00%
5.20%
5.40%
5.60%
5.80%
6.00%
7-ELEVEN FLORIDA STNL AVERAGE
S&P’s AA-
Moody’s Baa1
Cap Rate for 7-Eleven in Florida
Tenant Spotlight: 7-Eleven

4Page 4
Major Tenants in Florida
# SALES 28 20 15 14 12 11 11 9 8 6
Average Cap Rate for Major Tenants in Florida
Inline Strip CentersInline strip centers, with multiple tenants, have become a popular investment. They offer investors a chance to diversify
their tenant risk as well as the ability to stagger the ends of their tenant’s lease terms, ensuring that the building is always
at least partially occupied. This continuous cash flow is a strong driver of demand for these properties. These properties
will typically require the landlord to maintain the roof and structure, but this will mean the property can be purchased for a
higher cap rate. Investors commonly use financing to acquire these assets (few all cash deals).
The southeastern region of Florida had the lowest average cap rate, 6.40%, over the last 12 months while the less dense
regions such as central Florida (7.50%) or the panhandle (7.25%) had higher cap rates.
Multi-Tenant Cap Rate by Region
The dollar store and pharmacy sectors have four of the top five tenants with the most sales in Florida over the last 12
months. Both of these sectors are common and popular net lease assets with a small number of tenants that dominate their
industry. Dollar General and Family Dollar account for a large portion of the overall dollar store sector while Walgreens and
CVS are the two largest national pharmacies remaining. QSRs had the most sales of any sector in Florida over the last 12
months, however the sector is highly fragmented with dozens of major tenants, so only a few of the top spots went to QSR
tenants.
7.50%
6.40%
7.01%7.20% 7.25%
5.80%
6.00%
6.20%
6.40%
6.60%
6.80%
7.00%
7.20%
7.40%
7.60%
CENTRAL SOUTHEAST WEST NORTHEAST PANHANDLE
6.37%
4.66%
6.53%5.98% 5.72% 5.47% 5.61% 5.51% 5.22% 5.00%
0.00%
1.00%
2.00%
3.00%
4.00%
5.00%
6.00%
7.00%
Page 5
AUGUST 2018 | Florida Net Lease Report
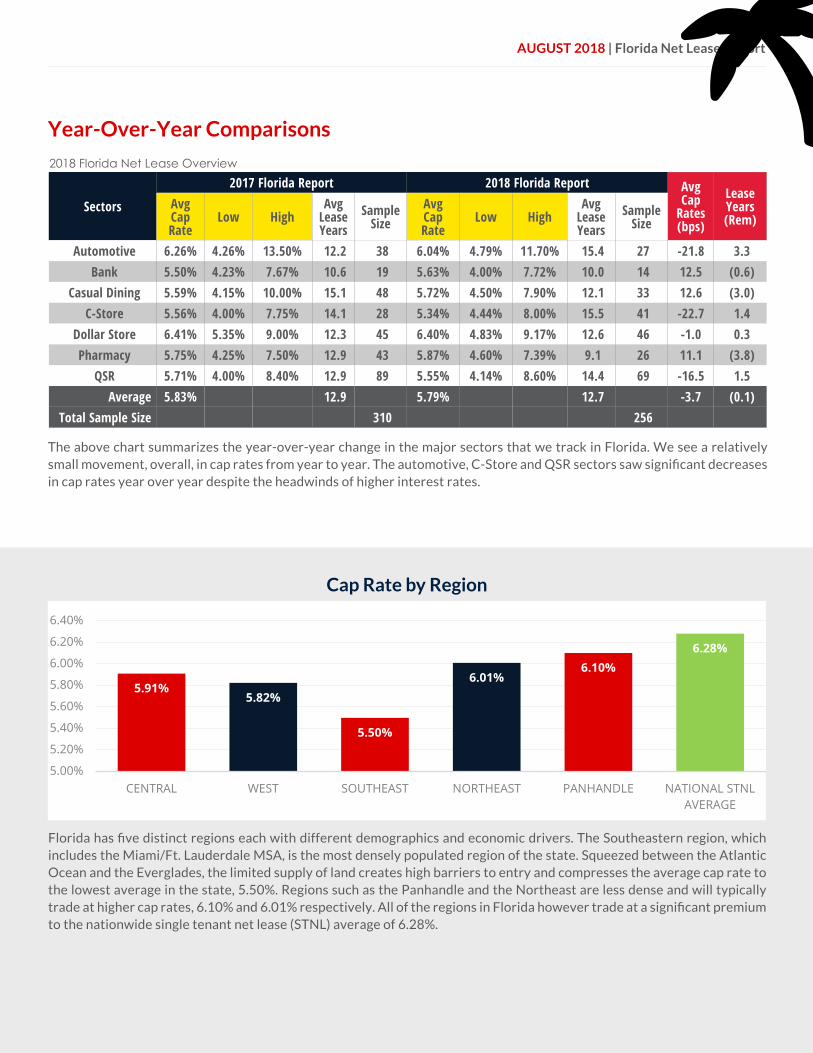
Year-Over-Year Comparisons
2018 Florida Net Lease Overview
The above chart summarizes the year-over-year change in the major sectors that we track in Florida. We see a relatively small movement, overall, in cap rates from year to year. The automotive, C-Store and QSR sectors saw significant decreases in cap rates year over year despite the headwinds of higher interest rates.
Cap Rate by Region
Florida has five distinct regions each with different demographics and economic drivers. The Southeastern region, which includes the Miami/Ft. Lauderdale MSA, is the most densely populated region of the state. Squeezed between the Atlantic Ocean and the Everglades, the limited supply of land creates high barriers to entry and compresses the average cap rate to the lowest average in the state, 5.50%. Regions such as the Panhandle and the Northeast are less dense and will typically trade at higher cap rates, 6.10% and 6.01% respectively. All of the regions in Florida however trade at a significant premium to the nationwide single tenant net lease (STNL) average of 6.28%.
5.91%5.82%
5.50%
6.01%6.10%
6.28%
5.00%
5.20%
5.40%
5.60%
5.80%
6.00%
6.20%
6.40%
CENTRAL WEST SOUTHEAST NORTHEAST PANHANDLE NATIONAL STNL AVERAGE
Sectors
2017 Florida Report 2018 Florida Report Avg Cap
Rates (bps)
Lease Years (Rem)
Avg Cap Rate
Low HighAvg
Lease Years
Sample Size
Avg Cap Rate
Low HighAvg
Lease Years
Sample Size
Automotive 6.26% 4.26% 13.50% 12.2 38 6.04% 4.79% 11.70% 15.4 27 -21.8 3.3 Bank 5.50% 4.23% 7.67% 10.6 19 5.63% 4.00% 7.72% 10.0 14 12.5 (0.6)
Casual Dining 5.59% 4.15% 10.00% 15.1 48 5.72% 4.50% 7.90% 12.1 33 12.6 (3.0) C-Store 5.56% 4.00% 7.75% 14.1 28 5.34% 4.44% 8.00% 15.5 41 -22.7 1.4
Dollar Store 6.41% 5.35% 9.00% 12.3 45 6.40% 4.83% 9.17% 12.6 46 -1.0 0.3 Pharmacy 5.75% 4.25% 7.50% 12.9 43 5.87% 4.60% 7.39% 9.1 26 11.1 (3.8)
QSR 5.71% 4.00% 8.40% 12.9 89 5.55% 4.14% 8.60% 14.4 69 -16.5 1.5 Average 5.83% 12.9 5.79% 12.7 -3.7 (0.1)
Total Sample Size 310 256
6Page 6
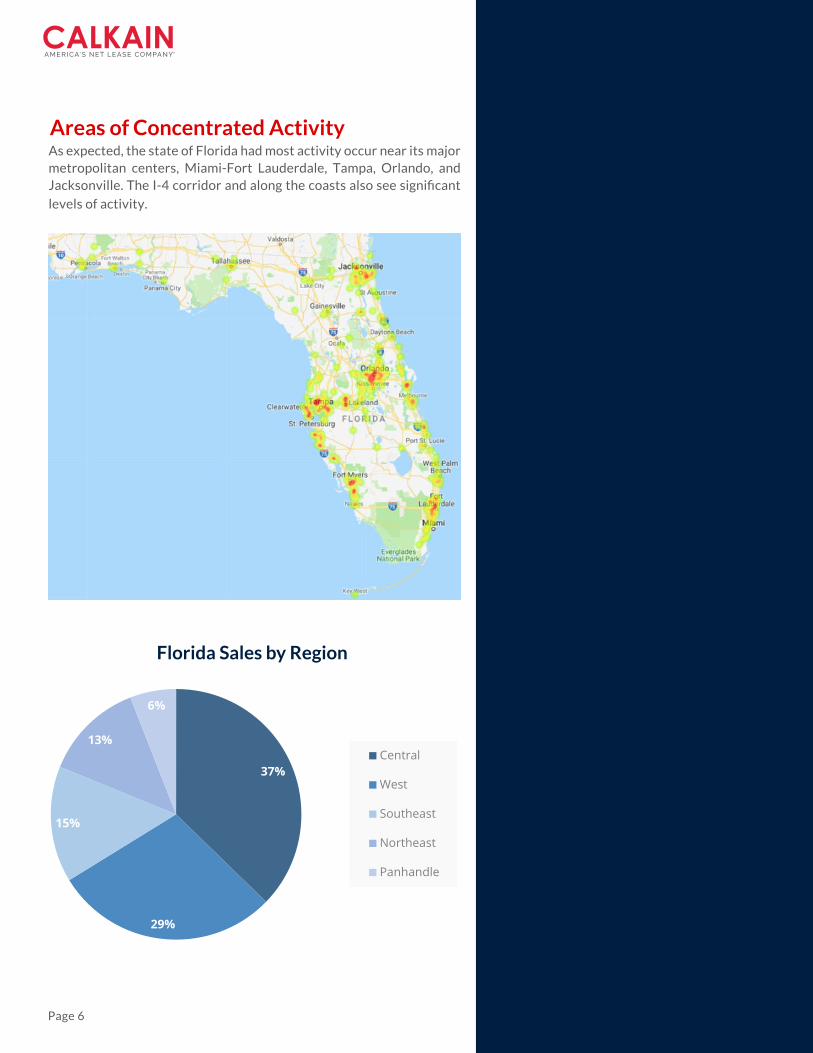
As expected, the state of Florida had most activity occur near its major metropolitan centers, Miami-Fort Lauderdale, Tampa, Orlando, and Jacksonville. The I-4 corridor and along the coasts also see significant
levels of activity.
Areas of Concentrated Activity
37%
29%
15%
13%
6%
Central
West
Southeast
Northeast
Panhandle
Florida Sales by Region
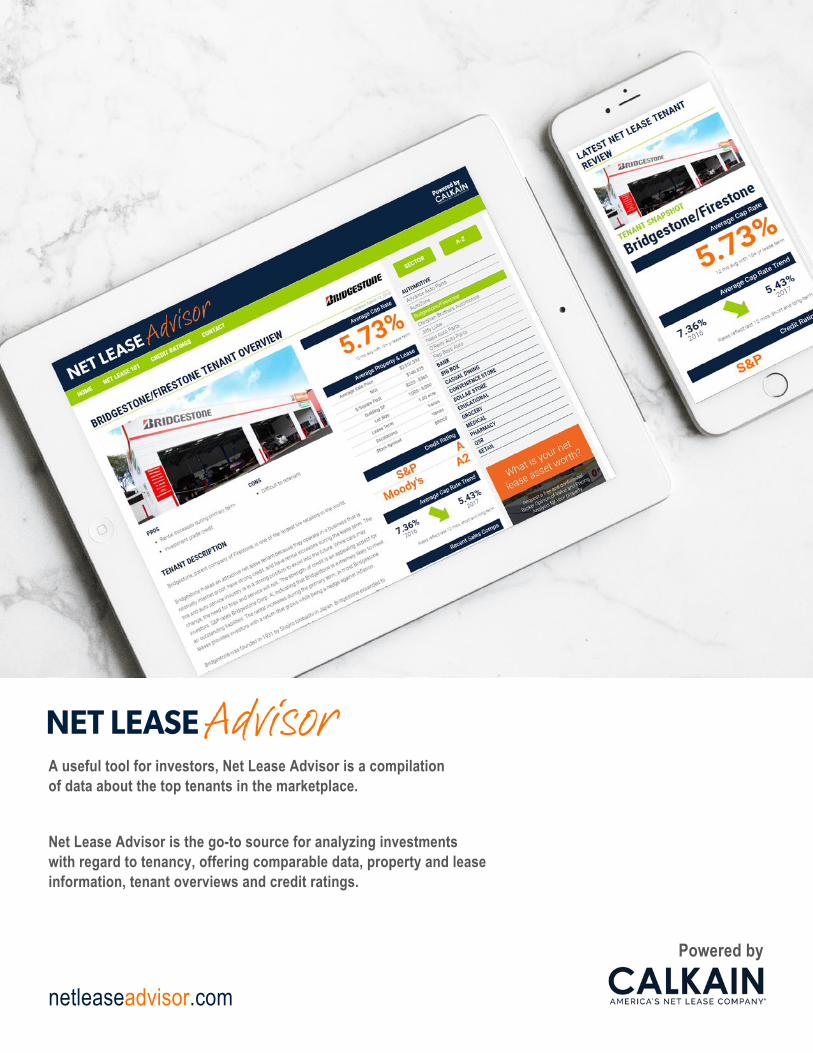
A useful tool for investors, Net Lease Advisor is a compilation of data about the top tenants in the marketplace.
Net Lease Advisor is the go-to source for analyzing investments with regard to tenancy, offering comparable data, property and lease information, tenant overviews and credit ratings.
netleaseadvisor.com
Powered by

DISCLOSURES: As part of our market research, we collect sales price, cap rate, and lease years remaining for all publicly advertised and sold STNL properties. a) We are not able to capture 100% of the off-market transactions that occur; however the nature of off-market typically limits their value as true market comps. b) Sources include public records, sales announcements, Calkain sales, and appraiser obtained sales amongst others. c) Our collection process, while thorough, is not all encompassing and there may be biases in the data as it relates to geography, tenancy, or brokers involved in the transaction. d) Public records often lag behind when transactions actually close, months in some cases. e) In sectors with a skew of greater than |2|, we have replaced the mean with the median to better describe these sectors. Consequently the data supplied here for any given quarter is likely to miss a material amount of transactions that actually closed in it.
CALKAIN|RESEARCH
12930 Worldgate Dr | Suite 150 Herndon, VA 20170 703.787.4714 | calkain.com
Interested in Calkain’s Research Services?Contact us at [email protected]