2018 clarivate/cortellis year in review · 2018 clarivate/cortellis year in review analysis...
TRANSCRIPT

2018 Clarivate/Cortellis Year in Review
Analysis premiered during the JP Morgan WeekSan Francisco, California7-10 January 2019

2
Presenters
Jamie Munro leads the Portfolio & Licensing practice at Clarivate Analytics including heading up CMRInternational, the R&D benchmarking service. Dr Munro has significant life science experience including over 15years large pharma experience as well as a PhD in Finance.
Helen Dowden is a strategic intelligence professional with more than 20 years pharmaceutical industry experience. She has a PhD in pharmacology, and is currently working as a Consultant within Clarivate’s Life Sciences Professional Services team. Helen has expertise in oncology deals analysis.

3
Contributors
Laura Vitez has over 25 years of experience in the life sciences industry. She has held lead or advisory roles at multiple small biotechs, a mid-sized pharma company, and two consulting firms, bringing in over $2B deal dollars. She holds an MS in biochemistry and a BA in mathematics and chemistry.
Lisa Christadore has 5+ years consulting with pharmaceutical clients across R&D, clinical, competitive intelligence, and BD. She has interviewed over 100 physicians, scientists, and investors and works closely with Clarivate’s Deals Intelligence team. She is a medical writer, deals enthusiast, and holds a PhD in Biochemistry with a focus on drug discovery.
Isabel Rodriguez has over 15 years of experience in the pharmaceutical business from early discovery research to the clinical practice, and works with clients on a range of assignments including the analysis of disease landscape, competitive intelligence, business development and licensing, disease target evaluation, technology assessment and intellectual property trends. Isabelholds a Doctorate in Pharmacy from the University of Barcelona.
Paul D’Souza has over 11 years as a pharmaceutical industry analyst, maintaining and analysing content on various competitive intelligence databases, including Clarivate Analytics’ Cortellis Deals Intelligence module, to support decision making across the pharmaceutical sector. He currently analyses quarterly trends in pharmaceutical mergers & acquisitions and licensing activity and holds an MBA and a BSc in Pharmacology & Physiology.
Karen Pihl-Carey is an analyst and writer for BioWorld who has tracked the biopharma industry since 1999. She manages databases of deals, financings, FDA approvals and clinical data that provide historical background and indicate industry trends.

4
Contents
Introductions 2
Recap of 2017 implications 7
Dealmaking 2018 Year-in-Review 8
Overview 9
Mergers and Acquisitions (M&A) 11
Licensing, Joint Ventures, and Research Collaborations 16
IPOs and VC 25
Top Pharma Dealmaking Activity 29
Biopharma Industry 2018 Year-in-Review 33
Oncology: Still the biggest driver of deal activity 34
Approvals and Other Drivers of ROI 45
Summary 62

5
Clarivate Analytics Life Sciences
Clarivate Analytics is the global leader in providing trusted insights and analytics to accelerate the pace of innovation.
Building on a heritage going back more than a century and a half, we have built some of the most trusted brands across the innovation lifecycle, including Web of Science, Cortellis, Derwent, Techstreet, CompuMark, and MarkMonitor.
Today, Clarivate Analytics is a new and independent company on a bold entrepreneurial mission to help our clients radically reduce the time from new ideas to life-changing innovations.
Cortellis Competitive IntelligenceLeading pipeline database for depth and breadth of content
Cortellis Deals IntelligenceRapid insights into critical deal making trends
Cortellis Regulatory IntelligenceMost comprehensive regulatory content and analysis
Cortellis Clinical Trials IntelligenceBroadest source of clinical trials intelligence
MetaCoreProprietary toolbox for discovery of biological pathways
Integrity & Drug Research AdvisorUnique provider of multifaceted drug research content
BioWorld NewsDaily actionable intelligence and incisve analysis

This report contains general information only and is based on the experiences and research of Clarivate Analytics practitioners. Clarivate Analytics is not, by means of this report, rendering business, financial, investment, or other professional advice or services. This report is not a substitute for such professional advice or services, nor should it be used as a basis for any decision or action that may affect your business. Before making any decision or taking any action that may affect your business, you should consult a qualified professional advisor. Clarivate Analytics, its affiliates, and related entities shall not be responsible for any loss sustained by any person who relies on this report.
Disclaimer

7
o Industry continues to innovate & will need to continue
Targeted therapies addressing unmet need
Oncology to remain a focal point
Challenges for NS, anti-infectives
o Challenges remain
Value generation
o Levers
Revenues – price challenges
Costs – hurdles
Pick winners – long term, beyond the tenure of many CEOs
Business development
• M&A – tax / repatriation
• Licensing to fill gaps and deliver strategy
• Regional opportunities / China
Let’s take a look at what we said last year…

Dealmaking 2018
Year-in-Review

9
M&A11%
Licenses41%
Asset Purchases
5%
Funding18%
Commercial14%
Other10%
Service1%
M&A64%
Licenses26%
Asset Purchases
5%
Overview of all life sciences deals captured by Cortellis in 2018 by percentage
4014Total transactions
announced in 2018
$428 BTotal deal dollars
announced in 2018
• Unless otherwise noted, all dollars throughout presentation are USD and are nominal figures (not corrected for inflation).• Transaction types: M&A = 50-100% acquisitions, mergers, reverse mergers; Licenses = licenses, joint ventures, research
collaborations; Asset Purchases = products and business unit acquisitions; Funding = acquisitions of < 50% equity, grants, loans, other funding types; Commercial = distribution, supply, co-promotion agreements; Service = contract services; Other = royalty buyouts, spin-outs, settlements.
Funding 15%; Commercial 2%; Service 0.2%; Other 1.2%

10
M&A, 482 M&A, 449
Licenses, 1811
Licenses, 1658
Asset Purch, 210 Asset Purch,
184
Funding, 941
Funding, 734
Commercial, 563
Commercial, 560
Service, 465
Service, 376
Other, 50
Other, 53
0
500
1000
1500
2000
2500
3000
3500
4000
4500
5000
2017 2018
Volume
M&A, $256M&A, $276
Licenses, $88
Licenses, $111
Asset Purch, $33
Asset Purch, $22
$0
$50
$100
$150
$200
$250
$300
$350
$400
$450
2017 2018
Announced $ billion
All life sciences deals in 2018 vs. 2017 by number and total deal size $ billion
4014
4522 $428 B$392 B
** Funding $6.0 (2017), $14.9 (2018); Commercial $24.0, $2.0; Service <$0.1, $0.2; Other (royalty buy-out, spin-out, settlement) $4.4, $1.2.
**
**

2018 Dealmaking
Year-in-Review
Mergers and Acquisitions (M&A)

12
Ten years of life sciences M&A transactions (adjusted $)
*Dollars are adjusted for inflation. Chart Includes all announced M&As plus four mega Asset Purchase transactions: Nestle/Pfizer Nutrition (2012), Novartis/GlaxoSmithKline Oncology (2014), Bayer/Merck Consumer Care (2014), Teva/Allergan Generics (2015).
254293 277 261
351
443
489
561
482449
$125 $122
$157
$94
$124
$347
$276
$239
$262
$276
$0
$50
$100
$150
$200
$250
$300
$350
$400
0
100
200
300
400
500
600
2009 2010 2011 2012 2013 2014 2015 2016 2017 2018
Agg
rega
te a
nn
ou
nce
d $
bill
ion
No. transactions
Aggregate M&A $ billion*

13
Top twenty M&As of 2018 by total size

14
0
10
20
30
40
50
60
No
. M&
A t
ran
sact
ion
s
Volume breakdown by Rx Area 2018 vs. 2017
2017
2018
2017 vs. 2018 M&As by known therapeutic focus
Analysis covers M&A transactions with an identifiable core therapeutic focus.
Not shown:
TAs for which there
were ≤5 M&As
announced in 2018:
• Immune
• Toxicity
• Inflammatory

15
Ten years of life sciences megamergers (nominal $)
$68.0
$49.6
$20.1 $19.7
$13.7
$29.1
$11.2 $11.9 $13.6
$25.0
$16.0 $13.4 $14.2
$42.9
$17.0
$12.2
$66.0
$17.0
$11.1
$20.8
$40.5
$32.0
$10.4
$23.6
$66.0
$14.3
$30.2
$16.6
$24.2
$11.9
$69.0
$11.6
$67.0
$13.0
$62.3
$0
$10
$20
$30
$40
$50
$60
$70
$80
2009 2010 2011 2012 2013 2014 2015 2016 2017 2018
$ b
illio
n
Year
Announced M&A deals > $10 billionYear Partner/Prinicpal
2009Pfizer/Wyeth
Merck/Schering-Plough
2010 Sanofi/Genzyme
2011
J&J/Synthes
Takeda/Nycomed
Express Scripts/Medco
Gilead/Pharmasset
2012 Nestle/Pfizer Nutrition
2013 Thermo Fisher/Life Tech
2014
Allergan (fka Actavis)/Forest
Novartis/GSK oncology products
Zimmer/Biomet
Bayer/Merck Consumer Care
Medtronic/Covidien
Merck/Sigma-Aldrich
BD/Carefusion
Actavis/Allergan
2015
Pfizer/Hospira
Valeant/Salix
AbbVie/Pharmacyclics
Teva/Allergan Generics
Shire/Baxalta
2016
AbbVie/Stemcentrx
Abbott/St Jude
Bayer/Monsanto
Pfizer/Medivation
2017
J&J/Actelion
Reckitt Benckiser/Mead Johnson
BD/C R Bard
Gilead/Kite
CVS/Aetna
2018
Sanofi/Bioverativ
Cigna/Express Scripts
GSK/Novartis consumer HC
Takeda/ShireDollars are the announced nominal values, not adjusted for inflation.

2018 Dealmaking
Year-in-Review
Licenses, Joint Ventures, and Research Collaborations

17
$25.27$25.72
$11.59
$22.32
$18.16$16.47
$25.31
$31.66
$20.62
$26.24$24.31
$25.58
$20.33
$13.39
$27.80$28.55
$32.32
$17.02
$22.03
$40.04
$0.00
$5.00
$10.00
$15.00
$20.00
$25.00
$30.00
$35.00
$40.00
$45.00
0
100
200
300
400
500
600
Agg
rega
te a
nn
ou
nce
d d
eal
do
llars
($
B)*
No
. an
no
un
ced
tra
nsa
ctio
ns
No. announced transactions Aggregate announced $B (adjusted)
Five years of licensing and collaborations by quarter (adjusted $)
*Dollars are adjusted for inflation. Chart includes all announced License, Joint Venture, and Research-Only collaborations.
2014 2015 2016 2017 2018
Q1 Q2 Q3 Q4 Q1 Q2 Q3 Q4 Q1 Q2 Q3 Q4 Q1 Q2 Q3 Q4 Q1 Q2 Q3 Q4

18
Ten years of average and median total license size (adjusted $)
* Dollars are adjusted for inflation.. Chart includes all announced License, Joint Venture, and Research-Only collaborations.
$231
$251
$196$204
$225
$330
$281
$330
$293
$371
$63
$40 $36 $31 $33
$51
$80$87
$67
$101
$0
$50
$100
$150
$200
$250
$300
$350
$400
0
200
400
600
800
1000
1200
1400
1600
1800
2000
2009 2010 2011 2012 2013 2014 2015 2016 2017 2018
$ m
illio
n*
No
. an
no
un
ced
tra
nsa
ctio
ns
No. announced transactions Average (Inflation-adjusted) $M Median (Inflation-adjusted) $M
19
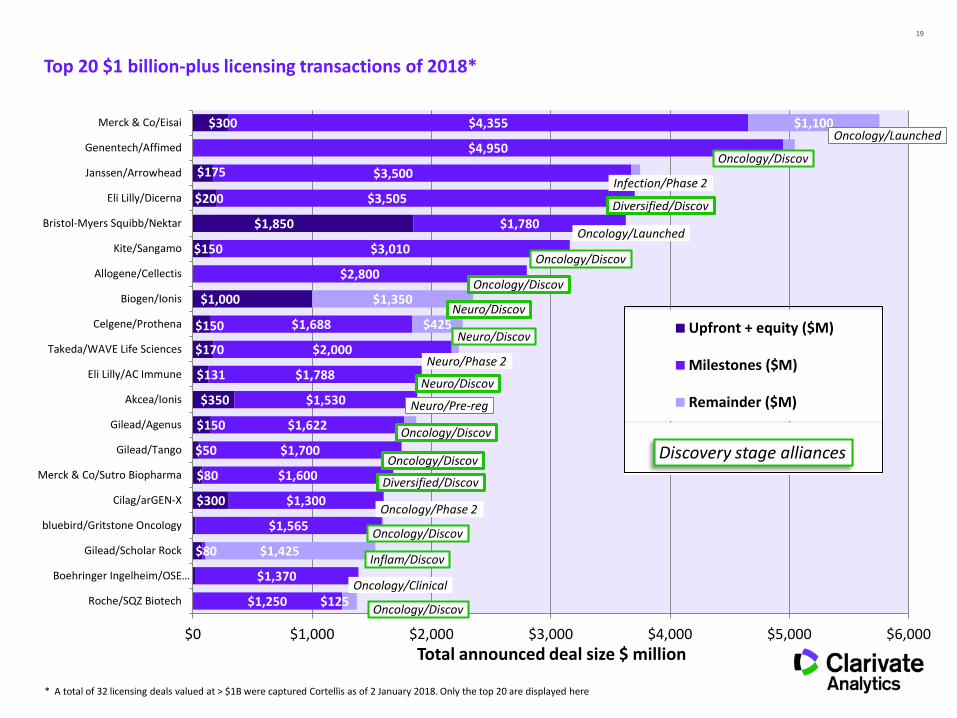
Top 20 $1 billion-plus licensing transactions of 2018*
$80
$300
$80
$50
$150
$350
$131
$170
$150
$1,000
$150
$1,850
$200
$175
$300
$1,250
$1,370
$1,565
$1,300
$1,600
$1,700
$1,622
$1,530
$1,788
$2,000
$1,688
$2,800
$3,010
$1,780
$3,505
$3,500
$4,950
$4,355
$125
$1,425
$425
$1,350
$1,100
$0 $1,000 $2,000 $3,000 $4,000 $5,000 $6,000
Roche/SQZ Biotech
Boehringer Ingelheim/OSE…
Gilead/Scholar Rock
bluebird/Gritstone Oncology
Cilag/arGEN-X
Merck & Co/Sutro Biopharma
Gilead/Tango
Gilead/Agenus
Akcea/Ionis
Eli Lilly/AC Immune
Takeda/WAVE Life Sciences
Celgene/Prothena
Biogen/Ionis
Allogene/Cellectis
Kite/Sangamo
Bristol-Myers Squibb/Nektar
Eli Lilly/Dicerna
Janssen/Arrowhead
Genentech/Affimed
Merck & Co/Eisai
Upfront + equity ($M)
Milestones ($M)
Remainder ($M)
Oncology/Launched
Oncology/Discov
Infection/Phase 2
Oncology/Launched
Neuro/Discov
Oncology/Discov
Diversified/Discov
Neuro/Phase 2
Neuro/Discov
Neuro/Pre-reg
Oncology/Discov
Oncology/Phase 2
Oncology/Discov
Inflam/Discov
Oncology/Clinical
Oncology/Discov
Discovery stage alliances
Total announced deal size $ million
Diversified/Discov
Oncology/Discov
Neuro/Discov
Oncology/Discov
* A total of 32 licensing deals valued at > $1B were captured Cortellis as of 2 January 2018. Only the top 20 are displayed here

20
$0
$10
$20
$30
$40
$50
$60
25th Percentile Median 75th Percentile Average
$ m
illio
n*
2009 2010 2011 2012 2013 2014 2015 2016 2017 2018
Ten-year trend in upfront cash license payments (adjusted $)
* Dollars are adjusted for inflation. Chart includes all announced License, Joint Venture, and Research-Only collaborations that reported an upfront cash payment. (2017 data exclude Merck/AstraZeneca and Biogen/Forward)
2018 upfront cash
25th percentile $3 M
Median $10 M
75th percentile $40 M
Average $38 M

21
Top 20 upfront cash payments in 2018 licensing transactions
Rank Licensee Licensor Upfront $M Stage Rx Area
1 Bristol-Myers Squibb Nektar $1,000 Approved Oncology
2 United Therapeutics Arena $800 Phase 3 Cardiovascular
3 Biogen Ionis $375 Discovery Neurology
4 Merck & Co. Eisai $300 Approved Oncology
5 Cilag (J&J) arGEN-X $300 Phase 2 Oncology
6 Janssen Arrowhead $175 Phase 2 Infection
7 Kite Pharma Sangamo $150 Discovery Oncology
8 Akcea Therapeutics Ionis $150 Pre-registration Neurology
9 Sanofi Denali $125 Phase 1 Neurology & Autoimm/Inflam
10 Gilead Agenus $120 Discovery Oncology
11 EUSA Janssen $115 Approved Immune
11 Takeda WAVE Life Sciences $110 Phase 2 Neurology
11 Novartis Spark Therapeutics $105 Registered Ophthalmologic
14 Eli Lilly Dicerna $100 Discovery Cardiovascular & Neurology
15 Celgene Prothena $100 Discovery Neurology
16 Janssen Theravance $100 Phase 1 Gastrointestinal
17 AbbVie Morphic Therapeutics $100 Discovery Autoimm/Inflam
18 Shionogi SAGE Therapeutics $90 Phase 2 Neurology
19 Eli Lilly AC Immune $81 Discovery Neurology
20 Roche Ionis $75 Phase 2 Ophthalmologic

22
2018 licenses by therapeutic area
Cancer, 515
Neurology/Psychiatric, 183
Infection, 129
Diversified, 91
Endocrine/Metabolic, 63
Gastrointestinal, 63
Dermatologic, 39
Cardiovascular, 37
Other/Miscellaneous, 34
Ocular, 34
Immune, 33
Genitourinary/Sexual Function, 30Inflammatory, 25Musculoskeletal, 23
Hematologic, 17 Respiratory, 17 Toxicity/Intoxication, 13
Chart includes all announced License, Joint Venture, and Research-Only collaborations where a Therapy Area is defined

23
Deal-making by Chinese companies dwarfed by US but showing robust growth
Country refers to company HQ location. Includes all announced License, Joint Venture, and Research-Only collaborations.
-10
10
30
50
70
90
China
China Principal (sell) China Partner (Buy)
China/China
-10
10
30
50
70
90
Japan
Japan Principal (Sell) Japan Partner (Buy)
Japan/Japan
-10
10
30
50
70
90
South Korea
S Korea Principal (Sell) S Korea Partner (Buy)
S Korea/S Korea
0
100
200
300
400
500
600
700
2009 2010 2011 2012 2013 2014 2015 2016 2017 2018
USA
USA/USA Inter-country
0
100
200
300
400
500
600
700
2009 2010 2011 2012 2013 2014 2015 2016 2017 2018
USA
USA Principal (Sell) USA partner (Buy)

24
Notable China inter-regional buy-side deals in 2018 – aimed at access to innovative meds in China
Sellside Buyside DateTotal
(Upfront)Asset/Technology
Phase of lead asset
Zymeworks(Canada)
BeiGene 05/2018 $722 ($20)Rights to Azymetric and EFECT platforms to develop and commercialize up to
three other bispecific antibodies worldwideDiscovery
AstraZeneca(UK)
Luye Pharma Group
01/2018 $546 ($260)Sale and license of rights to Seroquel and Seroquel XR in UK, China and other
international marketsLaunched
Zymeworks(Canada)
BeiGene 02/2018 $430 ($40)Develop and commercialize ZW-25 and ZW-49 HER2-targeted bispecific
antibodies in Asia (excl. Japan), Australia & New ZealandPhase I
Agios(US)
C-Stone Pharmaceuticals
06/2018 $424 ($12)Develop and commercialize ivosidenib (Tibsovo, AG-120) for AML and
cholangiocarcinoma in China, Hong Kong, Macau and TaiwanPre-
registration
Incyte (US)
Innovent Biologics 12/2018 $392 ($40)Develop and commercialize pemigatinib, itacitinib and parsaclisib in
hematology and in China, Hong Kong, Macau and TaiwanPhase III
Blueprint(US)
C-Stone Pharmaceuticals
06/2018 $386 ($40)Develop and commercialize avapritinib , BLU-554 and BLU-667 for cancers in
China, Hong Kong, Macau and TaiwanPhase III
Revance(US)
Shanghai FosunPharmaceutical
12/2018 $260 ($30)Develop and commercialize DaxibotulinumtoxinA (RT-002) against aesthetic and
neuroscience conditions in China, Hong Kong and MacauPhase III
Puma (US)
CANbridge 01/2018 $255 ($30)Develop and commercialize Nerlynx (neratinib oral) against cancer in China,
Taiwan, Hong Kong and MacauLaunched
Verastem(US)
CSPC Pharmaceutical 09/2018 $175 ($15)Develop and commercialize products containing duvelisib in China, Hong Kong,
Macau and Taiwan for all oncology indicationsLaunched
MacroGenics(US)
Zai Lab 11/2018 $165 ($25)Develop and commercialize three I-O programs margetuximab , MGD-019 and
MGD-013 in China, Hong Kong, Macau and TaiwanPhase III
Karyopharm(US)
Antengene 05/2018 $162 ($12)Develop and commercialize selinexor, eltanexor and KPT-9274 for oncology, and
verdinexor for non-oncology in various Asian countriesPhase III
Adocia(France)
Tonghua Dongbao 04/2018 $135 ($50)Develop, manufacture and commercialize BioChaperone Combo and Lispro for
diabetes in China and other designated countriesPhase II
Mirati(US)
BeiGene 01/2018 $133 ($10)Develop, manufacture and commercialize sitravatinib in Australia, New Zealand
and Asia excl. JapanPhase II
VBI Vaccines(US)
Brii Biosciences 12/2018 $128.5 ($4)Develop recombinant, protein-based immuno-therapeutic, VBI-2601 against
chronic HBV in China, Hong Kong, Taiwan and MacauDiscovery
Tocagen(US)
ApolloBio 04/2018 $127 ($16)Develop and commercialize Toca-511 against high-grade glioma (HGG) in
China, Hong Kong, Macau and TaiwanPhase III

2018 Dealmaking
Year-in-Review
IPOs and VC

26
Biopharma IPOs – significant uptick in last 5 years
Source: BioWorld (data current as of end of November 2018)
$0.00
$1,000.00
$2,000.00
$3,000.00
$4,000.00
$5,000.00
$6,000.00
$7,000.00
$8,000.00
$9,000.00
0
10
20
30
40
50
60
70
80
90
2009 2010 2011 2012 2013 2014 2015 2016 2017 2018
Number of financings Year total ($M)

27
Biopharma VC investment also shows strong growth
Source: BioWorld (data current as of end of November 2018)
0
2000
4000
6000
8000
10000
12000
14000
16000
18000
0
50
100
150
200
250
300
350
400
2009 2010 2011 2012 2013 2014 2015 2016 2017 2018
Number of financings Year total ($M)

28
China begins to emerge as a centre for VC investment in recent years
$0
$2,000
$4,000
$6,000
$8,000
$10,000
$12,000
0
50
100
150
200
250
2009 2010 2011 2012 2013 2014 2015 2016 2017 2018
Tota
l rai
sed
($
M)
No
. fin
anci
ngs
China # USA # Europe # China $ (M) USA $ (M) Europe $ (M)
Source: BioWorld (data current as of end of November 2018)

2017 Dealmaking
Year-in-Review
Top Pharma Dealmakers

30
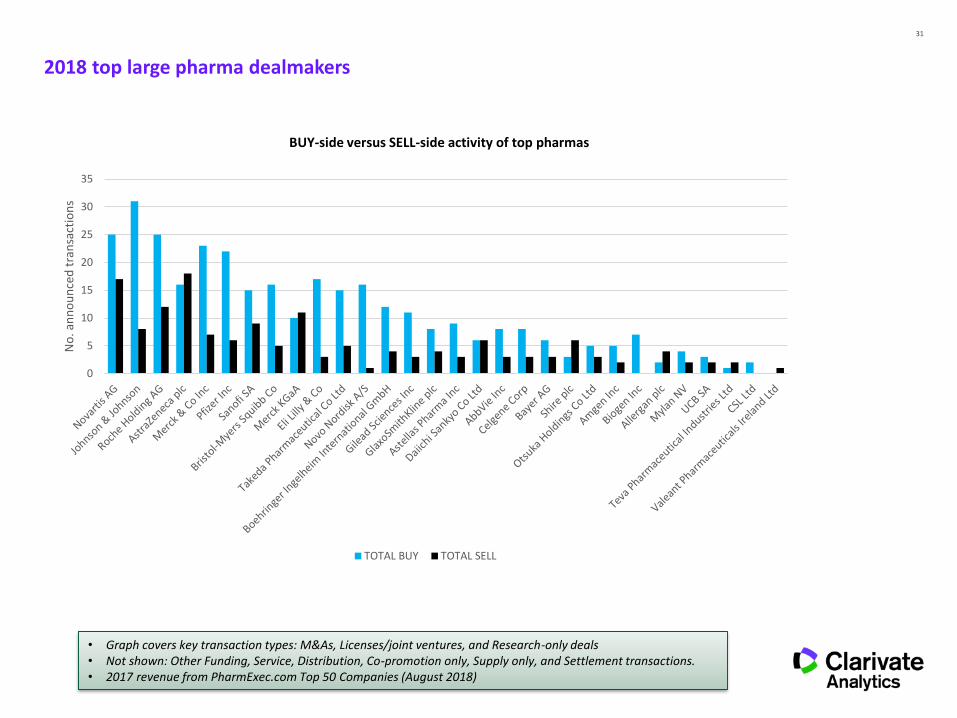
2018 top large pharma dealmakers
• Graph covers key transaction types: M&As, Licenses/joint ventures, and Research-only deals• Not shown: Other Funding, Service, Distribution, Co-promotion only, Supply only, and Settlement transactions.• 2017 revenue from PharmExec.com Top 50 Companies (August 2018)
Deal-making volume in 2018 vs. 2017 revenues and R&D spend for the top 30 pharma companies
$0
$5,000
$10,000
$15,000
$20,000
$25,000
$30,000
$35,000
$40,000
$45,000
$50,000
0
5
10
15
20
25
30
35
40
Pfi
zer
Inc
No
vart
is A
G
Ro
che
Ho
ldin
g A
G
Mer
ck &
Co
Inc
Joh
nso
n &
Jo
hn
son
San
ofi
SA
Gla
xoSm
ith
Klin
e p
lc
Ab
bV
ie In
c
Gile
ad S
cien
ces
Inc
Am
gen
Inc
Ast
raZe
nec
a p
lc
Bri
sto
l-M
yers
Sq
uib
b C
o
Eli L
illy
& C
o
Teva
Ph
arm
ace
uti
cal I
nd
ust
rie
s Lt
d
Bay
er A
G
No
vo N
ord
isk
A/S
Alle
rgan
plc
Shir
e p
lc
Bo
eh
rin
ger
Inge
lhe
im In
tern
atio
nal
…
Take
da
Ph
arm
aceu
tica
l Co
Ltd
Cel
gen
e C
orp
Myl
an N
V
Ast
ella
s P
har
ma
Inc
Bio
gen
Inc
CSL
Ltd
Dai
ich
i San
kyo
Co
Ltd
Mer
ck K
GaA
Ots
uka
Ho
ldin
gs C
o L
td
Val
ean
t P
har
mac
eu
tica
ls Ir
elan
d L
td
UC
B S
A
$ m
illio
n
No
. an
no
un
ced
tra
nsa
ctio
ns
TOTAL LicJVRsch TOTAL M&A TOTAL OTHER 2017 Revenue ($M) 2017 R&D spend ($M)
31
2018 top large pharma dealmakers
• Graph covers key transaction types: M&As, Licenses/joint ventures, and Research-only deals• Not shown: Other Funding, Service, Distribution, Co-promotion only, Supply only, and Settlement transactions.• 2017 revenue from PharmExec.com Top 50 Companies (August 2018)
BUY-side versus SELL-side activity of top pharmas
0
5
10
15
20
25
30
35
No
. an
no
un
ced
tra
nsa
ctio
ns
TOTAL BUY TOTAL SELL

32
2018 therapy area focus for top large pharma dealmakers
• Covers announced total deal size for key transactions types, M&As, Licenses/joint ventures, Research-only deals, and Other (Asset Purchases, Equity Stakes, Spin-outs), with identifiable therapeutic focus areas.
• Not shown: Toxicity, Unknown and Not Applicable therapy areas. • Diversified total does not include Takeda/Shire acquisition (Total for Diversified is $92,934 with deal included).• Companies are the Top 30 in terms of 2017 revenue (derived from PharmExec.com Top 50 Companies, August 2018)

Biopharma Industry 2018 Year-in-Review

2018 Biopharma Industry
Year-in-Review
Oncology

35
Oncology represents the greatest activity in deal making
Number of buy-side transactions by therapy area for top pharma dealmakers
• Covers key transactions types, M&As, Licenses/joint ventures, Research-only deals, and Other (Asset Purchases, Equity Stakes, Spin-outs), with identifiable therapeutic focus areas.
• Covers all technologies.• Not shown: Other, Genitourinary, Musculoskeletal, Toxicity, Unknown and Not Applicable therapy area deals. • Companies are the top 30 pharmas as ranked by 2017 revenues.
J&J
Me
rck
No
vart
is A
G
Ro
che
Eli L
illy
& C
o
Take
da
San
ofi
AZ
No
vo N
ord
isk
Pfi
zer
BI
Ab
bV
ie
Gil
ead
Ast
ell
as
Bio
gen
Me
rck
KG
aA
Ce
lge
ne
Dai
ich
i San
kyo
GSK
Am
gen
Bay
er
BM
S
Myl
an
Ots
uka
All
erg
an
CSL
Shir
e
UC
B
Teva
TOTA
L
Oncology 9 17 8 12 2 3 3 9 6 4 5 5 3 7 1 6 1 2 1 1 3 108
Neuroscience 6 1 3 3 3 3 1 1 1 2 1 7 3 2 1 2 40
Immuno/Inflam 2 1 4 1 1 1 1 2 1 1 1 1 1 1 1 1 1 1 23
Endo/Met 2 3 1 8 1 1 16
Infection 1 1 1 2 5 1 1 2 1 1 16
Diversified 1 3 1 2 3 1 1 1 13
GI 2 1 4 1 1 9
Dermatology 3 1 1 5
Hematology 1 2 1 1 5
Ophthalm 3 1 1 5
Respiratory 1 1 1 1 1 5
Cardiology 1 2 1 4
Total 27 20 20 18 14 14 13 12 12 12 9 8 8 7 7 7 6 6 6 3 3 3 3 3 2 2 2 2 0 222

36
Clarivate’s data and methodologies for oncology transactions
All announced business transactions were extracted from Cortellis for Deals Intelligence database between January 2014 and end of 2018 in the following categories:
• M&As - 183
• Licenses, Joint Ventures and Research Collaborations – 2,483
Unless otherwise noted the analysis focuses only on deals aimed at therapeutics:
• Included: Small molecules (MTT), Biologics (mAbs, siRNA, peptides, etc), Cell therapies, Vaccines, Gene therapies.
• Excluded: Medical devices, Diagnostics , Biomarkers, Discovery Technology, Software, Generics, OTC products.

37
Small molecule, 705
Antibodies, 491
DNA/RNA/Oligonucleotide/Gene & Cell
therapy/Oncolytic virus/Other cancer
vaccines, 401
Proteins/peptides, 68 Other , 14
$331 billion aggregate deal dollars in oncology announced since 2014; 64% of the deals are focused on therapeutic assets
• Source: Cortellis Deals Intelligence.• Covers key transactions types with an identifiable technologies; all included.
GSK Novartis asset purchase not included
Therapeutic, 1703
Biomarkers/Diagnostics/Imaging, 495
Genomics/Other Drug Discovery
Technologies, 235
Devices, 80
Instruments/Software/Service, 79
Generic/Biosimilar/OTC, …
Formulation, 36Other, 11
Breakdown of Therapeutic asset deals
Oligonucleotides/Gene & cell therapy/Cancer vaccines, 401

38
In 2018, both large and small pharma are active participants oncology licensing
In-licensing activity for big pharma (95 total deals; $31.8 billion total value)
Licensee/Licensor Total/Upfront Notable Assets Phase Indication
Merck & Co./Eisai $5.8 B/$300 M pembrolizumab, lenvatinib Launched Broad cancer focus
Roche/Affimed $5.0 B/unspecified NK cell engager-based immunotherapies Discovery Broad cancer focus
Bristol-Myers Squibb/Nektar $3.6 B/$1000 M Nivolumab, ipilimumab, NKT-214 Launched Broad cancer focus
Gilead/Sangamo Therapeutics $3.2 B/$150 M Cell therapies using zinc finger tech. Discovery Broad cancer focus
Gilead/Agenus $1.9 B/$120 M I-O therapies incl. AGEN-1423 Discovery Broad cancer focus
Gilead/Tango Therapeutics $1.8 B/$50 M I-O therapies Discovery Broad cancer focus
Cilag (J&J)/arGEN-X $1.6 B/$300 M cusatuzumab Ph II AML, MDS
Boehringer Ingelheim/OSE $1.4 B/$18 M OSE-172 Clinical Solid tumors
Roche/SQZ Biotech $1.4 B/$125 M Antigen-presenting cell-based therapies Discovery Broad cancer focus
Janssen/Yuhan $1.3 B/$50 M lazertinib Ph II NSCLC
Notable activity for smaller biotechnology (246 total deals; $17.6 billion total value )
Licensee/Licensor Total/Upfront Notable assets Phase Indication
Allogene/Cellectis $2.8 B/unspecified UCAR-T cell therapies Discovery Broad cancer focus
Bluebird/Gritstone $1.6 B/$20 M Cell therapies using EDGE tech. Discovery Broad cancer focus
Oncologie/Mologen $1.3 B/$4 M lefitolimod Registered Broad cancer focus
ONO/Fate Therapeutics $1.3 B/$10 M CART-cell therapies Discovery Broad cancer focus
Seattle Genetics/Pieris $1.2 B/$30 M Bispecific antibody-anticalin fusion proteins Discovery Broad cancer focus
LG Chem/Cue Biopharma $1.1 B/$5 M CUE-101 Discovery Broad cancer focus
AML = acute myeloid leukemia; MDS = myelodysplastic syndromes; NSCLC = non-small cell lung cancer
Includes therapeutic-focused deals with oncology as a major focus

39
Early-phase small molecules make up largest percentage of oncology deals and significant portion of total value
Includes M&A, Licensing, Joint venture, Research only and significant Asset Purchase deals (2014-2018).Excluded: Medical devices, Diagnostics , Biomarkers, Discovery Technology, Software, Generics, OTC products. Excluded: Deals where stage of asset at signing is “Launched” or unknown.
No. oncology deals Total announced value ($M)
Discovery Phase 1 Phase 2 Phase 3 Pre-reg/Reg
818
139
228
12041
$124,386
$18,417
$45,115
$12,366
$15,858

40
Increase in oncology licensing at large pharma companies is driven in part by greater overall deal activity
Upfront payment trends ($M) Total deal size trends
2014 2015 2016 2017 2018
Number of deals 36 45 36 22 25
Includes Licensing, Joint venture, Research only deals where deal terms disclosed..Excluded: Medical devices, Diagnostics , Biomarkers, Discovery Technology, Software, Generics, OTC products.
$0
$100
$200
$300
$400
$500
$600
$700
$800
2014 2015 2016 2017 2018
$0
$5,000
$10,000
$15,000
$20,000
$25,000
$30,000
$35,000
Med
ian
Dea
l Val
ue
ran
ge (
$M
)
Tota
l an
d M
ax D
eal V
alu
e ra
nge
($
M)
Max Deal Value ($M) Total Deal Value ($M) Median Deal Value ($M)
$0
$500
$1,000
$1,500
$2,000
$2,500
$3,000
$3,500
$4,000
2014 2015 2016 2017 2018
$0
$10
$20
$30
$40
$50
$60
Tota
l an
d M
ax U
pfr
on
t ra
nge
($
M)
Med
ian
Up
fro
nt
ran
ge (
$M
)
Max Upfront ($M) Total Upfront ($M) Median Upfront ($M)

41
$2.8 billion paid upfront; $26 billion downstream for top 10 oncology licensing deals by size in 2018
Source: Cortellis. press releases
Licensee Licensor DateTechnology/
Mechanism of actionTotal$M
Upfront1
$MDownstream fees and terms
Merck & Co. Eisai 03/2018 PD-1/lenvatinib I-O combination 5,755 300
$650 millionOption rights through 2020
$450 millionReimbursement for R&D expenses
$385 million Regulatory and sales milestones
$3,970 millionSales milestones associated with Lenvima
Roche Affimed 08/2018NK cell engager-based immunotherapeutics
5,046 ND
$250 millionDevelopment milestones
$1,100 millionOn receipt of regulatory approvals
$3,600 millionSales milestones Tiered royalties
Bristol-Myers Squibb
NektarTherapeutics
02/2018 PD-1/NKT-214 I-O combination 3,6301,000
(plus 850 equity)
$1,430 million Development and regulatory milestones
$350 millionSales milestones
Kite Pharma (Gilead)
SangamoTherapeutics
02/2018Engineered cell therapies using zinc finger nuclease technology platform
3,160 150
$1,260 millionResearch, development and first commercial sale milestones
$1,750 millionSales-based milestones if annual worldwide net sales reach.$455 million
Allogene Cellectis 04/2018Allogeneic UCAR-T cell therapy
programs 2,800 ND
$185 million per target for 15 targets Tiered royalties in the high single digits on net sales of any products
commercialized by Allogene
Gilead Agenus 12/2018 I-O therapies incl. AGEN-1423 1,872120
(plus 30 equity)
$553 millionDevelopment and commercial milestones
High single digit to mid-teen percent royalties on AGEN-1423$50 million
Option exercise fee for each option after exercising$520 million
Additional dvlpt and commercial milestones for each option programHigh single digit to mid-teen percent royalty payments for each option
GileadTango
Therapeutics10/2018 I-O therapies 1,750 50
$1,700 millionPreclinical fees and development, regulatory and commercial milestones
Low double-digit tiered royalties on net sales across all programs
Cilag (J&J) arGEN-X 12/2018Anti-CD70 antibodies incl.
cusatuzumab1,600
300(plus 200 equity
under separate deal)
$1,300 millionDevelopment, regulatory and sales milestones
BluebirdGritstone Oncology
08/2018 Cell therapies using EDGE tech. 1,59520
(plus 10 equity)
$129 million per therapy product & $27.5 million per target product Development, regulatory, and commercial milestones
Low single-digit tiered royalty payments upon on annual net sales
Boehringer Ingelheim
OSE Immunothera
peutics04/2018
Myeloid checkpoint inhibitor antibody, OSE-172
1,389 18
$18 millionOn initiation of a phase I clinical study
$1,350 millionDevelopment, commercialization and sales milestones
Royalties on worldwide net sales

42
Top 10 oncology M&A deals in 2018 total $21.7 billion and include new technologies
Sellside Buyside DateStage Financials
$MAsset/
TechnologyD I II III PR/R L
Juno Therapeutics
Celgene 01/2018 $9,000 Cell therapy
TESARO GlaxoSmithKline 12/2018 $5,100Small
molecule
ARMO Biosciences Eli Lilly 05/2018 $1,600 MAb
BeneVir Biopharm Janssen 02/2018$1,040 ($140 UF, $900 milestones)
Recombinant virus
Tusk Therapeutics Roche 09/2018$781 ($83 UF,
$697 milestones)Antibody
Cascadian Therapeutics
Seattle Genetics 01/2018 $614Small
molecule
AurKa Pharma Eli Lilly 05/2018$575 ($110 UF,
$475 milestones)Small
molecule
Denali Therapeutics F-Star Gamma 05/2018$465 ($18 UF,
$447 milestones) MAb
Viralytics Merck & Co. 02/2018 $394IntratumoralI-O therapy
ViraTherapeuticsBoehringer Ingelheim
09/2019 $210Recombinant
virus
1 Only M&A deals for therapeutics were considered, and where “Cancer” is the primary focus

43
Percentage of oncology licensing deals from 2014-2018 by region
~1% (North America → Aus/NZ)~1% (Aus/NZ → North America)
<1% (North America → Central/South America)<1% (Central/South America → North America)
~41% (North America → North America)
~11% (Europe → Europe)
~5% (Asia → North America)~7% (North America → Asia)
~8% (Asia → Asia)
~1% (Asia → Europe)~3% (Europe → Asia)
~1% (Europe → Aus/NZ )<1% (Aus/NZ → Europe)
~10% (Europe → North America)~10% (North America → Europe
<1% (Asia → Aus/NZ)<1% (Aus/NZ → Asia)
~1% (Aus/NZ → Aus/NZ)
~1% (North America → Israel/M. East)<1% (Israel/M.East→ North America)
<1% (Europe → Israel/M. East)<1% (Israel/M.East→ Europe)

44
Summary of findings
• Oncology represents the largest number of deals
• High value deals driven by immuno-oncology
• Median deal value rose in 2018 but upfronts static
• Discovery-stage deals capable of commanding high value
• Oncolytic virus technology make a prominent showing in M&A activity
• Opportunity remains for inter-regional deal-making

2018 Biopharma Industry
Year-in-Review
Approvals and Other Drivers of ROI

Analysis suggests large pharma ROI has continues to fall

47
But an orphan NME approval is not the end of the story…
0
200
400
600
800
1000
1200
Nu
mb
er
of
elig
ible
US
pat
ien
ts
(10
00
s)
Incremental growth in eligible patients for treatment with Keytruda (2014-2017)*
First FDA approval (orphan indication) for advanced melanoma refractory to ipilimumaband BRAF inhibitors and with V600 BRAF mutation
Advanced PD-L1+ NSCLC that has progressed after other treatments
Recurrent/metastatic head and neck squamous cell carcinoma (PD-L1 independent) that has progressed after platinum-containing chemotherapy
Additional indications
Source: IPD, NCI Cancer Stat Facts, and various publications* Patient number estimates are based on the prevalence of the cancer in the US. Assumptions have been made with regard to theproportion of patients eligible for Keytruda therapy (stage of disease, line of therapy, etc,)

48
o Stott suggests that the industry that is entering a vicious cycle of negative growth and terminal
decline as its fundamental business model has run out of steam by the Law of Diminishing
Returns
Pharma's broken business model – An industry on the brink of terminal decline by Stott

49
o There is a limited
correlation
between R&D
productivity and
Company
Performance
Biopharma R&D Productivity and Growth 2017: Big Pharma closes the gap (Catenion)

Enterprise Value Jan 2010 – Dec 2018

51
0
5
10
15
20
25
30
35
0 1000 2000 3000 4000 5000 6000 7000Sale
s fr
om
pro
du
cts
app
rove
d in
last
fiv
e ye
ars
as %
to
tal
ph
arm
a sa
les
Sales from products approved 2013-2017 ($M)
Sales from products approved in last five years (2013-2017)
Large pharma revenues have been driven by older products
Established products are driving sales
Sources: Clarivate Analytics 2018Approvals data from Cortellis Regulatory Intelligence and FDAProduct and company sales data from company Annual Reports/20-F or 10-K filingsPatent expiry data from company reports (as above) and NewportExchange rates from www.x-rates.com
0%
10%
20%
30%
40%
50%
60%
70%
80%
Off-patent sales as % total sales (2017)

52
The cost per from US$2 billion in 2014 to US$3 billion mark in 2016 and 2017
1903
2601
3239 3252
0
500
1000
1500
2000
2500
3000
3500
2014 2015 2016 2017
Co
st
in U
S$
mil
lio
n
Year
2014 2015 2016 2017
Approvals limited to lead projects. Adjusted to account for co-developments between companies. Limited to 2018
participants and includes companies that have provided expenditure for each year and have at least 0.5 approvals
Source: 2018 CMR R&D and Investment Metrics programmes
o While the cost per NME approval has increased by 50% between 2014 and 2017 the median peak
sales value per FDA approval has remained fairly constant at $1.0 billion during the same period.

53
Source: FDA
Record-breaking year for FDA NME approvals: orphan drugs exceed >50% for first time
No. US FDA CDER NME approvals 2010-2018
0%
10%
20%
30%
40%
50%
60%
70%
80%
90%
100%
0
10
20
30
40
50
60
70
2010 2011 2012 2013 2014 2015 2016 2017 2018*
% a
pp
rova
ls d
irec
ted
at
orp
han
ind
icat
ion
s
No
. FD
A C
DER
NM
E ap
pro
vals
SM Biologic % orphan approvals

54
Only 19% of 2018 NME approvals forecast to generate sales >$1Bn by end of 2023
Approvals with forecast sales >$1B
Major pharma, 7
Other pharma, 4
Approvals with forecast sales <$1B, 48
55
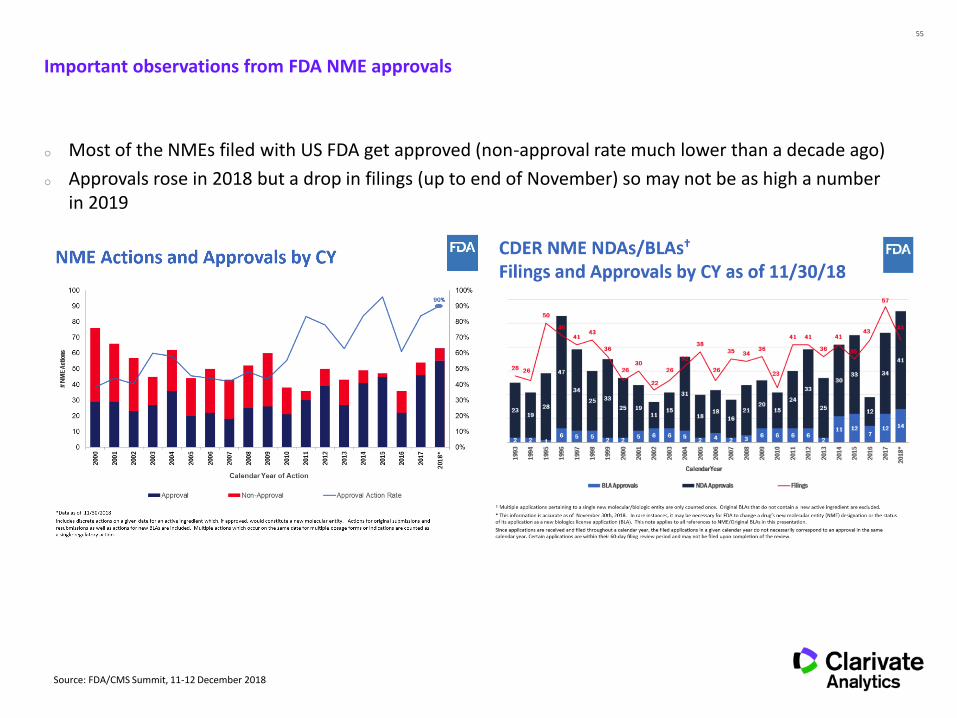
o Most of the NMEs filed with US FDA get approved (non-approval rate much lower than a decade ago)
o Approvals rose in 2018 but a drop in filings (up to end of November) so may not be as high a number in 2019
Important observations from FDA NME approvals
Source: FDA/CMS Summit, 11-12 December 2018

56
Oncology no longer main driver of approvals and most approved for orphan indications
Source: FDA, Clarivate Analytics analysis
2018
Other orphan approvals, 20
Oncology orphan approvals, 14
Oncology non-orphan approvals,
4
Other non-orphan approvals, 21

57
Trends in 2018 approvals
New drugs continue to address fewer patients
US FDA CDER NME approvals Patients covered by approved indications (M)1
Source: FDA, IPD, Clarivate Analytics analysis1 Epidemiology data from IPD and published scientific literature. Patient numbers are for US only
21
59
2010 2018
190
168
2010 2018
*
* Two of the drugs approved drugs in 2018 have been assigned as “zero” patients:
TPOXX (tecovirimat) for the treatment of smallpox when used as a bioweaponMOXIDECTIN (moxidectin) for onchocerciasis (river blindness) due to Onchocerca volvulus. There are no cases in the US, but the WHO estimates 18 M patients worldwide

58
Pricing remains a source of contention
Source: Novartis Investor Day, 5 November 2018, Slide 48

59
Percent of US NME approvals sponsored by top pharma companies has been falling year on year
Note: Acquisitions or licensing deals bringing in assets from a non Top 20 pharma that occurred within one year of eventual approval not counted for the Top 20 Pharma (usually not listed as sponsor in these cases anyway). Co-development of a molecule with a non Top 20 pharma company counted as half an approval
Source: FDA, Clarivate Analytics analysis
0%
10%
20%
30%
40%
50%
60%
70%
2010 2011 2012 2013 2014 2015 2016 2017 2018*
Top 20 pharma sponsors

60
Deal-making still accounting for more than 50% of NME approvals
All NME approvals Oncology NME approvals
US FDA CDER NME approvals resulting from licensing/acquisition (2010-2018)
0%
10%
20%
30%
40%
50%
60%
70%
80%
90%
100%
2010 2011 2012 2013 2014 2015 2016 2017 2018*

61The funding challenge (illustrative)

2018 Biopharma Industry
Year-in-Review
Summary

63
o Industry continues to concentrate BD on areas of unmet medical need, e.g. oncology, rare diseases
o With differences between biopharma and VC in terms of investing at risk, i.e. neuroscience
o China deal-making continues to grow
o Some of the doom-and-gloom papers suffer from methodological issues
o Companies are creating value although it is driven commercially and questions remain about ROI
o Rare disease/niche remains an attractive strategy which will continue to keep the spotlight on drug pricing
o Greater funding challenges remain which will require further innovation and bold leadership
Summary

Q&A

65
Contact us
Jamie Munro, PhDGlobal Practice Leader, Portfolio & LicensingMobile +44 782 447 4864 ; Office +44 207 433 4910Friars House, Southwark, London, UK
Helen Dowden, PhDConsultant, Portfolio & LicensingMobile +44 (0)7553 855 669

Powering life sciences innovation with trusted content, analytics & technology.
clarivate.com/contact-us