2018 - cmp - sart mexico · cyanide recycle, gold mining, merrill crowe, sart capex, sart process ....
TRANSCRIPT

This paper was presented at the 50th Canadian Minerals Processors Conference in Ottawa, Canada on January 24, 2018
SART IMPLEMENTATION AT HEAP LEACH OPERATIONS IN MEXICO
*D. Kratochvil1, D. Salari2 and Tadeo Avilez3
1BQE Water
Suite 250 – 900 Howe Street Vancouver, Canada V6Z 2M4
(*Corresponding author: [email protected])
2D.E.N.M. Engineering Ltd. #300 – 10, 1100 Burloak Drive Burlington, Canada L7L 6B2
3Metallōrum México
Av. Pedro Ramírez Vázquez 200-10, Valle Oriente Garza García, Nuevo León, 66269 México
ABSTRACT
The economics of developing gold deposits containing elevated levels of cyanide soluble base metals is often challenged by high cyanide consumption and increased operating costs. SART is a chemical process that enables cyanide consumed by base metals to be recovered and recycled for gold leaching. The process also provides concurrent recovery of the base metal to generate incremental revenue from the sale of high-grade base metal sulphide concentrates. Although SART was developed and successfully piloted by Lakefield Research and Teck Corporation in the late 90’s and is now a public domain technology, the adoption of SART has been relatively slow due to concerns about implementation costs and the reliability of metallurgical performance. Through extensive experience in selective metal sulphide precipitation applied to mining wastewater since 2007, BQE Water has provided process know-how, design along with operations and maintenance experience to a number of projects involving the integration of SART into various metallurgical flowsheets on an industrial scale. This paper presents the commissioning experience and operating data from a SART plant treating up to 500 m3/hr of leach solution at a heap leach operation in Mexico.
KEYWORDS Cyanide recycle, Gold mining, Merrill Crowe, SART CAPEX, SART process
This paper was presented at the 50th Canadian Minerals Processors Conference in Ottawa, Canada on January 24, 2018
INTRODUCTION One of the current trends in the gold industry globally is the increasing importance of complex polymetallic gold deposits as discoveries of large Carlin type gold deposits become increasingly rare (Sceresini, 2005). The presence of cyanide soluble copper and zinc in complex gold deposits necessitates changes to the traditional gold extraction metallurgical flowsheet. A tool available to the industry to help manage the interference of cyanide-soluble base metals in gold extraction is the SART (sulphidization-acidification-recycling-thickening) process. SART breaks the weak acid dissociable (WAD) base metal-cyanide complexes, precipitates the metals as high-grade sulphide concentrates and makes the freed cyanide available for recycle. Although SART is a commercially available technology, it is still relatively new to the industry with fewer than ten full scale plants having been constructed in the past couple of decades. Some of these SART plants are small, most are located at remote sites and the majority have not operated on a continuous basis. This has resulted in a general lack of information about the true costs, operability and metallurgical performance of SART. BQE Water has been involved in the design, construction, commissioning and operation of large scale SART plants in Mexico, Turkey and Chile and has conducted field testing programs for multiple projects in Peru, Chile, Kazakhstan and Mexico as part of the technical assessment of SART integration into future metallurgical plants. Having built and operated numerous plants utilizing selective sulphide precipitation of heavy metals, BQE Water has gained unique insight into the design and control of the sulphidization stage of SART to minimize costs and ensure high efficiency in cyanide recovery.
SART TECHNOLOGY
The SART process was developed in the 1990s by SGS Lakefield and Teck Corporation in response to the challenges associated with cyanide-soluble base metals at Lobos Martes and was first applied commercially at the Telfer Mine in Australia (Barter, Lane, Mitchell, Kelson, Dunne, Trang & Dreisinger, 2001). The following chemistry represents the process when copper is the base metal of concern and lime is used in the neutralization stage: Sulphidization and Acidification:
2Na2Cu(CN)3(aq) + NaHS + 2.5H2SO4 → Cu2S(s) + 6HCN + 2.5Na2SO4(aq) Recycling and Thickening:
6HCN + 2.5Na2SO4(aq) + 3Ca(OH)2 → 2.5CaSO4.2H2O(s) + 5NaCN(aq) + 0.5Ca(CN)2(aq) + H2O
As shown by these reactions, SART breaks the base metal-cyanide complexes, produces solid high-grade metal sulphide concentrate for sale and frees cyanide for recycle. The key inputs of the process are sulphuric acid, sulphide and a neutralization agent. A schematic of the SART process is shown in Figure 1.
Figure 1. Typical SART process flowsheet using lime for re-neutralization

This paper was presented at the 50th Canadian Minerals Processors Conference in Ottawa, Canada on January 24, 2018
Application of SART technology yields direct economic benefits to precious metals mining operations including the following: Reduction in cyanide consumption required to achieve cost-effective gold recovery in the presence of
cyanide soluble base metals. In some cases SART becomes the technology “enabling” gold recovery from deposits that would otherwise not be economically viable.
Reduction in cyanide destruction costs and avoidance of build-up of cyanide destruction by-products in process water and/or tailings supernatant prior to discharge into the environment.
Improved purity of gold doré and reduction in copper loading onto activated carbon. Incremental revenue from sales of copper and zinc sulphide concentrates.
However, there are also several limitations and challenges associated with SART integration into hydrometallurgical flowsheets including: 1) The majority of SART equipment is sized based on flow resulting in large plant footprints and high
capital cost for high flow SART applications which negatively impacts SART implementation at large heap leach operations.
2) SART does not concentrate cyanide for reuse which is critical for sites with positive water balances. 3) SART treats only solutions, not slurry streams which limits its integration into certain flowsheets.
A SART cost-benefit analysis needs to be performed on a case by case basis since metallurgical flowsheets and interferences of base metals in precious metals recovery vary from site to site.
CAPITAL COST OF A SART PLANT IN MEXICO Project Overview
In 2007, BQE Water designed and constructed a SART plant at a mine site in Sonora, Mexico. The
site operated a conventional heap leach combined with gold recovery by Carbon-in-Columns (CIC) in an Adsorption-Desorption-Regeneration (ADR) plant. In 2008, the mine was expected to ramp up production from a new section of the ore body rich in cyanide soluble copper. Based on mine plans and metallurgical testing completed in 2006, the SART plant was designed for a hydraulic flow of up to 340 m3/hr. The metallurgical processing flowsheet is shown in Figure 2.
Figure 2. Original SART flowsheet integration at Mexico gold mine
The SART plant construction was completed in 2008 followed by commissioning and several
months of operation. A high-grade, copper concentrate containing up to 65% copper was produced during the plant operation and sold to Trafigura. In 2009, due to constraints put on capital spending, the mine expansion and development of the copper rich part of the deposit was put on hold while production from the existing open pit continued. Consequently, the SART plant ceased to operate.
In 2015, a new mine development and production plan was prepared under new ownership. The
following year, D.E.N.M. Engineering Ltd. and BQE Water were retained to assist with preparing the SART plant for re-start and helping to increase both the hydraulic capacity and copper mass removal capacity to support the new plan. A comparison of the original 2008 design criteria to the new 2017 design criteria is given in Table 1 below.

This paper was presented at the 50th Canadian Minerals Processors Conference in Ottawa, Canada on January 24, 2018
Table 1. SART plant design criteria & high level production comparison
2008 Design 2017 Design Flow to SART plant m3/hr 340 525 Feed source ADR (BLS) Heap pond (PLS) Nominal copper concentration mg/L 150 300 Nominal WAD cyanide concentration mg/L 350 700 Target copper concentration in discharge mg/L 15 45 Copper recovery % 90% 90% Copper production lbs/year 900,000 2,800,000 Cyanide recovery % 95% 95% Cyanide recycle to leach lbs/year 2,200,000 6,800,000
One of the major changes to the plant from the original design is the feed source. Originally, the
SART plant was placed downstream of the ADR process, effectively treating barren leach solution (BLS). For the restart, it was decided to switch the SART plant feed source to treat the pregnant leach solution (PLS) to enable the ADR plant to benefit from reduced copper loading and increased free cyanide levels that reduce the capture of copper by activated carbon.
The other significant system change was the target 50% increase in hydraulic throughput from 340
to 525 m3/hr. To keep costs down, no tanks were replaced for larger vessels. While having a cost benefit, this has the effect of reducing the retention time within reactors and rise rates in the SART copper and gypsum clarifiers. To mitigate this reduced reaction time, BQE Water incorporated new design features based on experiences from other projects (Ljubetic, Lopez, Kratochvil & Sanguinetti, 2013) that are expected to increase the solids settling rate in the clarifiers without compromising reagent utilization efficiency. Capital Costs
The breakdown of the actual capital costs of the SART plant “as constructed” in Mexico in 2008 is
presented in Table 2. The costs include both direct and indirect costs of the fully installed plant but exclude costs of basic engineering and the feasibility study that preceded the construction of the plant. For clarity, the indirect costs include the cost of the geological survey, permitting, EPCM, freight for equipment and supplies, and all owner’s costs. It should be noted that the mine site is not remote and is readily accessible by local construction contractors. The SART plant is also installed outdoors with no need for a building enclosure or heat tracing to prevent pipes from freezing in the winter although all lines smaller than 2” in diameter are insulated.
Table 2. SART plant capital cost summary
Direct Costs Actual Costs (2008 CAD)
Inflation Adjusted Costs
(2017 CAD)
Cost for 2017 Refurbishment &
Upgrade to 500 m3/hr (2017 CAD)
Equipment Directs Subtotal $2,019,000 $2,251,000 $400,000 MCC/PLC System $111,000 $124,000 $44,000 Instrumentation $80,000 $89,000 $54,000 Construction Directs $1,600,000 $1,784,000 $250,000 Total Direct Costs $3,810,000 $4,248,000 $748,000 Indirect Costs (incl commissioning)
$2,247,000 $2,505,000 $795,000
Total Installed Costs $6,057,000 $6,753,000 $1,543,000 Resulting installed cost factor 3.0

This paper was presented at the 50th Canadian Minerals Processors Conference in Ottawa, Canada on January 24, 2018
Table 2 shows that the total installed costs for the SART plant treating up to 340 m3/hr of leach solution was CAD $6.1 M in 2008. Using the CPI indices to allow for inflation, this would represent CAD $6.8 M in 2017 dollars. However, using CPI to estimate the cost of the same SART plant being constructed in 2017 is not accurate and likely results in a significant overestimation due to the fact that commodity prices which affect the cost of materials of construction including steel, stainless steel, copper cable and fuel for powering construction equipment and contractor costs for mob and de-mob are significantly lower in 2017 compared to Q1 2008. Table 2 further shows that the ratio of the total installed cost to the cost of process equipment is approximately 3, differing from the ratios published for fluid processing plants (Perry & Green, 1997) which vary from 3.98 to 4.87. A possible explanation may be due to the fact that the Mexican SART plant did not require a building enclosure and/or solution pipe heat tracing which are often associated with fluid processing plants. Interestingly, the refurbishment cost summary presented in Table 2 indicates that the ratio between total installed cost and cost of equipment that applies to upgrades and expansions of existing plants can be expected to be similar.
The actual capital cost of the SART plant built in Mexico in 2008 is at the low end of the cost
estimates for SART published by others (Stewart & Kappes, 2012) and well below the low end when the upgrade to 500 m3/hr is taken into account. Perhaps this is one of the main reasons for the attempts to explore new versions of the SART process such as SART Lite (Stewart & Kappes, 2012). While these process versions appear plausible based on lab and engineering studies, they introduce multiple operational risks in the full-scale operation, and the true net benefit of the potential capital cost savings by adopting the modified SART flowsheets need to be assessed against these risks.
In BQE Water’s experience, the most important factors influencing the SART capital cost is the
remoteness of the mine site and the degree of pre-fabrication of plant components prior to shipping. If the design and fabrication is carried out in such a way that the site construction labour and overall schedule are minimized then the SART capital cost can be expected to be in line with the cost estimates presented above. Significant capital and operating cost savings can also be achieved if the SART gypsum thickener underflow slurry does not need to be dewatered. Such as the case in Sonora where the gypsum underflow is impounded in an engineered lined pond adjacent to the SART plant. In other projects, BQE Water is working with clients on alternative options for SART gypsum disposal including capping of spent heaps and/or blending with the feed to CIP/CIL circuits.
When the 2017 refurbishment costs are analyzed in more detail, the bulk of the total refurbishment
costs can be attributed to the nearly decade long furlough rather than the upgrade to manage the increased base metal and cyanide loading along with the increased hydraulic capacity. Furthermore, the refurbishment cost of CAD $1.5 M is relatively low considering the fact that the plant sat idle for almost a decade. This is a testament to the original quality of construction and the resilience of SART equipment to aging.
SART PLANT COMMISSIONING
Commissioning of Safety Systems
The first commissioning step of any SART plant prior to introducing acid and sulphide into the system involves the commissioning of all the safety systems and environmental safeguards. One of the most important safeguards in SART are HCN monitors that measure the concentration of hydrogen cyanide gas in ambient air and in scrubbed process off-gas at different locations around the plant including the stack that discharges scrubbed gas into the atmosphere.
Whenever one of the sensors detects HCN in excess of 4 ppmV for 30 seconds, the SART process
is stopped. While the protection of the plant operators is the key objective, faulty readings resulting in false alarms are not only a nuisance but can negatively impact the overall plant operation and performance. The mounting of HCN monitors that measure HCN in ambient air is straightforward involving clamps attached to support steel and handrails at strategic locations around the plant. In contrast, the sensor mounting in the scrubber off-gas is more delicate. The most important location is the gas discharge from the HCN scrubber

This paper was presented at the 50th Canadian Minerals Processors Conference in Ottawa, Canada on January 24, 2018
that conveys scrubbed gas into the atmosphere via a stack. Often gas sensors are mounted horizontally on stacks, producing a direct measurement of target compounds just prior to the gas release into the atmosphere. Unfortunately, many HCN sensors including the ones used at the SART plant in Sonora contain working elements inside the sensor that rely on the contact between these elements and a working fluid. This contact is lost when the sensors are mounted at an angle or horizontally as the fluid level changes. Thus the HCN sensors must be mounted vertically.
The initial sensor installation at the Sonora plant was located in the gas blower outlet manifold that
was connected to the bottom of the stack. However, during the first week of plant operation, several unexplained HCN alarms interrupted the plant operation. Investigation of the root cause of these alarms revealed that sensor readings were affected by the sensor location due to water vapour condensation and pockets of stationary gas trapped in the cavity around the tip of the sensor. Consequently, the sensors were moved to a new location away from the blower discharge and closer to the blower suction on a by-pass line where a steady flow of gas keeps sweeping the tip of the sensor. The final installation of the HCN sensors is shown in Figure 3 below.
Figure 3. Final installation of HCN gas sensors
Plant Performance during Process Start-up
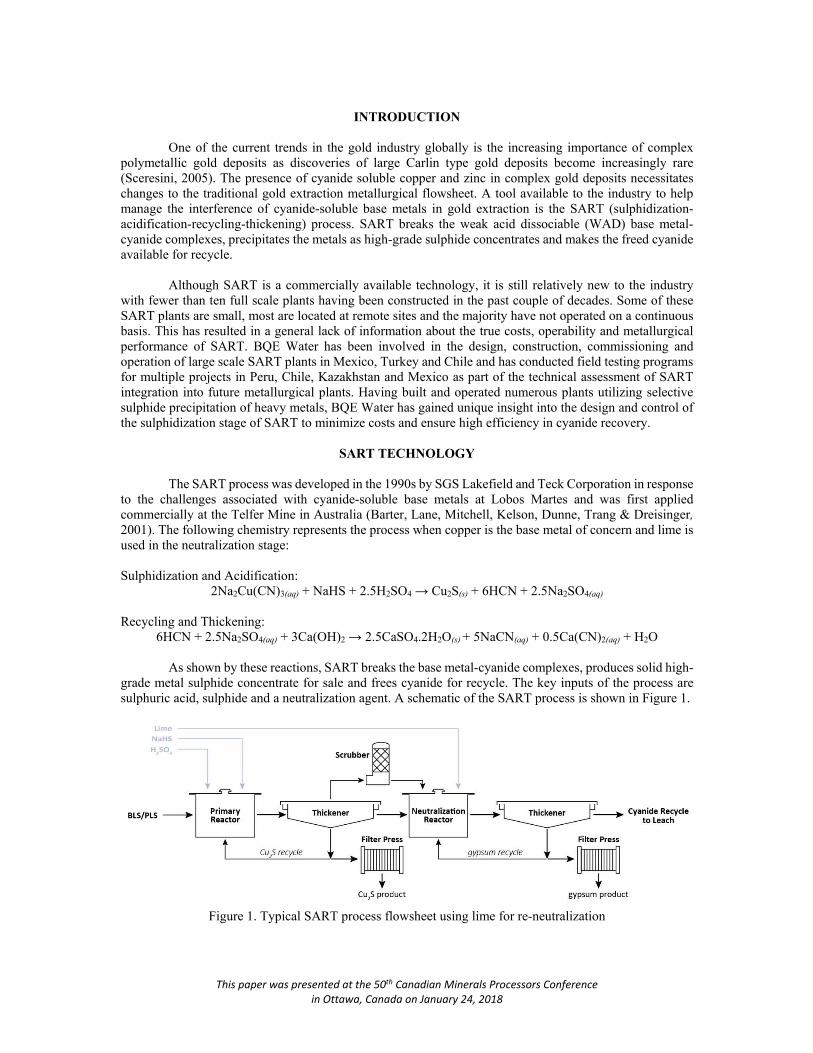
Figure 4 shows the concentrations of copper, free cyanide and gold in the SART feed during start-
up. The feed contained copper in excess of 1,000 mg/L which is much higher than the maximum design level for this plant and higher than in other SART plants (Lawrence & Lopez, 2011, and Monhemius, Hedhazi & Saeedi Ali, 2017). In addition, the feed solution contained very high free cyanide concentrations which varied between 800 and 1,800 mg/L. This is uncharacteristically high for pregnant leach solutions which are often cyanide starved.
This paper was presented at the 50th Canadian Minerals Processors Conference in Ottawa, Canada on January 24, 2018
Figure 4. SART feed (PLS) composition
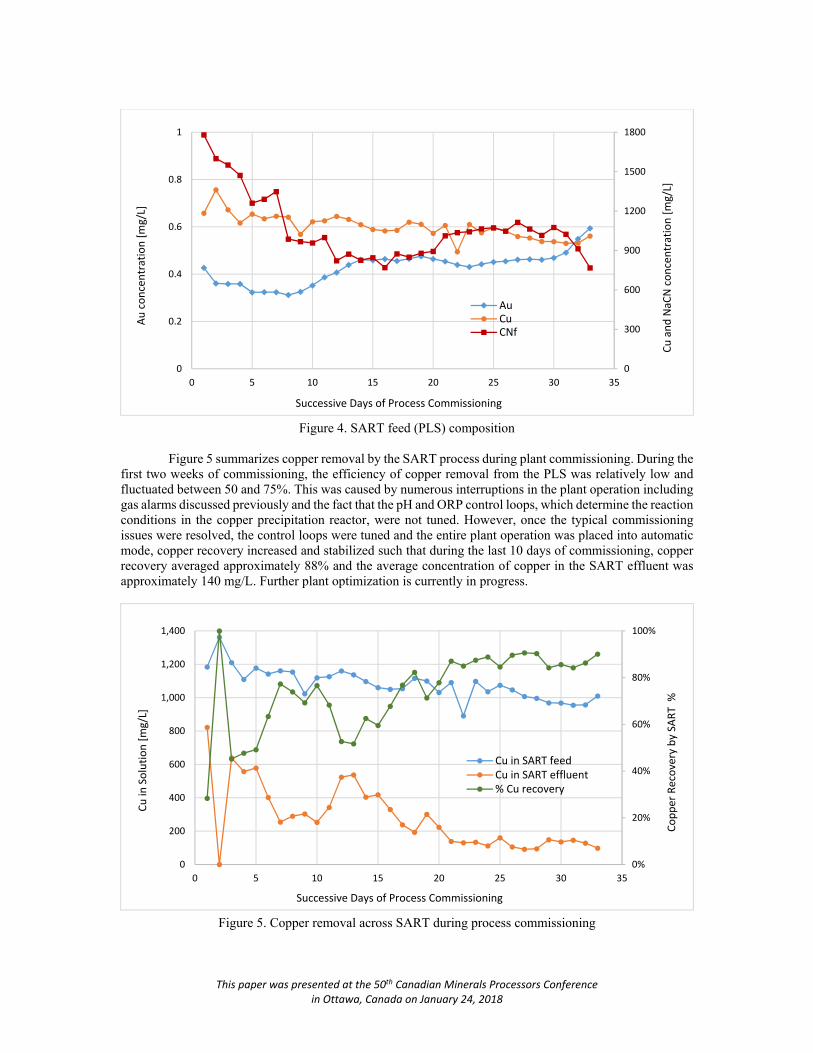
Figure 5 summarizes copper removal by the SART process during plant commissioning. During the
first two weeks of commissioning, the efficiency of copper removal from the PLS was relatively low and fluctuated between 50 and 75%. This was caused by numerous interruptions in the plant operation including gas alarms discussed previously and the fact that the pH and ORP control loops, which determine the reaction conditions in the copper precipitation reactor, were not tuned. However, once the typical commissioning issues were resolved, the control loops were tuned and the entire plant operation was placed into automatic mode, copper recovery increased and stabilized such that during the last 10 days of commissioning, copper recovery averaged approximately 88% and the average concentration of copper in the SART effluent was approximately 140 mg/L. Further plant optimization is currently in progress.
Figure 5. Copper removal across SART during process commissioning
0
300
600
900
1200
1500
1800
0
0.2
0.4
0.6
0.8
1
0 5 10 15 20 25 30 35
Cu a
nd N
aCN
conc
entr
atio
n [m
g/L]
Au co
ncen
trat
ion
[mg/
L]
Successive Days of Process Commissioning
AuCuCNf
0%
20%
40%
60%
80%
100%
0
200
400
600
800
1,000
1,200
1,400
0 5 10 15 20 25 30 35
Copp
er R
ecov
ery
by S
ART
%
Cu in
Sol
utio
n [m
g/L]
Successive Days of Process Commissioning
Cu in SART feedCu in SART effluent% Cu recovery

This paper was presented at the 50th Canadian Minerals Processors Conference in Ottawa, Canada on January 24, 2018
Figure 6 presents the plant operations data related to cyanide recovery during commissioning. Comparing the concentrations of free cyanide in the SART plant feed and effluent, one can see that a significant increase in free cyanide concentration was achieved throughout commissioning. During the last 10 days of commissioning, the increase in free cyanide concentration across the SART plant was approximately 1.5 g/L expressed as NaCN. Moreover, the amount of cyanide recovered balanced well with the quantity of copper removed from the leach solution. This is evident from the cyanide recovery curve shown in Figure 6 where the % recovery is calculated using as the 100% basis the amount of cyanide bound by copper that was removed by the process. It is apparent from this curve that there were several outliers in the free cyanide assays that artificially elevated the cyanide recovery to over 100%. The purpose of leaving the outliers in Figure 6 is to highlight the challenges associated with free cyanide measurements in cyanide leach solutions rich in copper in general, and SART plant effluent in particular. The site laboratory uses the conventional silver nitrate titration method to determine free cyanide. One of the challenges with applying this method to samples of SART effluent is that often residual sulphide is present in the samples which may cause interference. To overcome this, the standard titration procedure was modified to incorporate the addition of lead acetate prior to performing the titrations.
Figure 6. Cyanide recovery across SART during commissioning
Selectivity of copper recovery and gold losses in SART
One of the questions frequently posed by metallurgists discussing SART integration into
metallurgical flowsheets is related to the selectivity of copper recovery in SART and/or the magnitude of expected gold losses from the PLS to the SART copper concentrate solids. Despite the fact that copper removal and cyanide recovery upstream of gold adsorption on activated carbon can bring significant advantages for the carbon adsorption stage, several SART plants were built to treat BLS specifically for the fear of gold losses.
There are two principal sources of gold loss in SART including: 1) co-precipitation of gold with
copper sulphide in the copper precipitation reactor, and 2) gold contained in the pore water/moisture in the concentrate cake. Theoretically, the gold loss by co-precipitation should be minimal due to the fact unlike Cu(CN)3
2-, the Au(CN)2- complex is not a weak acid dissociable cyanide. The other part of gold loss that
occurs by entrainment of PLS in the copper solids is affected by the moisture content in the final dewatered copper solids cake and the concentration of gold in the leach solution entering SART. However, expressed as a percentage, the gold loss by entrainment is purely a function of the cake moisture content.
0%
25%
50%
75%
100%
125%
0
1,000
2,000
3,000
4,000
5,000
0 5 10 15 20 25 30 35
Reco
very
of C
N bo
und
by C
u %
NaCN
in so
lutio
n [m
g/L]
Successive Days of Process Commissioning
Free CN in SART feedFree CN in SART effluent

This paper was presented at the 50th Canadian Minerals Processors Conference in Ottawa, Canada on January 24, 2018
Figure 7 shows changes in the gold concentration in leach solution across SART and the percentage gold loss calculated from the solution assays during the plant commissioning.
Figure 7. Analysis of gold loss by co-precipitation in SART based on solution assays
As presented in the above figure, the SART effluent consistently contained lower concentrations of
gold in comparison to the SART feed. Moreover, the “apparent” % gold loss plotted in Figure 7 and calculated as “Gold loss = (Au in feed – Au in effluent)/Au in feed” seems to indicate that gold loss via co-precipitation could potentially be very significant with excursions as high as 15% to 20%.
Some of the operations personnel attributed the high apparent gold loss to the fluctuations in the
process conditions inside the copper precipitation stage during the early stages of commissioning. However, this does not align with the fundamental chemistry of SART that predicts minimal gold loss by co-precipitation. The water balance around the SART plant helped elucidate this apparent discrepancy.
The concentration of gold in the SART effluent must always be lower than that in the feed due to
the addition of water into the SART process. Water addition occurs via reagents and pump gland water. The analysis of water use in the plant revealed that approximately two-thirds of the total water addition is from the lime slurry and the remaining third from water contained in floc, caustic and NaHS solutions and pumps gland water.
This means that the higher the reagent consumption by SART, the greater the water volume added
per unit volume of leach solution processed by the plant, and the higher the apparent gold loss calculated from the difference in gold concentration between the plant feed and discharge. It follows that a much lower apparent gold loss would be observed in SART plants processing leach solutions with lower levels of copper and free cyanide compared to that shown in Figure 4. Furthermore, the gold loss excursions to 20% observed in Figure 7 are explained by excessive dilution of SART feed during the stoppages and interruptions of plant operation that are normally experienced during commissioning. To keep the slurry lines from plugging, pumps continue to run which result in the lime slurry storage tank and SART reactors receiving seed slurry from the clarifier underflow getting diluted by gland water. Figure 7 shows that when the effect of dilution caused by water addition to SART was taken into account, the resultant “actual” gold loss was mostly negative which means that the gold loss is either zero or too small to calculate using measurements that are subject to errors which further compound during gold loss calculations from solution assays.
-10%
-5%
0%
5%
10%
15%
20%
0.00
0.10
0.20
0.30
0.40
0.50
0.60
0 5 10 15 20 25 30 35
% G
old
loss
by
co-p
recip
itatio
n ba
sed
on
Solu
tion
Assa
ys
Au co
ncen
trat
ion
in le
ach
solu
tion
[mg/
L]
Successive Days of Process Commissioning
Au in SART feedAu in SART effluentApparent Au lossActual Au loss

This paper was presented at the 50th Canadian Minerals Processors Conference in Ottawa, Canada on January 24, 2018
A much more accurate reflection of the true total gold loss in SART can be obtained from assays performed on samples of copper concentrate solids. Figure 8 shows the gold contained in the copper concentrate produced by SART and the concentrate copper grade determined by fire assays. According to the results plotted in Figure 8, the concentrate copper grade fluctuated between 60% and 78% dwb which is to be expected given that the concentrate solids contain Cu2S as the main constituent. The gold content varied during the first two weeks but subsequently stabilized at approximately 1 g/dmt. By way of comparison, this corresponds to the total percentage gold loss across SART, including co-precipitation and entrainment, of approximately 0.2 to 0.4% depending on the tonnage of copper removed.
Figure 8. Gold contained in SART copper concentrate solids
Figure 9. Selectivity of copper removal in SART
0%
20%
40%
60%
80%
100%
0
2
4
6
8
10
12
14
16
18
0 5 10 15 20 25 30 35 40
Cu in
SAR
T Co
pper
Con
cent
rate
Sol
ids [
% d
wb]
Au in
SAR
T Co
pper
Con
cent
rate
Sol
ids
[g/d
mt
dwb]
Successive Days of Process Commissioning
Gold in solidsCopper in solids
0
4
8
12
16
20
24
0
100
200
300
400
500
600
0 5 10 15 20 25 30 35 40
Gold
-to-C
oppe
r Rat
io in
SAR
T Co
pper
Sol
ids
[mg
Au/k
g Cu
]
Gold
-to-C
oppe
r Rat
io in
SAR
T Fe
ed S
olut
ion
[mg
Au/k
g Cu
]
Successive Days of Process Commissioning
SART feedSART copper solids (fire assay)

This paper was presented at the 50th Canadian Minerals Processors Conference in Ottawa, Canada on January 24, 2018
Another way of demonstrating the high selectivity of copper precipitation over gold precipitation in SART is by looking at gold-to-copper ratios in the plant feed solution and the copper concentrate solids, respectively. This is illustrated in Figure 9. As can be seen from this figure, once the plant operation had stabilized, the gold-to-copper ratio in the SART solids was two orders of magnitude lower than that in the plant feed thus confirming high selectivity of copper recovery which enable SART to be applied to PLS.
CONCLUSIONS The cost of a SART plant in Sonora, Mexico that was designed and built to treat 340 m3/hr of leach
solution was CAD $6.1 M in 2007 (CAD $6.8 M in 2017). The cost of plant refurbishment and expansion to the target hydraulic capacity of 525 m3/hr was CAD $1.6 M in 2017. The ratio between the total installed cost and the cost of process equipment was approximately 3.
One of the key safety features of SART plants are HCN monitors. While the installation of
stationary monitors to measure HCN in ambient air around the plant is straightforward, the installation of HCN monitors in process off-gas and scrubber outlets needs to take into account the potential interferences caused by gas flow patterns in ducts and pockets of stationary gas, moisture condensation and sensor element orientation.
The plant operating data collected during the commissioning of the SART plant in Sonora showed
that steady operation along with high copper and cyanide recoveries of 80% to 90% can be achieved relatively quickly, within two to three weeks from start-up, and that the total gold loss in SART treating PLS is small, in the order of 0.2 to 0.4%. Further process optimization is expected to increase the copper and cyanide recovery closer to 95% without any impact on gold loss. The data clearly indicates that SART can be applied to treat PLS without concerns about gold loss to the copper concentrate solids.
Figure 10. SART plant – November 2016
Figure 11. SART plant gypsum clarifier –
November 2016
Figure 12. SART plant – November 2016
Figure 13. SART plant – October 2017

This paper was presented at the 50th Canadian Minerals Processors Conference in Ottawa, Canada on January 24, 2018
REFERENCES Barter, J., Lane, G., Mitchell, D., Kelson, R., Dunne, R., Trang, C., & Dreisinger, D. (2001). Cyanide
Management by SART. In C. Young (Ed.), Cyanide: Social, Industrial and Economic Aspects (pp. 549-562).
Lawrence, R. W., & Lopez, O. (2011). Improving the Economics of Gold‐Copper Ore Projects Using
SART Technology. Proceedings from the World Gold Conference, Montreal, Canada. Ljubetic, K., Lopez, O., Kratochvil, D., & Sanguinetti, D. (2013). Successful Application of SART
Technology for Gold-Copper Ore Deposits. Proceedings from the 5th International Seminar on Process Hydrometallurgy, Santiago, Chile.
Monhemius, A. J., Hedjazi, F., & Saeedi Ali, H. (2017). Flotation and Leaching at Anglo Asian Mining’s
Gedabek Gold and Copper Mine in Azerbaijan. Proceedings from the World Gold Conference, Vancouver, Canada.
Perry, R. H., & Green, D. W. (Eds). (1997). Perry’s Chemical Engineers’ Handbook: Seventh Edition (pp
9-70). McGraw-Hill. Sceresini, B. (2005). Gold-copper ores. In M.D. Adams (Ed), Advances in Gold Ore Processing (pp. 789-
824). Stewart, M & Kappes, K. (2012). SART for copper control in cyanide heap leaching. The Journal of The
Southern African Institute of Mining and Metallurgy, 112, 1037-1043.