2018 european semester: assessment of progress on ... · country report romania 2018 accompanying...
TRANSCRIPT
EN EN
EUROPEAN COMMISSION
Brussels, 7.3.2018
SWD(2018) 221 final
COMMISSION STAFF WORKING DOCUMENT
Country Report Romania 2018
Accompanying the document
COMMUNICATION FROM THE COMMISSION TO THE EUROPEAN
PARLIAMENT, THE COUNCIL, THE EUROPEAN CENTRAL BANK AND THE
EUROGROUP
2018 European Semester: Assessment of progress on structural reforms, prevention and
correction of macroeconomic imbalances, and results of in-depth reviews under
Regulation (EU) No 1176/2011
{COM(2018) 120 final}


Executive summary 1
1. Economic situation and outlook 4
2. Progress with country-specific recommendations 11
3. Reform priorities 15
3.1. Public finances and taxation 15
3.2. Financial sector 20
3.3. Labour market, education and social policies 23
3.4. Investment 32
3.5. Sectoral policies 42
Annex A: Overview table 46
Annex B: Macroeconomic Imbalance Procedure scoreboard 53
Annex C: Standard tables 54
References 60
LIST OF TABLES
Table 1.1: Key economic, financial and social indicators – Romania 10
Table 2.1: Summary table on CSR assessment 13
Table B.1: The Macroeconomic Imbalances Procedure scoreboard for Romania (AMR 2018) 53
Table C.1: Financial market indicators 54
Table C.2: Headline Social Scoreboard indicators 55
Table C.3: Labour market and education indicators 56
Table C.4: Social inclusion and health indicators 57
Table C.5: Product market performance and policy indicators 58
Table C.6: Green growth 59
LIST OF GRAPHS
Graph 1.1: GDP components and output gap 4
Graph 1.2: Contributions to potential growth 4
Graph 1.3: GDP by region 5
CONTENTS

Graph 1.4: Gross fixed capital formation 5
Graph 1.5: Current account breakdown 6
Graph 1.6: Harmonised index of consumer prices (HICP) inflation in constant taxes 6
Graph 1.7: Labour market outcomes 7
Graph 1.8: Population, natural change and net migration 7
Graph 1.9: Breakdown of change in general government balance 9
Graph 1.10: Loans to households and non-financial corporations 9
Graph 1.11: Share of debt in companies facing financial stress 9
Graph 2.1: Overall multiannual implementation of 2011-2017 CSRs to date 11
Graph 3.1.1: Redistributive power of the tax and benefit system in EU Member States, 2016 15
Graph 3.1.2: Romania: VAT Revenues, VAT theoretical tax liability (VTTL) and VAT gap 16
Graph 3.1.3: Public debt projection 2017-2028 19
Graph 3.2.1: Pension funds' real net investment rate of return, Dec 2016 (preliminary) 22
Graph 3.3.1: Nominal compensation per employee and GDP per person employed 23
Graph 3.3.2: People at risk of poverty or social exclusion by degree of urbanisation 27
Graph 3.3.3: Early school leaving rates 29
Graph 3.3.4: Proportion of people with health insurance, registered with a family practitioner 30
Graph 3.4.1: Net international investment position 32
Graph 3.4.2: FDI flows by investment type 32
Graph 3.4.3: Nominal unit labour cost, growth breakdown 33
Graph 3.4.4: Share of export value by quality category, in manufacturing 33
Graph 3.4.5: Export market share by industry 33
Graph 3.4.6: Export market share by country 34
Graph 3.4.7: Changes in regional and global value chain trade 34
Graph 3.4.8: GDP per capita and quality of infrastructure 35
Graph 3.4.9: Ease of doing business 36
Graph 3.4.10: Award of contracts for single bids in 2017 40
Graph 3.5.1: Regional Innovation performance in Romania 42
Graph 3.5.2: Business R&D intensity, 2007 and 2016 42
Graph 3.5.3: Logistics Performance Index 2016 44
LIST OF BOXES
Box 2.1: Tangible results delivered through EU support to structural change in Romania 14
Box 3.1.1: Emergency Ordinance No 79/2017: distributive and macroeconomic impact 17
Box 3.3.1: Monitoring performance in light of the European Pillar of Social Rights 24
Box 3.3.2: Main challenges for the education system as a driver of growth in Romania 31
Box 3.4.1: Investment challenges and reforms in Romania 41
Box 3.5.1: Policy highlights: ICT innovative cluster development and advanced manufacturing in
West Romania 45

1
In the absence of structural reforms and fiscal
consolidation, Romaniaʼs buoyant economic
growth risks setting the stage for a hard
landing. The current economic boom has been
driven mainly by consumption, while investment
has remained subdued. The strong economic
upswing represents an opportunity to rebuild fiscal
buffers and prepare the economy for leaner times.
Inequality and poverty rates remain high despite
the strong economic growth. Some structural
reforms were reversed in 2017 while others stalled.
The progress made in the fight against corruption
was again put at risk. Ensuring continuity of past
reforms would support Romania's transformation
to a higher value added economy and could
improve the economyʼs resilience to an eventual
downturn (1).
The economyʼs cyclical upswing continued in
2017 but is expected to ease off in 2018. Real
GDP growth accelerated in 2017 to a post-crisis
high on the back of booming private consumption,
spurred by wage hikes in both the public and
private sector and indirect tax cuts. Growth is
forecast to decelerate but stay above potential.
Despite export market share gains, the growth of
imports has outpaced that of exports and the
current account deficit is widening. Inflation
turned positive in 2017 and is forecast to
accelerate.
The labour market has been tightening in line
with the strong economic growth. Employment
growth was positive in 2017 (0.7 %) and the
unemployment rate dropped to 4.9 %, its lowest
level in more than 20 years. The low
unemployment rate, coupled with a declining
labour force and persistent skills shortages, has led
to very tight labour market conditions. The
compensation of employees is low relative to the
EU average but the strong wage growth of 2017,
also driven by a 16 % minimum wage hike and
public sector wage increases, risks putting pressure
on competitiveness and inflation, if not
(1) This report assesses Romania’s economy in the light of the
European Commission’s Annual Growth Survey published
on 22 November 2017. In the survey, the Commission calls
on EU Member States to implement reforms to make the
European economy more productive, resilient and
inclusive. In so doing, Member States should focus their
efforts on the three elements of the virtuous triangle of
economic policy — boosting investment, pursuing
structural reforms and ensuring responsible fiscal policies.
accompanied by corresponding productivity
increases.
Due to tax cuts and increases in public wages
and pensions, the public deficit is on an
increasing path. Indirect taxes were cut in 2017
while the personal income tax rate was cut from
January 2018. On the expenditure side, public
wages and old-age pensions were significantly
increased in 2017 and are set to advance further in
2018. As a consequence, the nominal and
structural budget deficits are on an increasing path,
causing Romania to diverge from the targets in its
national fiscal framework. In 2017 the Council
launched a significant deviation procedure
addressed to Romania.
The financial sector has further strengthened,
whereas some segments need monitoring. The
banking sector remains well-capitalised and its
overall health, including asset quality, has
continued to improve. However, recurrent
legislative initiatives warrant close monitoring.
The insurance sector is strengthening, as the
measures to address the financial situation of
weaker companies have started to bear fruit. The
recent reduction in the contributions to the pre-
funded second pillar pension funds, which have
displayed strong performance since they were set
up, eased short term fiscal concerns but could have
negative implications for the development of
capital markets.
Romania has made limited progress on
addressing the 2017 country-specific
recommendations. No progress was made on
ensuring that the national fiscal framework is
implemented and there was limited progress in
strengthening tax compliance and collection. By
contrast, there was some progress on fighting
undeclared work while limited progress was made
on strengthening targeted labour activation
measures. No progress was made on how the
minimum wage is set and on equalising the
pensionable age for men and women. Limited
progress was made on improving access to quality
mainstream education. In the healthcare system,
limited progress was made on shifting to outpatient
care and some progress was achieved on curbing
informal payments. There was limited progress on
adopting legislation to ensure a professional and
independent civil service and on prioritising public
investment. Finally, some progress was made on
EXECUTIVE SUMMARY

Executive summary
2
implementing the national public procurement
strategy, but sustainability of measures and
irreversibility of reforms should be further
monitored.
Regarding progress in reaching the national targets
under the Europe 2020 strategy, Romania is
performing well in the areas of employment rates,
national greenhouse gas emission, renewable
energy, energy efficiency and tertiary education.
The national target for reducing the number of
people at risk of poverty or social exclusion has
already been reached. However, research and
development intensity and early school leaving
remain some distance away from their respective
targets.
Romania faces challenges with regard to a
number of indicators of the Social Scoreboard
supporting the European Pillar of Social Rights.
The high economic growth has translated into
improved employment outcomes and resulted in a
strong increase of household disposable incomes.
However, Romania has a high number of early
school leavers, and young people not in education,
employment or training. Romania has not yet
achieved a mature social dialogue, and on social
protection and inclusion, challenges remain.
Key structural issues analysed in this report, which
point to particular challenges for Romania's
economy, are the following:
Labour and skills supply are not keeping up
with the fast-changing needs of the economy.
Romaniaʼs unfavourable demographic trends
are expected to continue. Population aging,
limited internal labour mobility and continued
emigration represent a significant drag on
potential economic growth. Despite recent
improvements, labour force participation rates
remain well below EU averages. This concerns
particularly women, older people, Roma,
young people, and people in rural areas. Active
labour market policies are insufficient in scope
and design. Skills shortages and mismatches
have an adverse impact on competitiveness and
convergence. Undeclared work continues to
distort the labour market. Minimum wage
increases are decided in a discretionary manner
while social partnersʼ involvement in policy-
making is very limited, with no substantive
process of involvement and cooperation.
Collective bargaining rates are low.
Poverty increased and income inequality
remains high. Inequality of opportunity
remains a challenge, especially for rural areas.
Income inequality is high, while the
redistributive effect of the tax and benefit
system is below the EU average. The limited
integration of employment, education and
social services prevents disadvantaged groups
from escaping poverty. The provision of
services is limited, especially in disadvantaged
areas. Child poverty is high and rising. The
entry into force of the Law on minimum
inclusion income that would increase the
adequacy and coverage of social benefits was
postponed again to 2019. Legislation
equalising pension ages for men and women
has not been adopted. The adopted shift of
social security contributions places the burden
of financing social protection almost entirely
on employees. Access to social protection for
all is not ensured.
No tangible results were achieved on public
administration reforms, and the business
environment shows weaknesses. Draft
legislation on human resource management is
currently aligned with the strategy for civil
servants but implementation has not started and
results are expected only in 2019. The public
consultation process, strategic and budgetary
planning as well as the use of regulatory impact
assessments remains weak, limiting evidence-
based policy making. Cumbersome
administrative procedures for businesses, slow
progress in the provision of e-government
solutions, complex insolvency procedures and
frequent regulatory changes with limited use of
impact assessment and consultation procedures
weigh on the business environment.
The weak performance of the education
system limits growth prospects in the long
run. Low attainment levels in basic skills and
digital skills, persistently high early school
leaving, poor Roma inclusion and rural-urban
disparities in education result in lost human
capital and growth potential. Quality assurance
and initial teacher education programmes face
challenges. Vocational education and training
Executive summary
3
remains a second choice option and in most
cases is not adapted to labour market needs.
Access to adult learning is limited, in particular
for the low-skilled.
The health status of the population has
improved, but remains below EU standards.
Access to healthcare remains a key challenge,
also in relation to equality of opportunities,
with negative repercussions on child
development, workforce employability and
healthy ageing. Low funding and inefficient
use of public resources limit the health
systemʼs effectiveness, against the background
of a sizeable shortage of doctors and nurses.
Health infrastructure and the prevalence of
informal payments remain sources of concern.
Performance in the area of research and
innovation remains modest. Despite a solid
IT infrastructure and the rapid development of
the ICT sector, Romania continues to score low
on all European Innovation Scoreboard
indicators and there are no signs of improving
performance. The degree of digitisation of both
the public and private sector remain very low.
Despite increasing public funding and a
dynamic start-up ecosystem, technology
adoption, internationalisation and scaling-up of
companies remain significant challenges. The
weak innovation performance could have a
negative impact on growth prospects.
High public spending is not reflected in the
countryʼs infrastructure. Despite relatively
high public investment rates, the supply of
infrastructure is limited, with the perceived
quality of infrastructure being one of the lowest
in the EU. The general condition and reliability
of road and rail infrastructure remain poor and
the reform of the transport sector progresses
very slowly. Water, waste and energy
infrastructure remain deficient. State-owned
enterprises’ efficiency is not improving and the
corporate governance framework is being
weakened. Public investment is characterised
by low efficiency particularly in project
preparation and prioritisation and public
procurement. Businesses see investment in
infrastructure as a major priority for public
spending.
The irreversibility of the progress in the
fight against corruption was recently put at
risk. The continued good results of the judicial
institutions in the fight against corruption were
largely brought into question by events
throughout the past year. The ongoing reforms
of the justice laws risk harming judicial
independence and undoing progress achieved
over the past 10 years. Moreover, judicial
institutions and the legal framework for
fighting corruption crimes continue to be under
intense pressure.

4
GDP and potential growth
Growth accelerated further in 2017, fuelled by
domestic demand. Real GDP is estimated to have
increased by 6.7 % in 2017, following the 4.8 %
advance in 2016, marking a new post-crisis peak.
Real GDP growth is forecast to ease off but remain
above potential growth, at 4.5 % in 2018 and
4.0 % in 2019. Private consumption was the main
contributor to growth in 2017, supported by
indirect tax cuts and wage hikes both in the public
and the private sectors. Private consumption is
forecast to slow down in 2018, as inflation
increasingly weighs on real disposable income, but
is expected to remain the main growth driver. The
output gap, which is estimated to have turned
positive in 2017, is projected to increase further as
actual GDP growth continues to outpace potential
growth.
Graph 1.1: GDP components and output gap
Source: European Commission
This strong upswing will not be sustainable in
the absence of reforms to increase the
economy’s potential. Private consumption has
accounted for most of the strong growth over the
past few years, supported by a pro-cyclical fiscal
policy (2) (Graph 1.1). In contrast, the contribution
of investment to GDP growth has mostly been
modest in recent years. In the longer run,
insufficient progress on implementing structural
reforms supporting investment and the
(2) Loosening fiscal policy when the economy is doing well
and tightening it when the economy is doing badly
transformation to a higher value added economy
will constrain economic growth (see Section 3).
Potential growth has improved somewhat
driven mainly by total factor productivity.
Potential growth is estimated to have been around
3.7 % in 2017, compared to an average of 4.6 %
over 2000-2008 (Graph 1.2). Growth in total factor
productivity (3) has been the main driver of
potential growth since 2012 and is expected to
remain so in the coming years. The contribution of
capital accumulation continued to be positive, but
smaller compared to pre-crisis times. The
contribution of labour was close to zero in 2016
and is estimated to have remained so in 2017 as the
effects of a shrinking working-age population and
a falling unemployment rate cancelled each other
out. Demographics will continue to weigh on
growth, calling for sustained improvements to
labour productivity (both through total factor
productivity growth and more efficient investment)
and to labour force participation so as to allow
further convergence towards EU average income
levels (see Sections 3.3-3.5).
Graph 1.2: Contributions to potential growth
Source: European Commission
Per capita GDP is converging towards EU
averages but regional disparities persist. GDP
per capita in Romania increased from slightly
more than 40 % of the EU average at the time of
accession in 2007 to almost 60 % in 2016.
Nevertheless, Romania remains one of the EU
countries with the lowest GDP per capita.
(3) Change in output that cannot be accounted for by the
change in either labour or capital inputs.
-25
-20
-15
-10
-5
0
5
10
15
09 10 11 12 13 14 15 16 17 18 19
pps o
f G
DP
HH cons. Gov. cons GFCF
Net exports Inventories GDP
forecast
-2
-1
0
1
2
3
4
5
6
7
8
9
05 06 07 08 09 10 11 12 13 14 15 16 17 18 19
pps o
f pote
ntial G
DP
forecast
Capital Contribution TFP Contribution
Labour Contribution Potential Growth
1. ECONOMIC SITUATION AND OUTLOOK

1. Economic situation and outlook
5
Although all regions have made progress on GDP
convergence, the capital region advanced at a
markedly faster pace with GDP per capita reaching
almost 140 % of the EU average in 2015, further
widening the already large gap with the rest of the
country (Graph 1.3).
Graph 1.3: GDP by region
(1)GDP in purchasing power standard (PPS) per inhabitant
as a percentage of the EU average
Source: European Commission
Investment
Romania has one of the highest investment
ratios in the EU but the quality of investment is
not improving. Total investment reached 22.7 %
of GDP in 2016, above the average for the EU
(19.8 %) and for the new Member States (19.9 %)
(Graph 1.4), consistent with the catching-up
process of the Romanian economy. However, the
quality of public investment remains constrained
by management deficiencies, frequently changing
priorities and difficulties in absorbing EU funds
while private investment is hampered by continued
legal uncertainty and red tape (see Section 3.4).
After a contraction in 2016, investment growth
started to recover in 2017. Overall, investment
increased by 3.4 % in the first nine months of
2017, following a reduction by 3.5 % in 2016.
However, public investment fell sharply in 2017
for the second consecutive year as the uptake of
projects financed by EU funds under the 2014-
2020 programming period lagged behind. Public
investment is estimated to have dropped to 3 % of
GDP in 2017, more than 2 percentage points (pps)
below the average of the last 10 years. Private
investment, driven mainly by housing construction
and equipment investment, recovered somewhat
but could only partially compensate for the drop in
public investment.
Graph 1.4: Gross fixed capital formation
Source: European Commission
Investment is expected to strengthen but
uncertainties persist. Public investment is
projected to start recovering on the back of a pick-
up in the implementation of projects financed by
EU funds and amount to 3.5% of GDP in 2018.
The 2018 budget provides for a 7.3% increase in
domestically-funded capital expenditure compared
to 2017 budget execution. However, in the past the
initial investment budget has often been
substantially under-executed, pointing to similar
risks for the future. The tightening of monetary
policy in response to mounting inflationary
pressures could weigh on private investment.
External position
The current account deficit has widened since
2014. The reduction of macroeconomic imbalances
under the balance-of-payments programmes
contributed to a significant improvement of the
current account deficit from the trough of 12.7 %
of GDP in 2007 to a balanced position in 2014
(European Commission, 2015a). The adjustment
was driven by improvements in the trade balance,
especially in services (Graph 1.5). However, on the
back of robust consumption-led import growth, the
current account balance turned around and
deteriorated to -0.6 % of GDP in 2015, - 2.3 % in
2016 and - 3.1 % in 2017. As of 2016, the current
account deficit was more than 1 pp. higher than
0 50 100 150
Romania
Nord-Vest
Centru
Nord-Est
Sud-Est
Sud - Muntenia
Bucuresti - Ilfov
Sud-Vest Oltenia
Vest
2015 2007
0
5
10
15
20
25
30
35
40
06 07 08 09 10 11 12 13 14 15 16 17 18 19
% o
f G
DP
Romania gov Romania private
EU28 excl RO gov EU28 excl RO total
EU13-RO gov EU13-RO total
forecast

1. Economic situation and outlook
6
expected from the fundamentals. Import growth is
projected to continue outpacing that of exports,
leading to a further widening of the current
account deficit to 3.2 % in 2018 and 3.4 % in
2019. Despite the persistent current account
deficit, Romania’s negative international
investment position has improved as a share of
GDP on the back of the strong economic growth
(see Section 3.4).
Graph 1.5: Current account breakdown
Source: European Commission
Inflation and monetary policy
After 2 years of falling consumer prices,
inflation is picking up. Inflation has been
markedly influenced by the successive reductions
of the VAT rates for different categories of
products and dampened by persistently low global
oil prices. After reaching a -3 % low in May 2016,
the average harmonised index of consumer prices
(HICP) inflation progressively increased but
remained subdued due to a further 1 pp. VAT cut
in January 2017 and a reduction in excise duties on
fuel. Inflation started to accelerate in the second
half of 2017, re-entering the National Bank of
Romania’s (NBR) target band of 2.5 % ±1 %
(Graph 1.6). Headline inflation is projected to
further pick up in 2018 as demand pressures mount
and the effect of disinflationary tax cuts fades
away – or, in the case of excise duties, the cuts
themselves are reversed.
The NBR has started to reverse its very
accommodative monetary policy stance. In
January 2018 the NBR increased its key monetary
policy rate, which had been unchanged since May
2015, from 1.75 % to 2 %. Market participants
expect further hikes in 2018 given the mounting
inflationary pressures. In November 2017, the
symmetrical corridor formed by the interest rates
on permanent credit and deposit facilities was
narrowed to ±1 pp. around the monetary policy
rate. So far the corridor has been narrowed by 150
bps since November 2014. The aim is to mitigate
interbank money market rate volatility and further
strengthen the transmission of the policy rate
signal.
Graph 1.6: Harmonised index of consumer prices (HICP)
inflation in constant taxes
(1) HICP in constant taxes assumes a full pass-through of
VAT changes to consumer prices.
(2) Inflation targets are formulated in terms of the annual
change in the consumer price index and are set as
midpoints within a target band of +/-1 percentage points.
Source: European Commission, National Bank of Romania
Labour market
Labour market conditions further improved
owing to strong economic growth.
Unemployment declined further and is estimated to
have reached 4.9 % in Q3-2017, the lowest level in
more than 20 years. Employment growth was
robust and the employment rate increased to 69 %
in Q3-2017, within reach of the national Europe
2020 target of 70 %. The activity rate has also
been increasing steadily since mid-2016 but
remains one of the lowest in the EU.
-25
-20
-15
-10
-5
0
5
10
15
99 00 01 02 03 04 05 06 07 08 09 10 11 12 13 14 15 16
% o
f G
DP
Capital account (KA) Secondary income balance
Primary income balance Trade balance - services
Trade balance - goods Trade balance
Current account balance (CA) Net lending/borrowing (CA+KA)-4
-2
0
2
4
6
Dec 11 Dec 12 Dec 13 Dec 14 Dec 15 Dec 16 Dec 17
%
NBR inflation target band NBR inflation target midpoints
HICP in constant taxes HICP
1. Economic situation and outlook
7
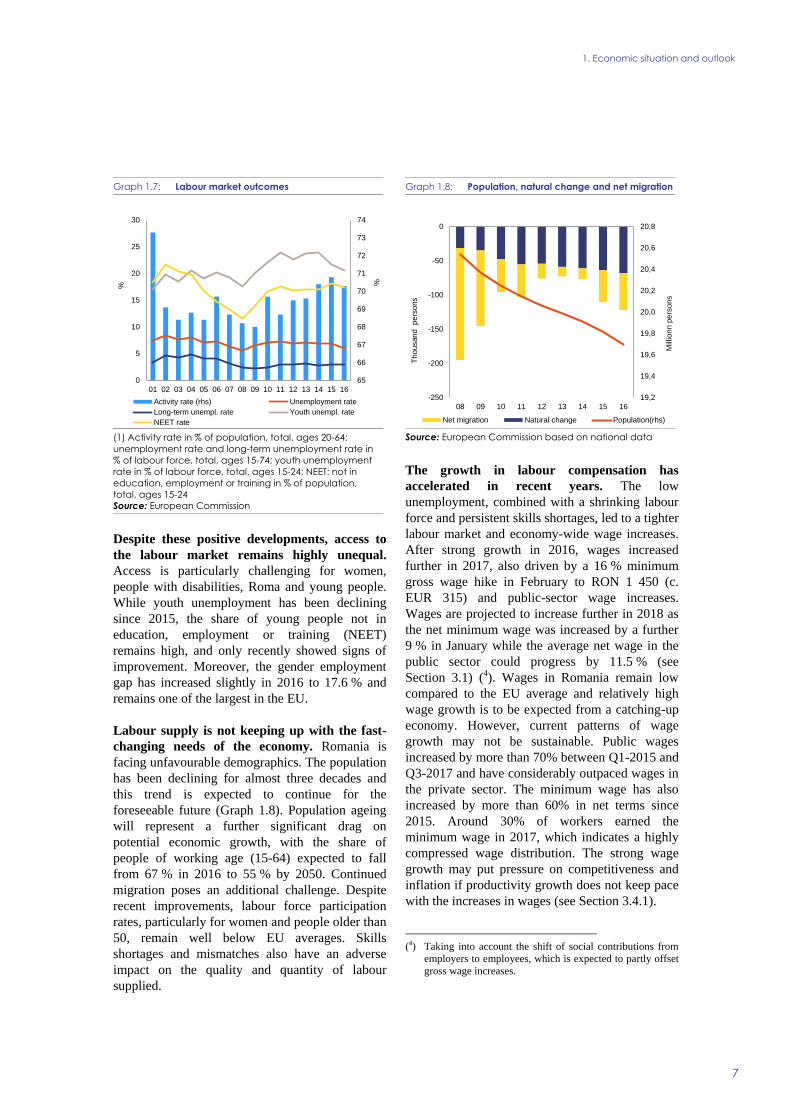
Graph 1.7: Labour market outcomes
(1) Activity rate in % of population, total, ages 20-64;
unemployment rate and long-term unemployment rate in
% of labour force, total, ages 15-74; youth unemployment
rate in % of labour force, total, ages 15-24; NEET: not in
education, employment or training in % of population,
total, ages 15-24
Source: European Commission
Despite these positive developments, access to
the labour market remains highly unequal.
Access is particularly challenging for women,
people with disabilities, Roma and young people.
While youth unemployment has been declining
since 2015, the share of young people not in
education, employment or training (NEET)
remains high, and only recently showed signs of
improvement. Moreover, the gender employment
gap has increased slightly in 2016 to 17.6 % and
remains one of the largest in the EU.
Labour supply is not keeping up with the fast-
changing needs of the economy. Romania is
facing unfavourable demographics. The population
has been declining for almost three decades and
this trend is expected to continue for the
foreseeable future (Graph 1.8). Population ageing
will represent a further significant drag on
potential economic growth, with the share of
people of working age (15-64) expected to fall
from 67 % in 2016 to 55 % by 2050. Continued
migration poses an additional challenge. Despite
recent improvements, labour force participation
rates, particularly for women and people older than
50, remain well below EU averages. Skills
shortages and mismatches also have an adverse
impact on the quality and quantity of labour
supplied.
Graph 1.8: Population, natural change and net migration
Source: European Commission based on national data
The growth in labour compensation has
accelerated in recent years. The low
unemployment, combined with a shrinking labour
force and persistent skills shortages, led to a tighter
labour market and economy-wide wage increases.
After strong growth in 2016, wages increased
further in 2017, also driven by a 16 % minimum
gross wage hike in February to RON 1 450 (c.
EUR 315) and public-sector wage increases.
Wages are projected to increase further in 2018 as
the net minimum wage was increased by a further
9 % in January while the average net wage in the
public sector could progress by 11.5 % (see
Section 3.1) (4). Wages in Romania remain low
compared to the EU average and relatively high
wage growth is to be expected from a catching-up
economy. However, current patterns of wage
growth may not be sustainable. Public wages
increased by more than 70% between Q1-2015 and
Q3-2017 and have considerably outpaced wages in
the private sector. The minimum wage has also
increased by more than 60% in net terms since
2015. Around 30% of workers earned the
minimum wage in 2017, which indicates a highly
compressed wage distribution. The strong wage
growth may put pressure on competitiveness and
inflation if productivity growth does not keep pace
with the increases in wages (see Section 3.4.1).
(4) Taking into account the shift of social contributions from
employers to employees, which is expected to partly offset
gross wage increases.
65
66
67
68
69
70
71
72
73
74
0
5
10
15
20
25
30
01 02 03 04 05 06 07 08 09 10 11 12 13 14 15 16
%%
Activity rate (rhs) Unemployment rate
Long-term unempl. rate Youth unempl. rate
NEET rate
19,2
19,4
19,6
19,8
20,0
20,2
20,4
20,6
20,8
-250
-200
-150
-100
-50
0
08 09 10 11 12 13 14 15 16
Mill
ionn p
ers
ons
Th
ousand pers
ons
Net migration Natural change Population(rhs)

1. Economic situation and outlook
8
Social developments
Poverty remains high. In 2016 the risks of
poverty and social exclusion increased, affecting
38.8 % of the population and reversing a
decreasing trend of several years. The trend does
not appear to improve, driven by increases in
equivalised disposable income for all households
except for the poorest 10 % (5). The divide
between the rich and the poor and between rural
and urban areas remains high. High poverty risks
are mostly associated with high inactivity levels.
High economic growth is accompanied by high
inequality. The income of the top 20 % of the
population exceeds by seven the income of the
bottom 20 % compared to a ratio of five for the
EU-28 (see Section 3.3). Meanwhile, inequality at
the lower end of the income distribution appears
more pronounced, with the bottom 10 % of the
population earning 14 times less than the bottom
50 %, one of the highest ratio in the EU.
Inequality remains high along many
dimensions. Income inequality remains one of the
highest in the EU despite the recent decline, while
the tax and benefit system has a limited effect on
reducing market income inequality (i.e. before
taxes and transfers including pensions) (see
Section 3.1.1). Opportunities are also unequal,
with educational outcomes and risk of poverty for
children highly correlated with parents’ education
levels (see Section 3.3). The gap in unmet
healthcare needs between the richest and the
poorest households (6.5 %) is one of the widest in
Europe. These in turn affect labour market
outcomes (see Section 3.3).
Public finances
The public deficit has been widening due to
pro-cyclical fiscal policy. Indirect taxes (in
particular the standard VAT rate) were cut in 2017,
while the personal income tax rate was cut from
January 2018. On the expenditure side, public
wages and old-age pensions significantly increased
in 2017 and will continue to do so in 2018. As a
consequence, the structural deficit (6) is projected
to have widened from 2.2 % of GDP in 2016 to
(5) Based on Eurostat experimental flash estimates for income
reference year 2016, which can be used in preliminary
analysis until the final EU-SILC data becomes available.
(6) Defined as the deficit corrected for the business cycle
3.3 % in 2017 and to reach 4.3 % in 2018.
Meanwhile, the headline deficit is projected by the
Commission to have remained at 3.0 % of GDP in
2017 and increase to 3.9 % in 2018 assuming no-
policy change (see Section 3.1.1).
The tax cuts and expenditure increases are
being financed with public debt. Because of the
widening of the public deficit, the general
government debt is projected to increase from
37.6 % of GDP in 2016 to 40.5 % of GDP in 2019.
Assuming no policy change, public debt is
projected to increase to above 60 % of GDP in
2027 (see Section 3.1.4).
Financial sector
Credit growth picked up in 2017. After several
years of decline, credit to non-financial
corporations started to increase in the second half
of 2017 (Graph 1.10). Meanwhile, the growth of
credit to households remained stable as a
slowdown in the growth of mortgages was
compensated by a pick-up in consumption credit.
The stock of foreign currency loans continued to
fall for both household and corporations, with the
domestic currency increasing its share of the total
loan stock to 61.8 % in November 2017 (up from a
low of 35.6 % in May 2012).
House prices are increasing fast, but from a still
low level. House prices corrected strongly between
2008 and 2012, falling by more than half in real
terms. The correction reversed in 2015 and prices
picked up in 2016, increasing by 6.5 % in real
terms. The strong momentum continued in the first
quarters of 2017, supported particularly by
increasing household disposable income and rapid
economic growth. Despite a strong increase in
2015 (+15.5 %) and 2016 (+12.0 %) which
provided further support to house price growth,
mortgages in Romania continue to account for a
relatively small share of GDP (7.6 % versus
37.5 % in the euro area in 2016). In spite of the
recent increase, valuation metrics suggest that
house prices remain undervalued (7) so the
increase in house prices could continue.
(7) Methodology in Philiponnet and Turrini (2017)

1. Economic situation and outlook
9
Graph 1.9: Breakdown of change in general government
balance
Source: European Commission
The banking sector continues to be profitable,
well capitalised and liquid. Capital adequacy at
system level has been stable since end-2015 and
stood at 19 % at the end of September 2017.
Liquidity remained at comfortable levels, with the
loan-to-deposit ratio around 80 % at end-
September 2017. The share of non-performing
loans (NPLs) has fallen significantly (see Section
3.2). Despite compressed interest margins, banking
profitability has remained in positive territory
since 2015.
Non-performing loans continue to fall but the
share of companies facing financial distress
remains high. In 2016, more than 40 % of
companies in selected sectors had an interest
coverage ratio lower than 1, suggesting a limited
ability to meet interest payments (Graph 1.11). The
large share of financially stressed companies can
act as a drag on economic growth. Besides being
significantly less productive, financially
constrained companies also tend to reduce
employment and invest less than non-financially
stressed companies. State-owned enterprises
accounted for a substantial share of financially
distressed companies (see Section 3.4).
Graph 1.10: Loans to households and non-financial
corporations
Source: National Bank of Romania
Graph 1.11: Share of debt in companies facing financial
stress
(1) Zombies are defined as companies that are less than
10-years old and for which the interest coverage ratio has
been below one for more than 3 years in a row (only
available from 2015 onwards).
The analysis does not include firms in agriculture, mining,
finance and insurance, public administration, the arts and
households as employers.
Source: Orbis and European Commission calculations
-3
-2
-1
0
1
2
14 15 16 17 18 19
% o
f G
DP
forecast
Other factors Discretionary reven. measures
Cyclical component Interest payments
Overall gov. balance
-15
-10
-5
0
5
10
15
20
25
Dec-11 Dec-12 Dec-13 Dec-14 Dec-15 Dec-16 Dec-17
y-o
-y %
change
Loans to households (HH), total
Loans to households (HH), housing
Loans to households (HH), consumer and other loans
Loans to non-financial corporations
0%
10%
20%
30%
40%
50%
60%
70%
80%
90%
100%
13 14 15 16
Zombies ICR<1 ICR>1

1. Economic situation and outlook
10
Table 1.1: Key economic, financial and social indicators – Romania
(1) NIIP excluding direct investment and portfolio equity shares
(2) Domestic banking groups and stand-alone banks, EU and non-EU foreign-controlled subsidiaries and EU and non-EU
foreign-controlled branches.
Source: Eurostat and ECB as of 30 Jan 2018, where available; European Commission for forecast figures (Winter forecast 2018
for real GDP and HICP, Autumn forecast 2017 otherwise)
2004-07 2008-12 2013-14 2015 2016 2017 2018 2019
Real GDP (y-o-y) 6.8 0.4 3.3 4.0 4.8 6.7 4.5 4.0
Potential growth (y-o-y) 5.8 2.5 1.9 3.2 3.6 3.7 4.0 4.0
Private consumption (y-o-y) 13.2 -0.4 2.7 5.9 7.6 . . .
Public consumption (y-o-y) -2.4 1.1 -2.0 0.2 3.1 . . .
Gross fixed capital formation (y-o-y) 23.2 -3.6 -1.2 7.4 -2.0 . . .
Exports of goods and services (y-o-y) 9.9 4.0 13.7 4.6 8.7 . . .
Imports of goods and services (y-o-y) 22.3 -0.5 8.8 8.0 9.8 . . .
Contribution to GDP growth:
Domestic demand (y-o-y) 14.4 -1.4 1.0 5.5 4.6 . . .
Inventories (y-o-y) -1.4 0.0 0.6 -0.1 0.7 . . .
Net exports (y-o-y) -6.4 1.3 1.6 -1.4 -0.5 . . .
Contribution to potential GDP growth:
Total Labour (hours) (y-o-y) -0.4 -1.0 -1.2 -0.7 -0.2 -0.2 0.0 0.0
Capital accumulation (y-o-y) 2.2 2.3 1.0 1.1 0.8 0.7 0.9 1.0
Total factor productivity (y-o-y) 4.0 1.2 2.0 2.8 3.0 3.1 3.0 3.0
Output gap 5.5 -1.5 -3.2 -2.1 -1.2 0.7 1.1 1.2
Unemployment rate 7.2 6.6 7.0 6.8 5.9 5.3 5.1 5.0
GDP deflator (y-o-y) 13.4 6.3 2.5 2.6 2.1 2.0 3.2 3.3
Harmonised index of consumer prices (HICP, y-o-y) 8.1 5.7 2.3 -0.4 -1.1 1.1 4.1 3.0
Nominal compensation per employee (y-o-y) 15.8 8.0 5.3 1.9 9.8 13.2 10.9 7.8
Labour productivity (real, person employed, y-o-y) 7.4 2.1 3.3 5.3 5.8 . . .
Unit labour costs (ULC, whole economy, y-o-y) 7.8 5.8 1.8 -3.3 3.8 7.9 6.6 3.7
Real unit labour costs (y-o-y) -4.9 -0.5 -0.7 -5.7 1.7 5.8 3.2 0.4
Real effective exchange rate (ULC, y-o-y) 9.6 -2.5 2.2 -6.0 1.8 6.1 4.1 1.7
Real effective exchange rate (HICP, y-o-y) 8.5 -2.9 2.6 -2.4 -1.2 -2.0 0.7 .
Savings rate of households (net saving as percentage of net
disposable income) -22.3 -16.9 7.5 . . . . .
Private credit flow, consolidated (% of GDP) 13.9 3.0 -1.9 0.2 0.6 . . .
Private sector debt, consolidated (% of GDP) 43.2 70.7 64.3 59.1 55.8 . . .
of which household debt, consolidated (% of GDP) 11.9 21.4 18.6 17.5 16.8 . . .
of which non-financial corporate debt, consolidated (% of GDP) 31.4 49.3 45.7 41.7 39.0 . . .
Gross non-performing debt (% of total debt instruments and total
loans and advances) (2) . . 16.9 10.7 7.7 . . .
Corporations, net lending (+) or net borrowing (-) (% of GDP) -2.8 6.3 -2.6 -5.6 -5.0 -5.6 -4.9 -5.4
Corporations, gross operating surplus (% of GDP) 25.8 28.3 31.6 31.7 32.0 30.0 29.2 28.0
Households, net lending (+) or net borrowing (-) (% of GDP) -4.7 -5.6 6.2 8.2 6.7 7.2 7.3 7.9
Deflated house price index (y-o-y) . . -3.0 1.9 6.5 . . .
Residential investment (% of GDP) 2.0 2.9 2.4 2.4 2.6 . . .
Current account balance (% of GDP), balance of payments -10.2 -6.2 -0.9 -1.2 -2.1 -2.8 -2.8 -2.6
Trade balance (% of GDP), balance of payments -11.3 -7.4 -0.6 -0.6 -0.9 . . .
Terms of trade of goods and services (y-o-y) 5.7 1.1 1.3 2.8 0.4 -1.5 -0.5 0.5
Capital account balance (% of GDP) 0.5 0.6 2.4 2.4 2.5 . . .
Net international investment position (% of GDP) . -61.7 -60.0 -54.6 -49.9 . . .
Net marketable external debt (% of GDP) (1) . -22.2 -18.2 -13.0 -7.4 . . .
Gross marketable external debt (% of GDP) (1) . 57.7 53.4 45.2 40.2 . . .
Export performance vs. advanced countries (% change over 5 years) 84.0 70.5 25.7 22.7 20.1 . . .
Export market share, goods and services (y-o-y) 13.9 2.4 10.7 -0.2 8.5 . . .
Net FDI flows (% of GDP) -7.1 -2.8 -1.9 . -2.7 . . .
General government balance (% of GDP) -1.7 -6.1 -1.7 -0.8 -3.0 -3.0 -3.9 -4.1
Structural budget balance (% of GDP) . . -0.7 -0.3 -2.2 -3.3 -4.3 -4.6
General government gross debt (% of GDP) 14.8 27.4 38.6 37.9 37.6 37.9 39.0 40.4
Tax-to-GDP ratio (%) 28.4 27.3 27.4 28.0 26.0 25.6 26.0 26.2
Tax rate for a single person earning the average wage (%) 27.2 28.5 25.8 25.3 . . . .
Tax rate for a single person earning 50% of the average wage (%) 22.7 25.5 23.0 22.9 . . . .
forecast

11
Progress with the implementation of the
recommendations addressed to Romania in
2017 (8) has to be seen in a longer-term
perspective since the introduction of the
European Semester in 2011. Looking at the
multi-annual assessment of the implementation of
the CSRs since these were first adopted, 68 % of
all the CSRs addressed to Romania have recorded
at least 'some progress'. 32 % of these CSRs
recorded 'limited' or 'no progress' (see Graph 2.1).
Overall, Romania has advanced in implementing
country specific recommendations (CSRs) since
2013, and some reforms have been pursued even
during the economically challenging times. The
decisiveness and speed of implementation have
however been uneven, largely dependent on
political developments. While there was an
acceleration of reform in 2016, the recent follow-
up on reform priorities in key sectors has been less
strong. In several policy areas subject to CSRs
measures have been slowed down or even reversed
and significant efforts are still needed to achieve
tangible results of reform implementation.
Graph 2.1: Overall multiannual implementation of 2011-
2017 CSRs to date
(1) The overall assessment of the country-specific
recommendations related to fiscal policy exclude
compliance with the Stability and Growth Pact.
(2) 2011-2012: Different CSR assessment categories.
(3) The multiannual CSR assessment looks at the
implementation since the CSRs were first adopted until the
February 2018 country report.
Source: European Commission
(8) For the assessment of other reforms implemented in the
past, see in particular section 3.1, 3.3, 3.4 and 3.5.
On fiscal adjustment past progress has been
gradually undone. Since 2009, Romania pursued
a significant fiscal consolidation which led to
achieving its medium-term objective in 2014 and
2015. However, the authorities have been pursuing
an expansionary fiscal policy since 2016 that led to
a substantial departure from that objective.
Progress on labour market and social assistance
reforms moderated in 2017. Some progress was
achieved on improving active labour market
policies and the public employment service reform
especially in 2016, but slowed down since then.
The reform of the National Employment Agency is
still to be implemented and sustained over the long
term through a strong political commitment. No
progress was made in 2017 on applying objective
criteria for the minimum wage setting and on
equalising pensionable age for men and women,
following the advances seen in 2016. Progress has
been uneven on social assistance reform. The
implementation of the Minimum Inclusion Income
Law, adopted in 2016, stalled in 2017 and is now
postponed for 2019. The pilot project aiming to
introduce integrated teams in a number of most
deprived communities is delayed. The link with
activation measures needs further strengthening.
The poverty reduction power of social transfers is
still among the lowest in the EU and there is no
objective mechanism to update social benefits.
Access to quality and inclusive education is
faced with continuous challenges. Over the last
years, the Romanian authorities have taken some
measures to address poor education outcomes and
skill shortages by adopting relevant strategies.
Some progress has been made in vocational
education and training, lifelong learning and
higher education but the quality of these services
and their labour market relevance remain largely
insufficient. After the adoption of the Strategy for
Early School Leaving in 2015 and the progress
observed the following year, efforts to continue
implementation were modest in 2017. This is
reflected in high early school leaving rates,
unequal access to quality education including for
the Roma and large gaps in terms of student
performance all pointing to persistent hurdles.
Healthcare reform is progressing at a slow pace.
Since 2013, the Romanian authorities have made
some progress in implementing health-related
6%
26%
53%
11%
4%
No Progress
Limited Progress
Some Progress
Substantial Progress
Full Implementation
2. PROGRESS WITH COUNTRY-SPECIFIC RECOMMENDATIONS

2. Progress with country-specific recommendations
12
country specific recommendations on a yearly
basis, albeit with some difficulties due to the
modest administrative capacity of the Ministry of
Health, shifting priorities, poor investment
planning and in some cases the lack of political
commitment. The shift to outpatient care remains
at an early stage, with most efforts concentrated on
hospital care. Past measures on reporting informal
payments need more time to deliver visible results.
Progress on the reform of the public
administration has been overall limited.
Romanian authorities took some measures
regarding the public administration reform by
adopting in 2016 the new civil service and staff
training strategies. However, draft legislation
reflecting the relevant objectives is not yet adopted
and results will be seen only around mid-2019.
The incomplete human resource reforms limit the
capacity to develop and implement policies in a
strategic manner, weigh on investments and
negatively impact the businesses environment.
Overall, Romania made limited progress (9) in
addressing the 2017 country-specific
recommendations. There was limited progress on
tax compliance and collection, activation
measures, education, outpatient care, public
administration and public investment
prioritization. No progress was made on minimum
wage setting, pensionable age and fiscal
framework. In contrast, there was some progress
on public procurement, fighting undeclared work
and curbing informal payments in healthcare.
Legislative changes adopted in 2017 reversed the
substantial progress made the previous year in
strengthening the corporate governance of state-
owned enterprises, pointing to a significant
backtracking on past reforms.
European Structural and Investment Funds
(ESI Funds) are pivotal in addressing key
challenges to inclusive growth and convergence
in Romania, notably by reforming the public
procurement system, strengthening the quality and
accessibility of primary and community healthcare,
and improving basic transport, waste and water
infrastructure. The ESI Funds also help extend
(9) Information on the level of progress and actions taken to
address the policy advice in each respective subpart of a
CSR is presented in the Overview Table in the Annex. This
overall assessment does not include an assessment of
compliance with the Stability and Growth Pact.
broadband access and e-Government services, they
support youth not in education, employment or
training, reinforce the capacity of the public
employment service and improve the integration of
employment, social and education services.
Member States can request from the
Commission technical support to prepare,
design, and implement growth-enhancing
structural reforms. The Structural Reform
Support Service (SRSS) provides, in cooperation
with the relevant Commission services, tailor-
made technical support, which does not require co-
financing and is provided at a Member State's
request. The support addresses priorities identified
in the context of the EU economic governance
process (i.e., implementation of country-specific
recommendations), but the scope of the SRSS
support is wider as it can also cover reforms linked
to other Commission priorities, or reforms
undertaken at the initiative of Member States.
Romania has requested technical support from
the SRSS to help implement reforms in various
areas. These include governance and public
administration, revenue administration, growth and
the business environment, health, social services,
education, the financial sector and access to
finance. In particular, the SRSS provides support
to improve the supervisory capacity of the
Romanian Financial Supervisory Authority.

2. Progress with country-specific recommendations
13
Table 2.1: Summary table on CSR assessment
(1) This does not include an assessment of compliance with the Stability and Growth Pact
Source: European Commission
Romania Overall assessment of progress with 2017 CSRs:
Limited progress
CSR 1: In 2017, ensure compliance with the
Council Recommendation of 16 June 2017
with a view to correcting the significant
deviation from the adjustment path toward the
medium-term budgetary objective. In 2018,
pursue a substantial fiscal effort in line with
the requirements of the preventive arm of the
Stability and Growth Pact. Ensure the full
application of the fiscal framework.
Strengthen tax compliance and collection.
Fight undeclared work, including by ensuring
the systematic use of integrated controls.
Limited progress
No progress was made in ensuring that the
national fiscal framework is implemented
and limited progress in strengthening tax
compliance and collection.
Some progress was made on fighting
undeclared work
CSR 2: Strengthen targeted activation policies
and integrated public services, focusing on
those furthest away from the labour market.
Adopt legislation equalising the pension age
for men and women. Establish a transparent
mechanism for minimum wage-setting, in
consultation with social partners. Improve
access to quality mainstream education, in
particular for Roma and children in rural
areas. In healthcare, shift to outpatient care
and curb informal payments.
Limited progress
Limited progress was made in strengthening
targeted activation policies and integrated
public services.
No progress was made on equalising of the
pensionable age for men and women.
No progress was made on minimum wage
setting.
Limited progress was made on improving
access to quality mainstream education.
Limited progress was made on shifting to
outpatient care
Some progress was made on curbing informal
payments.
CSR 3: Adopt legislation to ensure a
professional and independent civil service,
applying objective criteria. Strengthen project
prioritisation and preparation in public
investment. Ensure the timely full and
sustainable implementation of the national
public procurement strategy.
Limited progress
Limited progress was made adopting
legislation to ensure a professional and
independent civil service.
Limited progress was made on strengthening
project prioritization and preparation in public
investment.
Some progress was made on implementing the
national public procurement strategy.
2. Progress with country-specific recommendations
14
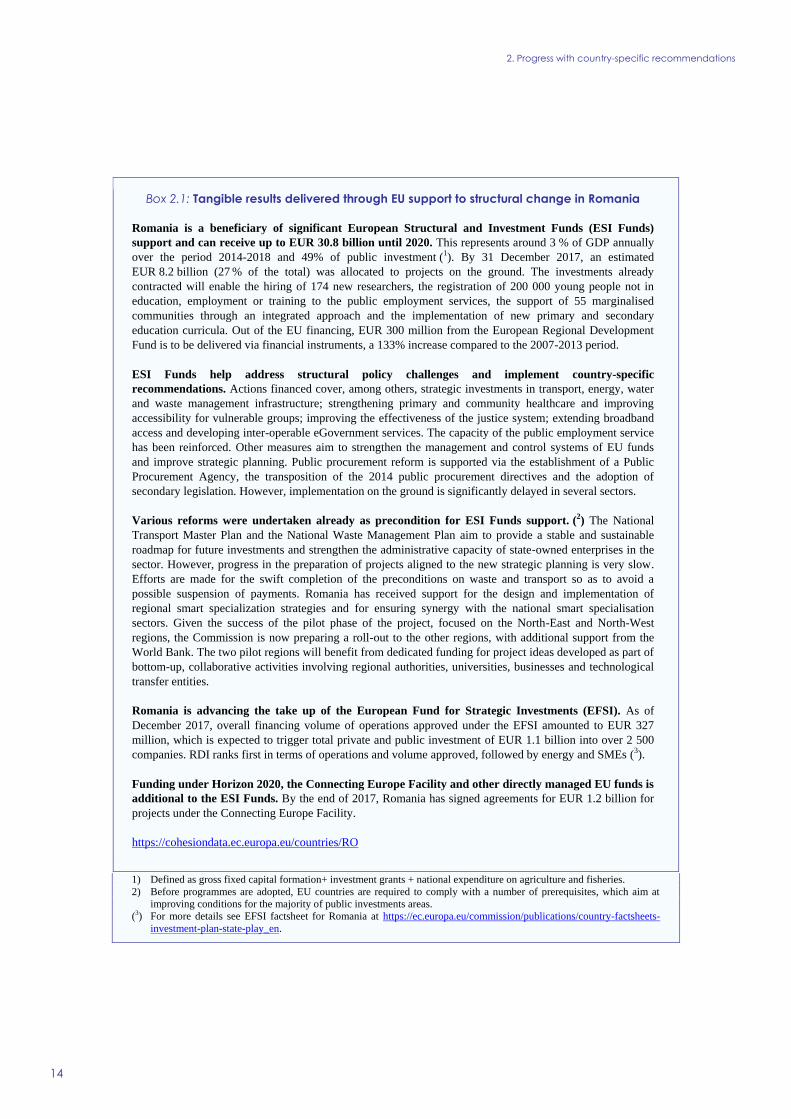
Box 2.1: Tangible results delivered through EU support to structural change in Romania
Romania is a beneficiary of significant European Structural and Investment Funds (ESI Funds)
support and can receive up to EUR 30.8 billion until 2020. This represents around 3 % of GDP annually
over the period 2014-2018 and 49% of public investment (1). By 31 December 2017, an estimated
EUR 8.2 billion (27 % of the total) was allocated to projects on the ground. The investments already
contracted will enable the hiring of 174 new researchers, the registration of 200 000 young people not in
education, employment or training to the public employment services, the support of 55 marginalised
communities through an integrated approach and the implementation of new primary and secondary
education curricula. Out of the EU financing, EUR 300 million from the European Regional Development
Fund is to be delivered via financial instruments, a 133% increase compared to the 2007-2013 period.
ESI Funds help address structural policy challenges and implement country-specific
recommendations. Actions financed cover, among others, strategic investments in transport, energy, water
and waste management infrastructure; strengthening primary and community healthcare and improving
accessibility for vulnerable groups; improving the effectiveness of the justice system; extending broadband
access and developing inter-operable eGovernment services. The capacity of the public employment service
has been reinforced. Other measures aim to strengthen the management and control systems of EU funds
and improve strategic planning. Public procurement reform is supported via the establishment of a Public
Procurement Agency, the transposition of the 2014 public procurement directives and the adoption of
secondary legislation. However, implementation on the ground is significantly delayed in several sectors.
Various reforms were undertaken already as precondition for ESI Funds support. (2) The National
Transport Master Plan and the National Waste Management Plan aim to provide a stable and sustainable
roadmap for future investments and strengthen the administrative capacity of state‐owned enterprises in the
sector. However, progress in the preparation of projects aligned to the new strategic planning is very slow.
Efforts are made for the swift completion of the preconditions on waste and transport so as to avoid a
possible suspension of payments. Romania has received support for the design and implementation of
regional smart specialization strategies and for ensuring synergy with the national smart specialisation
sectors. Given the success of the pilot phase of the project, focused on the North-East and North-West
regions, the Commission is now preparing a roll-out to the other regions, with additional support from the
World Bank. The two pilot regions will benefit from dedicated funding for project ideas developed as part of
bottom-up, collaborative activities involving regional authorities, universities, businesses and technological
transfer entities.
Romania is advancing the take up of the European Fund for Strategic Investments (EFSI). As of
December 2017, overall financing volume of operations approved under the EFSI amounted to EUR 327
million, which is expected to trigger total private and public investment of EUR 1.1 billion into over 2 500
companies. RDI ranks first in terms of operations and volume approved, followed by energy and SMEs (3).
Funding under Horizon 2020, the Connecting Europe Facility and other directly managed EU funds is
additional to the ESI Funds. By the end of 2017, Romania has signed agreements for EUR 1.2 billion for
projects under the Connecting Europe Facility.
https://cohesiondata.ec.europa.eu/countries/RO
1) Defined as gross fixed capital formation+ investment grants + national expenditure on agriculture and fisheries.
2) Before programmes are adopted, EU countries are required to comply with a number of prerequisites, which aim at
improving conditions for the majority of public investments areas.
(3) For more details see EFSI factsheet for Romania at https://ec.europa.eu/commission/publications/country-factsheets-
investment-plan-state-play_en.

15
3.1.1. FISCAL POLICY
The government has been pursuing an
expansionary, pro-cyclical fiscal policy,
resulting in an increasing fiscal deficit. Indirect
taxes were cut at the beginning of 2017 (in
particular the standard VAT rate by 1 pp.) while
the flat personal income tax rate was cut from 16
% to 10 % from January 2018. On the expenditure
side, public wages have been significantly
increased in 2017 and 2018, following the
adoption of the Unified Wage Law (UWL) in
summer 2017, although the fiscal impact of the
increases of the gross wages in the public sector
was partially contained by a switch of the social
contributions to the employee side from January
2018 (see Box 3.1.1). The government also
enacted significant increases to old-age pensions,
going beyond the standard pension indexation
mechanism, which enter into force in July 2017
and July 2018. As a consequence of these
measures, the public deficit has been increasing
(see Section 1). In June 2017 the Council launched
a significant deviation procedure addressed to
Romania.
3.1.2. TAXATION
The tax and benefit system has a relatively low
degree of redistribution and hence relatively
low influence on income inequality. Per capita
spending on social protection is one of the lowest
in the EU. The personal income tax has a tax-free
allowance and a flat rate (reduced to 10% since
January 2018). The tax wedge, i.e., the ratio
between the amount of taxes paid by a worker and
the corresponding total labour cost for the
employer, on low income earners is above the EU
average, while for high income earners it is below
it (10). As a consequence, the degree of
redistribution, measured as the difference between
the market income inequality and the disposable
(10) The tax wedge for those earning 50 % of average wage
(AW) was 36.8 %, while for those earning 167 % of AW it
amounted to 39.5 % in 2016, compared to the EU average
of 32.2 % and 44.4 % respectively. Source: European
Commission, Tax and Benefits database, available at
http://europa.eu/economy_finance/db_indicators/tab/#.
income inequality, is relatively limited (see Graph
3.1.1 and Sections 1 and 3.1).
Graph 3.1.1: Redistributive power of the tax and benefit
system in EU Member States, 2016
(1) Difference between the Gini coefficients for market
income inequality (i.e. before tax and benefits) and
disposable income inequality (i.e. after tax and benefits).
Income data are adjusted for household size
(equalisation). The scale of Gini coefficients is from 0 to 100.
The value 0 corresponds to perfect equality (same income
to everybody) while 100 corresponds to maximum
inequality (all income distributed to only one person and all
the others have nothing).
(2) No 2016 data available for Ireland, Italy and
Luxembourg, therefore 2015 data used instead. (3) The EU-
28 average is calculated as the population-weighted
average of individual national figures.
Source: Commission calculations based on Eurostat data
Tax compliance remains low, in particular in
VAT. The VAT gap in Romania, i.e. the difference
between theoretically expected VAT revenues and
the VAT actually collected, is the highest in the
EU. However, it decreased by 5.7 pps in 2015 (see
Graph 3.1.2), the second biggest fall in the EU
(CASE et al, 2017). As of October 2017, the
government introduced an optional VAT split-
payment system, aimed at addressing low VAT
collection. By the first half of November only 300
companies decided to switch to this optional
system. From 2018, the system is mandatory for
insolvent companies and for taxpayers with
significant old outstanding VAT liabilities.
However, the mandatory introduction of electronic
0,0
0,1
0,2
0,3
0,4
0,5
0,6
0
5
10
15
20
25
30
FI
BE SI
IE DK
CZ
AT
NL
HU
SE
DE
UK
FR
LU
HR
SK
EL
PT
MT IT
RO PL
ES
CY
EE
LT
LV
BG
EU
-28
Decre
ase o
f G
ini in
dex in %
Decre
ase o
f G
ini in
dex in a
bsolu
te v
alu
es
Decrease of Gini in absolute values Decrease of Gini in percentage
3. REFORM PRIORITIES
3.1. PUBLIC FINANCES AND TAXATION

3.1. Public finances and taxation
16
cash registers connected to the tax administrationʼs
IT system has been postponed (11).
The incidence of undeclared work continues to
be relatively high. The share of employees
receiving envelope wages – i.e. with underreported
salary – is estimated at double the EU average
(Williams and Horodnic, 2017). The informal
economy is large, (12) also given the high share of
self-employment, especially in agriculture. (13) In
2017, the Labour and Fiscal Codes were
amended (14) to broaden the definition of
undeclared work and to introduce more coercive
measures against disguised employment, by
increasing fines. While a dedicated department
was set up in the Labour Inspectorate to increase
controls and run awareness campaigns, the
organisation of the fight against undeclared work
continues to be fragmented across a range of
institutions and the preventive element is still
insufficiently developed. Social partners are
insufficiently involved in the fight against
undeclared work. Since September 2017 (for
employers) and January 2018 (for employees)
social security contributions for part-time contracts
have to be paid based on at least the minimum
gross wage.. While the potential impact of this
measure has not been fully assessed, it could
overall lead to more full time employment.
However, the higher tax burden may also create
new incentives to avoid formalised employment
altogether.
The authorities simplified tax compliance
obligations, introduced specific anti-abuse
measures and somewhat re-organised the tax
administration. The Code of Fiscal Procedures
was amended in August 2017. VAT registration
and deregistration was made dependent on the
(11) According to the Government Ordinance No. 20/2017,
published in Official Gazette No. 705/2017, the new
deadline for average and large-sized companies is June
2018, while the deadline for small companies was
maintained (August 2018).
(12) Using OECD methodology, the Romanian National
Statistics Office estimated for 2014 a level of 22.1% for the
informal/unobserved economy, a slight increase from the
OECD estimate of 21.5% for 2010. According to the
methodology used, the unregistered workforce is the
biggest component of the unobserved economy in
Romania.
(13) Seasonal employment, highly present in agriculture, has to
be declared by the employer, and the Labour Inspectorate
is competent to conduct checks.
(14) Government Emergency Ordinance No. 53/2017.
taxpayerʼs tax risk position (leading to a smoother
VAT reimbursement system), the average duration
of tax audits was reduced to 82 days, rules for
deferring tax payments were made more flexible,
and the use of the Private Virtual Space, i.e. an
online portal with personal taxpayer accounts, was
extended to legal entities, besides individuals (15).
In November, the government introduced specific
anti-abuse measures included in Directive
1164/2016 (16), complementing the general anti-
abuse provisions set out already in the Fiscal Code.
The Romanian tax administration (ANAF) and its
IT system also underwent a minor
reorganisation (17).
Graph 3.1.2: Romania: VAT Revenues, VAT theoretical tax
liability (VTTL) and VAT gap
"VAT gap" - the difference between theoretically expected
VAT revenues ("VTTL") and actually collected VAT, as a
share of the theoretically expected VAT revenues.
Source: CASE et al. (2017)
(15) The portalʼs use seems rather limited, with only 144 000
taxpayers connected almost 3 years after its introduction, of
which 67 000 are legal entities. See ANAF press release:
https://static.anaf.ro/static/3/Anaf/20170717142252_720-
17.07.2017-%20com%20spv.pdf
(16) Council Directive (EU) 2016/1164 of 12 July 2016 laying
down rules against tax avoidance practices that directly
affect the functioning of the internal market.
(17) Notable changes are: (i) the creation of the so-called
National Centre for Financial Information (CNIF) through
the merger of some resources from the Large Taxpayers
Office of ANAF, the National Agency for Public
Procurement (ANAP) and the National Forecasting
Commission (CNP); (ii) a further regional reorganisation,
and (iii) the centralised management of non-resident
taxpayers.
0
20
40
60
80
100
0%
10%
20%
30%
40%
50%
2011 2012 2013 2014 2015
Bn R
ON
VAT gap VTTL (rhs) collected VAT (rhs)

3.1. Public finances and taxation
17
Box 3.1.1: Emergency Ordinance No 79/2017:
distributive and macroeconomic impact
In November 2017 the government adopted Emergency Ordinance No 79/2017 which substantially
changed the structure of social contributions by shifting their burden almost entirely to the
employees, from 22.75 % for employers and 16.5% for employees to 2.25% and 35% respectively.
It also reduced the personal income tax (PIT) rate from 16% to 10% and increased the PIT-free
allowance. These changes entered into force on 1 January 2018. They follow the Unified Wage
Law (UWL) adopted in summer 2017, which provided for a 25% gross wage increase for most
government employees in January 2018 and additional increases in health and education sectors.
Also, to compensate for the shift of social contributions, the government increased the minimum
gross wage by 31 % to RON 1 900 (EUR 413) and requested social partners to re-negotiate the
wages in the private sector. This concerns a very large number of contracts. These measures are set
to have a negative impact on the general government balance. Expenditures on wages of public
employees are set to increase and the revenues from PIT are set to decrease. The fiscal cost of the
increased wages of public employees is set to be partially compensated by the higher social
contributions they are paying.
The distributive and equity impact of these changes has been simulated by the European
Commission Joint Research Centre using the EUROMOD microsimulation model1 (Graph 1
below). The simulation is static, i.e. it does not incorporate second-round effects of the reforms on
the economy. In the public sector, the disposable income increases across all income deciles,
although significantly less than what would have occurred without the social contributions shift.
For the private sector, the simulation presents a lower-bound scenario of no reaction of gross
wages to the shift. Those earning more than RON 1 593 (EUR 341) in the baseline scenario
increasingly lose. This is because the increased burden of the social contributions outweighs the
higher minimum gross wage, higher PIT allowance and the reduced PIT rate. Moreover, part-time
workers lose due to the introduction of a minimum contributory base for social contributions paid
by them. The UWL increases market income inequality, as the public employees are mostly
situated in the upper part of the income distribution (Graph 2). This impact is more than
compensated by the impact on inequality of the increase of the minimum wage. Taken together,
these two measures cause market income inequality to marginally fall. Assuming no adjustment of
private gross wages, the Ordinance increases the degree of redistribution, in particular thanks to
increased PIT-free allowance, and thus decreases the disposable income inequality. The
redistributive effect of the Ordinance is, however, diminished by the reduced PIT rate. A
renegotiation of private gross wages of those earning more than RON 1 593 (EUR 341) (not
simulated) would cause both market and the disposable income inequality to slightly increase
compared to the baseline scenario.
A simulation using the QUEST global macroeconomic model2 shows the second round effects of
the UWL and the Emergency Ordinance No 79/2017 (Graph 3). The model does not incorporate
the minimum wage increase and assumes no spill-overs from public wages increases to private
sector wages. The simulation indicates a gradual increase of real gross wages in the private sector
in reaction to the social contributions shift. Therefore, real net wages and labour costs (not shown)
in the private sector immediately drop and gradually adjust thereafter. GDP immediately increases
thanks to an increase in private employment driven by the decrease in average labour tax-rate on
employers (and thus a decrease in labour costs) brought by the shift. The gain in GDP would
dissipate in the long run, as private wages adjust and the increase in employment dissipates.
Adding the minimum wage increase and spill-overs between public and private sector wages
would dampen the impact of the reforms on GDP and employment.

3.1. Public finances and taxation
18
Graph 1: Mean disposable income of public and private sector employees
A. by decile (equivalised household disposable
income)
B. by initial gross wage in RON
"Public sector – UWL only": pure impact of the public wage increases. "Public sector – all policy changes" and
"Private sector – all policy changes": cumulative impact of UWL, Emergency Ordinance No 79/2017 and increased
minimum gross wage (assumes no reaction of the gross wages in the private sector).
Source: European Commission Joint Research Centre, calculations based on the EUROMOD model.
Graph 2: Impact on inequality Graph 3: Macroeconomic impact
"UWL only": pure impact of the public wage increases;
"all policy changes": cumulative impact of UWL,
Emergency Ordinance No 79/2017 and increased
minimum wage (assuming no adjustment of gross
wages in the private sector).
The graph shows the percentage deviations from the
baseline scenario without the reforms.. Public wage
increases resulting from UWL are simulated as a
permanent increase of government expenditures on
public wages. The Ordinance is simulated as a shift of
labour tax burden from employers to employees.
Source: European Commission Joint Research Centre,
calculations based on the EUROMOD model.
Source: European Commission, calculations based on
the QUEST model
1 EUROMOD is the tax-benefit microsimulation model for the European Union. The simulations are based on
representative survey data from the European Statistics on Income and Living Conditions (EU-SILC). 2 QUEST is a dynamic stochastic general equilibrium model. See https://ec.europa.eu/info/business-economy-
euro/economic-and-fiscal-policy-coordination/economic-research/macroeconomic-models_en.

19
3.1.3. FISCAL FRAMEWORK
The national fiscal framework has not been
respected, in what appears to have become a
recurrent practice. The deficit rule embedded in
the national fiscal framework requires compliance
with or convergence to the medium-term
budgetary objective of a structural deficit of 1 % of
GDP. However, in 2016 structural deficit increased
above the medium-term objective, in breach of the
national deficit rule. Both the 2017 and 2018
budgets target a headline deficit of close to 3 % of
GDP, which in presence of an increasing output
gap implies a further deterioration of the structural
balance, again contrary to the deficit rule.
Additionally, the two 2017 budget amendments
(from September and November) broke rules
prohibiting increases of the headline and primary
deficit ceilings during the fiscal year as well as
rules prohibiting increases in personnel
expenditure and total government expenditure
excluding EU funds during the fiscal year.
The medium-term fiscal strategy does not guide
the annual budget process. Under the Fiscal
Responsibility Law, the fiscal strategy sets out the
macroeconomic assumptions, medium-term budget
planning and expenditure ceilings that should
guide the annual budget process. However, in
2017, as in previous years, the authorities did not
send an update of the fiscal strategy to Parliament
by 15 August, the statutory deadline. Instead the
government sent it to Parliament simultaneously
with the 2018 budget law in December, thereby
undermining the guiding role of the medium-term
fiscal strategy.
3.1.4. FISCAL SUSTAINABILITY
With a high fiscal deficit, the public debt ratio
is expected to gradually increase, leading to
high debt sustainability risks in the medium
term. Due to a high structural primary deficit,
interest expenditure is set to gradually increase.
Increasing ageing costs related to health care and
long-term care will also negatively impact the
public debt dynamic. As a consequence, assuming
no-policy change, the debt-to-GDP ratio is set on
an upward path and expected to go beyond the
60 % Treaty reference by 2028. At the same time it
is sensitive to shocks on the primary balance.
Romania is one of the few EU countries where
debt is projected to rise by 2028 and it is the EU
country with the largest projected debt increase (18)
(Graph 3.1.3).
Graph 3.1.3: Public debt projection 2017-2028
(1)The green colour indicates a positive change in general
government's debt, while the red colour indicates a
negative change.
Source: European Commission
The government partially reversed the 2008
pension reform that introduced the multi-pillar
pension system. The 2008 reform provides that a
portion of social security contributions is directed
to funded individual accounts (a defined
contribution scheme) managed by pension funds
(second pension pillar). It envisaged that
contributions to the second pension pillar would be
gradually raised to 6 % of gross wages based on a
pre-determined schedule. However, in 2016
contributions were increased to only 5.1 % (instead
of 5.5 %) and the 2017 budget maintained this rate.
In November 2017 the government enacted an
emergency ordinance cutting the rate to 3.75 % of
gross wages as from 2018. This change will
decrease the fiscal deficit in the short term, as the
second pension pillar is classified outside of the
general government sector. However, that fiscal
gain would dissipate in the long term as the social
contributions diverted from the second pillar
would be accompanied by an obligation to pay old-
age pensions in the future. In addition, this reversal
will result in less diversified retirement income. It
could also have negative implications for the
development of capital markets (see Section 3.2).
(18) For an overview of fiscal sustainability assessment see
European Commission (2018a).
-60
-40
-20
0
20
40
60
80
100
120
140
160
BG
LU
SE
DK
CZ
MT
LV
SK
NL
DE IE AT SI
CY
HU
EU
28
HR
EA
UK
BE
ES
PT IT EE
LT
PL
RO FI
FR
% o
f G
DP
2017 Ch. 2017-2028 2028
Peak Year2028
Peak Year2017

20
Banking sector
Banking sector capitalisation continues to be
reassuring and asset quality has further
improved. Total capitalisation at system level
remained roughly flat in the first 9 months of 2017,
hovering around 19 %, well above the EU average.
The Common Equity Tier 1 ratio (19) has also
remained robust, at 17.15 % at the end of
September 2017. On the back of the measures
adopted since 2014 by the supervisor, non-
performing loans (NPLs) fell by roughly 14 pps to
slightly below 8 % in September 2017, down from
the peak registered in February 2014 (20). NPLs are
estimated to have further fallen to roughly 6 % by
the end of December 2017.
However, the ongoing clean-up of banksʼ
balance sheets faces obstacles. Bank balance
sheets continue to be burdened by the quality of
corporate exposures and the still high level of
impaired consumer loans, which require close
monitoring. Through the Fiscal Code amendments
approved in August 2017, the government limited
the tax deductibility of expenditure related to non-
performing exposures sold by banks to 30 %, in
contrast to the previous system of full tax
deductibility. Whereas the current situation
appears manageable, especially for highly
provisioned NPLs, the new tax treatment is likely
to significantly hinder NPL sales and hence the
clean-up of bank balance sheets if NPLs were to
increase again. Furthermore, if a legislative
proposal by Parliament aiming to cap the recovery
values from NPLs to no more than double the price
paid for these loans by investors (and debt
collection companies) is adopted, this is likely to
significantly discourage future secondary market
transactions with impaired assets.
The National Bank of Romania (NBR) has
reiterated its commitment to conducting an
asset quality review and stress test of the
banking sector in 2018. Preparatory work started
already in 2015 with a view to conducting the
(19) Defined as the ratio of a bankʼs Tier 1 capital (consisting
mostly of common stock) to its risk-weighted assets.
(20) The National Bank of Romania's NPL definition is fully in
line with that of European Banking Authority. Non-
performing exposures are: i) material exposures which are
more than 90 days past due; or ii) the debtor is assessed as
unlikely to pay its obligations in full without realisation of
the collateral, regardless of the existence of any past due
amount or of the number of days past due.
exercise in 2016. However, the authorities
subsequently postponed the exercise for 2018 to
capture the impact of the Debt Discharge Law on
banksʼ balance sheets and to allow for the
completion of the IMF 2017 Financial Sector
Assessment Programme. The asset quality review
and stress test exercise is expected to cover all
banks identified as having systemic relevance. It is
also expected to be performed with the support of
independent and reputable third parties. The
exercise will be overseen by a Steering Committee,
which includes representatives of the NBR as
members, plus observers from the European
Commission and the European Banking Authority.
Profitability has remained strong, supported
also by the lower costs of risk and funding. On
the back of the buoyant economic growth and the
increase in lending activity, profitability at system
level continued to improve in 2017. However,
profitability has varied between banks, as the
smaller credit institutions faced more difficulties to
generate profit. Net interest income has continued
to be the main source of operating revenues, with
several banks, in particular smaller credit
institutions, having limited capacity to generate
non-interest income. The cost-to-income ratio at
system level has been lower than the EU average,
but there is further scope for improving efficiency,
especially for smaller banks. The streamlining of
the banksʼ networks continued, with the total
number of branches down by some 3.6 % in
September 2017 as compared to end-2016 and by
6.5 % since 2015.
The banksʼ business model continues to be
geared towards lending to households. Whereas
banks have become more prudent about household
lending than in the pre-crisis period, they have
been also more reluctant to switch to a business
model focused predominantly on lending to
companies. Several factors have contributed to this
state of play: (i) the small size of companies, most
of which do not meet the EU definition of SMEs
and which among other things do not have a track-
record of creditworthiness; (ii) the persistent
undercapitalisation of a large number of
companies, which have not been bankable and
have also contributed to the decrease in payment
discipline in the economy (21); (iii) the difficulties
(21) Despite the buoyant economic growth over the past couple
of years, the capital position of companies has worsened.
3.2. FINANCIAL SECTOR

3.2. Financial sector
21
met by banks in hiring qualified staff to support
the transition to a business model focused on
corporate lending.
Risks to the banking sector posed by legislative
initiatives have abated, but require close
monitoring. Based on a referral by credit
institutions, the Constitutional Court ruled in
October 2016 that the Debt Discharge Law, which
entered into force in May of that year, was
constitutional if certain conditions are met so as to
minimise the lawʼs unwarranted adverse impact on
the banking sector (European Commission,
2017a). The number of notifications by borrowers
intending to use debt discharge has declined since
this decision of the Constitutional Court. Similarly,
following the 2016 Constitutional Court ruling on
the unconstitutionality of Swiss franc-denominated
loans conversion into local currency loans
(European Commission, 2017a), credit institutions
continued their efforts to support borrowers in
difficulty by offering the possibility to convert
Swiss franc-denominated loans into RON-
denominated loans with a discount or by
restructuring these loans. Despite these
developments, the legislative framework
applicable to the banking sector continues to
require close oversight. A recent initiative by
Parliament aims to introduce a maximum cap on
interest rates in all loan contracts for lending to
households, both for ongoing and new contracts.
Under this proposal, the interest rate should not be
higher than the policy rate of the NBR +50 % (i.e.
3 % at the end of January 2018).
Non-banking sector
Although insurance activity expanded in 2017,
insurance penetration is still very low. Insurance
activity expanded in the first half of 2017, as gross
written premiums increased by 2 % in the non-life
According to NBR data, roughly 44 % (276 500) of the
total number of companies do not observe the legal
requirements regarding capitalisation, with total own funds
being lower than half of the subscribed equity. Out of these
companies, 59 % (or 163 800 firms) are companies which
registered losses in 2016. Furthermore, roughly 42 % (268
500) of the total number of companies had negative equity
at the end of 2016. For further details see the presentation
of NBR First Deputy Governor Florin Georgescu, Real
convergence – the fundamental criterion for joining the
euro area, 22 November 2017. http://bnr.ro/Prezentari-si-
interviuri--1332.aspx
sector and by 36 % in the life insurance sector as
compared to the same period in 2016. Despite this
increase in insurance activity, insurance
penetration (22) has remained one of the lowest in
the EU at roughly 1.2 % of GDP. Furthermore, the
insurance market is highly dependent on non-life
insurance, in particular compulsory car insurance
(third-party liability motor insurance). The efforts
of several companies to diversify their insurance
business are still to bear fruit.
Despite past corrective measures, several
segments of the insurance sector require further
improvement. Following the 2015 balance sheet
review and stress test of the insurance sector,
measures were taken by the Financial Supervisory
Authority to restore the financial situation of
insurers in distress. Nevertheless, several pockets
of vulnerability remain to be addressed, including
the thin capital buffers of some weaker insurers
and their high reliance on compulsory car
insurance. The caps on insurance premiums for
compulsory car insurance, which became effective
in November 2016, were lifted in May 2017 and
replaced by reference prices. The removal of these
maximum caps has not, so far, triggered an
increase in insurance premiums, which have
remained below the reference prices. To continue
improving the health of the insurance market and
increase the capacity of insurance companies to
strengthen their capital basis, efficiency gains
through cost-cutting measures appear warranted, in
particular over the distribution of insurance
products.
The independence of the non-banking
supervisor has come under pressure. Following
measures taken after the 2015 balance sheet review
and stress test of the insurance sector (European
Commission, 2017a) to address shortcomings
related to insurance companies in financial distress
and to the situation regarding compulsory car
insurance, Parliament launched in late 2016 a
procedure to revoke the mandate of the President
of the Financial Supervisory Authority. The former
President of the Authority was subsequently
removed from office by Parliament in May 2017.
This was an indication of political pressure in
response to the Authorityʼs supervisory actions.
This limits the independence of the supervisor to
(22) Insurance penetration is defined as the share of gross
written premium in a countryʼs GDP.

3.2. Financial sector
22
tackle shortcomings identified in its area of
competence in a timely manner.
Graph 3.2.1: Pension funds' real net investment rate of
return, Dec 2016 (preliminary)
Source: OECD
The recent reductions in contributions to the
second pillar pension funds were triggered by
short-term fiscal concerns rather than their
financial performance (see Section 3.1). The
financial situation and functioning of Romanian
private pension funds has not been a matter of
concern. According to OECD data, they were
among the top performing pension funds in the
new EU Member States in 2016, together with the
Polish and Croatian pension funds (OECD, 2017c).
The real net investment rate of return of the
Romanian second pillar pension funds stood at
roughly 5% in 2016, higher than the average rate
of return (simple average) of 3.4% of pension
funds in the new EU countries.
Reform of the second pillar pensions could
weaken pension sustainability and the
performance of the local capital market. As of
end-June 2017, the second pillar pension funds had
total assets of EUR 7.9 billion and roughly 6.9
million participants (individuals). Over the past
couple of years, the second pillar pension funds
have increasingly diversified their investments. As
of June 2017, roughly 65 % of their assets were
invested in government bonds, down from around
70% in 2012. Furthermore, these pension funds
invested roughly 19.6 % of their assets in equity,
6.4 % in deposits and the remaining in investment
funds, corporate and municipal bonds. The
investments of the second pillar pension funds in
shares listed on the Bucharest Stock Exchange
amounted to roughly EUR 1.34 billion at the end
of June 2017. These investments went up by
roughly 20% compared to end-2016, thanks to the
hike in the stock exchange indices and the increase
of participations of these pension funds in some of
the largest companies listed on the Bucharest
Stock Exchange.
-2 0 2 4 6 8
Poland
Croatia
Romania
Hungary
Bulgaria
Simple average
Lithuania
Slovakia
Slovenia
Estonia
Latvia
Czech Republic
annual rate of return in %, Dec 2016

23
Labour market demand
Employment is growing, driven by strong
domestic demand. Employment, including the
number of self-employed people, is growing in
expanding sectors, i.e. industry and services, which
require medium to high levels of skills. At the
same time, the total number of persons employed
slightly increased over the past 12 months.
Employers increasingly report difficulties in
hiring and retaining workers. According to
survey information, in 2016 72 % of employers
reported difficulties in filling jobs, the highest rate
since 2008 (Manpower Group, 2016). Skill
shortages exist for medium- to high-skill jobs in
engineering, machinery, IT and services. Only
29 % of Romanians have at least basic IT skills (23)
while less than 6 % of firms provide ICT training
to their staff. Higher wages abroad, low internal
mobility (24), limited entrepreneurship initiative
and weak links between education and labour
market needs contribute to increasing labour
shortages.
Substantial wage increases in recent years
reflect a tightening labour market. Both labour
productivity and wages are converging towards the
EU average (25)(Graph 3.3.1). Romania has
witnessed an acceleration of wage growth (in real
terms) over the past 3 years, with the highest
increases registered in manufacturing, the IT and
financial sectors, and in the public sector. In
addition to the increasing labour shortages leading
to a rebound in wages after the crisis especially for
medium-to-high skill sectors, other factors
explaining the current trend are: (i) successive ad
hoc increases in public-sector wages, and (ii) the
surge in the statutory minimum wage. However,
the 2018 shift of social contributions almost
entirely onto employees could have a negative
(23) Among the lowest in the EU and half the EU average; see
footnote 65.
(24) Among other causes, home ownership is 96 %, the highest
in the EU.
(25) GDP per person employed, as a measure of productivity,
stood at around 31 % in 2016, with wages lagging behind
at around 27 %.
impact on net wages in the short run (see Section
3.1).
The shift of social contributions to employees
represents a major change. This alters the wage
structure and transforms fundamentally the
financing of social protection. In most EU
countries the shares of employersʼ contributions
are frequently higher than or equal to those of the
employees (in Denmark social security
contributions are financed from taxation). The shift
marks also an important deviation from the system
of social contributions generally agreed in
industrial countries in which employers,
employees and the state share the responsibility
and burden of the financing. It is also enshrined in
various international standards (26).
Graph 3.3.1: Nominal compensation per employee and
GDP per person employed
Source: European Commission
(26) Romania ratified ILO Convention 102 on Social Security
Minimum Standards and the Code of Social Security of the
Council of Europe, thus legally committing to standards
which stipulate that the total of the insurance contributions
bore by the employees protected shall not exceed 50 % of
the total of the financial resources allocated to the social
protection of employees and their families. Moreover, a
number of international standards of non-binding character
lay out principles and recommendations of fair burden
sharing and solidarity, including the role of employers.
0
5
10
15
20
25
30
35
00 01 02 03 04 05 06 07 08 09 10 11 12 13 14 15 16 17 18
% r
ela
tive to E
U28
forecast
GDP per person employed Nominal compensation per employee
3.3. LABOUR MARKET, EDUCATION AND SOCIAL POLICIES
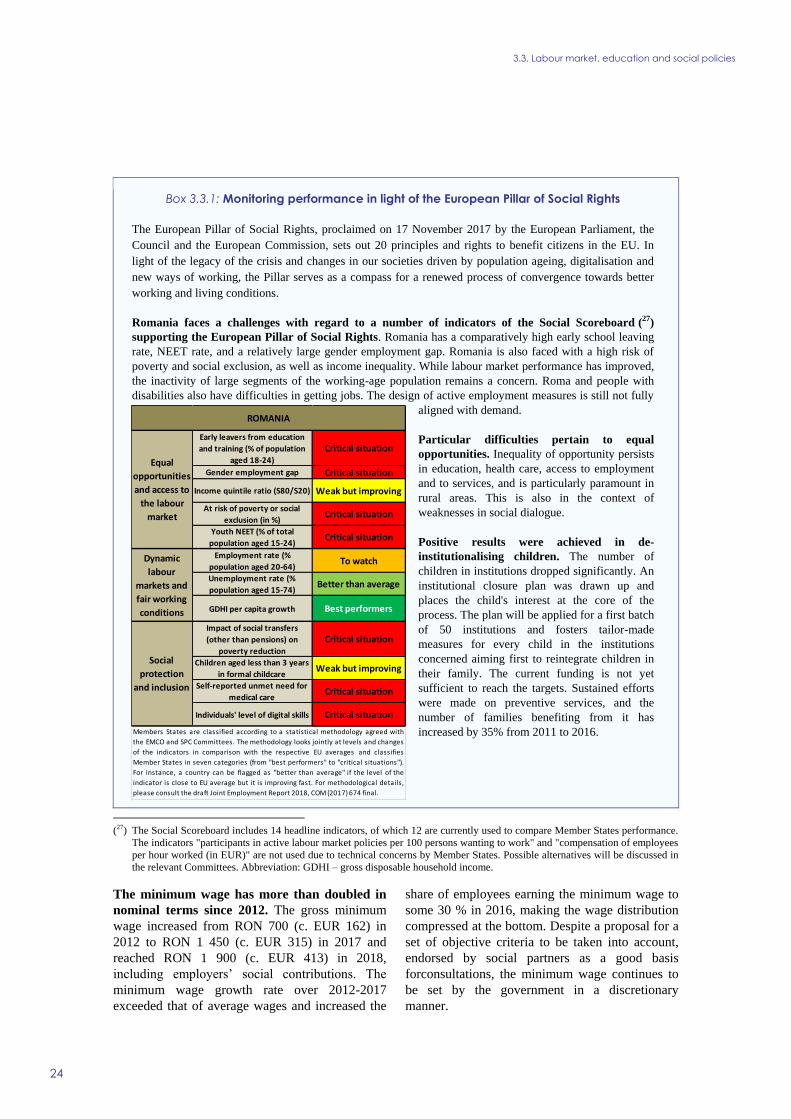
3.3. Labour market, education and social policies
24
Box 3.3.1: Monitoring performance in light of the European Pillar of Social Rights
The European Pillar of Social Rights, proclaimed on 17 November 2017 by the European Parliament, the
Council and the European Commission, sets out 20 principles and rights to benefit citizens in the EU. In
light of the legacy of the crisis and changes in our societies driven by population ageing, digitalisation and
new ways of working, the Pillar serves as a compass for a renewed process of convergence towards better
working and living conditions.
Romania faces a challenges with regard to a number of indicators of the Social Scoreboard (27
)
supporting the European Pillar of Social Rights. Romania has a comparatively high early school leaving
rate, NEET rate, and a relatively large gender employment gap. Romania is also faced with a high risk of
poverty and social exclusion, as well as income inequality. While labour market performance has improved,
the inactivity of large segments of the working-age population remains a concern. Roma and people with
disabilities also have difficulties in getting jobs. The design of active employment measures is still not fully
aligned with demand.
Particular difficulties pertain to equal
opportunities. Inequality of opportunity persists
in education, health care, access to employment
and to services, and is particularly paramount in
rural areas. This is also in the context of
weaknesses in social dialogue.
Positive results were achieved in de-
institutionalising children. The number of
children in institutions dropped significantly. An
institutional closure plan was drawn up and
places the child's interest at the core of the
process. The plan will be applied for a first batch
of 50 institutions and fosters tailor-made
measures for every child in the institutions
concerned aiming first to reintegrate children in
their family. The current funding is not yet
sufficient to reach the targets. Sustained efforts
were made on preventive services, and the
number of families benefiting from it has
increased by 35% from 2011 to 2016.
(27) The Social Scoreboard includes 14 headline indicators, of which 12 are currently used to compare Member States performance.
The indicators "participants in active labour market policies per 100 persons wanting to work" and "compensation of employees
per hour worked (in EUR)" are not used due to technical concerns by Member States. Possible alternatives will be discussed in
the relevant Committees. Abbreviation: GDHI – gross disposable household income.
The minimum wage has more than doubled in
nominal terms since 2012. The gross minimum
wage increased from RON 700 (c. EUR 162) in
2012 to RON 1 450 (c. EUR 315) in 2017 and
reached RON 1 900 (c. EUR 413) in 2018,
including employers’ social contributions. The
minimum wage growth rate over 2012-2017
exceeded that of average wages and increased the
share of employees earning the minimum wage to
some 30 % in 2016, making the wage distribution
compressed at the bottom. Despite a proposal for a
set of objective criteria to be taken into account,
endorsed by social partners as a good basis
forconsultations, the minimum wage continues to
be set by the government in a discretionary
manner.
Early leavers from education
and training (% of population
aged 18-24)
Critical situation
Gender employment gap Critical situation
Income quintile ratio (S80/S20) Weak but improving
At risk of poverty or social
exclusion (in %)Critical situation
Youth NEET (% of total
population aged 15-24)Critical situation
Employment rate (%
population aged 20-64)To watch
Unemployment rate (%
population aged 15-74)Better than average
GDHI per capita growth Best performers
Impact of social transfers
(other than pensions) on
poverty reduction
Critical situation
Children aged less than 3 years
in formal childcareWeak but improving
Self-reported unmet need for
medical care Critical situation
Individuals' level of digital skills Critical situation
Social
protection
and inclusion
Dynamic
labour
markets and
fair working
conditions
Equal
opportunities
and access to
the labour
market
ROMANIA
Members States are classified according to a statistical methodology agreed with
the EMCO and SPC Committees. The methodology looks jointly at levels and changes
of the indicators in comparison with the respective EU averages and classifies
Member States in seven categories (from "best performers" to "critical situations").
For instance, a country can be flagged as "better than average" if the level of the
indicator is close to EU average but it is improving fast. For methodological details,
please consult the draft Joint Employment Report 2018, COM (2017) 674 final.
3.3. Labour market, education and social policies
25
Shrinking labour supply
Demographics and emigration affect the labour
market supply. Since 2008 the population has
decreased significantly while its age structure has
developed unfavourably (28). In addition, around
3.4 million Romanians work and live abroad.
Sectors such as healthcare are particularly affected.
Many emigrants are younger and more qualified
than the average population (29), which further
constrains the supply of skilled labour. While in
the short run foreign remittances help improve the
current account, in the long run negative
demographics and emigration could hurt growth
and income convergence (European Commission,
2017i: p. 56, IMF, 2016).
Although the working-age population is
shrinking, there is a large untapped labour
pool. The activity rate among the population aged
20-64 remains one of the lowest in the EU despite
recent improvements (72.5 % in Q3- 2017).
Furthermore, long-term unemployment is high,
affecting 50 % of the unemployed (2016 data).
Regional disparities remain high. An appropriate
mix of active labour market policies could help
activate several disadvantaged groups in particular
prime-aged women with low education, Roma, and
young people, mainly from rural areas (World
Bank, 2017c).
The gender employment gap is high, affecting
mainly older women. The gap has increased from
16.7 pps in 2014 to 17.6 pps in 2016. Employment
and activity rates of women remain far below the
EU average, especially for older women, partly
due to the lack of affordable child care (30), after
school facilities and long-term care. The
government has taken some measures to formalise
the employment of child minders and plans to
finance 2 500 nurseries. Employment gaps lead in
turn to a gender pension gap that is one of the
highest in the EU. Despite these challenges, the
bill on pension age equalisation for men and
women has been pending before Parliament since
December 2013 and no plans have been made to
debate it in a plenary session.
(28) Romania’s population decreased from 21.1 million to 19.8
million over 2007-2016. The proportion of the population
aged 60+ to those aged 20-59 increased from 36.1 % to
44.1 % over the same period (Eurostat, 2017)
(29) More than half of those living abroad are aged 18 to 39
(World Bank, 2016b).
(30) The share of children below 3 in formal care is only 9.4 %
The number of young people neither in
education, employment or training (NEETs)
remains very high. While youth unemployment
has been declining (17.3 % in 2017), the situation
of young NEETs only improved slightly, mainly
driven by decreasing early school leaving. Many of
the NEETs are economically inactive or
discouraged workers (Eurofound, 2016) and the
incidence among women and the Roma (FRA,
2016) is particularly high.
The implementation of the Youth Guarantee
remains weak due to significant delays. The
large majority of young NEETs still need to be
reached and included in the scheme. Two thirds
(65.7 %) of those registered had not received an
employment offer within 4 months, while
Romania’s allocation under the EU’s Youth
Employment Initiative is unspent and risks being
returned to the EU budget. There is no follow-up
for most NEETs who have received an
employment offer. A number of measures have
been launched including the provision of Youth
Guarantee offers by multi-disciplinary teams of
employment and education counsellors, together
with social assistants. First results are expected for
the beginning of 2018.
Active labour market policies (ALMPs) appear
insufficient in scope and design. Due to delays in
accessing EU-financed ALMPs, financial
allocations (31) and participation rates in such
policies (32) remain very low. Despite increased
financial incentives, some measures are
overlapping for the target groups, the use and
uptake of the mobility schemes remains low, and
the administrative burden remains a disincentive
for employers. The development of innovative
measures and cooperation of the public
employment service with social and education
services and external providers (33) are limited.
There is no case management for the long-term
unemployed and recipients of social assistance.
Community work programmes do not provide
relevant skills and appear to have limited value as
stepping stones into standard employment. Some
(31) The national budget of ALMPs was 0.2 % GDP in 2015,
excluding the European Social Fund allocation.
(32) 3.1 % of people willing to work and 6.3 % of unemployed
people benefited from activation measures (in 2016).
(33) NGOs and social insertion enterprises (entities helping
vulnerable groups prepare for and access the labour market,
e.g. HIV positive in severe poverty, homeless or convicts).

3.3. Labour market, education and social policies
26
measures have been taken to strengthen the
capacity of the public employment service, while
further reform plans (notably on the merger of
these services with other institutions) may induce
some uncertainty into the reform process.
Limited skill forecasting capacities could
further affect labour market supply. The current
evaluation of skills on which training programmes
are based follows a standard procedure, which
however is not sufficiently taking into account the
rapidly changing needs in the economy (Cedefop,
2017). The capacity to anticipate future skills
needs and estimate the expected impact of new
technologies such as big data, biotechnologies,
waste reuse technologies, advanced manufacturing,
as well as public-sector innovations, is therefore
weak. The skill forecasting system currently
developed by public employment services is
expected to guide the design of training
programmes, including those funded by the
European Social Fund.
The involvement of social partners in policy-
making is very limited. Institutional structures for
social dialogue are in place (e.g. the National
Tripartite Council and the broader Economic and
Social Council, but also Ministry and county-level
committees), but they are mostly used by the
government to provide information about planned
initiatives, without a substantive process of
involvement and cooperation (Eurofound, 2018).
The views of social partners on policy-making are
often ignored by the government, even when they
converge, such as on the recent tax reform and the
shift of social contributions from employers to
employees. Romania has one of the lowest
perceived degrees of cooperation in labour-
employer relations in the EU (World Economic
Forum, 2017). The capacity of social partners is
also limited.
The framework for collective bargaining is not
conducive to a well-functioning system of
industrial relations. Social dialogue is
characterised by low collective bargaining (34),
especially at sectoral level, and low membership of
(34) Romania witnessed a drastic decrease in collective
bargaining coverage from 98 % (2008) to 35 % (2016),
compared to an EU average of 60 % (2016). Trade union
density decreased from around 90 % in 1990 to around
20 % in 2012. Membership of employersʼ organisations is
one of the lowest in the EU (based on 2013 data).
trade unions and employers’ organisations. Among
key obstacles to a more effective social dialogue
are the high representativeness thresholds and the
unclear definition of sectors. Amendments to the
Social Dialogue Law aimed at improving the
bargaining process and the definition of economic
sectors have been under discussion but
negotiations are not advancing.
Inequality
High income inequality persists, especially
between rural and urban areas. Despite a small
improvement in 2016 and recent policy changes,
Romania still has one of the highest levels of
income inequality in the EU, with the richest 20 %
of the population earning seven times more than
the poorest 20 %. In 2016, median incomes of
rural households were only 52 % of those of urban
households. High income inequality is the result of
a highly unequal distribution before taxes and
benefits (market inequality) and the limited ability
of the tax and benefit system to reduce this.
Inequality of opportunity remains a challenge.
Unequal access to education, healthcare and other
services, together with high inter-generational
transmission of poverty (35), prevents children
from disadvantaged areas or families from
reaching their full potential. Some social measures
for pre-school and school-aged children have been
introduced, but their take-up is low and
kindergarten places face shortages. Rural areas are
particularly affected by inequality of opportunity
due to poor infrastructure, insufficient employment
opportunities and inexistent or poor quality public
services (European Commission, 2016a).
Poverty and social exclusion
Despite economic growth, poverty and social
exclusion increased after a four-year decline.
The increase in poverty and social exclusion in
2016 is driven by the fact that the disposable
income for the bottom 10 % did not increase,
unlike for the rest of households. The in-work
poverty rate is one of the highest in the EU, at
18.9 %, twice the EU average, reflecting the large
(35) Child poverty is correlated with parental education levels,
with 63.2 % of children of low-skilled workers at risk of
poverty against only 6.7 % of children from high-skilled
families.

3.3. Labour market, education and social policies
27
percentage of individuals who have near-zero
monetary earnings despite working full time,
especially in subsistence and semi-subsistence
agriculture. The risk of poverty or social exclusion
is the highest for young people, families with
children, Roma, people with disabilities, the rural
population and inactive people (European
Commission, 2017a, FRA 2016). Women are more
exposed to poverty due to shorter careers, lower
retirement age and lower pension contributions.
Rural residents face twice the risk of poverty or
social exclusion compared to people living in cities
(Graph 3.3.2).
Graph 3.3.2: People at risk of poverty or social exclusion
by degree of urbanisation
Source: European Commission
Housing deprivation and exclusion affect large
parts of the population. A large share of the
population faces severe housing deprivation
(19.8 % versus 4.9 % in the EU). The figure is also
high for children. Housing cost overburden, though
decreasing, remains an issue, with one in eight
households allocating more than 40 % of their
income to housing costs in 2016. Housing
overcrowding is well above the EU average,
especially for Romanians in monetary poverty.
Roma face multiple disadvantages. Compared to
the rest of the population they are confronted with
very high inequality of opportunity and poverty
rates, low employment, poor educational
attainment, low health coverage and adverse
housing conditions (European Commission
2017a). Residential segregation, forced evictions
and discrimination at work persist. While the
specific bodies dealing with Roma show more
commitment, their impact depends on the work of
other institutions. Measures addressing Roma
inclusion are mainly supported by externally-
funded projects. A good part of them are only just
starting.
People with disabilities and children face a
higher risk of poverty. Many people with
disabilities leave school early and few reach
tertiary education, which reduces their
employability. Their situation is worsened by the
absence of targeted employment services and the
uneven availability of vocational counsellors and
job coaches. Child poverty is among the
highest (36) in the EU and rising, also due to the
low effectiveness of the family benefit system and
limited integrated measures to address the
situation.
Access to social protection is limited, in
particular for workers without a standard
employment contract, and for many self-
employed. High poverty incidence is driven by
unemployment, inactivity and unequal access to
services and social protection. Most recipients of
social assistance are poorly educated and live in
rural or remote areas, where jobs and access to
services are very limited. More than half of the
rural population employed in subsistence
agriculture is not covered by pensions or
unemployment insurance and many do not have
health insurance. Casual and seasonal workers are
not covered by mandatory healthcare insurance
and have less access to parental leaves. The risk of
poverty for the self-employed is more than ten
times higher than for employees. Part-time
workers, more than half of which are in
involuntary part-time (59.4 %, against an EU
average of 15.3 %), also face a very high risk of
poverty.
Unemployment benefits are very low. They have
a very low and decreasing coverage and strict
eligibility criteria (37). The coverage rate for the
short-term unemployed has decreased from 2013
to 2016, to around 10 % (38). The adequacy of
benefits is low and has been declining markedly
(36) One in two Romanian children is at risk of poverty or
social exclusion.
(37) According to the results of the benchmarking exercise on
unemployment benefits carried out by EU advisory
committee the Employment Committee (EMCO).
(38) Based on Eurostat data.
0
10
20
30
40
50
60
07 08 09 10 11 12 13 14 15 16
%
Cities Towns and suburbs Rural areas

3.3. Labour market, education and social policies
28
since 2010. The net replacement rate for a worker
at the average wage declined from 45 % to 30 % in
2016. With RON 500 per month, the Social
Reference Index on which unemployment benefits
are calculated is well below the minimum wage; it
has not been indexed since its introduction in
2008.
Social service provision remains fragmented
and increasingly dependent on the financial
capacity of municipalities. There is little
coordination in the provision of services between
national, local, public and private bodies and the
coverage of social services is limited, especially in
rural areas. Some services, such as long-term care
or counselling are mainly provided in big cities.
Staffing levels vary greatly between big cities and
rural communities, with many municipalities not
having a social assistant. Social and employment
services are not systematically linked (39) and
ALMPs are not tailored to the individual needs of
social assistance beneficiaries (see Section 3.4.5).
A pilot project aiming to introduce integrated
services in over 100 marginalised communities is
advancing at a slow pace, despite long standing
discussions.
Despite several years of preparation, the
implementation of the Minimum Inclusion
Income Law was again delayed. The current
minimum income is one of the lowest in the
EU not only in absolute terms but also as measured
by its distance to both poverty line and low wage
earners, with social assistance spending equally
low. The Minimum Inclusion Income law will
increase adequacy and coverage, but its long-
awaited entry into force, initially scheduled for
April 2018, was postponed by one more year, with
negative effects on poverty and social exclusion.
Education and skills
The weak performance of the education and
training system will limit growth prospects in
the long run. Persistently high early school
leaving rates (Graph 3.3.3), unequal access to
quality education and large shortcomings in
student performance, as measured by basic skills
performance, point to a large unused human capital
(39) Despite the transposition of the Council Recommendation
2016/67/C of 15 February 2016 on the integration of the
long-term unemployed into the labour market.
potential. Vocational education and training is not
well linked to labour market needs. These factors
will translate into lost growth opportunities if left
unaddressed, and assuming the countryʼs negative
demographics are not reversed (see also Box
3.3.2).
External school and higher education
evaluation face continued challenges. Quality
assurance in school education remains largely
focused on compliance, due to fragmentation and
overlaps in responsibilities. Mechanisms to support
school improvement and development are
relatively weak (OECD, 2017a), despite the recent
efforts to make better use of quality assurance
findings. The quality assurance body for pre-
university education cannot make
recommendations to support schools, while school
inspectorates’ tasks mostly relate to compliance
with regulations. Despite recent efforts by the
quality assurance body in higher education to
improve external evaluation and standards for
bachelor, master’s and doctoral programmes,
fostering excellence in higher education remains a
significant challenge.
Rural-urban disparities, Roma exclusion and
inequality in education often overlap. Schools in
rural areas are less likely to provide quality
education compared to urban schools (40). The gap
in underperformance between advantaged and
disadvantaged students is one of the highest in the
EU (36.9 pps in science compared to 26.2 pps for
EU-28). Roma inclusion in education remains a
challenge with implications for social inclusion
and future employability (41). Segregation in
education, in particular due to residential
segregation, remains a challenge.
(40) In 2016, 37.5 % of 8th grade students (i.e. in the final year
of lower-secondary education) in rural schools had poor
results at the national evaluation, compared to 15 % in
urban schools.
(41) According to Fundamental Rights Agency estimates, only
38 % of Roma children attend kindergarten and 77 % of
Roma aged 18-24 are early school leavers (FRA, 2016).

3.3. Labour market, education and social policies
29
Graph 3.3.3: Early school leaving rates
Source: European Commission
Inclusive education in the classroom requires
strengthening. Initial teacher education offers
insufficient training, especially on working with
students from disadvantaged backgrounds, Roma
and students with learning difficulties. Attracting
high-quality teachers to disadvantaged schools is a
persistent challenge. The current merit-based
allowance system is insufficiently geared towards
supporting work with students from disadvantaged
backgrounds.
Healthcare
The health status of the population has
improved, but remains below EU standards.
Despite recent improvements, life expectancy in
Romania is almost 6 years below the EU average.
Heart diseases and strokes, though decreasing,
remain the biggest contributors to mortality, while
the incidence of some forms of cancers has
increased sharply. Other major pressing challenges
are the declining rates of vaccination for children
and the high rate of tuberculosis and multidrug-
resistant tuberculosis cases. These in turn are
detrimental to childrenʼs development, workforce
employability and healthy ageing.
Low funding and inefficient use of public
resources limit health system effectiveness. Per
capita health spending is one of the lowest in the
EU (42). Over-reliance on hospital care to the
(42) EUR 814 in 2015, a third of the EU average. The annual
spending on health represents 4.9 % of GDP, half the EU
average of 9.9 % of GDP.
detriment of primary and community care points to
a misallocation of resources and limits access to
quality care (European Commission, 2017a). In
addition, Romania is confronted with a substantial
deficit of doctors and nurses. It is estimated that
since early 2000 around 24 000 Romanian doctors
and nurses have left the country (OECD, 2017b).
The government expects the salary increases in the
health sector in 2017-2018 to slow the emigration
of health professionals.
Health coverage is de facto not universal,
despite being a constitutional right. Social health
insurance covers only around 86 % of the
population, including those living abroad, with
limited access in rural areas and for vulnerable
sections of the population. Only half of the Roma
are estimated to be covered by public health
insurance (FRA, 2016). The uninsured are only
entitled to a minimum benefits package.
Accordingly, and despite the recent adoption of
legislation to regulate community healthcare, the
gap in unmet medical needs between the richest
and the poorest (6.5 %) remains one of the highest
in the EU. The main reasons for unmet needs are
costs (including informal payments) and distance.
Access to medicines is a major challenge,
although efforts are being made to improve the
situation. To improve access to innovative drugs,
the list of subsidised medicines has been
substantially amended by introducing over 100
new medicines since 2014. Nonetheless, efforts to
improve access to medicines are complicated by
concerns that the low prices of some medicines
compared to other EU countries may lead to
parallel exports, limiting availability within
Romania.
The ongoing implementation of the national
health strategy is marred by shifting priorities
and poor investment planning. Despite recent
progress in the preparation of EU-funded
investments in healthcare (e.g. the three regional
hospitals in Iasi, Cluj and Craiova), the preparation
of projects is significantly delayed, especially for
the shift towards outpatient care and community-
based services. The lack of clear political
commitment to the project and involvement in
overseeing it and the modest administrative
capacity of the Ministry of Health risk generating
further delays. A comprehensive human resources
strategy announced by the Ministry of Health in
0
5
10
15
20
25
30
35
07 08 09 10 11 12 13 14
%
Total Cities Towns and suburbs Rural

3.3. Labour market, education and social policies
30
December 2016 is still pending (European
Commission, 2017a).
Graph 3.3.4: Proportion of people with health insurance,
registered with a family practitioner
Source: Casa Naţională de Asigurări de Sănătate
(Romaniaʼs national health insurance office)
Romania ranks high in perceived levels of
healthcare corruption (43
). Corruption in
(43) According to a 2017 Eurobarometer survey, 19 % of
respondents say that upon visiting a public healthcare
practitioner or institution the past year they had to make an
healthcare covers a broad spectrum: the
widespread practice of informal payments, the
occurrence of double practice in public and private
clinics, as well as corruption in the procurement of
medical devices, authorisation and procurement of
pharmaceuticals, in the appointment of hospital
managers or Ministry of Health officials, and
within the healthcare educational system. In this
context, concerns remain as to whether the public
procurement procedures for the construction of the
three regional hospitals will be transparent and
effective (European Commission, 2017b).
extra payment on top of the standard fees. Despite an
improvement compared to the previous survey, the figure
remains one of the highest in the EU (EU average: 4 %). 0
10
20
30
40
50
60
70
80
90
100
2012 2013 2014 2015 2016
%
Urban Rural Total
3.3. Labour market, education and social policies
31
Box 3.3.2: Main challenges for the education system as a driver of growth in Romania
Investment in education is low and lacks appropriate mechanisms to support disadvantaged
schools. General government expenditure on education as a percentage of GDP is one of the
lowest in the EU (3.1 % versus 4.9 % in 2015) and is the third lowest as a proportion of total
government expenditure (8.6 % compared to 10.3 % in 2015). Expenditure per student in public
and private institutions is also among the lowest in the EU for all levels of education. This
underfunding poses a large financial burden to Romanian households (1). There are no targeted
programmes to channel additional resources to disadvantaged schools, while correction
coefficients remain insufficient, despite a recent increase in the standard cost per student. The
amendments to the Fiscal Code may result in the inequalities in local budgets financing school
infrastructure getting worse. Capacities to develop and implement evidence-based policies and
programmes require strengthening.
Human capital does not appear to sufficiently meet the needs of a competitive labour
market. In 2016, 23.6 % of the population aged 25-34 had less than lower secondary education
compared to an EU average of 16.6 %. Early school leaving, although decreasing (2), is still high.
It remains a challenge due to high drop-out rates. The OECD Programme for International
Student Assessment (PISA) found that one in four students is a low achiever in all three subjects
tested (European Commission 2017d). Achieving excellence in school education adds to the
challenge: the proportion of students who demonstrate complex problems solving abilities is low
(2 % in reading, 3.3 % in mathematics and 0.7 % in science).The design of second chance
programme lacks sufficient flexibility for adult learners while accessibility in rural areas is
particularly difficult.
The link of education to the labour market remains weak, despite recent measures. Tertiary
education is confronted with one of the lowest attainment rates in the EU (3). Adult participation
in learning remains very low, particularly for the low skilled, despite the need for upskilling
(1.2 % in 2016 compared to EU-28: 10.8 %). The fragmented system of adult learning lacks a
coordinating body, resulting in limited capacity in the implementation of strategic documents.
Weak skills governance, including on tracking of graduates, hamper evidence-based decision
making. This also impedes on the effective delivery of the Upskilling Pathways Council
Recommendation.
Despite recent measures, the quality and labour market relevance of vocational education
and training (VET) remain largely insufficient. The attractiveness of VET as a career choice
and not mainly as a ‘second choice’ option remains rather limited. The employment rate of recent
VET graduates remains below the EU average (63.3 % vs 75 % in 2016). Despite continued
reforms, especially on dual VET, several challenges remain to be addressed. An integrated and
robust system of feedback from employers about the relevance of qualifications is yet to be
established. Guidance and counselling services are still under-developed. The alignment between
VET and second chance programmes is insufficient as is the provision of alternative pathways.
Access to continuing VET learning programmes is hampered by entry requirements linked to the
completion of lower secondary education.
(1) The ratio of household expenditure on education as a proportion of public expenditure equals 39 % for Romania
against an EU average of 13 % (Eurostat data, 2015).
(2) From 19.1 % in 2015 to18.5 % in 2016 (% of population aged 18-24)
(3) 25.6 % in Romania vs. 39.1 % in EU-28 for people aged 30 to 34 (Eurostat data 2016)

32
3.4.1. EXTERNAL COMPETITIVENESS
Romaniaʼs net international investment
position (NIIP) has continued to improve. The
NIIP reached -49.9 % of GDP in 2016, almost 5
percentage points above the 2015 level (Graph
3.4.1). This decrease has taken place despite the
widening current account deficit and is mainly due
to strong GDP growth. Foreign direct investment
(FDI) has remained broadly stable as a share of
GDP, while the share of other foreign liabilities
declined as Romania repays its external debt, a
trend which is expected to continue.
Graph 3.4.1: Net international investment position
(1) Merged BPM5/BPM6-ESA 2010 data.
Source: European Commission
The trend for FDI flows continues to be volatile.
After increasing by almost 50 % in 2016, FDI
inflows declined in 2017. In the first 11 months of
2017, FDI inflows were around 9 % lower than in
the same period of 2016 (Graph 3.4.2). However,
FDI in equity and reinvested earnings increased
substantially, with the entire fall in FDI accounted
for by debt instruments (intercompany loans). The
main sources of FDI inflows into Romania in the
first three quarters of 2017 were Cyprus,
Luxembourg, the Netherlands, Germany and
France.
The current account balance has been
worsening recently. Despite increasing export
market shares (see below), the growth of exports
was outpaced by that of imports. In the first 10
months of 2017, imports of consumer goods,
intermediate goods, and capital goods all increased
by double digit rates. The balance of trade
services, driven mainly by exports of
transportation and IT services, remained positive
but did not offset the negative and widening deficit
in the trade of goods. The balance of primary
incomes remained negative, reflecting mainly the
outflow of investment income linked to the
countryʼs negative NIIP. The balance of secondary
income, which consists mainly of remittances,
continues to be positive but was outweighed by the
negative balance of primary income. Overall, the
current account deficit is estimated to have
increased to around 3 % of GDP in 2017.
Graph 3.4.2: FDI flows by investment type
Source: European Commission
Unit labour costs (ULC) further increased in
2017 as the growth of compensation to
employees outpaced that of productivity.
Productivity convergence has been substantial over
the past two decades. Labour productivity per hour
worked increased from 22 % of the EU-28 average
in 2000 to approximately 54 % in 2015. However,
productivity levels continue to be the second
lowest in the EU. The increase in real
compensation per employee (27.8 %) was broadly
in line with that of labour productivity (25.6 %)
between 2011 and 2016. In 2017, the growth of
real compensation per employee is estimated to
have been more than double that of productivity
(Graph 3.4.3). With Romaniaʼs nominal exchange
rate broadly stable, the rise in unit labour costs has
also been reflected in a real exchange rate
appreciation. The real effective exchange rate, as
deflated by unit labour costs has appreciated by
around 7.8 % between Q1-2016 and Q3-2017.
-100
-80
-60
-40
-20
0
20
00' 01' 02' 03' 04' 05 06 07 08 09 10 11 12 13 14 15 16
% o
f G
DP
Net portfolio invest., equity and invest. fund shares/units
Net portfolio invest., debt securities
Other invest. (net)
Net direct invest.
Net financial derivatives
Net int'l investment position
Marketable debt (NIIP minus FDI and shares)
-2000
-1500
-1000
-500
0
500
1000
1500
2000
2500
3000
10Q3 11Q3 12Q3 13Q3 14Q3 15Q3 16Q3 17Q3
Mn E
UR
s
Debt instruments (FDI)
Equity and investment fund shares/units - other than reinvestment of earnings
Equity and investment fund shares/units - reinvestment of earnings
Total FDI inflows
3.4. INVESTMENT

3.4. Investment
33
Graph 3.4.3: Nominal unit labour cost, growth breakdown
Source: European Commission
Non-cost competitiveness has improved.
Between 2011 and 2016 the share of top quality
products in total export values increased by almost
50 %. Over the same period, the value share of
low-quality products diminished substantially
(Graph 3.4.4). Quality gains took place across
Romaniaʼs main export industries but were most
conspicuous for computer, electronic and optical
products.
Graph 3.4.4: Share of export value by quality category, in
manufacturing
(1) A rank of 1 reflects the highest quality in the EU market
for a particular 'country of origin-product', while 0
corresponds to the lowest quality (manufacturing exports
to the EU-28 are proxied by EU-28 imports)
Source: European Commission based on Comext and Orbis
Export performance has been relatively strong
in recent years. Between 2000 and 2016 export
market shares increased almost fourfold, reflecting
the contained evolution of unit labour costs after
the crisis. Since 2016, however, unit labour costs
began to increase as the growth in workersʼ
compensation raced ahead of growth in
productivity (see below). A continuation of this
trend could threaten further increases in export
market shares, unless accompanied by structural
reforms sustaining a transition to higher value-
added products, integration in global value chains
and access to new export markets .
Graph 3.4.5: Export market share by industry
(1) IS stands for Romania’s initial sectoral specialisation,
while MSG (market share gain) captures how successful
Romania has been in gaining market shares on average
across export products.
Source: European Commission
Export market share gains in 2016 came mainly
from traditional export industries. The chief
export industry, machinery and equipment,
accounted for almost half of the increase in export
market shares of goods in 2016 (Graph 3.4.5).
Substantial gains also came from the vehicle
industry, Romaniaʼs third largest industry in terms
of share of exports. These gains came almost
entirely from market share gains within these
industries rather than from the sectors' global trade
dynamism. Export market shares in services
continued to expand as well, with most gains
coming from transport and telecommunications,
computers and information services.
-30
-20
-10
0
10
20
30
40
02 03 04 05 06 07 08 09 10 11 12 13 14 15 16 17* 18* 19*
y-o
-y %
change
Inflation (GDP deflator growth)Real Compensation per EmployeeProductivity Contribution (negative sign)Nominal unit labour costULC in Euro Area
0,00
0,10
0,20
0,30
0,40
bottom(0.0 - 0.2)
low(0.2 - 0.4)
middle(0.4 - 0.6)
high(0.6 - 0.8)
top quality(0.8 - 1.0)
2011 2016
-15%
-10%
-5%
0%
5%
10%
15%
05 06 07 08 09 10 11 12 13 14 15 16
IS - other sectorsMSG - Vehicles, Aircraft, VesselsIS - Machinery & ElectricalMSG - other sectorsMSG - Vehicles, Aircraft, VesselsMSG - Machinery & ElectricalTotal Market Share Change

3.4. Investment
34
Graph 3.4.6: Export market share by country
(1) The size of the bubbles indicates the weight of the trade
partner in Romaniaʼs total exports
ʼMarket dynamismʼ stands for the difference between the
annualised growth rates of world imports per geographical
market and global world imports.
ʼCompetitivenessʼ stands for the difference between the
annualised growth rates of Romaniaʼs exports per market
and world imports per market.
Source: European Commission
Geographically, the strong trade performance
since 2011 is mainly due to market share gains
in western Europe. Romaniaʼs chief export
destinations between 2011 and 2016 were
Germany, Italy and France. Over this period,
Romania gained market shares in all three
countries. Trade with each of them had a positive
contribution to Romaniaʼs global export market
share even though all three of them have seen their
share of global imports declining (Graph 3.4.6).
Romania has captured an increasing part of
trade related to EU production chains. The
Romanian economy continues to benefit from its
strong integration in EU value chains (44). An
increasing specialisation in regional European
value chains has enabled Romania to respond to
the shift in global demand to emerging economies.
This development is in contrast with the general
trend. Since 2011, global value chain trade
intensity has continued to grow and now accounts
for more than half of all value chain trade, while
the share of regional value chain trade has
(44) The main immediate production partners of Romania in
regional EU value chains that together account for more
than 70 % of Romanian regional value chain trade are:
Germany (28.9 % of regional value chain trade), Italy
(11.0 %), Hungary (9.2 %), France, Austria (7.2 % each)
and Belgium (6.6 %). Immediate production relations with
the UK are limited (1.8 %).
declined. The pattern for Romania is the opposite
as it is the share of regional value chain integration
that has continued to grow more strongly,
particularly in manufacturing and business services
(Graph 3.4.7).
Graph 3.4.7: Changes in regional and global value chain
trade
(1) RVC/GVC indicate the share of regional EU value chain
trade (RVC) and global value chain trade (GVC),
respectively, as a % of total value added trade in the total
economy
Source: Stehrer et al. (2017) based on World Input-Output
Databse release 2016
3.4.2. PUBLIC INVESTMENT AND
INFRASTRUCTURE
Investment spending needs improved efficiency
to deliver results. Investment has been robust over
the past decade and particularly after EU
accession, when the country became one of the
main beneficiaries of EU structural and cohesion
funds. However, high inefficiencies in public
investment management translated into sluggish
EU funds absorption and prevented the country
from reaping the full benefits of its increased
capital spending and from improving the quality of
its infrastructure.
High public investment spending is
accompanied by insufficient infrastructure.
Romania had one of the highest public investment
rates in the EU over the past decade. This would
suggest a corresponding supply of physical
infrastructure. However, recent achievements
under the National Local Development Programme
notwithstanding, the discrepancy between inputs
Germany
Italy
France
Hungary
UK
Bulgaria
Turkey
Spain
Poland
Czech Rep.
-4
-3
-2
-1
0
1
2
3
-15 -10 -5 0 5 10 15
Mark
et D
ynam
ism
(pps)
Competitiveness (pps)
8,0%
9,0%
10,0%
11,0%
12,0%
13,0%
14,0%
15,0%
16,0%
00 01 02 03 04 05 06 07 08 09 10 11 12 13 14
RO (GVC) RO (RVC) EU (GVC) EU (RVC)
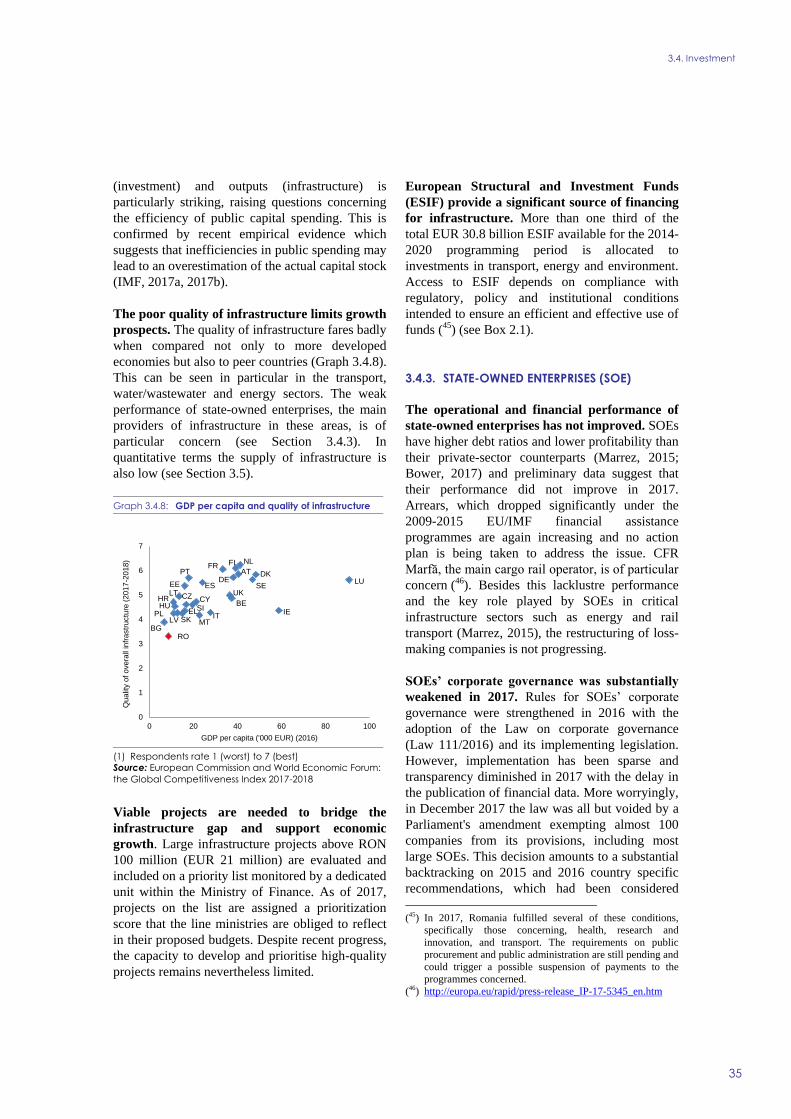
3.4. Investment
35
(investment) and outputs (infrastructure) is
particularly striking, raising questions concerning
the efficiency of public capital spending. This is
confirmed by recent empirical evidence which
suggests that inefficiencies in public spending may
lead to an overestimation of the actual capital stock
(IMF, 2017a, 2017b).
The poor quality of infrastructure limits growth
prospects. The quality of infrastructure fares badly
when compared not only to more developed
economies but also to peer countries (Graph 3.4.8).
This can be seen in particular in the transport,
water/wastewater and energy sectors. The weak
performance of state-owned enterprises, the main
providers of infrastructure in these areas, is of
particular concern (see Section 3.4.3). In
quantitative terms the supply of infrastructure is
also low (see Section 3.5).
Graph 3.4.8: GDP per capita and quality of infrastructure
(1) Respondents rate 1 (worst) to 7 (best)
Source: European Commission and World Economic Forum:
the Global Competitiveness Index 2017-2018
Viable projects are needed to bridge the
infrastructure gap and support economic
growth. Large infrastructure projects above RON
100 million (EUR 21 million) are evaluated and
included on a priority list monitored by a dedicated
unit within the Ministry of Finance. As of 2017,
projects on the list are assigned a prioritization
score that the line ministries are obliged to reflect
in their proposed budgets. Despite recent progress,
the capacity to develop and prioritise high-quality
projects remains nevertheless limited.
European Structural and Investment Funds
(ESIF) provide a significant source of financing
for infrastructure. More than one third of the
total EUR 30.8 billion ESIF available for the 2014-
2020 programming period is allocated to
investments in transport, energy and environment.
Access to ESIF depends on compliance with
regulatory, policy and institutional conditions
intended to ensure an efficient and effective use of
funds (45) (see Box 2.1).
3.4.3. STATE-OWNED ENTERPRISES (SOE)
The operational and financial performance of
state-owned enterprises has not improved. SOEs
have higher debt ratios and lower profitability than
their private-sector counterparts (Marrez, 2015;
Bower, 2017) and preliminary data suggest that
their performance did not improve in 2017.
Arrears, which dropped significantly under the
2009-2015 EU/IMF financial assistance
programmes are again increasing and no action
plan is being taken to address the issue. CFR
Marfă, the main cargo rail operator, is of particular
concern (46). Besides this lacklustre performance
and the key role played by SOEs in critical
infrastructure sectors such as energy and rail
transport (Marrez, 2015), the restructuring of loss-
making companies is not progressing.
SOEsʼ corporate governance was substantially
weakened in 2017. Rules for SOEsʼ corporate
governance were strengthened in 2016 with the
adoption of the Law on corporate governance
(Law 111/2016) and its implementing legislation.
However, implementation has been sparse and
transparency diminished in 2017 with the delay in
the publication of financial data. More worryingly,
in December 2017 the law was all but voided by a
Parliament's amendment exempting almost 100
companies from its provisions, including most
large SOEs. This decision amounts to a substantial
backtracking on 2015 and 2016 country specific
recommendations, which had been considered
(45) In 2017, Romania fulfilled several of these conditions,
specifically those concerning, health, research and
innovation, and transport. The requirements on public
procurement and public administration are still pending and
could trigger a possible suspension of payments to the
programmes concerned.
(46) http://europa.eu/rapid/press-release_IP-17-5345_en.htm
BE
BG
CZ
DKDE
EE
IEEL
ES
FR
HR
IT
CY
LV
LT
LU
HU
MT
NL
AT
PL
PT
RO
SI
SK
FI
SEUK
0
1
2
3
4
5
6
7
0 20 40 60 80 100
Qualit
y o
f overa
ll in
frastr
uctu
re (
2017
-2018)
GDP per capita ('000 EUR) (2016)

3.4. Investment
36
fulfilled by the European Commission (European
Commission, 2016a, 2017a) (47).
Some of the most profitable SOEs may be
transferred to a new Sovereign Development
and Investment Fund. A draft law for the
creation of a Sovereign Development and
Investment Fund (FSDI) was put under public
consultation in summer 2017. It has not yet been
adopted by the government, but a legislative
proposal substantially drawing on the
government's draft was submitted to the Senate by
a group of parliamentarians, kicking off the
legislative process. According to the draft law, the
Fund would be set up as a joint-stock company and
would receive the state-owned shares of 27
profitable SOEs. The purpose of the Fund and its
investment strategy are only vaguely set out in the
draft law and it is unclear how the Fund would
address the main barriers to public investment in
Romania (see Box 3.4.1). Under the draft law the
Fund is exempted from Law 111/2016 on SOEsʼ
corporate governance. The draft law also generates
concerns about transparency of decision-making,
reporting and monitoring.
The fiscal risks generated by the new FSDI are
not yet known. The government has sought
Eurostatʼs opinion on the fiscal impact of the Fund
if created under the draft legislation submitted to
public consultation in August 2017. If the Fund is
classified outside the general government sector, it
would have a negative impact on the state budget
in 2018 and possibly beyond as the dividends of
the SOEs under the Fund would no longer go to
the state budget. According to the authorities, this
impact is temporary until the Fund starts
distributing dividends. Information available to
date does not allow, however, to assess the extent
and timing of a turnaround in the budgetary
impact. A broader concern is the implicit liability
to the state budget from its operations and from the
debt issued.
(47) The law will need to be reassessed by Parliament. On 13
February 2018, the Constitutional Court considered it
unconstitutional due to procedural and substantive
concerns.
3.4.4. BUSINESS ENVIRONMENT
Romania’s business environment is
deteriorating (Graph 3.4.9). Romania dropped
nine ranks in the World Bankʼs Doing Business
2018 report, down to 45th, (World Bank, 2017a),
while in the Global Competitiveness Report it
dropped from 62nd to 68th (World Economic
Forum, 2017). Performance remains particularly
poor in governance, labour force qualification,
infrastructure, health and education (see Sections
3.3, 3.4.2, 3.4.5). In this environment, more firms
expect a reduction of investment activity than an
expansion in the near future (European Investment
Bank, 2017).
At sub-national level the business environment
presents a more varied picture. Despite common
legislation and provision of guidance by the
National Trade Register Office, Romanian cities
display considerably uneven performance in a
number of areas, in particular on starting a
business, obtaining a permanent electricity
connection and enforcing contracts. Enforcing a
contract takes 15 months in Timisoara but 23
months in Brasov. The time required to start a
business varies between 12 days in Bucharest and
Oradea and 25 days in Craiova. Getting electricity
requires 173 days in Iasi and 209 days in
Constanta (World Bank, 2017b).
Graph 3.4.9: Ease of doing business
(1) Ranking: (1) easiest to (190) most difficult
Source: World Bank 2017
Insolvency laws and procedures remain
complex. Despite the availability of a simplified
bankruptcy and asset liquidation procedure,
0
40
80
120
160
Starting a Business
Dealing withConstruction
Permits
Getting Electricity
RegisteringProperty
Getting Credit
Protecting MinorityInvestors
Paying Taxes
Trading acrossBorders
EnforcingContracts
ResolvingInsolvency
Romania EU

3.4. Investment
37
companies in financial distress are often brought to
court by creditors, without the possibility of
recourse to reorganisation or repayment plans.
Notwithstanding the reform of the insolvency
framework in 2014, and while a majority of cases
under the simplified procedure can be solved in
less than a year, the "time required to resolve
insolvency" indicator has remained stable since
2008 at 3.3 years, one of the highest values in the
EU (European Commission, 2017e).
SMEs rely heavily on bank financing, which has
remained sluggish. Almost half of SME funding
was secured via credit lines and bank loans in Q2-
Q3 2017. After a significant drop over 2015-2016
to below 2 %, loan rejection rates increased to
18 % in 2017, a level last observed in 2009.
Moreover, 10 % of SMEs report not having
received the full loan requested (ECB, 2017).
Among non-financial companies, the level of non-
performing loans remains higher particularly for
micro-enterprises and SMEs (NBR, 2017).
Further measures are needed to support SMEʼs
entrepreneurial initiatives. Romanian SMEs
would benefit from increased capitalisation,
simplification of the insolvency framework and
mobilisation of additional private financing
supported by EU financial instruments. An
initiative signed by the Commission and the
European Investment Bank with Romania is
expected to generate some EUR 500 million in
new SME loans under favourable conditions.
In an increasingly dynamic start-up
ecosystem, scaling-up remains a challenge.
Increased public support through the Start-up
Nation programme notwithstanding (48), scaling-up
of existing companies is hampered by lack of clear
legislation, administrative burden, skill shortages
and low innovation (see Sections 3.3, 3.4.5 and
3.5). The share of high-growth businesses in
Romania is among the lowest in the EU. Start-up
entrepreneurs lack access to mentoring and school
curricula are not aligned to the needs of future
entrepreneurs.
(48) In 2017, 8 700 start-up projects were approved for funding
from this programme.
Judicial reform
Challenges to judicial independence are a
persistent source of concern (European
Commission, 2017k). Recurrent public criticism of
the judiciary and judicial decisions undermine
judicial independence and the trust in the justice
system. However, the Commissionʼs findings over
the last years, which have been supported by the
Council (49), have made a positive assessment of
the judicial system and the role of the magistracy
in pursuing reform (European Commission,
2017j).
The ongoing reform of the justice laws risks
undoing progress achieved in the last 10 years
and harming judicial independence. The three
justice laws, dating back to 2004, regulate: (i) the
status of judges and prosecutors; (ii) the
organisation and functioning of the courts and
prosecution offices; and (iii) the Superior Council
of Magistracy. The laws have a direct impact on
judicial independence and the justice system more
broadly. Some of the amendments adopted by
Parliament at the end of December 2017 touch
upon safeguards for judicial independence or
would affect the functioning of the judicial system.
These amendments to the justice laws went
through a fast-track procedure in Parliament, a
process at odds with the Commission's CVM
recommendation to have a transparent and
consensus-based legislative process and to respect
safeguards for the independence of the judiciary.
Moreover, the Commissionʼs recommendation to
consult the Venice Commission, an advisory body
of the Council of Europe, was not followed up. No
proper consideration was given to the opinion of
the Romanian magistracy, which, when consulted,
has twice rejected drafts of these amendments
citing concerns over judicial independence and
serious negative impact on the functioning of the
judicial system. Some of the amendments also
raise questions about whether the positive
assessment of Romania’s progress on ensuring the
independence of the judicial system would have to
be reconsidered (European Commission, 2017k).
The draft laws were referred to the Constitutional
(49) Council Conclusions on the Cooperation and Verification
Mechanism (CVM) reports — March 2017 available at
https://ec.europa.eu/info/files/council-conclusions-7-
march-2017_en and December 2017 available at:
https://ec.europa.eu/info/files/council-conclusions-12-
december-2017_en

3.4. Investment
38
Court. The Court ruled unconstitutional a series of
provisions. The laws therefore will need to be
reconsidered in Parliament.
An action plan for the enforcement of court
decisions is lacking concrete solutions and a
timetable, and its implantation is slow. At the
end of August, Romania updated the 2016 action
plan it prepared for the Council of Europe in order
to address structural problems over the non-
enforcement of court decisions against the State
identified by European Court of Human
Rights (50). The implementation of the action plan
requires concrete solutions and a detailed timetable
to address the problems identified.
Corruption
Corruption persists at all levels and remains an
obstacle for doing business. Corruption is widely
acknowledged as a major issue in Romania, as
shown regularly in perception surveys. Corruption
and governance issues in the public sector are
among the top challenges for the business
environment, holding back growth (World
Economic Forum, 2017). In 2017, corruption as
well as patronage and nepotism are identified as
obstacles to doing business in Romania by 85 %
and 82 % of businesses respectively (EU averages:
37 % and 38 % respectively). 86 % of companies
think that bribery and the use of connections is
often the easiest way to obtain certain public
services (an increase of 10 pps compared to 2015,
EU average: 60 %) while 70 % think that the only
way to succeed in business is to have political
connections (an increase of 22 pps compared to
2015, EU average: 42 %) (European Commission,
2017f).
The fight against corruption continued but has
faced increased pressure throughout the past
year. Romania has a solid anti-corruption legal
framework and the track record of the judicial
institutions fighting corruption was maintained in
2017. However, the judicial institutions and the
legal framework for fighting corruption crimes are
facing intense pressure. Several legislative
amendments under debate in Parliament raise
(50) Action plan of structural measures in relation to the
Săcăleanu group of cases (73970/01)
http://hudoc.exec.coe.int/eng#{"EXECDocumentTypeColl
ection":["CEC"]}
serious concerns over the ability of the judicial
institutions to effectively continue the fight against
corruption.
The implementation of the national anti-
corruption strategy has kicked off at technical
level, but tangible political support is needed to
demonstrate progress (European Commission,
2017k). The 2016-2020 national anti-corruption
strategy, for central and local public institutions
has the potential to be an effective corruption
prevention policy if properly implemented and
followed up on the ground. At technical level,
implementation started with the drafting of
integrity plans in each public institution and the
establishment of the first peer-review monitoring
cycle. A high number of public institutions,
including state-owned enterprises, are participating
in the anti-corruption strategy. The first reporting
on the implementation of the measures will take
place at the beginning of 2018. Visible progress
would help bring effective results in corruption
prevention and reduce corruption prevalence. To
encourage public bodies to devote time and
resources to anti-corruption work, the strategy now
needs visible political support from the
government, the ministers responsible for central
and public administration, ministers in key sectors
such as education or health and local authorities.
3.4.5. PUBLIC ADMINISTRATION
Human resources
The human resources management reform has
yet to produce results. The draft legislation is
aligned with the strategy for civil servants. The
government reconfirmed its commitment to
implementing the key points of the reform and a
project was recently signed with World Bank,
which should enable the relevant authorities to
start implementation. First results of the project
will be available by mid-2019. So far, there has
been no progress on integrating databases of
employees in the public administration.
The Unified Wage Law does not include a
proper pay for performance system and is not
achieving wage equity, as provided for in the

3.4. Investment
39
relevant strategy. (51) The new legislative
framework aims to create a unified wage grid and
thus improve transparency and quality of services.
However, it appears to only reduce discrepancies
within sectors rather than between sectors for
similar functions. Moreover, at the local
administration level, there is a high risk that wages
will vary significantly between municipalities, for
similar functions. This will impact staff mobility
and could generate under-staffing in some sectors
or municipalities.
Policy-making process
A culture of transparency and participative
government at national and local level is not
well established. Despite the acceleration of
reform in this area, difficulties remain over
streamlining and implementing transparency
measures across all levels of administration.
Factors slowing down reform are insufficient
administrative capacity and weak political support
for improving the quality and impact of the public
consultation process. Also, the mechanism for
addressing the observations received during public
consultations does not ensure proper follow-up of
stakeholdersʼ opinions. This has a negative impact
on the business environment and citizens’
perception and trust.
Setting up an effective framework for strategic
and budgetary planning remains a challenge. A
recent legislative initiative proposing an updated
methodology for strategic planning could help
create a more effective and coherent
mechanism (52). The main novelty is the link
between the strategic plans of each public
institution and the annual budgetary process, with
an increased focus on implementing the annual
operational plans. An integrated calendar for
strategic planning, clear responsibilities and a
mechanism for performance monitoring are also
proposed. This should help increase the quality of
the decision-making process.
Regulatory impact assessment is not
systematically and adequately used. Political
will to enforce appropriate use of the existing tools
(51) The Unified Wage Law allows public institutions to reward
their employees for performance, but this is limited to 5 %
of wage expenditures, and can be granted in a discretionary
way.
(52) Government Emergency Ordinance 49/2017.
in the legislative process remains below
expectations. The government General Secretariat
continues to have a limited role in the quality
control of policy design. Explanatory memoranda
accompanying new legislative initiatives are vague
and not based on thorough impact assessments or
stakeholder consultation. Romania is among the
bottom-ranked OECD/EU countries (36 out of 41)
on executive capacity (Bertelsmann Stiftung,
2017).
Public service delivery
The quality of public services, especially at local
level, remains unsatisfactory. In a recent survey,
only 27 % of respondents rated the quality of
public services provided as good while 70 % took
the opposite view. Funding availability for
decentralised services remains the core issue.
Other factors include weak administrative capacity
of local administrations, unavailability of services
in poor or remote areas, lack of skilled personnel
and fragmentation of services offered.
In a context of decentralisation, the financial
capacity of municipalities is increasingly
important. Public and private social service
providers often compete for public funding which
has been drastically reduced for private operators.
Limiting the income tax deductions for
sponsorships also negatively impacts on private
sources of financing. Local budgetsʼ low ability to
generate their own resources perpetuates their
dependence on transfers from the state budget for
more than 50 % of their funding. The framework
and mechanisms for ensuring stability and
predictability of income sources for administrative
units are being developed. These include quality
and control standards for services to be
decentralised, with results expected for 2019.
Unequal access to basic public services and
uneven service provision could worsen. The gap
between the quality of services provided in
wealthy municipalities compared with poor
municipalities could widen further following
several measures adopted in 2017 (53). The
(53) Reduction of the income tax from 16 % to 10 % with no
clear compensatory measures for the local budgets
(Emergency Ordinance 79/2017); differences in wages for
staff in local public administration, encouraging staff
mobility towards wealthier municipalities and further
weakening the administrative capacity of poor
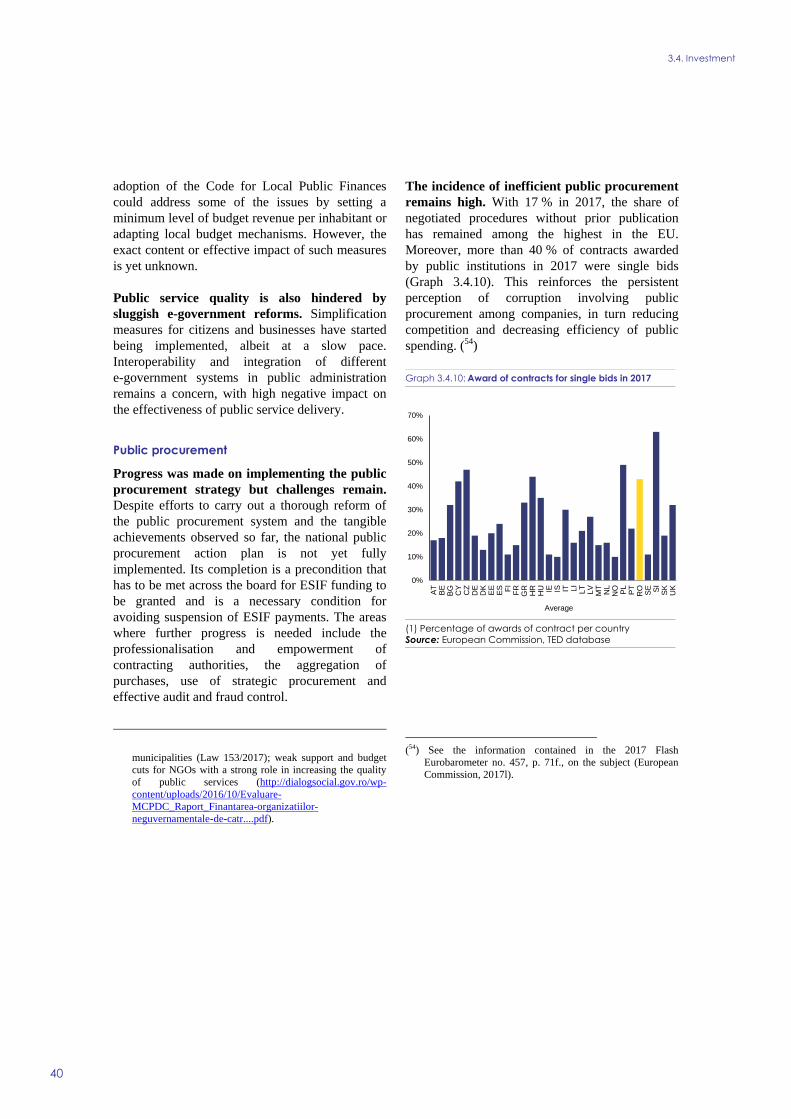
3.4. Investment
40
adoption of the Code for Local Public Finances
could address some of the issues by setting a
minimum level of budget revenue per inhabitant or
adapting local budget mechanisms. However, the
exact content or effective impact of such measures
is yet unknown.
Public service quality is also hindered by
sluggish e-government reforms. Simplification
measures for citizens and businesses have started
being implemented, albeit at a slow pace.
Interoperability and integration of different
e-government systems in public administration
remains a concern, with high negative impact on
the effectiveness of public service delivery.
Public procurement
Progress was made on implementing the public
procurement strategy but challenges remain.
Despite efforts to carry out a thorough reform of
the public procurement system and the tangible
achievements observed so far, the national public
procurement action plan is not yet fully
implemented. Its completion is a precondition that
has to be met across the board for ESIF funding to
be granted and is a necessary condition for
avoiding suspension of ESIF payments. The areas
where further progress is needed include the
professionalisation and empowerment of
contracting authorities, the aggregation of
purchases, use of strategic procurement and
effective audit and fraud control.
municipalities (Law 153/2017); weak support and budget
cuts for NGOs with a strong role in increasing the quality
of public services (http://dialogsocial.gov.ro/wp-
content/uploads/2016/10/Evaluare-
MCPDC_Raport_Finantarea-organizatiilor-
neguvernamentale-de-catr....pdf).
The incidence of inefficient public procurement
remains high. With 17 % in 2017, the share of
negotiated procedures without prior publication
has remained among the highest in the EU.
Moreover, more than 40 % of contracts awarded
by public institutions in 2017 were single bids
(Graph 3.4.10). This reinforces the persistent
perception of corruption involving public
procurement among companies, in turn reducing
competition and decreasing efficiency of public
spending. (54)
Graph 3.4.10: Award of contracts for single bids in 2017
(1) Percentage of awards of contract per country
Source: European Commission, TED database
(54) See the information contained in the 2017 Flash
Eurobarometer no. 457, p. 71f., on the subject (European
Commission, 2017l).
0%
10%
20%
30%
40%
50%
60%
70%
AT
BE
BG
CY
CZ
DE
DK
EE
ES FI
FR
GR
HR
HU IE IS IT LI
LT
LV
MT
NL
NO PL
PT
RO
SE SI
SK
UK
Average

3.4. Investment
41
Box 3.4.1: Investment challenges and reforms in Romania
Macroeconomic perspective
While Romania continues to have one of the highest investment ratios in the EU, the performance of
investment since the crisis has been volatile. An acceleration of investment in 2015 was followed by a
contraction in 2016 as public investment fell due to a slow uptake of projects financed by EU funds under
the 2014-2020 programming period. Investment grew again in 2017 on account of a pickup in private
investment, mainly in the construction sector. Public investment, however, declined for the second year in a
row. Investment is expected to strengthen in the future as private investment growth remains steady and
public investment recovers as the absorption of EU funds improves.
Assessment of barriers to investment and ongoing reforms
The overall business environment presents challenges hampering investment (European Commission,
2015b). These include continued political uncertainty and unpredictability of new policies. Some appropriate
measures have been taken, but many barriers remain to be addressed to lift growth and accelerate
convergence (see Sections 3.3-3.5).
Main barriers to investment and priority actions under way
1. Despite relatively high public investment spending, the low quality of infrastructure is holding back
investment. The development of quality infrastructure is being held back by: (i) comparatively low
absorption of EU funds; (ii) remaining inefficiencies in project preparation, prioritisation and
implementation; and (iii) limited efficiency and the recent weakening of corporate governance law
applicable to state-owned enterprises. The adoption of the transport master plan in 2016 was an important
step in the direction of improving strategic investments in road infrastructure but progress so far remains
slow.
2. Inadequate labour supply weighs on investment. Persistent labour emigration and shortages, skill gaps and
mismatches, low business innovation, lack of basic digital skills in large parts of the workforce reduce the
supply of skilled workers, which affects investment decisions.
3. Poor governance and inefficient public administration continue to hamper the business environment.
Investment can be held back by the continuing regulatory and administrative burden, inefficiencies in public
administration and public procurement, lack of predictability of legislation and lack of timely and effective
stakeholder consultation.
Regulatory/ administrative burden GROW Financial Taxation CSR
Public administration CSR EMPLSector / Taxation Access to finance
Public procurement /PPPs CSR EMPL Cooperation btw academia, research and business
Judicial system JUST Financing of R&D&I
Insolvency framework JUST Business services / Regulated professions
Competition and regulatory framework GROW Retail
EPL & framework for labour contracts EMPL? Construction
Wages & wage setting CSR EMPL Digital Economy / Telecom
Education CSR EAC/EMPL Energy
Transport
No barrier to investment identified Some progress
CSR Investment barriers that are also subject to a CSR Substantial progress
No progress Fully addressedLimited progress
Public
administration
/ Business
environment
Labour
market/
Education
Sector specific
regulation
R&D&I

42
RESEARCH AND INNOVATION (R&I)
The innovation performance shows no signs of
improvement, with consequences for growth
prospects. Romania is a modest innovator, scoring
below the EU average in all indicators analysed in
the European Innovation Scoreboard 2017 (55),
apart from broadband penetration. More
worryingly, Romania’s innovation performance
has deteriorated since 2011 in every region,
including the most dynamic ones (Graph 3.5.1).
Graph 3.5.1: Regional Innovation performance in Romania
Source: European Commission, Regional Innovation
Scoreboard 2017
R&D investment remains very low despite
recent improvements in the private sector. In
2016, R&D intensity (56) fell slightly to 0.48 % of
GDP, one of the lowest levels in the EU. Private
sector R&D intensity increased in 2016 (Graph
3.5.2), but was only partly offset by the fall in
public R&D expenditure. In the 2018 budget, the
R&D allocation was increased by about 15 %
compared to the budget executed in 2017.
(55) Innovation performance is measured by looking at a set of
27 indicators, including doctorate graduates, international
scientific co-publications, R&D expenditure, SME
innovation, medium- and high-tech product export
http://ec.europa.eu/growth/industry/innovation/facts-
figures/scoreboards_en
(56) Research and development (R&D) is the statistical proxy
for expenditure in the research and innovation system
(Eurostat). Intensity is measured as R&D expenditure as a
percentage of GDP.
Graph 3.5.2: Business R&D intensity, 2007 and 2016
Source: European Commission, Regional Innovation
Scoreboard 2017
Low and inefficient public R&D funding results
in a low-quality science base (57
). Inefficiencies
in funding are linked particularly to the high
fragmentation of the research and innovation
system and its lack of international openness. Only
46 % of Romanian publications are internationally
co-authored. Recent provisions adopted for the
evaluation process of R&D projects funded from
the national budget (58) will further reduce the
international openness of the R&D system.
The low quality of the science base acts as a
disincentive to private R&D investment. Despite
an economic structure favourable to R&D
activities (59), R&D business investment remains
modest. Knowledge transfer from public research
to businesses is limited. In 2016 the government
adopted several measures to stimulate private
R&D investment (60). While their impact is
(57) Measured as the share of Romanian scientific publications
ranked among the top 10 % most-cited worldwide
publications.
(58) In March 2017, the Minister for Research and Innovation
adopted new rules for the evaluation of nationally funded
research projects, limiting the number of international
reviewers in the selection panels. Under the new rules, the
Romanian research and innovation executive agency has to
give priority to Romanian evaluators and rely on foreign
evaluators only as a last resort, when no Romanian
evaluators can be found in a specific field.
(59) Medium-high-tech manufacturing represents 28 % of the
manufacturing sector while knowledge intensive services
account for 47 % of the services sector.
(60) Most notably, an exemption from paying the personal
income tax for specific R&D activities and for employees
in start-ups having software development as their main
activity (European Commission, 2017a).
0 10 20 30 40 50 60 70 80 90 100 110
Bucuresti - Ilfov
Vest
Centru
Nord-Vest
Sud - Muntenia
Sud-Est
Sud-Vest Oltenia
Nord-Est
Index: EU(2011)=100
2011 2017
EU (2017) =102.6
0,0
0,5
1,0
1,5
2,0
2,5
3,0
SE
AT
DE
DK FI
BE SI
FR
EU
NL
UK
CZ
HU IE IT EE
ES
LU
PT
BG PL
EL
SK
MT
HR LT
RO
CY
LV
Busin
ess R
&D
expenditure
as %
of G
DP
2016 2007
3.5. SECTORAL POLICIES

3.5. Sectoral policies
43
difficult to assess at this stage, significant
improvements cannot be expected as long as the
low-quality science base limits potential investors’
access to top-level human resources and
collaboration opportunities. The EU’s Horizon
2020 policy support facility for assessing the
entrepreneurship ecosystem proposes a set of
recommendations for a coherent policy mix to
foster a healthy innovative entrepreneurial
ecosystem (European Commission, 2017g).
Recent measures seek to support the
development of the research infrastructure. A
recently adopted roadmap for investing in research
infrastructure and an investment prioritisation
methodology aim to improve strategic planning
and the effectiveness of funding from EU and
national sources. The roadmap provides for an
assessment of the quantity, quality and degree of
utilisation of research equipment and laboratories
and the compilation of a priority list of
infrastructure to be financed either from national
or EU funds. An adequate national infrastructure
should not only support research programmes but
also improve access to Pan-European
infrastructures. Political commitment to the
implementation of the roadmap has been expressed
by a recent ministerial order. (61)
DIGITAL ECONOMY
The degree of digitisation of the economy
remains very low. Despite boasting the highest
ultrafast broadband penetration in the EU, the
levels of broadband coverage (fixed and 4G) and
digitisation of both the public and private sectors
remain low, in particular in rural areas. In contrast
with the increasing numbers of ICT specialists in
the economy, the digital skills of the overall
population are among the poorest in the EU (62).
This in turn limits labour force mobility (see
Section 3.3).
The government is taking steps to improve
digital skills performance in schools. As of 2017,
(61) The approval of the 2017-2025 national roadmap for
research, development and innovation infrastructure has
been a key element of the preconditions for EU funding in
this area. These preconditions were confirmed to the
Commission to have been attained by Ministerial Order
624/2017 of 3 October 2017.
(62) 29 % of Romanians only have basic digital skills (Digital
Economy and Social Index 2018)
programming and technology classes are
introduced as from the fifth grade (i.e. the first
year of lower-secondary education). This
complements what is already taught at high-school
level. Measures have also been taken to ensure that
there are sufficient teachers and that they have
proper digital training. The skills mismatch is also
caused by a sizable gap at university level.
Although the number of STEM (science,
technology, engineering, mathematics) students
has doubled over the past few years, the number of
teachers has remained the same.
Progress on implementing the Digital Agenda is
very limited. There is a lack of coordination both
within the government among institutions
implementing the Digital Agenda and between the
government and IT associations, initiatives and
stakeholders. This leads to weak national digital
policies and no common ground and direction
towards digitisation. EU co-financed investments
in public e-services addressing key life events
(such as births, marriages, deaths) are under
development but progress is slow. The preparation
of projects on eEducation (EUR 100 million),
eHealth (EUR 30 million) and eInclusion (EUR 25
million) in particular has been delayed.
ENERGY, RESOURCES AND CLIMATE CHANGE
Romania still needs to put in place appropriate
energy market rules. The existing market
structure remains inadequate and may prevent
Romania from exploiting its gas potential. The
Emergency Ordinance No 64 of October 2016
introduced crucial reforms for the energy market.
It abolished existing regulatory barriers to the
export of gas which breached EU rules and
introduced essential aspects on competition and
transparency. These changes put Romania on the
path towards becoming a key regional player in the
EU gas sector. However, the amendment of the
Emergency Ordinance currently in Parliament is
watering down the regulatory framework.
New infrastructure will increase Romaniaʼs
integration in the regional energy market. The
Romanian part of the BRUA bi-directional
Bulgaria-Romania-Hungary-Austria Gas Corridor,
a EUR 479 million investment to be completed by
end-2019, will connect gas reserves in the Black
Sea and from the Southern Gas Corridor with the
central and eastern European markets. As for
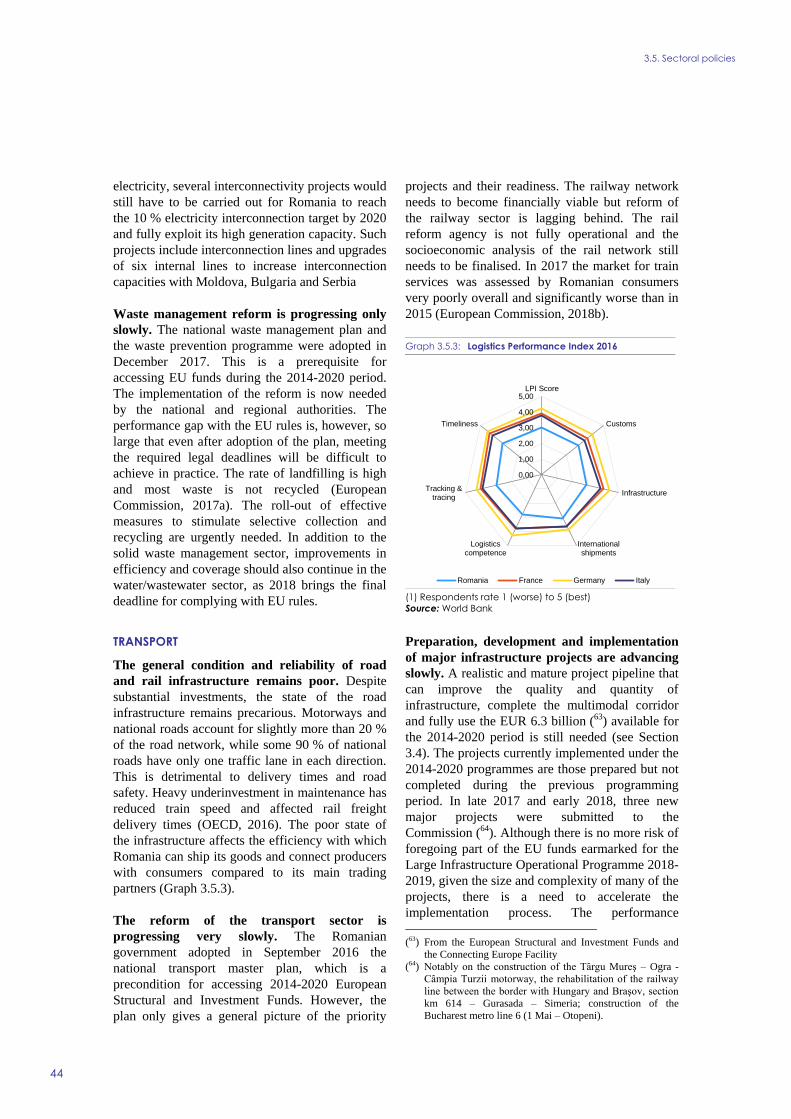
3.5. Sectoral policies
44
electricity, several interconnectivity projects would
still have to be carried out for Romania to reach
the 10 % electricity interconnection target by 2020
and fully exploit its high generation capacity. Such
projects include interconnection lines and upgrades
of six internal lines to increase interconnection
capacities with Moldova, Bulgaria and Serbia
Waste management reform is progressing only
slowly. The national waste management plan and
the waste prevention programme were adopted in
December 2017. This is a prerequisite for
accessing EU funds during the 2014-2020 period.
The implementation of the reform is now needed
by the national and regional authorities. The
performance gap with the EU rules is, however, so
large that even after adoption of the plan, meeting
the required legal deadlines will be difficult to
achieve in practice. The rate of landfilling is high
and most waste is not recycled (European
Commission, 2017a). The roll-out of effective
measures to stimulate selective collection and
recycling are urgently needed. In addition to the
solid waste management sector, improvements in
efficiency and coverage should also continue in the
water/wastewater sector, as 2018 brings the final
deadline for complying with EU rules.
TRANSPORT
The general condition and reliability of road
and rail infrastructure remains poor. Despite
substantial investments, the state of the road
infrastructure remains precarious. Motorways and
national roads account for slightly more than 20 %
of the road network, while some 90 % of national
roads have only one traffic lane in each direction.
This is detrimental to delivery times and road
safety. Heavy underinvestment in maintenance has
reduced train speed and affected rail freight
delivery times (OECD, 2016). The poor state of
the infrastructure affects the efficiency with which
Romania can ship its goods and connect producers
with consumers compared to its main trading
partners (Graph 3.5.3).
The reform of the transport sector is
progressing very slowly. The Romanian
government adopted in September 2016 the
national transport master plan, which is a
precondition for accessing 2014-2020 European
Structural and Investment Funds. However, the
plan only gives a general picture of the priority
projects and their readiness. The railway network
needs to become financially viable but reform of
the railway sector is lagging behind. The rail
reform agency is not fully operational and the
socioeconomic analysis of the rail network still
needs to be finalised. In 2017 the market for train
services was assessed by Romanian consumers
very poorly overall and significantly worse than in
2015 (European Commission, 2018b).
Graph 3.5.3: Logistics Performance Index 2016
(1) Respondents rate 1 (worse) to 5 (best)
Source: World Bank
Preparation, development and implementation
of major infrastructure projects are advancing
slowly. A realistic and mature project pipeline that
can improve the quality and quantity of
infrastructure, complete the multimodal corridor
and fully use the EUR 6.3 billion (63) available for
the 2014-2020 period is still needed (see Section
3.4). The projects currently implemented under the
2014-2020 programmes are those prepared but not
completed during the previous programming
period. In late 2017 and early 2018, three new
major projects were submitted to the
Commission (64). Although there is no more risk of
foregoing part of the EU funds earmarked for the
Large Infrastructure Operational Programme 2018-
2019, given the size and complexity of many of the
projects, there is a need to accelerate the
implementation process. The performance
(63) From the European Structural and Investment Funds and
the Connecting Europe Facility
(64) Notably on the construction of the Tȃrgu Mureş – Ogra -
Cȃmpia Turzii motorway, the rehabilitation of the railway
line between the border with Hungary and Braşov, section
km 614 – Gurasada – Simeria; construction of the
Bucharest metro line 6 (1 Mai – Otopeni).
0,00
1,00
2,00
3,00
4,00
5,00LPI Score
Customs
Infrastructure
Internationalshipments
Logisticscompetence
Tracking &tracing
Timeliness
Romania France Germany Italy

3.5. Sectoral policies
45
contracts that the Ministry of Transport concluded
with the national road and rail companies in
October 2017 should be used to improve
motorway and railway planning and
implementation, also by introducing modern
management practices.
Box 3.5.1: Policy highlights: ICT innovative cluster development and advanced
manufacturing in West Romania
The IT infrastructure is considered satisfactory by businesses and investors and it is supportive of the
international competitiveness in fields such as software development, engineering and design. There is a
vibrant ICT developers community which starts to show spill-overs in high-tech products and start-ups
concentrated in specific sectors such as automotive, advanced packaging, logistical services and mobility
technologies.
The development of clusters in ICT and advanced manufacturing is particularly dynamic in the capital
region and West Romania; diversifying towards advanced manufacturing and higher-value techniques has
been recognised as an opportunity for regional industrial development. The Regional Development Plan
2014-2020 and the Cluster Observatory scorecard for West Romania identify ICT as the most relevant key
enabling technology for the region. More than 22% of the region's working age population is employed in
the manufacturing sector, and more than half of all employed in manufacturing-oriented clusters.
The ICT sector has been developing rapidly in recent years especially in Timisoara, capitalising on the
presence of important technical universities and their close partnerships with leading companies, for
example in the field of big data analytics where students enrolled in the West University of Timisoara can
receive training at IBM on issues related to cloud computing, analytics, mobilecam and securitys and where
IBM professionals are involved in the re-design of the university curriculum for post-graduate degrees,
doctoral studies and research projects.
The West region shows an emerging and dynamic ecosystem for advanced manufacturing, and there are
opportunities in the development of cross-sector technological capabilities for the industry especially in
fields such as ICT and big data, high-performance computing and supercomputing, mechatronics,
electronics and nanoelectronics, as well as new materials testing. The regional Smart Specialisation (RIS3)
Strategy targets improving SMEs’ R&D&I capacities across the board, as well as the development of the six
priority sectors where the region has a comparative advantage (automotives, ICT, agro-food, textiles,
construction and tourism).
There are more and more cases of start-ups and local SMEs providing support with electronics, ICT services
and software development for the manufacturing sector. The fields of Big Data and 3D printing have also
proven to be interesting business opportunities for local SMEs and new multinational corporations alike.
Their integration into the local production sector continues rising fast, especially in the automotive sector.

46
Commitments Summary assessment (65
)
2017 Country-specific recommendations (CSRs)
CSR 1: In 2017, ensure compliance with the Council
Recommendation of 16 June 2017 with a view to
correcting the significant deviation from the
adjustment path toward the medium-term budgetary
objective. In 2018, pursue a substantial fiscal effort in
line with the requirements of the preventive arm of the
Stability and Growth Pact. Ensure the full application
of the fiscal framework. Strengthen tax compliance and
collection. Fight undeclared work, including by
ensuring the systematic use of integrated controls.
Romania has made Limited Progress in addressing
CSR 1 (the overall assessment of CSR 1 does not
include an assessment of compliance with the Stability
and Growth Pact).
In 2017, ensure compliance with the Council
Recommendation of 16 June 2017 with a view to
correcting the significant deviation from the
adjustment path toward the medium-term budgetary
objective.
The compliance assessment with the Stability and
Growth Pact will be included in spring once final data
for 2017 are available.
In 2018, pursue a substantial fiscal effort in line with
the requirements of the preventive arm of the Stability
and Growth Pact.
The compliance assessment with the Stability and
Growth Pact will be included in spring once final data
for 2017 are available.
Ensure the full application of the fiscal framework. No Progress There was no progress on ensuring the
application of the fiscal framework. The 2017 budget
does not comply with the deficit rule, which contains
the obligation to comply with the MTO; as in previous
years, the authorities did not send an update of the
fiscal strategy to Parliament by the statutory deadline
(65) The following categories are used to assess progress in implementing the 2017 country-specific recommendations (CSRs):
No progress: The Member State has not credibly announced nor adopted any measures to address the CSR. This category covers a
number of typical situations, to be interpreted on a case by case basis taking into account country-specific conditions. They
include the following:
no legal, administrative, or budgetary measures have been announced in the national reform programme, in any other
official communication to the national Parliament / relevant parliamentary committees or the European
Commission, publicly (e.g. in a press statement or on the government's website);
no non-legislative acts have been presented by the governing or legislator body;
the Member State has taken initial steps in addressing the CSR, such as commissioning a study or setting up a study
group to analyse possible measures to be taken (unless the CSR explicitly asks for orientations or exploratory actions).
However, it has not proposed any clearly-specified measure(s) to address the CSR.
Limited progress: The Member State has:
announced certain measures but these only address the CSR to a limited extent; and/or
presented legislative acts in the governing or legislative body but these have not been adopted yet and substantial further
non-legislative work is needed before the CSR is implemented;
presented non-legislative acts, but has not followed these up with the implementation needed to address the CSR.
Some progress: The Member State has adopted measures
that partly address the CSR; and/or
that address the CSR, but a fair amount of work is still needed to address the CSR fully as only a few of the measures
have been implemented. For instance, a measure or measures have been adopted by the national Parliament or by
ministerial decision, but no implementing decisions are in place.
Substantial progress: The Member State has adopted measures that go a long way towards addressing the CSR and most of them
have been implemented.
Full implementation: The Member State has implemented all measures needed to address the CSR appropriately.
ANNEX A
Overview table

A. Overview Table
47
of 15 August.
Strengthen tax compliance and collection. Limited Progress Despite an improvement registered
in 2015, the VAT gap in Romania remains the highest
in the EU. The size of the informal economy is also
large (22.1% according to 2014 estimates), reflecting
significant tax evasion and undeclared work.
Moreover, the mandatory introduction of electronic
cash registers connected to the tax administration's IT
system, which was supposed to help improve VAT
collection, has been postponed again.
Fight undeclared work, including by ensuring the
systematic use of integrated controls.
Some Progress. A number of important modifications
were made to the labour and fiscal codes broadening
the definitions of undeclared work. Under-declared
earnings are now explicitly included. Coercive
measures were expanded, also benefiting from media
coverage, but preventive measures are still
insufficiently used. However, in 2017 the labour
inspection conducted fewer joint inspections compared
to the previous year due to the late signature of the
memorandum of understanding with ANAF. Social
partners are still insufficiently involved, the dialogue
with external stakeholders is still relatively weak, and
quality management is at early stages.
CSR 2: Strengthen targeted activation policies and
integrated public services, focusing on those furthest
away from the labour market. Adopt legislation
equalising the pension age for men and women.
Establish a transparent mechanism for minimum wage-
setting, in consultation with social partners. Improve
access to quality mainstream education, in particular
for Roma and children in rural areas. In healthcare,
shift to outpatient care and curb informal payments.
Romania has made Limited Progress in addressing
CSR 2
Strengthen targeted activation policies and integrated
public services, focusing on those furthest away from
the labour market.
Limited Progress Despite measures to include more
categories of disadvantaged groups and to improve the
financial attractiveness, the active labour market
policies appear insufficiently well designed and the
administrative burden remains a disincentive for
employers. There is no case management for long-term
unemployed and social assistance beneficiaries or
cooperation procedures between public employment
services and social assistance or educational services.
Some progress has been made with outreaching young
people not in education, employment or training
following the signing of the project INTESPO.
Progress on introducing integrated teams in the most
disadvantaged communities is limited, despite several
months of discussions, due to lack of involvement of
certain actors, low political priority and rigid

A. Overview Table
48
employment provisions.
Adopt legislation equalising the pension age for men
and women.
No Progress The bill on pension age equalisation for
men and women is still pending in parliament.
Establish a transparent mechanism for minimum wage-
setting, in consultation with social partners.
No Progress Despite a proposal for an objective
mechanism endorsed by the social partners as a good
basis, the minimum wage continues to be set on a
discretionary basis. Moreover, the opinions of the
social partners are not taken into account, even when
they converge, as it was the case for the recent transfer
of social contributions to employees and the changes to
the Fiscal code.
Improve access to quality mainstream education, in
particular for Roma and children in rural areas.
Limited Progress Limited progress to improve access
to quality mainstream education, in particular for
Roma and children in rural areas. Implementation of
the ESF-financed calls to attract highly qualified
teachers in disadvantaged schools and to tackle early
school leaving is delayed, with limited or no impact on
the ground. The methodology to identify and tackle
school segregation has yet to be developed.
Implementation of the kindergarten coupon for
children from disadvantaged backgrounds has
continued, but the number of children not previously
enrolled is very low and hence the impact on enrolment
rates is only marginal. An early-warning mechanism to
identify children at risk of drop-out is being developed
and there are plans to launch an ESF-financed call for
second chance programmes. However, prevention
measures for early school leaving tend to be focused on
social programmes, whereas the focus on the quality of
education provided is rather limited. Existing measures
to address Roma inclusion in education remain
insufficient to tackle the magnitude of the challenge.
Implementation of the new school curriculum is
progressing, but is incomplete, while textbooks have
raised a series of controversies. Beyond the ongoing
ESF project to finance teacher training in view of the
new curriculum, initial and in-service teacher
education programmes remain insufficiently geared
towards fostering inclusive education in the classroom.
The strategy on education infrastructure has been
finalized at the end of 2017. However, no specific
budget has been set aside for the implementation of the
strategy and the implementation capacity remains very
modest.
In healthcare, shift to outpatient care Limited Progress A variety of measures will be
implemented in the 2018 Framework Contract of the
National Health Insurance House with the providers:
(i) The administrative burden for family doctors will be

A. Overview Table
49
reduced using eHealth solutions. (ii) In rural areas,
pilot projects will be implemented to increase the
number of family doctors by setting a pay per
performance system. (iii) The fees for specialised
ambulatory care will be raised close to the level of day
hospital. Other measures are planned in the context of
the Regional Health Plans and Regional Master Plans,
some of which will required some legislative changes
that are currently discussed to be approved by the
corresponding Commissions of Specialties: (i)
Palliative care is being reorganised with an integrated
approach (home-ambulatory-inpatient care) as part of a
World Bank project; (ii) In connection with the
building of the regional hospitals, some of the beds in
the old county hospitals will be reconverted to
palliative and long term care; (iii) The Romanian
government will invest in infrastructure regarding the
ambulatory specialised care (policlinics); (iv) A
network of Integrated Community Centres equipped
with integrated teams will be developed,
complemented with training for community nurses.
Nonetheless, the ongoing implementation of the
National Health Strategy 2014-2020 (with the overall
aim of shifting from inpatient to outpatient care) is
marred by shifting priorities, poor investment planning,
lack of clear political commitment and the modest
administrative capacity of the Ministry of Health. The
progress on mobilizing ESIF to reinforce outpatient
care remains very limited. Efforts are still focused on
the hospital sector (regional hospitals). While some
ESIF calls have been launched and implementation can
finally start, the political will to ensure the shift
towards outpatient care seems to be lacking.
and curb informal payments. Some Progress An Integrity Service within the
Ministry of Health is connected to the National
Integrity Agency and receives support from the
National Anticorruption Directorate. The Service
monitors patients’ feedback mechanism which was
revamped in December 2016. The feedback is based on
two elements: a survey of patients’ satisfaction
following hospital discharge and a secure telephone
line. Between July and October 2017, a total of 164
calls were registered of which 48 involved some
offence and 37 were corruption-related. A report on the
satisfaction survey is produced on a monthly basis (to
be sent to the Commission). The Government and the
hospitals are running awareness-raising campaigns.
However, it is too early to assess the impact of the
above measures on the reduction of informal payments.

A. Overview Table
50
CSR 3: Adopt legislation to ensure a professional and
independent civil service, applying objective criteria.
Strengthen project prioritisation and preparation in
public investment. Ensure the timely full and
sustainable implementation of the national public
procurement strategy.
Romania has made Limited Progress in addressing
CSR 3
Adopt legislation to ensure a professional and
independent civil service, applying objective criteria.
Limited Progress Draft legislation sent to the
Parliament in December is now aligned with the Civil
Service Strategy. The National Institute of
Administration has become operational since June
2017. A project with the World Bank was recently
signed to implement some of the key actions of the
human resource management reform. First results of
the project may be available by mid-2019 and depend
on the legal text adopted by Parliament and the
effective implementation of the measures under the
World Bank project. It is essential to address
dysfunctionalities in public administration and public
investments governance in all sectors including quality
of implementation and absorption of ESIF.
Strengthen project prioritisation and preparation in
public investment.
Limited Progress Despite some progress with public
procurement reform, limited political ownership of
structural measures, burdensome administrative
procedures and lack of stable prioritization and
strategic planning hold back the implementation of
important policies across many sectors, including the
timely implementation of ESI Funds. New
administrative structures were set up in the Ministry of
Finance in 2016 to facilitate public-private partnerships
(Directorate for Management of Public Investments).
The Government Programme 2017-2020 retains a
focus on PPP. Technical assistance projects under the
SRSP focus on improving the related existing legal
framework and administrative capacity and enhancing
public investment prioritisation. However the
investment agenda remains influenced by changing
priorities and the link with the adopted strategic
framework remains modest.
Ensure the timely full and sustainable implementation
of the national public procurement strategy.
Some Progress Despite efforts to engage a thorough
reform of the public procurement system and tangible
achievements made in 2017, the process was marked
by instances of backtracking and lack of political
ownership to implement some of the critical
commitments taken in the context of the national
public procurement action plan. Further focus and
progress are needed to ensure the sustainability of
reforms and the enforcement of measures allowing the
use of the opportunities provided by the new public
procurement directives. The areas where further

A. Overview Table
51
progress is needed include the professionalization and
empowerment of the contracting authorities, the
aggregation of purchases, use of strategic procurement
and balanced articulation of controls. The reform of the
public procurement system is supported via the
establishment of a Public Procurement Agency, the
transposition of the 2014 public procurement directives
and the adoption of secondary legislation. However,
pressures to exempt some investments from public
procurement rules continue to affect implementation.
The irreversibility of the public procurement reform
and further monitoring in the context of the EU
Semester process remain essential.
Europe 2020 (national targets and progress)
Employment rate target set in the NRP: 70 %. The national target of 70 % by 2020 is within reach as
the employment rate in the age group 20-64 was at
69.0% in Q3-2017.
R&D target set in the NRP: 2 % of GDP Romania will not reach the R&D intensity target by
2020. The country’s R&D intensity in 2016 was only
0.48% of GDP. To reach its 2020 target, R&D in
Romania will need to grow by an average of 42.7% per
year over the period 2016-2020. Moreover, the
Romanian R&D intensity fell annually by 2% in the
period 2007-2016. In 2016, public R&D intensity was
20% lower than in 2015, while business R&D intensity
increased by 24%. Business R&D intensity reached
0.27% of GDP in 2016 (26th in the EU) while public
R&D intensity fell to 0.22% of GDP (27th in the EU).
EU-funded investments in R&D infrastructure are
slowly taking off, but they are unlikely to have a
significant impact on R&D performance before 2020.
Greenhouse gas emissions, national target:
19 % in 2020 compared to 2005 (in non-ETS sectors)
According to preliminary estimates in 2016,
greenhouse gas emissions not covered by the EU ETS
decreased by 4% between 2005 and 2016, while the
target for 2015 allows an increase of 7% compared to
2005. According to the latest national projections based
on existing measures, non-ETS emissions will increase
by 1% between 2005 and 2020. The target is
consequently expected to be met with a margin of 18
percentage points.
2020 renewable energy target: 24 % With 24.8% renewable energy share in gross final
consumption, Romania is well on track and even above
in attaining its renewable energy target for 2020.

A. Overview Table
52
Emergency Ordinance No 24/2017 was adopted on 30
March 2017, approving the amendments to the
renewable energy support scheme. This provides
support to promoting renewable energy in a sustainable
manner while ensuring a reasonable consumer impact.
This approach brings the much needed stability and
predictability to the Romanian renewable energy
sector.
Energy efficiency, 2020 energy consumption targets:
43 Mtoe (primary energy consumption);
30.3 Mtoe (final energy consumption).
ESI Funds should further contribute to meeting this
target but the preparation and implementation of
energy efficiency projects are significantly delayed.
Early school leaving (ESL) target: 11.3 %. The rate of early school leaving decreased slightly to
18.5 % in 2016, but the target of 11.3 % remains far
from being reached. Romania continues to have one of
the highest early school leaving rates in the EU.
Tertiary education target: 26.7 %. Progress on meeting the target has stalled. In 2016,
tertiary attainment remained at the same level as in
2015 (25.6 %).
Target for reducing the number of people at risk of
poverty or social exclusion, expressed as an absolute
number of people: 580 000.
The national target of 580 000 people is already
considered reached. In absolute terms, the number of
people lifted out of the risk of poverty or social
exclusion since 2008 is 1 420 000 (2016). The
population taken out of poverty or social exclusion was
however higher in 2015 (1 680 000) as compared to
2016.

53
ANNEX B
Macroeconomic Imbalance Procedure scoreboard
Table B.1: The Macroeconomic Imbalances Procedure scoreboard for Romania (AMR 2018)
Flags:b:Break in series. p:Provisional.
(1) This table provides data as published under the Alert Mechanism Report 2018, which reports data as of 24 Oct 2017.
Please note that figures reported in this table may therefore differ from more recent data elsewhere in this document.
(2) Figures highlighted are those falling outside the threshold established in the European Commission's Alert Mechanism
Report.
Source: European Commission 2017, Statistical Annex to the Alert Mechanism Report 2018, SWD(2017) 661.
Thresholds 2011 2012 2013 2014 2015 2016
Current account balance, % of GDP 3 year average -4%/6% -4.9 -4.9 -3.6 -2.2 -1.0 -1.3
Net international investment position % of GDP -35% -65.4 -67.4 -62.6 -57.3 -54.6 -49.9
Real effective exchange rate - 42 trading
partners, HICP deflator3 year % change
±5% (EA)
±11% (Non-EA)-3.2 -2.0 0.4 -1.0 2.7 -2.5
Export market share - % of world exports 5 year % change -6% 50.2 12.8 14.2 20.7 20.9 23.6
Nominal unit labour cost index
(2010=100)3 year % change
9% (EA)
12% (Non-EA)-0.5 -0.2b -3.2 7.3 0.3 6.0p
House price index (2015=100), deflated 1 year % change 6% -15.8 -9.2 -2.8 -3.2 1.9 6.5
Private sector credit flow, consolidated % of GDP 14% 2.8 0.3 -1.4 -2.4 0.2 0.6p
Private sector debt, consolidated % of GDP 133% 72.9 71.9 66.6 62.1 59.1 55.8p
General government gross debt % of GDP 60% 34.4 37.3 37.8 39.4 37.9 37.6
Unemployment rate 3 year average 10% 6.9 7.0 7.0 6.9 6.9 6.5
Total financial sector liabilities, non-
consolidated1 year % change 16.5% 4.6 4.4 0.8 1.3 4.0 7.6
Activity rate - % of total population aged
15-643 year change in pp -0.2 pp 1.2 1.7 0.0b 1.6 1.3 0.7
Long-term unemployment rate - % of
active population aged 15-743 year change in pp 0.5 pp 0.5 0.8 0.8 -0.1 0.0 -0.2
Youth unemployment rate - % of active
population aged 15-243 year change in pp 2 pp 6.3 2.6 1.6 0.1 -0.9 -3.1
Ex
tern
al
imb
ala
nc
es
an
d c
om
pe
titi
ve
ne
ss
Inte
rna
l im
ba
lan
ce
sE
mp
loy
me
nt
ind
ica
tors

54
Table C.1: Financial market indicators
(1) Latest data Q3 2017. Includes not only banks but all monetary financial institutions excluding central banks.
(2) Latest data Q2 2017.
(3) As per ECB definition of gross non-performing debt instruments
(4) Quarterly values are not annualised
(5) Latest data May 2017.
* Measured in basis points.
Source: European Commission (long-term interest rates); World Bank (gross external debt); Eurostat (private debt); ECB (all
other indicators).
2012 2013 2014 2015 2016 2017
Total assets of the banking sector (% of GDP)(1) 68.3 63.4 60.2 57.6 55.7 53.4
Share of assets of the five largest banks (% of total assets) 54.7 54.4 54.2 57.4 59.1 -
Foreign ownership of banking system (% of total assets)(2) 89.8 90.0 90.0 90.5 91.4 91.2
Financial soundness indicators:2)
- non-performing loans (% of total loans)(3)
- 17.9 15.8 10.7 7.7 6.7
- capital adequacy ratio (%) 17.2 18.8 17.7 18.9 19.2 19.1
- return on equity (%)(4) -7.1 0.0 -15.2 11.3 10.6 6.1
Bank loans to the private sector (year-on-year % change)(1) -0.7 -3.5 -1.3 4.5 3.3 7.5
Lending for house purchase (year-on-year % change)(1) 7.7 9.7 9.2 15.5 13.4 11.9
Loan to deposit ratio(1) 113.9 100.8 90.0 85.3 79.7 80.8
Central Bank liquidity as % of liabilities(5) 3.9 0.3 - - - 0.0
Private debt (% of GDP) 71.9 66.6 62.1 59.1 55.8 -
Gross external debt (% of GDP)(2)
- public 19.1 20.7 21.8 19.6 19.1 18.9
- private 33.5 30.1 28.9 26.8 28.3 26.8
Long-term interest rate spread versus Bund (basis points)* 518.4 384.4 333.1 297.8 323.4 359.9
Credit default swap spreads for sovereign securities (5-year)* 310.5 180.4 137.4 110.0 105.9 92.5
ANNEX C
Standard tables
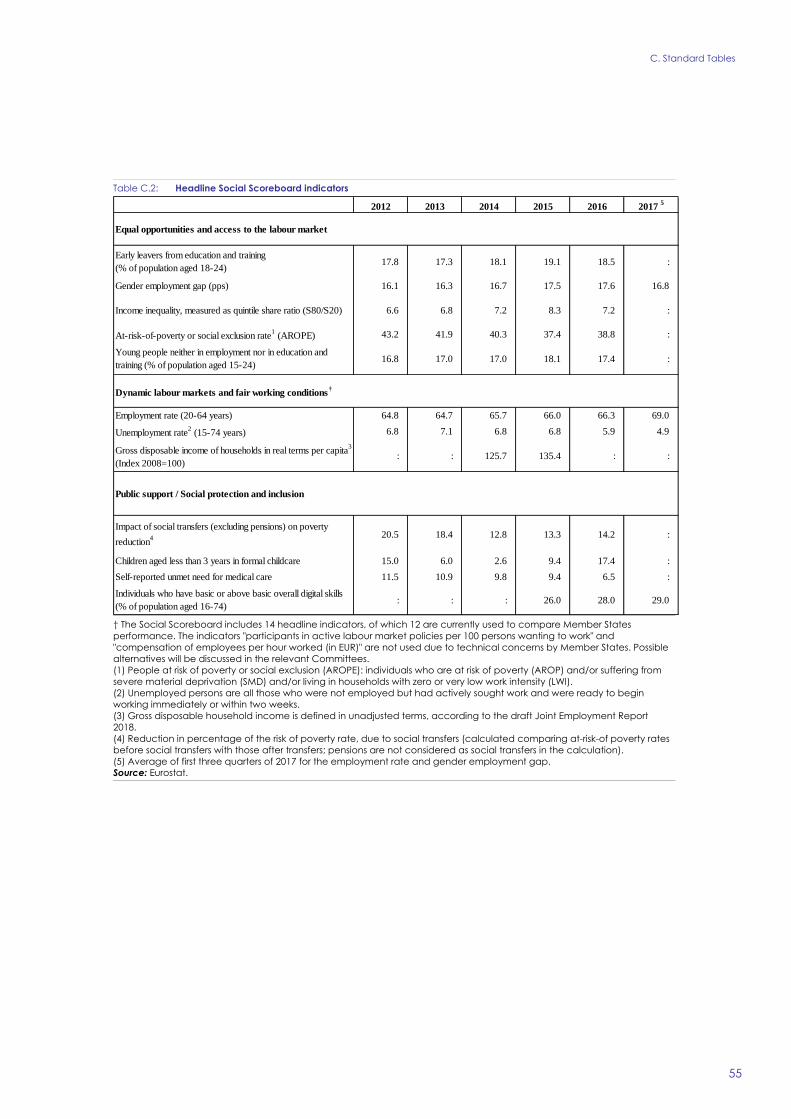
C. Standard Tables
55
Table C.2: Headline Social Scoreboard indicators
† The Social Scoreboard includes 14 headline indicators, of which 12 are currently used to compare Member States
performance. The indicators "participants in active labour market policies per 100 persons wanting to work" and
"compensation of employees per hour worked (in EUR)" are not used due to technical concerns by Member States. Possible
alternatives will be discussed in the relevant Committees.
(1) People at risk of poverty or social exclusion (AROPE): individuals who are at risk of poverty (AROP) and/or suffering from
severe material deprivation (SMD) and/or living in households with zero or very low work intensity (LWI).
(2) Unemployed persons are all those who were not employed but had actively sought work and were ready to begin
working immediately or within two weeks.
(3) Gross disposable household income is defined in unadjusted terms, according to the draft Joint Employment Report
2018.
(4) Reduction in percentage of the risk of poverty rate, due to social transfers (calculated comparing at-risk-of poverty rates
before social transfers with those after transfers; pensions are not considered as social transfers in the calculation).
(5) Average of first three quarters of 2017 for the employment rate and gender employment gap.
Source: Eurostat.
2012 2013 2014 2015 2016 2017 5
Equal opportunities and access to the labour market
Early leavers from education and training
(% of population aged 18-24)17.8 17.3 18.1 19.1 18.5 :
Gender employment gap (pps) 16.1 16.3 16.7 17.5 17.6 16.8
Income inequality, measured as quintile share ratio (S80/S20) 6.6 6.8 7.2 8.3 7.2 :
At-risk-of-poverty or social exclusion rate1 (AROPE) 43.2 41.9 40.3 37.4 38.8 :
Young people neither in employment nor in education and
training (% of population aged 15-24)16.8 17.0 17.0 18.1 17.4 :
Dynamic labour markets and fair working conditions†
Employment rate (20-64 years) 64.8 64.7 65.7 66.0 66.3 69.0
Unemployment rate2 (15-74 years) 6.8 7.1 6.8 6.8 5.9 4.9
Gross disposable income of households in real terms per capita3
(Index 2008=100) : : 125.7 135.4 : :
Public support / Social protection and inclusion
Impact of social transfers (excluding pensions) on poverty
reduction4 20.5 18.4 12.8 13.3 14.2 :
Children aged less than 3 years in formal childcare 15.0 6.0 2.6 9.4 17.4 :
Self-reported unmet need for medical care 11.5 10.9 9.8 9.4 6.5 :
Individuals who have basic or above basic overall digital skills
(% of population aged 16-74): : : 26.0 28.0 29.0

C. Standard Tables
56
Table C.3: Labour market and education indicators
* Non-scoreboard indicator
(1) Long-term unemployed are people who have been unemployed for at least 12 months.
(2) Difference between the average gross hourly earnings of male paid employees and of female paid employees as a
percentage of average gross hourly earnings of male paid employees. It is defined as "unadjusted", as it does not correct for
the distribution of individual characteristics (and thus gives an overall picture of gender inequalities in terms of pay). All
employees working in firms with ten or more employees, without restrictions for age and hours worked, are included.
(3) PISA (OECD) results for low achievement in mathematics for 15 year-olds.
(4) Impact of socio-economic and cultural status on PISA (OECD) scores. Values for 2012 and 2015 refer respectively to
mathematics and science.
(5) Average of first three quarters of 2017, unless for the youth unemployment rate (annual figure).
Source: Eurostat, OECD.
Labour market indicators 2012 2013 2014 2015 2016 2017 5
Activity rate (15-64) 64.8 64.9 65.7 66.1 65.6 :
Employment in current job by duration
From 0 to 11 months 5.3 5.2 5.0 6.2 4.9 :
From 12 to 23 months 6.6 5.8 6.0 7.4 6.4 :
From 24 to 59 months 22.1 21.2 20.0 19.5 20.5 :
60 months or over 66.0 67.8 69.0 66.8 68.2 :
Employment growth*
(% change from previous year) -4.8 -0.9 0.8 -1.3 -0.9 3.7
Employment rate of women
(% of female population aged 20-64) 56.7 56.5 57.3 57.2 57.4 60.5
Employment rate of men
(% of male population aged 20-64)72.8 72.8 74.0 74.7 75.0 77.3
Employment rate of older workers*
(% of population aged 55-64)41.6 41.8 43.1 41.1 42.8 44.5
Part-time employment*
(% of total employment, aged 15-64)9.3 9.0 8.7 8.8 7.4 6.9
Fixed-term employment*
(% of employees with a fixed term contract, aged 15-64)1.5 1.4 1.5 1.4 1.4 1.2
Transition rate from temporary to permanent employment
(3-year average)57.3 57.7 57.8 56.5 : :
Long-term unemployment rate1 (% of labour force) 3.0 3.2 2.8 3.0 3.0 2.1
Youth unemployment rate
(% active population aged 15-24)22.6 23.7 24.0 21.7 20.6 17.3
Gender gap in part-time employment 1.3 1.0 1.3 0.7 0.4 0.2
Gender pay gap2 (in undadjusted form) 6.9 4.9 4.5 5.8 : :
Education and training indicators 2012 2013 2014 2015 2016 2017
Adult participation in learning
(% of people aged 25-64 participating in education and training)1.4 2.0 1.5 1.3 1.2 :
Underachievement in education3 40.8 : : 39.9 : :
Tertiary educational attainment (% of population aged 30-34 having
successfully completed tertiary education)21.7 22.9 25.0 25.6 25.6 :
Variation in performance explained by students' socio-economic
status4 19.3 : : 13.8 : :

C. Standard Tables
57
Table C.4: Social inclusion and health indicators
* Non-scoreboard indicator
(1) At-risk-of-poverty rate (AROP): proportion of people with an equivalised disposable income below 60 % of the national
equivalised median income.
(2) Proportion of people who experience at least four of the following forms of deprivation: not being able to afford to i) pay
their rent or utility bills, ii) keep their home adequately warm, iii) face unexpected expenses, iv) eat meat, fish or a protein
equivalent every second day, v) enjoy a week of holiday away from home once a year, vi) have a car, vii) have a washing
machine, viii) have a colour TV, or ix) have a telephone.
(3) Percentage of total population living in overcrowded dwellings and exhibiting housing deprivation.
(4) People living in households with very low work intensity: proportion of people aged 0-59 living in households where the
adults (excluding dependent children) worked less than 20 % of their total work-time potential in the previous 12 months.
(5) Ratio of the median individual gross pensions of people aged 65-74 relative to the median individual gross earnings of
people aged 50-59.
(6) Fixed broadband take up (33%), mobile broadband take up (22%), speed (33%) and affordability (11%), from the Digital
Scoreboard.
Source: Eurostat, OECD.
2012 2013 2014 2015 2016 2017
Expenditure on social protection benefits* (% of GDP)
Sickness/healthcare 4.0 3.9 3.9 3.8 : :
Disability 1.2 1.1 1.1 1.1 : :
Old age and survivors 8.2 8.0 8.0 7.9 : :
Family/children 1.3 1.2 1.2 1.3 : :
Unemployment 0.2 0.2 0.1 0.1 : :
Housing 0.0 0.0 0.0 0.0 : :
Social exclusion n.e.c. 0.2 0.2 0.2 0.2 : :
Total 15.2 14.6 14.4 14.3 : :
of which: means-tested benefits 0.6 0.6 0.6 0.6 : :
General government expenditure by function (% of GDP, COFOG)
Social protection 12.3 11.5 11.4 11.4 11.6 :
Health 3.8 4.0 4.0 4.2 4.0 :
Education 3.0 2.8 3.0 3.1 3.7 :
Out-of-pocket expenditure on healthcare (% of total health expenditure) 22.4 20.2 20.3 21.3 : :
Children at risk of poverty or social exclusion (% of people
aged 0-17)*52.5 51.4 50.7 46.8 49.2 :
At-risk-of-poverty rate1 (% of total population) 22.9 23.0 25.1 25.4 25.3 :
In-work at-risk-of-poverty rate (% of persons employed) 19.0 18.4 19.8 18.8 18.9 :
Severe material deprivation rate2 (% of total population) 31.1 29.8 25.9 22.7 23.8 :
Severe housing deprivation rate3, by tenure status
Owner, with mortgage or loan 19.9 16.1 4.9 1.6 1.4 :
Tenant, rent at market price 19.0 21.2 32.8 53.0 46.0 :
Proportion of people living in low work intensity households4
(% of people aged 0-59)7.9 7.6 7.2 7.9 8.2 :
Poverty thresholds, expressed in national currency at constant prices* 3884 3888 3991 4253 4518 :
Healthy life years (at the age of 65)
Females 5.1 5.2 5.7 5.7 : :
Males 5.9 5.8 5.9 6.3 : :
Aggregate replacement ratio for pensions5 (at the age of 65) 0.7 0.7 0.7 0.6 0.7 :
Connectivity dimension of the Digital Economy and Society Inedex
(DESI)6
: : 43.9 46.2 49.8 54.1
GINI coefficient before taxes and transfers* 53.2 51.8 52.1 54.1 54.4 :
GINI coefficient after taxes and transfers* 33.2 34.0 34.7 37.4 34.7 :

C. Standard Tables
58
Table C.5: Product market performance and policy indicators
(1)The methodologies, including the assumptions, for this indicator are shown in detail here:
http://www.doingbusiness.org/methodology.
(2) Average of the answer to question Q7B_a. "[Bank loan]: If you applied and tried to negotiate for this type of financing
over the past six months, what was the outcome?". Answers were codified as follows: zero if received everything, one if
received most of it, two if only received a limited part of it, three if refused or rejected and treated as missing values if the
application is still pending or don't know.
(3) Percentage population aged 15-64 having completed tertiary education.
(4) Percentage population aged 20-24 having attained at least upper secondary education.
(5) Index: 0 = not regulated; 6 = most regulated. The methodologies of the OECD product market regulation indicators are
shown in detail here: http://www.oecd.org/competition/reform/indicatorsofproductmarketregulationhomepage.htm.
(6) Aggregate OECD indicators of regulation in energy, transport and communications (ETCR).
Source: European Commission; World Bank — Doing Business (for enforcing contracts and time to start a business); OECD (for
the product market regulation indicators); SAFE (for outcome of SMEs' applications for bank loans).
Performance Indicators 2010 2011 2012 2013 2014 2015 2016
Labour productivity (real, per person employed, year-on-year %
change)
Labour productivity in Industry 6.72 2.31 -4.52 4.24 1.38 9.36 2.48
Labour productivity in Construction -20.16 -31.93 13.84 7.05 1.67 7.55 4.87
Labour productivity in Market Services 0.81 -8.82 41.17 0.83 -0.02 3.76 4.70
Unit labour costs (ULC) (whole economy, year-on-year % change)
ULC in Industry 1.99 -2.48 18.48 -3.78 0.74 -0.53 2.66
ULC in Construction 7.50 37.79 -3.52 -5.01 -10.86 4.33 -3.78
ULC in Market Services 5.66 11.83 -29.30 6.19 7.37 -0.58 6.55
Business Environment 2010 2011 2012 2013 2014 2015 2016
Time needed to enforce contracts(1)
(days) 512.0 512.0 512.0 512.0 512.0 512.0 512.0
Time needed to start a business(1)
(days) 8.0 12.0 8.0 8.0 8.0 8.0 12.0
Outcome of applications by SMEs for bank loans(2) na 0.71 na 0.99 0.94 0.46 0.36
Research and innovation 2010 2011 2012 2013 2014 2015 2016
R&D intensity 0.45 0.49 0.48 0.39 0.38 0.49 0.48
General government expenditure on education as % of GDP 3.30 4.10 3.00 2.80 3.00 3.10 na
Persons with tertiary education and/or employed in science and
technology as % of total employment22 23 24 24 24 26 27
Population having completed tertiary education(3) 12 13 14 14 14 15 15
Young people with upper secondary level education(4) 78 80 80 80 80 80 80
Trade balance of high technology products as % of GDP -1.62 -1.46 -1.79 -1.96 -1.66 -1.74 na
Product and service markets and competition 2003 2008 2013
OECD product market regulation (PMR)(5)
, overall na na 1.69
OECD PMR5, retail na na 1.80
OECD PMR5, professional services na na na
OECD PMR5, network industries(6) na na 1.97

C. Standard Tables
59
Table C.6: Green growth
All macro intensity indicators are expressed as a ratio of a physical quantity to GDP (in 2010 prices)
Energy intensity: gross inland energy consumption (in kgoe) divided by GDP (in EUR)
Carbon intensity: greenhouse gas emissions (in kg CO2 equivalents) divided by GDP (in EUR)
Resource intensity: domestic material consumption (in kg) divided by GDP (in EUR)
Waste intensity: waste (in kg) divided by GDP (in EUR)
Energy balance of trade: the balance of energy exports and imports, expressed as % of GDP
Weighting of energy in HICP: the proportion of 'energy' items in the consumption basket used for the construction of the
HICP
Difference between energy price change and inflation: energy component of HICP, and total HICP inflation (annual %
change)
Real unit energy cost: real energy costs as % of total value added for the economy
Industry energy intensity: final energy consumption of industry (in kgoe) divided by gross value added of industry (in 2010
EUR)
Real unit energy costs for manufacturing industry excluding refining : real costs as % of value added for manufacturing
sectors
Share of energy-intensive industries in the economy: share of gross value added of the energy-intensive industries in GDP
Electricity and gas prices for medium-sized industrial users: consumption band 500–20 00MWh and 10 000–100 000 GJ; figures
excl. VAT.
Recycling rate of municipal waste: ratio of recycled and composted municipal waste to total municipal waste
Public R&D for energy or for the environment: government spending on R&D for these categories as % of GDP
Proportion of GHG emissions covered by EU emissions trading system (ETS) (excluding aviation): based on GHG emissions
(excl land use, land use change and forestry) as reported by Member States to the European Environment Agency.
Transport energy intensity: final energy consumption of transport activity (kgoe) divided by transport industry gross value
added (in 2010 EUR)
Transport carbon intensity: GHG emissions in transport activity divided by gross value added of the transport sector
Energy import dependency: net energy imports divided by gross inland energy consumption incl. consumption of
international bunker fuels
Aggregated supplier concentration index: covers oil, gas and coal. Smaller values indicate larger diversification and hence
lower risk.
Diversification of the energy mix: Herfindahl index covering natural gas, total petrol products, nuclear heat, renewable
energies and solid fuels
* European Commission and European Environment Agency
Source: European Commission and European Environment Agency (Share of GHG emissions covered by ETS); European
Commission (Environmental taxes over labour taxes and GDP); Eurostat (all other indicators)
Green growth performance 2011 2012 2013 2014 2015 2016
Macroeconomic
Energy intensity kgoe / € 0.29 0.27 0.24 0.23 0.23 0.21
Carbon intensity kg / € 0.99 0.96 0.86 0.83 0.81 -
Resource intensity (reciprocal of resource productivity) kg / € 3.51 3.37 3.28 3.25 3.31 3.20
Waste intensity kg / € - 1.92 - 1.27 - -
Energy balance of trade % GDP -2.7 -3.0 -1.9 -1.4 -0.9 -0.9
Weighting of energy in HICP % 17.77 12.52 12.45 12.21 12.25 11.94
Difference between energy price change and inflation % 1.0 1.3 5.0 0.1 2.8 -1.0
Real unit of energy cost% of value
added24.9 25.6 23.6 22.6 - -
Ratio of environmental taxes to labour taxes ratio 0.18 0.18 0.19 0.22 0.24 -
Environmental taxes % GDP 1.9 2.0 2.0 2.3 2.4 2.3
Sectoral
Industry energy intensity kgoe / € 0.18 0.20 0.18 0.18 0.17 0.15
Real unit energy cost for manufacturing industry excl.
refining
% of value
added21.0 22.7 21.7 21.4 - -
Share of energy-intensive industries in the economy % GDP 13.67 11.79 11.59 12.20 12.56 12.77
Electricity prices for medium-sized industrial users € / kWh 0.08 0.08 0.09 0.08 0.08 0.08
Gas prices for medium-sized industrial users € / kWh 0.02 0.03 0.03 0.03 0.03 0.03
Public R&D for energy % GDP 0.02 0.01 0.01 0.02 0.01 0.02
Public R&D for environmental protection % GDP 0.02 0.02 0.02 0.01 0.01 0.02
Municipal waste recycling rate % 11.7 14.8 13.2 13.1 13.2 -
Share of GHG emissions covered by ETS* % 47.0 44.6 38.0 38.2 37.7 35.3
Transport energy intensity kgoe / € 0.77 0.58 0.55 0.60 0.53 0.47
Transport carbon intensity kg / € 2.07 1.63 1.55 1.70 1.50 -
Security of energy supply
Energy import dependency % 21.6 22.7 18.5 17.1 17.1 22.3
Aggregated supplier concentration index HHI 16.7 12.4 12.8 14.2 17.8 -
Diversification of energy mix HHI 0.23 0.23 0.23 0.23 0.23 0.23

60
Bertelsmann Stiftung, Romania report. Sustainable governance indicators 2017, available at:
http://www.sgi-network.org/2017/Romania/Key_Findings
Bower, U. (2017), State-owned enterprises in emerging Europe – The good, the bad and the ugly, IMF
Working Papers, October, available at: https://www.imf.org/en/Publications/WP/Issues/2017/10/30/State-
Owned-Enterprises-in-Emerging-Europe-The-Good-the-Bad-and-the-Ugly-45181
CASE et al. (2017), Study and Reports on the VAT Gap in the EU-28 Member States: 2017 Final Report,
TAXUD/2015/CC/131, available at:
https://ec.europa.eu/taxation_customs/sites/taxation/files/study_and_reports_on_the_vat_gap_2017.pdf
Cedefop (2017), Skills Anticipation in Romania, Analytical Highlights 04/2017,
http://skillspanorama.cedefop.europa.eu/en/analytical_highligths/skills-anticipation-romania
ECB (2017), Survey on the access to finance of enterprises (SAFE),
https://www.ecb.europa.eu/pub/pdf/other/ecb.accesstofinancesmallmediumsizedenterprises201705.en.pdf
?17da4ff2a730b7ababea4037e4ce8cae
Eurofound (2016), Exploring the diversity of NEETs, July 2016, available at:
https://www.eurofound.europa.eu/publications/report/2016/labour-market-social-policies/exploring-the-
diversity-of-neets
Eurofound (2017), Future of Manufacturing - Developing regional industrial policy capacity - Regional
Case Study: West Romania, study by L. Roman, Technopolis, May 2017
Eurofound (2018), The involvement of the national social partners in the European Semester 2017 and in
the implementation of reforms, forthcoming.
European Commission (2015a), Balance of Payments assistance programme. Romania, 2013-2015,
available at: https://ec.europa.eu/info/sites/info/files/file_import/ip012_en_2.pdf
European Commission (2015b) Challenges to Member States’ Investment Environments, available at:
https://ec.europa.eu/futurium/en/system/files/ged/32-_swd_-barriers_to_investment_in_ms.pdf
European Commission (2016a), Country Report Romania 2016, SWD (2016) 91 final
European Commission (2016b), Cluster Observatory: Cluster Scorecard Report for West Region of
Romania.
European Commission (2017a), Country Report Romania 2017, SWD (2017) 88 final
European Commission (2017b), Updated Study on Corruption in the Healthcare Sector - September
2017, available at: https://ec.europa.eu/home-
affairs/sites/homeaffairs/files/20170928_study_on_healthcare_corruption_en.pdf
European Commission (2017c), Single Market Scoreboard, Performance per Policy Area: Public
Procurement (Reporting period: 01/2016 - 12/2016), http://ec.europa.eu/single-market-scoreboard
European Commission (2017d), Education and training monitor Romania, available at:
https://ec.europa.eu/education/sites/education/files/monitor2017-ro_en.pdf
European Commission (2017e), 2017 SME Performance Review: SBA Factsheet for Romania,
https://ec.europa.eu/growth/smes/business-friendly-environment/performance-review_en
REFERENCES

References
61
European Commission (2017f), Special Eurobarometer report, October 2017, available at:
http://ec.europa.eu/commfrontoffice/publicopinion/index.cfm/Survey/getSurveyDetail/instruments/SPECI
AL/surveyKy/2176
European Commission (2017g), Specific Support to Romania — Start-ups, Scale-ups and
Entrepreneurship in Romania report, available at: https://rio.jrc.ec.europa.eu/en/policy-support-
facility/specific-support-romania
European Commission (2017h), Draft Joint Employment Report 2018, COM(2017) 674, available at:
https://ec.europa.eu/info/sites/info/files/2017-comm-674_en.pdf
European Commission (2017i), Economic and Social Developments in Europe 2017, available at:
http://ec.europa.eu/social/main.jsp?catId=738&langId=en&pubId=8030&furtherPubs=yes
European Commission (2017j), Report on progress in Romania under the Cooperation and Verification
Mechanism – COM(2017) 44 and SWD(2017) 25, available at : https://ec.europa.eu/info/effective-
justice/rule-law/assistance-bulgaria-and-romania-under-cvm/reports-progress-bulgaria-and-romania_en
European Commission (2017k), Report on progress in Romania under the Cooperation and Verification
Mechanism – COM(2017) 751 and SWD(2017) 701, available at: https://ec.europa.eu/info/effective-
justice/rule-law/assistance-bulgaria-and-romania-under-cvm/reports-progress-bulgaria-and-romania_en
European Commission (2017l), Flash Eurobarometer report, December 2017, available at:
http://ec.europa.eu/commfrontoffice/publicopinion/index.cfm/Survey/getSurveyDetail/instruments/FLAS
H/surveyKy/2177.
European Commission (2018a), Debt Sustainability Monitor 2017, Directorate-General for Economic and
Financial Affairs, European Economy, Institutional Paper 071/2018, available at:
https://ec.europa.eu/info/sites/info/files/economy-finance/ip071_en.pdf
European Commission (2018b), Consumer Market Scoreboard 2018 edition, forthcoming
European Investment Bank (2017), EIB investment market survey 2017 Romania, available at:
http://www.eib.org/infocentre/publications/all/econ-eibis-2017-romania.htm
Eurostat (2017), Population data, available in: http://ec.europa.eu/eurostat/data/database .
FRA, European Union Agency for Fundamental Rights (2016), Second European Union Minorities and
Discrimination Survey, available at: http://fra.europa.eu/en/publication/2016/eumidis-ii-roma-selected-
findings.
IMF (2016), Emigration and its economic impact on Eastern Europe, available at:
https://www.imf.org/external/pubs/ft/sdn/2016/sdn1607.pdf
IMF (2017a), Efficiency-adjusted public capital, capital grants and growth, available at:
https://www.imf.org/en/Publications/WP/Issues/2017/07/24/Efficiency-Adjusted-Public-Capital-Capital-
Grants-and-Growth-45084
IMF (2017b), Romania Selected Issues, 25 May 2017, available at:
https://www.imf.org/en/Publications/CR/Issues/2017/05/25/Romania-Selected-Issues-44945
Manpower Group (2016), Manpower Talent Shortage 2016-2017, available at:
https://www.manpowergroup.com/talent-shortage-2016

References
62
Marrez, H. (2015), The role of state-owned enterprises in Romania, ECFIN Country Focus, available at:
http://ec.europa.eu/economy_finance/publications/country_focus/2015/pdf/cf_vol12_issue1_en.pdf
NBR (2017), Financial stability report, November 2017, available at: http://bnr.ro/Publicatii-periodice-
204.aspx
OECD (2016), OECD Competition Assessment Reviews: Romania, OECD Publishing, Paris, available at:
http://dx.doi.org/10.1787/9789264257450-en
OECD (2017a), Reviews of Evaluation and Assessment in Education, Kitchen, H., et al., Romania 2017,
http://dx.doi.org/10.1787/9789264274051-en
OECD/European Observatory on Health Systems and Policies (2017b), Romania: Country Health Profile
2017, State of Health in the EU, OECD Publishing, Paris/European Observatory on Health Systems and
Policies, Brussels. http://dx.doi.org/10.1787/9789264283534-en
OECD (2017c), Pension funds in figures, available at: https://www.oecd.org/pensions/private-
pensions/Pension-Funds-in-Figures-2017.pdf
Philiponnet N. and A. Turinni (2017), Assessing house price developments in the EU, Discussion paper
n°48, European Economy, available at: https://ec.europa.eu/info/sites/info/files/dp048_en.pdf
Stehrer, R. et al. (2017), Drivers and obstacles to competitiveness in the EU: The role of value chains and
the Single Market, Final report for the European Commission, May 2017
Williams and Horodnic (2017), Under-declaring work, falsesly declaring work: under-declared
employment in the European Union, available at:
https://www.researchgate.net/profile/Colin_Williams/publication/320394986_Under-
declaring_work_falsely_declaring_work_under-
declared_employment_in_the_European_Union/links/59e1b4fe458515393d57b286/Under-declaring-
work-falsely-declaring-work-under-declared-employment-in-the-European-Union.pdf
World Bank (2016b), Migration and remittances factbook 2016, available at:
http://www.worldbank.org/en/research/brief/migration-and-remittances
World Bank (2017a), Doing Business 2018: Comparing Business Regulation for Domestic Firms in 190
Economies, Washington DC, available at:
http://www.doingbusiness.org/~/media/WBG/DoingBusiness/Documents/Annual-
Reports/English/DB2018-Full-Report.pdf
World Bank (2017b), Doing Business in the European Union 2017: Bulgaria, Hungary and Romania,
Washington DC, available at: http://www.doingbusiness.org/reports/subnational-reports/eu-bulgaria-
hungary-romania
World Bank (2017c), Portraits of labour market exclusion 2.0, available at:
http://www.worldbank.org/en/region/eca/publication/portraits-of-labor-market-exclusion-in-europe-and-
central-asia
World Economic Forum (2017), Global Competitiveness Report 2017-2018, available at:
http://www3.weforum.org/docs/GCR2017-
2018/05FullReport/TheGlobalCompetitivenessReport2017%E2%80%932018.pdf