2018 integrated report guidance manual, final · web viewaquatic life use includes the propagation,...
TRANSCRIPT
COMMONWEALTH OF VIRGINIADEPARTMENT OF ENVIRONMENTAL QUALITY
WATER PLANNING DIVISIONJUTTA SCHNEIDER, DIRECTOR
P.O. BOX 1105 Richmond, VA 23218
Subject: Guidance Memo No. GM18-20012018 Water Quality Assessment Guidance Manual
To: Regional Directors
From: Jutta Schneider, Water Planning Division Director
Date: 12/20/2018
Copies: John Kennedy, Sandra Mueller, Regional Water Quality Planning Managers and staff, Office of Water Quality Programs Managers, WMA Staff
Summary:
The Environmental Protection Agency’s (EPA) original 2006 Integrated Report Guidance recommends that states submit an “Integrated Report”(IR) that will satisfy Clean Water Act (CWA) requirements for both Sections 305(b) water quality reports and 303(d) impaired waters lists. According to EPA this Integrated Report should include the following information:
delineation of water quality assessment units (AUs) based on National Hydrography Dataset (NHD); status of and progress toward achieving comprehensive assessments of all waters; Water Quality Standard attainment determination for every AU; additional monitoring that may be needed to determine Water Quality Standard attainment status
and, if necessary, to support development of Total Maximum Daily Loads (TMDLs) for each pollutant/AU combination;
schedules for additional monitoring planned for AUs; pollutant/AU combinations still requiring TMDLs; TMDL development schedules reflecting the priority ranking of each pollutant/AU combination; and Water Quality “Effluent Limited” Waters.
DEQ has incorporated the EPA Integrated Reporting guidance into the Virginia 2018 Water Quality Assessment Guidance Manual. The 2018 IR guidance is designed to integrate or combine the 305(b) overall assessment of Virginia’s waters and separate out those waters impaired and needing a TMDL as per Section 303(d) of the Clean Water Act. The EPA Integrated Report Guidance and Assessment Database (ADB V2.3.1) have 5 different assessment categories in which every segment or “assessment unit” (AU) will be placed. The EPA Guidance allows the states to subdivide the federal categories in order to address state programmatic needs. Virginia’s 2018 IR guidance contains the categories and subcategories Virginia has chosen for enhanced tracking and data management purposes.
The 2018 IR guidance manual contains a number of changes, all enumerated in Part II. One notable addition pertains to the monitoring and assessment summary for determining recreation use impacts due to algal growth (Appendix I).
The data window to be used in the development of the 2018 Integrated Report is January 1, 2011 through December 31, 2016. The manual uses excerpts from the “EPA 2006 Integrated Report Guidance”, “2008 and 2010 EPA Integrated Report Clarification Guidance”, “EPA 1997 Guidelines for the Preparation of the 1998
i
State Water Quality Assessment 305(b) Reports”, and “Assessment Database (ADB) Systems User’s Manual” published by EPA, along with other State and Federal guidelines.
Electronic Copy:
An electronic copy of this guidance in PDF format is available for staff internally on DEQNET, and for the general public on DEQ's website at: http://www.deq.virginia.gov/Programs/Water.aspx .
Contact information:
If you have any questions regarding the guidance manual, you can contact Amanda Shaver, Department of Environmental Quality, P.O. Box 1105, Richmond, Virginia 23218. Telephone (804) 698-4181, FAX (804) 698-4032, or via e-mail [email protected].
Disclaimer:This document has been developed based on Virginia’s Water Quality Standards Regulation (9 VAC 25-260), with amendments approved by the State Water Control Board resulting from iterative Triennial Reviews or periodic rulemakings. It is provided as guidance and, as such, sets forth standard operating procedures for the agency. However, it does not mandate nor prohibit any particular method for the analysis of data, establishment of a wasteload allocation, or establishment of a permit limit. If alternative proposals are made, such proposals should be reviewed and accepted or denied based on their technical adequacy and compliance with appropriate laws and regulations.
ii
WATER QUALITYASSESSMENT GUIDANCE MANUAL
for
2018
305(b)/303(d) Integrated Water Quality Report
December 2018
iii
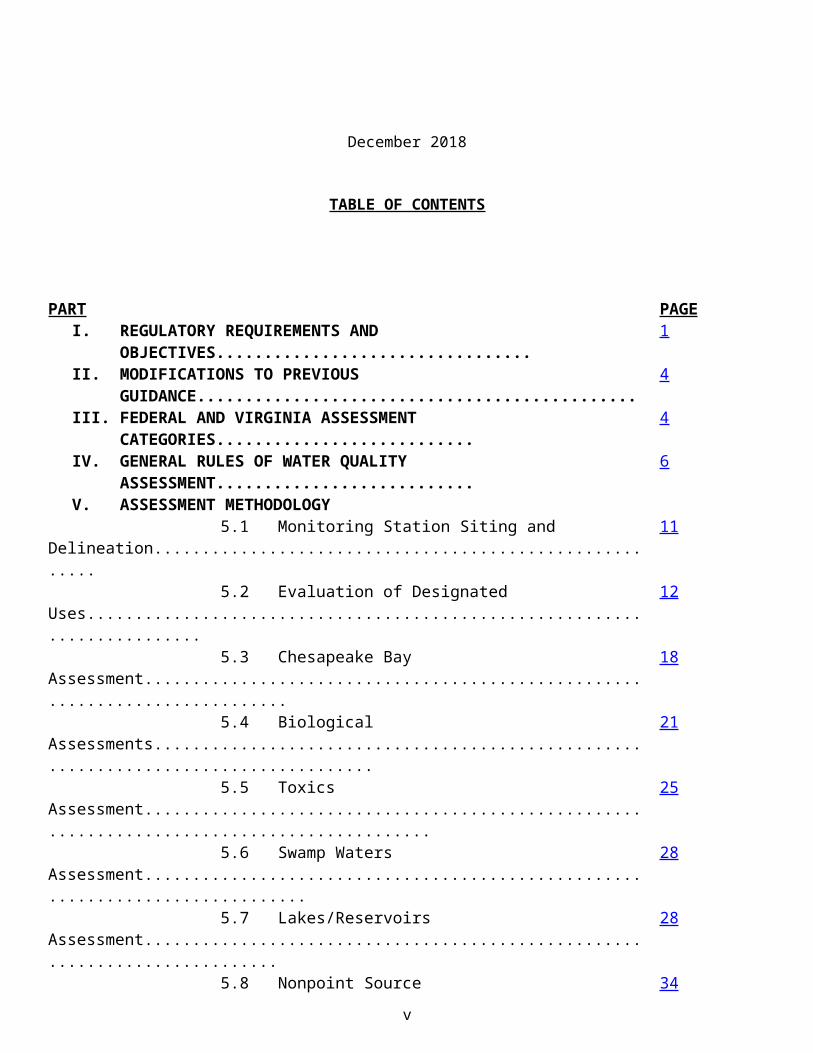
TABLE OF CONTENTS
PART PAGEI. REGULATORY REQUIREMENTS AND OBJECTIVES................................. 1II. MODIFICATIONS TO PREVIOUS GUIDANCE.............................................. 4III. FEDERAL AND VIRGINIA ASSESSMENT CATEGORIES........................... 4IV. GENERAL RULES OF WATER QUALITY ASSESSMENT........................... 6V. ASSESSMENT METHODOLOGY
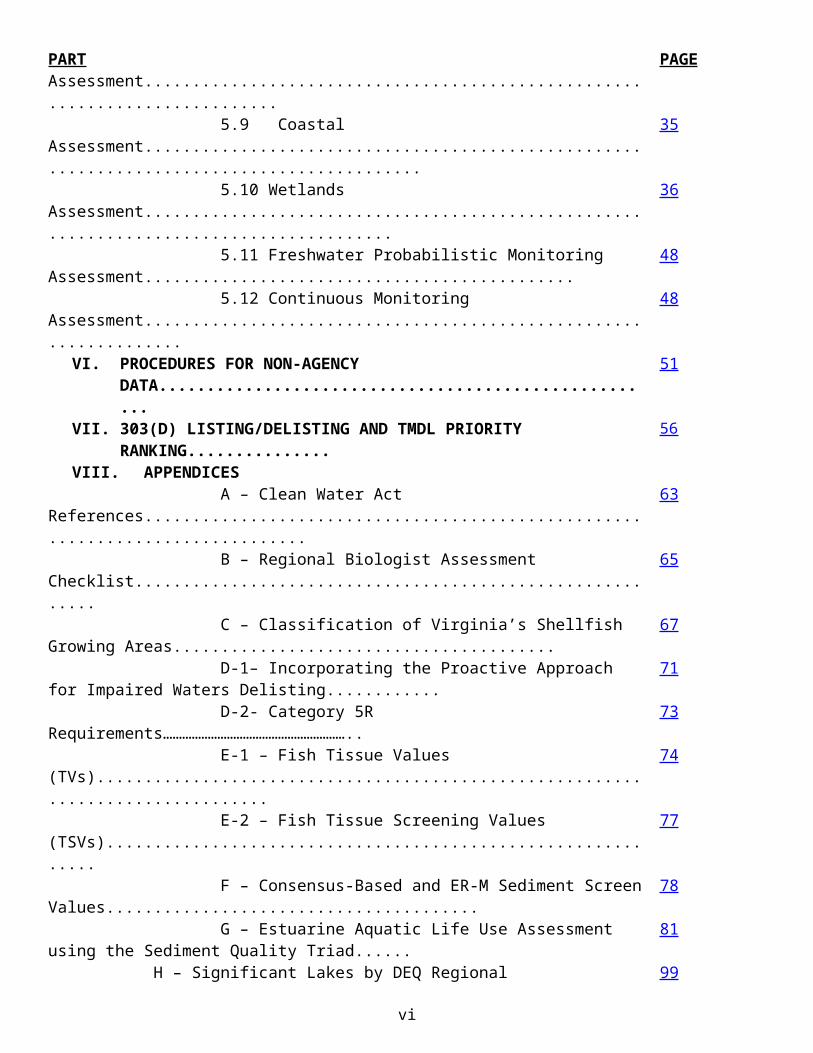
5.1 Monitoring Station Siting and Delineation........................................................ 11 5.2 Evaluation of Designated Uses.......................................................................... 12 5.3 Chesapeake Bay Assessment............................................................................. 18 5.4 Biological Assessments..................................................................................... 21 5.5 Toxics Assessment............................................................................................ 25 5.6 Swamp Waters Assessment............................................................................... 28 5.7 Lakes/Reservoirs Assessment............................................................................ 28 5.8 Nonpoint Source Assessment............................................................................ 34 5.9 Coastal Assessment........................................................................................... 35 5.10 Wetlands Assessment........................................................................................ 36 5.11 Freshwater Probabilistic Monitoring Assessment............................................. 48 5.12 Continuous Monitoring Assessment.................................................................. 48
VI. PROCEDURES FOR NON-AGENCY DATA..................................................... 51VII. 303(D) LISTING/DELISTING AND TMDL PRIORITY RANKING............... 56VIII. APPENDICES
A – Clean Water Act References............................................................................... 63 B – Regional Biologist Assessment Checklist.......................................................... 65 C – Classification of Virginia’s Shellfish Growing Areas........................................ 67 D-1– Incorporating the Proactive Approach for Impaired Waters Delisting............ 71 D-2- Category 5R Requirements………………………………………………….. 73 E-1 – Fish Tissue Values (TVs)................................................................................ 74 E-2 – Fish Tissue Screening Values (TSVs)............................................................. 77 F – Consensus-Based and ER-M Sediment Screen Values....................................... 78 G – Estuarine Aquatic Life Use Assessment using the Sediment Quality Triad...... 81
H – Significant Lakes by DEQ Regional Offices…………………………………. 99 I – Shenandoah River Algae Monitoring and Assessment Summary....................... 102
iv
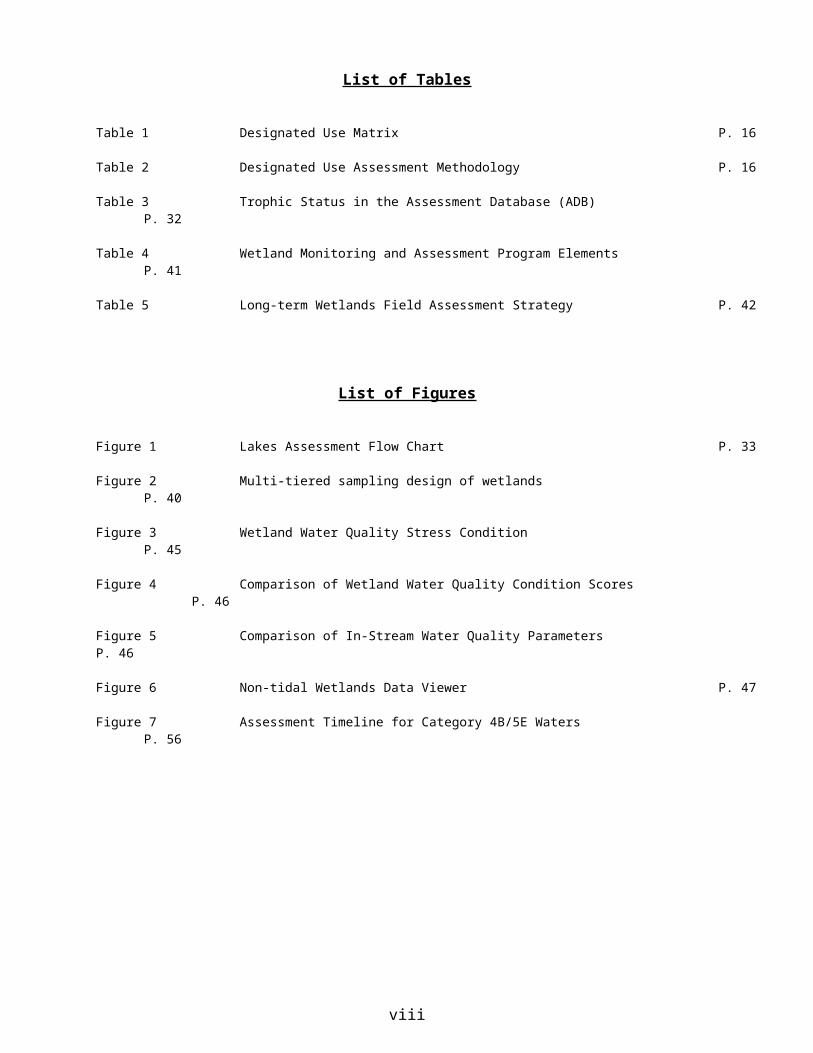
List of Tables
Table 1 Designated Use Matrix P. 16
Table 2 Designated Use Assessment Methodology P. 16
Table 3 Trophic Status in the Assessment Database (ADB) P. 32
Table 4 Wetland Monitoring and Assessment Program Elements P. 41
Table 5 Long-term Wetlands Field Assessment Strategy P. 42
List of Figures
Figure 1 Lakes Assessment Flow Chart P. 33
Figure 2 Multi-tiered sampling design of wetlands P. 40
Figure 3 Wetland Water Quality Stress Condition P. 45
Figure 4 Comparison of Wetland Water Quality Condition Scores P. 46
Figure 5 Comparison of In-Stream Water Quality Parameters P. 46
Figure 6 Non-tidal Wetlands Data Viewer P. 47
Figure 7 Assessment Timeline for Category 4B/5E Waters P. 56
v
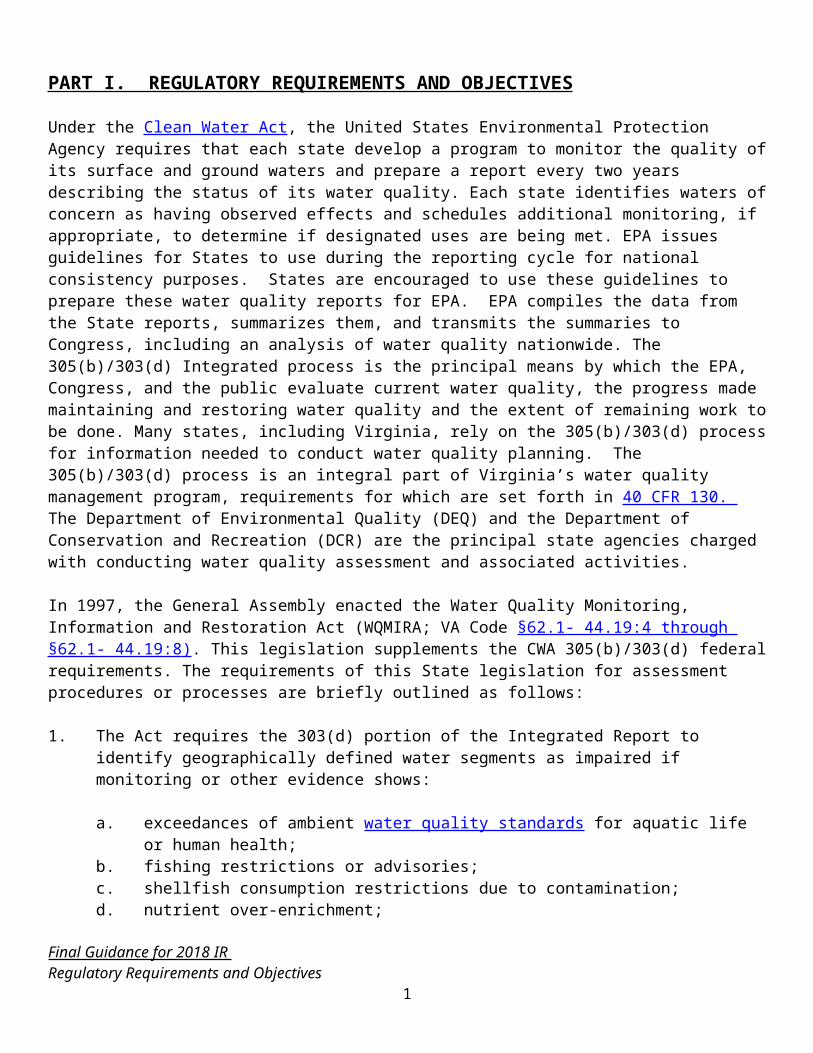
PART I . REGULATORY REQUIREMENTS AND OBJECTIVES
Under the Clean Water Act, the United States Environmental Protection Agency requires that each state develop a program to monitor the quality of its surface and ground waters and prepare a report every two years describing the status of its water quality. Each state identifies waters of concern as having observed effects and schedules additional monitoring, if appropriate, to determine if designated uses are being met. EPA issues guidelines for States to use during the reporting cycle for national consistency purposes. States are encouraged to use these guidelines to prepare these water quality reports for EPA. EPA compiles the data from the State reports, summarizes them, and transmits the summaries to Congress, including an analysis of water quality nationwide. The 305(b)/303(d) Integrated process is the principal means by which the EPA, Congress, and the public evaluate current water quality, the progress made maintaining and restoring water quality and the extent of remaining work to be done. Many states, including Virginia, rely on the 305(b)/303(d) process for information needed to conduct water quality planning. The 305(b)/303(d) process is an integral part of Virginia’s water quality management program, requirements for which are set forth in 40 CFR 130. The Department of Environmental Quality (DEQ) and the Department of Conservation and Recreation (DCR) are the principal state agencies charged with conducting water quality assessment and associated activities.
In 1997, the General Assembly enacted the Water Quality Monitoring, Information and Restoration Act (WQMIRA; VA Code §62.1- 44.19:4 through §62.1- 44.19:8 ) . This legislation supplements the CWA 305(b)/303(d) federal requirements. The requirements of this State legislation for assessment procedures or processes are briefly outlined as follows:
1. The Act requires the 303(d) portion of the Integrated Report to identify geographically defined water segments as impaired if monitoring or other evidence shows:
a. exceedances of ambient water quality standards for aquatic life or human health;b. fishing restrictions or advisories;c. shellfish consumption restrictions due to contamination;d. nutrient over-enrichment;e. significant declines in aquatic life biodiversity or populations; and/orf. contamination of sediments at levels which exceed water quality standards or threaten aquatic
life or human health.
2. Waters identified as “naturally impaired”, “fully supporting but threatened” or “evaluated” (without monitoring) as impaired shall be set out in the 303(d) portion of the Integrated Report in the same format as those listed as “impaired.”
3. The 303(d) portion of the Integrated Report shall include an assessment, conducted in conjunction with other appropriate state agencies, for the attribution of impairment to point and nonpoint sources. The absence of point source permit violations at or near the impaired water shall not conclusively support a determination that impairment is due to nonpoint sources. In determining the cause for impairment, the Board shall consider the cumulative impact of 1) multiple point source discharges, 2) individual discharges over time, and 3) nonpoint sources.
4. The Board shall develop and publish a procedure governing its process for defining and determining impaired water segments and shall provide for public comment on the procedure.
Final Guidance for 2018 IR Regulatory Requirements and Objectives
1

5. The Integrated Report, inclusive of CWA sections 305(b) and 303(d) shall be produced in accordance with the schedule required by federal law and shall incorporate at least the preceding five years of data, where appropriate. Data older than five years shall be incorporated when scientifically appropriate for trend analysis or other longer term considerations.
6. The Integrated Report, inclusive of CWA sections 305(b) and 303(d), shall be developed in consultation with scientists from state universities prior to submission by the Board to EPA.
7. The Integrated Report, inclusive of CWA sections 305(b) and 303(d), shall indicate water quality trends for specific, easily identifiable, geographically defined water segments and provide summaries of the trends using available data and evaluations. This will allow the citizens of the Commonwealth to easily interpret and understand the conditions of the geographically defined water segments.
8. Based on the information in the Integrated Report, inclusive of CWA sections 303(d) and 305(b), the Board shall request the Department of Game and Inland Fisheries (DGIF) or the Virginia Marine Resources Commission (VMRC) to post notices at public access points for all “toxic” impaired waters. The notice, prepared by the Board, shall contain the basis for the impaired designation and a statement of potential health risks. The Board shall coordinate with the DGIF and VMRC to assure that adequate notice of posted waters is provided to those purchasing hunting and fishing licenses.
The Water Quality Monitoring, Information, and Restoration Act directs DEQ to develop and publish a water quality assessment guidance document governing the process for defining and determining impaired waters, and to provide an opportunity for public comment on the assessment guidance. Public comment will be solicited through (to be determined) on the draft version of this guidance. This document can be found on the DEQ website at http://www.deq.virginia.gov/Programs/Water/WaterQualityInformationTMDLs/WaterQualityAssessments.aspx.
The purpose of this guidance manual is to guide DEQ staff in the development and reporting of the 2018 Integrated Report (305(b) Water Quality Assessment 305(b)/303(d) Impaired Waters). It is also intended to assist the public in understanding the monitoring and assessment process.
Section 305(b) of the Clean Water Act requires each state to submit a biennial report to EPA describing the quality of its navigable waters. The 305(b) report provides DEQ’s best overall assessment of water quality conditions and trends in the Commonwealth. The report is intended to be used as a tool in planning and management of water quality in Virginia. The report also directs continuous planning and implementation activities in coordination with the State Water Quality Management Plan and the Continuous Planning Process (CPP).
Primary objectives of the Integrated Report are:
1. To educate and inform citizens and public officials about Virginia’s overall water quality.
2. To analyze water quality data in order to determine the extent to which Virginia’s waters are supporting the applicable designated uses and to compare the results to WQ Standards and other appropriate criteria and guidelines.
3. To determine the causes for the “failure to support” the designated uses of the State’s waters.
Final Guidance for 2018 IR Regulatory Requirements and Objectives
2
4. To determine the nature and recognizable extent of point and nonpoint source impacts in accordance with state and federal guidelines.
Section 303(d) of the Clean Water Act and the Environmental Protection Agency’s regulation 40 CFR Section 130.7 (d), promulgated in July 1992, requires each state to submit a Total Maximum Daily Load (TMDL) Priority List to EPA on April 1 of even numbered years. Category 5 signifies waters that are impaired and need a TMDL.
Impaired waters needing a TMDL are those waters that do not meet water quality standards due to a pollutant(s). A pollutant, as defined in 40 CFR 122.2, means: any dredged spoil, solid waste, incinerator residue, filter backwash, sewage, garbage, sewage sludge, munitions, chemical wastes, biological materials, radioactive materials (except those regulated under the Atomic Energy Act of 1954, as amended (42 U.S.C. 2011 et seq.)), heat, wrecked or discarded equipment, rock, sand, cellar dirt and industrial, municipal, and agricultural waste discharged into water.
Category 4 includes waters that are “water quality effluent limited” and other waters not needing a TMDL. Waters receiving effluent from facilities with water quality-based effluent limits in their Virginia Pollution Discharge Elimination System (VPDES) permits, with schedules of compliance to meet these limits within the next reporting cycle or within the current permit cycle (5 years), are considered Subcategory 4B (impaired but not needing a TMDL) due to the control requirements and compliance schedules associated with the VPDES permit or other alternative control requirements. Waters where compliance schedules extend past the current permit cycle or into the next assessment cycle are considered part of the 303(d) impaired waters list (Subcategory 5E).
EPA’s Integrated Report Guidance recommends that states submit an “Integrated Report” that will satisfy Clean Water Act (CWA) requirements for Sections 305(b) overall water quality report, 303(d) Impaired Waters List and Section 314 assessment of publicly owned lakes. This Integrated Report shows the following information:
delineation of water quality assessment units (AUs) based on National Hydrography Dataset (NHD); status of and progress toward achieving comprehensive assessments of all waters; attainment status of water quality standards (WQS) for every AU assessed; additional monitoring that may be needed to determine WQS attainment status and, if necessary, to
support development of TMDLs for each pollutant/AU combination; schedules for additional monitoring planned for AUs; pollutant/AU combinations still requiring TMDLs; and TMDL development schedules reflecting the priority ranking of each pollutant/AU combination. water quality “effluent limited” waters.
Virginia’s biennial water quality assessment is conducted by the Department of Environmental Quality (DEQ), with the assistance of the Department of Conservation and Recreation (DCR) and the Virginia Department of Health (VDH), to determine the water quality conditions in the Commonwealth. The results of this water quality analysis are usually reported to the EPA by April 1 of even numbered years. The Integrated Report describes the aggregated water quality conditions of the State and contains the individual listing of those waters identified as “impaired” for one or more designated uses and needing a Total Maximum Daily Load (TMDL). As per EPA guidance, the former 305(b) Water Quality Assessment Report and the 303(d) Impaired Waters List are now combined into a single Integrated Report. EPA compiles the data from all State reports into a national water quality status report that is presented to Congress.
Final Guidance for 2018 IR Regulatory Requirements and Objectives
3
PART II . MODIFICATIONS TO PREVIOUS GUIDANCE
DEQ has incorporated EPA Integrated Reporting guidance initially developed in 2004, with all subsequent versions current to March 2018. DEQ’s guidance for the 2018 Integrated Report contains the following modifications:
1. Section 5.7 Lakes/Reservoirs Assessment updated to reflect revised pH water quality standards.
2. All references to a ‘violation’ in regards to assessment methods have been updated to an ‘exceedance’ to more accurately reflect the intent of the report.
3. Development and inclusion of a filamentous algae monitoring plan and assessment summary.
The following modifications were included as a result of public comments received on the Draft 2018 Guidance Manual:
1. Section 5.6 Naturally Low DO and pH Evaluation in Swamp Waters: An update on the current process for reclassification of Virginia’s swamp waters and removal of the current process no longer in use.
2. A revised Figure 1. Lake Assessment Flow Chart
3. Part VII. 303(d) Listing/Delisting and TMDL Priority Ranking: Updated language included
4. Appendix I: Filamentous Algae Monitoring Plan and Assessment Summary: Updated language included
PART III. FEDERAL AND VIRGINIA ASSESSMENT CATEGORIES
The 2018 EPA Integrated Report Guidance and Assessment Database (ADB V2.3.1) has five major categories and three subcategories which every “assessment unit” (AU) are placed based on designated use attainment. Additionally, Virginia has created several subcategories to supplement the federal categories, enabling a more precise water quality tracking and reporting mechanism.
Below are the US EPA-defined categories and associated Virginia-defined subcategories:
FULLY SUPPORTING - Waters are supporting one or more designated uses
EPA Category 1 - Attaining all associated designated uses and no designated use is threatened
Va. Category 1A - waters are attaining all uses and a TMDL has been developed for one or more uses.
EPA Category 2 – Available data and/or other information indicate that some, but not all of the designated uses are supported.
Va. Category 2A - waters are supporting all of the uses for which they are monitored.
Final Guidance for 2018 IR Regulatory Requirements and Objectives
4
Va. Category 2B - waters are of concern to the state but no Water Quality Standard exists for a specific pollutant, or the water exceeds a state screening value or toxicity test.
Va. Category 2C - waters are now attaining the use(s) for which they were originally 303(d) listed and the TMDL is EPA approved but other applicable use(s) were not monitored and assessed.
INDETERMINATE - Waters needing additional information
EPA Category 3 - Insufficient data and/or information to determine whether any designated uses are met.
Va. Category 3A - no data are available within the data window of the current assessment to determine if any designated use is attained and the water was not previously listed as impaired.
Va. Category 3B - some data exist but are insufficient to determine support of designated uses. Such waters will be prioritized for follow up monitoring, as needed.
Va. Category 3C- data collected by a citizen monitoring or another organization indicating water quality problems may exist but the methodology and/or data quality has not been approved for a determination of support of designated use(s). These waters are considered as having insufficient data with observed effects. Such waters will be prioritized by DEQ for follow up monitoring.
Va. Category 3D - data collected by a citizen monitoring or other organization indicating designated use(s) are being attained but the methodology and/or data quality has not been approved for such a determination.
IMPAIRED - Waters are impaired or threatened but a TMDL is not required.
EPA Category 4A - water is impaired or threatened for one or more designated uses but does not require a TMDL (an EPA approved TMDL already exists or the waterbody has been nested within an approved TMDL). In the case of a nested water, a new TMDL is not necessary to address the newly impaired water if the nesting procedure is followed (see Part VII, Rule 3).
EPA Category 4B - water is impaired or threatened for one or more designated uses but does not require the development of a TMDL because other pollution control requirements (such as VPDES limits under a compliance schedule) are reasonably expected to result in attainment of the Water Quality Standard by the next reporting period or permit cycle.
EPA Category 4C - water is impaired or threatened for one or more designated uses but does not require a TMDL because the impairment is not caused by a pollutant. This category includes Virginia waters that are suspected swampwaters awaiting applicable aquatic life criteria because the impairment is determined to be caused by natural conditions.
Va. Category 4D - part(s) of a water quality standard is attained for a pollutant with a TMDL, but the remaining criteria for the standard were not assessed due to insufficient information. (Only to be applied to dissolved oxygen in tidal waters of the Chesapeake Bay).
IMPAIRED - Waters are impaired or threatened and require a TMDL
Final Guidance for 2018 IR Regulatory Requirements and Objectives
5
EPA Category 5 - Waters are impaired or threatened and a TMDL is needed.
Va. Category 5A - a Water Quality Standard is not attained. The water is impaired or threatened for one or more designated uses by a pollutant(s) and requires a TMDL (303d list). Va. Category 5B - the Water Quality Standard for shellfish use is not attained. One or more pollutants causing impairment require TMDL development.
Va. Category 5C - the Water Quality Standard is not attained due to “suspected” natural conditions. The water is impaired for one or more designated uses by a pollutant(s) and may require a TMDL (303d list). WQ Standards for these waters may be re-evaluated due to the presence of natural conditions.
Va. Category 5D - the Water Quality Standard is not attained where TMDLs for a pollutant(s) have been developed but one or more pollutants are still causing impairment requiring additional TMDL development.
Va. Category 5E - effluent limited facilities are not expected to meet compliance schedules by next permit cycle or reporting period.
Va. Category 5F - the Water Quality Standard is attained for a pollutant(s) with a TMDL and 303(d) delisting approved but the water remains impaired for additional pollutant(s) requiring TMDL development.
Va. Category 5R - the Water Quality Standard is not attained and the water is impaired, and implementation of an EPA-accepted restoration plan is expected to result in attainment. A status update will be provided each 303(d) cycle to evaluate progress.
EPA Category 5M - the Water Quality Standard is not attained for mercury primarily due to atmospheric deposition.
PART IV. GENERAL RULES OF WATER QUALITY ASSESSMENT
305(b)/303(d) assessments seek to characterize surface waters under typical, ambient conditions. For this reason, water quality assessments are based on data that are representative of normal conditions. The assessment begins by analyzing all QA/QC approved data from DEQ ambient water quality monitoring stations, biological, sediment and fish tissue monitoring, special studies and/or other non-DEQ water quality data collected during the six-year assessment period. This interval of time works in concert with the ambient rotating watershed monitoring program. Assessment data are compared to both numeric and narrative criteria established for Virginia’s designated uses and promulgated in its water quality standards (WQS; 9 VAC 25-260). Listing decisions will not be based on datasets that are solely targeted or biased1.
The following list of rules is to be applied uniformly, only to be modified after internal review or directive from EPA. Specific assessment procedures are outlined later in this document.
1[1] DEQ may assess targeted datasets collected to investigate probable stressors for existing benthic impairments (i.e. toxics). This may lead to the identification of other assessment units with impaired aquatic life uses. These impairments may be addressed under the TMDL(s) developed to address the initial benthic impairment. Final Guidance for 2018 IR Regulatory Requirements and Objectives
6
Rule 1
Impaired waters are defined as those with exceedances of recurring or human health-related water quality standards as documented by QA/QC-approved monitoring data. Predictive data generally refers to computer-generated modeling data and may be used for assessment purposes on a case-by-case basis. Impairments are generally determined from exceedances of the numeric/narrative water quality standards, using the guidelines described in Part V of this manual.
Previous EPA guidance recommends the use of an exceedance rate of >10.5% of the total samples analyzed to establish impairment using conventional parameters (i.e., dissolved oxygen, pH, temperature, and bacteria). This “allowable” exceedance rate takes into account equipment failure and/or human error. Single samples (n = 1) will be considered insufficient information for assessment. A single exceedence of the WQS for conventional parameters is also considered insufficient justification for 303(d) listing (though sufficient for “observed effects” categorization). At least two exceedences and > 10.5% of the total samples are required for a water to be listed as impaired. Maximum temperature in tidal waters up to the fall line will not be assessed due to the lack of standards for maximum temperature in these waters.
Rule 2
Waters where restrictions are placed on shellfishing and fish consumption uses by the Virginia Department of Health (VDH) are not meeting designated uses (9 VAC 25–260–10 A.) and determined to be impaired, unless the designated use has been administratively removed. Uses are administratively removed in the presence of a permitted discharge outfall and any associated VDH safety zone, salinity regimes are not conducive for productive harvest, or a consumption advisory not restricting the designated use has been issued.
Rule 3
Escherichia coli (freshwater) and enterococci (saltwater and transition zone) data will be assessed for the recreation designated use. These indicators replaced fecal coliform bacteria in 2006. Any waters previously listed for fecal coliform will remain as impaired until appropriate bacteria data are available and assessed.
The E. coli/enterococci maximum standard of 235 per 100 ml (E. coli in freshwater) and 104 per 100 ml (enterococci in saltwater and transition zone) applies when a minimum of four weekly samples per month are not available to calculate a geometric mean. Where data are not sufficient to calculate a monthly geometric mean, at least two exceedances and >10.5% of the total samples taken during the assessment period exceeding the single sample maximum bacteria standard for primary contact recreation is impaired.
When appropriate, the monthly geometric mean standard of 126 per 100 ml (E. coli) for freshwater and 35 per 100 ml (enterococci) for saltwater and transition zone applies when a minimum of four weekly samples are collected during any calendar month. See 9 VAC 25-260-140-C for freshwater, saltwater, and transition zone delineation. One geometric mean exceedance in the assessment window constitutes an impairment. However, beaches under surveillance by VDH and characterized by weekly monitoring during warm weather months (May to September) are allowed a single exceedance of the geometric mean provided that it does not occur within the most recent two years of the assessment window and it can be attributed to an unusually intense wet-weather event such as a hurricane or tropical storm.
Final Guidance for 2018 IR Regulatory Requirements and Objectives
7
Bacteria densities reported as both Colony Forming Units (CFU) and Most Probable Number (MPN) shall be assessed against the numeric values in 9VAC25-260-170-A, pursuant EPA’s approval of the methods specified in 40 CFR Part136.3. Approved test methods that report either unit shall be used for assessment.
Rule 4
Conventional parameter data generated by probabilistic monitoring (ProbMon) networks will be used to create a general overview of those waters and to direct targeted monitoring in the future. For most ProbMon stations, only one data point per parameter will be available, providing insufficient information for determination of impairment. A single “grab sample” exceedance of human health or aquatic life toxic criteria is assessed as fully supporting with an observed effect and follow-up monitoring should be conducted as resources allow to determine if the water is impaired. A single chronic or acute exceedance of a 30-day semi-permeable membrane device (SPMD) sample for a toxic parameter associated with aquatic life and wildlife use is considered fully supporting with an observed effect. For ProbMon stations with two data points for conventional parameters, assessment will be the same as any station with two or more data points. Benthic data will be compared to the Virginia Stream Condition Index (VSCI) or Virginia Coastal Plain Macroinvertebrate Index (VCPMI) and assessed accordingly.
Rule 5
To be eligible for assessment, a continuous monitoring dataset must cover at least 30 days (consecutive or otherwise), except in the assessment of maximum hourly temperature change criteria, which may be assessed on a dataset spanning no less than 15 days. The continuous monitoring dataset will have undergone rigorous and standardized QA/QC screening before analysis. If a continuous monitoring dataset is used to place a water on the 303(d) Impaired Waters List, then an additional continuous monitoring dataset, collected during a subsequent year, during the same month(s) as the listing dataset, must be used to delist it. See Section 5.12 for detailed assessment methodology.
Rule 6
When data are insufficient for the determination of use attainment but indicate possible impairment, additional monitoring should be considered. “Observed effects” are indications in the form of single sample WQS exceedances, observed pollutants or signs of water quality degradation (i.e., fish kills) lacking specific standards, or lower quality data that point to possible impairment (e.g., high bacteria counts on a Coliscan® plate). This rule applies to conventional and toxic parameters (water column, sediment, nutrient, and fish tissue) as well as biological monitoring.
Rule 7
Waters that are suspected to be impaired due to naturally occurring, non-anthropogenic conditions will be classified as Category 5C (possibly needing a TMDL) of the Integrated Report. Examples of natural impairments include low DO and/or pH in slow-flowing Class VII (swamp) waters or high temperature from thermal springs. If EPA agrees with DEQ’s assessment that the low DO and/or pH are a result of the swamp-like conditions, the water will then be listed in Category 4C (impaired but not needing a TMDL). For waters in Category 5C or 4C, the water quality standards will be reviewed and possibly updated during the next triennial review to reflect variations caused by natural conditions for these
Final Guidance for 2018 IR Regulatory Requirements and Objectives
8
waters. Once appropriate water quality standards are in place, data will be reviewed again to determine whether these waters meet or exceed designated uses. It may be necessary to conduct a TMDL study or Use Attainability Analysis prior to standards modification in order to determine and/or verify the appropriate criteria based on natural pollutant loadings. DO should not be listed as an impairment cause in Class VII waters lacking human-induced pollutant sources, per 9VAC25-260-50. When available, other data—such as fish community composition, habitat assessment, benthic macroinvertebrate composition, etc. —should be evaluated against the narrative criterion to determine use support.
Rule 8
Waters that have been assessed as fully supporting (Category 2) or impaired (Category 4 or 5) will continue to be tracked in the Assessment Database (ADB) and monitoring station list, whether they have recent monitoring data or not. Waters will retain the results of previous assessments for all impaired designated uses. Waters previously classified as Category 5 will carry this designation until a TMDL is developed or additional monitoring data reveal the waters are no longer impaired and needing a TMDL. (Justification must be provided to EPA before removing an impaired water from the 303(d) Impaired Waters List.) In contrast, Category 2 waters can retain their assessment status for only two additional reporting cycles with no new data. After two reporting cycles with no additional data, the water will be classified as “not assessed” and will remain as such until new data is collected and assessed.
Rule 9
For effluent limited waters, if the VPDES permit has been issued with a scheduled compliance date that extends beyond the next 303(d) listing or permit cycle, the water would be listed as Category 5E. If the compliance date falls within the next listing cycle or within the current permit cycle whichever is longer, the water would be listed in Category 4B. See Part VII for additional information.
Rule 10
Duplicate and/or split samples collected for QA/QC purposes will not be used in the assessment. The primary sample (S1) will be assessed against the appropriate standard and the duplicate/split sample (S2) will be used only to document lab analysis quality control.
Rule 11
Sampling stations that happen to be located within a permitted mixing zone, primarily via probabilistic monitoring, will not be individually assessed for aquatic life use. They will be included with the overall probabilistic assessment. Any other stations that inadvertently were located in mixing zones will not be assessed individually for aquatic life use as the use is exempt in mixing zones.
Rule 12
A review of stockable and some natural trout waters currently listed as impaired has revealed that many of these impairments are due to erroneous segment boundaries or natural conditions. Both issues were addressed as part of Virginia’s most recent review of its water quality standards. For the 2018
Final Guidance for 2018 IR Regulatory Requirements and Objectives
9
assessment, these waters will be categorized as Category 2A if specifically addressed via standards and currently meeting new criteria or 4C (impaired due to natural conditions and not needing a TMDL) as long as supporting documentation is provided by the Virginia Department of Game and Inland Fisheries (VDGIF) and endangered species are not being adversely affected. This should prevent and/or correct the misclassification of these segments, pending any amendments during Triennial Review. Once these standard reviews are completed and EPA approved, these waters will be re-evaluated and classified accordingly.
Rule 13
Data associated with multi-probe meters are to be rounded to one decimal place.
Rule 14
Nested impairments are those waters that are included within a pre-existing TMDL watershed. A TMDL requires a specific loading reduction for all waters within the watershed whether they currently meet the standard or not. Once the TMDL is approved by EPA, any waters within the watershed that are subsequently assessed as impaired for the parameter targeted by the TMDL will be considered Category 4A (impaired but has a TMDL). Nested impairments are normally bacteria related to recreation and shellfish consumption uses, but may also include benthic impairments (aquatic life use) depending on the stressors involved.
Rule 15
Division of Consolidated Laboratories (DCLS) has determined that total dissolved ammonia and total ammonia are essentially the same parameter. Thus, where only dissolved ammonia data are available, these will be used to assess against the total ammonia criteria. Where both data are available, total ammonia should be used to assess the criteria.
Rule 16
Shellfish waters where restrictions or prohibitions are due solely to a discharge outfall and associated buffer zone or where the use is deemed too limited to harvest due to low salinity or other natural reasons—and not due to water quality exceedances—will not be included in the 303(d) list. In these cases, monitoring should not be conducted as the shellfish designated use has been administratively removed through the issuance of a discharge permit or prohibition on harvesting.
Rule 17
Uncensored values should be pulled from the Comprehensive Environmental Database System (CEDS) when evaluating toxics.
PART V. ASSESSMENT METHODOLOGY
5.1 Monitoring Station Siting and Delineation
DEQ has a vast network of active Ambient Water Quality Monitoring (AWQM) stations and a number of biological stations statewide. The AWQM stations are generally monitored bimonthly while the biological stations are normally monitored twice a year (usually in the spring and fall). Monitoring programs can be Final Guidance for 2018 IR Regulatory Requirements and Objectives
10
designed based on a “targeted” (conventional) approach or a “probability based” random selection approach or a combination of the two. Each monitoring program design has its advantages and disadvantages. Historically, most of DEQ’s monitoring strategy has been based on the conventional approach. Many of the stations were located in proximity to (above and below) Virginia Pollutant Discharge Elimination System (VPDES) facility outfalls. During this reporting cycle, DEQ has continued to use a rotating watershed approach where stations are sited for two years of bimonthly sampling within a selected major river basin. The number of stations per watershed is based on the drainage area of the watershed and the Department of Conservation and Recreation (DCR) “nonpoint source potential” rating of the watershed. In order to provide consistency between the regional planning staff and to get an accurate number of assessed stream miles in Virginia, the following stream delineation guidelines are the primary considerations used in the assessment unit (segment) size decisions. However, in certain cases, best professional judgment of the regional staff may be used if the delineation results are contrary to these guidelines. Where appropriate, documentation of these decisions should be included in the segment narrative.
1. Typically, no more than 10 miles of free-flowing stream should be assessed by conventional pollutant data from one ambient monitoring station. Miles assessed for a toxic pollutant or biological impairment may vary from the miles assessed for conventional parameters.
2. One monitoring station should not be used to assess an entire watershed unless land use, source, and habitat are relatively homogeneous.
3. When determining the miles assessed for a free-flowing monitoring station, the following items need to be considered:
a) WQ Standards use designations (i.e. classes and/or special standards)
b) point and/or nonpoint source input to the stream or its tributaries,
c) watershed characteristics such as land use,
d) local habitat characteristics such riparian vegetation, stream banks, substrate, slope, or channel morphology,
e) entry of a large tributary or diversion, or
f) hydrologic features such as channelization or dams.
4. For non-Chesapeake Bay Program tidal and estuarine stations, EPA guidance suggests using a 4-mile radius for open water stations; a 2-mile radius for sheltered bay stations, and a 0.5 mile radius for highly sheltered bay stations.
5. Segment delineation will be performed using the USGS National Hydrography Dataset (NHD) coverage or other appropriate GIS dataset.
6. Spatial coverage for estuarine probabilistic monitoring stations should be identified in conjunction with the development of the monitoring plan and coordinated by regional monitoring and assessment staff and/or the Chesapeake Bay Program monitoring coordinator and Bay monitoring staff. Estuarine B-IBI data will be assessed according to the methodology described in Appendix G.
Final Guidance for 2018 IR Regulatory Requirements and Objectives
11
7. If the mixing zone of a VPDES-permitted facility exists in an impaired segment, the parameter-specific length of the mixing zone is specifically understood to be separate from the impaired segment, even though the boundaries of the segment and/or its description may show the impairment as continuous.
8. Probabilistic stations in free-flowing waters will not be delineated into 303(d) segments unless they are characterized by toxics data, biological data, or more than one measurement of a conventional parameter.
5.2 Evaluation of Designated Uses
The 305(b) process assesses a total of six primary designated uses, as appropriate for a particular waterbody, based on Water Quality Standards: wildlife, aquatic life, recreation, fish consumption, shellfishing, and public water supply uses. The Chesapeake Bay criteria, adopted in 2005, have sub-divided the aquatic life use into several distinct sub-uses. Following are details relating to the assessment of the six designated uses of Virginia’s waters.
1. Wildlife Use:
Wildlife use includes the propagation, growth, and protection of a balanced, indigenous population of wildlife.
Support of wildlife use is determined by assessing the toxic standards for aquatic life found in 9 VAC-25-260-140 B. These criteria were developed to protect aquatic life as well as wildlife. For toxic pollutant assessment in free-flowing streams, waters where there are two or more samples and no exceedances of aquatic life criteria within a running 3-year period, using grab samples or SPMD data, are considered fully supporting for wildlife use. For toxic pollutant assessment in free-flowing streams, waters where there are two or more exceedances of the same WQS aquatic life toxic criteria in a running 3-year period using grab samples or SPMD data are considered impaired for wildlife use.
2. Aquatic Life Use:
Aquatic life use includes the propagation, growth, and protection of a balanced indigenous population of aquatic life (including game and marketable fish) which may be expected to inhabit the waters.
Support of aquatic life use can be determined by the assessment of conventional parameters (dissolved oxygen, pH and temperature), toxic pollutants in the water column (relative to water quality standards), toxic pollutant analysis of sediments, toxicity testing, nutrient analysis and/or the biological assessment of benthic communities. All available data, relative to aquatic life use, shall be considered to determine if the aquatic life use is being supported. This assessment includes the sub-categories of aquatic life use associated with the Chesapeake Bay criteria. The maximum temperature will not be assessed for aquatic life in tidal waters since no maximum temperature standard is applicable.
Conventional parameters are assessed using the “Percent Method”. A 10.5% exceedance threshold is used for determining full support or impairment for conventional pollutants. An exceedance rate that is > 10.5% with at least two exceedances is normally considered impaired. An exceedance rate ≤ 10.5% is considered fully supporting. A single exceedance in a small dataset (2-9 samples) is considered insufficient to indicate fully supporting or impaired.Final Guidance for 2018 IR Regulatory Requirements and Objectives
12
For dissolved oxygen, the instantaneous minimum standard is used to assess exceedances unless continuous monitoring data are available to assess the daily average. See Section 5.12 for assessment methodology for continuous monitoring. Dissolved oxygen in the Chesapeake Bay and its tributaries is assessed according to the method outlined in Section 5.3.
For free-flowing stream benthic macroinvertebrate assessments, data for the overall assessment period is rated as non-impaired when the Virginia Stream Condition Index (VSCI) or the Virginia Coastal Plain Macroinvertebrate Index (VCPMI) scores are at or above their respective impairment thresholds. (60 for the VSCI or 40 for the VCPMI).
A project to refine the estuarine biological assessment methodology (B-IBI) was completed in 2006 and approved for use by EPA. The same methodology will be used again for 2018. See Section 5.3 and Appendix G for more information.
For toxic pollutant assessment in free-flowing streams, both chronic and acute criteria can be assessed whenever sufficient data are available. Chronic criteria are to be assessed when multiple grab samples are collected within two separate four-day periods within a three-year period, or when there are two or more separate 30-day SPMD deployments within a three-year period. Two samples (either grab or SPMD) taken within three consecutive years are sufficient to assess acute criteria.
3. Fish Consumption Use:
Fish consumption use includes the propagation, growth and protection of a balanced population of aquatic life including game and marketable fish. Human health is also a primary consideration with regard to fish consumption use. Support of this use is determined using three separate criteria.
First, support or lack thereof, is based on human health related advisories and/or restrictions issued by the Virginia Department of Health (VDH). The fish consumption use is determined to be impaired when the public is advised by VDH that fish consumption is prohibited for the general population or an advisory that certain fish species should not be consumed by the general population or sub-populations at greater risk, such as children and/or pregnant women.
Second, the assessment methodology used for fish consumption use is a comparison of fish tissue data to WQS criterion-based tissue values (TVs) and tissue screening values (TSVs) for toxic pollutants. Any single observation above the TV or TSV results in the water being assessed as fully supporting but having an observed effect. Two or more exceedances of a particular TV listed in Appendix E-1 results in an impaired assessment of the water for the fish consumption designated use.
Third, support of the fish consumption use is determined by comparison of water column or semi-permeable membrane device analytes to the human health criteria in public water supplies and other surface waters, as listed in the WQS (9 VAC-25-260-140 B).
4. Shellfishing Use:
Shellfishing use includes the propagation, growth and protection of a balanced population of aquatic life including marketable shellfish.
Final Guidance for 2018 IR Regulatory Requirements and Objectives
13
Use support is based on the determination of restrictions or condemnations on the harvesting and marketability of shellfish resources made by the VDH-Division of Shellfish Sanitation (DSS) as of the most recent condemnation list (December 2016) associated with the reporting period. DSS has the statutory authority to determine shellfish harvesting and marketability status. DSS uses four classifications for describing the status of shellfish waters:
Open: Growing areas from which shellfish may be taken for direct marketing at all times.
Conditionally Condemned,Seasonally Restricted: Growing areas where the water quality may be affected by seasonal or
sporadic use of boat docks or harbor facilities are considered conditionally approved. Normally, this would occur during the boating season (April 30 through October 31).
Restricted: Growing areas where a sanitary survey indicates a limited degree of pollution which makes it unsafe to market shellfish for direct marketing. Shellfish from such areas may be marketed after purifying or relaying activities in accordance with certain VDH-DSS requirements.
Prohibited,Prohibited-Nonproductive: Growing areas where the harvesting of shellfish from these areas for direct
marketing, relaying, or depuration is prohibited. The sanitary survey may indicate dangerous numbers pathogenic microorganisms or other contaminants that might reach that area. Additionally, prohibited areas due to administrative closures.
Specific information regarding DSS assessment methodology and the listing/delisting flowchart for shellfish waters can be found in Appendix C of this guidance document. For the 305(b)/303(d) Integrated Report, listing and delisting will be based on data assessed for the reporting period. However, as the TMDL begins development, if new or more recent data shows the shellfish water is no longer impaired, a petition for delisting will be crafted and submitted to EPA for their approval by the Watershed Program (TMDL) staff.
5. Recreation/Swimming Use:
Recreation use assessment includes swimming and other primary and secondary water contact recreation uses such as water skiing and pleasure boating.
Bacteria
Normally, support or lack thereof of this use is determined based on a comparison of E. coli (freshwater) or Enterococci (saltwater) bacteria data to the single sample maximum and applying the > 10.5% assessment rule. However, if a special study, designed to collect at least 4 weekly bacteria data points within a calendar month is conducted, such as in VDH’s BEACH (Beaches Environmental and Coastal Health) program, then these results should be compared to the appropriate geometric mean criterion described in 9 VAC-25-260-170. A water is considered impaired for the recreation use under the following conditions: more than 10.5% of bacteria samples exceed the single sample maximum, there is a single geometric mean exceedance, or VDH has issued one or more beach closures of at least one-week duration due to contamination or two or more swimming advisories of Final Guidance for 2018 IR Regulatory Requirements and Objectives
14
at least one week-duration due to contamination—based on QA/QC-approved data within the assessment cycle with a medium to high probability that the closure/advisory will recur.
For bacteria monitoring in lakes/reservoirs, including the monitoring of freshwater beaches, data from multiple stations should be aggregated unless there is reason to believe stations represent disparate environments (e.g., isolated coves).
Water Quality Impacts Due to Algal Growth
DEQ received EPA's approval of the 2014 Integrated Water Quality Assessment Report on May 19, 2016. Action had been delayed due to citizen concerns raised about algae growth impacting recreation use in the Shenandoah River. DEQ responded by revising the Report to list 7 stream segments, totaling about 25 river miles, as having an observed effect, but with insufficient data to determine whether or not the recreation use was supported. These segments were prioritized for follow-up monitoring over the summer and fall of 2016 and 2017 by DEQ to test scientifically based, defensible, and reproducible field methods for estimating the percent coverage of river bottom by filamentous algae. Other commitments for future activities include decisions on thresholds for percent coverage that constitute impairment under the general narrative water quality standard.
Appendix I contains a summary of progress to date on the development of monitoring methods and assessment thresholds, with specific considerations for public comment.
6. Public Water Supply Use:
Waters that are used for public drinking water supply are identified in the WQS and are protected by additional health related standards that are applicable only to these waters. Support or lack thereof of this use is based on VDH closures or advisories due to excessive pollutant(s) and/or a comparison of water column data to applicable public water supply criteria. Impairment is determined if one or more VDH public water supply source closures due to contamination are issued within the assessment cycle, with a medium to high probability that the contamination will recur.
Table 1 and 2 summarize the kinds of information required to establish designated use support.
Table 1.DESIGNATED USE USE DESCRIPTION/INDICATORS
Aquatic Life Use,Chesapeake Bay sub-uses
Description: The propagation, growth, and protection of a balanced indigenous population of aquatic life that may be expected to inhabit a waterbody
Indicators: Dissolved oxygen, pH, temperature, chlorophyll-a *, nutrients*, water column and sediment toxics, toxicity tests, benthics, submerged aquatic vegetation
Fish Consumption Use
Description: Game and marketable fish species that are safe for human health
Indicators: VDH notices, fish tissue toxics, water column toxics
Shellfishing UseDescription: Marketable shellfish (clams, oysters, mussels) that are safe for human health
Indicators: VDH notices
Recreation (Swimming) Use
Description: Swimming, boating, and other recreational activities
Indicators: VDH notices, bacteria
Final Guidance for 2018 IR Regulatory Requirements and Objectives
15
DESIGNATED USE USE DESCRIPTION/INDICATORS
Public Water Supply Use
Description: Drinking water safe for human health
Indicators: VDH notices, water column toxics
Wildlife Use Description: The propagation, growth, and protection of associated wildlifeIndicators: Water column toxics
* chlorophyll-a and nutrients (total phosphorus) are assessed only in the lakes listed in Section 187 of the WQS. chlorophyll-a is also assessed in the tidal James River.
Final Guidance for 2018 IR Regulatory Requirements and Objectives
16
Table 2. Information required for determining designated use support.
Designated Use
Parameter/Data Type Fully Supporting
Observed Effects (either as
supporting or with insufficient data)
Impaired
Aquatic Life
Wildlife (toxics only)
Conventional1
• n > 2, exceedance rate < 10.5% for field parameters• Median lacustrine TP2
below criterion• 90th percentile lacustrine Chlorophyll-a below criterion
• Level II3 data with an exceedance rate > 10.5%• Single exceedance in small dataset (n <10)
• n > 2, exceedance rate > 10.5% for field parameters• Two exceedances in small dataset• Median lacustrine TP above criterion• 90th percentile lacustrine chlorophyll-a above criterion
Biological Benthic index scores > impairment threshold
• Level II3 data suggest degraded community• Benthic index score conflicts with biologist’s best professional judgment
Benthic index score < impairment threshold
Toxics n > 2, no exceedances
• A single exceedance of chronic aquatic life use criteria using temporally aggregated water column grab samples in a 3-year period or one SPMD sample exceedance of chronic aquatic life use criteria in a 3-year period •Single water column grab or SPMD sample exceedance of acute aquatic life use criteria in a 3-year period• Single sediment toxicity test or screening value exceedance (aquatic life only)
Two or more grab or SPMD exceedances of the same chronic or acute aquatic life criteria in a 3-year period
Recreation
Bacteria
• No geometric mean exceedance• n > 2, exceedance rate < 10.5%
• Level II3 data with exceedance rate > 10.5%• Single exceedance in small dataset (n <10)
• One or more geometric mean exceedance(s)• n > 2, single sample max exceedance rate > 10.5%• Two single sample max exceedances in small dataset
VDH notice No swimming advisory
A single short-term (< 1 week) VDH closure/advisory with low probability of recurrence, based on bacteria data
One or more closure(s) and/or two or more advisories > 1 week duration with medium or high probability of recurrence, based on bacteria data
Shellfishing VDH notice Approved shellfish harvest waters
Area classified as “conditionally condemned or seasonally restricted”
Areas classified as “restricted” or “prohibited”—excluding VPDES5 outfalls and administrations closures where no data are available
FishConsumption
Toxics No exceedances of fish tissue criteria
• Single exceedance of a human health criterion using grab sample or SPMD data• Single exceedance of a
• Two or more exceedances of a human health criterion using grab sample or SPMD data
Final Guidance for 2018 IR Assessment Methodology
17
Designated Use
Parameter/Data Type Fully Supporting
Observed Effects (either as
supporting or with insufficient data)
Impaired
tissue value or tissue screening value
• Two or more exceedances of a tissue value
VDH notice No advisories A VDH advisory which does not limit consumption is in effect
A VDH advisory or restriction limiting or prohibiting consumption
Public WaterSupply
Toxicsn > 2, no exceedances A single exceedance of human
health criteria using grab or SPMD data
Two or more exceedances of the same human health criteria using grab samples or SPMD data
VDH notice No closures A single VDH closure with low probability of recurrence
One or more closures with medium or high probability of recurrence
1Refer to Section 5.3 for methodology specific to Chesapeake Bay criteria. Refer to Section 5.12 for methodology specific to continuous monitoring data. 2TP = total phosphorus concentration. Along with lacustrine chlorophyll-a, only data from the most recent two years are aggregated. See Section 5.7 for methodology specific to lakes/reservoirs. 3 Level II data are lower-quality data submitted to DEQ from other sources. See Part VI for more information.4SPMD = semi-permeable membrane device (an instrument that passively samples ambient toxics over some length of time)5VPDES=Virginia Pollution Discharge Elimination System
Final Guidance for 2018 IR Assessment Methodology
18
5.3 Chesapeake Bay Assessment
In addition to assessment of criteria for state-wide aquatic life designated uses as described elsewhere in this document, the Chesapeake Bay and its tidal tributaries will be assessed for: 1) sub-categories of aquatic life use specific to the Chesapeake Bay estuarine system, and 2) the general narrative standard for aquatic life use through assessment of benthic invertebrate community condition. The following describes the aquatic life use sub-categories, applicable criteria, assessment process, segmentation issues, as well as Assessment Database (ADB) and Integrated Reporting issues. Bay-specific criteria for dissolved oxygen, chlorophyll-a, and submerged aquatic vegetation/water clarity are detailed in 9 VAC25-260-185.
Migratory Fish Spawning and Nursery Designated Use: waters in the Chesapeake Bay and its tidal tributaries that protect the survival, growth and propagation of the early life stages of a balanced, indigenous population of anadromous, semi-anadromous, catadromous and tidal-fresh resident fish species inhabiting spawning and nursery grounds. This designated use extends from the end of tidal waters to the downriver end of spawning and nursery habitats that have been determined through a composite of all targeted anadromous and semi-anadromous fish species' spawning and nursery habitats (see boundaries in U.S. Environmental Protection Agency. 2004. Technical Support Document for Identification of Chesapeake Bay Designated Uses and Attainability 2004 Addendum. Chesapeake Bay Program Office, Annapolis, Maryland. This designated use extends horizontally from the shoreline of the body of water to the adjacent shoreline and extends down through the water column to the bottom water-sediment interface. This use applies February 1 through May 31 and applies in addition to the open-water use described in this subsection.
Shallow-Water Submerged Aquatic Vegetation Designated Use: waters in the Chesapeake Bay and its tidal tributaries that support the survival, growth and propagation of submerged aquatic vegetation (rooted, underwater bay grasses). This use applies April 1 through October 31 in tidal-fresh, oligohaline and mesohaline Chesapeake Bay Program segments, and March 1 through November 30 in polyhaline Chesapeake Bay Program segments and applies in addition to the open-water use described in this subsection.
Open-Water Aquatic Life Designated Use: waters in the Chesapeake Bay and its tidal tributaries that protect the survival, growth and propagation of a balanced, indigenous population of aquatic life inhabiting open-water habitats. This designated use applies year-round but the vertical boundaries change seasonally. October 1 - May 31, the open water aquatic life use extends horizontally from the shoreline at mean low water, to the adjacent shoreline, and extending through the water column to the bottom water-sediment interface. June 1 - September 30, if a pycnocline is present and, in combination with bottom bathymetry and water column circulation patterns, presents a barrier to oxygen replenishment of deeper waters, this designated use extends down into the water column only as far as the upper boundary of the pycnocline. June 1- September 30, if a pycnocline is present but other physical circulation patterns (such as influx of oxygen rich oceanic bottom waters) provide for oxygen replenishment of deeper waters, the open-water aquatic life designated use extends down into the bottom water-sediment interface (see boundaries in U.S. Environmental Protection Agency. 2004. Technical Support Document for Identification of Chesapeake Bay Designated Uses and Attainability 2004 Addendum. Chesapeake Bay Program Office, Annapolis, Maryland. This designated use includes the migratory fish spawning and nursery and shallow-water submerged aquatic vegetation uses.
Deep-Water Aquatic Life Designated Use: waters in the Chesapeake Bay and its tidal tributaries that protect the survival, growth and propagation of a balanced, indigenous population of aquatic life inhabiting deep-water habitats. This designated use extends to the tidally influenced waters located between the upper
Final Guidance for 2018 IR Assessment Methodology
19
and lower boundaries of the pycnocline where, in combination with bottom bathymetry (depth, contour & shape) and water circulation patterns, a pycnocline is present and presents a barrier to oxygen replenishment of deeper waters. In some areas, the deep-water designated use extends from the upper boundary of the pycnocline down to the bottom water-sediment interface (see boundaries in U.S. Environmental Protection Agency. 2004. Technical Support Document for Identification of Chesapeake Bay Designated Uses and Attainability 2004 Addendum. Chesapeake Bay Program Office, Annapolis, Maryland.) This use applies June 1 - September 30.
Deep-Channel Seasonal Refuge Designated Use: waters in the Chesapeake Bay and its tidal tributaries that protect the survival of a balanced, indigenous population of aquatic life inhabiting deep-channel habitats. This designated use extends to the tidally influenced waters at depths greater than the lower boundary of the pycnocline in areas where, in combination with bottom bathymetry and water circulation patterns, the pycnocline presents a barrier to oxygen replenishment of deeper waters (see boundaries in U.S. Environmental Protection Agency. 2004. Technical Support Document for Identification of Chesapeake Bay Designated Uses and Attainability 2004 Addendum. Chesapeake Bay Program Office, Annapolis, Maryland.) This use applies June 1 through September 30.
Assessment Process
Full details of the assessment processes are described in USEPA, Ambient Water Quality Criteria for Dissolved Oxygen, Water Clarity, and chlorophyll-a for the Chesapeake Bay and Tidal Tributaries, EPA 903-R-03-002, April 2003 and the 2004 (EPA 903-R-002 October 2004) and 2007 (CBP/TRS 285-07, EPA 903-R-07-003), 2007 (CBP/TRS 288/07, EPA 903-R-07-005), 2008 (CBP/TRS 290-08, EPA 903-R-08-001), and 2010 (CBP/TRS 301-10, EPA 903-R-10-002) addenda. A very general summarization of key aspects of the process follows.
The assessment period for DO, water clarity and chlorophyll-a criteria shall be the most recent three consecutive years within the data window. When three consecutive years of data are not available, three years within the most recent data assessment window must be available and used for the assessment.
Attainment of the dissolved oxygen and numeric chlorophyll-a criteria shall be assessed through comparison of a cumulative frequency distribution of criteria exceedances to the applicable criteria reference curve for each designated use. A first step in the process involves spatial interpolation and extrapolation of data collected at individual fixed locations to project water quality conditions throughout the segment. A subsequent step involves development of cumulative frequency distribution (CFD) of criteria exceedances combining both spatial and temporal domains for each segment-designated use combination. A final step is to compare this CFD of criteria exceedances against a reference CFD of allowable exceedances to determine if the criteria are attained.
The revised methodology for DO and chlorophyll-a criteria assessment is described in the 2010 addendum. For DO, the algorithm used for the calculation of the pycnocline has been adjusted, and a 10% reference curve is now being used for the assessment of the Open Water and Deep Channel designated uses. Additionally, a geometric mean, rather than an arithmetic mean, has been explicitly specified for use in the assessment of seasonal chlorophyll-a criteria.
For the Shallow Water Submerged Aquatic Vegetation use criteria, if the submerged aquatic vegetation (SAV) acres are met in any individual Chesapeake Bay Program segment, then the shallow-water submerged aquatic vegetation use is met in that segment. If the SAV acres are not met, then the water clarity criteria shall be examined with either a CFD methodology or a “water clarity acres” methodology. If sufficient water clarity is
Final Guidance for 2018 IR Assessment Methodology
20
available to support SAV growth through either of these alternatives, then the Shallow Water Submerged Aquatic Vegetation use is met regardless of the number of acres of SAV in that segment.
The assessment of criteria for Chesapeake Bay continues to undergo refinements. We anticipate that if data of sufficient quantity and quality are available we may eventually be able to use the “spectral analysis” procedure described in USEPA, Ambient Water Quality Criteria for Dissolved Oxygen, Water Clarity, and Chlorophyll-a for the Chesapeake Bay and Tidal Tributaries, EPA 903-R-03-002.
Assessment Units
The Chesapeake Bay program segmentation scheme (Chesapeake Bay Program Analytical Segmentation Scheme-Revisions, Decisions and Rationales: 1983 -2003, CBP/TRS 268/04. Chesapeake Bay Program, Annapolis, Maryland) shall be used as the assessment unit to determine attainment of the criteria in this section for each designated use. The spatial boundaries of each aquatic life use subcategory within each of these CBP segment are described in the Technical Support Document for Identification of Chesapeake Bay Designated Uses and Attainability 2004 Addendum. Chesapeake Bay Program Office, Annapolis, Maryland. Assessment results for each CBP segment/designated use will determine the Integrated Report listing category of all waterbodies (i.e. all ADB assessment Units) geographically within that CBP segment/designated use. For example, the listing category of all tidal Onancock Creek assessment units will be determined by the appropriate designated use attainment of CBP segment CB7PH. In this example, it is likely that only open water and shallow water uses of CB7PH extend into Onancock Creek.
Assessment Database (ADB) Reporting Units
The Assessment Database (ADB) is used to track assessment data for all designated uses in distinct geographically defined waterbodies across the state. ADB assessment unit spatial boundaries are defined by many factors including the spatial distribution of available data to assess for designated uses. There may be several ADB assessment units included in each Chesapeake Bay Program segment.
ADB can only accept estuarine assessment units defined by surface areas (i.e. square miles). The complete water column within that assessment unit is assigned to a single overall aquatic life use attainment. Each individual Bay segment assessment unit may have deep channel, deep water, and open water sub-categories of aquatic life designated use (that may only account for a portion of the total volume/area of the ADB assessment unit).
Each ADB assessment reporting unit will be designated as having the aquatic life use and sub-use status according to the appropriate CBP segment/Aquatic life sub-designated use assessment. The rules to be applied are:
a) Open water designated extends from “shoreline to shoreline” within each CBP segment and thus all ADB reporting units located within each CBP segment is reported as having “open water” aquatic life use attainment consistent with the CBP segment attainment of open water criteria.
b) Deep water and deep channel designated use spatial boundaries within each CBP segment are spatially constrained as smaller areas within the larger CBP segments (see Technical Support Document for Identification of Chesapeake Bay Designated Uses and Attainability 2004 Addendum. Chesapeake Bay Program Office, Annapolis, Maryland.) Thus the deep water or deep channel designated use status for each CBP segment will apply only to ADB reporting units which contain a “deep water” designated use area. The two-dimensional (i.e. square miles) size of each CBP segment encompassing the impaired
Final Guidance for 2018 IR Assessment Methodology
21
deep water use will be reported as the actual impaired area in ADB, unless only a very small portion of deep water/deep channel is present in the segment.
c) The Shallow Water Submerged Aquatic vegetation designated use applies only out to a maximum of 2 meter contour. Each ADB unit having this sub-use present in some portion will designate the sub-use as attained or not. However, the actual size of the impaired use will be tracked outside of the ADB system and reported in the Integrated Report as being only the size of area within the two meter contour.
d) The general standard aquatic life use status of the ADB unit will be assigned to the “worst case” status of aquatic life sub-use within that ADB assessment unit (e.g. an ADB reporting unit containing an open water use which meets its associated criteria and a deep water use which fails its associated criteria will be categorized as failing the general aquatic life use). Other criteria applicable to the general standard for aquatic life use (e.g. for benthic communities, toxics, or “weight of evidence” etc…) will also determine the overall aquatic life use attainment. If the general aquatic life use is impaired only due to a smaller area of aquatic life sub-use, then only the area (i.e. square mileage) of the sub-use is reported as impaired for general aquatic life use.
Impact of Chesapeake Bay TMDL
The Chesapeake Bay TMDL, developed by EPA in cooperation with Bay state partners, was approved by EPA on December 31, 2010. This TMDL focuses on reductions to nutrients (nitrogen and phosphorus) and sediment inputs into Bay waters (including major tributaries). Improvements in DO and water clarity, which are indicators for the Aquatic Life and Shallow Water Submerged Aquatic Vegetation designated uses, are anticipated after the implementation of this TMDL.
All Bay waters that are on the 303(d) list for dissolved oxygen, SAV, and chlorophyll-a impairments should be in Category 4, and any waters newly impaired for these parameters should also get this designation. Chesapeake Bay and tidal tributary assessment units, as described in 9 VAC 25-260-185 (d), that were listed for dissolved oxygen by EPA in the 1999 consent decree will continue to remain in Category 4 until all applicable criteria are attained (e.g. any 7-day mean or instantaneous criteria must be assessed and attained as well as the 30-day criteria).
Category 4D should be used to classify those waters listed for dissolved oxygen by EPA that are found to be meeting all assessed dissolved oxygen criteria. For instance, if a water meets the 30-day mean criterion for the Open Water sub-use, but the 7-day mean and instantaneous minimum criteria were not assessed, the Open Water sub-use should be categorized as “4D” in the Assessment Database. In the absence of other aquatic life use impairments (pH, benthics, etc.), the aquatic life use for this water would be assessed as “4D” as well. Refer to Part III for the full description of Category 4D.
5.4 Biological Assessments
Biological monitoring of streams and rivers using benthic macroinvertebrates is an integral component of the water quality monitoring program in the Commonwealth of Virginia. Biological monitoring allows the Virginia DEQ to assess the ecological condition of streams and rivers. Benthic macroinvertebrate surveys are used to determine if the waterbodies meet their designated aquatic life uses.
The Virginia Stream Condition Index (VSCI)Final Guidance for 2018 IR Assessment Methodology
22
In 2000, the United States Environmental Protection Agency (USEPA) contracted TetraTech to develop a multi-metric macroinvertebrate index for Virginia. This index contains eight core metrics that when calculated into one number is known as the Virginia Stream Condition Index (VSCI). TetraTech developed the VSCI using Virginia’s existing biomonitoring database, which contained a significant amount of upstream (reference) control sites for use with the USEPA’s Rapid Bioassessment Protocols.
Using an independent probabilistic database (sample n=350) with data collected from 2001-2004, Virginia has validated the VSCI using a spatially diverse (ecoregionally and stream size) data set free of pseudoreplication. These probabilistic data sets have allowed DEQ to narrow data gaps and test the proposed VSCI against many classification variables, which include season, stream size, ecoregion, bioregion, river basin, regional office, and sampling technique. The VSCI validation study was designed to incorporate suggestions provided through public comment from the Academic Advisory Committee (AAC), the USEPA and the regulated community.
The validation study using probabilistic biological data has confirmed that the VSCI works well to discriminate between sites with acceptable water quality and habitat versus sites with degraded water quality and habitat. A VSCI impairment threshold score of 60 was determined from statistical analyses of the original TetraTech report and the DEQ validation study. The VSCI validation study and the aquatic life use assessment guidance using the VSCI has been reviewed and approved by the USEPA. The validation study “Using Probabilistic Monitoring Data to Validate the Non-Coastal Virginia Stream Condition Index” can be found at http://www.deq.virginia.gov/Portals/0/DEQ/Water/WaterQualityMonitoring/ProbabilisticMonitoring/scival.pdf. The Virginia Coastal Plain Macroinvertebrate Index (VCPMI)
In the late 1990s, the United States Environmental Protection Agency (USEPA) coordinated a six-state monitoring effort to develop a multi-metric macroinvertebrate index that included Virginia’s coastal plain. This index contained five metrics that when calculated into one number is known as the Coastal Plain Macroinvertebrate Index (CPMI). This index was adopted by DEQ in the early 2000’s to make aquatic life use impairment determinations in the coastal plain of Virginia. Virginia biologists recommended validation of the index and initiated a special study.
Over the past decade DEQ compiled a new database of coastal plain macroinvertebrate data, which includes significantly more Virginia reference samples than the original CPMI study. Virginia has created the new VCPMI using a spatially diverse (ecoregionally and stream size) dataset free of pseudoreplication. The VCPMI replaces metrics that did not work well in Virginia’s coastal plain and has correctly calibrated each metric’s best standard values. The VCPMI study has confirmed that the VCPMI works well to discriminate between sites with acceptable water quality and habitat versus sites with degraded water quality and habitat. The impairment threshold score of 40 was determined from statistical analyses conducted during the VCPMI study. The VCPMI study and the aquatic life use assessment guidance using the VCPMI have been reviewed and approved by the USEPA. The VCPMI technical report, “The Virginia Coastal Plain Macroinvertebrate Index”, can be found at: http://www.deq.virginia.gov/Portals/0/DEQ/Water/WaterQualityMonitoring/ProbabilisticMonitoring/vcpmi.pdf
Free-flowing Aquatic Life Use DeterminationFinal Guidance for 2018 IR Assessment Methodology
23
The DEQ uses the VSCI for non-coastal streams for biological assessment as well as the Virginia Coastal Plain Macroinvertebrate Index (VCPMI) for coastal plain streams. Assessment rankings, based on a single VSCI or VCPMI bioassessment, are the result of the data evaluation and reduction of numerous measurements and observations conducted during the biomonitoring survey. Bioassessment measures the response of the biological community to all perturbations it has experienced. A single, properly conducted VSCI or VCPMI bioassessment is not a “single data-point” analogous to a single dissolved oxygen (DO) measurement or bacteria sample. Non-coastal streams with VSCI scores ≥ 60 or coastal plain streams with VCPMI scores ≥40 will be assessed as “fully supporting for aquatic life use”. VSCI scores < 60 and CPMI scores < 40 will result in streams being listed as “impaired”.
If the biologist has observed natural conditions, such as recent drought or flooding, etc., that could be responsible for a ranking below the impairment threshold, they should note the lack of confidence in the survey and the stream will be listed as “fully supporting but having observed effects for aquatic life use” until further analysis can be conducted.
The regional biologists should review the biological assessments for the assessment cycle and they should make a final biological assessment ranking based on these data. Since biomonitoring surveys are records of the condition of the community at the time of the survey, the most recent bioassessment should be the most accurate indicator of stream ecological health. An attempt to average the data would weaken the ability to accurately predict current conditions. In cases where biological assessment rankings fall above and below the impairment threshold over multiple sampling events, more weight should be given to the most recent bioassessment. In cases where only one biomonitoring survey was conducted, a stream may be assessed for aquatic life use based on a single VSCI or VCPMI score. A standardized fact sheet, as found in Appendix B of this manual, has been developed to help the regional biologists review and assess the data for the assessment cycle. The fact sheet allows for consideration of supplemental information about the watershed that is important in making the final assessment decision.
Estuarine Aquatic Life Assessment
In cooperation with EPA Region III and the State of Maryland, DEQ has developed an assessment methodology for estuarine benthic community biological (B-IBI) data. This methodology assures Bay-wide consistency in determinations of estuarine benthic impairments and requires a sample size ≥ 10 for statistical purposes. In order to assist with meeting the sample size requirement, a six-year data window is used. This corresponds with the data window used for the assessment of other non-Chesapeake Bay criteria data.
The methodology incorporates uncertainty in the reference condition and is based on the confidence limit and bootstrap simulation concept described in Alden et al. (2002). Bootstrap simulation (Efron and Tibshirani 1998) will be applied to incorporate uncertainty in reference conditions as well as sampling variability in the assessment data. For each habitat, a threshold based on percentiles in an unimpaired reference data set will be applied (i.e. 5th percentile). This threshold is not intended to serve as criteria for classifying individual B-IBI scores, rather it will be used to categorize the segment as impaired or not based on the proportion of samples below the threshold and the variance associated with this estimate.
The impairment assessment for each segment is based on the proportion of samples below the threshold with the variance in this proportion estimated by simulation. In each simulation run, a subset of the reference “unimpaired” data for each habitat is selected at random, and the threshold is determined (i.e., the B-IBI score at the 5th percentile of the un-impaired dataset). A random subset of the assessment data is compared to the Final Guidance for 2018 IR Assessment Methodology
24
threshold value to estimate the proportion of sites below the threshold. By repeating this process over and over again (2000 runs) we estimate the variance in the proportion of sites below the threshold from the bootstrap estimates. For this analysis, it is assumed that each reference ‘un-impaired” data set (by habitat) is a representative sample from a “super population” of reference sites.
The assessment result for each benthic segment (i.e. % of area with IBI score below 5th percentile threshold) is then statistically compared (p<0.05) with the percentage that would be expected even if the segment is unimpaired. This percentage under “un-impaired” conditions is assumed to be 5%.
A benthic segment will be classified as having insufficient information (Category 3B) when the number of sites sampled during the six-year data window is less than 10. A segment will also be classified as Category 3B when the analysis suggests non-impairment but the difference between the upper and lower 95% confidence limits equals or exceeds 0.5 and the average BIBI score is less than 2.7.
In addition to an assessment of impairment, a discriminant analysis tool (benthic diagnostic tool) has been developed that can be used to identify sources of stress affecting benthic community condition in the Chesapeake Bay (Dauer et al. 2002). The results can distinguish stress due to contaminants versus stress due to other factors (e.g., low dissolved oxygen, or unknown). This tool will be used to identify which impaired segments have high probability of sediment contamination. Separately from the discriminant tool, the B-IBI metric scoring will also be used to identify (1) insufficient abundance patterns consistent with a low dissolved oxygen effect and (2) excessive abundance patterns consistent with eutrophication effects in the absence of low dissolved oxygen events. The combined use of these causal analyses will be used to assign causes for benthic impairments to either 1) Sediment chemical contaminants 2) Low dissolved oxygen 3) Eutrophication or 4) Unknown.
The spatial assessment unit for determining attainment of the general standard for aquatic life use using benthic community data will be the same as used in the 2008 assessment report. These criteria assessment units are described in “Chesapeake Bay Program Analytical Segmentation Scheme-Revisions, Decisions and Rationales: 1983 -2003, CBP/TRS 268/04. Chesapeake Bay Program, Annapolis, Maryland” with the additional caveat that minor tidal tributaries are considered separate benthic assessment segments.
Assignment of aquatic life use status, as determined by benthic assessments to ADB reporting waterbodies, will be the same as described previously for the Bay criteria assessments found in Section 5.3. Each ADB reporting unit will be assigned the general aquatic life use status of the benthic assessment segment in which it is geographically located.
References:Alden, R.W. III. 1992. Uncertainty and sediment quality assessments: Confidence limits for the Triad.
Environmental Toxicology and Chemistry 11:645-651.Alden, R.W. III, D.M. Dauer, J.A. Ranasinghe, L.C. Scott, and R.J. Llansó. 2002. Statistical verification of
the Chesapeake Bay Benthic Index of Biotic Integrity. Environmetrics 13:473 498.Dauer, D.M., M.F. Lane, and R.J. Llansó. 2002. Development of diagnostic approaches to determine
sources of anthropogenic stress affecting benthic community condition in the Chesapeake Bay. Report submitted to the USEPA Chesapeake Bay Program Office, Annapolis, Maryland, by Old Dominion University Department of Biological Sciences, Norfolk, Virginia. 65 pp.
Efron, B. and R. Tibshirani. 1998. An Introduction to the Bootstrap. Chapman & Hall/CRC.
Final Guidance for 2018 IR Assessment Methodology
25
Llansó, R.J., J.H. Vølstad, and D.M. Dauer. 2003. Decision Process for Identification of Estuarine Benthic Impairments. Final Report submitted to Maryland Department of Natural Resources, Tidewater Ecosystem Assessments, Annapolis, Maryland, by Versar, Inc., Columbia, Maryland.
5.5 Toxics Assessment
Fish Tissue (Consumption) Use
The Fish Tissue Monitoring Program (FTM) collects fish tissue samples from designated monitoring stations for contaminant analysis. FTM staff identifies the results of any analysis that exceeds the WQS criterion-based tissue value (TV) or tissue screening value (TSV) found in Appendix E-1 and E-2 respectively, for the toxic contaminants and provides the data to water quality assessment staff. Older fish tissue data may be included where deemed appropriate.
Fish tissue data collected at stations during routine monitoring throughout Virginia represent Tier 1 monitoring data. Tier 1 monitoring data are meant to identify sites where concentrations of contaminants in the edible portions of commonly consumed fish indicate a potential health risk to humans. Usually, three fish tissue composite samples are analyzed for chemical contaminants at each Tier 1 station. Each is a composite of edible fillets for one species of fish from a top-level predator, a mid-level predator, and a bottom feeder. If Tier 1 results reveal potential problems, a more intensive Tier 2 study is initiated by the FTM staff to determine the magnitude, geographical extent, and potential sources of contamination in the fish. The need for a more intensive Tier 2 study takes into consideration the severity of the potential concern and is initiated as soon after the discovery of a potential problem as resources allow. Generally, if additional information is requested by the Virginia Department of Health (VDH) for determining the need for fish consumption advisories, a follow-up monitoring effort is initiated the year after the discovery of the potential problem. If limited resources prevent this, the water body will be sampled more intensely as soon as resources allow and/or during the next scheduled monitoring event in the affected river basin.
Currently, most fish tissue monitoring is focused on the development of PCB TMDLs throughout the Commonwealth.
Analytical results for fish tissue are expressed in wet-weight and are compared to WQS TVs and TSVs for the toxic pollutants using EPA risk assessment techniques for non-carcinogen and carcinogen effects. WQS human health calculations use the 10-5 risk level adopted by the State Water Control Board in 1992, an average human body weight of 70 kg and a lifetime average fish consumption rate of 17.5 grams per day (general U.S. population adopted in 2008). These same values are used to calculate the human health water quality criteria found in 9 VAC 25-260-140 B. Also included in the calculation are toxicological data pertinent to human health effects. A reference dose (RfD) is used for non-carcinogen toxic effects and a cancer oral slope factor is used for carcinogen effects. TVs are based on the same toxicological data (and body weight, fish consumption, and RfD or cancer risk level) that form the basis for the water quality criteria listed in 9 VAC 25-260-140 B, under the column labeled "Human Health, All Other Surface Waters". These water quality criteria are water column concentrations that are based on a specific fish tissue concentration, which were calculated to represent a safe or acceptable minimal human health risk level. The water quality criteria are designed to prevent the fish from bioconcentrating the toxic contaminants to levels greater than these fish tissue concentrations. The TV concentrations listed in Appendix E-1 represent the same fish tissue concentrations that are the basis for the water quality criteria listed in 9 VAC-25-260-140 B and may be considered the fish tissue concentration equivalent of those water quality criteria. Appendix E-1 contains TVs for all chemicals for which Virginia has adopted water Final Guidance for 2018 IR Assessment Methodology
26
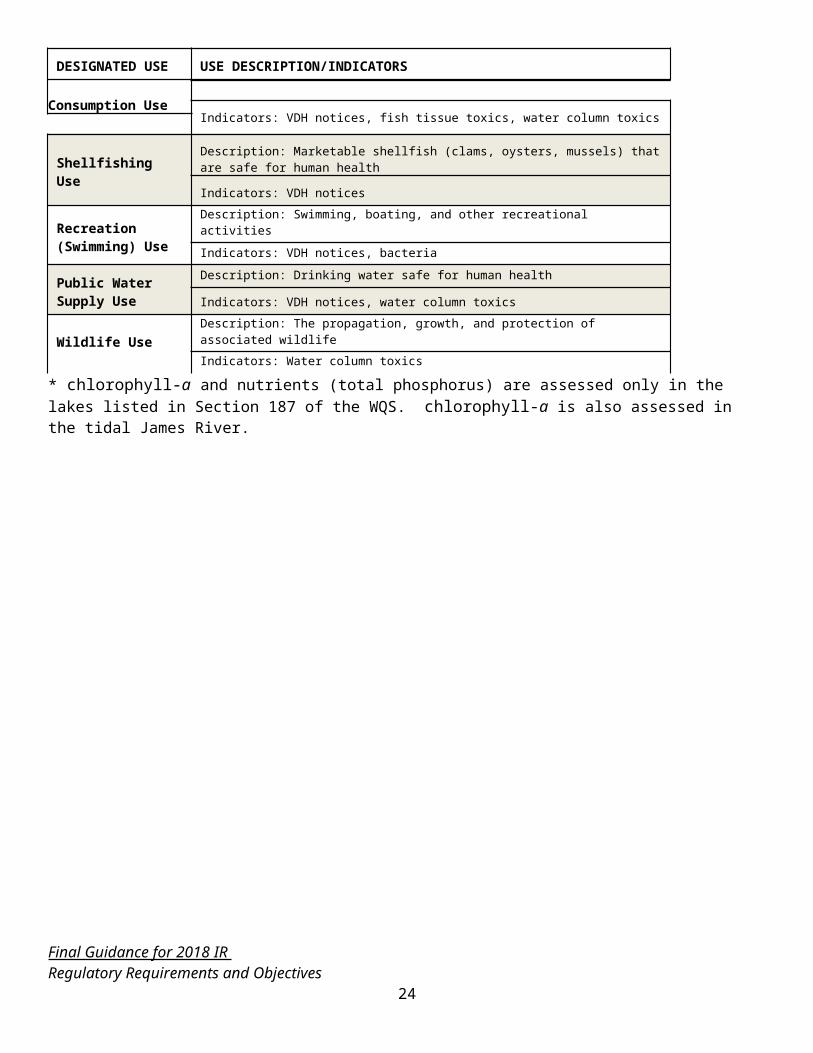
quality criteria. However, many of the TVs listed in Appendix E-1 do not bioaccumulate and are not often found in fish tissue and have been included for completeness. All TVs are rounded to two significant digits.
Appendix E-2 also lists TSVs for additional toxic chemicals for which Virginia has not adopted water quality criteria that are based on fish tissue concentrations (those criteria listed under " Human Health, All Other Surface Waters" in 9 VAC 25-260-140.B). It includes chemicals recommended for monitoring by EPA or of special interest to DEQ as well as some chemicals that are based on recent changes to toxicological data and/or exposure assumptions that are different from those used to calculate the water quality criteria found in 9 VAC 25-260-140 B. The TSVs are updated using available data from the EPA IRIS database and/or recommendations from EPA or the VDH before each assessment effort.
If a fish tissue composite sample exceeds a single WQS TV or TSV, the water body should be assessed as fully supporting but having an observed effect for the fish consumption use (Category 2B). If the TV for the same toxic pollutant is exceeded in two or more samples from the same site, the water is considered impaired. For example, both of the following situations would qualify as impaired under this criterion: two different fish samples from different species during one sampling event or two or more different samples of the same or different species from different sampling events. Data from all Tier 1 and Tier 2 monitoring studies are evaluated by DEQ as well as provided to the VDH for their consideration of the need for establishing fish consumption advisories. DEQ and VDH have signed a Memorandum of Agreement (MOA) that describes how the agencies exchange information regarding the results of all Tier 1 and Tier 2 fish tissue monitoring. If VDH issues a fishing ban or advisory, limiting consumption, the segment should be designated impaired for fish consumption use based on the advisory. The results of the Tier 2 study should be clearly communicated in the Integrated Report narrative.
Sediment (aquatic life use)
Similar to the sediment monitoring and analysis conducted by FTM, the regional offices will assess the AWQM sediment data. For freshwater sediments above the fall-line and in tidal fresh zones, as described in the WQS, the consensus-based Probable Effects Concentrations (PEC; MacDonald et al. 2000) should be applied. Estuarine sediment contaminant data collected during scheduled AWQM monitoring should be compared to National Oceanic and Atmospheric Administration (NOAA Screening Quick Reference Tables (SQuiRT) Tables 1999) for effects-range-median (ER-M) SVs for sediment. Transition zones should be assessed against the more stringent of the two screening values. One or more exceedances of an ER-M/PEC value results in a fully supporting but having observed effects status for aquatic life use support. In these cases, additional biological monitoring should be scheduled to assess actual aquatic life use support. For National Coastal Assessment, a “weight of evidence” approach using sediment toxicity and sediment chemistry will be used to determine aquatic life designated use. See Appendix G for additional information. All metals contaminant screening values found in Appendix F have been converted to parts per million (ppm) for consistency.
Freshwater Toxics Evaluation (Water Column)
For overall freshwater toxics evaluation, DEQ uses the Virginia WQS for human health in surface waters, other than public water supplies (9 VAC 25-260-140 B). These same values are used to assess the fish consumption use in public water supplies as well as all other surface waters. (Please note the criteria for human health in public water supplies will be used to assess the drinking water use in PWSs only). In conformance with water quality management plans and VPDES permitting procedures, water column toxicant data collected up to six years prior to the current 305(b) period should be assessed along with current data if they reflect current conditions. When assessing the aquatic life and wildlife use support for toxic contaminants, compliance should Final Guidance for 2018 IR Assessment Methodology
27
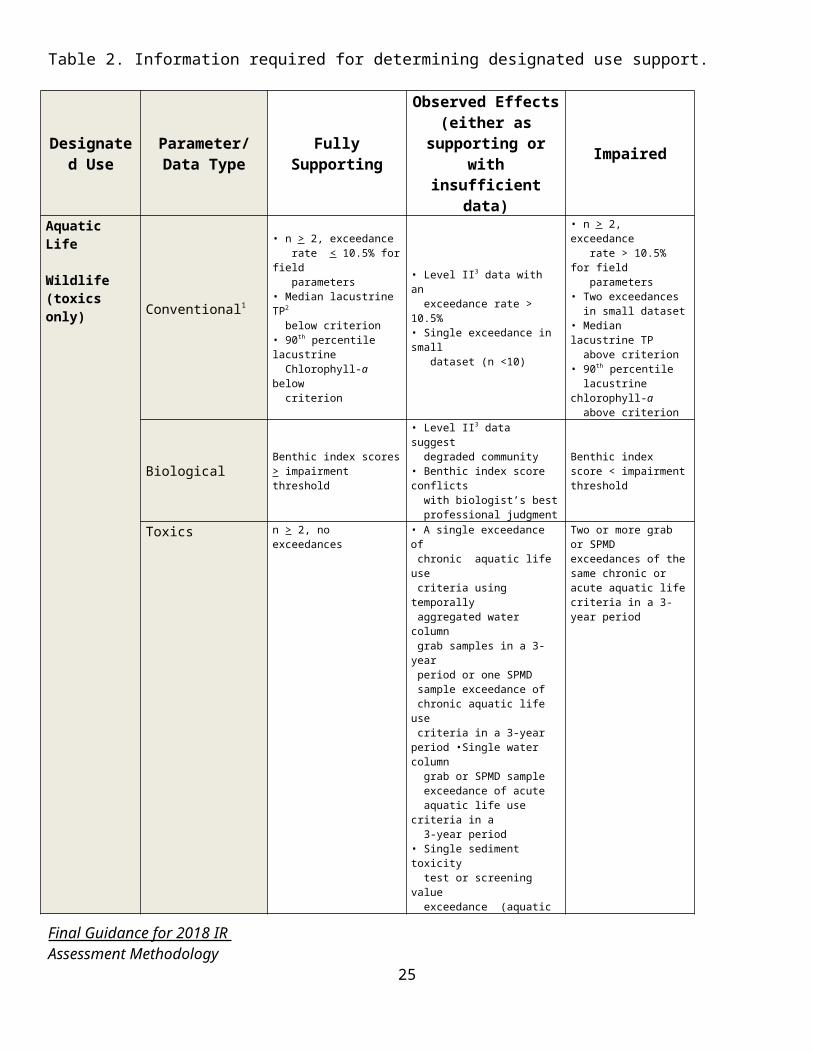
be based on meeting the aquatic life WQS found in 9 VAC 25-260-140 B. See Section 5.2 for additional information.
Virginia will declare waters impaired for aquatic life use and included in Category 5A if 1) an acute criterion is exceeded two or more times within a three-year period based on either grab samples or samples collected with a 30-day semi-permeable membrane device (SPMD) or if 2) a chronic criterion is exceeded two or more times within a three-year period based on either multiple grab samples collected within two separate four-day periods or multiple samples collected with a 30-day semi-permeable membrane device (SPMD)”. Weight-of-Evidence Aquatic Life Use Assessment in Estuarine Waters
The “Weight-of-Evidence” (WOE) approach that DEQ currently uses for its general evaluation and assessment of the designated Aquatic Life Use (ALU) for estuarine benthic communities has evolved from a previously more limited application of the “Sediment Quality Triad” concept (SQT – Figure 1). The SQT concept was originally conceived and applied for the evaluation of the presence and effects of toxic contaminants in marine sediments (Long and Chapman, 1985). It was further applied by Chapman et al. (1986, 1987), and has continued to be one of the preferred approaches for the evaluation of toxics in marine and estuarine benthic environments (Chapman, 1992; Chapman et al., 1997; McGee et al., 2001). The Interstate Chesapeake Bay Program (CBP) employed SQT evaluations along with other methods to produce a Bay-wide toxics characterization in 1999 (US EPA, 1999) that identified (1) “Regions of Concern – areas with probable adverse effects,” (2) “Areas of Emphasis – areas with potential adverse effects,” (3) “Areas with Low Probability for Adverse Effects”, and (4) “Areas with Insufficient or Inconclusive Data” relative to toxics contamination in Bay waters. Maps of more recent characterizations (2006, 2008, and 2009) can be found at: http://www.chesapeakebay.net/maps.aspx?menuitem=15230.
Appendix G describes the SQT in more detail.
5.6 Naturally Low DO and pH Evaluation in Swamp Waters
Virginia’s list of impaired waters currently identifies many waters as not supporting the aquatic life use due to exceedances of pH and/or DO criteria that are designed to protect aquatic life in Class III waters. However, there is reason to believe that some of these streams or stream segments have been misclassified and should more appropriately be classified as Class VII, Swamp Waters. A revised procedure for assessing if natural conditions are the cause of the low pH and/or low DO levels in a given stream or stream segment is currently being developed.
5.7 Lakes/Reservoirs Assessment
The current agency guidance on the monitoring and assessment of targeted lakes and reservoirs is found in the Department Guidance Memo No. 09-2005 “Monitoring and Assessment of Lakes and Reservoirs" (April 2009). Section 5.6 provides summary guidance on how to prioritize and evaluate the many lakes and reservoirs in the Commonwealth for monitoring. This prioritization allows the Department to focus on the most important lakes as they relate to designated uses.
Final Guidance for 2018 IR Assessment Methodology
28
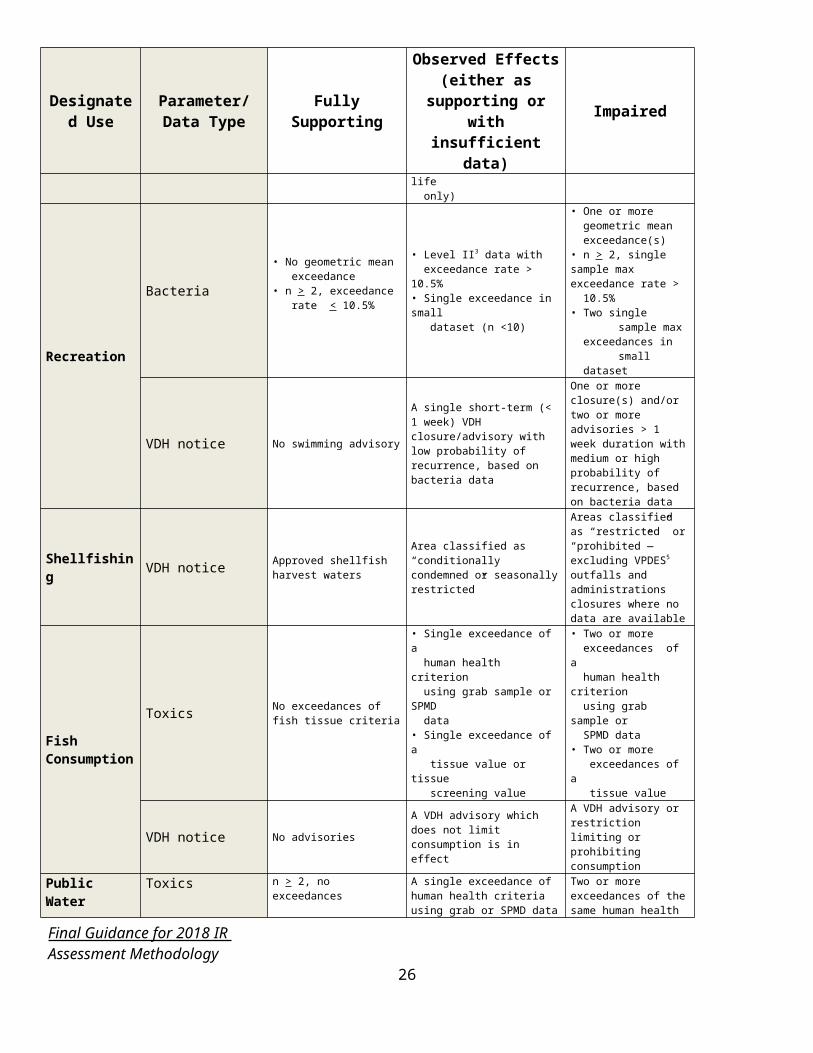
GM09-2005 defines “significant lakes and reservoirs”:
“A significant lake/reservoir is defined as: a publicly accessible lake/reservoir that is a public water supply and/or 100 acres or more in size and is included in Section 187 list of reservoirs with nutrient criteria.”
A list of the current “significant lakes” is included in Appendix H of this document. Since 2007, these are the 121 man-made lakes and reservoirs identified under the nutrient standards for lakes and reservoirs (9 VAC 25-260-187), and the two natural lakes, Mountain Lake and Lake Drummond, which have been assigned special standards for nutrients (9 VAC 25-260-310).
Publicly accessible means direct access to the water from public property during normal work hours.
The significant lakes designation includes the federally owned lakes which meet these criteria, but all other federally owned lakes would be excluded from the agency lakes monitoring program.
There are additional lakes/reservoirs that should also be considered, as resources allow, for monitoring and assessment that are not in §187 but do meet one of the other two characteristics above. Although nutrient criteria do not apply to these, other criteria should be assessed as available data will allow.
At least one of these two criteria must be met for a lake or reservoir to be assessed as impaired:
1. A lake/reservoir has exceedances of numerical WQS, as observed during multiple sampling events, or
2. There is a loss of a designated use as evidenced in ancillary data, such as records documenting conditions unconducive for swimming and/or boating, recurrent fish kills, and other QA/QC approved non-agency studies or reports, etc. This applies even if there is no water quality standard for the parameter(s) in question.
This section incorporates summary guidance from Guidance Memo 09-2005 that documents how nutrients and dissolved oxygen data collected from the man-made lakes and reservoirs listed in §187 and the two natural lakes listed in the special WQS section (9 VAC 25-260-310) will be assessed by DEQ for the 2018 Integrated Report. Nutrient criteria will not be applicable to lakes/reservoirs not included in §187; these waterbodies will only be evaluated if low DO concentrations have been documented.
The assessor should provide a complete narrative documenting assessment decisions. If uses are impacted, document those uses impacted and how they are impacted. Name causes and sources where possible, (e.g. nuisance algal blooms preventing swimming
Final Guidance for 2018 IR Assessment Methodology
29
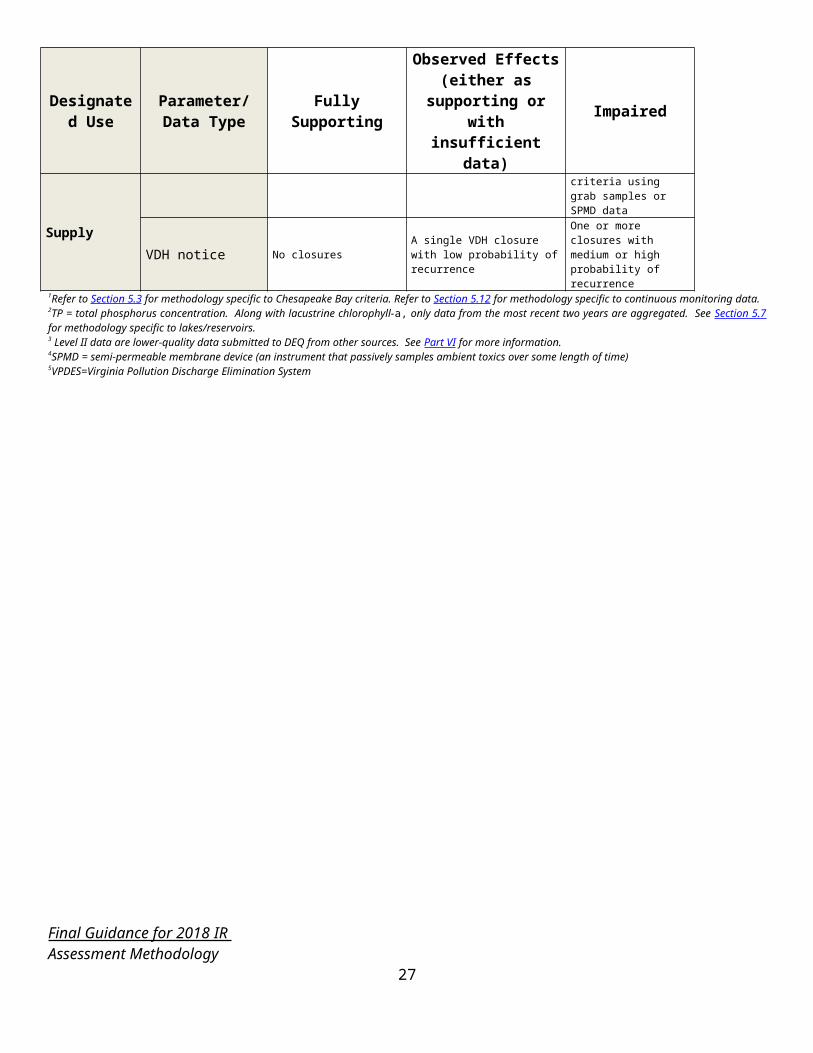
during summer months, numerous complaints on file or aquatic weed growth preventing free navigation of lake and/or expensive mechanical or chemical clearing, etc.).
Nutrient Evaluation of §187 Reservoirs development
Both nutrient (chlorophyll-a and total phosphorus if there is documented use of algaecides any time during the Department’s seven month monitoring period from April through October) and dissolved oxygen/pH data are assessed for aquatic life use. Bacteria data are used to assess recreational use. Observations regarding nuisance algal, plant growth, or discolored water are assessed using the general standard; the recent criteria amendments for lakes and reservoirs did not modify these existing criteria.
Since the 2010 assessment, the Trophic State Index (TSI) evaluation for nutrient impacts in §187 lakes has been replaced by nutrient criteria. The TSI evaluation will continue to be used in those lakes that are not included in §187.
Assessment for aquatic life (fishery) use of §187 lakes/reservoirs for chlorophyll-a and total phosphorus (if there is documented algaecide use):
This assessment procedure for nutrients in §187 lakes replaces the combined TP/DO TSI approach used in 2006 for nutrient assessment related to assessing natural low DO conditions. However, the TSI approach will be used to determine natural conditions for other non-§187 lakes if DO problems have been documented. The nutrient criteria for the man-made lakes and reservoirs listed in §187 of the WQS only apply in the top 1 meter of the lacustrine zone. “Lacustrine” means the zone within a lake or reservoir that corresponds to non-flowing lake-like conditions within reservoirs that are deeper than 3 meters (10 feet). The other two zones within a deeper reservoir are riverine (flowing, river-like conditions) and transitional (transition from river to lake conditions). If total phosphorus or chlorophyll-a data are collected outside the lacustrine zone in the riverine or transitional zone, the data from these two zones will not be used in the assessment for lake or reservoir impairment due to nutrients. As previously stated, the nutrient criteria cannot be used for assessment of lakes and reservoirs that are not listed in §187 of the WQ Standards. For lakes and reservoirs without defined nutrient criteria, but with DO problems, the TSI approach may still be used to determine if those problems are natural.
The regional office staff will base their determination of algaecide use on discussions with the lake owner regarding use of algaecides during the monitoring period and/or DEQ monitoring staff observations of algaecide applications during their monitoring runs on the lake or reservoir. (The intent is to use both chlorophyll-a and total phosphorus when algaecides are applied within any zone of the reservoir.)
The 90th percentile of chlorophyll-a data collected at one meter or less within the lacustrine portion of the man-made lake or reservoir between April 1 and October 31 (considered a lake monitoring year) shall not exceed the chlorophyll-a criterion for that waterbody in each of the two most recent monitoring years within the assessment window. For a waterbody that received algaecide treatment, the median of the total phosphorus data collected at one meter or less within the lacustrine portion of the man-Final Guidance for 2018 IR Assessment Methodology
30
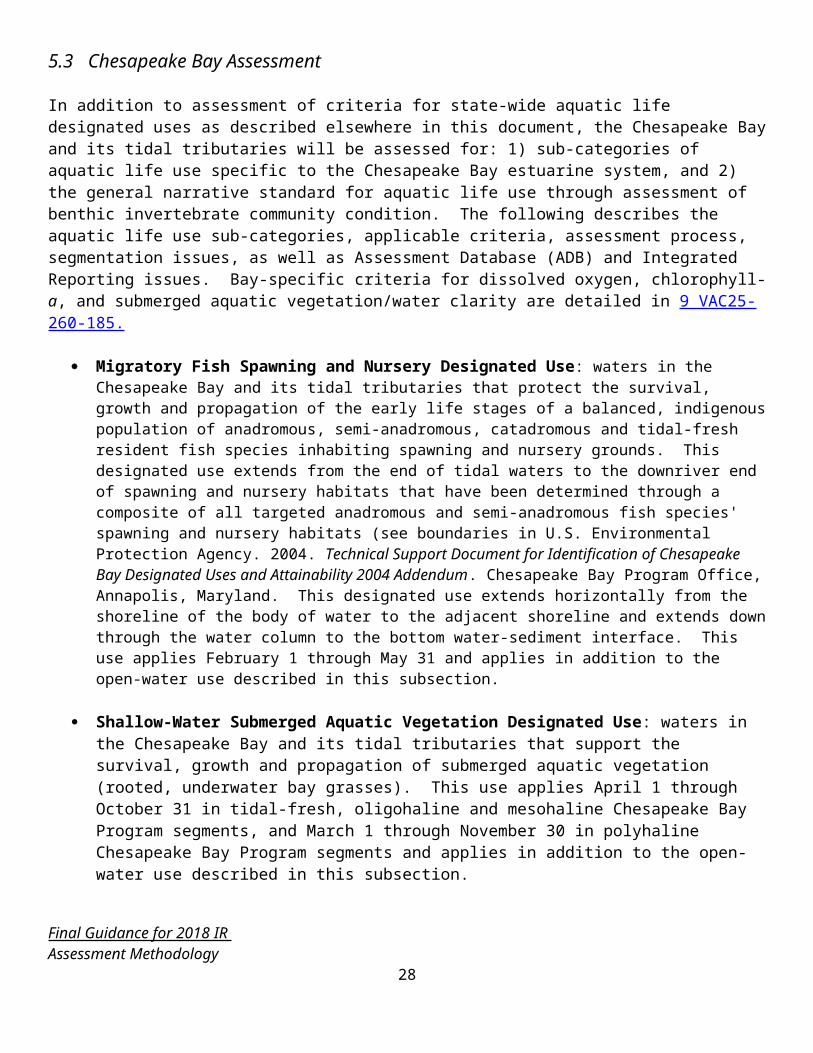
made lake or reservoir between April 1 and October 31 shall not exceed the total phosphorus criterion in each of the two most recent years that total phosphorus data are available. The aquatic life (fishery) use of any lake (not just the lacustrine zone but rather the entire lake/reservoir) listed in §187 is considered impaired for nutrients if the criterion for either chlorophyll-a or total phosphorus is exceeded. For each nutrient criterion, chlorophyll-a and total phosphorus (if documented algaecide use), the assessor will pool all data collected at one meter or less for all months and all stations within the lacustrine portion collected between April and October. Each year must have valid data for 6 of the 7 months of required monitoring to be considered a valid year.
Assessment for aquatic life (fishery) use for nutrients in the two natural lakes: Assessments of the two natural lakes in the special standards section will follow the guidelines above for chlorophyll-a and total phosphorus except that orthophosphate-P rather than total phosphorus applies to Mountain Lake.
Use of citizen and other external data:
In order to use citizen data in assessments for nutrient impairments, the collector must provide documentation that the data meet QA/QC requirements for chlorophyll-a and total phosphorus (orthophosphate-P for Mountain Lake) and that the location of the sampling was within the lacustrine portion of the reservoir and outside the littoral (near shore) zone and corresponds with the lake monitoring year requirements.
Dissolved Oxygen Evaluation
The dissolved oxygen criteria are based on the appropriate criteria established for that class of waters in Section 9 VAC 25-260-50. Dissolved oxygen information is used for assessment of aquatic life use.
Assessment for aquatic life use of lakes and reservoirs for the dissolved oxygen criterion:
The 10.5% rule is applicable to assessments for the minimum dissolved oxygen criterion in all assessed lakes and reservoirs for each lake monitoring year. For §187 lakes/reservoirs, dissolved oxygen samples taken for all months within the lake monitoring year, at all stations within a given lake or reservoir, are assessed only in the epilimnion if the water body is thermally stratified. If not stratified, dissolved oxygen should be assessed throughout the water column. A lake or reservoir is considered stratified if there is a difference of 1ºC /meter. If the differential is < 1ºC /meter, the lake is not considered stratified. Lakes/Reservoirs not listed in §187 should have all DO samples assessed regardless of thermal stratification determination. Two or more exceedances and >10.5% exceedance of total samples are required before a water body is listed as impaired for the minimum dissolved oxygen criterion (4 mg/l for most freshwater lakes and reservoirs) under § 62.1-44.19:5 and 7 of the Code of Virginia.
Final Guidance for 2018 IR Assessment Methodology
31
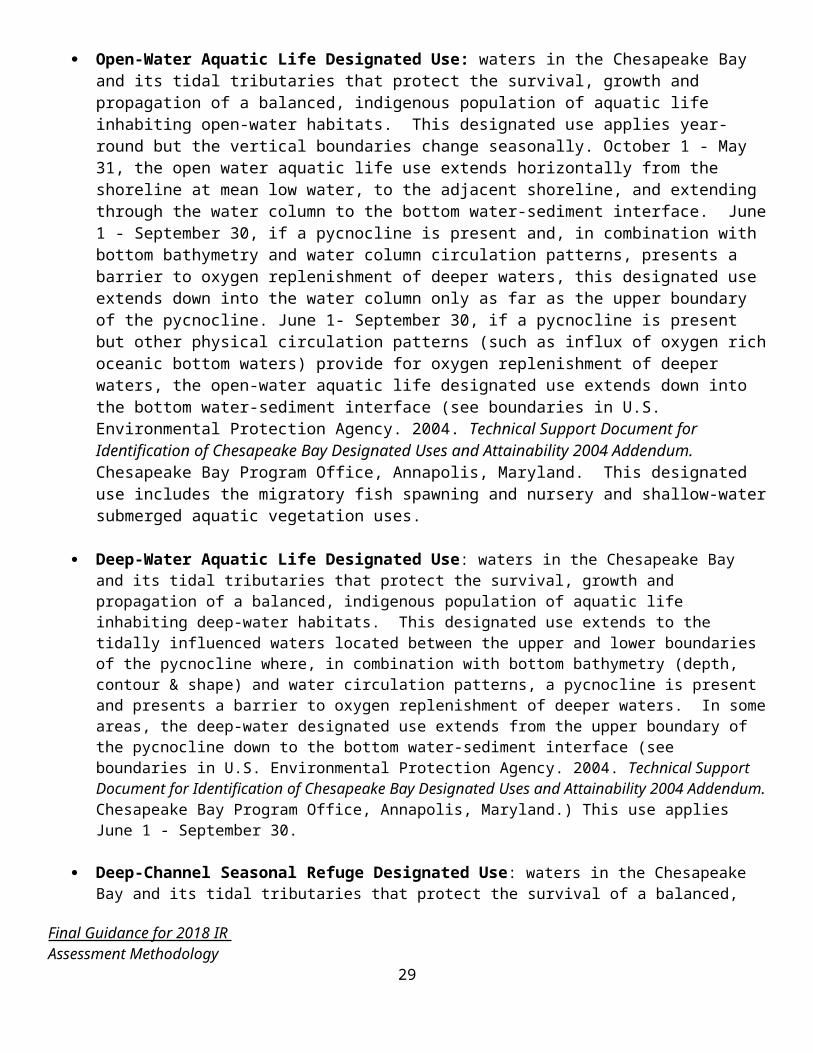
pH Evaluation
The pH criteria are based on the appropriate criteria established for that class of waters in section 9 VAC 25-260-50. pH information is used for assessment of aquatic life use.
Assessment for aquatic life use of lakes and reservoirs for the pH criterion range:
The 10.5% rule is applicable to assessments for the pH criterion range in all lakes and reservoirs sampled during the lake monitoring year, not just the significant man-made lakes and reservoirs and two natural lakes included in the WQS. For §187 lakes/reservoirs, pH samples taken for all months within the lake monitoring year, at all stations within a given lake or reservoir, are assessed only in the epilimnion if the water body is thermally stratified. If not stratified, pH should be assessed throughout the water column. A lake or reservoir is considered stratified if there is a difference of 1ºC /meter. If the differential is < 1ºC /meter, the lake is not considered stratified. Lakes/Reservoirs not listed in §187 should have all pH samples assessed regardless of thermal stratification determination. Two or more exceedances and >10.5% exceedance of total samples are required before a water body is listed as impaired for pH criterion range (6.0-9.0 for most freshwater lakes and reservoirs) under § 62.1-44.19:5 and 7 of the Code of Virginia.
In cases where the applicable nutrient criteria are met for the man-made lakes/reservoirs listed in §187 but the pH criterion range is not met, the lake or reservoir should be classified as Category 5C and recommended for a WQS review due to natural pH fluctuations. In lakes that are not in §187, the waterbody would be listed as impaired (Category 5C), as well. See lakes/reservoir assessment flowchart below.
Trophic State Index (for non-significant/non- §187 lakes) Trophic state index equations for secchi depth (SD), chlorophyll-a (CA), and total phosphorus (TP) will be calculated in stratified lakes using aggregated station data in the epilimnion from mid-June through mid-September (at 0.3 m for TP and CA) and will be used to determine if DO problems in non §187 lakes and reservoirs are natural (Category 4C).
A trophic state index value of 60 or greater for any one of the 3 indices will indicate that nutrient enrichment from anthropogenic sources are adversely interfering, directly or indirectly, with the designated uses. A TSI value of 60 corresponds to a CA concentration of 20 ug/l, a SD of 1 meter, and a TP concentration of 48 ug/l.
The TSI equations: TSI(SD) = 10(6 - (ln SD / ln 2)) TSI(CA) = 10(6 - ((2.04 - 0.68 ln CA ) / (ln 2))) TSI(TP) = 10(6 - ((ln (48 / TP)) / (ln 2)))
SD = meters Final Guidance for 2018 IR Assessment Methodology
32
CA = ug/TP = ug/l
The following rules apply: 1. Do not calculate a chlorophyll-a TSI in lakes that are treated with algaecides. 2. The chlorophyll-a TSI will normally be the preferred indicator in untreated lakes. 3. Assume that typical Virginia freshwater lakes and reservoirs are phosphorus
limited. 4. Do not use the secchi depth index in the assessment if it is much larger than the
CA and TP indices in the same assessment unit (this indicates prevalence of inorganic matter).
5. The appropriate TSIs should be calculated based on all summer sample data collected in the segment using the spreadsheet that has been developed for easier data processing.
For each monitoring station, if one or more of the TSIs ≥ 60*, the non-§187 lake/reservoir will be assessed as impaired partially due to one or more pollutants from anthropogenic sources. The assessment unit or entire lake/reservoir will be placed in Category 5A for TMDL development.
For each monitoring station, if each of the TSIs < 60, the lake/reservoir will be assessed as impaired due to pollution from natural sources and placed in Category 4C. A TMDL is not needed for the assessment unit represented by the monitoring station(s) and appropriate DO criteria will be developed for the hypolimnion.
Table 3. Trophic status in the Assessment Database (ADB)
Trophic Index Trophic State Carlson Trophic State Index
ADB Category
Hypereutrophic 80 – 100 5AEutrophic 60 – Less than 80 5AMesotrophic 40 – Less than 60 4COligotrophic 0 – Less than 40 4CUnknown Insufficient Data 3A
Final Guidance for 2018 IR Assessment Methodology
33
Figure 1. Lake Assessment Flow Chart
Draft Guidance for 2016 IR Assessment Methodology: Lake/Reservoir Assessment
34
5.8 Nonpoint Source (NPS) Assessment
Nonpoint Source (NPS) Assessment
The 2018 nonpoint source pollution (NPS) assessment will be performed by the Virginia Department of Conservation and Recreation (DCR) at the 6th order hydrologic units of the National Watershed Boundary Dataset. This assessment will consist of calculations of net loadings of the NPS pollutants - nitrogen, phosphorous, and sediment - per hydrologic unit as well as evaluations of NPS-related measures in these units.
Gross loadings of NPS pollutants are determined via a modeling process that closely approximates the results of the Chesapeake Bay Program water quality model in regards to loadings in the Bay watersheds, thereby diminishing the uncertainty of having significantly conflicting assessment results for that portion of the state. This model, as deployed, also calculates similar values for non-Bay watersheds to develop consistent statewide loadings. Inputs to this modeling process include:
A DCR modified land use / land cover layerA DCR developed confined animal data setCensus of Agriculture animal numbers by jurisdictionVirginia Department of Forestry (VDOF) forest harvesting data by jurisdictionVirginia Department of Mines, Minerals, and Energy (VDMME) extraction dataThe USDA’s Natural Resources InventoryChesapeake Bay Program Watershed Model outputUSDA statewide and jurisdiction level soil surveysVALUES based pasture yieldsA DCR developed table of dominant crop types by modeled hydrologic unitNational Weather Service weather records for a multi-state areaUSGS stream flows from gage stationsCensus of Population and Housing indicators of non-sewered population by block groupSlopes developed from USGS Digital Elevation Models (DEMs)A DCR developed indicator of stream density by modeled hydrologic unitA DCR developed manure application schedule by manure type by region
Improvements will be made to several of these inputs to better represent model year conditions. As loadings are significantly influenced by land use/land cover changes, improving this input layer is a priority. An evaluation of all available recent sources of this data will occur and establish the model year. Farm animal related uses such as pasture-cattle grazed, manure acres, etc. are also noteworthy load contributors. Thus this input will also be updated using various sources, including the US Census of Agriculture, the DCR Animal Feeding Operation (AFO) database, and DEQ’s Virginia Pollution Abatement permits for significant AFOs.
Net loadings are formed by subtracting the reductions in nitrogen, phosphorous, and sediment that are realized from both best management practice (BMP) installations and relevant grant projects from calculated gross loads. This includes BMPs funded and installed through DCR, VDOF, and the USDA. Updated BMP datasets will be used for this purpose. Results will produce NPS pollution load rankings per pollutant by categorized land use of the modeled hydrologic units.
In contrast to modeled potential nutrient loadings, the NPS related portions of the most current available list of water quality limited waters (from the 303(d) report) will be assessed by modeled hydrologic unit. This will produce rankings of hydrologic units from monitoring the impaired waters by water regime of the modeled hydrologic units.Final Guidance for 2018 IR Citizen and Non-Agency Monitoring
35
Aside from the NPS loadings described above, two variables used in the past NPS assessments for prioritizing watershed protection efforts for biological health will also be recalculated and ranked by modeled hydrologic unit in 2016 – an aquatic Index of Biological Integrity (IBI) and a public source water protection need.
A modified aquatic IBI score, calculated by the Center for Environmental Studies at Virginia Commonwealth University (VCU), will be used to indicate modeled hydrologic units in need of aquatic species health protection. The IBI score will be developed from the most recent aquatic species data collected by DCR, the Virginia Department of Game and Inland Fisheries (VDGIF), and VCU.
As an indication of human health protection concerns, a public surface source water protection variable will be calculated by hydrologic unit. This variable will reflect the area in each hydrologic unit that is within a Zone 1 protection level of public source water intakes as defined by the Virginia Department of Health (VDH), weighted by the population served by each intake.
DCR rates modeled hydrologic units as high, medium, or low for potential NPS problems as indicated by the NPS assessment. This categorization is performed so that approximately the highest 20% of the net loadings by unit are assigned the high rank. The next highest 30% of the net loading values are assigned the medium rank. All other units are assigned a low NPS rank. Rather than make a hard and true category split at these percentages, the category breaks are made where the larger net loading differences occur nearest to the stated percentages.
Impaired riverine and lacustrine waters, as well as the biological indicators, are ranked based on the clustering and spread of values. Impaired estuarine waters are not evaluated at all at this time due to the difficulty of associating their impairment sources with the surrounding land activities.
No single NPS ranking will be produced from the rankings of the various pollutant loadings, biological indicators, and NPS-impaired water regimes. Each user’s total ranking needs can be met by deciding which of the ranked categories are pertinent to their program’s cause and creating customized rankings using only those categories. DCR will, however, be flagging units with significant combinations of measures from this assessment, such as those with high aquatic biological diversity and/or public water supply protection need, and those with this same condition but with high NPS pollutant threats.
Other NPS reduction activities and results will be summarized. This will include agricultural BMP installations and NPS TMDLs.
5.9 Coastal Assessment
Virginia has 120 miles of Atlantic Ocean coastline and approximately 2,500 square miles of estuary. This resource has a prominent place in Virginia’s history and culture. It is valued for its commercial fishing, wildlife, sporting, and recreational opportunities, as well as its commercial values in shipping and industry. In the 1970’s adverse trends in water quality and living resources were noted and prompted creation of the Federal-Interstate Chesapeake Bay Program (CBP). The coastal assessment is conducted in the same manner as the estuarine assessments previously. Additionally, the federal BEACH program, implemented by VDH, has enabled the collection of recreational use data during the swimming season. Assessment of this data has been incorporated into the Integrated Report.
Final Guidance for 2018 IR Citizen and Non-Agency Monitoring
36
5.10 Wetlands Assessment
Background
Impacts to tidal wetlands, including vegetated tidal wetlands and non-vegetated shoreline between mean low and mean high water, are regulated under the Virginia Tidal Wetlands Act (Title 28.2, Chapter 13 of the Code of Virginia) enacted in 1972 and revised in 1982. The Virginia Marine Resources Commission (VMRC) is the regulating authority for the tidal wetlands laws while localities in Tidewater Virginia have the option to regulate their own tidal wetlands through citizen Wetlands Boards with oversight from VMRC. The Virginia Department of Environmental Quality (DEQ) is responsible for providing Section 401 Certification of Clean Water Act for Section 404 federal permits for tidal and nontidal wetlands and water withdrawals, through the Virginia Water Protection Permit (VWPP) Program, first developed in 1992.
The VWP permit program is administered by DEQ‘s Office of Wetlands & Stream Protection, and derives its regulatory authority from both the Clean Water Act (§401) and State Water Control Law (§62.1-44.15:20 of the Code of Virginia), found at http://water.epa.gov/lawsregs/guidance/wetlands/sec401.cfm and https://law.lis.virginia.gov/vacode/title62.1/chapter3.1/section62.1-44.15:20/, respectively.
Before July 1, 2000, applicants seeking a Clean Water Act § 404 permit (http://water.epa.gov/lawsregs/guidance/wetlands/sec404.cfm) from the U.S. Army Corps of Engineers (the Corps) for the discharge of dredged or fill materials in wetlands or waters of the United States were also required to submit an application to DEQ for a permit or waiver under § 401 Certification. In 2000, Virginia passed a Nontidal Wetlands Act that amended Title 62.1 of the Code of Virginia relating to wetlands. The Nontidal Wetlands Act mandates that the Commonwealth implement a nontidal wetlands regulatory program to achieve no net loss of existing wetland acreage and function, and to develop voluntary and incentive based programs to achieve a net resource gain in wetlands. Amendments to the Virginia Water Protection (VWP) permit program, fully implemented in October 2001, provided additional state jurisdiction and required a state permit for the following activities in a wetland: excavation, filling or dumping, activities in a wetland that cause drainage or otherwise significantly alter or degrade existing wetland acreage or function, and permanent flooding or impounding.
Amendments to the VWPP program in July 2007 provided clarifications of state jurisdiction of small water withdrawals, incorporated several provisions of the Local and Regional Water Supply Planning regulation, and addressed water supply permitting and surface water withdrawal concerns. Further amendments to the VWPP program in December 2008 provided exclusion of certain in-stream fills for water supply on agricultural properties.
Further reducing duplication of permitting between State and Federal agencies while ensuring minimal individual and cumulative consequences to wetland and stream resources, the Corps issued a State Program General Permit (SPGP), and suspended a few of the Nationwide Permits. The State Program General Permit (SPGP-01) was granted to the Commonwealth of Virginia by the Norfolk District Corps of Engineers (Corps) for the discharge of dredged and/or fill material in nontidal wetlands and waters associated with residential, commercial, and institutional developments and linear transportation projects within the Commonwealth.Corps general permits are authorizations issued on a nationwide or regional basis by the Army Corps of Engineers for categories of activities that have minimal environmental impacts. Programmatic general permits may be issued in situations where a state, regional, or local authority has a regulatory program in place that provides a similar level of review as the Corps. Final Guidance for 2018 IR Citizen and Non-Agency Monitoring
37
The SPGP-01 became effective on November 1, 2002, and included additional activities normally permitted by Corps’ nationwide permits. The Corps issued modified SPGPs in June 2007 and June 2012. The Norfolk District Corps (Corps) revised and expanded the State Program General Permit (12-SPGP-01), which became effective on June 1, 2012. A project must meet the wetland and stream impact thresholds and all other limitations and conditions of the SPGP to be used.
The permit process for both tidal and nontidal wetland activities relies on a Joint Permit Application (JPA) which receives independent and concurrent review by local wetlands boards, VMRC, DEQ and the U.S. Army Corps of Engineers (Corps), as appropriate.
By statute and by regulation, Virginia adopted the same definition of wetlands as the federal definition, and requires that wetlands be defined in the field using the Corps’ 1987 Manual. Specifically, wetlands are defined as "those areas that are inundated or saturated by surface or groundwater at a frequency and duration sufficient to support, and that under normal circumstances do support, a prevalence of vegetation typically adapted for life in saturated soil conditions. Wetlands generally include swamps, marshes, bogs, and similar areas." Wetlands are part of state waters, which are defined as "all water, on the surface and under the ground, wholly or partially within or bordering the Commonwealth or within its jurisdiction, including wetlands." The Corps has created Regional Supplements in an effort to address regional wetland characteristics and improve the accuracy and efficiency of wetland-delineation procedures. The Regional Supplements that apply to Virginia are: U.S. Army Corps of Engineers (2010) "Interim Regional Supplement to the Corps of Engineers Wetland Delineation Manual: Eastern Mountains and Piedmont Region," ERDC/EL TR-10-9, U.S. Army Engineer Research and Development Center, Vicksburg, MS and U.S. Army Corps of Engineers (2010). "Regional Supplement to the Corps of Engineers Wetland Delineation Manual - Atlantic and Gulf Coastal Plain Region (Version 2.0)," ERDC/EL TR-10-20, U.S. Army Engineer Research and Development Center, Vicksburg, MS.
Tidal wetlands are defined to include tidally influenced areas within Tidewater Virginia contiguous to mean low water extending landward to an elevation 1 1/2 times the mean tide range at a site and upon which is growing certain listed plant species. They also include “nonvegetated wetlands” which include unvegetated lands between mean low water and mean high water tides.
Section 62.1-44.15:21 of the Code of Virginia specifies that the state utilize the Corps' Wetlands Delineation Manual (Technical Report Y-87-1, January 1987, Final Report) as the approved method for delineating wetlands, and that the state shall adopt appropriate guidance and regulations to ensure consistency with the Corps’ implementation of delineation practices.
Purpose
A monitoring and assessment program is defined as the establishment and operation of appropriate devices, methods, systems and procedures necessary to monitor, compile, and analyze data on the condition of wetlands (adapted from the United States Environmental Protection (EPA) Agency’s “Elements of a State Water Monitoring and Assessment Program”, March 2003). Monitoring is the systematic observation and recording of current and changing conditions, while assessment is the use of that data to evaluate or appraise wetlands to support decision-making and planning processes. Wetlands can be characterized both by their condition and by functions. Wetland condition is the current state as compared to reference standards for physical, chemical, and biological characteristics, while functions represent the processes that characterize wetland ecosystems.
Final Guidance for 2018 IR Citizen and Non-Agency Monitoring
38
The overarching goal of Virginia’s wetland monitoring and assessment strategy was to develop a long-term implementation plan for a wetland monitoring and assessment program that protects the physical, chemical, and biological integrity of the Commonwealth’s water resources, including wetlands. In order to accomplish this goal, it is critical to first know the status of wetland resources in Virginia, in terms of location and extent of wetlands in each watershed, and have a general knowledge of the quality of these wetland resources. Secondly, the functions of wetland resources impacted through VWP permitting program must be accurately evaluated to determine those functions to be replaced through compensatory mitigation. It is also important to assess the degree to which the required compensatory mitigation is performing in relation to those impacted functions.
Since 2003, the overall wetland monitoring and assessment strategy has been to establish baseline conditions in various broad contexts, such as land use, watershed, and wetland type. This information can then be used to guide management decisions regarding wetland restoration efforts, programmatic compensatory mitigation, and integration with overall WQ Standards. This strategy provides the ultimate framework for an ongoing assessment of the status of the Commonwealth’s wetland resources and the success of both wetland regulatory and voluntary programs. The wetlands monitoring strategy will be coordinated with Virginia’s comprehensive water quality monitoring program strategy. The monitoring objectives are designed to support regulatory decision-making, allow reporting of wetland conditions, and provide information for policy development.
The wetland monitoring program will also meet the Clean Water Act objectives for water monitoring programs by addressing the quality of the Commonwealth’s wetlands and their condition as part of the overall condition assessment of state waters.
Wetlands Assessment Approach
Virginia has developed a three-tiered approach to wetland sampling and analysis. Comprehensive coverage of all mapped wetlands is achieved with a GIS based analysis of remotely sensed information (Level I analysis). These data are summarized on the basis of small watersheds or hydrologic units. It provides a first order evaluation of the condition and functional capacity of wetlands based on their landscape position.
The second level assessment (Level II) is intended for use in a statistically selected sub-sample of the watershed wetland population and involves a more sophisticated analysis of remotely sensed information and a site visit for verification and additional data collection. The third level assessment (Level III) involves very detailed analysis of wetland performance of specific functions (i.e., habitat and water quality). This involves extensive sampling of a limited number of sites, specifically chosen to allow validation of the conceptual model of wetland function that underlies the Level I and Level II assessments.
A critical part of the overall monitoring and assessment strategy is effective validation and calibration of the underlying models. The Level III assessments are designed to specifically evaluate performance of functions in wetlands under varying degrees of stress, as indicated by the Levels I and II protocols.
Wetlands Monitoring Program Development
The DEQ wetlands program, in coordination with the overall DEQ water quality monitoring program, has developed a ten-year plan for wetland monitoring and assessment in Virginia. This work is being accomplished as work products under EPA State Wetland Development Grants CD-983380-01, CD 983815-01, BG 983924-4, and BG-983925-01, BG-98392502 and BG-98392503 to the Department of Environmental Quality. The development of this strategy follows the EPA October 2002 draft document “Elements of a Wetland Monitoring and Assessment Program Checklist,” EPA May 2006 “Application of Elements of a State Water Monitoring and Final Guidance for 2018 IR Citizen and Non-Agency Monitoring
39
Assessment Program for Wetlands” (a supplement to the 2003 EPA document) and includes discussion of the following ‘Ten Essential Elements of a State Water Monitoring and Assessment Program’ (USEPA, March 2003):
1. Monitoring Program Strategy2. Monitoring Objectives
Information derived from monitoring will be used to:
Report ambient wetland conditions in Virginia's Clean Water Act (CWA) Section 305(b) reports;
Assist in the evaluation of environmental impacts of proposed impacts to wetlands during permit review as part of Virginia's regulatory program;
Evaluate the performance of wetland restoration and compensatory wetland mitigation in replacing wetland acreage and function; and
Evaluate the cumulative impacts of wetland loss and restoration in watersheds relative to ambient ecological conditions.
3. Monitoring Design4. Core and Supplemental Water Quality Indicators5. Quality Assurance 6. Data Management7. Data Analysis/Assessment
Examples of different wetland quality data analyses may include:
Comparison of wetland quality within a watershed and between watersheds Comparison of wetland quality within a locality and between different localities Comparison of wetland quality within a watershed or locality over time Comparison of wetland quality between wetland types Correlation of wetland type and specific stressor Comparison of wetland quality within and between hydrogeomorphic (HGM) classes Comparison of wetland quality within a specific wetland over time
8. Reporting9. Programmatic Evaluation10. General Support and Infrastructure Planning
Virginia’s wetland monitoring and assessment program is being implemented through a cooperative agreement between DEQ and the Center for Coastal Resources Management at the Virginia Institute of Marine Science (CCRM) using funds awarded through EPA’s Wetland Program Development Grants to continue these efforts. DEQ has received seven grant awards from EPA over the past eight years for this initiative, and Virginia is recognized as one of five states leading this initiative nationally.
Parameters used in the assessment reflect information from published literature, with consideration of on-going work being conducted through the Mid-Atlantic Wetland Workgroup (MAWWG), regarding each parameter’s validity, usefulness, and utility for field data collection.
Final Guidance for 2018 IR Citizen and Non-Agency Monitoring
40
The protocol for the wetland monitoring and assessment developed in Virginia consists of a multi-tiered sampling design coupled with methods for regulatory updates and field office data delivery (see Figure 2 below). Each assessment level informs the other levels, and is essential in development of the final assessment protocol.
Figure 2. Multi-tiered sampling design of wetlands
The elements of Virginia’s wetland monitoring and assessment program are listed in Table 4 below.
Table 4 - Wetland Monitoring and Assessment Program ElementsMonitoring Strategy Establish baseline condition of nontidal wetlands by
broad category scalable from individual wetland to small watershed to physiographic province to entire State.Guide management decisions regarding restoration, compensation, and regulation of wetlands.
Final Guidance for 2018 IR Citizen and Non-Agency Monitoring
41
Table 4 - Wetland Monitoring and Assessment Program ElementsMonitoring Objectives Support regulatory decision-making.
Report wetland condition.Guide policy development.Evaluate cumulative impacts of wetland loss.Evaluate wetland restoration and compensatory mitigation effectiveness.
Survey Design Three-Tiered: Sample Frame = all NWI wetlandsEnhanced GIS analysis (census) – Level I.Probability-based sampling for field assessment of anthropogenic stressors – Level II.Intensive study of biological endpoints (birds, amphibians, water quality) along stressor gradient – Level III+
Assessment Indicators and Methods
Level I: land use adjacent, within 200m, and within 1000m of wetland, wetland size, type, hydroperiod, proximity to other wetlands, road type, road density, and road alignment.Level II: Field assessment of anthropogenic stressors within 30m of wetland assessment point and within 100m of wetland assessment point.Level III: Population and community structure metrics for birds and amphibians. Water quality modification metrics.
Quality Assurance An EPA-approved Quality Management Plan coupled with the Center Quality Assurance Plan used to prevent random and systematic errors. Techniques include direct electronic field data assimilation to prevent transcription error as well as random return site visits and redundant QA assessment loops.
The strategy continues to develop a complete wetland monitoring and quality assessment in Virginia’s Coastal Plain, Piedmont, and Ridge and Valley physiographic provinces in Virginia. The long-term field assessment strategy is outlined in Table 5 below. The strategy developed in Phase 1 provides the framework for the ongoing assessment of the status of the Commonwealth’s wetland resources and performance measures for both the wetland regulatory and voluntary programs. Products from this strategy directly support Goal 4 of EPA’s Strategic Plan to provide “…additional focus on assessment of wetland condition” and the National Priority of “wetlands monitoring and assessment.”
Table 5: Long-term wetlands field assessment strategy for VirginiaPhase 1
Oct. 2003
Begin Level I assessment for Virginia. Complete
Dec. 2004
Begin Level II site assessment of Coastal Plain wetlands. Complete
Dec. 2005
Complete Level I assessment of Virginia, Complete Level II site assessment of Coastal Plain, Develop protocol for Level III assessment for Coastal Plain
Complete
Final Guidance for 2018 IR Citizen and Non-Agency Monitoring
42
Table 5: Long-term wetlands field assessment strategy for Virginiaphysiographic province.
Phase 2
Dec. 2005
Begin Level II site assessment of Piedmont physiographic province.
Complete
Sept. 2007
Complete Level II site assessment of Piedmont. Begin Level III sampling for coastal plain sites.
Complete
Phase 3
Oct. 2007 –Sept. 2008
Complete enhanced wetland site selection for Ridge and Valley Level II site assessment using a protocol for probable wetlands location. Complete Level II site assessment for Ridge and Valley physiographic provinces. Continue Level III sampling for Coastal Plain.
Complete
Phase 4
Oct. 2008 – Sept. 2010
Begin Level III (model validation) sampling for Piedmont, and Ridge and Valley. Begin Level II re-sample coastal plain subset for calibration.
Complete
Phase 5
Oct. 2010
Begin Level I re-sample of Virginia for trends analysis. Complete
Phase 6
Oct. 2011
Development of a Wetland Program Comprehensive Plan, refinement of our environmental database, and continued development of the wetlands monitoring and assessment program.
Complete
Phase 7
Jan.2012– Dec.2016
Collaborate with VDOT to incorporate linear transportation projects into the wetland data viewer, review and update the monitoring and assessment strategy to incorporate completed tasks and re-evaluate the direction of the strategy.
In Progress
The level I assessment, which has been completed for all wetlands in Virginia, is based on wetland type and surrounding landscape. The Level II and Level III sampling are intended to calibrate and validate the model that is applied at the Level I (model development) stage. The data collections are not designed to operate independently. The method characterizes the capacity of the wetland to provide water quality and habitat services using remotely sensed data. The underlying models are based on existing research. They specify the combination of landscape level parameters that are most likely predictive of these capacities. The model application produces a relative score for each wetland for each service. The scores are then refined and calibrated by site visits to randomly selected wetlands. The relationship between structure and function is validated by intensive study of ecological service endpoints.
The assessment was done using existing data sets from the National Wetlands Inventory (NWI), Landsat Thematic Mapper (TM) satellite, protocols developed by the Coastal Change Analysis Program (CCAP) of the National Oceanic and Atmospheric Administration (NOAA), U.S. Geologic Survey National Elevation Dataset (NED), and Digital OrthoPhoto Quads. The parameters chosen for Virginia’s Level I assessment wetland quality score include: (i) wetland size, (ii) wetland type, (iii) wetland hydroperiod; (iv) proximity to other wetlands; (v) proximity to roads and highways, (vi) density of roads and highways; and (vii) percent land cover (immediately adjacent to the study wetland, at a 200 meter radius from the study wetland, and at 200-1000
Final Guidance for 2018 IR Citizen and Non-Agency Monitoring
43
meter radius from the study wetland). The data set will be updated periodically, when resources allow, as revised land cover and NWI maps are updated.
The level I (model development) analysis, combined with validation and calibration from the level II and level III assessments, will provide an evaluation of the condition of wetlands based on their position in the landscape. This information is directly applicable to status and trends reporting under Clean Water Act Section 305(b), and can be utilized in permitting programs to assess cumulative impacts to wetlands within watersheds.
Level II and III assessments have proceeded by physiographic province from the coastal plain to piedmont to the ridge and valley with a sampling effort succeeded by model validation. Re-calibration of the stressors by landcover to verify the correlation of stressor type to landcover and validate the use landcover for condition assessment scoring has been completed.
Resampling of NWI mapped wetlands in the Coastal Plain and the Piedmont to investigate possible changes between surrounding land use and wetland stressors has been completed. This information is critical in the Virginia assessment protocol as the foundation of the stressor prediction algorithm in the Level I assessment model. It is essential to revisit the relationship between land use practices and stressors impacting wetlands as the pattern of development changes. Evolving best management practices in agriculture, and changing stormwater and site development regulations in suburban communities alter the probable occurrence of selected stressors. Since the Level I protocol uses remotely sensed land cover information to predict stressor occurrence, it is critical to periodically reassess the prediction algorithms. This task involved re-sampling the Piedmont region with the Level II protocol. Sixty sites, 1/10th of the original sample number, were randomly sampled to detect potential significant changes in the relationships established in the original sample set. The major stressors found within wetlands remained similar between sample periods with mowing, brush cutting, roads, eroding banks, and unfenced livestock predominating. There was an uptick in the ditch/drain stressor in the 2011 sample and a downtick in the presence of potential nonpoint discharge.
A critical part of the overall monitoring and assessment strategy is effective validation and calibration of the underlying models. The level III assessments are designed to specifically evaluate performance of functions in wetlands under varying degrees of stress, as indicated by the level I and level II protocols. This project completed Level III validation within in the Piedmont and Ridge and Valley and began the wetlands condition status and trends analysis for the Coastal Plain. The Coastal Plain analysis provided a direct measurement of the selected sites’ performance of habitat (avian and amphibian) functions to allow testing for correlations between ecological service and stressor levels.
One of the potential advantages of the Virginia protocol for monitoring and assessment of nontidal wetlands is the opportunity to develop a comprehensive assessment of the functional condition of all mapped wetlands whenever there is updated land cover information. This information is particularly useful for evaluating the performance of the regulatory program. It is also useful for indicating cumulative impacts to wetland resources arising from development activities that do not directly impact wetlands. This information can help to raise awareness of consequences and motivate essential change in general land use management and planning that affects lands outside wetland jurisdictional boundaries. Linking decisions in these areas to wetlands policy will be essential to attainment of the no net loss goal.
This task took advantage of the recently updated coastal plain assessment protocol, and the newly available land cover information from the NOAA Coastal Change Analysis Program. The recent update of the land cover classification for the coastal plain of Virginia provides a 2006 land cover that can be used in conjunction with the 1996 and 2001 land cover data set to assess change. All three land cover data sets were analyzed using the Final Guidance for 2018 IR Citizen and Non-Agency Monitoring
44
Level 1 assessment model. CCRM then summarized the changes in wetland condition output by the model. This represents the first comprehensive assessment of trends in wetland condition over a relatively modern time interval. Analysis of wetland water quality condition and habitat condition scores by 12-digit hydrologic unit code showed some changes in average water quality and average habitat condition over time.
Using the analysis of wetland condition change, the water quality data was analyzed for Virginia’s coastal plain. By developing catchment areas for the various water quality monitoring stations, the primary objective of this task was to search for relationships between water quality condition recorded at DEQ water quality stations and the condition of wetlands in the contributing drainage.
To test wetland water quality condition scores, Virginia Department of Environmental Quality coastal plain water quality stations (n=99) were used to determine possible trends between wetland water quality condition scores and in-stream water quality metrics (E. coli, fecal coliform, total nitrate nitrogen, DO, pH, and turbidity). Contributing drainage areas were developed for water quality stations using the same protocol for development of individual wetland drainage areas (Figure 3). Water quality station data was compared to contributing drainage wetland water quality condition scores for multiple years (1996, 2001, and 2006).
Final Guidance for 2018 IR Citizen and Non-Agency Monitoring
45
Figure 3. Wetland water quality stress condition within the contributing drainage to a Virginia Department of Environmental Quality water quality station.
While there were no obvious trends between wetland water quality condition score and average DO, pH, and turbidity, there were trends in total nitrate nitrogen, fecal coliform levels, and E. coli levels. As shown in Figure 4, the higher the wetland water quality condition score in the contributing drainage the lower the levels of nitrate, fecal coliforms, and E. coli suggesting a relationship between those water quality parameters and wetland condition.
Final Guidance for 2018 IR Citizen and Non-Agency Monitoring
46
year 1996 2001 2006
M e a
n ( D
O )
M e a
n ( p H
) M
e a n (
T u r b
i d i t y
) 0 2 4 6 8
10
0 1 2 3 4 5 6 7
0
5
10
15
0.1 0.4 0.7 1 0.1 0.4 0.7 1 0.1 0.4 0.7 1 Wetland WQ Condition Score
Legend
DO
pH
Turbidity
.Figure 4. Comparison of wetland water quality condition scores (mode)
E C
o l i &
F e c
a l
T o t a
l N i t r
a t e m
g / L
100
200
300
400
500
600
0.0
0.2
0.4
0.6
0.8
1.0
0.1 0.4 0.7 1 Wetland WQ Condition Score
E Coli
Fecal
Total Nitrate
Figure 5. Comparison of in-stream water quality parameters (mean)
Final Guidance for 2018 IR Citizen and Non-Agency Monitoring
47

GIS Wetland Data Viewer
Coordination with VIMS and DEQ staff to design and implement procedures to facilitate the routine application of inventory and monitoring data for regulatory decisions on wetland permits is ongoing. The data collected has been compiled into a wetland data viewer created by CCRM with substantial input from DEQ. The goal is to automate the processing of database information through GIS necessary to support DEQ’s regulatory decision-making, allow reporting of wetland condition, and provide information for policy development.
The additions of data sets and GIS layers will allow Virginia to continue to develop a GIS-based wetland data viewer for use by regulatory agencies and the general public (see Figure 6). Our success will be measured by an increasing trend in the statistically-reliable Level I protocol and a decreasing trend in cumulative wetland impacts. By having a statistically-validated tool that measures wetland quality as a function of habitat and water quality parameters, our permit staff will be able to make better permit decisions relative to potential cumulative impacts. Further, we will also be able to measure how well we are protecting the function of our more vulnerable wetlands (i.e. isolated wetlands, vernal pools, Atlantic white cedar swamps), by comparing the condition of wetland habitat and water quality parameters, as a function of the assessment scoring over time.
Figure 6. Non-tidal Wetlands Data Viewer
Final Guidance for 2018 IR Citizen and Non-Agency Monitoring
48
The wetland data viewer illustrated above is currently under design modifications and testing, and is not expected to be available for general use until late 2013 or early winter of 2016. The overall outcome of this continued focus on wetland monitoring and assessment will be better protection of wetlands and more definitive and defensible information on wetland condition over time and documentation of how we are achieving no net loss of wetland acreage and function in Virginia.
5.11 Freshwater Probabilistic Assessment
The freshwater probabilistic monitoring program is designed to allow Virginia DEQ make estimates of water quality with known confidence for 100% of Virginia’s freshwater stream miles. Freshwater probabilistic monitoring is not designed to make segment/assessment unit decisions. However, a small number of parameters collected at probabilistic sites can be used to determine use support for that site.
The following parameters will be used for assessment unit decisions:
1) Dissolved Oxygen (if 2 out of 2 do not meet standard for stream class)2) pH (if 2 out of 2 do not meet standard for stream class)3) Temperature (if 2 out of 2 exceed standard for stream class)4) Virginia Stream Condition Index – Using the guidance set forth in the freshwater benthic assessment
guidance.
5.12 Continuous Monitoring Assessment Methodology
Continuous monitoring, in which multiple observations are collected during a 24-hour period at a relatively high frequency, can provide for a more comprehensive assessment of water quality than what more traditional discrete or "grab sample" monitoring provides because it generates more accurate descriptive statistics and can reveal daily, weekly, monthly, and seasonal variability. High-frequency data collection allows for a more accurate calculation of the frequency and duration of excursions as well. This is especially true for conventional field parameters (i.e., dissolved oxygen concentration and saturation, conductance, pH, temperature, and turbidity). Traditional sampling regimes (semi-monthly, monthly, bimonthly, or quarterly) can only provide a snap-shot of parameters, only allowing evaluation of parameter magnitudes and a very rough estimate of excursion frequencies. Another advantage of continuous monitoring is that it monitors environmental conditions at times when field staff rarely sample, such as during nighttime or early morning hours.
Although these are significant benefits of continuous monitoring, the large datasets generated by such monitoring can be a challenge for assessment. It is considered appropriate to apply a 10.5% rule to grab sample datasets, which tend to be relatively small, but applying that rule to a continuous monitoring dataset, which can contain as many as tens of thousands of observations, could result in a water being assessed as attaining the standard for a parameter that it may be actually impaired for. Thus, using continuous monitoring data for listing and delisting waters requires caution and thoughtfulness. The following rules were crafted with this in mind:
Rule 1
A continuous monitoring dataset that is eligible for assessment must cover at least thirty 24-hour periods (with the exception of data being assessed for maximum temperature exceedances, which must cover at least fifteen 24-hour periods). This allows for an informative characterization of a water during the critical period (May to September) when exceedances of conventional field parameters are most expected.
Final Guidance for 2018 IR Citizen and Non-Agency Monitoring
49
Rule 2
The continuous monitoring dataset will have undergone rigorous and standardized QA/QC screening before analysis. Every 24-hour period with at least 75% of its observations deemed as valid should be assessed and counted as a single sample. Grab samples must be collected during the run that a continuous monitor is deployed.
Rule 3
Daily averages are the mean of all valid observations (including grab samples from the same station) collected during a 24-hour period. An excursion of the DO daily average is defined as a mean calculated from all valid data collected during a 24-hour period (midnight-to-midnight) that is below the appropriate daily average criterion for a given water. To count two daily means not meeting the standard as separate excursions, they must not be contained within the same four-day interval. This is consistent with 4-day experimental tests conducted by USEPA during the development of chronic DO criteria.
Rule 4
A 24-hour period exceeds minimum and maximum instantaneous criteria when > 10.5% of its observations exceed the criteria. Any two such days, even if consecutive, would count as two separate exceedances. Water temperature should be evaluated for exceeding increases as described in Section 9VAC25-260-60 of the Water Quality Standards. The “natural temperature” for a site should be determined upstream from a point-source discharge prior to assessment. Exceedances recorded during the continuous monitoring run should be combined with grab samples within the assessment data window. A 10.5% rule should then be applied to the combined data set.
Rule 5
For water temperature standards specifying a maximum hourly change (9VAC25-260-70), a 10.5% rule should be applied to the total number of monitored hours where data meet QA/QC (including hours of the first and last days of deployment.) Hourly change calculations should be based on sequential observations (rolling hourly averages); exceedance frequency should be determined by dividing the number of hourly change exceedances into the total number of clock hours. An additional continuous monitoring dataset, collected during a subsequent year, during the same month(s) as the listing dataset, must be used to delist it.
Rule 6
If a continuous monitoring dataset is used to list a water on the 303(d) Impaired Waters List, then an additional continuous monitoring dataset, collected during a subsequent year, during the same month(s) as the listing dataset, must be used to delist it. A water that was previously listed using grab samples may be delisted using continuous monitoring data collected for at least 30 days, during a subsequent year and during the same month(s) when exceedances were previously found.
Final Guidance for 2018 IR Citizen and Non-Agency Monitoring
50
SCENARIO # 1:
A monitor was deployed July 31 at noon and run continuously through September 1 (noon) at a station. Five grab samples were collected at that station during the same year as the monitor’s deployment (during February, April, June, July, and November); no other data exist in the assessment window for this station. No excursion of the minimum DO criterion is detected in the grab samples, while four 24-hour periods in the continuous monitoring dataset have >10.5% of their total observations not meeting the minimum DO criterion.
Assessment The sample size is 36 (31 continuous monitor “samples” + 5 grab samples). The first and last
24-hour periods observed by the monitor should not be used for assessment, since at least 75% of the diurnal cycle was not recorded by the monitor on these two days.
The exceedance rate is 11.1% and is therefore excessive. Accordingly, the water fails to meet the water quality standard for DO and should be placed on the 303(d) Impaired Waters list for this parameter.
To delist this water, a continuous monitor must be set up for the same length of time as the original run, during the same month (August). Grab samples should be collected during other months of the year to maintain “temporal representativeness”.
SCENARIO #2:
A monitor was deployed April 1 at noon and run continuously through August 31 (noon). Three grab samples were collected at that station during the same year as the monitor’s deployment (February, October, December), and ten were collected two years previously. None of the newer grab samples exceed any standard, but twelve 24-hour periods, the majority clustered in the summer months, have >10.5% of their observations not meeting the minimum DO criterion. The older dataset contained 2 excursions of the DO minimum criterion, and these excursions were also found during the summer. The water had therefore been placed on the 303(d) Impaired Waters list during the previous cycle.
Assessment The sample size is 164 (151 continuous monitoring samples + 3 new grab samples + 10 older
grab samples). The exceedance rate is not technically excessive (8.5%), as defined by the 10.5% rule. However,
there is evidence that the water experiences hypoxia during the summer. Before considering to delist the water, the assessor should address the following questions:
a) Do the excursions observed in the continuous monitoring dataset correspond temporally to those found in the older dataset used to list the water?
b) What is the average duration of the excursions? It would not be wise to delist a water characterized by long durations of excursions—particularly for excursions of the DO minimum.
c) What is the temporal frequency of the excursions? Are the exceeding 24-hour periods mostly consecutive, or are they spaced relatively far apart (potentially allowing for aquatic life recovery if the excursions are not too severe)?
d) Were hydrological and/or weather conditions similar between the current dataset and the older dataset?
e) Were there specific documented practices put into place that have improved water quality over the two-year period? (refer to Appendix D for more details)
Final Guidance for 2018 IR Citizen and Non-Agency Monitoring
51
f) Are excursions observed in the grab samples collected during the continuous monitoring run?
Note that this is not an exhaustive list of considerations. To resolve situations such as the one described above, the assessor may need to rely on best professional judgment rather than following a strict interpretation of the 10.5% rule.
PART VI. PROCEDURES FOR CITIZEN AND NON-AGENCY DATA
For the purposes of this guidance document, a citizen water quality monitoring program, or “citizen monitoring,” is defined as water quality monitoring which uses volunteers to collect the data. Some of these programs are run by local governments, Soil and Water Conservation Districts, citizen organizations, community organizations or colleges. Generally, K-12 school monitoring is conducted for educational purposes and does not fall under citizen monitoring unless working in cooperation with existing citizen monitoring efforts. Citizen monitoring is not defined as monitoring conducted by all entities external to DEQ, such as colleges and local governments, unless volunteers are used in their efforts.
DEQ does routinely receive water quality data from non-citizen volunteer sources such as local governments, universities, and other non-state or federal sources. The review and assessment of non-agency data is done using the same QA/QC review as with citizen monitoring data.
In 1997, Water Quality Monitoring, Information and Restoration Act (WQMIRA) was passed by the Virginia General Assembly. This bill charged DEQ with monitoring and assessing all the waters within the Commonwealth. During this same General Assembly session, the position of citizen monitoring coordinator was added into the operating budget of DEQ. The primary duties of the citizen monitoring coordinator were providing guidance and support to citizen water quality monitoring groups in the development of monitoring programs and quality assurance project plans. In addition, the citizen monitoring coordinator facilitated communication among citizen groups and other state agencies, sponsoring citizen monitoring seminars, promoting the use of citizen water quality data in a manner consistent with the data use goals of the organization and encouraging additional citizen monitoring efforts. In 2002, the Virginia General Assembly passed legislation that established the Virginia Citizen Water Quality Monitoring Program in the Code of Virginia (§62.1-44.19:11).
In 2004, the citizen monitoring coordinator position evolved into the role of water quality data liaison. This was done to centralize the task of requesting any and all available data collected outside of DEQ for inclusion into water quality assessment reports and follow up monitoring by DEQ. The duties and responsibilities of the former position regarding citizen monitoring data submissions and working with the citizen monitoring community have been maintained and expanded to include all other non-DEQ potential sources of water quality data.
Assessment Process: The process of assessing water quality data submitted to DEQ involves staff from both the central office headquarters and the regional offices. In order to include any citizen or non-agency monitoring data in the biennial 305(b)/303(d) Integrated Water Quality Assessment Report (Integrated Report), it must be received and evaluated by the agency. By adhering to the tasks outlined below, the agency can ensure that all qualifying monitoring data is properly assessed. Final Guidance for 2018 IR Citizen and Non-Agency Monitoring
52
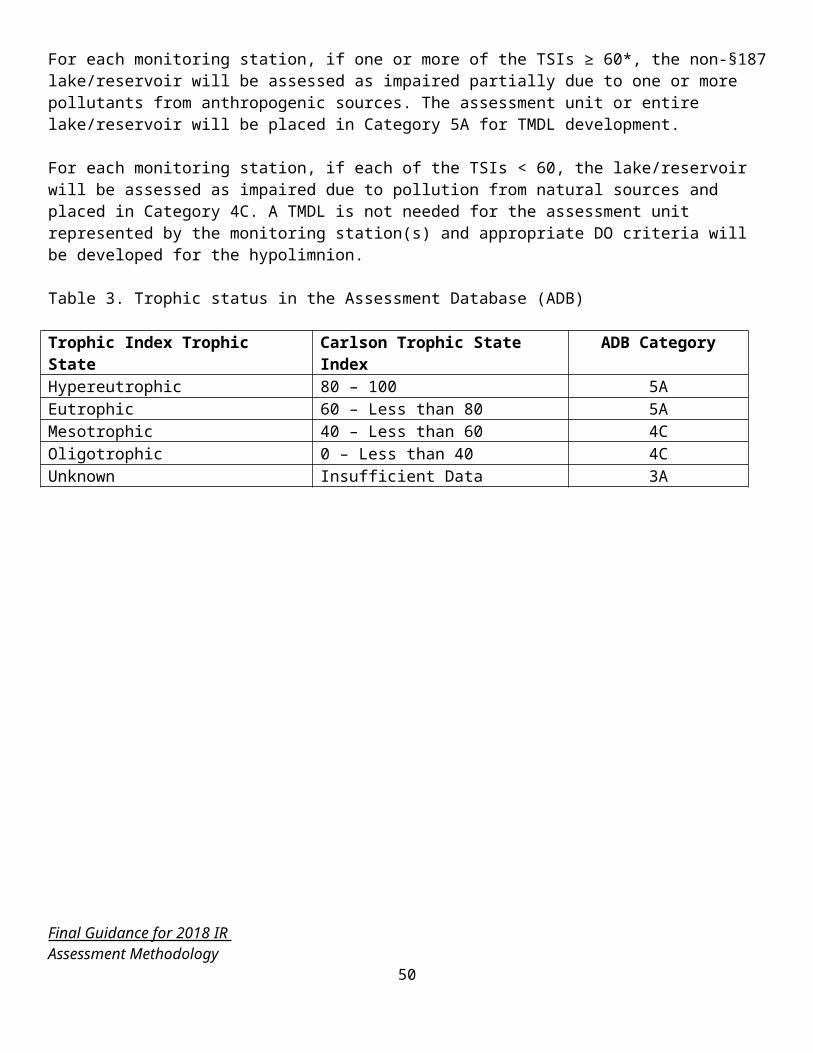
Submitting Data for Evaluation: 1. All water quality data provided to DEQ from citizen and non-agency organizations should be sent to the
water quality data liaison at DEQ. The liaison and the appropriate QA/QC staff in the Water Monitoring and Assessment (WMA) Office will review all standard operating procedures (SOPs), QA/QC plans or Quality Assurance Project Plans (QAPPs) for each citizen/non-agency monitoring group submitting chemical data.
For citizen/non-agency chemical and bacteria monitoring programs, the liaison will work with the WMA quality assurance (QA) coordinator. The liaison, QA coordinator, and the Biological Monitoring Program Coordinator will review all supporting documentation for benthic macroinvertebrate citizen/non-agency monitoring programs. Based upon the review of all procedures, the appropriate use of the data will be determined based on a three-tiered system.
2. The designation of DEQ tiered uses of data will be determined based upon the review of all procedures in conjunction with the organization submitting the water quality data. Any changes in QA/QC and/or SOP methods and/or any additions or deletions of current monitoring sites should be brought to the attention of the WQDL.
Since 2007, DEQ has provided a data use authorization form to monitoring groups. Because not all non-DEQ organizations may wish to have their data used for water quality assessment reports, this form allows DEQ to meet their wishes. This authorization form cannot be used to upgrade the use of lower tiered data for a higher tiered purpose. Such an example would be a data submitter requesting DEQ to assess their data for Level III (use for 303(d) listing/delisting of impaired waters) based on Level II or Level I quality data.
Central Office Assessment Tasks:1. The QA coordinator, with the help of the liaison, will provide a copy of all Level II and III citizen and
non-agency monitoring data received during a given assessment cycle to the regions. The format of the data provided to the regions will be as follows:
a. Data will be in electronic spreadsheet format compatible with programs used by the regional assessors.
b. Level II and III data will be combined with columns denoting the applicable QA status and assessment use for that data point.
c. All data not meeting QA/QC requirements or otherwise not relevant for assessment will be omitted by the QA Coordinator. However, an unedited master copy of all data submitted will be maintained.
d. At a minimum, all citizen and non-agency monitoring sites submitted to the regions for assessment will contain the following metadata:
i. Name of waterbody monitoredii. Latitude and Longitude information iii.Physical description of the site (i.e. At Route 646 bridge crossing)
Final Guidance for 2018 IR Citizen and Non-Agency Monitoring
53
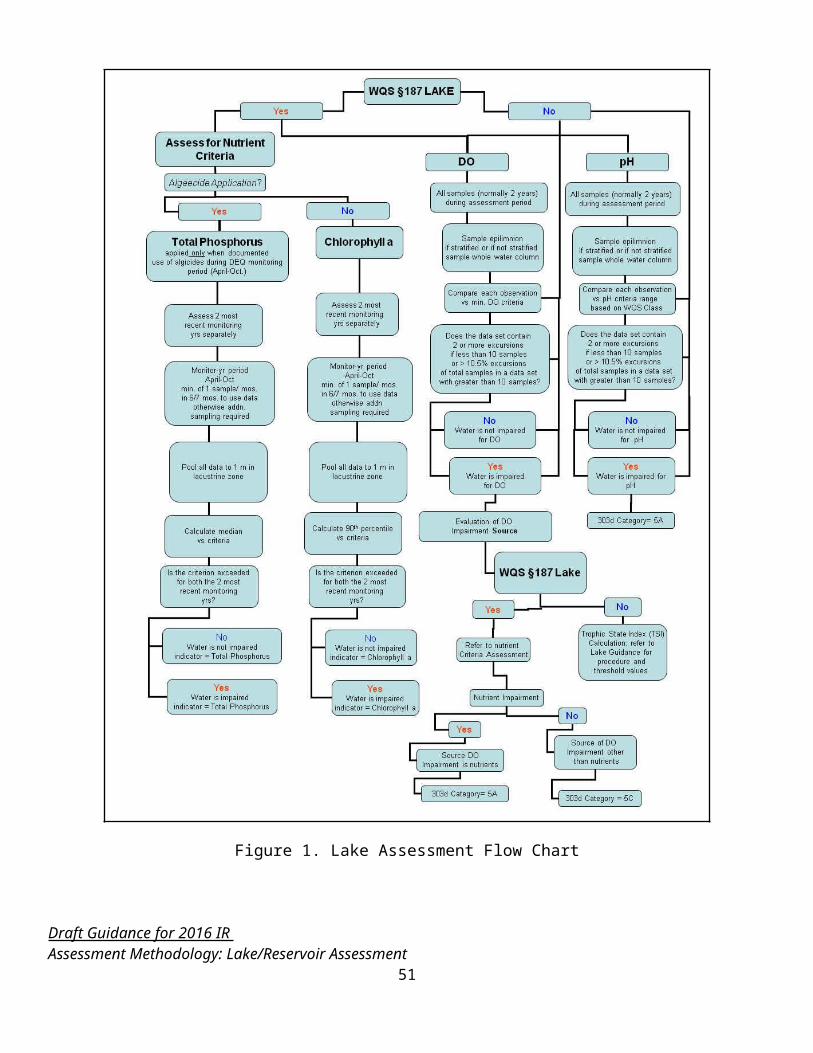
2. The liaison and QA coordinator will review data collected without SOPs and QAPPs plans. This data will be acknowledged in the applicable river basin evaluation as appropriate.
3. Citizen and non-agency monitoring groups that provided data for the assessment will have a summary of their results placed in a separate Citizen Monitoring/Non-Agency section of the Integrated Report.
4. The QA coordinator, with the help of the liaison, will coordinate with each regional office regarding the final assessment of the citizen and non-agency monitored data. In coordination with the liaison and the assessment coordinator, each regional office should provide any appropriate final editing of the citizen and non-agency monitoring assessment.
5. After the release of the final biennial Integrated Report, regional DEQ monitoring staff will receive a list of all stations where monitoring results indicate possible water quality impairments. This list will identify waters based on the probability of impairment ranked from low to high. The regional monitoring staff should review the station list results and consider including monitoring sites as appropriate to their regional monitoring plan for future monitoring.
6. With the help of the liaison, the QA coordinator will provide all data approved by DEQ for use in the Integrated Report in basic data tables. The tables will be posted on the DEQ website along with the final Integrated Report. At a minimum, these data tables should include each individual sample period.
Regional Office Assessment Tasks:1. All approved conventional parameter data should be summarized by major watershed and characterized
according to the procedures and considerations in Part V of this manual.
2. For benthic macroinvertebrate monitoring programs used by citizen and non-agency monitoring organizations, data will be assessed based on the criteria outlined in Guidance Memo No. 06-2010, Guidelines for DEQ Review and Approval of Biological Monitoring QAPPs.
a. For organizations that complete the requirements outlined in the guidance memo for Level III,
DEQ staff will assess the data for the purposes of 305(b) water quality assessment and 303(d) listing and delisting of impaired waters. If a validation study showed inconclusive correlation with DEQ benthic protocols, the corresponding scores showing inconclusive correlation will not be assessed as Level III. These ‘gray zone’ scores may be used to characterize waters with or without observed effects (Category 3C or 3D).
b. For all other methods not validated by DEQ or using DEQ protocols, biological monitoring sites characterized by citizen and non-agency organizations as “excellent,” “good” or “acceptable” should be designated as “Area of low probability for adverse conditions” (Category 3D). Biological sites periodically characterized as “fair,” “poor,” “unacceptable” or “moderate” should be designated as “Area of medium probability for adverse conditions” and listed as insufficient data with observed effects and prioritized for follow-up monitoring (Category 3C). Likewise, biological sites that are consistently “poor” or “unacceptable” should be characterized as “Area of high probability for adverse conditions” and listed as insufficient data with observed effects with DEQ follow up monitoring to be prioritized (Category 3C).
3. Segment lengths represented by a monitoring site should be determined using the mileage delineation guidance found in Section 5.1. Each monitoring site used in the assessment should have a unique station
Final Guidance for 2018 IR Citizen and Non-Agency Monitoring
54
ID using a system similar to the DEQ station ID system. The regional office staff assigns this station ID to each citizen/non-agency monitoring site and relays the station ID to the QA Coordinator.
4. Level III data collected at sites that complement and are comparable (i.e. chemical to chemical comparisons and biological to biological comparisons) to DEQ monitoring sites, should be included in the major basin report. However, the final assessment of that segment will be made using the DEQ monitoring data (found in the appropriate section of the Integrated Report). In this case, the data collected by the monitoring organization would be used as supplemental data.
5. Level III data collected at sites that do not complement or compare (i.e. benthic to chemical comparisons) to DEQ monitored sites, should be included in the major basin report. The final assessment of the segment should be primarily assessed using the non-DEQ monitoring data. For example, Level III citizen benthic macroinvertebrate data shows impairment while a nearby DEQ chemical monitoring station does not directly show impairment.
6. Level II ambient and bacteria data collected at sites will undergo the similar evaluation process as used for Level III and DEQ results. Since Level II data may have some variation in quality assurance, corresponding waterbodies that indicate poor water quality will be listed as insufficient data with observed effects and prioritized for follow-up monitoring (Category 3C). Waterbodies that have Level II data indicating good water quality will be listed as insufficient data with low probability for adverse conditions (Category 3D).
7. If during the regional review, a discrepancy between data from DEQ monitoring stations and data from nearby citizen/non-agency monitoring stations is believed to be suspect, the QA coordinator should be notified and effort made to rectify the discrepancy.
The QA coordinator and liaison will evaluate the potential causes for the data disparity and/or review the QAPP and the monitoring techniques of the data submitting group. After this evaluation is complete and a problem is confirmed, appropriate corrective actions will be recommended to the monitoring group for inclusion in the citizen/non-agency monitoring organization’s QAPP and/or SOPs.
Until the discrepancies with the data and/or methods are fully evaluated by DEQ, the data (either for the parameter(s) of concern or for all observations) should not be used in agency assessments. If the citizen or non-agency monitoring group does not initiate corrective action, the QAPP for that parameter and/or for the group as a whole may no longer be considered valid by DEQ, and the data will not be considered for statewide water quality assessments.
Other State and Federal Water Quality Data
After review and approval of monitoring and QA/QC protocols, DEQ will consider data generated by other State and Federal monitoring programs for use in the Integrated Report. DEQ has established a water quality data sharing agreement with several state and federal agencies that includes the Virginia Department of Health, Tennessee Valley Authority, National Park Service, United States Forest Service, and the United States Geological Survey.
Virginia Department of Health (VDH) - DEQ receives and lists areas closed by VDH for shellfish harvesting due to high bacteria levels. All Enterococcus bacteria results provided by VDH are also used along with any
Final Guidance for 2018 IR Citizen and Non-Agency Monitoring
55
DEQ water quality data in assessing water quality. Any other water quality data collected by VDH and shared with DEQ will be used at the latter agency’s discretion.
Tennessee Valley Authority (TVA) - The TVA routinely monitors for E. coli bacteria along TVA reservoirs in Virginia. These data are considered acceptable for assessing water quality in Virginia.
National Park Service - The National Park Service has several long-term monitoring programs in place at many of the national parks in Virginia. Many of the parks monitor for chemical and benthic macroinvertebrate parameters using varying methodologies or procedures. Because of this, the liaison and QA coordinator provide guidance to the regional office assessment staff in assessing data received from the parks.
United States Forest Service (USFS) - The USFS program collected macroinvertebrate data from numerous monitoring stations within the George Washington and Jefferson National Forests. Sampling for macroinvertebrates is conducted utilizing the same collection methodology (Plafkin et al 1989) that DEQ biologists use in the ambient biomonitoring program. Therefore, the raw data collected by the USFS should be highly comparable with DEQ data. The USFS has used the Macroinvertebrate Aggregated Index for Streams (MAIS) to assess this raw data and make an initial water quality interpretation.
The DEQ regional biologists and planners may use the data, provided to DEQ by the USFS, in the Integrated Report if they find it acceptable for assessment purposes. If the regional biologists or planners have information that conflicts with the initial USFS assessment, or for any other reason questions the USFS stream assessment, they may elect to disregard the USFS assessment results until further verification can be obtained. If the initial assessment is not used, documentation relating to this decision will need to be provided. The regional biologists may elect to reevaluate the raw data using the Virginia Stream Condition Index (VSCI) metrics to confirm consistent assessment methodology and conclusions. If differences become apparent, the regional biologists may decide not to use the assessment data in the Integrated Report until an on-site stream visit can be performed and conditions verified. Final assessment results of the USFS data should be consistent with the ambient biological assessment criteria described in Section 5.4 of this guidance. Any non-approved data will not be used directly in the assessment.
United States Geological Survey (USGS) - The USGS monitors several water quality stations throughout Virginia. Data collected by the USGS is considered Level III by DEQ and is used in assessing water quality including 303(d) impairment listings and delistings. Water quality parameters for which there are no established numerical criteria in Virginia’s water quality standards are not used for the purposes of 303(d) impairment listing, but can be used to assess waters for observed effects (Category 3C/3D).
Final Guidance for 2018 IR Citizen and Non-Agency Monitoring
56
PART VII. 303(d) LISTING/DELISTING and TMDL PRIORITY RANKING
Effluent Limited and Alternative Control Waters (Category 4B/5E)
Rule 1
When reviewing waters receiving effluent from facilities with water quality-based effluent limits in VPDES permits, the following should be considered in developing the 303(d) list:
1. If the permit has been issued with no compliance schedule and the limits are to be met upon permit issuance, then listing is not necessary.
2. If the permit for a previously listed water has since been issued with no compliance schedule and the limits are required to be met upon permit issuance, then the facility should be delisted. EPA must be provided a verification package for delisting waters (see Section 5.2 Rule 2).
3. If achievement with the existing permit compliance schedule or consent order has not occurred by the end of the 2018 reporting period (12/31/2016) but is anticipated to meet the schedule by the end of the 2020 reporting period (12/31/2018) AND the permit is still in effect, it is Category 4B.
4. If the existing permit expiration date is before the end of the 2018 reporting period (12/31/2016) and the compliance schedule or consent order compliance date is after the 2018 reporting period ending (12/31/2016), it is Category 5E.
5. If a permit re-issuance occurs with a new compliance/consent order schedule date between 12/31/2016 to 12/31/2021 (reflecting a five-year permitting cycle) and compliance with the previous permit compliance or consent order schedule was not achieved, the water is Category 4B.
However, if a staged or phased permit compliance schedule (greater than the permit five-year cycle) or consent order extends beyond 12/31/2021, then the water is Category 5E.
Figure 7.Assessment Timeline for Category 4B/5E Waters
Final Guidance for 2018 IR 303(d) Listing/Delisting and TMDL Priority Ranking
57
Rule 2
The verification process for removing or delisting effluent-limited waters must consider the following:
The removal or delisting process applies only to waters impacted by a single point source discharge. TMDLs will have to be developed and approved by EPA prior to delisting waters impacted by multiple discharges or a single point source with a significant nonpoint source “load allocation” component. A water listed in Part II for NH3-N discharging into a segment listed for nonpoint source fecal coliform bacteria could be removed since the bacteria problem is unrelated to the NH3-N.
If compliance with the water quality-based effluent limits is not met by the compliance date, the waters should not be removed from the list or should be relisted in Category 4B if previously removed and a new compliance schedule requiring compliance by the end of the next reporting period is in place. If a new compliance schedule has not been negotiated or extends past the next reporting period, the water should be listed as Category 5E. If post-operational water quality data shows that WQS are not being met, the water should remain on the list or be relisted in Category 5A.
If the above conditions are met, the following information should be submitted to EPA for delisting those waters identified in Category 4B of the 2018 303(d) Report. Waters that do not meet the above conditions should be listed or remain in Category 4B of the 2018 303(d) Report.
Verification Packet for VPDES Permits:Hydrologic Unit Code (HUC), Watershed Identity Number, Stream Name, Parameter, and VPDES Permit Number, Owner/Facility Name and recent DMRs showing compliance.
A statement identifying the basis for delisting the water. The statement should confirm that water quality based effluent limits were in place by the compliance date, and these effluent controls are sufficient to attain or maintain WQS. If the facility will meet the water quality-based effluent limits within the listing cycle required by federal law and WQS are expected to be attained or maintained, the verification should describe the facility’s progress in meeting the effluent requirements and the expectation that the compliance date in the permit will be met.
Copy of water quality analysis modeling conducted as part of permit development that shows the level of controls necessary to implement WQ Standards.
Copy of permit page (and/or any State compliance order and associated interim limits and schedule to achieve the final limit) that contains the required control levels.
Copy of permit page that provides the compliance date for water quality based controls.
Rule 3
Final Guidance for 2018 IR 303(d) Listing/Delisting and TMDL Priority Ranking
58
Category 4B – Alternative Control
EPA’s 2006 IR Guidance acknowledged that the most effective method for achieving water quality standards for some water quality impaired segments may be through controls developed and implemented prior to the TMDL development and/or implementation (referred to as a “4B alternative”). DEQ requests EPA to evaluate, on a case-by-case basis, the Commonwealth’s decisions to exclude or delist certain segment/pollutant combinations from Category 5 based on the 4B alternative. A 4B rationale will be provided to EPA in the submission of the 2018 IR which supports the Commonwealth’s conclusion that there are “other pollution control requirements” sufficiently stringent to achieve applicable water quality standards within a reasonable period of time. Required elements of the 4B rationale:Specifically, this rationale should include: (1) a statement of the problem causing the impairment,(2) a description of the proposed implementation strategy and supporting pollution controls necessary to achieve water quality standards, including the identification of point and non-point source loadings that when implemented assure the attainment of all applicable water quality standards, (3) an estimate or projection of the time when water quality standards will be met, (4) a reasonable schedule for implementing the necessary pollution controls, (5) a description of, and schedule for, monitoring milestones for tracking and reporting progress to EPA on the implementation of the pollution controls, and (6) a commitment to revise, as necessary, the implementation strategy and corresponding pollution controls if progress towards meeting water quality standards is not being shown.
Rule 4
Category 5R – Alternative Restoration Plan
EPA’s 2016 IR Guidance acknowledges that restoration plans that serve as alternatives to TMDLs may be the best option to reach water quality standards faster. However, when the TMDL alternative lacks enforceable “other pollution control requirements,” the water cannot be assessed as 4B, and must remain in category 5. In EPA’s 2016 IR Guidance the national subcategory of 5-alternative is discussed and introduced. In Virginia this is the state subcategory 5R (detailed description in Appendix D-2). When DEQ develops an alternative restoration plan to a TMDL, DEQ requests EPA to review the plan. While EPA cannot approve the plan, they can review it and accept it as a 5R alternative restoration plan. The six main elements of an acceptable 5R alternative restoration plan are outlined in Appendix D-2. Once EPA has accepted a 5R alternative restoration plan, the impaired waters that are addressed by this plan are to be assessed as state subcategory 5R.
Delisting Rules
Final Guidance for 2018 IR 303(d) Listing/Delisting and TMDL Priority Ranking
59
Rule 1
Waters listed as impaired and needing a TMDL in the Integrated Report will remain on the list and tracked in subsequent Integrated Reports until:
An EPA approved TMDL is developed for all pollutants causing impairment
OR
A subsequent assessment of new monitoring data (or in special cases, modeling data) results show that the water is no longer impaired and EPA approves the delisting of the water.
Rule 2
Documentation required by EPA for delisting previously listed impaired waters that are now restored:
Scenario # 1: when new data demonstrates a previously impaired waterbody is currently attaining WQS, DEQ should submit the following documents to justify the delisting of this segment from the 303(d) list.
Hydrologic Unit Code (HUC), Federal TMDL ID (if available), Cause Group Code, Watershed Identity Number, Stream Name and Listed Parameter
Rationale for the decision to remove the previously impaired segment from the 303(d) list Copies of the data that are being used to justify the removal of the segment Copies of the previous data which were used to list the segment Any differences between the sampling techniques should be documented and submitted A description of the water including but not limited to: stream name, impaired miles (acres or sq. mi.),
beginning and ending river miles, impairment, watershed identification code and HUC
Scenario # 2: when new water quality modeling determines the stream is now attaining WQS, DEQ should submit the following documents to justify the removal of this segment from the 303(d) list.
Hydrologic Unit Code (HUC), Federal TMDL ID (if available), Cause Group Code, Watershed Identity Number, Stream Name and Listed Parameter.
Rationale for the decision to remove the previously impaired segment from the 303(d) list Submission of any new data that were used in the modeling A copy of the EPA approved model that was used. A summary of the differences between the new and the
old models. The reasons why the stream attains WQS under the new model opposed to the former model (data, modeling assumptions, modeling applications, etc.)
A description of the water including but not limited to: stream name, impaired miles (acres or sq. mi.), beginning and ending river miles, impairment, watershed identification code and HUC
Scenario # 3: when new management practices from point and/or nonpoint sources lead to the attainment of WQS, DEQ should submit the following documents to justify the removal of this segment from the 303(d) list.
Hydrologic Unit Code (HUC), Federal TMDL ID (if available), Cause Group Code, Watershed Identity Number, Stream Name and Listed Parameter.
Final Guidance for 2018 IR 303(d) Listing/Delisting and TMDL Priority Ranking
60
Rationale for the decision to remove the previously impaired segment from the 303(d) list. Submission of the most recent 2 years of water quality data that indicate the water is a candidate for
delisting and A description of the new management practices and other changes that have occurred in the watershed to
explain the change in water quality. A description of the water including but not limited to: stream name, impaired miles (acres or sq. mi.),
beginning and ending river miles, impairment, watershed identification code and HUC.
The TMDL staff should apply the Proactive Approach, as appropriate, any time a TMDL is scheduled for development. Appendix D contains additional procedural information on this approach.
Scenario # 4: when errors are detected in the rationale for the initial listing of the segment or WQ Standards have been modified and the segment is attaining WQ Standards, DEQ should submit the following documents to justify the removal of this segment from the 303(d) list.
Hydrologic Unit Code (HUC), Federal TMDL ID (if available), Cause Group Code, Watershed Identity Number, Stream Name and Listed Parameter.
Rationale for the decision to remove the previously impaired segment from the 303(d) list Documentation of the errors in the initial listing A copy of the data and/or modeling that demonstrates the segment attains WQS at least 90% of the time A description of the water including but not limited to, stream name, impaired miles (acres or sq. mi.),
beginning and ending river miles, impairment, watershed identification code and HUC
In certain cases EPA may request additional documentation to justify the removal of the segment from the 303(d) list.
Rule 3
A new impairment is “nested” when it is determined that the impairment has the same source/cause as a previously listed impairment within an existing TMDL. In such a case, it is assumed the new impairment is adequately addressed by the pre-existing TMDL and should thus be classified as Category 4A. Assessors should coordinate with TMDL staff to review nesting guidance for specific qualifications for nesting, procedural requirements, and appropriate documentation.
Bacteria impairments within the existing TMDL watershed or within the “tidal range” of the existing TMDL boundary can be immediately nested when land uses in the existing TMDL and newly impaired segment are comparable and all existing sources are accounted for in the TMDL. A narrative nesting memo is not necessary for these impairments. To show the nested impairments spatially within the existing TMDL watershed, a GIS-based analysis and supporting spreadsheet identifying the waterbody, TMDL name and ID, EPA approval date should be submitted to EPA as delisting materials.”
Nesting non-bacterial impairments may be appropriate if the existing TMDL(s) addresses all appropriate stressor(s) for benthic impairments or all source(s) for other non-bacterial impairments. It is not appropriate if new applicable stressor(s) or source(s) exist.
A rationale memo, coordinated and developed by regional TMDL staff, describing the TMDL, the watershed, and the relevant assessments unit(s) as well as justification for the nesting should be submitted to EPA before nesting
Final Guidance for 2018 IR 303(d) Listing/Delisting and TMDL Priority Ranking
61
impairment(s) under the following conditions: Non-bacteria impairment (e.g., nesting a pH impairment under a TMDL originally addressing DO and
nutrients) Bacteria impairment outside the boundary of a TMDL watershed or not within the “tidal range” of the
existing TMDL boundary.
For newly nested segments, the following should be entered in the Assessment Database: Change Impaired Category code to 4A Enter Nested Year: Federal TMDL ID, EPA approval date In Cause Comment field enter “Proposed nested because addressed by [name of TMDL]”. E.g.
“Proposed nested because addressed by Rivanna River Sediment TMDL.”
Rule 4
Section 303(d) requires States to “establish a priority ranking” for the waters it identifies on the impaired waters list, taking into account the severity of the pollution and the uses to be made of such waters, and to establish TMDLs “in accordance with the priority ranking.” Federal regulations provide that “schedules for submissions of TMDLs shall be determined by the Regional Administrator and the State” (40 CFR 130.7(d)(1)). Other reasonable factors such as the State’s use of a rotating basin approach or commitments specified in court orders or consent decrees may also be considered when States develop priorities and schedules.
In scheduling TMDLs for development, every effort should be made to address all related impairments in a watershed at the same time. If endangered species are affected by an impairment listing, TMDL development should be scheduled as expeditiously as possible. If a public water supply is affected by an impairment listing, TMDL development should be scheduled as expeditiously as possible. In the absence of impacts to public water supplies or endangered species, a watershed approach should be used for TMDL development scheduling. Other factors that may impact TMDL scheduling include public interest and support, locally available funding to implement controls, or coordinating TMDL development efforts with an adjoining state.
Starting in December 2013 as part of EPA’s 303(d) Program Vision, EPA tasked states with prioritizing impaired waters for TMDL or TMDL alternative development over the approaching six year window (2016-2022). Impairments were prioritized using a statewide strategy that started with a geospatial prioritization. This was accomplished by prioritizing impairments based on spatial criteria. All impaired waters that intersect a public water supply intake were prioritized through this spatial process. Recreational and shellfishing use impairments were prioritized by criteria such as boat landings and paddling trails since recreational activities were expected to be concentrated there. Aquatic life use impairments were prioritized by 12 digit hydrologic units. Whenever a 12 digit hydrologic unit contained an aquatic life use impairment in addition to the presence of an aquatic community of high integrity or the presence of rare, threatened, or endangered species, the impairment was prioritized. Fish consumption use impairments were prioritized by the severity of the impairment and the availability of monitoring data. All of the impaired waters prioritized by these methods were packaged into datasets for final prioritization. This final set of priorities was determined both by the number of the aforementioned criteria an individual impaired water meets, and by practical considerations such as the severity of the impairment, the length of time a water has been listed as impaired, existing monitoring plans, watershed characteristics, and anticipated stakeholder participation. This list of priority impairments was public noticed for public comment from July 27 – August 26, 2015, and then again for revisions to the priority list from April 4 – May 4, 2016. Most recently, the minor adjustments were made to the priorities and these were public noticed for public comment from April 2, 2018 to May 2, 2018.
Final Guidance for 2018 IR 303(d) Listing/Delisting and TMDL Priority Ranking
62
The priorities list is broken down into two main categories. The first category is the EPA formal priorities that are submitted to EPA as part of the 303(d) Program Vision. These formal priorities are impaired waters that are prioritized with a high level of confidence that resources (e.g., time, funding, data, etc.) allow for completion of TMDL, TMDL alternative, or TMDL revision reports during the 2016-2022 time period. The second category of priorities are DEQ internal priorities. Because natural conditions reports and stressor analyses could not be prioritized formally with EPA, and because DEQ intends to address impaired waters that may require more time than is allowed during the 2016-2022 priority window, there is the additional set of priorities classified as DEQ internal priorities. In the 303(d) list the priority waters formally submitted to EPA are the waters that have an “H” under the “TMDL Development Priority” column. The DEQ internal priorities, with the exception of those prioritized for natural conditions reports, are the waters that have an “M” under the “TMDL Development Priority” column. Waters prioritized for Natural Conditions Reports receive a TMDL priority ranking of “L” for low since no TMDL or TMDL-alternative will be developed. While TMDL-alternatives may be pursued for any priority water, the decision between TMDL and TMDL-alternative development will be made at the onset of the study.
After the TMDL schedule has been developed, the order in which TMDLs are established might be subject to some modifications to accommodate logistical efficiencies or data availability. The process is a dynamic process and any priority ranking may be changed if substantial factors change or become apparent during the scheduling process.
Final Guidance for 2018 IR 303(d) Listing/Delisting and TMDL Priority Ranking
63
APPENDIX A
Clean Water Act Sections
SEC. 305. WATER QUALITY INVENTORY
(b) (1) Each State shall prepare and submit to the Administrator by April 1, 1975, and shall bring up to date by April 1, 1976, and biennially thereafter, a report that shall include—
(A) a description of the water quality of all navigable waters in such State during the preceding year, with appropriate supplemental descriptions as shall be required to take into account seasonal, tidal, and other variations, correlated with the quality of water required by the objective of this Act (as identified by the Administrator pursuant to criteria published under section 304(a) of this Act) and the water quality described in subparagraph (B) of this paragraph;
(B) an analysis of the extent to which all navigable waters of such State provide for the protection and propagation of a balanced population of shellfish, fish, and wildlife, and allow recreational activities in and on the water;
(C) an analysis of the extent to which the elimination of the discharge of pollutants and a level of water quality which provides for the protection and propagation of a balanced population of shellfish, fish, and wildlife and allows recreational activities in and on the water, have been or will be achieved by the requirements of this Act, together with recommendations as to additional action necessary to achieve such objectives and for what water such additional action is necessary;
(D) an estimate of (1) the environmental impact, (ii) the economic and social costs necessary to achieve the objective of this Act in such State, (iii) the economic and social benefits of such achievement, and (iv) an estimate of the date of such achievement; and
(E) a description of the nature and extent of nonpoint sources of pollutants, and recommendations as to the programs which must be undertaken to control each category of such sources, including an estimate of the costs of implementing such programs. (2) The Administrator shall transmit such State reports, together with an analysis thereof, to Congress on or before October 1, 1975, and October 1, 1976, and biennially thereafter.
GRANTS FOR SEC. 106. POLLUTION CONTROL PROGRAM
(e) Beginning in fiscal year 1974 the Administrator shall not make any grant under this section to any State which has not provided or is not carrying out as a part of its program—
(1) the establishment and operation of appropriate devices, methods, systems, and procedures necessary to monitor, and to compile and analyze data on (including classification according to eutrophic condition), the quality of navigable waters and to the extent practicable, ground waters including biological monitoring; and provision for annually updating such data and including it in the report required under section 305 of this Act;
Final Guidance for 2018 IR Appendix A
64
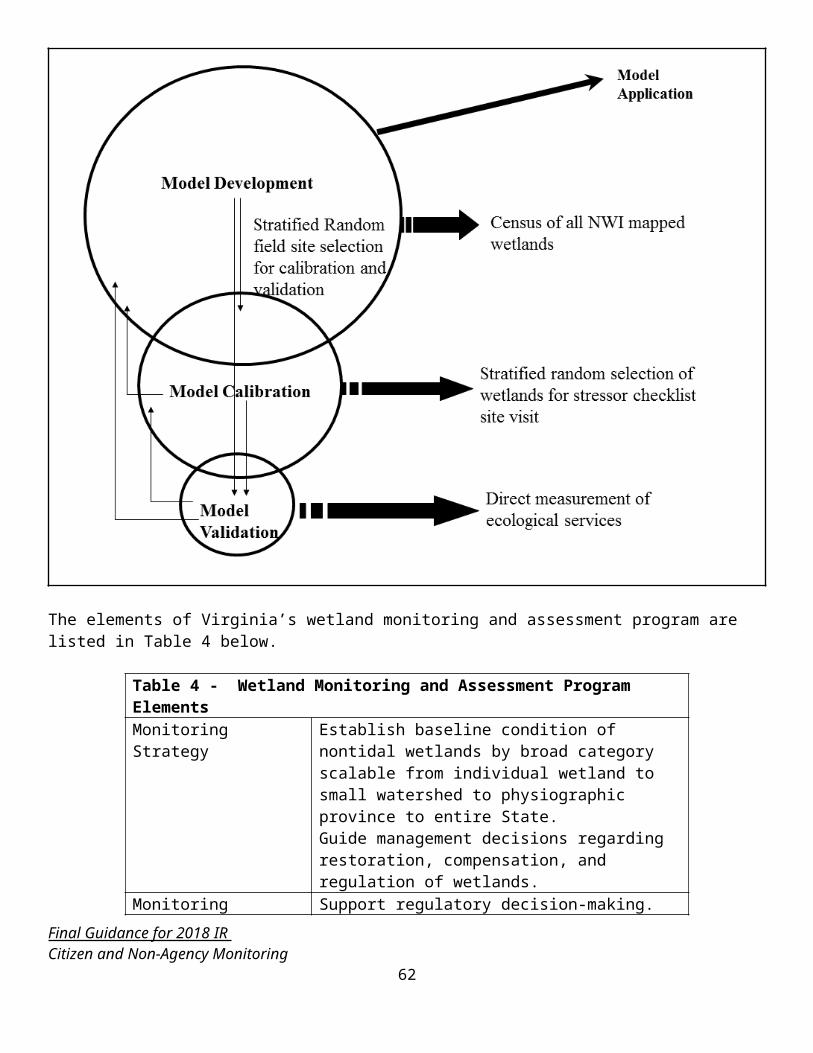
SEC. 204 LIMITATION AND CONDITIONS
(a) Before approving grants for any projection for any treatment works under section 201(g)(1) the Administrator shall determine—
“that (A) the State in which the project is to be located (1) is implementing any required plan under section 303(e) of this Act and the proposed treatment works are in conformity with such plan, or (ii) is developing such a plan and the proposed treatment works will be in conformity with such plan, and (b) such State is in compliance with section 305(b) of this Act;”
SEC. 314. CLEAN LAKES
(a) Each State shall prepare or establish, and submit to the Administrator for his approval—
“(A) an identification and classification according to eutrophic condition of all publicly owned lakes in such State; “(B) a description of procedures, processes, and methods (including land use requirements), to control sources of pollution of such lakes;“(C) a description of methods and procedures, in conjunction with appropriate Federal agencies, to restore the quality of such lakes;“(D) methods and procedures to mitigate the harmful effects of high acidity, including innovative methods of neutralizing and restoring buffering capacity of lakes and methods of removing from lakes toxic metals and other toxic substances mobilized by high acidity;“(E) a list and description of those publicly owned lakes in such State for which uses are known to be impaired, including those lakes which are known not to meet applicable WQ Standards or which require implementation of control programs to maintain compliance with applicable standards and those lakes in which water quality has deteriorated as a result of high acidity that may reasonably be due to acid deposition; and“(F) an assessment of the status and trends of water quality in lakes in such State, including but not limited to, the nature and extent of pollution loading from point and nonpoint sources and the extent to which the uses of lakes is impaired as a result of such pollution, particularly with respect to toxic pollution.
“(2) SUBMISSION AS PART OF 305(b) (1) REPORT. – The information required under paragraph (1) shall be included in the report required under section 305(b) (1) of this Act, beginning with the report required under such section by April 1, 1988”.
Final Guidance for 2018 IR Appendix A
65
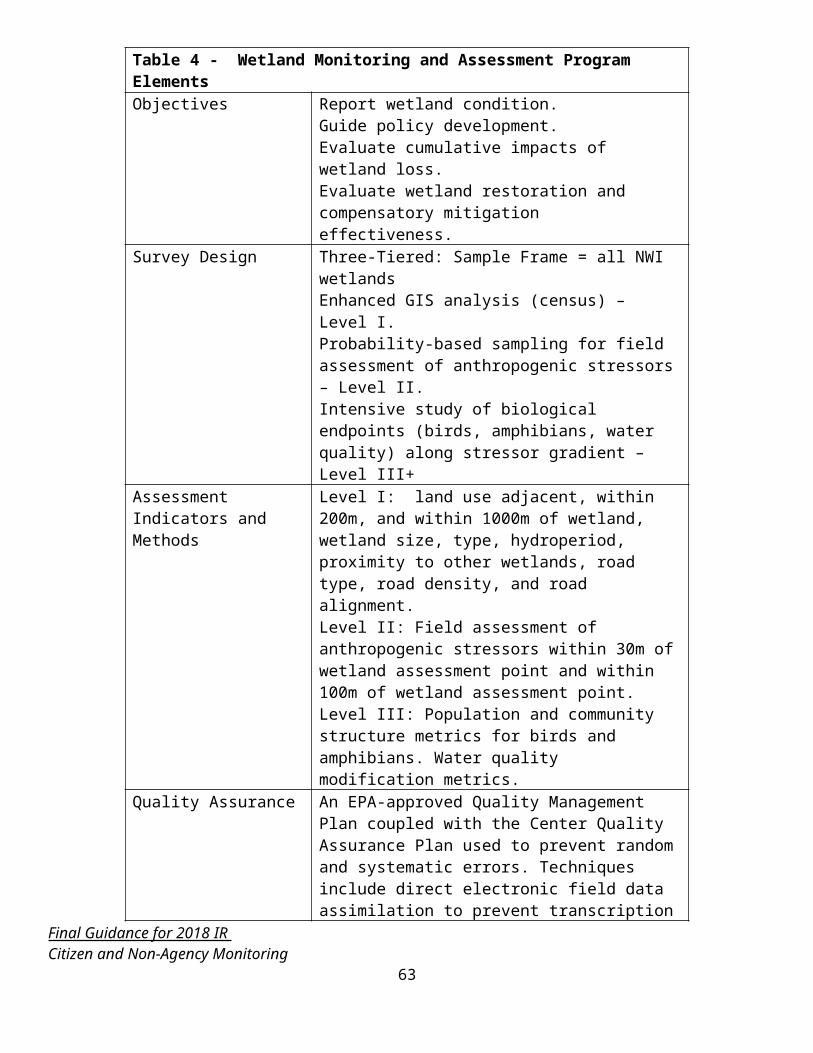
APPENDIX B
Virginia Department of Environmental QualityBiological Monitoring Program305(b) Assessment Fact Sheet
Regional Office: Regional Biologist's Signature: Review Date:River Basin:Stream Name and Site Location:Station ID #:Reference Station ID #:Assessment Method:
VSCICoastal Plain (MACS)
Biological Assessments for the Last Six YearsYear Spring score Spring
assessmentFall score Fall
assessment201120122013201420152016 0.0 0.0
Seasonal avg 6-yrs ** Expression isfaulty **
** Expression is faulty **
Seasonal avg last 2-yrs ** Expression isfaulty **
** Expression is faulty **
Final 6-yr average 0 ** Expression is faulty **
Final 2-yr average ** Expression isfaulty **
0.0
Note, because of the long, six-year time frame covered by this review and for a variety of reasons, some sites may not have been sampled during every year or season and/or an assessment ranking or score may not be available for every "cell" in the above table. The above table is intended to be a convenient method to summarize and review all the data available for the reporting period. The final assessment ranking for each site should be based on a review of all the available rankings shown in the above table and any pertinent supplemental data described below. For the purpose of Integrated Report preparation, if more recent bioassessment rankings differ significantly from earlier rankings, primary consideration should be given to the
Final Guidance for 2018 IR Appendix B
66
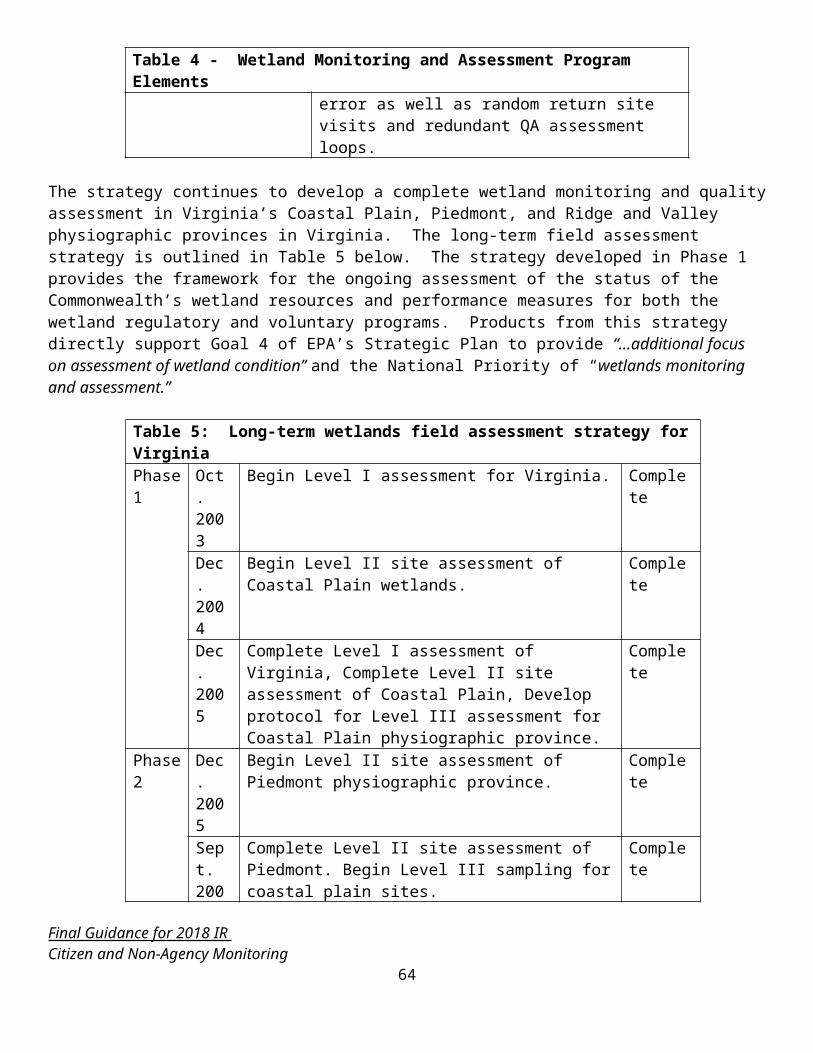
more recent assessed data. This is described in more detail of Section 5.4 of the Integrated Report Guidance Manual.
Supplemental Information (if applicable):
Are any seasonal differences noted?
Summary of any comments associated with assessments.
Have any factors been observed in watershed that may be affecting the benthic community? Have there been any recent changes in activity in the watershed that may have affected the more recent bioassessments. Are these changes likely to affect the benthic community for a short or long term basis?
Final Assessment Rating:
Final Guidance for 2018 IR Appendix B
67
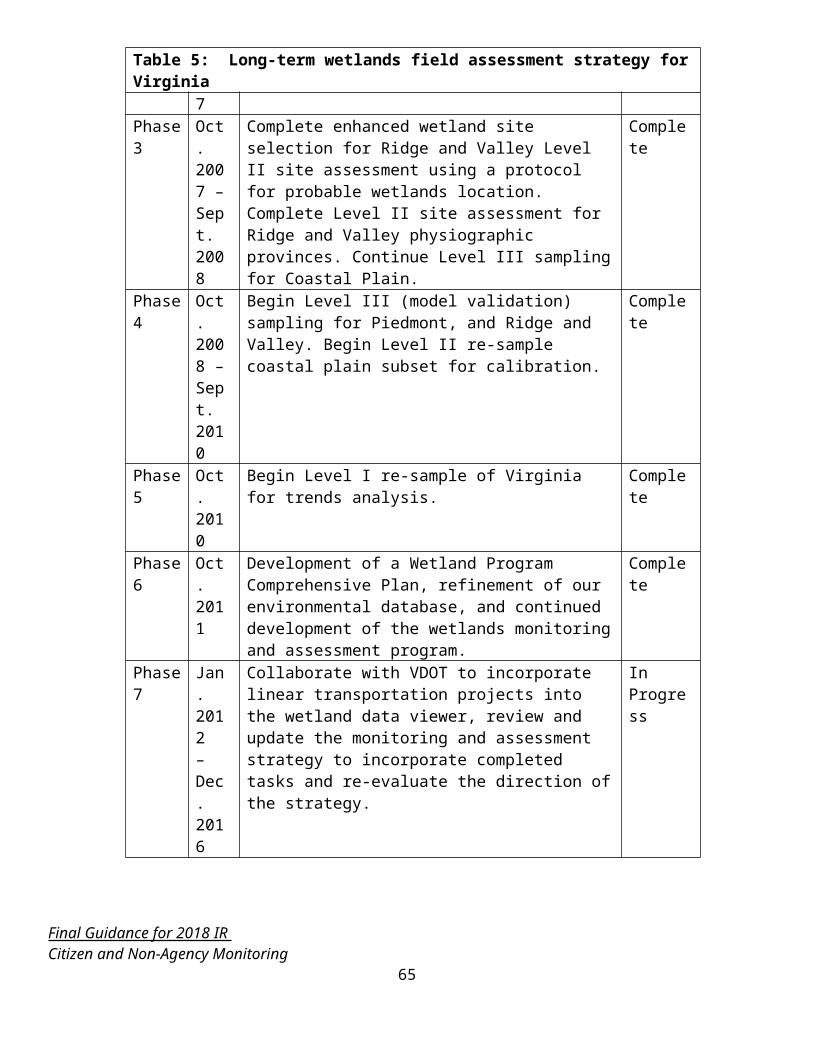
APPENDIX C
Classification of Virginia’s Shellfish Growing Area s Robert E. Croonenberghs, PhD
The Division of Shellfish Sanitation (DSS) follows the requirements of the National Shellfish Sanitation Program (NSSP), which is regulated by the U.S. Food and Drug Administration. The NSSP classification uses the shoreline survey as its primary tool for classifying shellfish growing waters. Fecal coliform concentrations in seawater samples collected in the immediate vicinity of the shellfish beds function to verify the findings of the shoreline surveys, and to define the border between approved and condemned (unapproved) waters.
DSS uses the shoreline survey to locate as many sources of pollution as possible on the watersheds of shellfish growing areas. DSS conducts a property-by-property inspection of the onsite sanitary waste disposal facilities of many properties on un-sewered sections of watersheds, and investigates other sources of pollution such as wastewater treatment facilities (WWTF), marinas, livestock operations, landfills, etc. The information is compiled into a written report with a map showing the location of the sources of real or potential pollution found, and sends it to the various state agencies that are responsible for regulating these concerns and the city or county. The local health departments (LHDs) of the Virginia Department of Health (VDH) play a major role in the process by obtaining correction of the onsite sanitary waste disposal problems. Most of the Division’s shoreline survey effort is focused on locating potential fecal contamination, and in this manner we prevent significant amounts of human pathogens from getting into shellfish waters. We believe that this is a primary reason why we have not had a confirmed shellfish-borne disease outbreak due to Virginia-grown shellfish since the early 1960’s. VDH is reducing the input of these pathogens to back yards, waterways, unofficial swimming areas and shellfish waters. The shoreline survey work is the foundation of the shellfish growing area classification program.
In addition to the shoreline survey, the NSSP requires that DSS collect seawater samples in the growing areas as part of the classification procedure. States must use the most recent 30 samples, collected randomly with respect to weather (scheduled one month in advance), to classify a station. The two-part standard for fecal coliforms in waters for direct shellfish harvest to market is a geometric mean no greater than 14 MPN fecal coliforms/100 ml and an estimated 90th percentile no greater than 31. Exceeding either number requires closure of that station.
To a lesser degree, the Division collects shellfish samples from sentinel growing areas and has them analyzed for heavy metals and chlorinated hydrocarbons (pesticides and PCBs). Such toxic substances in shellfish are not a public health threat in Virginia’s waters, with the potential exception of the Southern Branch of the Elizabeth River and perhaps Little Creek, both of which are located in the Hampton Roads area.
Thus, classification based on fecal pollution is a multi-layered and multi-step process. Initially one uses the shoreline survey to determine if there are any actual or potential sources of fresh fecal pollution to the growing area. If so, then the area cannot be used for the direct harvest of shellfish for marketing. Hampton Roads is an example. Most of Hampton Roads is permanently closed, due to the tremendous amount of shipping and the concern of contamination from treated sewage outfalls and runoff from the urban watershed. However, microbiological results are generally acceptable.
Another example of actual or potential pollution that requires closure is a discharge, such as from a WWTF or the potential discharge from boats in marinas. DSS uses relatively simple computer models developed by VIMS, which employ fairly sophisticated mathematics, to determine the size of buffer zones around these sources. These models use inputs of fecal coliforms (estimated from sewage treatment facility outfall volumes or factors related to the number and size of boats in marinas), die-off factors, and readily available tidal current and channel configuration information. Buffer zones around marinas are typically only in effect during the warmer boating months (April 1 -
Final Guidance for 2018 IR Appendix C
68
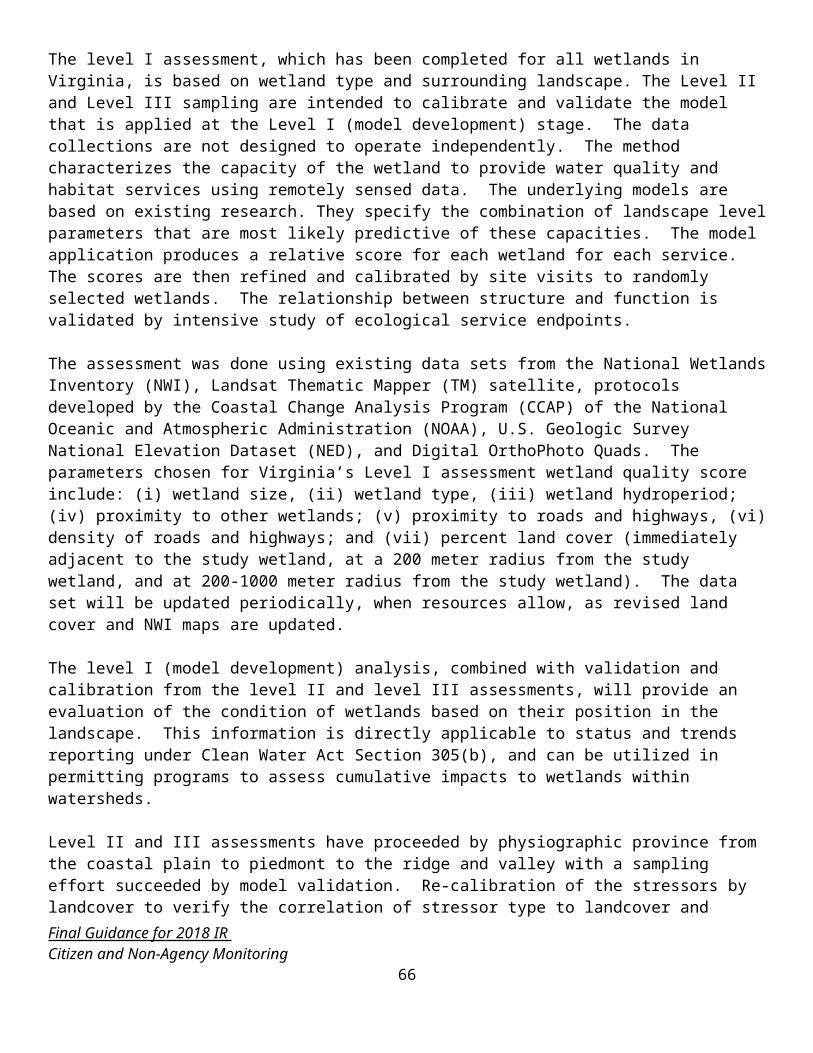
October 31), whereas those around WWTF are in effect all year. Once these buffer zones are determined, they do not change in size unless the capacity of the WWTF or the marina changes.
Our third layer of classification, and our most common in Virginia, consists of evaluating areas that are not affected by urban runoff or significant wastewater discharges. One must evaluate the watershed for the potential impacts of known failing onsite sanitary waste facilities to estimate whether their input could be of such a magnitude as to require closure, even if the water quality data is acceptable. If the impact from these failing systems does not appear to pose an undue threat, then the water quality data can be used to verify whether the waters should be classified as approved or not.
Since DSS collects approximately 9-10 seawater samples annually, this means that our geometric mean typically incorporates data reaching back 2.5 to 3 years. Heavy rainfall or very high tides due to winds or moon phase can wash unusually high concentrations of fecal coliforms into shellfish growing areas that can increase the geometric mean or the 90th percentile beyond the allowed standard. As more data is collected and the unusually high concentrations fall off the trailing end of the data set, the water quality then appears to improve. This is one of the factors that can cause a continual fluctuation in the classification of the water quality at the interface between impacted upstream waters and the relatively unaffected downstream water body.
Since DSS is not a research organization, we cannot do much to determine the cause of water quality deterioration in areas. However, the Division has tried over the years to do so, and we have encouraged the Commonwealth to put resources into determining those causes. The Division has rarely found an association between obviously failing septic systems adjacent to growing areas and deteriorating water quality in large bodies of water. We have seen areas where impacts on fecal coliform concentrations in smaller bodies of water occur due to failing onsite sanitary waste disposal systems, but these seem to be rare. This should not be taken to downplay the concern from such failing onsite sanitary waste disposal systems, since even small inputs of fecal coliforms from these systems are quite likely to contain significant concentrations of human pathogens. Indeed, failing onsite sanitary waste disposal systems are one of the types of pollution sources of greatest concern with regard to the consumption of bivalve molluscan shellfish. Drainfields located in seasonally high water tables may contribute significant numbers of fecal coliforms to impact water quality, and research into this potential source is needed.
Virginia’s urban suburban watersheds like the Lynnhaven River in Virginia Beach are clearly impacted by the flushing action of rapid runoff from storm drains. Other areas are much less predictable. Sometimes heavy rainfalls cause elevated counts in rural areas and sometimes they do not. While the Division used to depend upon rain gauges at airports and other widely scattered locations, it now uses NOAA Doppler predicted rainfall, which provides much improved data during spotty summertime thunderstorms. We may find that with this new data, that some areas respond more predictably to rainfall events than was apparent in the past.
In more rural areas the wildlife component of fecal coliform inputs is significant, as can be the human input. Wildlife, such as raccoons, muskrats and deer, living near the intertidal zone, can have dramatic local impacts on fecal coliform concentrations in the adjacent shellfish waters, with the attendant possibility of introducing human pathogens. New data indicates that wildfowl can have significant impacts on water quality too. Wildlife inputs of fecal material are basically accounted for by the seawater sampling data.
The Division is not seeing a steady increase in the number of acres of condemned waters in the state. Instead, what we see are fluctuations in the location of the border between acceptable and unacceptable water quality measurements moving up and down tributaries over time. Again, these fluctuations seem to be due largely to changing factors on the watershed, chance weather events (rain, high tides), changes in wildlife populations near shore or unknown factors (perhaps movement of livestock from one field to another, migratory bird flocks, or runoff from recently plowed fields that later contribute little when crops stabilize the soil).
Final Guidance for 2018 IR Appendix C
69
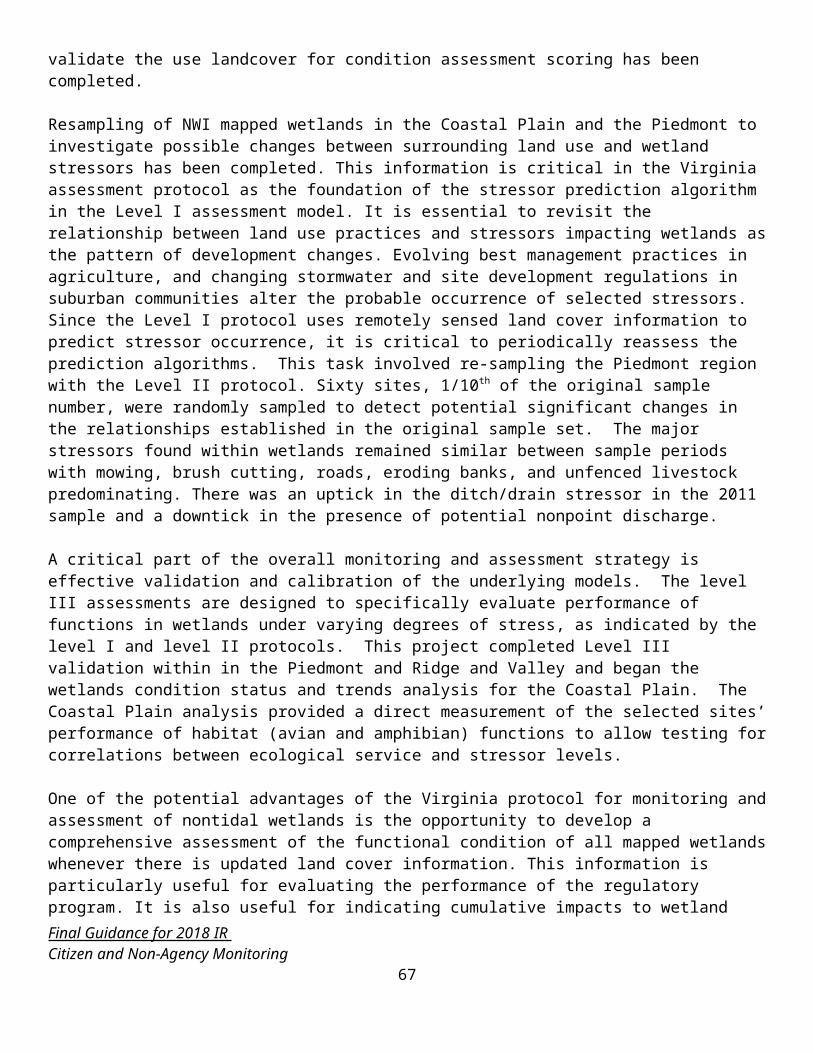
Man does directly impact the fecal coliform counts in the waters. The headwaters of smaller streams are impacted by development due to the loss of the filtering and detention of runoff waters through upland swamps and other slow moving water areas. These natural detention areas provide the extended time element so that predators (e.g., rotifers and ciliates) and sunlight can reduce the numbers of fecal coliforms and pathogenic human bacteria and viruses. When these are replaced with drainage systems the fecal coliforms and potentially present human pathogens are directly discharged into the shellfish waters.
Final Guidance for 2018 IR Appendix C
70
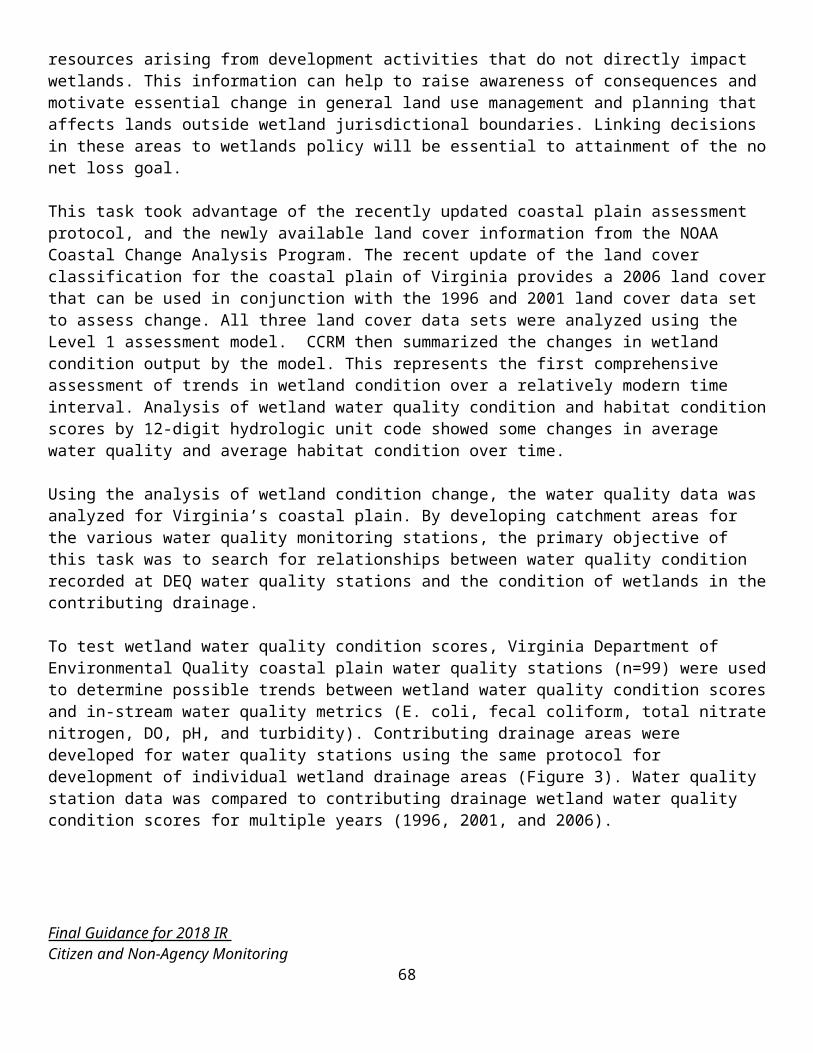
EPA Shellfish Listing /Delisting ChartMaking §303(d) & §305(b) CWA Listing Decisions Based on National Shellfish Sanitation Program (NSSP) Growing Area Classifications* 2007 NSSP Model Ordinance Subsection IV.@03: Growing Area Classification
Final Guidance for 2018 IR Appendix C
71
YES
NO
Classification reflect
attainment of WQS?
Not necessary to list under §303(d) or
§305(b)
START HERE
Follow Fish/Shellfish
Advisory Chart
YES
NO
List as impaired under
303(d) & 305(b)
List as fully supporting
with observed effects
Are risk assessment parameters < WQS?
NO
YES
Is the Classification based on FDA action levels?
YES
NO
YES
AdvisoryNSSP
NO
YES
NO
Is waterbody specific data available?
Precautionary Classification* “Prohibited”?
Classification otherwise lower
than “Approved”?
Advisory or Classification
underNSSP?
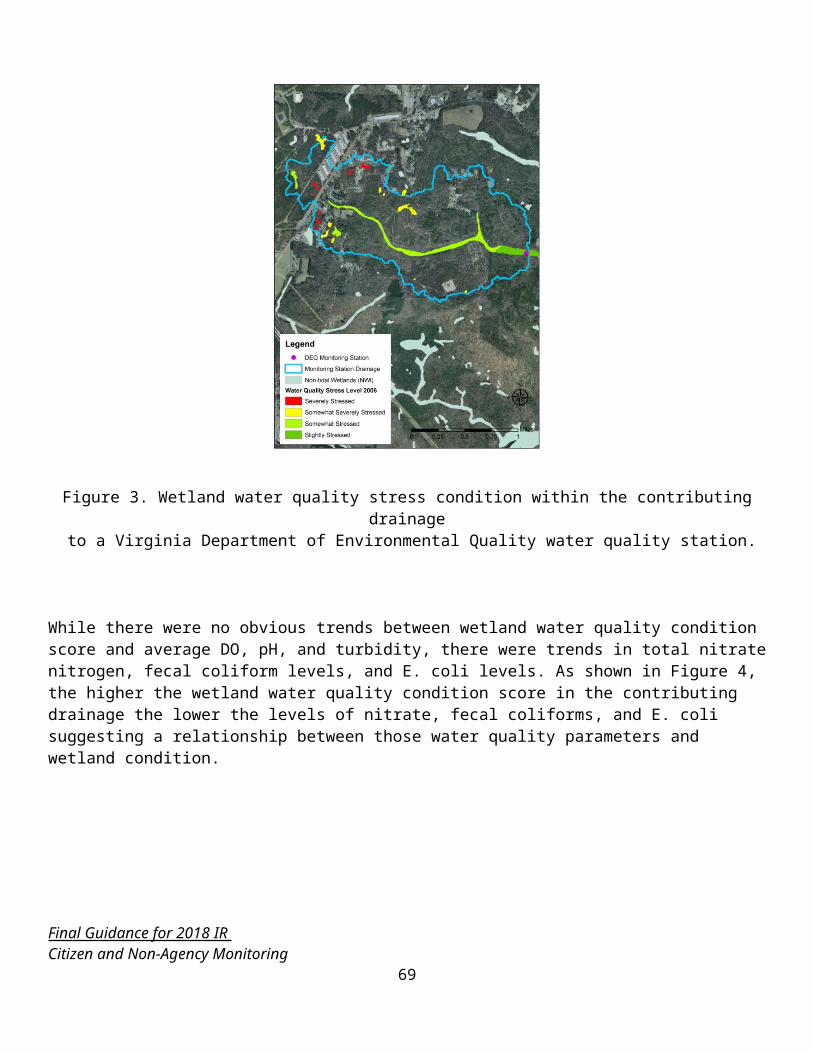
APPENDIX D-1
Incorporating the Proactive Approach to delisting 303(d) listed segments into the 2018 Water Quality Assessment
For the 1998 assessment cycle, EPA changed the data analysis period for the 305(b) assessment from two to five years. Virginia’s water quality assessments and the subsequent 303(d) list have since been based on a 5-year data window. In 2008 the assessment data window was expanded to six years to coincide with the two-year ambient watershed rotation monitoring schedule. The data window for 2018 is January 1, 2011 through December 31, 2016.
In August 2001, the Office of Water Quality Programs negotiated with EPA an approach, termed the Proactive Approach, which results in the proposed delisting of waters on the Section 303(d) list through assessment of less than six years of data. Correspondence and information related to the issue is attached to this memorandum. In short, EPA Region III has consented that Virginia can delist a segment on the 303(d) list if the following requirements are met:
1) For conventional parameters, no more than one of twelve samples taken over a two-year period exceeds the water quality criteria (> 10.5 percent exceedence for larger data sets).
2) For biological impairment, a minimum of 2 consecutive samples, taken over a one to two year period, show attainment of the applicable standard.
3) The samples are taken at the same location (monitoring station) which demonstrated the impairment.4) A rationale document is submitted to EPA justifying why the State believes the waters are achieving
WQ Standards. This rationale document can consist of a description of measures taken in the watershed which are considered to be responsible for improvement of the water quality.
Eligibility and Water Quality Assessment
The following procedure is to be used to consider the eligibility of, and to subsequently assess, any particular waterbody segment submitted for consideration for delisting under the Proactive Approach.
Locations where proactive measures are being taken to improve water quality through the TMDL or Water Quality Management Plan program such that the Proactive Approach is eligible for consideration are to be provided by the DEQ TMDL program. Assessment staff can recommend segments for consideration, but only those locations provided by the DEQ TMDL program as candidates for the Proactive Approach are to be considered for assessment under the Proactive Approach. Notification must be made in writing through memorandum to the affected regional assessment manager, copied to the DEQ 305(b) coordinator, and must include the required documentation supporting consideration of the Proactive Approach. At a minimum, this is to include documentation of those implementation measures considered to be responsible for improvement in water quality and subsequent achievement of WQ Standards.
Regional assessment staff members are responsible for assessment of water quality in their respective regions and for the defense of their assessments. Therefore, the decision for delisting consideration is to be made by regional assessment staff based on the analysis of the proactive measures being taken, available monitoring data, any ancillary information collected, and their professional knowledge of site specific influences on water quality in the affected segment.
Final Guidance for 2018 IR Appendix D-1
72
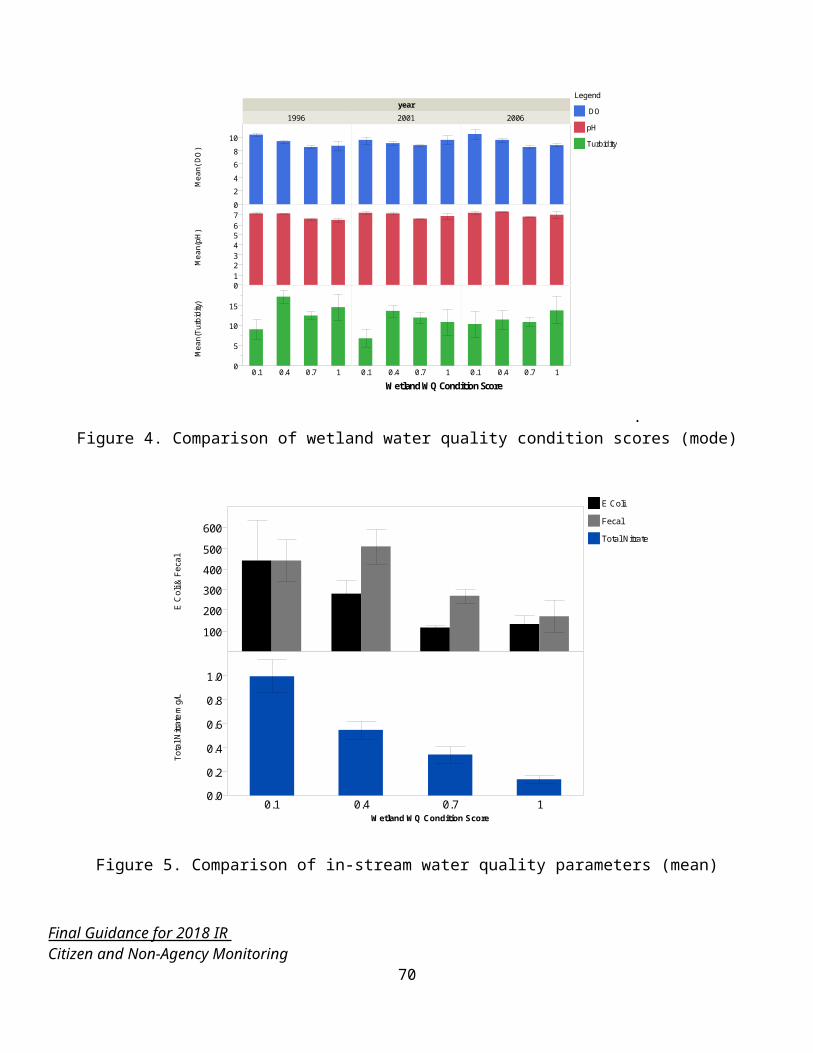
Where there is agreement between TMDL program and assessment staff that it is appropriate to pursue delisting based on implementation of the Proactive Approach, the assessment must be performed based on the requirements outlined in 1, 2 and 3 above. For a scheduled 305(b)/303(d) assessment, only the last two years of the assessment window are to be used for assessment of eligible segments. For delisting assessment at any other time, all years of the assessment window are to be used.
Assessment Documentation and Delisting ProcedureADB Database A segment meeting the above criteria is considered monitored, fully
supporting. The assessment comments section should include the phrase Proactive Approach Assessment. The Proactive Approach data window used must be specifically identified.
Delisting Documentation
Documentation must include the information provided by the TMDL program related to control measures implemented using the Proactive Approach (requirement 4, above), and the results of data analysis related to requirements 1, 2, and 3 above.
EPA Review, Approval and Public Participation
Fulfillment of EPA review and approval requirements, and fulfillment of public participation requirements for removal of waterbody segments (delisting) at EPA required 303(d) list submittal dates, is the responsibility of the Monitoring and Assessments Program. At other times, fulfillment of these requirements in an effort to delist waters not needing TMDLs is the responsibility of the TMDL program. Final documentation for segments delisted by the TMDL program staff must be provided to the regional assessment manager and copied to the DEQ 305(b) coordinator at least five months prior to any EPA required 303(d) list submittal date, if time permits.
Final Guidance for 2018 IR Appendix D-1
73
APPENDIX D-2
Requirements for Category 5R Waters
EPA specifically recommends that the 5R documentation describe the following six minimum elements:
a) The identification of the point and nonpoint sources. For point sources, an analysis should be included to document whether they are causing or contributing to the water quality impairments. If it is determined that the point sources are causing or contributing, then a Water Quality Based Effluent Limitation (WQBEL) or Best Management Practices Approach2 should be developed and implemented through NPDES permits.
b) The point source and nonpoint source water quality restoration activities that are expected to result in water quality improvements and restoration. Where applicable, describe any authorities that may require water quality controls to be implemented (e.g., state or local regulations, permits, contracts and grant/funding agreements).
c) Cost estimates and funding commitments to implement the water quality restoration activities. In order to provide assurance that water quality restoration can occur through the implementation of water quality restoration activities, cost estimates and secured funding sources that will be used to implement these activities should be identified.
d) An anticipated schedule for implementing the water quality restoration activities, including the anticipated completion date and the estimated pollutant load reductions necessary to meet water quality standards. The schedule should outline specific activities and include a timeline of when each phase will be implemented and accomplished. The schedule can be revised and updated at each 303(d) listing cycle.
e) A water quality monitoring component to evaluate and track the effectiveness of the scheduled water quality restoration activities at each 303(d) listing cycle. Baseline water quality conditions should be established in order to accurately measure water quality progress. At each 2-year 303(d) listing cycle, performance measurements, whether environmental, programmatic, or social, should be provided for each implemented water quality restoration activity to measure progress. It is understood that each water restoration activity may not result in improved water quality; however the combined restoration activities should result in improved water quality at each 303(d) listing cycle.
f) An anticipated date for achieving water quality standards. Projects are expected to follow adaptive management allowing critical milestones to be adjusted as project plans and goals may change as implementation occurs. Once water quality standards have been met, the State may determine that the waterbody is appropriate to be included in category 1 or 2. If the project does not meet water quality standards by the estimated completion date, sufficient trends toward improved water quality must be shown in order to continue in the 5R program and an updated implementation schedule including revised critical milestones should be submitted to EPA. The project will continue to be reviewed every 2-year 303(d) listing cycle until water quality standards are met.
2 EPA currently recommends point sources be addressed with WQBEL, but DEQ intends to explore how BMPs can also be effectively employed. Final Guidance for 2018 IR Appendix D-2
74
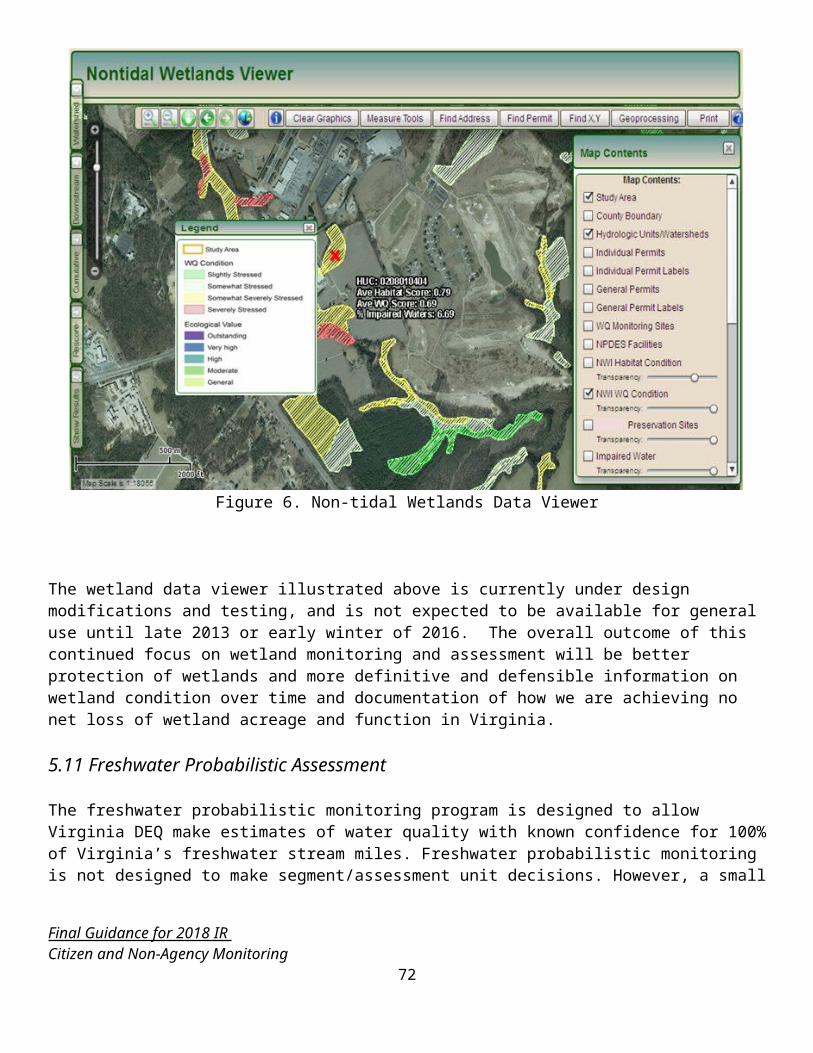
APPENDIX E-1
FISH TISSUE VALUES (TV)* NON CARCINOGEN
CARCINOGEN
CRITERION BASED TISSUE VALUE (TV)
CRITERION BASED TISSUE VALUE (TV)
COMPOUND CAS # PPB (wet–weight) PPB (wet-weight)Acenaphthene 83-32-9 240,000.00Acrolein 107-02-8 2,000.00Acrylonitrile 107-13-1 74Aldrin 309-00-2 2.40Anthracene 120-12-7 12,000,000Antimony 7440-36-0 1,600Benzene 71-43-2 2,700Benzidine 92-87-5 0.17Benzo(a)anthracene 56-55-3 5.50Benzo(b)fluoranthene 205-99-2 5.50Benzo(k)fluoranthene 207-08-9 5.50Benzo(a)pyrene 50-32-8 5.50Bis2-chloroethyl ether 111-44-4 36Bis2- chloroisoproply ether 108-60-1 160,000Bis2- ethylhexyl Phthalate 117-81-7 2,900Bromoform 75-25-2 5,100Butyl benzyl phthalate 85-68-7 800,000Carbon tetrachloride 56-23-5 310Total Chlordane 57-74-9 110Chlorobenzene 108-90-7 16,000Chlorodibromomethane 124-48-1 4802-Chloronaphthalene 91-58-7 320,000Chloroform 67-66-3 40,0002-Chlorophenol 95-57-8 20,000Chrysene 218-01-9 5.50Cyanide 57-12-5 80,000DDD 72-54-8 170DDE 72-55-9 120Total DDT 50-29-3 120Dibenz(a,h)anthracene 53-70-3 5.501,2-Dichlorobenzene 95-50-1 72,0001,3-Dichlorobenzene 541-73-1 54,0001,4-Dichlorobenzene 106-46-7 11,0003,3-Dichlorobenzidine 91-94-1 89Dichlorobromomethane 75-27-4 6501,2-Dichloroethane 107-06-2 4401,1-Dichloroethylene 75-35-4 40,0001,2-Trans-dichloroethylene 156-60-5 16,0002,4-Dichlorophenol 120-83-2 12,0001,2-Dichloropropane 78-87-5 600
Final Guidance for 2018 IR Appendix E-1
75
FISH TISSUE VALUES (TV)* NON CARCINOGEN
CARCINOGEN
CRITERION BASED TISSUE VALUE (TV)
CRITERION BASED TISSUE VALUE (TV)
COMPOUND CAS # PPB (wet–weight) PPB (wet-weight)1,3-Dichloropropene 542-75-6 400Dieldrin 60-57-1 2.50Diethyl phthalate 84-66-2 3,200,0002,4-Dimethylphenol 105-67-9 80,000Dimethyl Phyhlate 131-11-3 40,000,000Di-n-butyl phthalate 84-74-2 400,0002,4-Dinitrophenol 51-28-5 8,0002-Methyl-4,6-dinitrophenol 534-52-1 1,6002,4-Dinitrotoluene 121-14-2 130Dioxin 1746-01-6 0.000261,2-Diphenylhydrazine 122-66-7 50Endosulfan (I and II) 115-29-7 24,000Endosulfan sulphate 1031-79-8 24,000Endrin 72-20-8 240Endrin aldehyde 7421-93-4 1,200Ethylbenzene 100-41-4 80,000Fluoranthene 206-44-0 160,000Fluorene 86-73-7 160,000Heptachlor 76-44-8 8.90Heptachlor epoxide 1024-57-3 4.40Hexachlorobenzene 118-74-1 25Hexachlorobutadiene 87-68-3 510Hexachlorocyclohexane (alpha-BHC) 319-84-6 6.30Hexachlorocyclohexane (beta -BHC) 319-85-7 22Hexachlorocyclohexane (gamma-BHC) (lindane)
58-89-9 240
Hexachlorocyclopentadiene 77-47-4 4,800Hexachloroethane 67-72-1 2,900Indeno(1,2,3-cd)pyrene 193-39-5 5.5Isophrone 78-59-1 42,000Mercury (Methyl) ** 22967-92-
6300
Methyl Bromide 74-83-9 5,600Methylene Chloride 75-09-2 5,300Nickel 744-00-2 220,000Nitrobenzine 98-95-3 2,000N-nitrosodimethylamine 62-75-9 0.78N-nitrosodiphenylamine 86-30-6 8,200N-nitrosodi-n-propylamine 621-64-7 5.70PCB Total/congeners 1336-36-3 20Pentachlorophenol 87-86-5 330Phenol 108-95-2 1,200,000Pyrene 129-00-0 120,000
Final Guidance for 2018 IR Appendix E-1
76
FISH TISSUE VALUES (TV)* NON CARCINOGEN
CARCINOGEN
CRITERION BASED TISSUE VALUE (TV)
CRITERION BASED TISSUE VALUE (TV)
COMPOUND CAS # PPB (wet–weight) PPB (wet-weight)Selenium 7782-49-2 20,0001,1,2,2-Terachloroethane 79-34-5 200Tetracholoethylene 127-18-4 1,000Thalium 7440-28-0 54Toluene 108-88-3 64,000Toxaphene 8001-35-2 361,2,4-Trichlorobenzene 120-82-1 8,0001,1,2-Trichloroethane 79-00-5 700Trichloroethylene 79-01-6 3,2002,4,6-Trichlorophenol 88-06-2 3,600Vinyl Chloride 75-01-4 29Zinc 7440-66-6 1,200,000
*These fish tissue values have been calculated based on the Water Quality Standards that are associated with the latest Triennial Review criteria proposals as adopted by the State Water Control Board in October 2008.**The fish tissue criterion for methylmercury applies to fish species commonly eaten in the local waterbody and applies to most fish species in the DEQ database except bowfin or longnose gar because fish consumption surveys show that these species are rarely consumed in Virginia. Total mercury concentrations in fish tissue are assumed to equal methylmercury concentrations.
Final Guidance for 2018 IR Appendix E-1
77
APPENDIX E-2 RISK-BASED TISSUE SCREENING VALUE (TSVs) FOR FISH TISSUE UPDATED FROM INTEGRATED RISK INFORMATION SYSTEM (IRIS) FOR GENERAL POPULATION (ADULT)
BODY WEIGHT (KG) 70RISK LEVEL 10-5
CONSUMPTION RATE (KG/DAY) 0.0175 Fish Tissue Screening Values (TSV) NON
CARCINOGENCARCINOGEN
TISSUE SCREENING VALUE (TSV)
TISSUE SCREENING VALUE (TSV)
COMPOUND CAS # PPB (wet-weight) PPB (wet-weight)Arsenic (inorganic) 7440-38-2 270*Barium 7440-39-3 800,000BHC isomers 608-93-1 0Brominated Diphenyl ethers (BDEs)
5000 (VDH)**
Cadmium 7440-43-9 4,000Decabromdiphenyl ether 1163-19-5 28,000Hexabromodiphenyl ether 36483-60-0 800Pentabromodiphenyl ether 32534-81-9 8,000Chromium III 16065-83-1 6,000,000Chromium VI 18540-29-9 12,000Chlorpyrifos 2921-88-2 12,000Diazinon 333-41-5 3600Disulfoton 298-04-4 160Ethion 563-12-2 2,000Kepone 143-50-0 300 (VDH)**Methoxychlor 72-43-5 20,000Mirex 2385-85-5 8,000Oxyfluorfen 42874-03-3 12,000PAHs (sum PEC) *** 15Terbufos 13071-79-9 100Tributyltin 56-35-9 1,200
*The screening value for arsenic applies to inorganic arsenic only. Organic forms of arsenic are not carcinogenic and are relatively nontoxic. There is a general consensus that 85 to 90% of arsenic found in fish tissue is organic arsenic. The screening value of 270 ug/kg total arsenic is based on the estimate that 10% of total arsenic detected in fish tissue is inorganic arsenic.** These values are based on recent changes to the toxicological data used to calculate the screening values, or recent recommendations from U.S. EPA or the Virginia Department of Health. These screening values are not based on the same toxicological data that were used to develop the existing water quality criteria.*** Mixtures of seven polynuclear aromatic hydrocarbons (PAHs) that are classed as probable human carcinogens were assessed based on a screening value concentration of 15 ppb calculated as a sum potency equivalency concentration (PEC) using methods described in EPA's Guidance for Assessing Chemical Contaminant Data for Use in Fish Advisories, Vol. 1, (EPA 823-R-95-007) and Vol. 2 (EPA 823 B-00-008) using the following equation;
PEC = Σ (RPi x Ci )i
where; RPi = relative potency for the ith PAHCi = concentration of the ith PAH in fish tissue)
The relative potency estimates used for these PAHs were:Benzo(a)pyrene 1.0Benzo(a)anthracene 0.145Benzo(b) fluoranthene 0.167Benzo(k)fluoranthene 0.020Chrysene 0.0044Dibenz(a,h)anthracene 1.11Indeno(1,2,3-cd)pyrene 0.055
Final Guidance for 2018 IR Appendix E-2
78
APPENDIX F
Freshwater Consensus- Based Sediment Screening Values (SVs)
Analyte(Metals)
Consensus PEC (ppm) dry weight
Arsenic 33Cadmium 4.98Chromium 111Copper 149Lead 128Mercury 1.06Nickel 48.6Silver NAZinc 459
Analyte(Organics/Pesticides)
Consensus PEC(ppb) dry weight
Acenaphthene NAAcenaphthylene NAAnthracene 845Benzo-a-pyrene 1,450Benz(a)Anthracene 1,050Chrysene 1,290Dibenz[a,h]Anthracene NAFluoranthene 2230Fluorene 536Methylnaphthalene, 2- NANaphthalene 561Phenanthrene 1,170Pyrene 1,520LMW PAHs NAHMW PAHs NATotal PAHs ** (see footnote) 22,800Chlordane 17.6DDD 28DDE 31.3DDT 62.9DDT, total 572Dieldrin 61.8Total PCBs 676Endrin 207Heptachlor Epoxide 16Lindane 4.99NA = Not Available
Final Guidance for 2018 IR Appendix E-2
79
Estuarine NOAA-based ER-M Sediment Screening Values (SVs)Trace Elements (Metals) ER-M Value ppm (dry weight)
Antimony (Sb) NAArsenic (As) 70
Beryllium NACadmium (Cd) 9.6Chromium (Cr) 370
Copper (Cu) 270Lead (Pb) 218
Manganese (Mn) NAMercury (Hg) 0.71
Nickel (Ni) 51.6Selenium (Se) NA
Silver (Ag) 3.7Thallium NAZinc (Zn) 410
Pesticides and Other Organic Substances –parts per billion dry weightCAS # Substance ER-M Value(dry weight) (ppb)336363 Polychlorinated Biphenyls (PCBs) 180309002 Aldrin NA57749 Chlordane 6
NA total DDT (include metabolites) 46.172548 DDD 2050293 DDT 772559 DDE 2760571 Dieldrin (EPA proposed criteria) 872208 Endrin NA76448 Heptachlor NA
1024573 Heptachlor epoxide NA118741 Hexachlorobenzene NA608731 Hexachlorocyclohexane NA58899 Lindane NA
2385855 Mirex NA108952 Phenol NA117817 Di (2-Ethylhexyl) Phthalate NA84742 N-Butyl Phthalate NA83329 Acenapthene 500 LMW PAH
208968 Acenapthylene 640 LMW PAH120127 Anthracene 1100 LMW PAH50328 Benzo-A-Pyrene 1600 HMW PAH
191242 Benzo [GHI] Perylene NA HMW PAH56553 Benz[A] Anthracene 1600 HMW PAH
218019 Chrysene 2800 HMW PAH53703 Dibenz [A,H] Anthracene 260 HMW PAH
206440 Fluoranthene 5100 HMW PAH86737 Fluorene 540 LMW PAH
193395 Indeno (1,2,3-CD)Pyrene NA HMW PAH91576 Methylnaphthalene, 2 670 LMW PAH91203 Naphthalene 2100 LMW PAH
Final Guidance for 2018 IR Appendix F
80
Pesticides and Other Organic Substances –parts per billion dry weightCAS # Substance ER-M Value(dry weight) (ppb)85018 Phenanthrene 1500 LMW PAH
129000 Pyrene 2600 HMW PAHNA Low Molecular Weight (LMW)PAHs 3160NA High Molecular Weight (HMW) PAHs 600NA Total PAHs **(see footnote) 44,792
*Changes or updates to any of the ER-M or PEC screening values should be updated in the assessment spreadsheet used to calculate the estuarine weight of evidence. **sum of 24 Polyaromatic hydrocarbons used in previous reports, also polynuclear aromatic hydrocarbons (PNAs)
DEQ acknowledges the use of the ER-M or PEC may be limited (for several reasons) in their ability to accurately predict biological effects. Given that DEQ continues to employ the collection of bulk sediment with chemical analysis as a cost-effective way to monitor a great number of sediment sites, these thresholds are an appropriate tool for assessing sediment data relative to its potential harm to aquatic life.
Citation:Freshwater PECs: MacDonald, D.D., C.G. Ingersoll, T.A. Berger. 2000. Development and Evaluation of Consensus-Based Sediment Quality Guidelines for Freshwater Ecosystems. Arch. Environ. Contam. Toxicol. 39:20-31.
Estuarine ER-Ms: Buchanan, M.F. 1999 National Oceanic and Atmospheric Administration Screening Quick Reference Tables, NOAA HAZMAT Report 99-1 Seattle, WA, Hazardous Materials Response and Assessment Division, 12 pages.
Final Guidance for 2018 IR Appendix F
81
APPENDIX G
Weight-of-Evidence (WOE) Aquatic Life Use Assessment in Estuarine Waters
The “Weight-of-Evidence” (WOE) approach that DEQ currently uses for its general evaluation and assessment of the designated Aquatic Life Use (ALU) for estuarine benthic communities has evolved from a previously more limited application of the “Sediment Quality Triad” concept (SQT – Figure 1). The SQT concept was originally conceived and applied for the evaluation of the presence and effects of toxic contaminants in marine sediments (Long and Chapman, 1985). It was further applied by Chapman et al. (1986, 1987), and has continued to be one of the preferred approaches for the evaluation of toxics in marine and estuarine benthic environments (Chapman, 1992; Chapman et al., 1997; McGee et al., 2001). The Interstate Chesapeake Bay Program (CBP) employed SQT evaluations along with other methods to produce a Bay-wide toxics characterization in 1999 (US EPA, 1999) that identified (1) “Regions of Concern – areas with probable adverse effects,” (2) “Areas of Emphasis – areas with potential adverse effects,” (3) “Areas with Low Probability for Adverse Effects”, and (4) “Areas with Insufficient or Inconclusive Data” relative to toxics contamination in Bay waters. Maps of more recent characterizations (2006, 2008, 2009, and 2010) can be found at: http://www.chesapeakebay.net/maps.aspx?menuitem=15230.
A
Benthos
B Sediment
Chemistry
C Sediment Toxicity
E – Additional Stressors Eutrophication Sedimentation Predation Etc…
D - Benthic Indices: Chesapeake B-IBI Benthic Diagnostic Tool Mid-Atlantic B-IBI EMAP VP-IEC Etc…
Figure 1 - The Sediment Quality Triad (SQT = triangle A.B.C.) as originally conceived for the identification and characterization of potential toxics-induced stressors. The apex of the triangle, Circle A or “Benthos,” represents the condition of the benthic community, which is the primary objective of the “Aquatic Life Use” assessment, while B - “Sediment Chemistry” and C - “Sediment Toxicity” provide two lines of evidence for the evaluation of possible causes of stress due to toxic contamination. Tools for the evaluation of benthic condition (D – “Benthic Indices”) and “Additional Stressors” (E), as well as Sediment Chemistry (B), and Sediment Toxicity (C), are discussed in the text.
Subsequent to the 1999 characterization, DEQ, in conjunction with researchers from the Virginia Institute of Marine Science (VIMS), used the SQT for the characterization of those Virginia Bay waters that had been identified as Class 4 (Insufficient or Inconclusive Data) in the previous CBP study, namely the tidal fresh regions of the James River, the tidal York River drainage, and Mobjack Bay (Roberts et al., 2002a, 2002b,
Final Guidance for 2018 IR Appendix G
82
2003). A new report on toxics throughout the Chesapeake Basin was published in December 2012 (EPA, et al., 2012).
The original objective of such ambient toxics monitoring was primarily to perform a quick screening of the medium of interest (water, sediment, fish tissue, etc.) to determine whether toxic pollutants were present and could potentially have a negative impact on aquatic life or human health. In addition to the evaluation of potential causes of impact (based on Sediment Chemistry – element B), potential toxic effects on the biota (including individual survival, growth and/or reproduction) could be evaluated based on the results of toxicity tests (Sediment Toxicity – element C), most commonly conducted in the laboratory but at times carried out with test species maintained in situ (e.g., Roberts et al., 2002a, 2002b, 2003). The general welfare of the benthic community in the field (Benthos – element A) was evaluated as a manifestation of elements B and C (if they were positive), i.e. actual observed effects of sediment contamination. Although the potential effects of other stressors were acknowledged, they did not play a significant role in the earlier SQT evaluations.
Because sediment chemical contamination and its resultant toxicity are relatively stable through time, they are much more appropriate for characterizing probabilistic sites (that are normally only visited once) than are water quality parameters, which may vary on much shorter time scales (seasonally, daily, hourly, or minute-to-minute). The condition of the benthic infaunal community reflects long-term (and potentially chronic) effects from sediment chemical contamination as well from a variety of other stressors.
The Virginia DEQ began to apply a modified, more formal Weight-of-Evidence (WOE) assessment procedure employing the Sediment Quality Triad in its 2006 Integrated 305(b)/303(d) Water Quality Assessment Report. DEQ’s assessment procedure, however, goes beyond the original SQT toxics-related evaluations and includes tools for the tentative evaluation of some of the additional potential stressors (E – “Additional Stressors” of Figure 1) affecting estuarine benthic communities. WOE assessment is carried out on data collected within DEQ’s Estuarine Probabilistic Monitoring (ProbMon) Program and, periodically, the National Coastal Condition Assessment (NCCA) surveys which sample the coastal Delmarva region, the Back Bay / North Landing River region, and the tidal tributaries, embayments, and mainstem of the Chesapeake Bay drainage. Because all three elements of the SQT are collected and water quality and additional sediment analyses are carried out simultaneously, the WOE procedure is able to provide an integrated assessment for individual sampling sites. General guidance for the delineation of the area represented by each site is provided in Section 5.1, “Monitoring Station Siting and Delineation”, Rules 4 and 6, of this Assessment Guidance Manual. It should be pointed out here that, within the tidal portions of the Chesapeake Bay basin, the weight-of-evidence assessment discussed in this section complements the probabilistic benthic assessments carried out by Virginia’s Chesapeake Bay Program (CBP). The probabilistic benthic monitoring carried out by the CBP collects benthic samples and a few measures of bottom conditions at each site (sediment type and TOC content, salinity, dissolved oxygen, etc.), but does not carry out chemical analyses or toxicity tests of sediment. Consequently, the results of CBP benthic characterizations are spatially integrated and assessments are performed only on pre-designated Bay segments that have a sufficiently large sample size (N ≥ 10).
The SQT is an effects-based approach that describes the condition of the sediment and associated benthic infaunal communities relative to toxic pollutants and their effects. The three main data components that were integrated into the original “weight-of-evidence” SQT analysis included: (1) sediment bulk chemical concentrations, (2) sediment toxicity test results, and (3) an evaluation of benthic infaunal community condition. Rather than considering each type of characterization individually, the complementary methods integrate biological responses with chemical data (Chapman, 1992) for a more scientifically defensible assessment process. Chapman (1992) provided eight possible scenarios from which conclusions could be drawn with the SQT approach. It was this concept that first served as the foundation required to implement the “weight of evidence” assessment of triad data as summarized in the evaluation matrix of Figure 2, below.
Final Guidance for 2018 IR Appendix G
83
The objective of this guidance is to provide orientation for interpreting data generated by the traditional SQT approach, as complemented by additional lines of evidence, with added insight on how to consider “weighting” of each component. This is not to suggest that sound scientific interpretation and best professional judgment are unnecessary, but does provide some degree of standardization for the process. Conceptually, this is similar to the approach used by the Chesapeake Bay Program and its partners for its Toxics Characterization of the Bay (EPA 903-R-00-010, June 1999). The use of this guidance will provide assistance in applying “weights” to the different triad components, which are then inserted into the classic SQT matrix. The bulk chemistry results, for example, can receive additional weighting based on the magnitude of exceedence of the applicable Sediment Quality Guideline (SQG). For toxicity tests, greater weight is applied with two or more statistically significant sediment toxicity tests than is applied to a single significant test, for the affected endpoint. The type of toxicity test endpoints that exhibit statistical significance must also be given consideration, since the acute ecological consequence of not surviving would be greater on the population of a species than the rate of growth of individuals. Test results based on survival/mortality would therefore receive a greater weight.
All of the data contributing to each line of evidence, the intermediate results, the tentative conclusions, and the final integrated WOE assessment are aggregated into a single “Weight of Evidence Assessment (Excel ®) Workbook” for each site. An example of the basic template used for the Weight-of-Evidence Assessment Workbooks is provided here for reference. An example of a completed workbook will be provided later in this section.
Scenario Chemistry ToxicityBenthic
Community Alteration
Total Score (Sum) Tentative/Possible Conclusions Listing Category
(Weight dependent)
Observed Scores >>> - - - 0 ??? ???
1 Score > 0 Score > 0 Score > 0 3-9 If "3" in all three categories, strong evidence for chemical contaminant-induced degradation. (Benthic "Diagnostic Tool" results?)
VA Category 5A (Cause = Toxics)
or 3B
2 0 0 0 0 Strong evidence for absence of chemical contaminant-induced degradation. VA Category 2A
3 Score > 0 0 0 1-3 Chemical contaminants are not bioavailable. VA Category 2A (or 2B)
4 0 Score > 0 0 1-3 Unmeasured chemical contaminants or conditions may exist that have the potential to cause degradation.
VA Category 2A, 2B (or 3B)
5 0 0 Score > 0 1-3
Alteration is probably not due to chemical contaminants. Bay waters - moderate to severe benthic degradation => 3B (Benthic "Diagnostic Tool" results?); Elsewhere, severe benthic degradation =>5A when corroborated by two or more indices.
VA Category 3B or 5A
(Cause = Water Quality)
6 Score > 0 Score > 0 0 2-6 Chemical contaminants are likely stressing the system. VA Category 3B (or 2B)
7 0 Score > 0 Score > 0 2-6Unmeasured chemical contaminants are causing degradation. Slight or moderate benthic degradation => 3B (or 2B); severe benthic degradation => 5A. (Benthic "Diagnostic Tool" results?)
VA Category 3B (or 2B); or 5A
8 Score > 0 0 Score > 0 2-6 Chemical contaminants are not bioavailable or benthic alteration is not due to chemical contaminants. (Benthic "Diagnostic Tool" results?)
VA Category 3B or 5A
(Cause = Water Quality)
Hyp
othe
tical
Sce
nari
os
Figure 2 - The SQT Evaluation Matrix summarizing the eight scenarios originally described by Chapman (1992). Refer to the “SQT Evaluation Matrix” Tab of the Weight-of-Evidence Assessment Workbook. This matrix has been adapted from the original in order to incorporate additional lines of evidence and to provide numerical scores for the three classes of characterization: Chemistry, Toxicity and Benthic Community Alteration. The penultimate column summarizes Chapman’s descriptions of the eight possible scenarios with the addition of some comments on possible assessment classifications, and the last column lists the specific listing categories that may be assigned for Virginia’s 305(b)/303(d) Integrated Water Quality Assessment Report. Further discussion of the matrix is provided in the text sections below related to the Microsoft Excel® “Weight-of-Evidence Assessment Workbook.”
Final Guidance for 2018 IR Appendix G
84
The Weight-of-Evidence Workbook consists of 13 individual worksheets that fully document the location of the monitoring site, the complete analytical results of sediment chemical analyses, of sediment toxicity tests, and of benthic identifications and enumerations, the interpretation of those results, and the integration of all lines of evidence (including water quality, sediment quality and benthic community well-being) into a final assessment:
Page No. Tab Title1. Orientation - Read Me First2. Summary Sheet3. SQT Evaluation Matrix4. (1) SedChem – Mean ERM Quotient Model5. (2) SedChem – Logistic Regression Model6. (3) SedChem – Equilibrium Partitioning Sediment Benchmark for PAH Mixtures7. (4) Sediment Toxicity8. (5) Benthic Infauna9. Sediment Chemistry Data10. Chemistry QA Codes11. Sediment Toxicity Data12. Benthic Data13. Site Map (USGS TopoQuad) and Satellite Imagery
In keeping with DEQ’s continual planning process, the WOE assessment procedure and the format of the Weight-of-Evidence Assessment workbook continue to evolve as additional lines of evidence and new assessment tools become available. Page 5 “(2) Sediment Chemistry – Logistic Regression Model” was added in 2015, for the assessment of 2014 results, following its inclusion in the 2014 draft Technical Appendix of National Coastal Condition Assessment 2010 (US EPA, 2015) by the EPA Office of Water and Office of Research and Development. The following discussions will describe the various lines of evidence considered and summarize the characterization procedures as currently employed (April 2016). More details and explicit instructions relative to each step are included in the Weight-of-Evidence Workbook.
Workbook Summary Sheet - Final Assessment and Comments:
Descriptive information identifying the specific sampling site is entered into this workbook Tab prior to adding additional results of field measurements and laboratory analyses here or elsewhere in the file. As on other tabs throughout the workbook, information should be typed or pasted into fields that are highlighted in pastel green. Fields highlighted in pale yellow should not be altered in any way. Yellow fields are populated automatically by embedded calculations or direct transfers from other fields within the workbook. Entering observations or comments in undesignated fields should be avoided, since many fields contain hidden reference values for populating other cells of the workbook. Once assessment is complete, the assessor may highlight additional cells to classify results as “Good” (bright green), “Fair” (bright yellow), or “Poor” (bright red).
Benthic Community Characterization: Workbook Tab 8 - “(5) Benthic Infauna”
Because the WOE assessment is applied strictly for the designated “Aquatic Life Use” (ALU), evaluation of the structure and function of the benthic community is the ultimate, most heavily weighted indicator for site characterizations. The condition of the benthic community constitutes an integrated observed effect (Va. Assessment Category 3B) of the existing environmental stressors, whether the individual stressors are identified or not. If the benthic community is found to be severely degraded, a site may be assessed as “Impaired” for ALU even if evidence for a specific cause is lacking. Additional, conformational sampling would be required,
Final Guidance for 2018 IR Appendix G
85
however, prior to initiating TMDL development. In the opposing case, if the benthic community was found to be in good condition (“non-degraded” or “meeting goals”), a classification of “(5A) Impaired” would be unlikely unless chemical and/or toxicity results were exceptionally extreme.
The general objective of the weight-of-evidence (WOE) assessment methodology is to integrate multiple lines of evidence, based primarily on sediment analyses, to provide a standardized, objective evaluation of the severity and probable cause(s) of benthic degradation. Individual benthic index scores are subject to sampling error, which results from the great heterogeneity of biological communities as well as from methodological variations in sample collection, handling and analysis. When additional lines of evidence such as significant chemical contamination and/or significant acute or chronic toxic effects corroborate low benthic IBI scores, they serve to identify probable causes of degradation, and consequently to confirm the validity of low benthic scores and to justify an assessment classification of “Impaired” (5A). When low benthic scores are not corroborated by integrative chemical or toxicological measures, additional lines of evidence (e.g., low DO, high nutrient concentrations, evidence of sedimentation, or other habitat characterizations) may contribute to their interpretation. These alternative lines of evidence are of limited value, however, in the case of single-visit probabilistic sampling.
Within tidal Chesapeake Bay waters the natural variability of benthic communities, both within and among habitat types, is recognized and included in a formal statistically-based procedure which integrates multiple (N ≥ 10) CBP probabilistic benthic IBI scores for ALU assessment of pre-defined tidal water segments. The benthic IBI scores from the Estuarine Probabilistic Monitoring Program (ProbMon) are included in this procedure. Consequently, within Bay waters and in the absence of corroborating evidence from chemical or toxicological measures, benthic IBI scores from this ProbMon program are integrated into the CBP assessment and are not further evaluated using the WOE approach. In non-Bay tidal waters, however, where no other benthic community evaluation is carried out, the WOE assessment places greater weight on alternative lines of evidence from the probabilistic sample, including the degree of consensus among the three benthic indices generally calculated. In coastal Delmarva waters and in the Albemarle Sound drainage (Back Bay, North Landing River), greatest weight is given to the Middle Atlantic Benthic IBI. In these waters, if the CBP Benthic IBI and/or the EMAP Virginia Province Index of Estuarine Condition corroborate evidence of severe benthic degradation, an assessment of impaired ALU may result even in the absence of supporting chemical or toxicological evidence.
The number of different benthic taxa present in a standardized sample3, their relative abundances, and knowledge of their specific ecological/functional roles provide the information for calculating numerous measures or metrics of community structure and function. Several of these metrics are used individually for a preliminary, general characterization of the benthic community while many of them are subsequently integrated into various, more objective multi-metric indices of biological integrity (Benthic IBIs) or of estuarine condition (IEC). Raw taxonomic data and intermediate results are provided on the “Benthic Data” Tab (page 12) of the WOE Workbook, while the integrated evaluation is summarized on Tab “(5) – Benthic Infauna” (page 8).
The values of seven individual metrics derived from the taxonomic results provide an initial qualitative evaluation of benthic condition during the WOE process. The first five are measures of taxonomic abundance
3 The standardized benthic sample for the Estuarine Probabilistic Monitoring Program consists of a composite of two separate sediment grabs using a 6-inch Petite Ponar sediment sampler, representing a total bottom area of approximately 0.046 m2. The contents of each grab must conform to quality assurance criteria specified in the National Coastal Condition Assessment program QAPP (U.S. EPA., 2009b, 2014a) and Field Operations Manual (U.S. EPA., 2009c, 2014b) and must include at least 7.0 cm of sediment. The B-IBI results with this sampling protocol have been shown not to differ significantly from standardized samples collected with a single 8” Young sampler (Dauer and Lane, 2005).Final Guidance for 2018 IR Appendix G
86
and diversity, while the last two are the abundances of two stress-tolerant taxa that are also used in calculating an IEC, to be discussed below.
Metric Description
1. Total Abundance - The total number of individuals in a benthic sample; generally symbolized as “N”. 2. Total Taxa - The total number of taxa that are identified from a sample. Depending upon the
group of organisms, an individual taxon may represent a species, a genus, a family, or a higher level of identification. Usually symbolized as “S” for number of species, but “S” is maintained here as the number of taxa.
3. Shannon H' - The Shannon-Weiner Species Diversity Index: H’ = -Σ i = 1, S (pi ln pi). This index is calculated here as it was originally expressed, using log2. Elsewhere, however, it is often calculated using natural logs (ln) or occasionally using decimal logs (log10). The use of “S” as defined here would make H’ an index of taxonomic diversity rather than of species diversity.
4. Gleason-D - Gleason’s Diversity Index: D = S / ln N5. Pielou-J' - Pielou’s Index of Equitability (or Evenness): J’ = H’ / H’max , where H’max is the
theoretical maximum diversity with “N” individuals divided among “S” taxa. The value of J’ can vary from 0.0 to 1.0; both H’ and H’max must be calculated to the same logarithmic base; in this case H’max = log2 (S)
6. Tubificidae - The numeric abundance of the family Tubificidae (Annelida, Oligochaete), a stress-tolerant taxon.
7. Spionidae - The numeric abundance of the family Spionidae (Annelida, Polychaete), another stress-tolerant taxon.
Although the abundance of individuals and the diversity of taxa vary among habitat types - muddy vs. sandy sediment, in combination with salinity regime - within a specific habitat type higher values of metrics 1 through 5 are generally indicative of more healthy, less degraded benthic communities. A high abundance (metric 1) with few taxa (metric 2) may indicate a degraded benthic community, especially if the abundant taxa are stress-tolerant as are those of metrics 6 and 7. This would result in relatively low values for metrics 3, 4 and 5. An excessive abundance of tubificids (6) and/or spionids (7) generally indicates a highly stressed and probably degraded benthic community.
Benthic community alteration is also evaluated by integrating various individual metric scores into a single Benthic Index of Biotic Integrity (B-IBI) based on previously established and verified thresholds (e.g., Chesapeake Bay B-IBI; Weisberg et al., 1997), and then comparing the overall site B-IBI score with the defined ranges characteristic of specific habitat types (e.g., Llansó and Dauer, 2003 for the Chesapeake Bay). Characterizing the overall benthic community condition with this CBP B-IBI is straight-forward, since there are four previously established categories ranging from good to severely degraded (Please refer to Table 1 below). It is the preferred and most appropriate index for use within the Chesapeake Bay drainage. An alternate B-IBI, developed for estuaries of the Middle Atlantic Region (Llansó et al., 2002a, 2002b), is used for assessment in the Atlantic coastal estuarine waters of the Delmarva Peninsula. Index values < 3.0 for this B-IBI are considered indicative of stressed benthic assemblages and degraded conditions (SQT Matrix Score = 3 or 2), while scores ≥ 3.0 indicate that benthic goals are met (Matrix Score = 0).
Final Guidance for 2018 IR Appendix G
87
Table 1 - Chesapeake Bay B-IBI Ranges and Benthic Community Condition
CBP B-IBI Score
Benthic Community Condition
SQT Matrix Score
> 3.0 Meets Goal 02.7-2.9 Marginal 12.1-2.6 Degraded 2< 2.0 Severely Degraded 3
When one or more measurements essential for the calculation of either of these B-IBIs is lacking, or if they are considered geographically inappropriate, a third alternative is available. Paul et al. (2001) developed a benthic-based “Index of Estuarine Condition” (VP-IEC) for the Virginian Biogeographic Province (from Cape Cod to the mouth of Chesapeake Bay), based on the 1990-1993 results of EPA’s Middle Atlantic Integrated Assessment (MAIA) Program. This index is given minimum weight when either of the B-IBIs is available and more appropriate, but is more heavily weighted when neither of the B-IBIs is available. In the original publication of the VP-IEC, calculated as a linear discriminant function, final values greater than zero (> 0.000) were interpreted as an indication of non-degraded conditions and values less than zero (< 0.000) were interpreted as an indication of degraded sites. No indeterminate “gray zone” was specified. For the purpose of weight-of-evidence assessment, discriminant scores of this index between -0.1 and +0.1 are considered “marginal.” Although no systematic salinity-induced bias has been demonstrated for any of these indices, it should be noted that all three are notably less reliable in low-salinity habitats, i.e., oligohaline and tidal fresh waters (salinity < 5.0 ppt). Approximately 20% of Virginia’s estuarine probabilistic sites sampled between 2001 and 2014 were within this salinity range.
Back Bay and the North Landing River, in southeastern coastal Virginia, fall within the Carolinian Biogeographic Province. They constitute a unique tidal freshwater/oligohaline region that is so isolated from Albemarle Sound and the Atlantic Ocean that none of the previously described benthic indices may be completely appropriate. Most of the benthos in this region is more characteristic of freshwater than of tidal estuarine waters. For the purpose of assessment in this region, all three benthic indices are compared and a tentative characterization is based on the relative degree of concordance among them and other individual metrics of species abundance, taxonomic richness, and diversity.
Since the summer of 2005, the separation, taxonomic identification and enumeration of all benthic samples collected within the Estuarine ProbMon Program has been carried out at the Benthic Ecology Laboratory (BEL) at Old Dominion University (ODU) under the auspices of Dr. Dan Dauer. Dr. Dauer is the principal investigator responsible for Virginia’s portion of the Chesapeake Bay Program’s Probabilistic Benthic Monitoring Program. In addition to providing a complete list of all benthic taxa and their abundances (in terms of numbers of individuals and biomass), Dr. Mike Lane (ODU, BEL) uses the BEL database to calculate all of the individual metrics required and the final score for each of the benthic and estuarine indices discussed above. In practice, all three benthic indices are calculated and evaluated for all benthic samples. The greatest weight is given to the results of the most appropriate index, but the degree of concordance (or disagreement) among the three is also considered for the final characterization.
Tab “(5) Benthic Infauna” of the WOE Assessment Workbook summarizes the integrated scoring and weighting for the three benthic and condition indices, along with a number of associated habitat and sediment characteristics that contribute to the final characterization of the benthic community. Several of these complementary characteristics (e.g., bottom DO, bottom temperature, sediment TOC, and habitat type – salinity
Final Guidance for 2018 IR Appendix G
88
regime and mud or sand substrate, summarized on page 2 “Summary Sheet” ) are helpful in identifying potential causes of any observed benthic degradation. Comments and the final Matrix Score recorded on Tab (5) are subsequently transferred to the “SQT Evaluation Matrix” Tab (page 3) for integration into the final assessment.
Under special conditions (i.e., when the CBP B-IBI indicates significant degradation of the benthic community at sites within the Chesapeake Bay drainage) an additional “Benthic Diagnostic Tool”, developed for the Chesapeake Bay Program by Dr. Dan Dauer et al. (2002), may be utilized to tentatively identify the potential cause(s). These analyses are carried out by the CBP Program on a biennial basis for the Integrated 305(b)/303(d) Water Quality Assessment Report. The procedure is described in more detail elsewhere in this Assessment Guidance Manual. When the results become available they are added to Tab (5) – “Benthic Infauna” of the WOE Assessment Workbook as one additional line of evidence for determining probable causes of benthic degradation. The a posteriori inclusion of the diagnostic tool results does not influence the final WOE assessment classification in any way.
Sediment Characterization: Workbook Tabs (1), (2), (3) and (4)
Sediment Chemistry: Workbook Tab “(1) SedChem Mean ERMq Model” (Mean ERM Quotient Model – page 4)
At the present time, EPA has not yet established specific criteria for toxic contaminants in sediment, and Virginia has not established sediment quality standards against which to assess sediment contamination. Consequently, a site is rarely assessed as impaired based on sediment chemistry alone. However, numerous empirical studies carried out over the past 20 to 25 years have provided “Sediment Quality Guidelines” (SQGs) or “Screening Values” (SVs) that serve to tentatively identify the range of concentrations of specific contaminants or classes of contaminants that are likely to cause adverse effects in benthic communities. Virginia currently employs two sets of screening values to characterize sediments: consensus-based Probable Effects Concentrations (PECs - MacDonald et al., 2000) for freshwater sediments and Effects Range Median (ER-M - Long et al., 1995) concentrations for estuarine and marine sediments. APPENDIX F of this Assessment Guidance Manual lists the “Consensus Based and ERM Sediment Screening Values” currently applied in Virginia. They also appear on Tab “(1) SedChem Mean ERMq Model” of the WOE Assessment Workbook, where they are compared to observed sediment contaminant concentrations. Virginia’s Water Quality Standards (“WQS” - 9 VAC 25-260) provide guidelines for the application of these screening values and indicate that in transitional Class II (oligohaline) waters the “more stringent of either the freshwater or saltwater criteria apply.” Section 9 VAC 25-260-140, Subsection C, of the WQS defines specific, fixed zones of transitional Class II waters for Virginia’s major tidal tributaries (Potomac, Rappahannock, York, and James Rivers) and Back Bay. (Transitional or oligohaline waters vary in salinity from 0.5 ppt. to 5.0 ppt.) Fixed transition zones within the Chesapeake Bay drainage correspond with pre-established Chesapeake Bay Program assessment segments. However, at any specific estuarine site the salinity, the sediment chemistry, and the resultant toxicity of contaminants vary temporally. As a consequence, the bottom salinity observed at the time of sampling is used to define habitat classes for benthic IBI evaluations and for the selection of PEC vs. ER-M screening values for WOE assessment. To assure maximum protection of the aquatic life community during WOE assessment, the concept of applying the “more stringent of either the freshwater or saltwater criteria” is also extended to include tidal fresh waters. An exceedence of these screening values raises a red flag of warning, but does not in itself result in an “Impaired” assessment (Virginia Assessment Category 5A). The final assessment classification - impaired, observed potential effects, or fully supporting of ALU, ultimately depends upon the observed effects on the benthic community and not upon potential causes identified with the use of screening values.
Final Guidance for 2018 IR Appendix G
89
When the appropriate SVs are exceeded for one or more contaminants, and no ancillary biological data are available to corroborate significant benthic degradation, the site is still considered fully supporting but having observed (potential) effects status for aquatic life use support (Virginia Assessment Category 3B). In such cases, additional biological monitoring should be scheduled to assess actual aquatic life use support. In practice, for WOE assessment, each SV is evaluated based upon its Sediment Quality Guideline Quotient (SQGQ, sometimes abbreviated as “Q”), which is calculated as the ratio between the observed concentration in the sediment and the screening value: SQGQ = observed concentration / SV. A ratio of 1.0 or greater indicates that the screening value was exceeded. A ratio of 2.0 indicates that the observed concentration was twice the screening value, etc. In the WOE assessment, the magnitude of each exceedence, abbreviated as “Q”, is considered and weighted in scoring the degree of chemical contamination. A summary of the SQT Matrix Scoring Guidelines for sediment contamination can be found at the top of Tab “(1) - SedChem Mean ERMq Model” of the WOE Assessment Workbook.
The use of such screening values for assessment suffers several limitations. First, although they are available for most of the trace toxics metals, they are only available for a very limited number of organic contaminants. Secondly, each screening value reflects the potential effects of a single contaminant and does not consider possible interactions with other contaminants in the same sediment matrix. The often significant effects of additivity, antagonism, and synergism are not considered. A number of efforts have been made in recent years to integrate SQG quotients across multiple contaminants (see Long et al., 2006 for a critical review). The most successful and commonly applied integrated measure is the mean SQG quotient (mSQGQ). In a study of southeastern estuaries Hyland et al. (1999), applying the methods of Long et al. (1998), demonstrated that sites with mean SQG quotients as low as 0.1 had relatively high probabilities of significant degradation of their benthic communities. Applying the mean ERM quotient (mERM-Q) of eight trace metals (excluding Ni), 13 PAHs (excluding Low Molecular Wt PAHs, High Molecular Wt PAHs, and total PAHs), total PCBs, plus total DDT, they found that when the mean ER-M quotient exceeded 0.1, the probability of adverse effects on the benthic community was ≥ 0.75. Similar results were observed when using mean quotients for another set of sediment quality guidelines, the Probable Effects Concentration (PEC). For the purpose of WOE assessment, therefore, when the mean SQG quotient for the selected contaminants exceeds 0.1 a positive chemical score is reported, whether an individual screening value is exceeded or not. A table summarizing the “Risk of benthic impact” as a function of the “ Mean ERM-Q” value in the Virginia Biogeographic Province can be found at the foot of the WOE Workbook Tab “(1) SedChem Mean ERMq Model”.
Sediment Chemistry: Workbook Tab “(2) SedChem Logistic Reg Model” (Logistic Regression Model – page 5)
EPA recently applied a new method for evaluating sediment chemistry in the National Coastal Condition Assessment 2010 (US EPA, 2015). In that Report (also described as NCCA Report V), EPA introduced the Logistic Regression Model (LRM - Field et al., 1999; Field et al., 2002) and the concept of utilizing the maximum probability (Pmax) of acute toxic effects among the sediment contaminant analytes to characterize the ecological condition of a site. To briefly summarize the procedure, a table of LRM coefficients (B0 = Intercept, B1 = Slope), and LRM 25th and 75th percentiles was presented in the 2010 Technical Report (US EPA, 2016) for ten individual metals, 21 individual PAHs plus biphenyl, total PCBs, and four pesticides/pesticide derivatives found in estuarine and marine sediments. The observed sediment concentration of each of these analytes (x) was used to calculate a logistic regression value (LRMX) corresponding to the observed concentration of the analyte. Based on the array of all LRMX values calculated for the measured analytes in a sample, the maximum LRMX value was identified and the probability was calculated of observing significant toxicity based on the observed concentration of that single analyte. Significant toxicity was defined as control-corrected survivorship < 80% and a statistically significant difference from negative controls. This probability was termed Pmax. EPA subsequently utilized the Pmax value in conjunction with the mERM-Q to characterize
Final Guidance for 2018 IR Appendix G
90
individual sites in relation to their ecological condition. In order to be classified as “Good”, a site was required to have a Pmax ≤ 0.5 and a mERM-Q < 0.1 (refer to Table S-6, reproduced below). A classification of “Fair” resulted from a Pmax > 0.5 and < 0.75 or a mERM-Q ≥ 0.1 and ≤ 0.5, and a classification of “Poor” resulted if either Pmax was ≥ 0.75 or the mERM-Q was > 0.5.
Table S-6. Thresholds for sediment chemistry used in NCCA 2010.*
* Reproduced from the 2015 Technical Report (US EPA, 2016) of the National Coastal Condition Assessment 2010 (US EPA, 2015).
The use of this Logistic Regression Model characterization was added to the Weigh-of-Evidence assessments as an additional line of evidence beginning with the 2016 Integrated Report. Observations and comments from Tab “(2) SedChem Logistic Reg Model” are copied to the SQT Evaluation Matrix where they contribute to the final weighting of the SQT Matrix score given for sediment chemistry from Tab (1).
A secondary output statistic from the Logistic Regression Model has been added to the weight-of-evidence workbooks. The probability of toxic effects for each analyte in the model has been calculated in column “P” of the “(2) SedChem Logistic Reg Model” tab. The mean (arithmetic average) probability (Pavg) of toxic effects across all analytes was then calculated. This statistic integrates potential effects across all contaminant analytes, as opposed to considering only the potential effect of the single most critical contaminant (Pmax). Evaluation of the Pavg statistic among 442 probabilistic sites sampled within Virginia’s estuarine water between 2005 and 2014 revealed that Pavg values as low as 0.1000 indicated an elevated probability of significant benthic effects (Smith, 2016 - unpublished results).
Sediment Chemistry: Workbook Tab “(3) SedChem ESB Model” (Equilibrium Partitioning Sediment Benchmark for PAH Mixtures – page 6)
The concentration of dissolved contaminants in the interstitial water of sediment may also stress benthic infauna. The interstitial water in sediment is difficult to collect and analyze accurately and this is not commonly carried out during normal monitoring programs. However, the concentrations of dissolved contaminants in interstitial water can be estimated from the concentrations in the sediment itself using their equilibrium partitioning coefficients and their integrated effects can be predicted by applying procedures similar to those applied for integrating sediment quality guidelines. EPA has published procedures for the derivation of equilibrium partitioning sediment benchmarks (ESBs) for the protection of benthic organisms from several classes of contaminants (US EPA - 2001, 2003a, 2003b, 2003c, 2005, 2008). The guidance manual “Procedures for the Derivation of Equilibrium Partitioning Sediment Benchmarks (ESBs) for the Protection of Benthic Organisms: PAH Mixtures” (US EPA, 2003a) provides orientation for calculating an integrated ESB for a suite of 34 common PAHs that have been included in various intensive sediment studies, as well as conversion factors to be applied for smaller subsets of 23 and 13 PAHs analyzed in other studies. The suite of PAHs analyzed in DEQ’s Estuarine ProbMon Program includes all 23 PAHs of the 23-analyte subset for which conversion factors have been provided. Tab “(3) SedChem ESB Model - PAHs” performs the necessary calculations and conversion based on the concentrations of PAHs and total organic carbon (TOC) measured in the sediment. When the converted sum of the 23 individual benchmarks reaches or exceeds 1.0, there is a high Final Guidance for 2018 IR Appendix G
91
probability of adverse chronic effects due to the toxicity of dissolved PAHs. Observations and comments from Tab (3) are copied to the SQT Evaluation Matrix where they contribute to the final weighting of the SQT Matrix score given for sediment chemistry from Tab (1).
Even a moderate amount of total organic carbon (TOC) in the sediment is sufficient to sequester PAHs and inhibit their solubility in interstitial water. Consequently, the results from this line of evidence complement other lines of chemical characterization and are useful for interpreting probable causes of observed effects, but they are not adequate in themselves to assess a site as impaired or not.
An additional tool for the identification of potential sources of PAHs is the ratio between the members of each of two pairs of compounds (Neff et al., 2005). Depending upon the value of the ratio (see Table 2, below), the source may be identified as probably pyrogenic as opposed to petrogenic in origin. Petrogenic PAHs are found in nature, usually at low concentrations; they may be associated with petroleum spills. Pyrogenic PAHs are combustion byproducts, and usually result from the combustion of petroleum products (e.g., emissions from fuel consumption by outboard motors, etc.).
Table 2 – The Identification of Pyrogenic vs. Petrogenic Sources of PAH Contaminants based on the ratio of concentrations of Phenanthrene / Anthracene and Fluoranthene / Pyrene (Neff et al., 2005)
Ratio Value Probable Source of PAHs
Phenanthrene / Anthracene Ratio If <7.0 Probably Pyrogenic If >10.0 Probably Petrogenic
Fluoranthene / Pyrene Ratio If <0.9 Possibly Petrogenic If >1.0 Possibly Pyrogenic
The Fluoranthene / Pyrene Ratio is much more variable among pyrogenic and petrogenic sources of PAHs than is the Phenanthrene / Anthracene Ratio. Consequently the resultant classification is considered a possible rather than a highly probable source.
Sediment Total Organic Carbon (TOC): (Summary Sheet – page 2)
The concentration of total organic carbon in the sediment influences the availability and route of uptake of toxic contaminants by benthic organisms. Organic carbon absorbs or sequesters many organic and inorganic contaminants, and many benthic infauna organisms actively feed on the organic detritus where these contaminants concentrate. Elevated amounts of TOC are consequently considered undesirable for benthic infauna that ingests sediment particulates. Sediment quality indices published in a series of National Coastal Condition Reports (US EPA, 2001, 2005, 2008) classify sediments with more than 5% TOC as being of poor quality. More recently, Hyland et al. (2005) reported that sediment TOC concentration as low as 3.5% may induce a high risk to benthic communities. Sediment TOC evaluations are presented under both sets of guidelines are included in the Summary Sheet of page 2 - NCCA guidelines in line 18 and Hyland et al. guidelines in line 36.
Conversely, because of the equilibrium partitioning of contaminants between sediment carbon and interstitial water, high TOC concentrations in the sediment tend to lower their ESBs and reduce the risk from dissolved toxics that would diffuse across gills and other semi-permeable membranes. Higher TOC concentrations would be beneficial in reducing toxic effects through this route of uptake. Sediment TOC concentration is
Final Guidance for 2018 IR Appendix G
92
consequently maintained as an ancillary line of evidence for the interpretation of sediment contamination and is used in the calculation of ESBs on Tab “(3) SedChem ESB Model”.
Sediment Toxicity: Workbook Tab “(4) Sediment Toxicity” (Page 7)
The magnitude of effects observed during sediment toxicity tests can be applied for weighting this line of evidence. The survival of test organisms, expressed by the percent control-corrected survival or control-corrected mortality endpoint, is generally associated with the acute effects of higher levels of toxicants (although chemical additivity, antagonism and synergism can also play a role). Sub-lethal test endpoints that provide a measure of chronic exposure effects at an increased level of sensitivity, with lower toxicant concentrations, include organism growth (expressed in weight), reburial (amphipods), reproductive rate, etc. In relative terms, the ecological significance of these endpoints is not likely to be as critical as the measure of survival. Therefore, less weight is applied in cases where only these endpoints show effects. In situations where the survival endpoint yields statistically significant effects by one or more species, greater weight would be applied accordingly. It is important to factor the number of test species, their taxonomic identifications and the associated sensitivities of each test species into the weighting. During the tests, attention must also be applied to artificial toxicity such as in the case of naturally occurring sediment ammonia. Another complication is salinity adjustment, which can chemically alter the sediment, thus leading to changes in chemical bioavailability and ultimately affecting sediment toxicity (Roberts et al., 2002). In the field, indigenous predators can also significantly alter the test outcome. Most of these factors are considered and controlled during the performance of toxicity tests in the laboratory.
Toxicity tests performed in compliance with the QAPP of the National Coastal Assessment Program (US EPA, 2009b) and continued within the DEQ Estuarine Probabilistic Monitoring Program have generally been limited to a single test format with a single test species: ten-day static acute toxicity tests with an estuarine amphipod, conducted in accordance with standard ASTM guidelines and EPA methods. (Prior to 2010, Ampelisca abdita was the amphipod of choice. Beginning in 2010, the NCCA Program as well as DEQ’s Estuarine Probabilistic Monitoring Program switched from Ampelisca abdita to the amphipod Leptocheirus plumulosus as a test organism.) Beginning in 2012 we started to observe exceptionally high mortalities in toxicity texts of sediment from a number of tidal freshwater sites. Apparently, adjusting the salinities from freshwater (<0.5‰) to a standardized estuarine salinity of 20‰ following estuarine toxicity test protocols, changed sediment chemistry sufficiently to stimulate the proliferation of iron-fixing bacteria, the precipitation a reddish-brown flocculant, a precipitous drop in pH and increased ammonia concentrations, resulting in catastrophic amphipod mortality. Consequently, beginning in 2013 we included a parallel freshwater toxicity test using Hyalella azteca as a test organism. Subsequently, we reported the results of both tests for sediment from tidal freshwater sites. Often, control-corrected survivorship was comparable and high in both tests, but when poor results from the estuarine test were accompanied by the manifestations described above, sediment toxicity was characterized by the results of the freshwater test.
In either case, the specified end-point was amphipod survival. The results of these tests are provided on the “SedTox Data” Tab (page 11) of the WOE Assessment Workbook and the final evaluation and scoring are carried out on Tab “(4) Sediment Toxicity.” Both statistical significance and ecological significance of the results are considered. The statistical significance of test results is tested at a significance level of α = 0.05 (≥ 95% confidence that differences from control are real); ecological significance is assumed only if control-corrected survivorship is < 80%. On rare occasion, results may be statistically significant but not ecologically significant, or vice versa. In such cases a score of 1 (marginal toxicity = “Fair”) is awarded for evaluation in the SQT matrix and the Summary Sheet.
Ancillary Parameter Values and the Identification of Additional Potential Stressors
Final Guidance for 2018 IR Appendix G
93
Near Bottom Salinity (‰) and Percent Sand (%): The near-bottom salinity class observed at the time of sample collection, and the percent sand in the sediment sample are used in several ancillary evaluations. On the “Summary Sheet” Tab of the WOE Assessment Workbook these two measurements are automatically integrated into a “Habitat Type” characterization for application of the CBP B-IBI on Tab “(5) Benthic Fauna”. This integration is also performed by the BEL benthic database at Old Dominion University during the calculation of the CBP Benthic IBI. In addition, the relative proportions of sand vs. fines (silt/clay) in the sediment (“sand” vs. “mud” substrate) can be used to differentiate high energy from low energy benthic environments. Percent sand ≥ 98.00% and TOC concentrations ≤ 0.5% were generally indicative of current-scoured substrate or dynamic habitat (due to wave action). Chemical contamination is always very low and benthic communities are almost always (naturally) degraded at such sites. Both are areas where the substrate is at least periodically in movement and fine particulates tend to be washed away. Filter feeders may predominate in such areas, while deposit feeders may predominate in low energy areas where fine particulates accumulate. Substrate type may also serve as an indication of the relative risk of chemical contamination. Contaminants are more readily absorbed, transported and deposited by fine particles (silt/clay) and associated organic detritus than by sand. (Incidentally, sediment with extremely high sand content often stimulates amphipod mortality that is not associated with chemical contamination during toxicity tests. Some amphipod species respond negatively to high sand concentrations (U.S EPA, 1996; Emery et al., 1997).
Near Bottom Dissolved Oxygen (DO - mg/L) and Depth: Low dissolved oxygen presents a direct stress on benthic fauna. This may result from natural thermal and/or salinity stratification that inhibit mixing in deep channels, from nutrient enrichment and eutrophication, or from a combination of both. In warmer, shallower waters low DO concentrations (mg/L) may result simply from oxygen’s lower solubility at higher temperatures. In either case, the observation of a single low near-bottom DO concentration at a probabilistic site is not sufficient to result in an impaired assessment. It is evaluated only as one among various potential causes for any benthic degradation that is observed.
Bottom Temperature: (oC): Higher water temperature may itself be a significant stressor, in addition to its indirect effect via DO depression.
Total Organic Carbon (TOC): As indicated above, the concentration of Total Organic Carbon in the sediment can influence the degree of exposure to and the uptake route of chemical contaminants by benthic organisms. In association with other water quality characteristics, it may also provide insight into the degree of eutrophication present in the estuarine system.
While potential scenarios based on these integrated lines of evidence are too numerous to list, for many sites the conclusion should be obvious. For example, chemical contaminants are commonly detected but at concentrations below their respective SQGs. If the biological results from the same samples indicate a lack of effects, as demonstrated by lack of significant sediment toxicity and the presence of a healthy benthic community, the resultant listing would be VA Category 2A (fully supporting designated use). On the opposite end of the spectrum, all three components of the triad may show extreme effects and the site would consequently be listed in the 5A category (impaired for toxics – potentially needing a TMDL).
Ancillary Indices: Beginning in 2011, several indices used for site evaluation by the National Coastal Condition Assessment (NCCA) Reports were added to the Summary sheets of WOE Assessment workbooks. A Sediment Quality Index (SQI) integrates the results of sediment toxicity, sediment contamination, and sediment TOC content into a rating of “Good”, “Fair” or “Poor.” A Water Quality Index (WQI) integrates near surface
Final Guidance for 2018 IR Appendix G
94
dissolved inorganic nutrients (nitrogen and phosphorus), chlorophyll-a, water clarity, and near-bottom dissolved oxygen into a similar rating scale. In 2013, a national workgroup began reevaluating the thresholds for classification of the individual components of these indices for the fifth National Coastal Condition Report (U.S. EPA, 2015). Once a final consensus was reached for the national report, the thresholds in the WOE workbooks were adjusted accordingly (see Table 2-5, below). A résumé of the three types of benthic evaluations (CBP B-IBI, Mid Atlantic B-IBI, EMAP VP-IEC) applied in the WOE Assessment has also been included on the Summary tab to facilitate site characterizations.
Table 2-5. NCCA guidelines for evaluating the five component indicators used in the water quality index to assess estuarine coastal condition.*
a Tropical refers to NCCA Florida Bay sites. b Submerged Aquatic Vegetation.* Reproduced from the 2015 Technical Report (US EPA, 2016) of the National Coastal
Condition Assessment 2010 (US EPA, 2015).
An example of a completed WOE workbook is included here to illustrate the final product and provide additional information to help with the Weight-of-Evidence assessment process.
It is preferred that this WOE approach only be applied when all three sediment data components are available from a particular site. It is still possible, however, to implement this process if only two elements are available, as long as data on the condition of the resident benthic community is included (e.g., sediment chemistry and benthic IBI or sediment toxicity and benthic IBI). If both lines of evidence are in agreement as to the condition of the site (e.g., degraded or severely degraded), a corresponding assessment may be attained (i.e., Category 5A with toxics as a potential cause). If such a conclusion is suggested based solely on sediment chemistry and
Final Guidance for 2018 IR Appendix G
95
sediment toxicity data, follow-up monitoring should be scheduled (Virginia Assessment Category 3B), even if both chemical and toxicological results are in agreement on the potential existence of a toxic condition. For those instances where the conclusions are not obvious, it will be necessary to obtain consensual agreement between Central Office and the Regional Office responsible for the assessment of that water body. If agreement cannot be attained, advice should be sought from DEQ’s Academic Advisory Committee.
References
Buchanan, M.F. 1999. National Oceanic and Atmospheric Administration Screening Quick Reference Tables, NOAA HAZMAT Report 991 Seattle, WA, Hazardous Materials Response and Assessment Division, 12 pages.
Chapman, P.M. 1986. Sediment quality criteria from the sediment quality triad – an example. Environ. Toxicol. Chem. 5: 957-964.
Chapman, P.M., R.N. Dexter, S.F. Cross and D.G. Mitchell. 1986. A field trial of the Sediment Quality Triad in San Francisco Bay. NOAA Technical Memorandum NOS OMA 25. National Oceanic and Atmospheric Administration, San Francisco, CA. 127 pp.
Chapman, P.M., R.N. Dexter and E.R. Long. 1987. Synoptic measures of sediment contamination toxicity and infaunal community structure (the Sediment Quality Triad). Mar Ecol. Prog. Ser. 37:75-96.
Chapman, P.M, 1992. Sediment Quality Triad Approach. In: Sediment Classification Methods Compendium. EPA 823-R-92-006 Ch. 10 pp. 1-18.
Chapman, P.M, B. Anderson, S. Carr, V. Engle, R. Green, J. Hameedi, M. Harmon, P. Haverland, J. Hyland, C. Ingersoll, E. Long, J. Rodgers Jr, M. Salazar, P. Sibley, P. Smith, R. Swartz, B. Thompson and H. Windom. 1997. General guidelines for using the sediment quality triad. Mar Pollut Bull 34(6):368-372.
Dauer, D.M., and M.F. Lane. 2005. Side-by-Side Comparison of Young Grab and Composite Petite Ponar Grab Samples for the Calculation of the Benthic Index of Biological Integrity (B-IBI). Report to: Chesapeake Bay Program Office, Virginia Department of Environmental Quality, 629 East Main Street, Richmond, Virginia 23230. June, 2005. 46pp.
Dauer, D.M., M.F. Lane and R.J. Llansó. 2002. Development of Diagnostic Approaches to Determine Sources of Anthropogenic Stress Affecting Benthic Community Condition in the Chesapeake Bay. Final Report to the U.S. Environmental Protection Agency, Chesapeake Bay Program Office, Annapolis, Maryland, 64 pp.
Emery, V.L., Jr., D.W. Moore, B.R. Gray, B.M. Duke, A.B. Gibson, R.B. Wright, and J.D. Farrar. 1997. Development of a chronic sublethal sediment bioassay using the estuarine amphipod Leptocheirus plumulosus (Shoemaker). Environ. Toxicol. Chem. 16(9):1912-1920.
Hall, L.W. and R.W. Alden III. A review of concurrent ambient water column and sediment toxicity testing in the Chesapeake Bay watershed: 1990-1994. Environ. Toxicol. Chem. 16:1607-1617.
Hall, L.W. Jr., and R.D. Anderson. 1997. A Pilot Study for Ambient Toxicity Testing in Chesapeake Bay Year 4 Report. Chesapeake Bay Program, 410 Severn Ave., Suite 109, Annapolis, MD 21403.
Hyland, J.L., R.F. Van Dolah, and T.R. Snoots. 1999. Predicting stress in benthic communities of Southeastern U.S. estuaries in relation to chemical contamination of sediment. Environmental Toxicology and Chemistry, 18(11): 2557-2564.
Hyland, J, L. Balthis, I. Karakassis, P. Magni, A. Petrov, J. Shine, O. Vestergaard, R. Warwick. 2005. Organic carbon content of sediments as an indicator of stress in the marine benthos. Marine Ecology Progress Series.Vol. 295: 91–103, 2005 Published June 23
Llansó, R.J., and D.M. Dauer. 2003. Methods for Calculating the Chesapeake Bay Benthic Index of Biotic Integrity. Chesapeake Bay Program. 24 pp. www.baybenthos.versar.com
Llansó, R.J., L.C. Scott, J.L. Hyland, D.M. Dauer, D.E. Russell, and F.W. Kutz. 2002. An Estuarine Benthic Index of Biotic Integrity for the Mid-Atlantic Region of the United States. II. Index Development. Estuaries Vol. 25, No. 6A, p. 1231–1242 December 2002.
Final Guidance for 2018 IR Appendix G
96
Long, E.R., and P.M. Chapman. 1985. A sediment quality triad: Measures of sediment contamination, toxicity and infaunal community composition in Puget Sound. Mar. Pollu. Bull. 16(10): 405-415.
Long, E.R., D.D. MacDonald, S.L. Smith, F.D. Calder. 1995. Incidence of adverse biological effects within ranges of chemical concentrations in marine and estuarine sediments. Environmental Management vol 19(1):81-97.
Long, E.R., D.D. MacDonald, C.G. Severn, and C.B. Hong. 2000. Classifying the probabilities of acute toxicity in marine sediments with empirically-derived sediment quality guidelines. Environmental Toxicology & Chemistry 19(10): 2598-2601.
Long, E.R., C.G. Ingersoll, and D.D. MacDonald. 2006. Calculation and uses of mean sediment quality guideline quotients: A critical review. Environmental Science and Technology (March 2006 issue).
Long, E.R., J. Field, and D. MacDonald. 1998. Predicting toxicity in marine sediments with numerical sediment quality guidelines. Environmental Toxicology and Chemistry 17:714-727
MacDonald, D.D., C.G. Ingersoll, T.A. Berger. 2000. Development and Evaluation of Consensus Based Sediment Quality Guidelines for Freshwater Ecosystems. Arch. Environ. Contam. Toxicol. 39:2031.
McGee, B.L., D.J. Fisher, J. Ashley and D. Velinsky. 2001. Using the Sediment Quality Triad to characterize toxic conditions in the Chesapeake Bay (1999): An assessment of tidal river segments in the Bohemia, Magothy, Patuxent, James, and York Rivers. EPA 903-R-01-008, CBP/TRS 257/01, Environmental Protection Agency, Chesapeake Bay Program Office, Annapolis, MD, 35 pp + Appendices.
Neff, J.M., S.A. Stout, and D.G. Gunsert. 2005. Ecological Risk Assessment of Polycyclic Aromatic Hydrocarbons in Sediments: Identifying Sources and Ecological Hazard. Integr Environ Assess Manag 1(1): 22-33. © 2005 SETAC.
Paul, J.F., K.J. Scott, D.E. Campbell, J.H. Gentile, C.S. Strobel, R.M. Valente, S.B. Weisberg, A.F. Holland and J.A. Ranasinghe. 2001. Developing and applying a benthic index of estuarine condition for the Virginian Biogeographic Province. Ecological Indicators 1: 83-99.
Roberts, M.H. Jr, M.A. Vogelbein, M.A. Richards, L. Seivard, and P.F. De Lisle. 2002a. Chemical and Toxicological Characterization of Tidal Freshwater Areas in the James River, Virginia. EPA 903-R-02-006, CBP/TRS 264/02, Environmental Protection Agency, Chesapeake Bay Program Office, Annapolis, MD, 123 pp + Appendices.
Roberts, M.H. Jr, M.A. Vogelbein, M.A. Richards, L. Seivard, and P.F. De Lisle. 2002b. Chemical and Toxicological Characterization of Tidal Freshwater Areas in the James River, Virginia Between Jordan Point and Richmond. Final report to VA Department of Environmental Quality. 49 pp +Appendices.
Roberts, M.H. Jr, M.A. Richards, P.F. DeLisle. 2003. Chemical and Toxicological Characterization of the Lower Mobjack Bay, York River, Virginia Segment of the Chesapeake Bay. Final Report to VA Department of Environmental Quality. 46 pp + Appendices.
Smith, D.H. 2016. Comparative Evaluation of Mean ERM-Q (mERM-Q) and the Logistic Regression Model Pmax vs Pavg Output Statistics for Sediment Contamination Characterizations relative to Benthic Community Integrity. Unpublished report prepared for the National Coastal Condition Assessment Steering Committee. March 2016.
U.S. EPA. 1996. Ecological Effects Test Guidelines: OPPTS 850:1740: Whole Sediment Acute ToxicityInvertebrates, Marine. Technical Report EPA 712 C-96-355. U.S. Environmental Protection Agency, Washington, DC.
U.S. EPA. 1999. Targeting Toxics: A Characterization Report. A Tool for Directing Management and Monitoring Actions in the Chesapeake Bay’s Tidal Rivers. CPB/TRS 222/103, US EPA, Chesapeake Bay Program, Annapolis, MD.
U.S. EPA. 2001. Environmental Monitoring and Assessment Program (EMAP): National Coastal Assessment Quality Assurance Project Plan 2001-2004. United States Environmental Protection Agency, Office of Research and Development, National Health and Environmental Effects Research Laboratory, Gulf Ecology Division, Gulf Breeze, FL. EPA/620/R-01/002.
U.S. EPA. 2001a. National Coastal Condition Report. EPA/620-R-01-005. U.S. Environmental Protection Agency, Office of Research and Development and Office of Water, Washington, DC.
Final Guidance for 2018 IR Appendix G
97

http://water.epa.gov/type/oceb/assessmonitor/nccr/index.cfm U.S. EPA. 2001b. Supporting documentation used in the derivation of selected freshwater Tier 2 ESBs. Office
of Research and Development, Atlantic Ecology Division, Narragansett, RI USA. Contribution AED-08-044 of the Office of Research and Development National Health and Environmental Effects Research Laboratory’s Atlantic Ecology Division. http://www.epa.gov/nheerl/publications/files/Appendix_A_Cupdate7_2.pdf
U.S. EPA. 2003a. Procedures for the Derivation of Equilibrium Partitioning Sediment Benchmarks (ESBs) for the protection of Benthic Organisms: PAH Mixtures. United States Environmental Protection Agency, Office of Research and Development, Washington, DC. EPA-600-R-02-013. November 2003. http://www.epa.gov/nheerl/publications/files/PAHESB.pdf
U.S. EPA. 2003b. Procedures for the Derivation of Equilibrium Partitioning Sediment Benchmarks (ESBs) for the Protection of Benthic Organisms: Endrin. EPA-600-R-02-009. Office of Research and Development. Washington, DC 20460. http://www.epa.gov/nheerl/publications/files/endrin.pdf
U.S. EPA. 2003c. Procedures for the Derivation of Equilibrium Partitioning Sediment Benchmarks (ESBs) for the Protection of Benthic Organisms: Dieldrin. EPA-600-R-02-010. Office of Research and Development. Washington, DC 20460. http://www.epa.gov/nheerl/publications/files/dieldrin.pdf
U.S. EPA (Environmental Protection Agency). 2005a. National Coastal Condition Report II. EPA-620/R-03/002. U.S. Environmental Protection Agency, Office of Research and Development and Office of Water, Washington, DC. (December 2004)http://water.epa.gov/type/oceb/assessmonitor/nccr/index.cfm
U.S. EPA. 2005b. Procedures for the Derivation of Equilibrium Partitioning Sediment Benchmarks (ESBs) for the Protection of Benthic Organisms: Metal Mixtures (Cadmium, Copper, Lead, Nickel, Silver, and Zinc). United States Environmental Protection Agency, Office of Research and Development, Washington, DC. EPA/600/R-02/011. January 2005. http://epa.gov/nheerl/publications/files/metalsESB_022405.pdf
U.S. EPA. 2007. Sediment Toxicity Identification Evaluation (TIE) Phases I, II, and III Guidance Document EPA/600/R-07/080 Office of Research and Development. Washington, DC http://www.epa.gov/nheerl/publications/files/Sediment%20TIE%20Guidance%20Document.pdf
U.S. EPA. 2008. Procedures for the Derivation of Equilibrium Partitioning Sediment Benchmarks (ESBs) for the Protection of Benthic Organisms: Compendium of Tier 2 Values for Nonionic Organics. EPA-600-R-02-016. Office of Research and Development. Washington, DC 20460 http://www.epa.gov/nheerl/publications/files/ESB_Compendium_v14_final.pdf
U.S. EPA (Environmental Protection Agency). 2009a. National Coastal Condition Report III. EPA/842-R-08-002. U.S. Environmental Protection Agency, Office of Research and Development and Office of Water, Washington, DC. (December 2008) http://water.epa.gov/type/oceb/assessmonitor/nccr/index.cfm
U.S. EPA. 2009b. National Coastal Condition Assessment Quality Assurance Project Plan 2008-2012. United States Environmental Protection Agency, Office of Water, Office of Wetlands, Oceans and Watersheds. Washington, D.C. EPA/841-R-09-004
U.S. EPA. 2009c. National Coastal Condition Assessment: Field Operations Manual. EPA-841-R-09-003. U.S. Environmental Protection Agency, Washington, DC.
U.S. EPA (United States Environmental Protection Agency). 2012. National Coastal Condition Report IV. EPA-842-R-10-003. Office of Research and Development and Office of Water, Washington, DC.http://water.epa.gov/type/oceb/assessmonitor/nccr/index.cfm
U.S. EPA - US Environmental Protection Agency, US Geological Survey, US Fish and Wildlife Service. 2012. Toxic Contaminants in the Chesapeake Bay and its Watershed: Extent and Severity of Occurrence and Potential Biological Effects, USEPA Chesapeake Bay Program Office, Annapolis, MD, December, 2012, 175 pages.
U.S. EPA. 2014a. National Coastal Condition Assessment Quality Assurance Project Plan. United StatesEnvironmental Protection Agency, Office of Water, Office of Wetlands, Oceans and Watersheds.
Final Guidance for 2018 IR Appendix G
98
Washington, D.C. EPA 841‐R‐14‐005. 2014.U.S. EPA. 2014b. National Coastal Condition Assessment: Field Operations Manual. EPA-841-R-14-007. U.S.
Environmental Protection Agency, Washington, DC.U.S. EPA. 2015. National Coastal Condition Assessment 2010. U.S. Environmental Protection Agency. Office
of Water and Office of Research and Development. (2015). National Coastal Condition Assessment 2010 (EPA 841-R-15-006). Washington, DC. December 2015.
U.S. EPA. 2016. U.S. Environmental Protection Agency. Office of Water and Office of Research and Development. (2016). NCCA 2010 Technical Report. Washington, DC. January 2016.
(Citation format suggested by Hugh Sullivan, NCCA QA Officer, personal communication 04Feb2016 – will be updated at a later time.)
Weisberg, S.B., J.A.. Ranasinghe, DM. Dauer, L.C. Schaffner, R.J. Diaz and J.B. Frithsen. 1997. An estuarine benthic index of biotic integrity (B-IBI) for Chesapeake Bay. Estuaries 20: 149-158.
Final Guidance for 2018 IR Appendix G
99
APPENDIX H
SIGNIFICANT LAKES/RESERVOIRS BY REGION
Northern Regional Office – 17 Reservoirs/Lakes
Abel Lake Stafford Co. 174 (Acres) PWSAquia Reservoir Stafford Co. 131 PWS(Smith Lake)Beaverdam Reservoir Loudoun Co. 301 PWSBreckenridge Reservoir Prince William Co. 47 PWSBurke Lake Fairfax Co. 208 VDGIFCurtis Lake Stafford Co. 58Goose Creek Reservoir Loudoun Co. 40 PWSHunting Run Reservoir Spotsylvania Co. 440 PWSLake Anna Louisa, Spotsylvania, Orange 9,595Lake Manassas Prince William Co. 675 PWSLake Pelham Culpeper Co. 250 PWSLunga Reservoir Prince William Co. 477 PWSMotts Run Reservoir Spotsylvania Co. 137 PWSMountain Run Lake Culpeper Co. 73 PWSNi Reservoir Spotsylvania Co. 408 PWSNortheast Creek Reservoir Louisa Co. 178 PWSOccoquan Reservoir Fairfax, Prince William Co. 1,333 PWS
Piedmont Regional Office – 22 Reservoirs/Lakes
Amelia Lake Amelia Co. 98 VDGIFBriery Creek Lake Prince Edward Co. 825 VDGIFBrunswick Lake Brunswick Co. 138 VDGIFLake Chesdin Chesterfield Co. 3,164 PWSChickahominy Lake Charles City Co. 1,049 PWSDiascund Creek Reservoir New Kent Co. 1,055 PWSEmporia Lake Greensville Co. 290 PWSFalling Creek Reservoir Chesterfield Co. 88Fort Pickett Reservoir Nottoway Co. 319Great Creek Reservoir Lawrenceville 219Harrison Lake Charles City Co. 60Holiday Lake Appomattox Co. 113Lake Nottoway Nottoway Co. 161Lakeview Reservoir Chesterfield Co. 43Little Creek Reservoir James City Co. 926 PWSLunenburg Beach Lake Town of Victoria 12 PWSModest Creek Reservoir Town of Victoria 20 PWSPowhatan Lake (U & L) Powhatan Co. 61Sandy River Reservoir Prince Edward Co. 718Swift Creek Lake Chesterfield Co. 102Swift Creek Reservoir Chesterfield Co. 1,581 PWSTroublesome Creek Reservoir Buckingham Co. 53 PWS(SCS Impoundment #2)
Final Guidance for 2018 IR Appendix H
100
Southwest Regional Office – 11 Reservoirs
Bark Camp Lake Scott Co. 29 USFSBig Cherry Lake Wise Co. 103 PWSHidden Valley Lake Russell Co. 58 VDGIFHungry Mother Lake Smyth Co. 100 DCRJ. W. Flannagan Reservoir Dickenson Co. 1,177 USACE/PWSLake Keokee Lee Co. 97 VDGIFLaurel Bed Lake Russell Co. 312 VDGIFNorth Fork Pound Reservoir Wise Co. 116 USACE/PWSRural Retreat Lake Wythe Co. 85 VDGIFSouth Holston Reservoir Washington Co. 1,699 TVA/PWSWise Reservoir Wise Co. 46 WISE/PWS
Tidewater Regional Office – 21 Reservoirs/Lakes
Airfield Pond Sussex Co. 120 VDGIFHarwood Mills Reservoir York Co. 258 PWSLake Burnt Mills Isle of Wight Co. 638 PWSLake Cohoon Suffolk City 454 PWSLake Drummond Suffolk City 3,242Lake Kilby Suffolk City 200 PWSLake Lawson Virginia Beach 75Lake Meade Suffolk City 490 PWSLake Prince Suffolk City 709 PWSLake Smith Norfolk City 185 PWSLake Whitehurst Norfolk City 495 PWSLake Wright Norfolk City 12Lee Hall Reservoir Newport News 290 PWSLittle Creek Reservoir Norfolk City 200 PWSLone Star Lake F Suffolk City 19 PWSLone Star Lake G Suffolk City 90 PWSLone Star Lake I Suffolk City 33 PWSSpeights Run Lake Suffolk City 118 PWSStumpy Lake Virginia Beach 263Waller Mill Reservoir York Co. 288 PWSWestern Branch Reservoir Norfolk City 1,205 PWS
Valley Regional Office – 21 Reservoirs/Lakes
Beaver Creek Reservoir Albemarle Co. 96 PWSChris Greene Lake Albemarle Co 57 PWSColes Run Reservoir Augusta Co. 11 USFS/PWSDouthat Lake Bath Co. 47Elkhorn Lake Augusta Co. 51 USFS/PWSFluvanna Ruritan Lake Fluvanna Co. 51Lake Albemarle Albemarle Co. 37Lake Arrowhead Page Co. 36Lake Frederick Frederick Co. 67 VDGIFLake Nelson Nelson Co. 41Lake Robertson Rockbridge Co. 24Final Guidance for 2018 IR Appendix H
101
Mount Jackson Reservoir Shenandoah Co. 1Ragged Mountain Reservoir Albemarle Co. 71 PWSRivanna Reservoir Albemarle Co. 399 PWSShenandoah Lake Rockingham Co. 36Silver Lake Rockingham Co. 11 PWSStaunton Dam Lake Augusta Co. 21 PWSStrasburg Reservoir Shenandoah Co. 5Switzer Lake Rockingham Co. 99 USFSSugar Hollow Reservoir Albemarle Co. 47 PWSTotier Creek Reservoir Albemarle Co. 37 PWS
Blue Ridge Regional Office - Roanoke – 31 Reservoirs/Lakes
Beaverdam Creek Reservoir Bedford Co. 70 PWSBedford (Stony Cr.) Reservoir Bedford Co. 28 PWSCarvin Cove Reservoir Botetourt Co. 632 PWSCherrystone Reservoir Pittsylvania Co. 104 PWSClaytor Lake Pulaski Co. 4,287 PWSClifton Forge (Smith Cr.) Reservoir Alleghany Co. 10 PWSConner Lake Halifax Co. 98 VDGIFFairystone Lake Henry Co. 127Gatewood Reservoir Pulaski Co. 176 PWSGeorges Creek Reservoir Pittsylvania Co. 8 PWSGraham Creek Reservoir Amherst Co. 40 PWSHogan Lake Pulaski Co. 36 PWSKerr Reservoir (Va.’s portion) Halifax Co. 33,300 USACE /PWSKeysville Reservoir Charlotte Co. 36 PWSLake Gordon Mecklenburg Co. 115 VDGIFLake Gaston (Va.’s portion) Brunswick Co. 5,614 PWSLeesville Reservoir Bedford Co. 2,630 PWSLittle River Reservoir Montgomery Co. 60 PWSMartinsville Reservoir Henry Co. 181 PWSMill Creek Reservoir Amherst Co. 190Lake Moomaw Bath Co. 2,389 USACEPedlar Lake Amherst Co. 118 PWSPhelps Creek Reservoir Campbell Co. 19 PWSPhilpott Reservoir Henry Co. 2,813 USACERoaring Fork Reservoir Pittsylvania Co. 19 PWSSmith Mountain Lake Bedford Co. 19,820 PWSSpring Hollow Reservoir Roanoke Co. 113 PWSStonehouse Creek Reservoir Amherst Co. 34Talbott Reservoir Patrick Co. 141Thrashers Creek Reservoir Amherst Co. 32Townes Reservoir Patrick Co. 28
Total 123= Significant Reservoirs/Lakes statewidePWS = Public Water SupplyVDGIF = Virginia Department of Game and Inland FisheriesUSACE = U.S. Army Corps of Engineers
Final Guidance for 2018 IR Appendix H
102
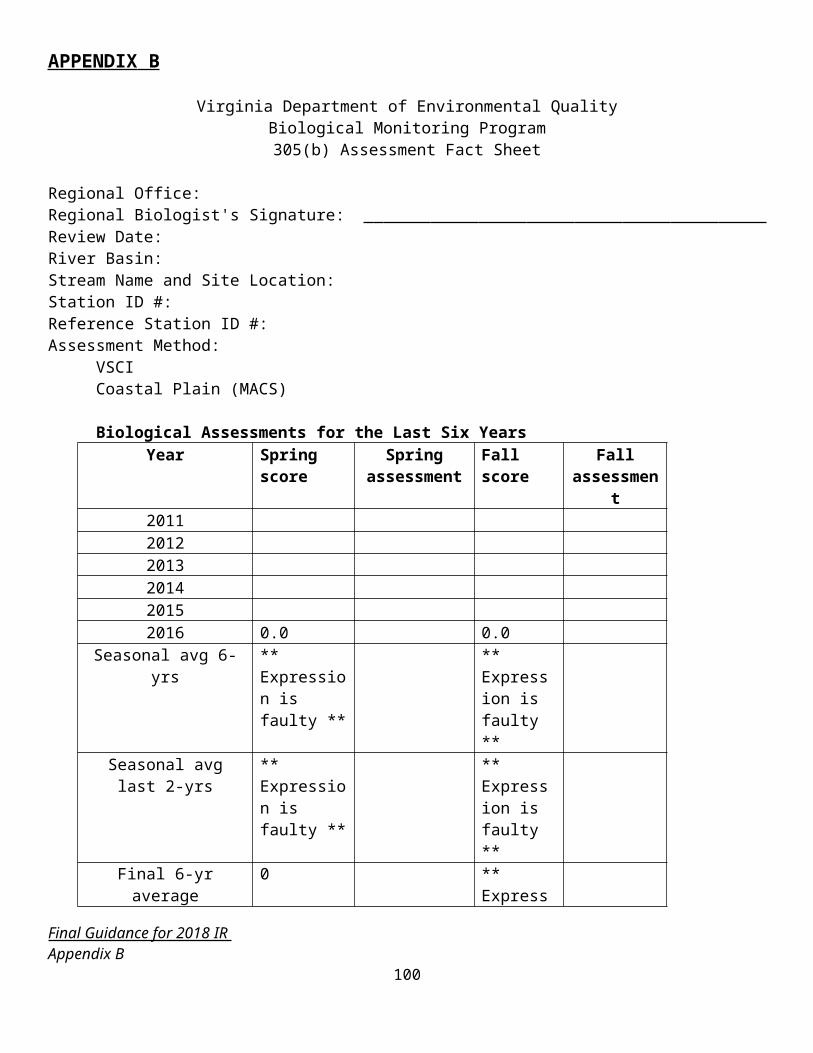
APPENDIX I
During the public comment periods for the 2012 and 2014 Integrated Reports, DEQ received comments from citizens regarding the presence of algae in the Shenandoah River and concern that the algae in the river impaired the recreation designated use. In response to citizen comments, DEQ classified five segments (approximately 25 river miles) along the Shenandoah River as Category 3C for the recreation use, which indicated an observed effect, but insufficient data to determine whether or not the recreation use was supported. These segments were prioritized for follow-up monitoring in 2016 and 2017 by DEQ to develop and test scientifically-based, defensible and reproducible field methods for estimating the percent coverage of river bottom by filamentous algae.
In May 2016, DEQ began developing the field method for evaluating algae cover. The 2016 monitoring season extended through early November and focused primarily on the development of lateral transect methods for estimating algal cover. During the 2017 field season, DEQ staff considered other variables to measure besides percent algal coverage, since the lateral transect method takes a long time to complete and was found to have a high potential for error. Staff conducted algal monitoring weekly from June through October. In 2017, monitoring focused on:
Lateral transects (% algal cover): estimates using the quadrat method. Wet-wrung Biomass (g/m2): wrung wet-weight as initial estimate of nuisance potential. Chlorophyll-a (mg/m2): commonly used indicator of potential impacts due to algae. Captures
filamentous algae and blue/green algae. Chlorophyll-b (mg/m2): used to corroborate the chlorophyll-a results. Captures filamentous algae
but not blue-green algae and diatoms. Ash Free Dry Mass (g/m2): also used to corroborate the chlorophyll-a results
Chlorophyll-a and wet-wrung biomass samples were collected using a quantitative benthic collection device called a Surber. The chlorophyll-a and wet-wrung biomass data were strongly correlated (Figure 3).
5/1/20175/31/2017 7/1/2017
7/31/20178/31/2017
9/30/201710/31/2017
0
50
100
150
200
250
300 TimbervilleDeer RapidsStrasburg ParkRileyvilleBentonville
CHL-
a (m
g/m
2)
Figure 1. CHL-a (mg/m2) at all Sites Sampled in 2017 Field Season
Final Guidance for 2018 IR Appendix I
103
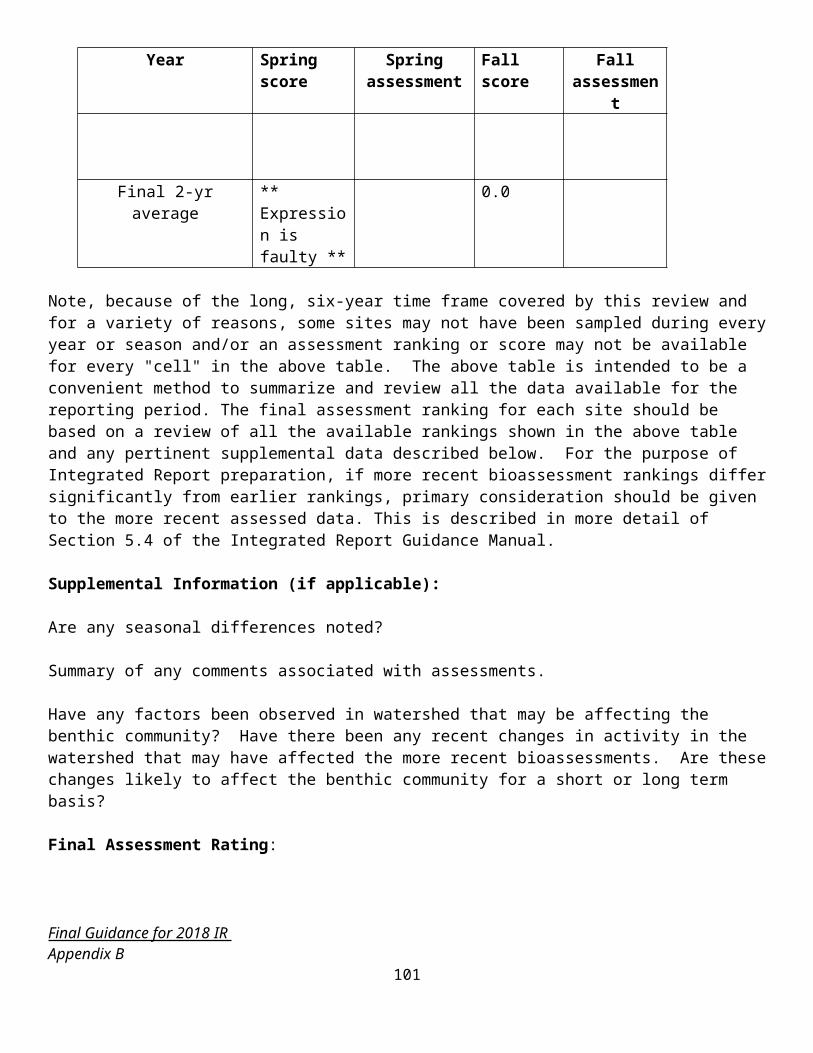
5/1/20175/31/2017
7/1/20177/31/2017
8/31/20179/30/2017
10/31/20170
50
100
150
200
250
300
350
400
450
500
TimbervilleDeer RapidsStrasburg ParkRileyvilleBentonville
Wru
ng W
eigh
t (g)
Figure 2. Wet Wrung Biomass (g) at all Sites Sampled in 2017 Field Season
0 100 200 300 400 500 600 700 8000
50
100
150
200
250
300
f(x) = 0.364352694077711 xR² = 0.952553513759663
Wet Biomass (g of algae)
CHL-
a (m
g/m
2)
Figure 3. Wet Wrung Biomass (g) vs CHL-a (mg/m2)
Final Guidance for 2018 IR Appendix I
104
Monitoring and Assessment ConsiderationsAt the conclusion of the 2017 field season, DEQ developed monitoring and assessment protocols to determine if filamentous algae was contributing to a potential nuisance condition. The protocols were based on current monitoring and assessment practices utilized for Virginia’s lakes, with two additional considerations: First, staff proposed that the nuisance condition was best determined by the persistence of algae over at least two growing seasons. Second, staff recommended chlorophyll-a as the most appropriate, objective metric for determining nuisance potential. This is because algae densities are commonly measured via benthic chlorophyll-a content, and chlorophyll-a is used as an indicator of algal biomass.
The protocols, described below, were presented to the public in a webinar in March 2018, and comments were accepted from March 5 through April 19, 2018. The protocols below have been amended based on public comment.
Monitoring considerations Current algal monitoring techniques are appropriate for wadeable systems, which are the same in-stream
requirements for DEQ’s robust benthic monitoring network. Monitoring process should be prompted by citizen complaints or by observations and recommendations by
DEQ monitoring staff. DEQ staff will make every effort to respond to complaints within three to five days to verify presence of algae.
If filamentous algae is confirmed, staff should complete Surber collection for wet-wrung biomass. Waterbodies with a wet-wrung biomass above an identified threshold should be considered for monthly monitoring (Surber sampling for wet-wrung biomass and benthic chlorophyll-a).
Monitoring sites should be established based on presence of algae, site accessibility, and suitable conditions (wadeable, etc.)
DEQ’s regional offices should prioritize monitoring based on available resources. DEQ acknowledges that there is a need to be strategic in the use of limited resources to collect data to support the assessment of the designated uses across the Commonwealth.
If included in the agency’s annual monitoring plan, algal monitoring should be completed monthly from May through October. It is recommended that monitoring occur in two consecutive years, or as soon as feasible within one six-year assessment data window.
Assessment considerationsTwo years of monitoring data must be used for assessment of benthic chlorophyll-a. If assessment results for two years conflict with each other, then that water body will be categorized as having insufficient data (Assessment Category 3) and a subsequent monitoring year will be required. In such cases, an assessment determination for benthic chlorophyll-a will be based on the results of two out of the three monitoring years that are in agreement. If a third year of data is needed, monitoring should occur as soon as feasible but within one six-year assessment data window.
Monitoring frequency: monthly monitoring during the growing season (May – October), with a minimum of three samples collected.
Monitoring duration: minimum of two years of data required for assessment. It is recommended that monitoring occur in two consecutive years. When this is not possible, the second year should occur as soon as feasible within one six-year assessment data window.
DEQ is considering the following as potentially indicative of a nuisance algal condition for the annual growing season:
o Two consecutive monthly samples above an identified chlorophyll-a threshold, oro Median of three samples above an identified chlorophyll-a threshold
Once a chlorophyll-a threshold is determined, DEQ would consider the reach impaired based on the above protocols if monitoring data demonstrate a nuisance algal condition in both monitoring
Final Guidance for 2018 IR Appendix I
105
years. Likewise, DEQ would consider the reach unimpaired based on the above protocols if a nuisance algal condition is not demonstrated in the two monitoring years that occur in the six-year assessment window.
If the assessment results for two monitoring years conflict with each other, then that segment would be categorized as having insufficient data (Assessment Category 3) and a subsequent monitoring year would be required. The third monitoring year should be scheduled as soon as feasible, but within one six-year assessment data window.
For reference: Approaches used in other states and literature WV impairment threshold for recreational impacts due to algae: 40% algal cover on any occasion, or 20%
algal cover three times.o Virginia places high value on developing monitoring methods that are objective, quantifiable,
defensible, repeatable, and accurate. While we believe there is a place for lateral transects that generate algal percent cover estimates in the agency’s algal monitoring strategy, we do not intend to use this method for impairment listing decisions. This is because lateral transect methods are subject to user bias and algal misidentification, and also lack the ability to easily quantify the volume of algae present in the system (a critical component, as it gets at the potential for recreational impact). DEQ prefers to instead rely on analytical data that provide an indication of algal biomass, such as chlorophyll-a or ash free dry mass measurements, to make decisions on recreational use impact and impairment.
Montana DEQ proposed chlorophyll-a threshold to support recreation: >150 mg/m2. Montana’s algae threshold was informed by a public survey.
Utah DEQ also conducted a public survey and arrived at identical conclusion to Montana DEQ. For both surveys, there was a clear line between what the public felt was suitable for recreation and what was unacceptable. 70% or more of the public felt that algae levels less than or equal to 150 mg chlorophyll-a /m2 (≤ 36 g AFDW/m2) were acceptable for recreation. But then a sharp threshold occurred, and only 30% or less of the public considered algae levels at or above the next level up — 200 mg chlorophyll-a /m2 (95 g AFDW/m2) — to be acceptable for recreation.
The literature-based ranges for chlorophyll-a thresholds for recreational nuisance designations are not extremely wide: 150 – 200 mg/m2 benthic chlorophyll-a.
Potential Roles for Citizen Groups DEQ engaged Shenandoah Valley citizen monitoring groups during the 2017 monitoring season. Two workshops were held to provide background information on the agency’s algal monitoring program, demonstrate monitoring techniques, and gather feedback from groups on potential points of collaboration. Citizen groups unanimously agreed that there was a place for their involvement in the algal monitoring process, but felt they were best utilized as additional eyes on the river to alert DEQ staff of potential problematic conditions. Citizen groups felt confident making bank estimates of algae, but not completing lateral transects or collecting Surber measurements.
DEQ recently awarded a 2018 Citizen Monitoring Grant to the Friends of the North Fork of the Shenandoah River to assist with algal observations along the Shenandoah River during the 2018 growing season.
Next StepsFollowing the conclusion of the public comment period for the 2018 Integrated Report Guidance Manual, DEQ will work with EPA Region 3 staff to coordinate a second algae summit with the other EPA Region 3 states to discuss our findings and whether or not a meaningful “nuisance” threshold can be identified based on the work completed to date.
Final Guidance for 2018 IR Appendix I
106