2018 investor day - s21.q4cdn.com · 9/30/2018 ttm net income available to common stockholders...
TRANSCRIPT


2018 Investor DayNovember 15, 2018

Welcome
John EganVice President - Investor Relations

Forward looking statements
4
Certain statements made by the company which are not historical facts may be considered forward-looking statements, including, without limitation, statements as to non-GAAP operating earnings, net income attributable to PFG, net cash flows, realized and unrealized gains and losses, capital and liquidity positions, sales and earnings trends, and management’s beliefs, expectations, goals and opinions. The company does not undertake to update these statements, which are based on a number of assumptions concerning future conditions that may ultimately prove to be inaccurate. Future events and their effects on the company may not be those anticipated, and actual results may differ materially from the results anticipated in these forward-looking statements. The risks, uncertainties and factors that could cause or contribute to such material differences are discussed in the company’s annual report on Form 10-K for the year ended Dec. 31, 2017, and in the company’s quarterly report on Form 10-Q for the quarter ended Sep. 30, 2018, filed by the company with the U.S. Securities and Exchange Commission, as updated or supplemented from time to time in subsequent filings. These risks and uncertainties include, without limitation: adverse capital and credit market conditions may significantly affect the company’s ability to meet liquidity needs, access to capital and cost of capital; conditions in the global capital markets and the economy generally; volatility or declines in the equity, bond or real estate markets; changes in interest rates or credit spreads or a sustained low interest rate environment; the company’s investment portfolio is subject to several risks that may diminish the value of its invested assets and the investment returns credited to customers; the company’s valuation of investments and the determination of the amount of allowances and impairments taken on such investments may include methodologies, estimations and assumptions that are subject to differing interpretations; any impairments of or valuation allowances against the company’s deferred tax assets; the company’s actual experience could differ significantly from its pricing and reserving assumptions; the pattern of amortizing the company’s DAC and other actuarial balances on its universal life-type insurance contracts, participating life insurance policies and certain investment contracts may change; changes in laws, regulations or accounting standards; the company may not be able to protect its intellectual property and may be subject to infringement claims; the company’s ability to pay stockholder dividends and meet its obligations may be constrained by the limitations on dividends Iowa insurance laws impose on Principal Life; litigation and regulatory investigations; from time to time the company may become subject to tax audits, tax litigation or similar proceedings, and as a result it may owe additional taxes, interest and penalties in amounts that may be material; applicable laws and the company’s certificate of incorporation and by-laws may discourage takeovers and business combinations that some stockholders might consider in their best interests; competition, including from companies that may have greater financial resources, broader arrays of products, higher ratings and stronger financial performance; a downgrade in the company’s financial strength or credit ratings; client terminations, withdrawals or changes in investor preferences; inability to attract and retain qualified employees and sales representatives and develop new distribution sources; an interruption in telecommunication, information technology or other systems, or a failure to maintain the confidentiality, integrity or availability of data residing on such systems; international business risks; fluctuations in foreign currency exchange rates; the company may need to fund deficiencies in its “Closed Block” assets; the company’s reinsurers could default on their obligations or increase their rates; risks arising from acquisitions of businesses; and loss of key vendor relationships or failure of a vendor to protect information of our customers or employees.

GAAP metricsPrincipal Financial Group, Inc.U.S. GAAP Financial Measures(in millions, except as indicated) Trailing 12 months
9/30/2013 9/30/2014 9/30/2015 9/30/2016 9/30/2017 9/30/2018 PFGNet income available to common stockholders 1 $861.2 $1,074.1 $1,226.1 $1,252.1 $1,786.6 $2,151.8
Net income diluted earnings per share $2.89 $3.53 $4.11 $4.27 $6.11 $7.39Weighted average common shares outstanding 2 297.7 298.7 298.5 292.8 292.7 290.0
Common stockholders' equity attributable to parent $8,736.4 $9,774.4 $9,620.3 $10,794.6 $11,996.4 $11,700.8Preferred stock 0.1 0.1 - - - -Preferred stock paid-in capital 541.9 541.9 - - - -Noncontrolling interest 95.0 52.6 65.5 69.2 70.9 67.9Stockholders' equity $9,373.4 $10,369.0 $9,685.8 $10,863.8 $12,067.3 $11,768.7
Average common stockholders' equity attributable to parent $8,977.6 $9,255.4 $9,697.4 $10,207.5 $11,395.5 $11,848.6Net income ROE available to common stockholders (including AOCI) 9.6% 11.6% 12.6% 12.3% 15.7% 18.2%
1 9/30/2018 TTM net income available to common stockholders benefited $568.3 million as a result of U.S. tax reform ; 9/30/2017 TTM net income available to common stockholders benefited $410.8 million as a result of real estate transactions.
2 Weighted average shares outstanding for the nine-months ended.3 This is a non-GAAP financial measure and is reconciled to GAAP on this page.5
Trailing 12 months 9/30/2013 9/30/2014 9/30/2015 9/30/2016 9/30/2017 9/30/2018
PFGNet income available to common stockholders 1 $861.2 $1,074.1 $1,226.1 $1,252.1 $1,786.6 $2,151.8Net realized capital (gains) losses 149.0 2.3 36.3 (173.4) (520.7) 3.1Net realized capital (gains) losses after-tax adjustments (21.6) 97.3 103.1 181.6 181.9 1.8Other after-tax adjustments 25.6 106.2 (74.2) 2.0 52.0 (524.5)
Non-GAAP operating earnings 3 $1,014.2 $1,279.9 $1,291.3 $1,262.3 $1,499.8 $1,632.2

GAAP metricsPrincipal Financial Group, Inc.U.S. GAAP Financial Measures(in millions, except as indicated)
1 This is a non-GAAP financial measure and is reconciled to GAAP on this page6
Trailing 12 months PFG 09/30/2018
Income (loss) before income taxes $1,856.3
Net realized capital (gains) losses 3.1
Net realized capital (gains) losses pre-tax adjustments 50.1
Pre-tax operating (earnings) losses attributable to noncontrolling interest (12.0)
Income taxes related to equity method investments 61.6
Principal Financial Group Foundation, Inc. contribution 70.0
Pre-tax operating earnings (losses) 1 $2,029.1
Trailing 12 months PFG 09/30/2018
Income taxes $(308.6)
Net realized capital gains (losses) tax adjustments 49.6
Income taxes attributable to noncontrolling interest (0.2)
Income taxes related to equity method investments 61.6
Other tax adjustments:
Principal Financial Group Foundation, Inc. contribution 26.2
Tax Cuts and Jobs Act 568.3
Income taxes1 $396.9

Trailing 12 months 9/30/2018
As reported Impact of 3Q18 actuarial assumption review
Excluding 3Q18 actuarial assumption review 1
Segment pre-tax operating earnings (losses)
RIS-Fee $549.0 $7.7 $541.3
Principal Global Investors 576.8 - 576.8
Principal International 279.8 (53.5) 333.3
Total Fee 1,405.6 (45.8) 1,451.4
RIS-Spread 362.0 11.5 350.5
Specialty Benefits 277.1 6.2 270.9
Individual Life 169.8 (15.5) 185.3
Total Risk 446.9 (9.3) 456.2
Pre-tax operating earnings (losses) excluding Corporate 2,214.5 (43.6) $2,258.1
Corporate (185.4) - (185.4)
Non-GAAP pre-tax operating earnings 2 $2,029.1 $(43.6) $2,072.7
Income taxes2 396.9 (22.1) 419.0
Non-GAAP operating earnings 2 $1,632.2 $(21.5) $1,653.7
GAAP metrics
71 This is a non-GAAP financial measure and is reconciled to GAAP on this page.2 This is a non-GAAP financial measure and the “as reported” figures are reconciled to GAAP on the previous slides.
Principal Financial Group, Inc.U.S. GAAP Financial Measures(in millions, except as indicated)

Use of non-GAAP financial measures
8
A non-GAAP financial measure is a numerical measure of performance, financial position, or cash flows that includes adjustments from a comparable financial measure presented in accordance with U.S. GAAP.
The company uses a number of non-GAAP financial measures management believes are useful to investors because they illustrate the performance of the company’s normal, ongoing operations which is important in understanding and evaluating the company’s financial condition and results of operations. While such measures are also consistent with measures utilized by investors to evaluate performance, they are not, however, a substitute for U.S. GAAP financial measures. Therefore, the company has provided reconciliations of the non-GAAP financial measures to the most directly comparable U.S. GAAP financial measure within the slides. The company adjusts U.S. GAAP financial measures for items not directly related to ongoing operations. However, it is possible these adjusting items have occurred in the past and could recur in future reporting periods. Management also uses non-GAAP financial measures for goal setting, as a basis for determining employee and senior management awards and compensation, and evaluating performance on a basis comparable to that used by investors and securities analysts.
The company also uses a variety of other operational measures that do not have U.S. GAAP counterparts, and therefore do not fit the definition of non-GAAP financial measures. Assets under management is an example of an operational measure that is not considered a non-GAAP financial measure.

AgendaTime Topic Presenter(s)
1:00 pm Welcome John Egan
1:05 pm CEO perspective Dan Houston
1:35 pm Panel discussion: Digital and technology Gary Scholten, Kara Hoogensen, Jerry Patterson, Renee Schaaf, Ellen Shumway
2:40 pm Break
2:50 pm Panel discussion: Business unit opportunities John Egan, Nora Everett, Amy Friedrich, Pat Halter, Luis Valdés
3:55 pm Financial update Deanna Strable
4:15 pm General Q&A Dan Houston, Deanna Strable, Nora Everett, Amy Friedrich, Pat Halter, Luis Valdés
4:45 pm Networking All presenters
9

CEO perspective
Dan HoustonChairman, President & Chief Executive Officer

Capitalize on key macroeconomic trends
• Era of personal responsibility
• Aging populationsand longer lifeexpectancies
• Wealth creation in emerging markets
Continue to deliver above market growth
• Retirement and long-term savings in the U.S., Latin America and Asia
• Asset management globally
• Protection in the U.S.
Address key challenges
• Fee pressures• Demand for low
cost investments• Competitive
landscape – at scale and non-traditional competition
Principal remains well-positioned to:
11

Strategic and integrated business mix
RIS - Fee RIS - Spread
Principal Global Investors
Principal International
U.S. Insurance Solutions
$2.3BPre-tax
operating earnings
15%
20%
26%
15%
24%
• We’re in the right businesses
• We’re in the right markets
• Integrated business model enhances results
Trailing twelve months as of 9/30/2018; excludes the impact of the 2018 actuarial assumption review; excludes Corporate12

The customer remains at the center of our strategy
13
Individuals
Our foundationCustomer Focus | Talent Development | Financial Strength | Integrity | Operational Excellence | Capital & Risk Management | Diversity & Inclusion | Social Responsibility
Customer IndividualsInstitutions
SMBs
Our customersSmall to Medium Sized Businesses (SMBs)We help businesses address risks and compete for talent, through insurance, retirement and other employee benefits.
Institutions
We help people save and invest; and protect against financial risks through insurance and guaranteed income.
We tailor investment solutions to client preferences, risk tolerances and long-term investment objectives.

Leading market positions• Top 40 global asset manager• Top 5 retirement & group benefits/leading SMB franchise (U.S.)• #1 pension (Latin America); #4 retail mutual funds (China)• Top 20 Advisor sold fund family (U.S.)
Strong investment performance• 89% of funds above median for 5 year performance1
• 80% of fund level AUM carries 4 or 5 star rating1
• Best Fund awards in Asia, Europe, Latin America and U.S.
Broad diversification• By customer type and geography• By asset class and solution set• By source of non-GAAP operating earnings:
Fee 64%, Spread 17%, Risk 20%2
Strong competitive positioning ‒ playing to our strengths
1 As of 9/30/182 Trailing twelve months ended 9/30/18. Excludes Corporate. Because of rounding, not all percentages add up to 100%.Sources: Plansponsor Recordkeeping Survey, July, 2018; LIMRA non-med survey, 2017; World’s 500 Largest Asset Managers, Willis Towers Watson, Oct. 2018; LatAm ranking based on AUM as of March 2018 among multi-country providers; East Money, June 2018;.Strategic Insight Flow Watch Series, Sept. 2018.14

Continue to execute efficiently and effectively
Enhancing our solution set• 100+ new funds launched in 2017 and 2018• ETF franchise now in top 25• Internos acquisition
Expanding our distribution network• More than 160 third party platform placements in 2017 and 2018• Alibaba/Ant Financial, Tencent, Paytm
Using technology to benefit customers and advisors• Multiple mobile rollouts in 2017 and 2018• Digital pension product launch in Brazil• RobustWealth acquisition
Advancing our brand• 9 percentage point increase in consumer awareness since 1Q17• Best employers/best places to work recognition• Most ethical company recognition
15

Continue to achieve above industry growth in AUM
161 Calculated based on local currencySource: The World’s 500 Largest Asset Managers, Willis Towers Watson, Oct. 2018; study based on results through 2017; ranking changes relate to rankings among top 50 firms
11.0%
8.3% 8.4%
Principal Top 20 globalasset managers
Top 500 globalasset managers
5 Year AUM CAGRs (2012-2017)1
Among top 50:• 15th fastest
growing firm• 11th largest ranking
increase (up 5 spots in 5 years)

Continue to prioritize revenue growth
17
Alternatives, active specialties and solutions continue to be key drivers
59%
86%
33%
11%
0%
10%
20%
30%
40%
50%
60%
70%
80%
90%
% of AUM growth % of Revenue growth
Industry AUM and revenue growth (2017-2022E) Passive Active core Alternatives,
active specialties & solutions
0
20
40
60
80
100
120
AUM growth Revenue growth($trillions) ($billions)
Source: Digital Metamorphosis, BCG, July 2018

Capitalizing on key trends

Era of personal responsibility
Responsibility for financial
security shifting to individuals
Aging populations,
longer life expectancies
Reinforces importance of
retirement readiness, and
critical nature of retirement income
solutions
Emerging market middle class population
growth New wealth creation
drives growth opportunity beyond
appreciation of existing assets and
taking market share
Informal employment
Prevalence of informal
employment in certain emerging markets coupled with expansion of
gig economy creating coverage
issues
Innovation and digitization
Changes to how people acquire and pay for goods and services; emergence of non-
traditional competitors represents threat; but
digitization also creates opportunity for differentiation
Revisiting and capitalizing on key trends
1 2 3 4 5
19

Era of personal responsibility
56%
54%
49%
47%
39%
34%
33%
29%
0% 10% 20% 30% 40% 50% 60% 70%
Brazil
China
U.S.
Thailand
Chile
Malaysia
Hong Kong
Mexico
1
Target is 70+% of income
Sources: For Brazil, Chile, and Mexico, Pensions at a Glance: Latin America and the Caribbean; for China, Global Aging Institute (GAI) calculations; for Hong Kong, Malaysia, and Thailand, Pensions at a Glance: Asia/Pacific 2013; for U.S., https://www.oecd.org/unitedstates/PAG2017-USA.pdf20
Insufficient income replacement spotlights need for long-term savings vehicles
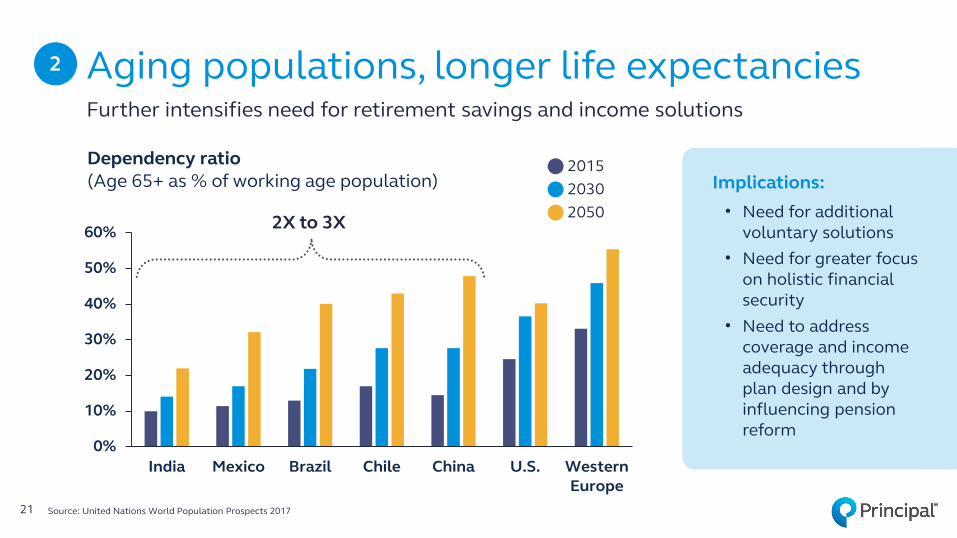
0%
10%
20%
30%
40%
50%
60%
India Mexico Brazil Chile China U.S. WesternEurope
Dependency ratio (Age 65+ as % of working age population)
Aging populations, longer life expectanciesFurther intensifies need for retirement savings and income solutions
2X to 3X
2
Implications:• Need for additional
voluntary solutions• Need for greater focus
on holistic financial security
• Need to address coverage and income adequacy through plan design and by influencing pension reform
Source: United Nations World Population Prospects 201721
2015 2030 2050

22
NorthAmerica
0.00.10.20.30.40.50.60.70.80.91.01.1
Rest of Asia
China
India
Asia Pacific
Middle East &North Africa
Sub-SaharanAfrica
Central &South America Europe
Implications:
• Resource allocation –Asia Pacific represents nearly 90% of expansion
• Need for solutions and distribution that can address local demand
• Need for accelerated investment in digital solutions
Growth of emerging market middle class3
Asia-Pacific dominates expansion
Regional contribution to next middle class billion 2015-2022E(Population in billions)
Source: The Unprecedented Expansion of the Global Middle Class, Brookings, Feb. 2017

“
Informal employment and gig economyPresents massive digital sales and advice opportunity
For hundreds of millions of workers, informality means a lack of access to finance
4
Source: Informal Economy, International Labour Organization, Apr. 201823
”93% are in emerging and developing countries
2 billion peoplework informally(>60% of world’s population)

Innovation and digitizationCreate important levers for growth
Benefits of AI, data analytics, digital experience technologies and cloud ecosystems:
• Better customer insights• Predictive capabilities• Improved decision
making• Improved customer
experience• Greater efficiency
5
Sources: Nine benefits of digital transformation in financial services, brandworkz, Aug. 2017; zdnet.com, Feb. 201724
71% 26% 20+billion
believe legacy systems slow development of new products & services
of companies that have embraced digital transformation are more profitable
internet-connected devices in 2020 (up nearly 220% from 2016)

Narrowing the focus

A global overviewSignificant opportunity for asset management industry overall
$0
$50
$100
$150
$200
$250
$300
$350
$400
2016 2025E
Global investable assets(in USD trillions)
Source: Asset & Wealth Management Revolution, PwC, 201726
Investable assets managed by asset management industry
Investable assets notmanaged by asset management industry
Projections:• Total global
investable assets up >$130 trillion (5.4% CAGR)
• Industry AUM up >$60 trillion (6.2% CAGR)
• Industry penetration increases from 40% to 42%

A regional overviewTrend toward equities and fixed income enhances opportunity($ in trillions)
65% 59% 50% 52%24%
12%4% 4% 37%
15%
23%37% 26%
11%
61%
Asia-Pacific
Japan MiddleEast &Africa
LatinAmerica
EasternEurope
$38
Cash heavy
$15 $8 $5 $4
Global
$167
Totalwealth
NorthAmerica
$56
Equityheavy
WesternEurope
$41
Balanced
Equities Bonds Cash & deposits
39%
17%
43%
70%
16%14%
39%
37%
25%
Source: BCG Global Wealth Market-Sizing Database, 2017. Note: Private financial wealth, including life insurance and pensions, is measured across all households. Because of rounding, not all percentages add up to 100. 27
Highlights:• More mature
markets have greater investment in equities and fixed income
• Less mature markets more cash heavy but with additional long-term potential

Principal Global Asset Management (GAM)
Institutional investors
High Net Worth/Retail investors
RobustWealth
Principal International
(PI) investment operations*
Principal Global
Investors (PGI)General Account
Global Strategy, Marketing &
Product
Retirement investors
Global Asset Management
28 *As permitted and in accordance with regulatory guidelines in the markets in which we operate.

#1 United States
• Total projected AUM growth dwarfs all other opportunities• SMB market remains massive opportunity for retirement and group benefits
#2 China and SE Asia
• China to become 2nd largest investment management market by 2030 (Casey Quirk projection)• Substantial upward trend in demand for asset management (AM) industry solutions• Strong new wealth creation
#3 Latin America
• Strong demand for AM industry solutions (particularly in Brazil and Mexico)• Opportunity to achieve leading share across markets• Pension reform bodes well for retirement and long-term savings businesses• Strong new wealth creation
#4 Europe• Strong current and expected future demand for AM industry solutions in the institutional
and high net worth markets• Continued strong demand for active strategies• Increasing cross border success in Dublin and Luxembourg
#5 India(longer-term)
• Highest projected growth rate• Increasing demand for AM industry solutions• Strong new wealth creation
Where we’ll compete
29

How we’ll win
Take market share
• Goal for all businesses
• Competitive pricing
• Delivering better outcomes
Technology, data and innovation
• Data analytics for underwriting, propensity to buy, customer segmentation
• Algorithm driven investment strategies
• Online: tools, education, 401k, IRA rollovers, insurance portal
30
Maximize existing block
• Innovative enrollment solutions
• Benefit event asset retention
• Cross-BU collaboration
• Mandatory/voluntary cross-purchase
Make the pie bigger
• New plan formation
• Under-served markets and geographies
Talent/workforce of the future
• Workplace flexibility; linking diversity & business outcomes
• Expanding leadership capabilities; succession preparedness

Q&A

Digital and technology
Gary ScholtenChief Information Officer & Chief Digital Officer
Panel discussion

Customerexperience
Directsales & advice
Businessefficiency
Investment process
Principal digital strategies
33
Digital infrastructure

Kara HoogensenVice PresidentGroup Benefits
On the panelRenee SchaafSenior Vice President & Chief Operating Officer Principal International
34
Jerry PattersonSenior Vice President Retirement & Income Solutions
Ellen ShumwaySenior Executive Director - Strategy & InvestmentsPrincipal Global Investors


Summary thoughts
• Digital is business strategy driven• 20%+ IRRs; benefits will emerge two-thirds through
revenue growth, one-third through expense efficiencies• Revenue growth will emerge from:
• New channels & new customer segments• Increased plan participation• Reduced lapses• Improved traditional distribution performance
• Benefits will start to emerge in 2019, but net digital impact will be at a similar level as 2018
• Proven ability to execute and focused on realizing benefits
36

Kara HoogensenVice PresidentGroup Benefits
Q&ARenee SchaafSenior Vice President & Chief Operating Officer Principal International
37
Jerry PattersonSenior Vice President Retirement & Income Solutions
Ellen ShumwaySenior Executive Director - Strategy & InvestmentsPrincipal Global Investors

Break

Business unit opportunities
John EganVice President – Investor Relations
Panel discussion

Retirement & Income Solutions
Principal Global Investors
U.S. Insurance Solutions
Principal International
Vision for our future…
Principal’s businesses
40

Nora EverettPresident Retirement & Income Solutions
On the panelLuis ValdésPresidentPrincipal International
41
Pat HalterPresidentPrincipal Global Investors
Amy FriedrichPresidentU.S. Insurance Solutions


Summary thoughts
Retirement & Income Solutions • Underserved target market –
half of all SMBs don’t currently have a retirement plan offering
• Largest retirement market –U.S. has almost double the assets of the next nine countries combined
• Ability to offer guaranteed products is a differentiator
Principal Global Investors• Strong investment performance
provides foundation for growth• Niche active management strategies
still very much in demand globally• Collaboration with RIS, PI and USIS
provides for unique opportunity set
Principal International• Growing opportunity set – our
current footprint covers half the world’s population
• Favorable demographics - growing demand for retirement and long-term savings products positions us for sustainable growth
• Our marquee partners offer us tremendous distribution capabilities
U.S. Insurance Solutions• Strategic importance for Principal
with over 90K SMB relationships• Specialty Benefits – focus on the
SMB market a big differentiator for Principal
• Individual Life - more than 50% of our sales focused on business owner and executive solutions
43

Nora EverettPresident Retirement & Income Solutions
Q&ALuis ValdésPresident Principal International
44
Pat HalterPresidentPrincipal Global Investors
Amy FriedrichPresidentU.S. Insurance Solutions

Financial update
Deanna StrableChief Financial Officer

Long-term focused growth strategy
Investing for the future
Strong financial position
What differentiates Principal?
1 As of 9/30/2018 TTM and excludes the impact of the 3Q 2018 actuarial assumption review. See appendix for non-GAAP financial measure reconciliations.46
Proven history of execution
10%+ average growth in non-GAAP operating earnings and earnings per diluted share (EPS)1
over the last 5 years
Committed to investment for growth through:
• Organic growth• M&A• Business capabilities
At one of our strongest financial positions as a public company

Coming from a position of strength
As of 9/30/20181 Return on equity excluding AOCI, other than foreign currency translation. Excludes the impact of the 3Q 2018 actuarial assumption review. This is a non-GAAP financial measure; see appendix for a reconciliation to the closest GAAP measure. 47
• Includes capital at Holdco, subsidiaries, and excess above a 420% RBC ratio
• Estimated RBC >450%
• No debt maturities until 2022
• Flexibility exists to increase the leverage ratio for the right opportunity
• A proven, diversified business model
• Strong result reflecting business mix and capital position
Over $2BExcess and available capital
20%Low debt-to-capital ratio
14.5%ROE1
Capital Leverage Profitability

12/31/2008 9/30/2018
NAIC 1 57% 69%
NAIC 2 38% 28%
NAIC 3 – 6 5% 4%
12/31/2008 9/30/2018Bond Equivalent Rating (A and above) 61% 92%
Current loan-to-value 62% 45%
Current debt service coverage 1.7x 2.6x
A diversified high quality portfolio
As of 9/30/20181 Other includes Equity Securities, Residential Mortgages, Real Estate, Policy Loans, Investment in Equity Method subs, Direct Finance Leases and Other Investments48
Fixed Maturities portfolio
Commercial Mortgage quality
Corporate Public Bonds
25%
Corporate Private Bonds17%
CMBS5%
Commercial Mortgages
17%
MBS7%
ABS8%
Government, Agency, State
& Political11%
Other1
7%Cash3%
$79BTotal U.S. invested
assets & cash

Intentional diversification & limited exposure to products with higher risksRIS - Fee
• Defined contribution and defined benefit
• Variable annuities• Trust
RIS - Spread• Fixed annuities• Pension risk transfer• GICs and MTNs• Bank
Principal Global Investors
• Institutional, retail, and high net worth
Principal International
• Pensions, mutual funds, asset management and annuities
U.S. Insurance Solutions
• Group dental, vision, life, critical illness, accident, and disability
• Individual disability • Individual life
$2.3BPre-tax
operating earnings
15%
20%
26%
15%
24%Products we’ve limited or managed our exposure to:
• Long-term care• Variable annuities• Products with minimum
interest rate guarantees
Trailing twelve months as of 9/30/2018; excludes the impact of the 2018 actuarial assumption review; excludes Corporate49

Targeted long-term capital deployment strategy
Capital deployed as a percent of net incomeCapital is prioritized:
• Grow the company organically and inorganically• Strong growth including PRT and
Group Benefits• Recent strategic acquisitions include: Mexico
Afore, SE Asia JV, Robust Wealth and PrinREEurope
• Return to shareholders• Raised dividend 11 consecutive times• Currently ~4% dividend yield
Every capital deployment opportunity is evaluated against a minimum return on our cost of capital
Disciplined capital management drives long-term shareholder value
External deployments;target 65-70% of net income
M&A and share repurchases
25-30%
Common stock
dividends40%
Organic growth30-35%
50

$377 $441 $465 $540
$447
$205
$275 $257 $193 $440 $180
$355
$40 $180
$130
$100 $94
2014 2015 2016 2017 3Q 2018YTD
Common Stock Dividends Share Repurchases Strategic Acquisitions Debt Reduction
3Q 2018YTD
$0.9B
78%of Net Income
77% of Net Income
89% of Net Income
65% of Net Income
69% of Net Income1
Highlights:• Over the past 5 years,
we’ve externally deployed nearly $5B of capital
• After prioritizing for organic growth, we expect to deploy 65–70% of net income per year over the long-term, with fluctuations in any given year
($ in millions)
External capital deployments
1 2017 net income excludes the benefits from a large real estate transaction and the U.S. Tax Cuts and Jobs Act51
$1.1B$0.9B $0.9B $1.0B

Strategic growth oriented business mix
Strong financial position
High quality asset portfolio and conservative liability profile
Balanced and disciplined approach to capital deployment
Experienced management team
Proven above market
long-term results
average growth in non-GAAP operating earnings and earnings per diluted share (EPS)110%+
50 bps average ROE expansion per year2
Proven results
1 CAGR 3Q 2013 - 3Q 2018 on a trailing twelve month basis; excludes the impacts of the 2018 actuarial assumption review2 5 year average as of 9/30/2018. Return on equity excluding AOCI, other than foreign currency translation. Excludes the impact of the 3Q 2018 actuarial
assumption review. This is a non-GAAP financial measure; see appendix for a reconciliation to the closest GAAP measure. 52

General Q&A

Nora EverettPresident Retirement & Income Solutions
Q&A
Luis ValdésPresident Principal International
54
Pat HalterPresidentPrincipal Global Investors
Amy FriedrichPresidentU.S. Insurance Solutions
Deanna StrableChief Financial Officer
Dan HoustonChairman, President & Chief Executive Officer

Thank you

Appendix

Non-GAAP financial measure reconciliations
57
Principal Financial Group, Inc.(in millions, except as indicated)
Trailing 12 months
PFG 09/30/2013 09/30/2014 09/30/2015 09/30/2016 09/30/2017 09/30/2018
Non-GAAP operating earnings 1 $1,014.2 $1,279.9 $1,291.3 $1,262.3 $1,499.8 $1,632.2
Actuarial assumption review - (39.0) (31.2) 48.2 42.9 21.5
Non-GAAP operating earnings excluding actuarial assumption review $1,014.2 $1,240.9 $1,260.1 $1,310.5 $1,542.7 $1,653.7
Average stockholders' equity attributable to parent $8,977.6 $9,255.4 $9,697.4 $10,207.5 $11,395.5 $11,848.6
Average net unrealized capital (gains) losses (997.2) (892.0) (1,027.8) (1,260.2) (1,470.5) (816.1)
Average net unrecognized postretirement benefit obligation 391.0 296.2 260.2 400.7 410.9 410.7
Average stockholders' equity x-AOCI other than foreign currency translation adjustment $8,371.4 $8,659.6 $8,929.8 $9,348.0 $10,336.0 $11,443.2
Per diluted share:
Net income $2.89 $3.53 $4.11 $4.27 $6.11 $7.39
Net realized capital (gains) losses 0.43 0.34 0.47 0.02 (1.16) 0.01
Other after-tax adjustments 0.09 0.35 (0.25) 0.01 0.17 (1.79)
Adjustment for redeemable noncontrolling interest - 0.07 - - - -
Non-GAAP operating earnings $3.41 $4.29 $4.33 $4.30 $5.12 $5.61
Actuarial assumption review - (0.13) (0.10) 0.17 0.14 0.08
Non-GAAP operating earnings excluding actuarial assumption review $3.41 $4.16 $4.23 $4.47 $5.26 $5.69
1 This is a non-GAAP financial measure and is reconciled to GAAP on slide 5.
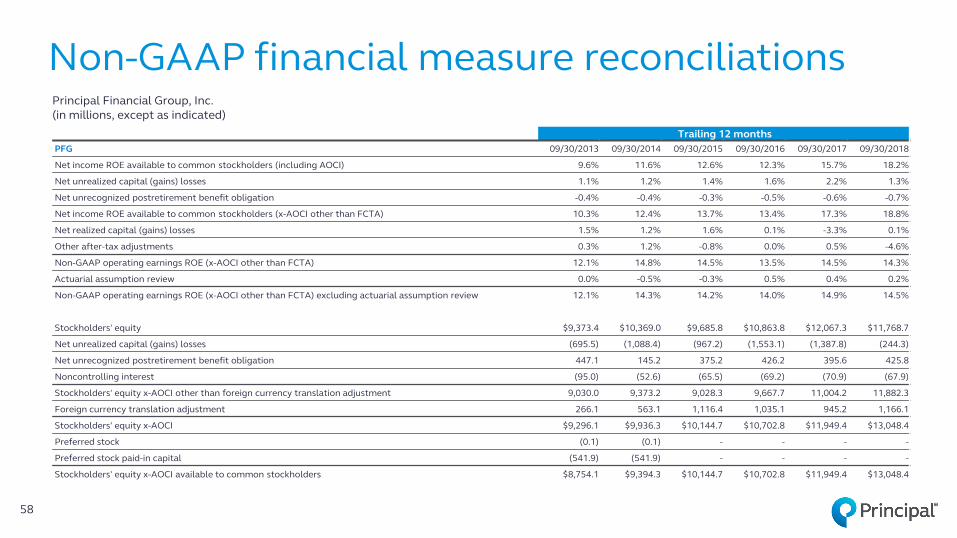
Non-GAAP financial measure reconciliations
58
Principal Financial Group, Inc.(in millions, except as indicated)
Trailing 12 months PFG 09/30/2013 09/30/2014 09/30/2015 09/30/2016 09/30/2017 09/30/2018
Net income ROE available to common stockholders (including AOCI) 9.6% 11.6% 12.6% 12.3% 15.7% 18.2%
Net unrealized capital (gains) losses 1.1% 1.2% 1.4% 1.6% 2.2% 1.3%
Net unrecognized postretirement benefit obligation -0.4% -0.4% -0.3% -0.5% -0.6% -0.7%
Net income ROE available to common stockholders (x-AOCI other than FCTA) 10.3% 12.4% 13.7% 13.4% 17.3% 18.8%
Net realized capital (gains) losses 1.5% 1.2% 1.6% 0.1% -3.3% 0.1%
Other after-tax adjustments 0.3% 1.2% -0.8% 0.0% 0.5% -4.6%
Non-GAAP operating earnings ROE (x-AOCI other than FCTA) 12.1% 14.8% 14.5% 13.5% 14.5% 14.3%
Actuarial assumption review 0.0% -0.5% -0.3% 0.5% 0.4% 0.2%
Non-GAAP operating earnings ROE (x-AOCI other than FCTA) excluding actuarial assumption review 12.1% 14.3% 14.2% 14.0% 14.9% 14.5%
Stockholders' equity $9,373.4 $10,369.0 $9,685.8 $10,863.8 $12,067.3 $11,768.7
Net unrealized capital (gains) losses (695.5) (1,088.4) (967.2) (1,553.1) (1,387.8) (244.3)
Net unrecognized postretirement benefit obligation 447.1 145.2 375.2 426.2 395.6 425.8
Noncontrolling interest (95.0) (52.6) (65.5) (69.2) (70.9) (67.9)
Stockholders' equity x-AOCI other than foreign currency translation adjustment 9,030.0 9,373.2 9,028.3 9,667.7 11,004.2 11,882.3
Foreign currency translation adjustment 266.1 563.1 1,116.4 1,035.1 945.2 1,166.1
Stockholders' equity x-AOCI $9,296.1 $9,936.3 $10,144.7 $10,702.8 $11,949.4 $13,048.4
Preferred stock (0.1) (0.1) - - - -
Preferred stock paid-in capital (541.9) (541.9) - - - -
Stockholders' equity x-AOCI available to common stockholders $8,754.1 $9,394.3 $10,144.7 $10,702.8 $11,949.4 $13,048.4

Daniel J. HoustonChairman, President & Chief Executive Officer
Daniel J. Houston is Chairman, President and Chief Executive Officer of Principal Financial Group®. He is responsible for overall management of the company.
Houston joined Principal® in 1984 in Dallas. He has held several management positions, being named Senior Vice President in 2000, Executive Vice President in 2006 and President of Retirement and Income Solutions in 2008. He was named President and Chief Operating Officer in 2014 before assuming his current role in 2015.
Houston is a member of several boards, including Greater Des Moines Partnership, Employee Benefits Research Institute (EBRI), American Council of Life Insurers (ACLI), Iowa State University Business School Dean’s Advisory Council, Partnership for a Healthier America (PHA) and Community Foundation of Greater Des Moines.
Houston received his bachelor’s degree from Iowa State University in 1984. He has appeared before the U.S. Senate Special Committee on Aging to discuss the importance of educating the workforce about the financial needs in retirement. Houston joined the joint forum of U.S. Senate Committees on Finance and Health, Education, Labor and Pensions to discuss “Private-Sector Retirement Savings Plans: What Does the Future Hold?” He also authored a chapter in “The Upside of Aging” published by John Wiley & Sons in 2014, on the keys to achieving financial security in retirement.
59

Deanna D. StrableExecutive Vice President & Chief Financial Officer
Deanna Strable is Executive Vice President and Chief Financial Officer with Principal Financial Group®. She plays a central role in driving and managing long-term strategies for innovation-fueled company growth, including responsibility for corporate strategy and capital markets. Strable joined the company in 1990 as an Actuarial Assistant. She held various actuarial and management roles within Principal® and specifically in the Principal’s insurance business from 1995 through 2016. Strable was promoted to President U.S. Insurance Solutions in 2015 and Executive Vice President in 2016. Strable’s current position was effective February 2017.
In addition to her role within Principal, Strable currently serves as past-chair of the Board of Directors for LIMRA LOMA Global (LL Global, Inc) and is a member of the Board of Directors for Simpson College. She also serves on United Way’s USA Board of Trustees after holding various positions for the United Way of Central Iowa.
A native of Iowa, Strable received her bachelor’s degree from Northwestern University in Evanston, Illinois. She is a Fellow of the Society of Actuaries and a member of the American Academy of Actuaries.
60

Gary P. ScholtenExecutive Vice President, Chief Information Officer & Chief Digital Officer
Gary P. Scholten is the Executive Vice President, Chief Information Officer and Chief Digital Officer of Principal Financial Group®. He’s responsible for overseeing the company’s use of Information Technology and driving digital strategy into all aspects of thebusiness. He also leads the company’s use of offshore resourcing and oversees sourcing and supplier management.
Scholten joined the company in 1980 as an Assistant Planning Analyst. He held multiple IT positions, was promoted to Senior Vice President and Chief Information Officer in 2002, and to Executive Vice President and Chief Information Officer in 2014. He became Chief Digital Officer in 2017.
Scholten is a fellow of the Life Office Management Institute and is past chair of the LOMA Individual Product Systems Committee. He chairs Principal Global Services, Private Limited, a wholly owned subsidiary of the Principal Financial Group located in Pune, India. Scholten currently serves on two Principal International Chilean Boards: Principal International de Chile S.A, and Principal Asset Management Chile S.A. Scholten has served as the chairman of the board for the Technology Association of Iowa. In 2011, he was appointed to serve on the Iowa Governor’s Science, Technology, Engineering and Mathematics (STEM) Advisory Council, and joined the group’s executive committee in 2013.
Under Scholten’s leadership, Principal® has consistently been ranked in the top half of Computerworld magazine’s “100 Best Places to Work in IT,” and InformationWeek magazine’s “Top 500 Most Innovative Users of Information Technology,” ranking as the number one company in 2006. Scholten received the University of Northern Iowa’s 2011 Alumni Achievement Award for his overall professional accomplishments.
A native of Larchwood, Iowa, Scholten received his bachelor’s degree from the University of Northern Iowa in Cedar Falls.
61

Nora M. EverettPresident, Retirement & Income Solutions
Nora Everett is President of Retirement and Income Solutions (RIS) and chairman of Principal Funds at Principal Financial Group®. She is responsible for U.S. retirement, annuity, broker-dealer and banking businesses at Principal®.
Everett joined Principal® in 1991 as an attorney and was promoted to Senior Vice President and Deputy General Counsel in 2004. She was promoted to Senior Vice President, Retirement and Investor Services and President of Principal Funds in 2008, and CEO of Principal Funds in 2010. Everett was promoted to her current position in 2015. Prior to joining Principal, she practiced law in Washington, D.C.
She earned her bachelor’s degree and Phi Beta Kappa honors from Iowa State University and her J.D. degree from William & Mary Law School. Everett serves on several boards, including Principal Funds, Principal International, Principal Asset Management Company (Asia) Limited in Hong Kong, Origin Asset Management, Finisterre Capital, United Way of Central Iowa, Community Foundation of Greater Des Moines and Greater Des Moines Partnership. She also serves on the Investment Company Institute’s Board of Governors.
62

Amy C. FriedrichPresident, U.S. Insurance Solutions
Amy C. Friedrich is president of U.S. Insurance Solutions with Principal Financial Group®.
Friedrich joined Principal® in 2000 in a performance improvement role for Corporate Strategic Development. Later, as a Director in that division, she helped define a long-term strategy for the specialty benefits division and in 2004, she moved into that area. Since then, she’s held many leadership roles, including second Vice President in 2006 and Vice President of Group Benefits in 2008. She took on oversight of individual disability insurance in 2015 when she was named a Senior Vice President. She assumed her current position in 2017
Prior to joining the company, she was a Change Management Manager with Accenture.
Friedrich is a native of Van Meter, Iowa and earned her bachelor’s degree in mass communication and philosophy from Buena Vista University in Storm Lake, Iowa and her master’s in organizational communication from Purdue University in West Lafayette, Ind.
63

Patrick G. Halter President & Chief Executive Officer, Principal Global Investors
Patrick G. Halter is the President and Chief Executive Officer for Principal Global Investors, the multi-boutique investment management firm within Principal’s Global Asset Management business. Halter is responsible for overseeing the firm’s operations, its 15 investment boutiques, and the fund and distribution teams.
Halter joined the company in 1984 in commercial real estate. In 2016, Halter was named Chief Operating Officer of Principal Global Investors, responsible for oversight of primary functions within the firm, including finance, strategic direction, operations, global firm relations, human resources and technology, as well as many of the investment boutiques. Today, he serves on the boards of the firm’s 15 investment boutiques, the Principal Mutual Fund Board, and has board responsibilities with various international ventures. Additionally, he has served as Chief Executive Officer for Principal Real Estate Investors, the dedicated real estate unit of Principal Global Investors, since 2003, with responsibility for overall strategy, business development and boutique management.
Halter is past Chairman of the Board of the National Association of Real Estate Investment Managers (NAREIM). He is a member of the Real Estate Roundtable and serves on the REPAC Steering Committee. He is also a member of the Pension and Real Estate Association (PREA), the Association of Foreign Investors in Real Estate (AFIRE) and serves on the Board of the Graaskamp Center for Real Estate at the University of Wisconsin.
Halter earned his bachelor’s degree in finance and marketing, and an MBA in finance from the University of Wisconsin.
64

Luis ValdésPresident & Chief Executive Officer, Principal International
Luis Valdés is President and Chief Executive Officer, Principal International. Previously he was President, Principal Financial Group Latin America (2010 – March 2011), supervising operations in Brazil, Chile and Mexico. Valdés also served as Regional Vice President Latin America and Spain, Principal International from 1998 through March 2010. Prior to joining Principal®, Valdés served in several positions as a public servant for the Chilean Government from 1980 through 1991, including his last appointment as Insurance Commissioner for Chile (1989 – 1991).
Valdés has been associated with Principal® since 1995 when he was managing director of BanRenta Compania de Segurosde Vida in Chile, and Principal signed its first joint venture in that country.
Valdés received his bachelor´s degree in physics and math (1980) and his degree of civil industrial engineering from the Universidad de Chile in Santiago (1982). He received his MBA degree from the IESE – Universidad de Navarra in Barcelona, Spain (1988).
Valdés has been an Insurance Market Consultant for the World Bank. He currently serves as Board Chair for BrasilPrevSeguros e Previdencia (Brazil). Valdés is also a member of the Executive Committee and the Honors Committee for the International Insurance Society (IIS). He has been a professor of Business Policy and Finance since 1988 at several universities. Valdés also served as a professor in a postgraduate program in Business at the ESE School Business of Universidad Los Andes.
65

Kara M. Kohler HoogensenVice President, Group Benefits
Kara M. Kohler Hoogensen is a Vice President with Principal Financial Group®. She has responsibility for the Group Benefits business within U.S. Insurance Solutions (USIS). In addition, Kara leads a team of strategists supporting the USIS and Retirement and Income Solutions (RIS) segments.
Kara joined Principal® in 1996 as a Junior Pension Underwriter. She was promoted to Assistant Pension Underwriter in 1998 and to Pension Consultant in 2000. After a year with Merck & Co., Inc. as a Professional Representative, Kara re-joined Principal in May 2001 as a Business Development Consultant. She was promoted to Business Development Officer in 2005 and Director of Business Development in 2006. In January 2007, she moved to the position of Strategy Director in Corporate Strategy. She joined Principal Funds in June 2008 as a Strategy Director. She expanded her responsibilities in February 2009 to assume strategy work for the RIS segment. Kara was named Director - Defined Contribution Investment Only (DCIO) in July 2011 and was promoted to Managing Director – Investment Only in March 2012. In September 2013, Kara also took on responsibilities for investment product development for Principal Funds. She was promoted to Chairman, President and CEO of Principal Bank and Principal Trust Company in June 2014 and became President and CEO of Principal Securities, Inc. in March 2015. From late 2015 through June 2018, she also led a cross-business unit team that navigated the largest regulatory change for the financial services industry since the 1970s (the Department of Labor fiduciary regulation). She assumed her current responsibilities in August 2017.
Kara received her bachelor’s degree from Central College in 1996. She has earned her Certified Employee Benefits Specialist (CEBS) designation from the International Foundation of Employee Benefits and Certified Investment Management Analyst (CIMA®) designation. Kara was named to the Des Moines Business Record’s “Forty Under Forty” in the spring of 2009 for her professional and civic accomplishments, was selected to attend the inaugural Fortune Most Powerful Women Next Gen Summit in December 2014 and attended the inaugural G100 Women’s Leadership Acceleration program in December 2016. She has continued participating in the G100 Women’s Leadership Network through June 2018.
66

Gerald (Jerry) PattersonSenior Vice President, Retirement & Income Solutions
Jerry Patterson has been a presence in the financial services industry for more than 25 years and has held diverse and senior roles at some of the nation’s largest financial institutions. Patterson currently serves as Senior Vice President, Retirement and Income Solutions with the Principal Financial Group® - leading the company’s retirement plan businesses. Key focus areas include delivering industry leading retirement plan record-keeping services, driving better retirement outcomes through more effective retirement plan designs, behavior-based education and engagement strategies as well as getting more Americans to understand and embrace the power of guaranteed retirement income and addressing the changing needs of workers across generations.
Patterson is a national speaker and writer on a broad range of topics, including financial and estate planning, behavioral finance, healthcare, wellness, generational trends, and retirement. He has been featured as a resident blogger for the Huffington Post where he focused on financial wellness and overcoming human nature to attain better financial security outcomes.
Patterson is an active participant in several industry and community organizations focused on retirement security and the arts. He is an active board member for the Insured Retirement Institute, Pyramid Theatre Company, Greater Des Moines Public Art Foundation (GDPAF), and Grand View College. Patterson’s education and early career centered on accounting and law. He is a member of the Kansas and Missouri bars. Follow Patterson @JerryWPatterson.
67

Renee SchaafSenior Vice President & Chief Operating Officer
Renee Schaaf is Senior Vice President and Chief Operating Officer for Principal International. In that role, she is responsible for global business development, strategy and operations in key emerging markets in Latin America and Asia. Renee collaborates with all Principal International member companies to advance their global pension and long-term savings businesses.
Prior to her current role, Schaaf was the Vice President of Strategic Planning and Business Development for Principal International, where she was responsible for multiple business development disciplines, including: product development, technology, marketing, distribution and customer experience.
In addition to her international work, Schaaf has held several leadership positions in various areas of the Principal Financial Group. Before joining Principal International, she was Vice President - Retirement and Investor Services where she was responsible for the U.S. midsized group solutions pension market segment. Product solutions included 401(k) defined contribution plans, defined benefit plans and ESOPs. Renee has considerable knowledge and experience in global pension policy, including voluntary and mandatory pension programs.
Renee earned her bachelor’s degree from Iowa State University, Ames, Iowa, and her MBA from Drake University, Des Moines, Iowa. She completed the Global Advanced Management Program from Northwestern University, Kellogg School of Management in 2016.
68

Ellen ShumwaySenior Executive Director, Strategy & Investments
Ellen Shumway is Senior Executive Director, Strategy and Investments for Principal Global Investors, the asset management arm of Principal Financial Group®.
In this capacity, she oversees two of Principal Global Investor’s boutique asset management businesses as well as strategy and global marketing and product development for Principal Global Asset Management. She sits on the Boards of Origin Asset Management, Finisterre Capital, and Robust Wealth.
Ellen joined Principal Global Investors in 2008 from her previous position as Vice President-Corporate Strategic Development for the Principal Financial Group. Her background includes 15 years at McKinsey & Company, Chicago, as a partner and leader in the firm’s North American insurance practice. Previously, she was an assistant treasurer at J.P. Morgan & Company, Inc.
Ellen received an MBA from the University of Chicago and a bachelor’s degree from Johns Hopkins University.
69

John EganVice President, Investor Relations
John Egan is Vice President, Investor Relations with the Principal Financial Group®.
Egan joined Principal® in 2010. Prior to joining the company, he most recently served as Vice President, Investor Relations with Assurant Inc., and Vice President and Financial Analyst with Assurant Asset Management.
Egan earned his bachelor’s degree in accounting from Manhattan College and his M.B.A. in finance from St. John’s University. He serves as a board member of Nippon Life Benefits, Operation Downtown Des Moines and is also a member of the National Investor Relations Institute (NIRI).
70

Contact page
71
John EganVice President, Investor [email protected]
Eddie VonnahmeDirector, Investor [email protected]
Cindy KreuderAssistant Director, Investor [email protected]
Lorna WieskampAdministrative [email protected]
This presentation is available on our website: www.principal.com/investor.
Mail711 High StreetDes Moines, IA 50392