2018 mid-atlantic commercial vegetable production ... · a general production recommendations this...
TRANSCRIPT
A General Production Recommendations
This is a section from the
2018
Mid-Atlantic
Commercial Vegetable
Production Recommendations
The manual, which is published annually, is NOT for home gardener use.
The full manual, containing recommendations specific to New Jersey, can be found on the Rutgers
NJAES website in the Publications section:
http://njaes.rutgers.edu/pubs/publication.asp?pid=E001.
The label is a legally-binding contract between the user and the manufacturer. The user must follow all
rates and restrictions as per label directions. The use of any pesticide inconsistent with the label directions
is a violation of Federal law.
Cooperating Agencies: Rutgers, The State University of New Jersey, U.S. Department of Agriculture, and County Boards of
Chosen Freeholders. Rutgers Cooperative Extension, a unit of the Rutgers New Jersey Agricultural Experiment Station, is an
equal opportunity program provider and employer.

B Soil and Nutrient Management
29
B. Soil and Nutrient Management
1. Soils The best soils for growing vegetables have well drained, deep mineral topsoil with a relatively high percentage of
organic matter (> 2%). Soil pH has been modulated through cycles of cultivation with lime and gypsum as needed
and fertility levels (N-P-K) have been augmented as needed. Sandy loam or loamy sand soil textures are generally
best suited for growing early market crops, since they are more accessible to machinery and workers during periods
of high moisture. Loam and silt loam soils are generally better suited for growing crops for later fresh market use
or for processing. Deep, well-drained muck soils are ideally suited for growing leafy vegetables, bulb, and root
crops. The better suited the crop is to your soil, the greater chance of producing a successful crop. If you plant crops
that require well-drained soils on poorly drained soils, you are doomed to failure regardless of your growing skills.
Typical BMPs (Best Management Practices) include a good soil management program, proper liming and
fertilization, good tillage practices, crop rotation, annual supplements of organic matter, and adequate irrigation.
Using winter cover crops and periodically resting the land with the use of summer cover crops between vegetable
plantings are essential to prevent the deterioration of soil structure and to retain topsoil. Note: BMPs are similar to
the Good Agricultural Practices (GAPs) described in chapter A, and share many elements. BMPs are aimed at
consistently high crop yields and quality, whereas GAPs are focused on avoidance of food safety deterrents.
Soil Tests The most economical means of determining the lime and fertilizer needs of your soil is to have it tested. You can
generally obtain soil sample kits or containers and instructions through your local Extension Office.
If you do not know the present fertility level of the soil in a field, your application rates of lime and fertilizer
materials are likely to be inaccurate. For most efficient production, application rates of lime and fertilizer materials
should consider the existing soil fertility level, past cropping and soil management practices, and the crop to be
grown. Taking this approach also minimizes the potential for soil damage and water pollution. Knowing soil nutrient
contents makes it less likely fertilizers and organic nutrients sources are applied when they are not needed, saving
the cost of unneeded materials.
Lime and fertilizer recommendations from a soil testing laboratory are based on the soil test results, the crop to
be grown, past cropping, liming, and fertilization practices; information you supply with the soil sample
questionnaire when submitting the sample. For this reason, it is very important that you supply accurate information
about the history and future use of the field along with the soil sample.
If you have a special problem related to soil drainage, tillage, or past history, inform your Extension
Agent/Educator when you pick up the soil sampling kit or container, so he/she can advise you if any special tests
are needed. The Agent/Educator will also be aware of the cost of the various soil testing services performed by the
soil testing laboratory.
2. Liming Soils Most soils in the mid-Atlantic region are naturally acidic or become acidic under crop production systems and
rainfall. If soils become too acidic (generally pH less than 6.0), crop performance is hindered by many factors,
including reduced availability of plant nutrients. A regular liming program is required to neutralize soil acidity and
to supply crops with calcium and magnesium. The first step in a liming program is knowing the optimum or target
value of the crop to be grown. Many crops will grow over a wide range of soil pH, but most vegetable crops perform
best when soils are in the pH 6.0 to 7.0 range. Plan rotations such that all crops grown on a given field have similar
pH and nutrient requirements. The target pH values and the low pH limits suitable for vegetable crop production
are listed in Table B-1.
Soil pH alone cannot be used to determine the amount of liming material needed to correct soil pH. Information
on soil texture and fertility is also required. Soil test results provide all of the data needed to determine the lime
requirement and the type of lime to use when using soil-water pH. Alternatively, many state and private labs now
use buffer solutions to extract active and reserve acidity for pH determination. Buffer solutions reduce interference
that commonly occurs when substantial amounts of soluble salts are in the soil solution. When using buffer pH,
calibrated charts along with the buffer pH can solely be used for lime requirement determination.
B Soil and Nutrient Management
30
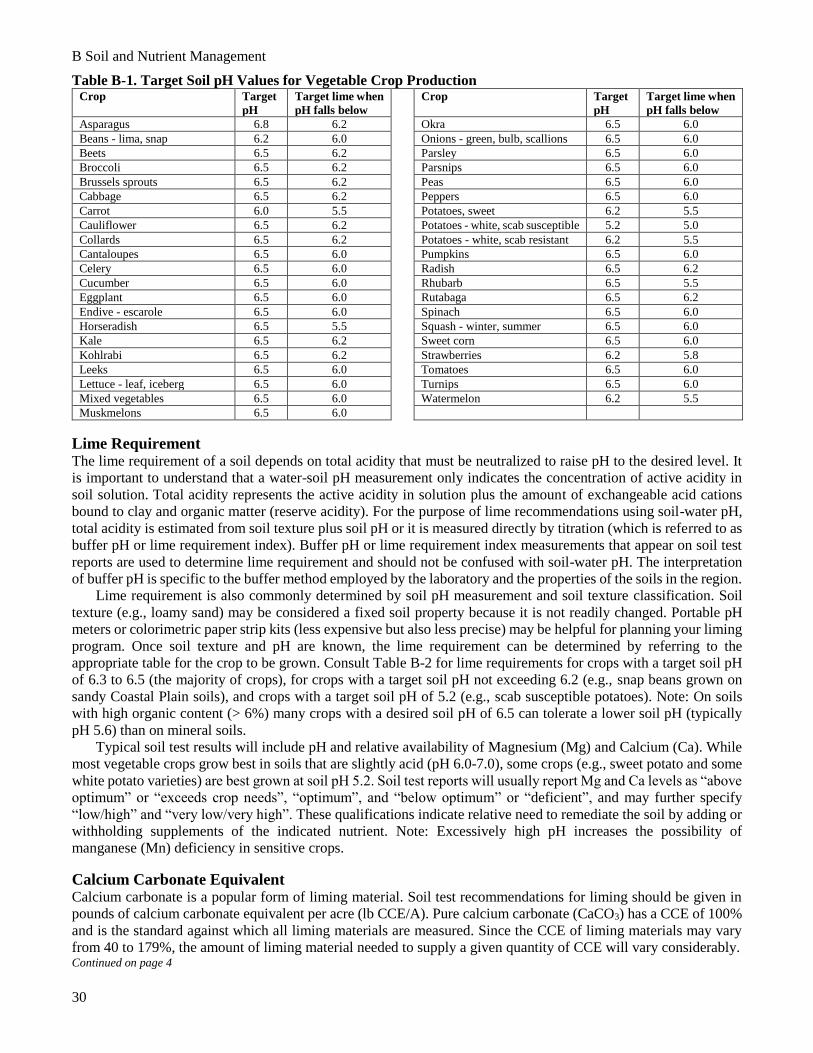
Table B-1. Target Soil pH Values for Vegetable Crop Production Crop Target
pH
Target lime when
pH falls below
Crop Target
pH
Target lime when
pH falls below
Asparagus 6.8 6.2 Okra 6.5 6.0
Beans - lima, snap 6.2 6.0 Onions - green, bulb, scallions 6.5 6.0
Beets 6.5 6.2 Parsley 6.5 6.0
Broccoli 6.5 6.2 Parsnips 6.5 6.0
Brussels sprouts 6.5 6.2 Peas 6.5 6.0
Cabbage 6.5 6.2 Peppers 6.5 6.0
Carrot 6.0 5.5 Potatoes, sweet 6.2 5.5
Cauliflower 6.5 6.2 Potatoes - white, scab susceptible 5.2 5.0
Collards 6.5 6.2 Potatoes - white, scab resistant 6.2 5.5
Cantaloupes 6.5 6.0 Pumpkins 6.5 6.0
Celery 6.5 6.0 Radish 6.5 6.2
Cucumber 6.5 6.0 Rhubarb 6.5 5.5
Eggplant 6.5 6.0 Rutabaga 6.5 6.2
Endive - escarole 6.5 6.0 Spinach 6.5 6.0
Horseradish 6.5 5.5 Squash - winter, summer 6.5 6.0
Kale 6.5 6.2 Sweet corn 6.5 6.0
Kohlrabi 6.5 6.2 Strawberries 6.2 5.8
Leeks 6.5 6.0 Tomatoes 6.5 6.0
Lettuce - leaf, iceberg 6.5 6.0 Turnips 6.5 6.0
Mixed vegetables 6.5 6.0 Watermelon 6.2 5.5
Muskmelons 6.5 6.0
Lime Requirement The lime requirement of a soil depends on total acidity that must be neutralized to raise pH to the desired level. It
is important to understand that a water-soil pH measurement only indicates the concentration of active acidity in
soil solution. Total acidity represents the active acidity in solution plus the amount of exchangeable acid cations
bound to clay and organic matter (reserve acidity). For the purpose of lime recommendations using soil-water pH,
total acidity is estimated from soil texture plus soil pH or it is measured directly by titration (which is referred to as
buffer pH or lime requirement index). Buffer pH or lime requirement index measurements that appear on soil test
reports are used to determine lime requirement and should not be confused with soil-water pH. The interpretation
of buffer pH is specific to the buffer method employed by the laboratory and the properties of the soils in the region.
Lime requirement is also commonly determined by soil pH measurement and soil texture classification. Soil
texture (e.g., loamy sand) may be considered a fixed soil property because it is not readily changed. Portable pH
meters or colorimetric paper strip kits (less expensive but also less precise) may be helpful for planning your liming
program. Once soil texture and pH are known, the lime requirement can be determined by referring to the
appropriate table for the crop to be grown. Consult Table B-2 for lime requirements for crops with a target soil pH
of 6.3 to 6.5 (the majority of crops), for crops with a target soil pH not exceeding 6.2 (e.g., snap beans grown on
sandy Coastal Plain soils), and crops with a target soil pH of 5.2 (e.g., scab susceptible potatoes). Note: On soils
with high organic content (> 6%) many crops with a desired soil pH of 6.5 can tolerate a lower soil pH (typically
pH 5.6) than on mineral soils.
Typical soil test results will include pH and relative availability of Magnesium (Mg) and Calcium (Ca). While
most vegetable crops grow best in soils that are slightly acid (pH 6.0-7.0), some crops (e.g., sweet potato and some
white potato varieties) are best grown at soil pH 5.2. Soil test reports will usually report Mg and Ca levels as “above
optimum” or “exceeds crop needs”, “optimum”, and “below optimum” or “deficient”, and may further specify
“low/high” and “very low/very high”. These qualifications indicate relative need to remediate the soil by adding or
withholding supplements of the indicated nutrient. Note: Excessively high pH increases the possibility of
manganese (Mn) deficiency in sensitive crops.
Calcium Carbonate Equivalent Calcium carbonate is a popular form of liming material. Soil test recommendations for liming should be given in
pounds of calcium carbonate equivalent per acre (lb CCE/A). Pure calcium carbonate (CaCO3) has a CCE of 100%
and is the standard against which all liming materials are measured. Since the CCE of liming materials may vary
from 40 to 179%, the amount of liming material needed to supply a given quantity of CCE will vary considerably. Continued on page 4

B Soil and Nutrient Management
31
Table B-2. Pounds of Calcium Carbonate Equivalent (CCE) Recommended per Acre
For Crops with a Target Soil pH of 6.5
Soil Texture and Fertility
Initial Soil pH Loamy Sand Sandy Loam Loam Silt Loam Clay Loam
4.1-4.4 4,500 5,400 9,800 11,600 23,300
4.5-4.8 3,600 4,500 8,100 9,800 18,800
4.9-5.2 2,700 3,600 6,300 8,100 15,200
5.3-5.6 1,800 2,700 4,500 6,300 12,500
5.7-6.0 900 1,800 3,600 4,500 8,100
6.1-6.4 500 900 1,800 3,600 5,400
Above 6.5 0 0 0 0 2,700
For Crops with a Target Soil pH of 6.2
Soil Texture and Fertility
Initial Soil pH Loamy Sandy Sandy Loam Loam Silt Loam Clay Loam
4.1-4.4 4,000 4,500 8,000 8,900 20,600
4.5-4.8 3,100 3,600 6,300 7,100 16,100
4.9-5.2 2,200 2,700 4,500 5,400 12,500
5.3-5.6 1,300 1,800 2,700 3,600 9,800
5.7-6.0 500 900 1,200 1,800 5,400
Above 6.5 0 0 0 0 2,700
For Potato Varieties with a Target Soil pH of 5.2
Soil Texture and Fertility
Initial Soil pH Loamy Sandy Sandy Loam Loam Silt Loam
4.5 630 990 1,350 1,790
4.6 540 810 1,160 1,520
4.7 450 630 940 1,250
4.8 360 540 760 990
4.9 270 450 540 760
5.0 180 270 400 490
5.1 90 100 180 270
5.2 0 0 0 0
Table B-3. Conversion of Recommended Calcium Carbonate Equivalent to Recommended Limestone CCE (lb/A)
Recommended
by Soil Test
Percent Calcium Carbonate Equivalent (% CCE) of Liming Material
70 75 80 85 90 95 100 105
Actual Limestone Recommendation (lb/A)1,2
1,000 1,400 1,300 1,200 1,200 1,100 1,100 1,000 1,000
2,000 2,900 2,700 2,500 2,400 2,200 2,100 2,000 1,900
3,000 4,300 4,000 3,700 3,500 3,300 3,200 3,000 2,900
4,000 5,700 5,300 5,000 4,700 4,400 4,200 4,000 3,800
5,000 7,100 6,700 6,200 5,900 5,600 5,300 5,000 4,800
6,000 8,600 8,000 7,500 7,100 6,700 6,300 6,000 5,700
7,000 10,000 9,300 8,700 8,200 7,800 7,400 7,000 6,700
8,000 11,400 10,700 10,000 9,400 8,900 8,400 8,000 7,600
9,000 12,000 12,000 11,200 10,600 10,000 9,500 9,000 8,600
10,000 14,300 13,300 12,500 11,800 11,100 10,500 10,000 9,500
11,000 15,700 14,700 13,700 12,900 12,200 11,600 11,000 10,500
12,000 17,100 16,000 15,000 14,100 13,300 12,600 12,000 11,400
13,000 18,600 17,300 16,200 15,300 14,400 13,200 13,000 12,400
14,000 20,000 18,700 17,500 16,500 15,600 14,700 14,000 13,300 1The amounts of CCE recommended in the table are for increasing the pH of an 8-inch soil layer to the desired pH value.
Multiply the numbers in the table by 1.25 to adjust a 10-inch plow layer to the desired pH. 2It is not advisable to apply more
than the following lb/A of CCE as a topdressing: loamy sand 2,000, sandy loam 3,000, loam 4,000, and silt loam 5,000.
If fields are to be plowed and the CCE recommendation exceeds 3,000 lb/A, plow under half the needed amount and apply
the other half after plowing and then disk in as deeply as possible.
B Soil and Nutrient Management
32
Calcium Carbonate Equivalent - continued By law, the CCE of a liming material must be stated on the product label. To determine the application rate of
liming material in CCE, refer to Table B-3 or use the following calculation:
Actual amount of liming material required = Soil test CCE recommendation / % CCE of liming material x 100
Example: The soil test recommends applying 2,000 lb CCE/A and the liming material purchased has 80% CCE.
Actual amount of liming material required per acre = 2,000/80 x 100 = 2,500 lb/A
Table B-3 may be used instead of the formula to convert soil test recommendations for lb CCE/A to lb of the actual
liming materials to be applied. Find your soil test limestone recommendation in the left-hand column, then read
across the table on the line until you come to the column headed by the percent CCE nearest to that of your liming
material. Application rates may be rounded off to the nearest 500 lb/A practical for spreading equipment. Although
liming recommendations should now be given in lb CCE/A, recommendations that are given as total oxides can be
converted to CCE by multiplying by 1.79. Example: If the recommendation calls for 2,000 lb/A of total oxides, the
recommendation for lb CCE/A is: 2,000 x 1.79 = 3,580 lb CCE/A.
Selection of Liming Material Liming materials neutralize soil acidity, supply calcium (Ca) and supply or increase available magnesium (Mg).
Selection of the appropriate liming material based on its Ca and Mg concentrations is a key to furnishing crops and
soils with sufficient amounts of these nutrients. The goal of a liming program is to establish the desired soil pH and
to maintain the soil fertility levels for Mg and Ca in the optimum range.
Fine-sized liming materials are recommended when rapid neutralization of soil acidity is desired. Medium and
coarse-sized liming materials are best suited for maintenance of soil pH once the desired soil pH range has been
attained through the use of fine-sized liming material. When soil pH is low, soil test levels of Ca and Mg may be
below optimum or deficient. It is important to choose a liming material that contains a significant concentration of
Mg; these liming materials are commonly referred to as dolomitic type or dolomite. If the soil Mg level is below
optimum-very low or -low, use a liming material that has a minimum concentration of 9% Mg. If the soil Mg level
is below optimum-medium, use a dolomitic liming material that has 3.6 to 9% Mg. If the soil Mg level is optimum
or above optimum or exceeds crop needs, use a calcitic or calcite liming material that has less than 3.6% Mg.
Occasionally soils test below optimum or deficient in Mg or Ca, but do not need lime for pH adjustment. For
soils needing Mg, apply Epsom salt (9.9% Mg) or sulfate of potash magnesia (21.8% Mg). If soil pH is appropriate
for the crop, but the soil test Mg level is below optimum-very low, apply 30 lb/A of Mg from a Mg fertilizer. If Mg
is below optimum-low, apply 15 lb/A of Mg. If soil pH is satisfactory for the crop, but the Ca level is below
optimum-very low, apply 350 lb/A of Ca (=1500 lb/A of gypsum). If the pH is satisfactory, but Ca is below
optimum-low, apply 175 lb/A of Ca (=750 lb/A of gypsum).
Timing of Application Lime is slow to react in soil. The desired increase in soil pH may require several months. Thus, it is important to
plan ahead and apply lime several months in advance of planting. Lime can be applied at any time of the year. Plan
ahead and apply lime well in advance of planting crops that are sensitive to soil acidity. Fall applications have the
advantage of allowing the lime to react in the soil prior to the start of the next growing season.
Careful attention to liming prior to planting perennial crops such as asparagus is important. Once the crop is
established, it is virtually impossible to correct a soil pH problem using surface applications of lime. Lime should
be applied at least six months to a year in advance of planting to ensure that the target pH has been achieved.
Soils naturally become more acidic over time. The frequency of prescribed lime application varies with soil
characteristics, cropping system, and fertilizer practice. Heavy use of ammonium and urea N fertilizers accelerates
soil acidification. Soil pH testing should be performed every1 to 3 years. Relime soils before pH drops below the
desired range to avoid development of excess acidity.
Lime Placement Lime applications are most effective at neutralizing acidity when they are spread uniformly and thoroughly mixed
with the soil by plowing, disking, and harrowing. When applying large amounts of lime, it is best to use split
applications. Apply half the lime and plow it under. Next, apply the other half to the plowed surface and disk it into
the soil as deeply as possible up to 24 inches.

B Soil and Nutrient Management
33
Whenever conventional tillage is not practiced (e.g., perennial crops, conservation tillage systems), surface
applications are recommended but the rate of pH change is much slower than for conventionally tilled soils. Monitor
soil pH change and the need for lime to avoid higher lime requirements. Surface lime application rates should not
exceed 3,000 lb CCE/A .
For crops using plastic or organic mulches, lime should be applied and incorporated prior to bedding rows. It is
ineffective and not recommended to apply lime after plastic mulch has been laid.
Special Considerations Potato scab is caused by the soil-inhabiting fungus Streptomyces scabies. The disease is suppressed in acid soils
(pH <5.2), so increase of soil pH with lime favors development of scab. When lime is needed, it is best to apply the
lime after potato harvest and before the other crops grown in rotation. The optimum soil pH for growing scab
susceptible potato varieties is about 5.0 to 5.2. Scab resistant potato varieties may be grown at pH 5.5 to 6.2.
Cabbage, broccoli, and leafy greens are subject to infection by the clubroot fungus Plasmodiophora brassicae.
If clubroot is known to be present, cole crops should be grown at pH 6.5 to 7.0. The disease is also suppressed at
pH 7.2 to 7.4 but crop production and/or quality may be decreased at the higher pH range.
Spinach requires an initial pH of 6.5 to 6.7 for good growth and leaf quality. Soil Ca levels should be medium
or optimum and in balance with Mg. Plan ahead and adjust pH, Ca, and Mg the season before planting spinach.
Lime and Fertilizer Lime and fertilizer work together to produce high yields and better crops. Lime is not a substitute for fertilizer, and
fertilizer is not a substitute for lime. The proper use of the two together makes for profitable vegetable crop
production. The rate and frequency of their use depends on the crop to be grown, type of soil, soil acidity, and past
use of fertilizer materials. The availability of nutrients is adversely affected by pH less than 5.0 or greater than 8.0.
3. Plant Nutrients
Many factors influence the nutrient requirements for optimum yield and quality of a given vegetable crop. The
original source of soil particles, textural classification, cation exchange capacity, organic matter content, and
drainage are important soil properties that influence the rates of nutrients applied to vegetables. In addition, rainfall
amounts and distribution, irrigation types and management, and soil and air temperatures during the growing season
can alter the retention, availability, and uptake of nutrients. Varieties of the same crop species often differ
significantly in their nutrient requirements. Test soils to determine the kinds and amounts of pre-plant fertilizer
nutrients required for optimum production. During the growing season, sap and tissue testing should be used when
they have been shown to be effective to adjust nutrient applications to current growing conditions and the nutrient
status of the crop.
Pennsylvania growers will receive soil test results directly from the Agricultural Analytical Services
Laboratory, College of Agriculture, The Pennsylvania State University; http://agsci.psu.edu/aasl. In years
when soil tests are not taken, growers in Pennsylvania should use Tables B-4, as described below. Growers
in Delaware, Maryland, New Jersey, Virginia and West Virginia should use Table B-4, as described below.
See important notes and discussion in the Plant Nutrient Recommendations section below to adjust
nutrient rates and timing based on soil type, cation exchange capacity, cropping and manure history, and
soil temperatures.
Soil Fertility Test Interpretation A soil fertility test evaluates the nutrient-supplying power of a soil. The results of the test are used to predict if, or
how much fertilizer is required for optimum plant growth. Soil fertility categories include: below optimum or
deficient, optimum, and above optimum or exceeds crop needs. Below optimum is divided into subcategories: very
low, low, and medium. These soil fertility categories gauge the probability of a beneficial response to the addition
of a given nutrient (assuming that other factors such as temperature, moisture and disease are not limiting growth).
The critical factor is the soil test level below which a crop response to a nutrient application may be expected, and
the level above which no crop response is expected. Crop yields may decrease at very high soil nutrient levels.
B Soil and Nutrient Management
34
Soil Test Categories
The basic soil test categories for management of soil Calcium (Ca), Magnesium (Mg), Phosphorus (P) and
Potassium (K) are: “below optimum” or “deficient”, “optimum”, and “above optimum” or “exceeds crop needs”.
For limestone recommendations, these categories indicate the concentrations of Ca and Mg most suitable for use as
a liming material. Soil test categories, along with crop nutrient requirements, are the basis for nutrient
recommendations. For example, when the soil test category for K is below optimum-low or deficient the
recommendation will indicate how much K to apply. The amount of K recommended however, depends on the crop.
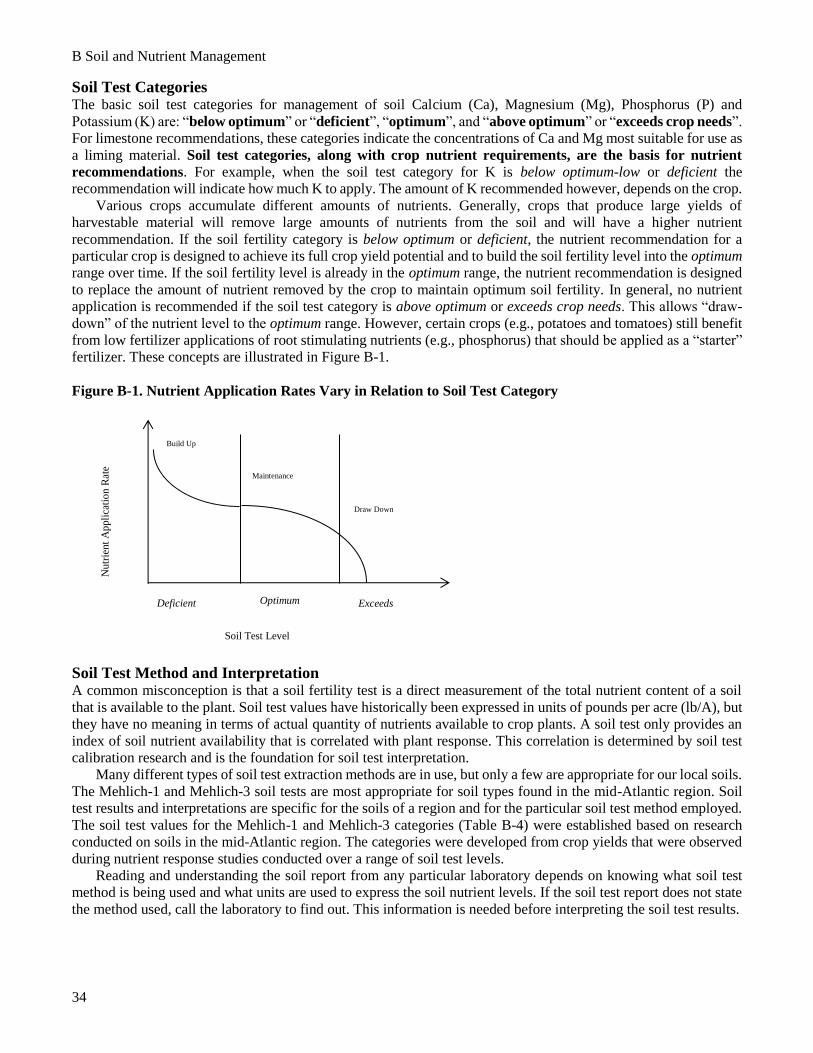
Various crops accumulate different amounts of nutrients. Generally, crops that produce large yields of
harvestable material will remove large amounts of nutrients from the soil and will have a higher nutrient
recommendation. If the soil fertility category is below optimum or deficient, the nutrient recommendation for a
particular crop is designed to achieve its full crop yield potential and to build the soil fertility level into the optimum
range over time. If the soil fertility level is already in the optimum range, the nutrient recommendation is designed
to replace the amount of nutrient removed by the crop to maintain optimum soil fertility. In general, no nutrient
application is recommended if the soil test category is above optimum or exceeds crop needs. This allows “draw-
down” of the nutrient level to the optimum range. However, certain crops (e.g., potatoes and tomatoes) still benefit
from low fertilizer applications of root stimulating nutrients (e.g., phosphorus) that should be applied as a “starter”
fertilizer. These concepts are illustrated in Figure B-1.
Figure B-1. Nutrient Application Rates Vary in Relation to Soil Test Category
Soil Test Method and Interpretation A common misconception is that a soil fertility test is a direct measurement of the total nutrient content of a soil
that is available to the plant. Soil test values have historically been expressed in units of pounds per acre (lb/A), but
they have no meaning in terms of actual quantity of nutrients available to crop plants. A soil test only provides an
index of soil nutrient availability that is correlated with plant response. This correlation is determined by soil test
calibration research and is the foundation for soil test interpretation.
Many different types of soil test extraction methods are in use, but only a few are appropriate for our local soils.
The Mehlich-1 and Mehlich-3 soil tests are most appropriate for soil types found in the mid-Atlantic region. Soil
test results and interpretations are specific for the soils of a region and for the particular soil test method employed.
The soil test values for the Mehlich-1 and Mehlich-3 categories (Table B-4) were established based on research
conducted on soils in the mid-Atlantic region. The categories were developed from crop yields that were observed
during nutrient response studies conducted over a range of soil test levels.
Reading and understanding the soil report from any particular laboratory depends on knowing what soil test
method is being used and what units are used to express the soil nutrient levels. If the soil test report does not state
the method used, call the laboratory to find out. This information is needed before interpreting the soil test results.
Nutr
ien
t N
utr
ien
t A
pp
lica
tion
Ra
te
Build Up
Maintenance
Draw Down
Deficient Optimum Exceeds
Soil Test Level
Nu
trie
nt
Ap
pli
cati
on R
ate
B Soil and Nutrient Management
35
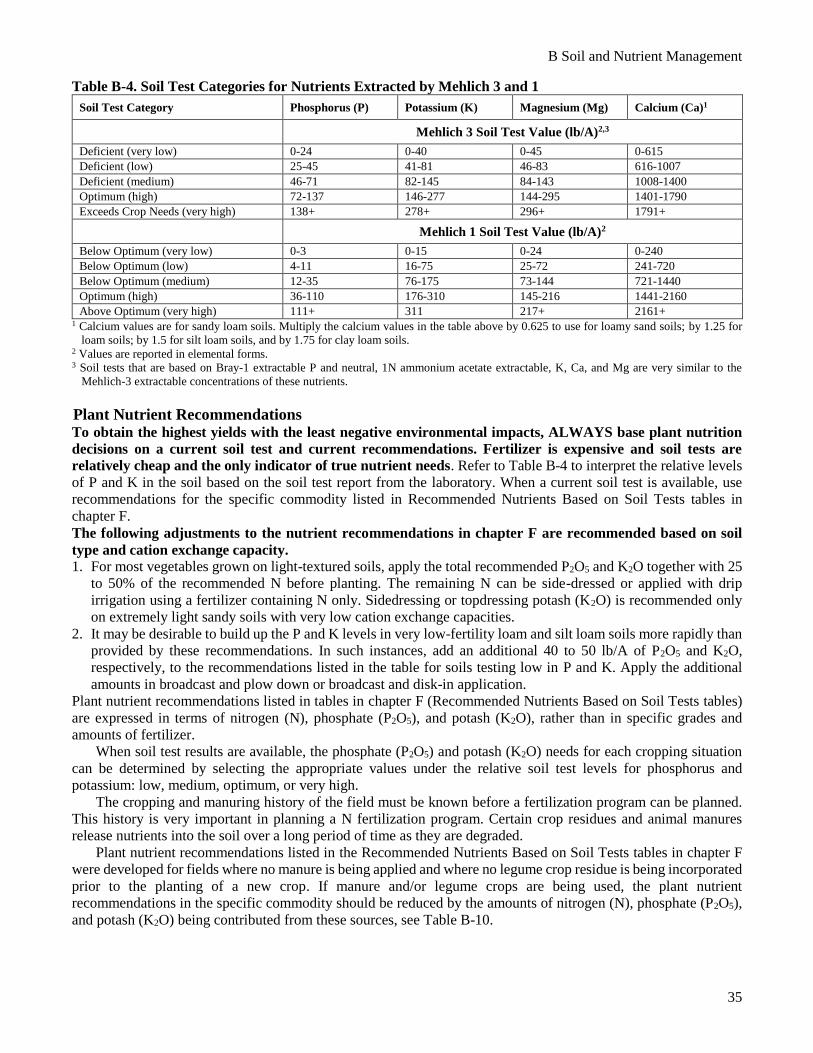
Table B-4. Soil Test Categories for Nutrients Extracted by Mehlich 3 and 1
Soil Test Category Phosphorus (P) Potassium (K) Magnesium (Mg) Calcium (Ca)1
Mehlich 3 Soil Test Value (lb/A)2,3
Deficient (very low) 0-24 0-40 0-45 0-615
Deficient (low) 25-45 41-81 46-83 616-1007
Deficient (medium) 46-71 82-145 84-143 1008-1400
Optimum (high) 72-137 146-277 144-295 1401-1790
Exceeds Crop Needs (very high) 138+ 278+ 296+ 1791+
Mehlich 1 Soil Test Value (lb/A)2
Below Optimum (very low) 0-3 0-15 0-24 0-240
Below Optimum (low) 4-11 16-75 25-72 241-720
Below Optimum (medium) 12-35 76-175 73-144 721-1440
Optimum (high) 36-110 176-310 145-216 1441-2160
Above Optimum (very high) 111+ 311 217+ 2161+ 1 Calcium values are for sandy loam soils. Multiply the calcium values in the table above by 0.625 to use for loamy sand soils; by 1.25 for
loam soils; by 1.5 for silt loam soils, and by 1.75 for clay loam soils. 2 Values are reported in elemental forms. 3 Soil tests that are based on Bray-1 extractable P and neutral, 1N ammonium acetate extractable, K, Ca, and Mg are very similar to the
Mehlich-3 extractable concentrations of these nutrients.
Plant Nutrient Recommendations To obtain the highest yields with the least negative environmental impacts, ALWAYS base plant nutrition
decisions on a current soil test and current recommendations. Fertilizer is expensive and soil tests are
relatively cheap and the only indicator of true nutrient needs. Refer to Table B-4 to interpret the relative levels
of P and K in the soil based on the soil test report from the laboratory. When a current soil test is available, use
recommendations for the specific commodity listed in Recommended Nutrients Based on Soil Tests tables in
chapter F.
The following adjustments to the nutrient recommendations in chapter F are recommended based on soil
type and cation exchange capacity. 1. For most vegetables grown on light-textured soils, apply the total recommended P2O5 and K2O together with 25
to 50% of the recommended N before planting. The remaining N can be side-dressed or applied with drip
irrigation using a fertilizer containing N only. Sidedressing or topdressing potash (K2O) is recommended only
on extremely light sandy soils with very low cation exchange capacities.
2. It may be desirable to build up the P and K levels in very low-fertility loam and silt loam soils more rapidly than
provided by these recommendations. In such instances, add an additional 40 to 50 lb/A of P2O5 and K2O,
respectively, to the recommendations listed in the table for soils testing low in P and K. Apply the additional
amounts in broadcast and plow down or broadcast and disk-in application.
Plant nutrient recommendations listed in tables in chapter F (Recommended Nutrients Based on Soil Tests tables)
are expressed in terms of nitrogen (N), phosphate (P2O5), and potash (K2O), rather than in specific grades and
amounts of fertilizer.
When soil test results are available, the phosphate (P2O5) and potash (K2O) needs for each cropping situation
can be determined by selecting the appropriate values under the relative soil test levels for phosphorus and
potassium: low, medium, optimum, or very high.
The cropping and manuring history of the field must be known before a fertilization program can be planned.
This history is very important in planning a N fertilization program. Certain crop residues and animal manures
release nutrients into the soil over a long period of time as they are degraded.
Plant nutrient recommendations listed in the Recommended Nutrients Based on Soil Tests tables in chapter F
were developed for fields where no manure is being applied and where no legume crop residue is being incorporated
prior to the planting of a new crop. If manure and/or legume crops are being used, the plant nutrient
recommendations in the specific commodity should be reduced by the amounts of nitrogen (N), phosphate (P2O5),
and potash (K2O) being contributed from these sources, see Table B-10.
B Soil and Nutrient Management
36
When warm season crops, such as sweet corn, tomatoes, peppers, eggplants, and vine crops are seeded or
transplanted and soil temperatures are below 65°F (18°C), 20 lb/A of P2O5 may be applied to replace phosphorus
removed by the crop when soil test levels for phosphorus are above optimum or exceeds crop needs.
Once the final fertilizer nutrient needs are determined, it will be necessary to determine the grade and rate of
fertilizer needed to fulfill these requirements. For example, if the plant nutrient requirements that need to be added
as a commercial fertilizer are 50 lb of N, 100 lb of P2O5, and 150 lb of K2O, you would need a fertilizer with a 1:2:3
ratio, e.g., a 5-10-15, 6-12-18, or 7-14-21. Once you have selected the grade of fertilizer, the amount needed to
fulfill the plant nutrient requirement can be determined by dividing the amount of the nutrient needed per acre by
the respective percentage of N, P2O5, or K2O in the fertilizer, and multiplying the answer by 100. For example, if
you choose a 5-10-15 fertilizer grade to supply the 50 lb of N, 100 lb of P2O5, and 150 lb of K2O needed, you can
calculate the amount of 5-10-15 fertilizer needed as follows: Divide the amount of N needed per acre (50 lb) by the
percentage of N in the 5-10-15 fertilizer (5%), and multiply the answer by 100; the answer is 1,000 lb.
This same system can be used for converting any plant nutrient recommendations into grades and amounts of
fertilizer needed. When you use this system, it is possible for you to select your fertilizer needs based on the most
economical fertilizer grades available to you. In cases where the preferred grade is not available, it is also possible
to change from one fertilizer grade to another, providing the plant nutrient ratio is the same. This flexibility may be
necessary because of a shortage of some fertilizer materials.
4. Nutrient Management
Plants remove substances from the soil and air to enable them to grow and reproduce. The specific substances they
remove are termed nutrients. Certain nutrients (macronutrients) are generally required in larger quantities.
Nutrients needed in smaller quantities (micronutrients) are often as important as macronutrients for achieving
desired results. Most commercial fertilizers contain the macronutrients N, P, and K, expressed as a weighted
percentage (N-P2O5-K2O). Micronutrients may be supplied along with macronutrients.
Nitrogen Management Nitrogen (N) is one of the most difficult nutrients to manage in vegetable production systems. N is readily leached
or can be tied-up by soil microbes, can be lost to the atmosphere if not quickly incorporated, and is lost under water-
saturated soil conditions. Due to the numerous N loss pathways, N is not routinely tested by state soil testing
laboratories for making crop recommendations. Instead, N recommendations are based on years of fertilizer trials
and yield potential. N application timings, application methods, and sources are also commonly tested in state
fertilizer trials and have resulted in recommendations for splitting N fertilizer for increased fertilizer use efficiency.
Heavy rainfall, higher than normal yield, and following non-legume cover crops are just a few examples of
situations where N fertilizer may be tied-up, lost from the production system, or another application of N is
warranted. Tissue testing is the best option when deciding if and how much more N is needed to meet expected
yields. Soil testing laboratories can provide N concentrations of plant materials with quick turnaround times to aid
in N application decisions.
Phosphorus Management In general, crops are very likely to respond to phosphorus (P) fertilization if dictated necessary by soil tests. Soil
test P levels of deficient or below optimum-very low, low, or medium indicate a strong response to P fertilizer. Crops
in soils testing optimum may or may not respond to further additions, but P may be applied to maintain the fertility
level in the optimum range (P fertilizer applied at crop removal rates). Crops in soils with levels in the exceeds crop
needs or above optimum-very high categories may also respond to P fertilizer if conditions are favorable for high
yields or plants have slow growing and/or shallow root systems. Tomato and potato are classic examples of crops
benefiting from P fertilizer additions on very high soil test P concentrations.
It is often recommended that a band of P fertilizer be placed near the seed/transplant as a starter fertilizer
regardless of the P fertility level. Banded P is especially helpful at low soil test P levels, however, overall field rates
should not be decreased. When the soil test level is deficient or below optimum, P should generally be applied as a
combination of broadcast and banded methods. Even at P soil test levels that are very high-above optimum or
exceeds crop needs, a small amount of banded P may benefit crop establishment. Many test results describe soils
as above optimum or exceeds crop needs due to previous fertilizer and manure applications. When
B Soil and Nutrient Management
37
applied in excess of crop removal, P accumulates in the soil. P is strongly adsorbed to soil particles and very little
is subject to loss via leaching. In high concentrations, soil P will also interact with ionic micronutrients, such as
zinc, to alter availability of P to the plant. If the soil test report indicates that P levels are above optimum or exceeds
crop needs, crop and site-specific factors will determine if P fertilizer should still be applied, but the general
recommendation under those circumstances is that soils should receive very little or no P fertilizer.
Potassium Management Crops are very likely to respond to K fertilizer when the soil test indicates that K is deficient or below optimum-very
low or low. A soil testing below optimum-medium in K may or may not respond to K fertilizer. Soils testing optimum,
above optimum or exceeds crop needs are unlikely to respond to K fertilizer, but it may be recommended to apply
K to maintain the soil fertility level in the optimum range.
In general, most of K fertilizer should be broadcast. When the fertility level is below optimum or deficient, it
may be advantageous to apply a portion of the total K application as a band. There is generally no benefit to applying
banded K when soil fertility levels are optimum or above optimum or exceeds crop needs. In loamy sand and sand
textured soils, split applications of K may be beneficial and may be applied using side-dress applications or applied
through trickle irrigation.
Crops remove larger amounts of K than P from the soil during a growing season. In addition, sandy soils have
low reserves of K, and K is susceptible to leaching. Therefore, frequent applications of K are needed to maintain K
at an optimum fertility level.
Secondary and Micronutrient Management Calcium (Ca), magnesium (Mg), and sulfur (S) are included in the secondary element group. Ca may be deficient
in soils that were not properly limed, where excessive amounts of potash fertilizer were used, and/or where crops
are subjected to drought stress. Of these 3 elements, Mg is the most likely to be deficient in soils. Dolomitic or high-
Mg limestone should be used for liming soils that are low in Mg. On low-Mg soils where lime is not needed, Mg
should be applied in fertilizer. Magnesium may be applied as a foliar spray to supply Mg to crops in emergency
situations. Contact your county Extension Agent/Educator for recommendations regarding scenarios that do not
conform to these common soil nutrient ranges.
Sulfur is an important plant nutrient, especially for the onion family and cole crops. S may become deficient on
light, sandy soils. S deficiencies may develop as more air pollution controls are installed and with the continued use
of high-analysis fertilizers with low S content. S concentrations greater than 5 ppm are associated with increased
pungency in sweet Spanish onions, and low soil S will result in reduced pungency. S can be supplied by application
of S-containing fertilizers, e.g., Gypsum (Calcium Sulfate) or Epsom Salt (Magnesium Sulfate), see Table B-5.
Micronutrients Boron (B) is the most widely deficient micronutrient in vegetable crop soils. Deficiencies of this element are
most likely to occur in the following crops: asparagus, most bulb and root crops, cole crops, and tomatoes. See
Table B-7 for B recommendations for various crops based on soil or plant tissue test results. Use of excessive
amounts of B can be very toxic to plant growth. DO NOT exceed recommendations listed in Table B-7 and in the
Recommended Nutrients Based on Soil Tests tables for specific commodities in chapter F (note: in chapter F, Boron
recommendations may be listed in a footnote under the Recommended Nutrients Based on Soil Test table).
Manganese (Mn) deficiency often occurs in plants growing on soils that have been over-limed with a pH above
7.0. A broadcast application of 20 to 30 lb/A or a band application of 4 to 8 lb/A of Mn will usually correct the
deficiency. When Mn is applied as manganese sulfate, foliar application of 0.5 to 1 lb/A of Mn in 20 gal of water/A
in one to three applications usually will help relieve the deficiency. Use a sulfate or chelate of Mn. Do not apply
lime or poultry manure to such soils until the pH has dropped below 6.5, and be careful not to over-lime again.
Molybdenum (Mb) deficiency in cauliflower (whiptail) may develop when this crop is grown on soils that are
more acid than pH 5.5. Liming acid soils to a pH of 6.0 to 6.5 will usually prevent the development of Mb
deficiencies in vegetable crops.
Deficiencies of other micronutrients in vegetable crops in the mid-Atlantic region are rare; and when present,
are usually caused by over-liming or other substandard soil management practices. Contact your county Extension
Agent/Educator for advice if you suspect a deficiency of zinc, iron, copper, or chlorine in your crops. Sources of
fertilizers for the essential plant nutrients may be found in Tables B-5 and 6.
B Soil and Nutrient Management
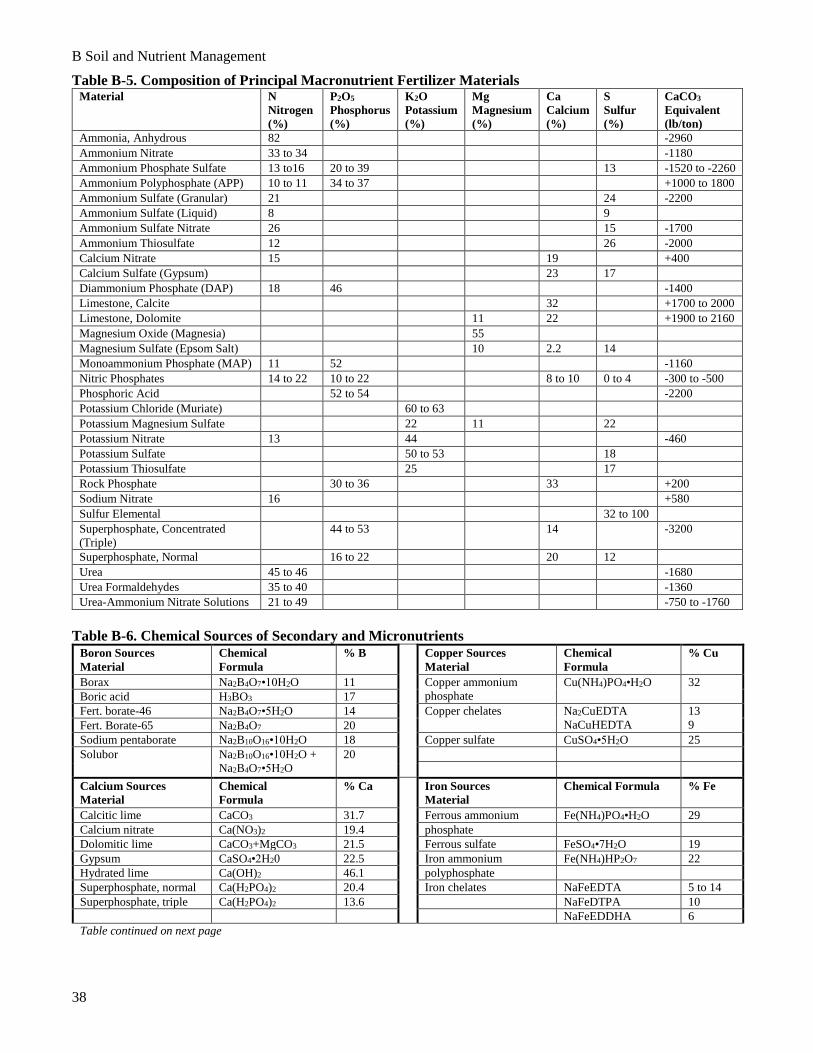
38
Table B-5. Composition of Principal Macronutrient Fertilizer Materials Material N
Nitrogen
(%)
P2O5
Phosphorus
(%)
K2O
Potassium
(%)
Mg
Magnesium
(%)
Ca
Calcium
(%)
S
Sulfur
(%)
CaCO3
Equivalent
(lb/ton)
Ammonia, Anhydrous 82 -2960
Ammonium Nitrate 33 to 34 -1180
Ammonium Phosphate Sulfate 13 to16 20 to 39 13 -1520 to -2260
Ammonium Polyphosphate (APP) 10 to 11 34 to 37 +1000 to 1800
Ammonium Sulfate (Granular) 21 24 -2200
Ammonium Sulfate (Liquid) 8 9
Ammonium Sulfate Nitrate 26 15 -1700
Ammonium Thiosulfate 12 26 -2000
Calcium Nitrate 15 19 +400
Calcium Sulfate (Gypsum) 23 17
Diammonium Phosphate (DAP) 18 46 -1400
Limestone, Calcite 32 +1700 to 2000
Limestone, Dolomite 11 22 +1900 to 2160
Magnesium Oxide (Magnesia) 55
Magnesium Sulfate (Epsom Salt) 10 2.2 14
Monoammonium Phosphate (MAP) 11 52 -1160
Nitric Phosphates 14 to 22 10 to 22 8 to 10 0 to 4 -300 to -500
Phosphoric Acid 52 to 54 -2200
Potassium Chloride (Muriate) 60 to 63
Potassium Magnesium Sulfate 22 11 22
Potassium Nitrate 13 44 -460
Potassium Sulfate 50 to 53 18
Potassium Thiosulfate 25 17
Rock Phosphate 30 to 36 33 +200
Sodium Nitrate 16 +580
Sulfur Elemental 32 to 100
Superphosphate, Concentrated
(Triple)
44 to 53 14 -3200
Superphosphate, Normal 16 to 22 20 12
Urea 45 to 46 -1680
Urea Formaldehydes 35 to 40 -1360
Urea-Ammonium Nitrate Solutions 21 to 49 -750 to -1760
Table B-6. Chemical Sources of Secondary and Micronutrients Boron Sources
Material
Chemical
Formula
% B Copper Sources
Material
Chemical
Formula
% Cu
Borax Na2B4O7•10H2O 11 Copper ammonium
phosphate
Cu(NH4)PO4•H2O 32
Boric acid H3BO3 17
Fert. borate-46 Na2B4O7•5H2O 14 Copper chelates Na2CuEDTA
NaCuHEDTA
13
9 Fert. Borate-65 Na2B4O7 20
Sodium pentaborate Na2B10O16•10H2O 18 Copper sulfate CuSO4•5H2O 25
Solubor Na2B10O16•10H2O +
Na2B4O7•5H2O
20
Calcium Sources
Material
Chemical
Formula
% Ca Iron Sources
Material
Chemical Formula % Fe
Calcitic lime CaCO3 31.7 Ferrous ammonium Fe(NH4)PO4•H2O 29
Calcium nitrate Ca(NO3)2 19.4 phosphate
Dolomitic lime CaCO3+MgCO3 21.5 Ferrous sulfate FeSO4•7H2O 19
Gypsum CaSO4•2H20 22.5 Iron ammonium Fe(NH4)HP2O7 22
Hydrated lime Ca(OH)2 46.1 polyphosphate
Superphosphate, normal Ca(H2PO4)2 20.4 Iron chelates NaFeEDTA 5 to 14
Superphosphate, triple Ca(H2PO4)2 13.6 NaFeDTPA 10
NaFeEDDHA 6
Table continued on next page

B Soil and Nutrient Management
39
Table B-6. Chemical Sources of Secondary and Micronutrients - continued
Magnesium Sources
Material
Chemical Formula % Mg Sulfur Sources
Material
Chemical
Formula
% S
Dolomitic lime MgCO3+CaCO3 11.4 Ammonium sulfate (NH4)2SO4 24
Epsom salt MgSO4•7H2O 9.6 Ammonium thiosulfate (NH4)2S2O3 26
Magnesia MgO 55.0 Gypsum CaSO4•2H2O 16.8
Potassium-Mg sulfate K2SO4•2MgSO4 11.2 Potassium-Mg-sulfate K2SO4•2MgSO4 22.0
Potassium thiosulfate K2S2O3 17
Sulfur, elemental S 32 to 100
Manganese Sources
Material
Chemical Formula % Mn Zinc Sources
Material
Chemical
Formula
% Zn
Manganese chelate MnEDTA 12 Zinc carbonate ZnCO3 52
Manganese oxide MnO 41 to 68 Zinc chelates Na2ZnEDTA
NaZnHEDTA
14
9 Manganese sulfate MnSO4•4H2O 26 to 28
Zinc oxide ZnO 78
Zinc sulfate ZnSO4•H2O 35
Molybdenum Sources
Material
Chemical
Formula
% Mo
Ammonium molybdate (NH4)6Mo7O24•2H2O 54
Molybdenum trioxide MoO3 66
Sodium molybdate Na2MoO4•2H2O 39
Table B-7. Boron Recommendations Based on Soil Tests for Vegetable Crops
Interpretation of Boron Soil Tests
Crops that often need additional Boron1
Boron (B)
Recommendations
(lb/A)2
Parts per
Million
Pounds
per Acre
Relative
Level
0.0-0.35 0.0-0.70 Low
Beets, broccoli, Brussels sprouts, cabbage, cauliflower,
celery, rutabaga, and turnips
3
Asparagus, carrots, eggplant, horseradish, leeks,
muskmelons, okra, onions, parsnips, radishes, squash,
strawberries, sweet corn, tomatoes, and white potatoes
2
Peppers and sweet potatoes
1
0.36-0.70 0.71-1.40 Medium
Beets, broccoli, Brussels sprouts, cabbage, cauliflower,
celery, rutabaga, and turnips
1.5
Asparagus, carrots, eggplant, horseradish, leeks,
muskmelons, okra, onions, parsnips, radishes, squash,
strawberries, sweet corn, tomatoes, and white potatoes
1
>0.70 >1.40 High
All crops
0
1If boron deficiency is suspected in vegetable crops not listed above, a soil and/or plant tissue test should be made and used as a basis for
treatment recommendations. 2Approximate conversion factors to convert elemental boron (B) to different boron sources:
Boron (B) x 9 = borax (11.36% B); boron (B) x 7=fertilizer borate granular (14.3% B); boron (B) x 6.7 = fertilizer borate 48 (14.91% B);
boron (B) x 5 = fertilizer borate 65 (20.2% B) or Solubor (20.5% B); boron (B) x 4.7 = fertilizer borate 68 (21.1% B).
Note. The most practical way to apply boron as a soil application is as an additive in mixed fertilizer bought
specifically for the crop or field where it is needed. Do not use fertilizer containing more than 0.5 lb B per ton of
fertilizer for crops not listed above, unless specifically recommended. To avoid possible boron toxicity damage to
crops, apply boron in broadcast fertilizer rather than in bands or as a side-dressing. Boron may be broadcast pre-plant
as a soluble spray alone or with other compatible soluble chemicals.
B Soil and Nutrient Management
40
Plant Tissue Testing Plant tissue testing is an important tool in assessing vegetable nutrient status during the growing season. The
following methods are commonly used: 1. Testing leaf tissue, 2. Testing whole petioles, and 3. Testing petiole sap.
1. Collecting leaf tissue for analysis:
Sample the most recently matured leaf from the growing tip; the sample should not contain any root or stem. For
sweet corn or onions, the leaf is removed just above the attachment point to the stalk or bulb. For compound
leaves (e.g., carrots, peas, tomatoes) the whole leaf includes the main petiole, all the leaflets and their petioles.
For heading vegetables, it is most practical to take the outermost whole wrapper leaf. When sampling particularly
young plants, the whole above-ground portion of the plant may be sampled.
A proper leaf sample should consist of about 25 to 100 individual leaves. The same leaf (i.e., physiological age
and position) should be collected from each sampled plant.
Avoid sampling plants damaged by pests, diseases, or chemicals.
Sample across the field, from different rows, and avoid problem areas (e.g., low spots, ridges, washed out areas).
Sample when the plants are actively growing (typically between 9 a.m. and 4 p.m.). Do not collect samples from
water stressed plants.
Send samples to a laboratory in a paper bag; do not use plastic bags (your samples may spoil in plastic).
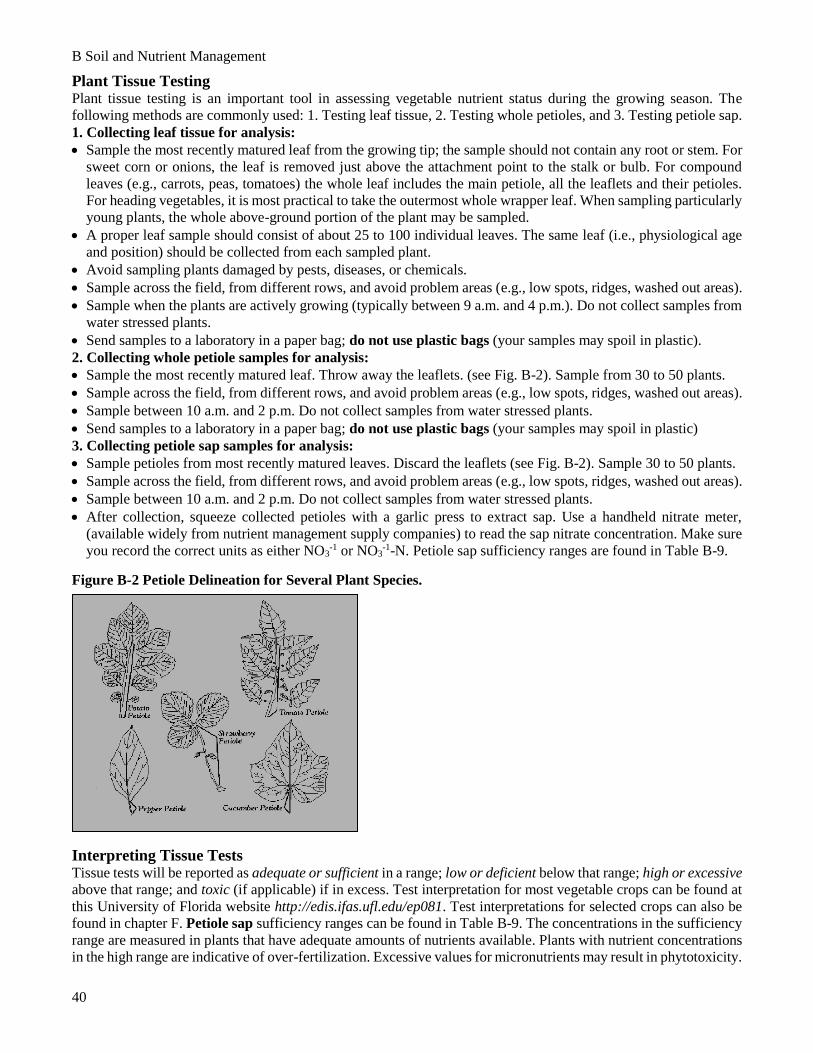
2. Collecting whole petiole samples for analysis:
Sample the most recently matured leaf. Throw away the leaflets. (see Fig. B-2). Sample from 30 to 50 plants.
Sample across the field, from different rows, and avoid problem areas (e.g., low spots, ridges, washed out areas).
Sample between 10 a.m. and 2 p.m. Do not collect samples from water stressed plants.
Send samples to a laboratory in a paper bag; do not use plastic bags (your samples may spoil in plastic)
3. Collecting petiole sap samples for analysis:
Sample petioles from most recently matured leaves. Discard the leaflets (see Fig. B-2). Sample 30 to 50 plants.
Sample across the field, from different rows, and avoid problem areas (e.g., low spots, ridges, washed out areas).
Sample between 10 a.m. and 2 p.m. Do not collect samples from water stressed plants.
After collection, squeeze collected petioles with a garlic press to extract sap. Use a handheld nitrate meter,
(available widely from nutrient management supply companies) to read the sap nitrate concentration. Make sure
you record the correct units as either NO3-1 or NO3
-1-N. Petiole sap sufficiency ranges are found in Table B-9.
Figure B-2 Petiole Delineation for Several Plant Species.
Interpreting Tissue Tests Tissue tests will be reported as adequate or sufficient in a range; low or deficient below that range; high or excessive
above that range; and toxic (if applicable) if in excess. Test interpretation for most vegetable crops can be found at
this University of Florida website http://edis.ifas.ufl.edu/ep081. Test interpretations for selected crops can also be
found in chapter F. Petiole sap sufficiency ranges can be found in Table B-9. The concentrations in the sufficiency
range are measured in plants that have adequate amounts of nutrients available. Plants with nutrient concentrations
in the high range are indicative of over-fertilization. Excessive values for micronutrients may result in phytotoxicity.

B Soil and Nutrient Management
41
Correcting Deficiencies Recommendations for correcting nutrient deficiencies are presented in the previous sections and in table B-8.
Table B-8. Recommendations for Correction of Vegetable Crop Nutrient Deficiencies Nutrient Fertilizer Method Application Rate
(Nutrient) lb/A
Nitrogen (N) Urea-ammonium nitrate solutions T,S,D1 30 to 40
Calcium nitrate T,S,D 30 to 40
Phosphorus (P2O5) Ammonium phosphates T,S,D 20
Triple superphosphate T,S 20
Phosphoric acid S,D 20
Potassium (K2O) Potassium chloride T,S,D 30
Potassium nitrate T,S,D 30
Calcium (Ca) Calcium nitrate T,S,D 30
Calcium chloride D 30
Magnesium (Mg) Magnesium sulfate T,S,D 20
Potassium magnesium sulfate T,S 20
Sulfur (S) Ammonium Sulfate T,S,D 20
Gypsum T,S,D 20
Boron (B) Borax, Solubor2 D,F1 0.1 to 0.2
Copper (Cu) Copper sulfate D,F 0.1 to 0.2
Iron (Fe) Ferrous sulfate, chelated iron D,F 0.2 to 0.5
Manganese (Mn) Manganous sulfate, chelated manganese D,F 0.5 to 1.0
Molybdenum (Mo) Sodium molybdate D,F 0.01 to 0.05
Zinc (Zn) Zinc sulfate, chelated zinc D,F 0.1 to 0.2 1T=topdress, S=sidedress, D=drip irrigation, F=foliar. 2Mention of a trade name does not imply a recommendation compared to similar materials.
Table B-9. Sufficiency Ranges for Fresh Petiole Sap Concentrations in Vegetable Crops Crop Stage of Growth Concentration (ppm) Crop Stage of Growth Concentration (ppm)
K NO3-N K NO3-N
Cucumber First blossom N/A 800-1000 Potato Plants 8 in. tall 4500-5000 1200-1400
Fruit (3 in.) N/A 600-800 First open flowers 4500-5000 1000-1400
First harvest N/A 400-600 50% flowers open 4000-4500 1000-1200
Broccoli Six-leaf stage N/A 800-1000 100% flowers open 3500-4000 900-1200
Just prior to harvest N/A 500-800 Tops falling over 2500-3000 600-900
At first harvest N/A 300-500 Squash First blossom N/A 900-1000
Eggplant First fruit (2 in. long) 4500-5000 1200-1600 First harvest N/A 800-900
First harvest 4000-5000 1000-1200 Tomato
(Field)
First buds 3500-4000 1000-1200
Mid harvest 3500-4000 600-800 First open flowers 3500-4000 600-800
Muskmelon
(Cantaloupe)
First blossom 4000-5000 1000-1200 Fruit (1 in. diameter) 3000-3500 400-600
Fruit (2 in.) 3500-4000 800-1000 Fruit (2 in. diameter) 3000-3500 400-600
First harvest 3000-3500 700-800 First harvest 2500-3000 300-400
Pepper First flower buds 3200-3500 1400-1600 Second harvest 2000-2500 200-400
First open flowers 3000-3200 1400-1600 Watermelon Vines (6 in. long) 4000-5000 1200-1500
Fruit half-grown 3000-3200 1200-1400 Fruit (2 in. long) 4000-5000 1000-1200
First harvest 2400-3000 800-1000 Fruit (half mature) 3500-4000 800-1000
Second harvest 2000-2400 500-800 At first harvest 3000-3500 600-800
Sustainable Nutrient Management A major objective of nutrient management is to bring the soil fertility level into the optimum range and to sustain
that fertility level during crop growth. Once soil fertility has reached the optimum level, the nutrient application rate
should be only large enough to maintain the optimum level. This can be accomplished by applying nutrients at a
rate that closely matches the rate of nutrient removal in the harvested crop. The rate may need to be slightly higher
to account for other losses such as leaching.
B Soil and Nutrient Management
42
Keeping records of soil test results enables you to track changes over time and to adjust recommendations as needed
to maintain soil fertility in the optimum range. Meaningful records require a consistent approach to soil testing in
terms of sample collection, sampling depth, and laboratory submission. Soil test levels can vary somewhat from
sample to sample and having records helps to spot unusual soil test values that should be rechecked.
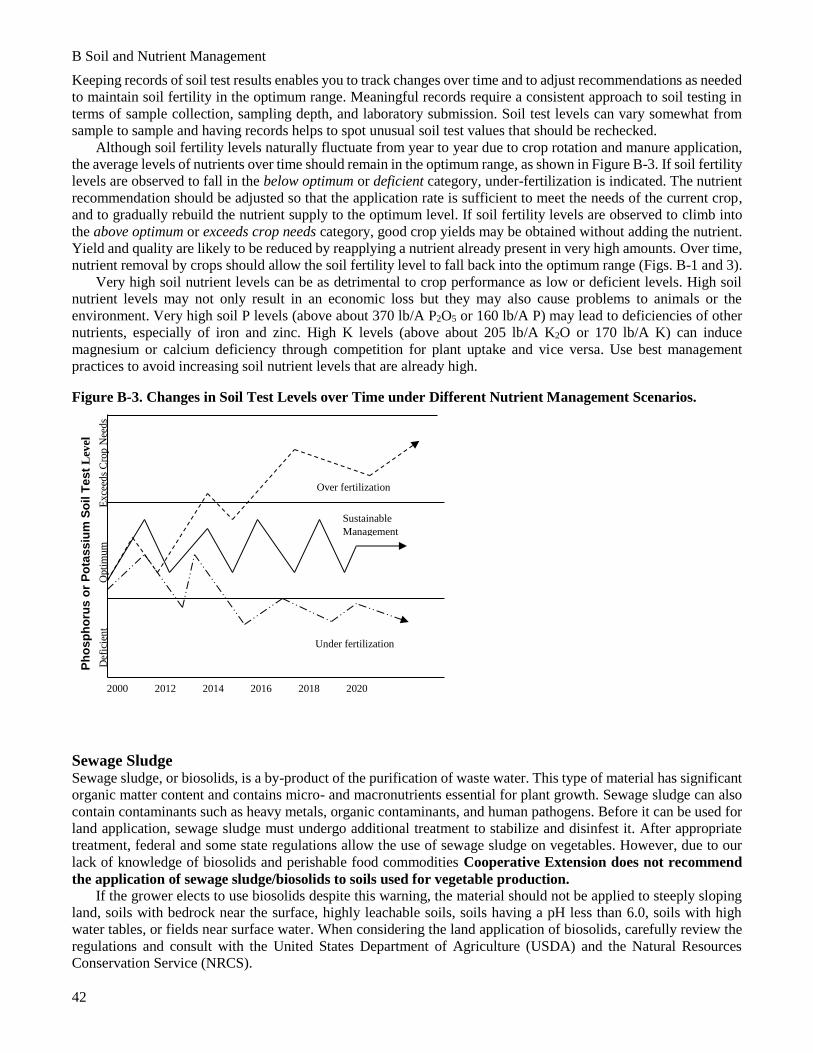
Although soil fertility levels naturally fluctuate from year to year due to crop rotation and manure application,
the average levels of nutrients over time should remain in the optimum range, as shown in Figure B-3. If soil fertility
levels are observed to fall in the below optimum or deficient category, under-fertilization is indicated. The nutrient
recommendation should be adjusted so that the application rate is sufficient to meet the needs of the current crop,
and to gradually rebuild the nutrient supply to the optimum level. If soil fertility levels are observed to climb into
the above optimum or exceeds crop needs category, good crop yields may be obtained without adding the nutrient.
Yield and quality are likely to be reduced by reapplying a nutrient already present in very high amounts. Over time,
nutrient removal by crops should allow the soil fertility level to fall back into the optimum range (Figs. B-1 and 3).
Very high soil nutrient levels can be as detrimental to crop performance as low or deficient levels. High soil
nutrient levels may not only result in an economic loss but they may also cause problems to animals or the
environment. Very high soil P levels (above about 370 lb/A P2O5 or 160 lb/A P) may lead to deficiencies of other
nutrients, especially of iron and zinc. High K levels (above about 205 lb/A K2O or 170 lb/A K) can induce
magnesium or calcium deficiency through competition for plant uptake and vice versa. Use best management
practices to avoid increasing soil nutrient levels that are already high.
Figure B-3. Changes in Soil Test Levels over Time under Different Nutrient Management Scenarios.
Sewage Sludge Sewage sludge, or biosolids, is a by-product of the purification of waste water. This type of material has significant
organic matter content and contains micro- and macronutrients essential for plant growth. Sewage sludge can also
contain contaminants such as heavy metals, organic contaminants, and human pathogens. Before it can be used for
land application, sewage sludge must undergo additional treatment to stabilize and disinfest it. After appropriate
treatment, federal and some state regulations allow the use of sewage sludge on vegetables. However, due to our
lack of knowledge of biosolids and perishable food commodities Cooperative Extension does not recommend
the application of sewage sludge/biosolids to soils used for vegetable production. If the grower elects to use biosolids despite this warning, the material should not be applied to steeply sloping
land, soils with bedrock near the surface, highly leachable soils, soils having a pH less than 6.0, soils with high
water tables, or fields near surface water. When considering the land application of biosolids, carefully review the
regulations and consult with the United States Department of Agriculture (USDA) and the Natural Resources
Conservation Service (NRCS).
Ph
os
ph
oru
s o
r P
ota
ss
ium
So
il T
es
t L
evel
Def
icie
nt
Opti
mu
m
E
xce
eds
Cro
p N
eed
s
2000 2012 2014 2016 2018 2020
Over fertilization
Sustainable
Management
Under fertilization

B Soil and Nutrient Management
43
Foliar Fertilization Plants usually obtain nutrients from the soil through roots, but plants can also absorb a limited amount of some
nutrients through aerial organs such as leaves. Properly managed soils are usually able to supply the essential
mineral nutrients the crop will need during its development. If one or more soil-supplied nutrients become deficient
or unavailable during the development of the crop, foliar nutrient applications may be beneficial. Care should be
taken to use approved tank mixes if nutrients are combined with fungicides, insecticides, herbicides, or any other
additive. Chelated nutrient sources are often optimal for tank mixes, but make sure to read the label and conduct
a jar test. Generally, it is difficult to supply ample macro- and secondary nutrients through foliar fertilization, and
application of this strategy should be focused on micronutrients only. If a nutrient deficiency occurs, efforts should
be made to correct this deficiency via soil fertilization prior to the next growing season.
5. Soil Improvement and Organic Nutrient Sources Cover Crops Cover cropping is an important practice for sustainable vegetable production; some reasons to consider cover crops:
Return organic matter to the soil: Vegetable rotations are tillage intensive and organic matter is oxidized at a high
rate. Cover crops help maintain soil organic matter levels; a critical component of soil health and productivity.
Provide winter cover: By having a cover crop - including roots - growing on a field in the winter you recycle plant
nutrients (especially N), reduce N leaching losses, reduce erosion by wind and water, and reduce surface compaction
and the effects of heavy rainfall on bare soils. Cover crops also compete with winter annual weeds and can help
reduce weed pressure in the spring.
Reduce certain diseases and other pests: Cover crops help maintain soil organic matter levels. Cover crop residues
can help increase the diversity of soil organisms and reduce soil borne disease pressure. Some cover crops may also
release compounds that help suppress certain soil borne pests, e.g., nematodes.
Provide nitrogen for the following crop: Leguminous cover crops, such as hairy vetch or crimson clover, can
provide significant amounts of nitrogen, especially for late spring planted vegetables.
Improve soil physical properties: Cover crops help maintain or improve soil physical properties and reduce
compaction. Roots of cover crops and incorporated cover crop residue will help improve drainage, water holding
capacity, aeration, and tilth.
Small Grains and Ryegrasses Seeding spring oats at 60 to 100 lb/A during August or early September provides a good cover crop that will winter-
kill in the colder areas but may overwinter in warmer areas. Rye, triticale, barley, or winter wheat can be seeded at
80 to 110 lb/A after early September. These crops can also provide strips for wind protection during the early part
of the next growing season. Spring oats also works as a spring planted cover. Annual and perennial ryegrass or a
mixture of the two seeded at 15-20 lb/A by early September are also good cover crops.
Legumes Legumes such as hairy vetch, crimson clover, field peas, subterranean clover, and other clovers are excellent cover
crops and can provide significant amounts of N for vegetable crops that follow. Good examples are hairy vetch
drilled at 25-60 lb/A, crimson clover at a rate of 15-30 lb/A, or field peas such as Austrian Winter planted at 50-70
lb/A. Subterranean clover is an option for the southern part of the region. Hairy vetch works very well in no-till
vegetable systems where it is allowed to go up to flowering or early fruiting and then is killed by herbicides or with
a roller-crimper. It is a common system for planting pumpkins in the region but also works well for late plantings
of other vine crops, tomatoes and peppers. Hairy vetch, crimson clover, field peas and subterranean clover can
provide from 80 to well over 100 lb/A of N equivalent. See table B-10 for estimated N credits from legumes.
Remember to inoculate the seeds of these crops with the proper Rhizobia inoculants. All of these legume species
should be planted as early as possible, from the last week in August through the end of September to get adequate
fall growth. Legume cover crops should be planted a minimum of 4 weeks before a killing frost.
Red clover planted late winter or early spring can be used ahead of early summer vegetables. Summer legume
cover crops can be used for soil improvement and provide N prior to planting fall vegetable crops. These include
sun hemp, cowpeas, soybeans, annual lespedeza, and a number of medic (alfalfa) species.
B Soil and Nutrient Management
44
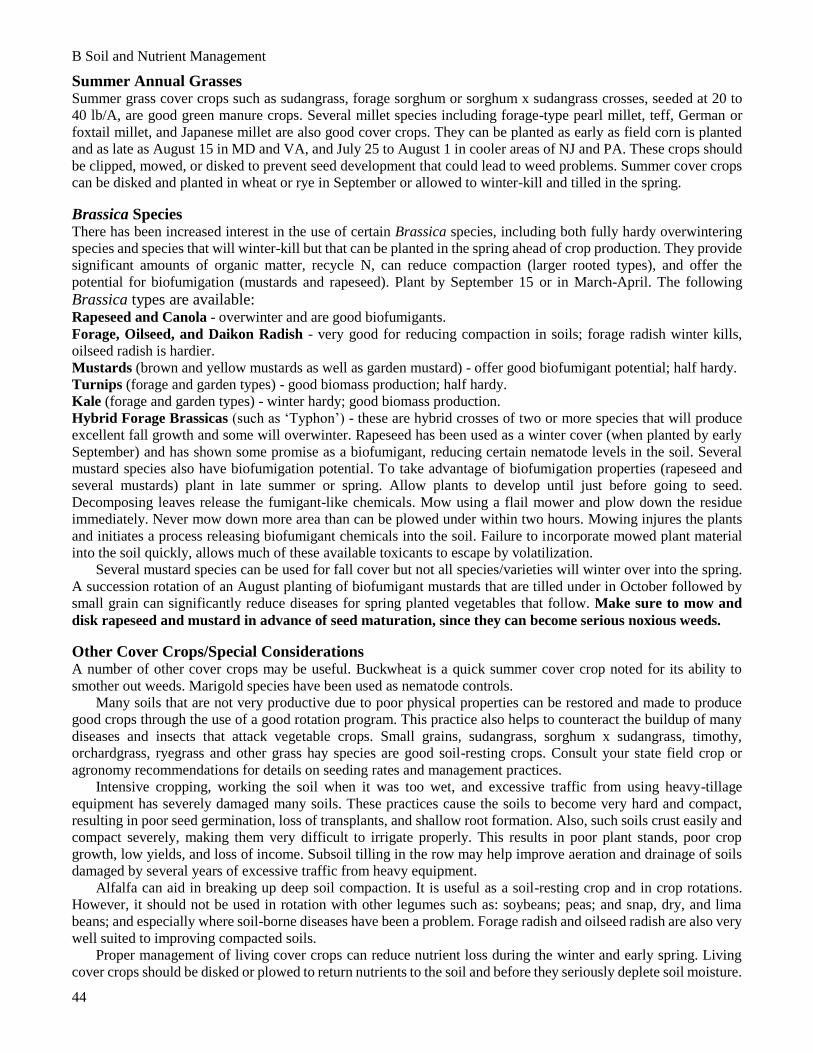
Summer Annual Grasses Summer grass cover crops such as sudangrass, forage sorghum or sorghum x sudangrass crosses, seeded at 20 to
40 lb/A, are good green manure crops. Several millet species including forage-type pearl millet, teff, German or
foxtail millet, and Japanese millet are also good cover crops. They can be planted as early as field corn is planted
and as late as August 15 in MD and VA, and July 25 to August 1 in cooler areas of NJ and PA. These crops should
be clipped, mowed, or disked to prevent seed development that could lead to weed problems. Summer cover crops
can be disked and planted in wheat or rye in September or allowed to winter-kill and tilled in the spring.
Brassica Species There has been increased interest in the use of certain Brassica species, including both fully hardy overwintering
species and species that will winter-kill but that can be planted in the spring ahead of crop production. They provide
significant amounts of organic matter, recycle N, can reduce compaction (larger rooted types), and offer the
potential for biofumigation (mustards and rapeseed). Plant by September 15 or in March-April. The following
Brassica types are available: Rapeseed and Canola - overwinter and are good biofumigants.
Forage, Oilseed, and Daikon Radish - very good for reducing compaction in soils; forage radish winter kills,
oilseed radish is hardier.
Mustards (brown and yellow mustards as well as garden mustard) - offer good biofumigant potential; half hardy.
Turnips (forage and garden types) - good biomass production; half hardy.
Kale (forage and garden types) - winter hardy; good biomass production.
Hybrid Forage Brassicas (such as ‘Typhon’) - these are hybrid crosses of two or more species that will produce
excellent fall growth and some will overwinter. Rapeseed has been used as a winter cover (when planted by early
September) and has shown some promise as a biofumigant, reducing certain nematode levels in the soil. Several
mustard species also have biofumigation potential. To take advantage of biofumigation properties (rapeseed and
several mustards) plant in late summer or spring. Allow plants to develop until just before going to seed.
Decomposing leaves release the fumigant-like chemicals. Mow using a flail mower and plow down the residue
immediately. Never mow down more area than can be plowed under within two hours. Mowing injures the plants
and initiates a process releasing biofumigant chemicals into the soil. Failure to incorporate mowed plant material
into the soil quickly, allows much of these available toxicants to escape by volatilization.
Several mustard species can be used for fall cover but not all species/varieties will winter over into the spring.
A succession rotation of an August planting of biofumigant mustards that are tilled under in October followed by
small grain can significantly reduce diseases for spring planted vegetables that follow. Make sure to mow and
disk rapeseed and mustard in advance of seed maturation, since they can become serious noxious weeds.
Other Cover Crops/Special Considerations A number of other cover crops may be useful. Buckwheat is a quick summer cover crop noted for its ability to
smother out weeds. Marigold species have been used as nematode controls.
Many soils that are not very productive due to poor physical properties can be restored and made to produce
good crops through the use of a good rotation program. This practice also helps to counteract the buildup of many
diseases and insects that attack vegetable crops. Small grains, sudangrass, sorghum x sudangrass, timothy,
orchardgrass, ryegrass and other grass hay species are good soil-resting crops. Consult your state field crop or
agronomy recommendations for details on seeding rates and management practices.
Intensive cropping, working the soil when it was too wet, and excessive traffic from using heavy-tillage
equipment has severely damaged many soils. These practices cause the soils to become very hard and compact,
resulting in poor seed germination, loss of transplants, and shallow root formation. Also, such soils crust easily and
compact severely, making them very difficult to irrigate properly. This results in poor plant stands, poor crop
growth, low yields, and loss of income. Subsoil tilling in the row may help improve aeration and drainage of soils
damaged by several years of excessive traffic from heavy equipment.
Alfalfa can aid in breaking up deep soil compaction. It is useful as a soil-resting crop and in crop rotations.
However, it should not be used in rotation with other legumes such as: soybeans; peas; and snap, dry, and lima
beans; and especially where soil-borne diseases have been a problem. Forage radish and oilseed radish are also very
well suited to improving compacted soils.
Proper management of living cover crops can reduce nutrient loss during the winter and early spring. Living
cover crops should be disked or plowed to return nutrients to the soil and before they seriously deplete soil moisture.
B Soil and Nutrient Management
45
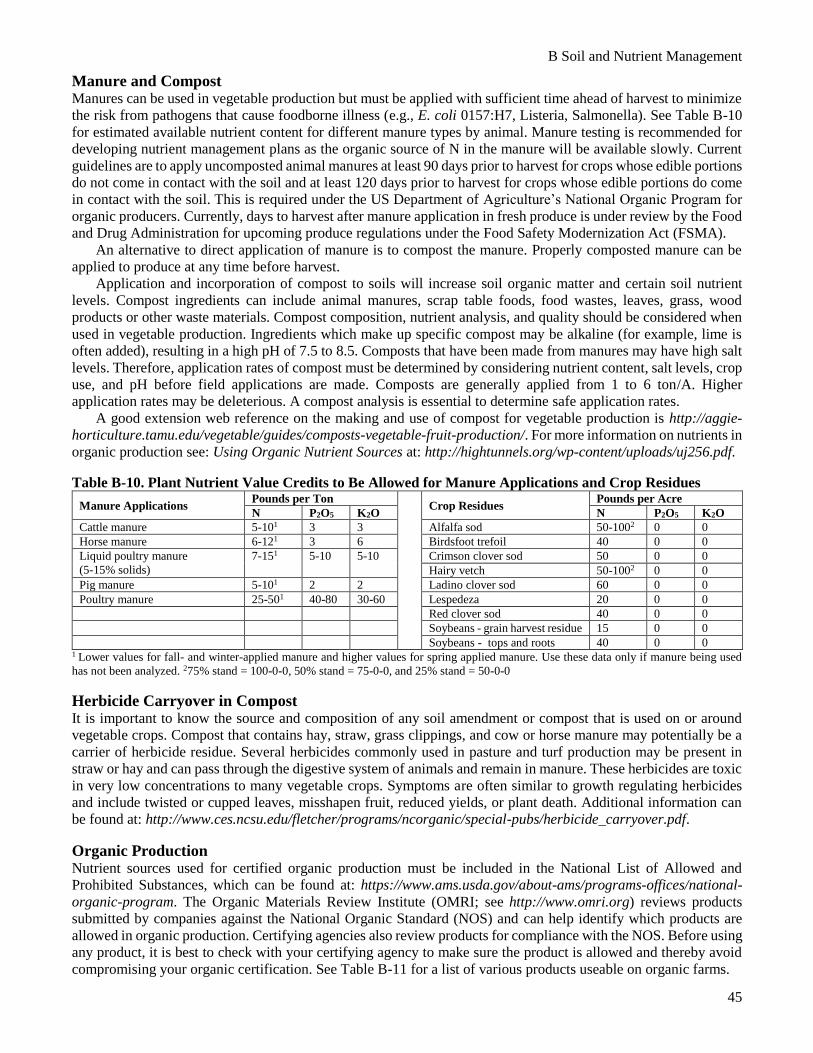
Manure and Compost Manures can be used in vegetable production but must be applied with sufficient time ahead of harvest to minimize
the risk from pathogens that cause foodborne illness (e.g., E. coli 0157:H7, Listeria, Salmonella). See Table B-10
for estimated available nutrient content for different manure types by animal. Manure testing is recommended for
developing nutrient management plans as the organic source of N in the manure will be available slowly. Current
guidelines are to apply uncomposted animal manures at least 90 days prior to harvest for crops whose edible portions
do not come in contact with the soil and at least 120 days prior to harvest for crops whose edible portions do come
in contact with the soil. This is required under the US Department of Agriculture’s National Organic Program for
organic producers. Currently, days to harvest after manure application in fresh produce is under review by the Food
and Drug Administration for upcoming produce regulations under the Food Safety Modernization Act (FSMA).
An alternative to direct application of manure is to compost the manure. Properly composted manure can be
applied to produce at any time before harvest.
Application and incorporation of compost to soils will increase soil organic matter and certain soil nutrient
levels. Compost ingredients can include animal manures, scrap table foods, food wastes, leaves, grass, wood
products or other waste materials. Compost composition, nutrient analysis, and quality should be considered when
used in vegetable production. Ingredients which make up specific compost may be alkaline (for example, lime is
often added), resulting in a high pH of 7.5 to 8.5. Composts that have been made from manures may have high salt
levels. Therefore, application rates of compost must be determined by considering nutrient content, salt levels, crop
use, and pH before field applications are made. Composts are generally applied from 1 to 6 ton/A. Higher
application rates may be deleterious. A compost analysis is essential to determine safe application rates.
A good extension web reference on the making and use of compost for vegetable production is http://aggie-
horticulture.tamu.edu/vegetable/guides/composts-vegetable-fruit-production/. For more information on nutrients in
organic production see: Using Organic Nutrient Sources at: http://hightunnels.org/wp-content/uploads/uj256.pdf.
Table B-10. Plant Nutrient Value Credits to Be Allowed for Manure Applications and Crop Residues
Manure Applications Pounds per Ton
Crop Residues Pounds per Acre
N P2O5 K2O N P2O5 K2O
Cattle manure 5-101 3 3 Alfalfa sod 50-1002 0 0
Horse manure 6-121 3 6 Birdsfoot trefoil 40 0 0
Liquid poultry manure
(5-15% solids)
7-151 5-10 5-10 Crimson clover sod 50 0 0
Hairy vetch 50-1002 0 0
Pig manure 5-101 2 2 Ladino clover sod 60 0 0
Poultry manure 25-501 40-80 30-60 Lespedeza 20 0 0
Red clover sod 40 0 0
Soybeans - grain harvest residue 15 0 0
Soybeans - tops and roots 40 0 0 1 Lower values for fall- and winter-applied manure and higher values for spring applied manure. Use these data only if manure being used
has not been analyzed. 275% stand = 100-0-0, 50% stand = 75-0-0, and 25% stand = 50-0-0
Herbicide Carryover in Compost It is important to know the source and composition of any soil amendment or compost that is used on or around
vegetable crops. Compost that contains hay, straw, grass clippings, and cow or horse manure may potentially be a
carrier of herbicide residue. Several herbicides commonly used in pasture and turf production may be present in
straw or hay and can pass through the digestive system of animals and remain in manure. These herbicides are toxic
in very low concentrations to many vegetable crops. Symptoms are often similar to growth regulating herbicides
and include twisted or cupped leaves, misshapen fruit, reduced yields, or plant death. Additional information can
be found at: http://www.ces.ncsu.edu/fletcher/programs/ncorganic/special-pubs/herbicide_carryover.pdf.
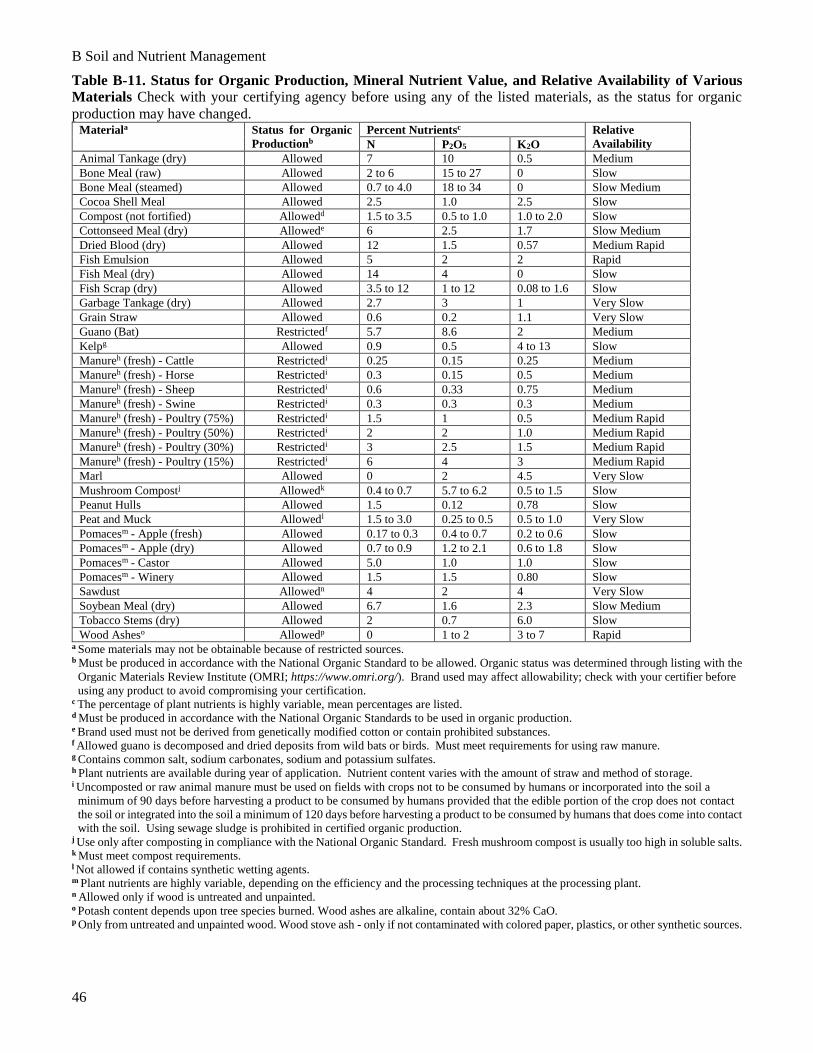
Organic Production Nutrient sources used for certified organic production must be included in the National List of Allowed and
Prohibited Substances, which can be found at: https://www.ams.usda.gov/about-ams/programs-offices/national-
organic-program. The Organic Materials Review Institute (OMRI; see http://www.omri.org) reviews products
submitted by companies against the National Organic Standard (NOS) and can help identify which products are
allowed in organic production. Certifying agencies also review products for compliance with the NOS. Before using
any product, it is best to check with your certifying agency to make sure the product is allowed and thereby avoid
compromising your organic certification. See Table B-11 for a list of various products useable on organic farms.
B Soil and Nutrient Management
46
Table B-11. Status for Organic Production, Mineral Nutrient Value, and Relative Availability of Various
Materials Check with your certifying agency before using any of the listed materials, as the status for organic
production may have changed. Materiala Status for Organic
Productionb
Percent Nutrientsc Relative
Availability N P2O5 K2O
Animal Tankage (dry) Allowed 7 10 0.5 Medium
Bone Meal (raw) Allowed 2 to 6 15 to 27 0 Slow
Bone Meal (steamed) Allowed 0.7 to 4.0 18 to 34 0 Slow Medium
Cocoa Shell Meal Allowed 2.5 1.0 2.5 Slow
Compost (not fortified) Allowedd 1.5 to 3.5 0.5 to 1.0 1.0 to 2.0 Slow
Cottonseed Meal (dry) Allowede 6 2.5 1.7 Slow Medium
Dried Blood (dry) Allowed 12 1.5 0.57 Medium Rapid
Fish Emulsion Allowed 5 2 2 Rapid
Fish Meal (dry) Allowed 14 4 0 Slow
Fish Scrap (dry) Allowed 3.5 to 12 1 to 12 0.08 to 1.6 Slow
Garbage Tankage (dry) Allowed 2.7 3 1 Very Slow
Grain Straw Allowed 0.6 0.2 1.1 Very Slow
Guano (Bat) Restrictedf 5.7 8.6 2 Medium
Kelpg Allowed 0.9 0.5 4 to 13 Slow
Manureh (fresh) - Cattle Restrictedi 0.25 0.15 0.25 Medium
Manureh (fresh) - Horse Restrictedi 0.3 0.15 0.5 Medium
Manureh (fresh) - Sheep Restrictedi 0.6 0.33 0.75 Medium
Manureh (fresh) - Swine Restrictedi 0.3 0.3 0.3 Medium
Manureh (fresh) - Poultry (75%) Restrictedi 1.5 1 0.5 Medium Rapid
Manureh (fresh) - Poultry (50%) Restrictedi 2 2 1.0 Medium Rapid
Manureh (fresh) - Poultry (30%) Restrictedi 3 2.5 1.5 Medium Rapid
Manureh (fresh) - Poultry (15%) Restrictedi 6 4 3 Medium Rapid
Marl Allowed 0 2 4.5 Very Slow
Mushroom Compostj Allowedk 0.4 to 0.7 5.7 to 6.2 0.5 to 1.5 Slow
Peanut Hulls Allowed 1.5 0.12 0.78 Slow
Peat and Muck Allowedl 1.5 to 3.0 0.25 to 0.5 0.5 to 1.0 Very Slow
Pomacesm - Apple (fresh) Allowed 0.17 to 0.3 0.4 to 0.7 0.2 to 0.6 Slow
Pomacesm - Apple (dry) Allowed 0.7 to 0.9 1.2 to 2.1 0.6 to 1.8 Slow
Pomacesm - Castor Allowed 5.0 1.0 1.0 Slow
Pomacesm - Winery Allowed 1.5 1.5 0.80 Slow
Sawdust Allowedn 4 2 4 Very Slow
Soybean Meal (dry) Allowed 6.7 1.6 2.3 Slow Medium
Tobacco Stems (dry) Allowed 2 0.7 6.0 Slow
Wood Asheso Allowedp 0 1 to 2 3 to 7 Rapid a Some materials may not be obtainable because of restricted sources. b Must be produced in accordance with the National Organic Standard to be allowed. Organic status was determined through listing with the
Organic Materials Review Institute (OMRI; https://www.omri.org/). Brand used may affect allowability; check with your certifier before
using any product to avoid compromising your certification. c The percentage of plant nutrients is highly variable, mean percentages are listed. d Must be produced in accordance with the National Organic Standards to be used in organic production. e Brand used must not be derived from genetically modified cotton or contain prohibited substances. f Allowed guano is decomposed and dried deposits from wild bats or birds. Must meet requirements for using raw manure. g Contains common salt, sodium carbonates, sodium and potassium sulfates. h Plant nutrients are available during year of application. Nutrient content varies with the amount of straw and method of storage. i Uncomposted or raw animal manure must be used on fields with crops not to be consumed by humans or incorporated into the soil a
minimum of 90 days before harvesting a product to be consumed by humans provided that the edible portion of the crop does not contact
the soil or integrated into the soil a minimum of 120 days before harvesting a product to be consumed by humans that does come into contact
with the soil. Using sewage sludge is prohibited in certified organic production. j Use only after composting in compliance with the National Organic Standard. Fresh mushroom compost is usually too high in soluble salts. k Must meet compost requirements. l Not allowed if contains synthetic wetting agents. m Plant nutrients are highly variable, depending on the efficiency and the processing techniques at the processing plant. n Allowed only if wood is untreated and unpainted. o Potash content depends upon tree species burned. Wood ashes are alkaline, contain about 32% CaO. p Only from untreated and unpainted wood. Wood stove ash - only if not contaminated with colored paper, plastics, or other synthetic sources.