2018 outlook through the looking glass - sifma · through the looking glass trends in the capital...
TRANSCRIPT
2018 OUTLOOK
Through the Looking GlassTrends in the Capital Markets
SIFMA 2018 Outlook2
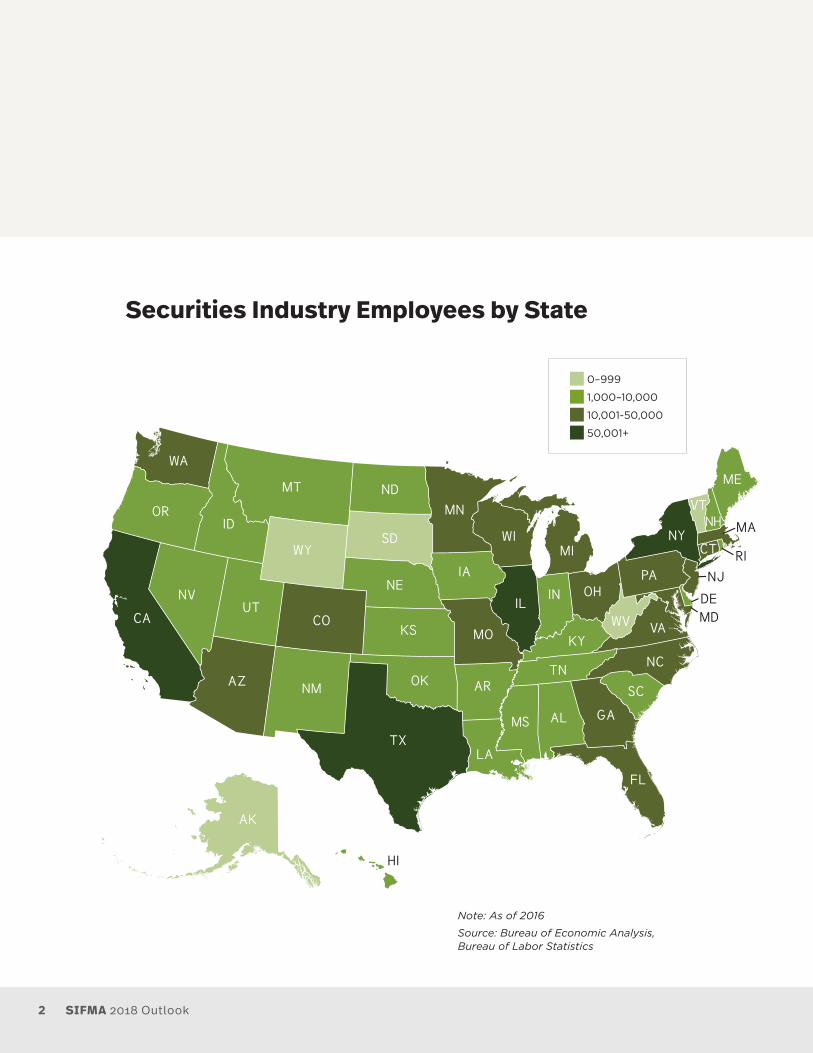
Note: As of 2016
Source: Bureau of Economic Analysis, Bureau of Labor Statistics
Securities Industry Employees by State
0–999
1,000–10,000
10,001-50,000
50,001+
3
Welcome
SIFMA is the voice of the U.S. securities industry. We are a member-driven organization that
advocates for effective and efficient capital markets.
We represent the broker-dealers, banks and asset managers whose nearly 1 million employees
provide access to the capital markets, raising over $2.5 trillion for businesses and municipalities
in the U.S., serving clients with over $18.5 trillion in assets and managing more than $67 trillion
in assets for individual and institutional clients including mutual funds and retirement plans.
Our members represent 75% of the U.S. broker-dealer sector by revenue and 50% of the asset
management sector by assets under management. We convene more than 13,000 financial
professionals on approximately 100 committees and societies, as well as countless task forces
and working groups. Together, we are invested in America.
This report contains our insights into the markets, the industry’s viewpoints on critical policy issues
and several helpful resources.
With best regards,
LISA KIDD HUNT Executive Vice President, Business Initiatives Charles Schwab & Co., Inc.2018 Chair SIFMA Board of Directors
KENNETH E. BENTSEN, JR. President and CEO SIFMA
TIMOTHY C. SCHEVE President and CEO Janney Montgomery Scott2017 Chair SIFMA Board of Directors

The capital markets fuel the U.S. economy, providing 65% of funding for
economic activity. Today, GDP growth is slowly starting to pick up and the
financial system is strong.
And yet, the U.S. economy has experienced the slowest economic recovery
of the post-war period. Real gross domestic product stands at only 112% of
the 2007 level, and the economy has been stuck in low gear.
The financial system has absorbed hundreds of new regulations in the decade
since the financial crisis. While many of those regulations have made the
financial system safer and more resilient, they are not without cost. To meet
these requirements, financial institutions have built up excess capital and
liquidity. Liquidity1 is up 4x for the CCAR2 banks since 2006. This is exaggerated
for the G-SIBs3, those exposed to a longer list of regulations given their
increased complexity and size, with liquidity up almost 5x. This is excess
liquidity that remains trapped in the system. We wonder how much stronger the
economy could be if financial institutions had the flexibility to release more of
this excess capital and liquidity into the economy.
1 Liquidity = (cash + deposits at banks) / total assets.
2 Comprehensive Capital Analysis and Review (CCAR) firms: https://www.federalreserve.gov/newsevents/pressreleases/fles/bcreg20170203a4.pdf
3 Global Systemically Important Banks (G-SIBs): http://www.fsb.org/wp-content/uploads/P211117-1.pdf
Market Insights

SIFMA 2018 Outlook6
MARKET INSIGHTS
US, 39%
EU, 16%
China, 10%
Japan, 7%
HK, 5%
Canada, 3%
Australia, 2%
Singapore, 1%
EMs, 17%
Other DMs, 0.5%
Global Equity Markets ($70T)
US, 43%
EU, 27%
China, 10%
Japan, 13%
HK, 0.2%
Canada, 2%
Australia, 2%
Singapore, 0.4%
EMs, 2%
Other DMs, 0.5%
Global Bond Markets ($92T)
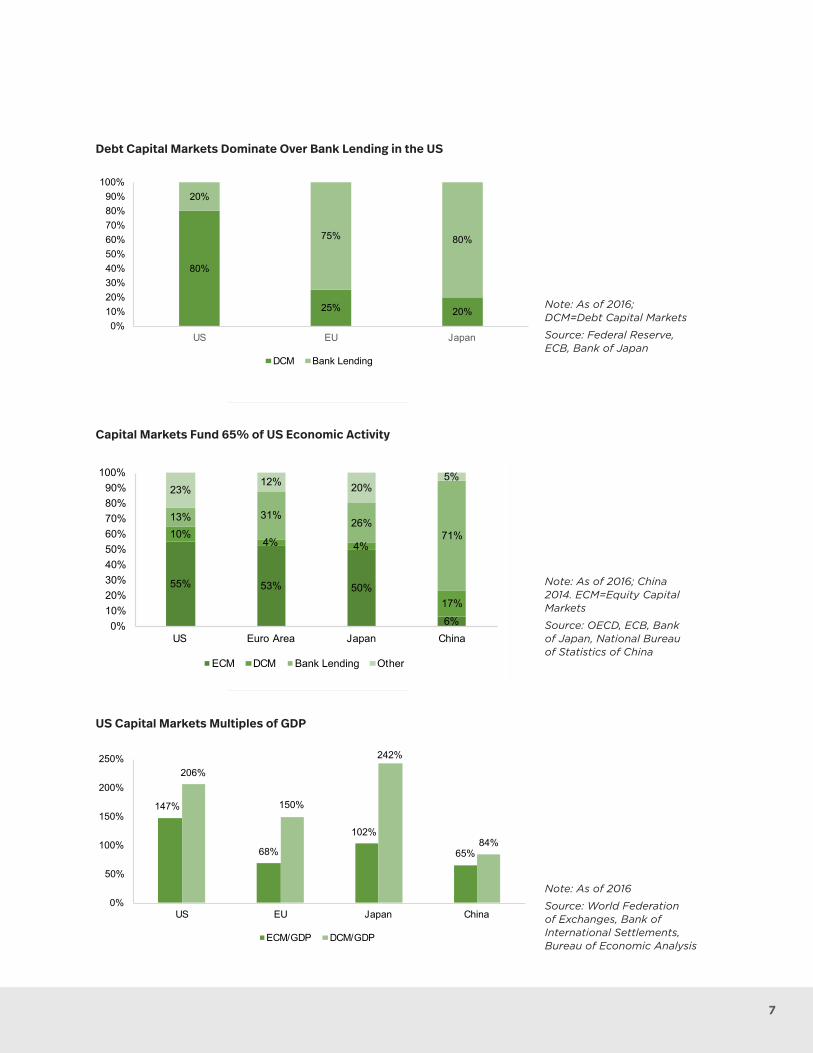
US Capital Markets are the Largest in the World
The U.S. equities market is 2.4x and the U.S. bond markets are 1.6x the size of the EU, the #2 player
globally for each segment. U.S. capital markets enable debt issuance – a more efficient, stable and
less restrictive form of borrowing for corporations – to fuel growth, while bank lending is more
prevalent in other regions (80%/20% in the U.S., reversed in other markets). U.S. capital markets
provide 65% of total funding for economic activity and are multiples of U.S. GDP, thereby driving
economic growth for the country (Japan’s GDP is around one-fourth that of the U.S., skewing its
result in the chart on the next page).
Note: As of 2016; DM=Developed Markets; EM=Emerging Markets; HK=Hong Kong
Source: World Federation of Exchanges, Bank of International Settlements
Global Equity Markets ($70T)
Global Bond Markets ($92T)
7
147%
68%
102%
65%
206%
150%
242%
84%
0%
50%
100%
150%
200%
250%
US EU Japan China
US Capital Markets Multiples of GDP
ECM/GDP DCM/GDP
55% 53% 50%
6%
10%4% 4%
17%
13% 31%26%
71%
23%12% 20%
5%
0%10%20%30%40%50%60%70%80%90%
100%
US Euro Area Japan China
Capital Markets Fund 65% of US Economic Activity
ECM DCM Bank Lending Other
80%
25% 20%
20%
75% 80%
0%10%20%30%40%50%60%70%80%90%
100%
US EU Japan
DCM Dominates Over Bank Lending in the US
DCM Bank Lending
Note: As of 2016; DCM=Debt Capital Markets
Source: Federal Reserve, ECB, Bank of Japan
Note: As of 2016; China 2014. ECM=Equity Capital Markets
Source: OECD, ECB, Bank of Japan, National Bureau of Statistics of China
Note: As of 2016
Source: World Federation of Exchanges, Bank of International Settlements, Bureau of Economic Analysis
Debt Capital Markets Dominate Over Bank Lending in the US
Capital Markets Fund 65% of US Economic Activity
US Capital Markets Multiples of GDP

SIFMA 2018 Outlook8
MARKET INSIGHTS
Intersection of Financial Technologies & Traditional Business Models
New financial technologies (fintech) present both opportunities and threats to financial
institutions. Some fintech firms are becoming new competitors, while others present collaborative
opportunities. Fintech also provides the ability to increase efficiencies and decrease costs.
A recent EY survey1 asked about the key disruptive forces impacting their sector. 27% noted digital technology and 26% indicated changing customer behaviors, which we view as going hand-in-hand with fintech decisions.
Whatever the use case or challenge to solve may be, financial institutions across the spectrum –
banks, broker-dealers, asset managers, etc. – are reviewing and analyzing fintech options in
their strategic planning decisions. These discussions include using fintech to: update legacy
systems, adopt new technologies, invest in cybersecurity and improve the client experience.
A Confluence survey2 indicated 49% of asset managers surveyed identified technology innovation as a factor that will cause fundamental change in their operating model over the next 24 months.
While financial institutions cannot ignore what is happening in fintech, adoption of new
technologies may not be as simple as strategic funding and implementation decisions.
New technologies may face regulatory constraints. As many fintech offerings are new
to the firms looking to utilize them, they are new to regulators as well. Regulators are assessing
potential risks arising from usage of fintech contributions.
1 The 2017 EY Global Capital Confidence Barometer surveyed 3,000 executives in 43 countries across 14 sectors, including financial services.
2 The 4Q17 Confluence Trend Survey included 125 online interviews with asset managers and third-party administrators.
MARKET INSIGHTS
SIFMA 2018 Outlook8
9
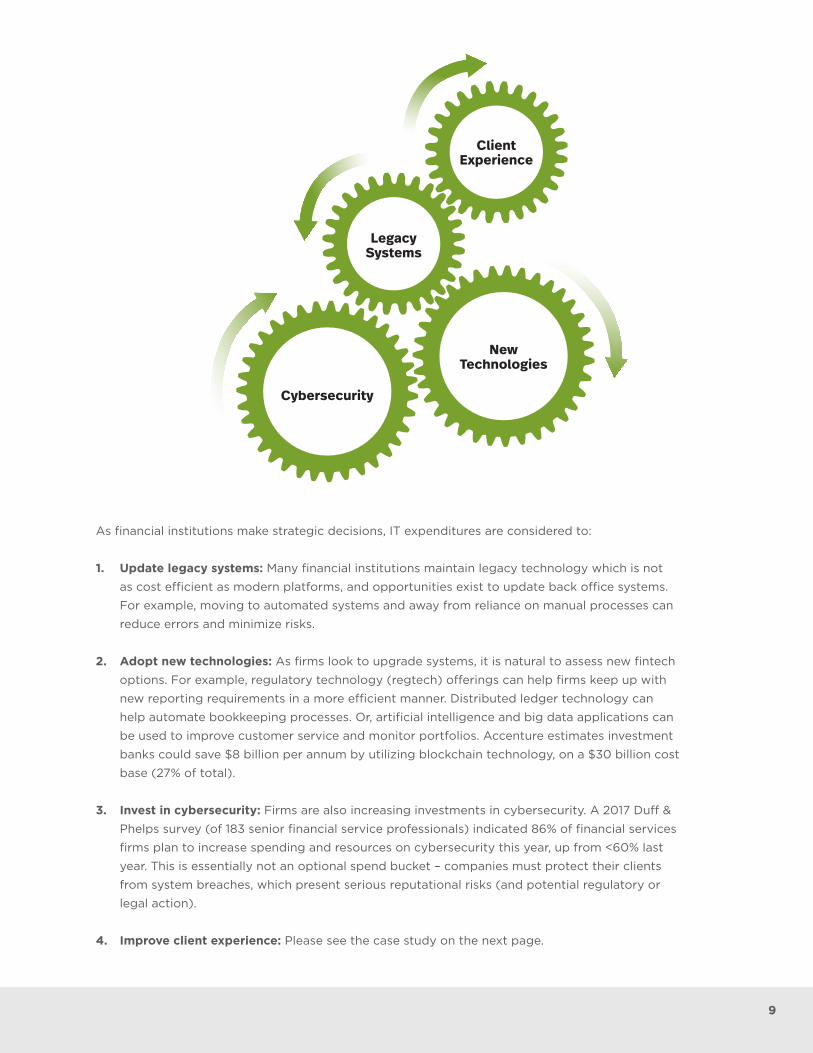
As financial institutions make strategic decisions, IT expenditures are considered to:
1. Update legacy systems: Many financial institutions maintain legacy technology which is not
as cost efficient as modern platforms, and opportunities exist to update back office systems.
For example, moving to automated systems and away from reliance on manual processes can
reduce errors and minimize risks.
2. Adopt new technologies: As firms look to upgrade systems, it is natural to assess new fintech
options. For example, regulatory technology (regtech) offerings can help firms keep up with
new reporting requirements in a more efficient manner. Distributed ledger technology can
help automate bookkeeping processes. Or, artificial intelligence and big data applications can
be used to improve customer service and monitor portfolios. Accenture estimates investment
banks could save $8 billion per annum by utilizing blockchain technology, on a $30 billion cost
base (27% of total).
3. Invest in cybersecurity: Firms are also increasing investments in cybersecurity. A 2017 Duff &
Phelps survey (of 183 senior financial service professionals) indicated 86% of financial services
firms plan to increase spending and resources on cybersecurity this year, up from <60% last
year. This is essentially not an optional spend bucket – companies must protect their clients
from system breaches, which present serious reputational risks (and potential regulatory or
legal action).
4. Improve client experience: Please see the case study on the next page.
Client Experience
Legacy Systems
New Technologies
Cybersecurity

SIFMA 2018 Outlook10
MARKET INSIGHTS
Firm A, 63.9%Firm B, 14.9%
Firm C, 7.0%
Firm D, 5.2%
Firm E, 3.3%
Firm F, 0.6%Firm G, 0.3%
Firm H, 0.1%
Other, 5%
Robo Advising AUM
44%
52%
61%
71%77%
43%
50% 51% 52% 53%
22% 29%33%
39%43%
20%
30%
40%
50%
60%
70%
80%
2011 2012 2013 2014 2015
Mobile Usage Is on the Rise
Smart Phones Usage on Smart Phones Usage on All Phones
Case Study: Improving the Customer Experience
As new technologies emerge, client behavior changes. Many clients now prefer to do simple
transactions – deposit checks, monitor 401K balances or even trade stocks – on mobile devices. We
note that branches remain to serve the big decisions, such as advanced financial planning around
major life events, where clients still prefer the human touch.
77% of Americans now own a smart phone, and mobile usage for financial transactions, while
lagging, is moving directionally in line (53% in 2015, +10 pps since 2011). One area firms are
adopting technology to meet shifting client behavior is robo advising, where the top five firms
represent around 95% of AUM (based on a July 2017 report by Barron’s).
Source: Federal Reserve
Mobile Usage is on the Rise
Source: Barron’s, BackendBenchmarking, SIFMA estimates
Robo Advising AUM

11
Robo advising, which allows wealth managers to expand their services to a broader client-base, is
projected to grow in the U.S. to $2.2T by 2020 from $300B in 2016, a 49% CAGR. Many firms have
invested to varying degrees in robo advice platforms to enhance their customers’ financial advice
experience, blending technology enhancements with their firm’s investment portfolio management
expertise. AUM in Intelligent Portfolios, Schwab's robo segment, now represents 8.6% of total
Advice Solutions AUM, up 8.4 pps since its start in 2015.
Source: Aite, Statista, SIFMA estimates
Source: Company reports, SIFMA estimates
Schwab Intelligent Portfolios AUM Growing as a % of Total
0.4 2.2
3.7 4.4 5.1 6.6
8.2
11.2
14.2
17.8
21.2
0.2%1.1%
2.0% 2.3% 2.7%3.3%
4.0%
5.2%
6.4%
7.5%
8.6%
-2%
0%
2%
4%
6%
8%
10%
0
5
10
15
20
25
1Q15 2Q15 3Q15 4Q15 1Q16 2Q16 3Q16 4Q16 1Q17 2Q17 3Q17
Schwab Intelligent AUM Growing as a % of Total
Avg. Intelligent AUM ($B) % Total Advice Solutions AUM
300 500
900
1,500
2,200
1.8
3.8
6.9
10.3
13.8
(2)
0
2
4
6
8
10
12
14
0
500
1,000
1,500
2,000
2,500
2016 2017E 2018E 2019E 2020E
Solid Growth Forecasted for Robo Advice in the US
AUM ($B, LHS) # Clients (M, RHS)
Solid Growth Forecasted for Robo Advice in the US
SIFMA 2018 Outlook12
MARKET INSIGHTS
0
5,000
10,000
15,000
20,000
25,000
30,000
35,000
40,000
2007 2008 2009 2010 2011 2012 2013 2014 2015 2016
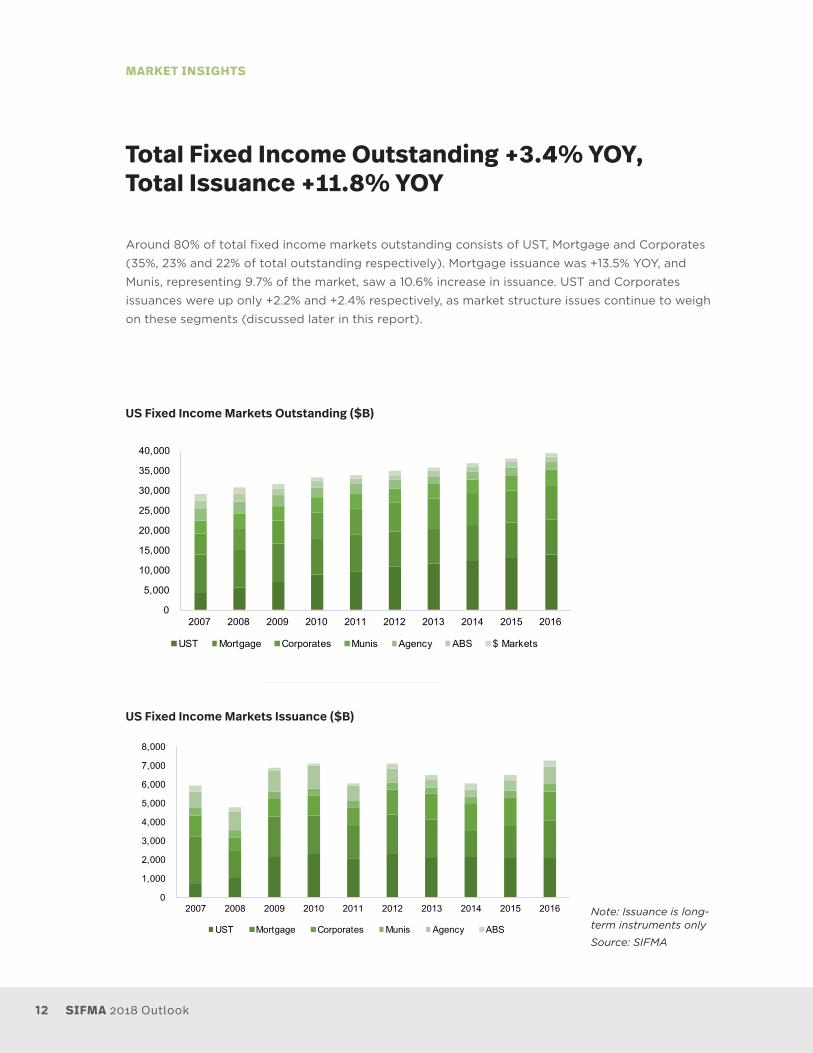
US Fixed Income Markets Outstanding ($B)
UST Mortgage Corporates Munis Agency ABS $ Markets
Total Fixed Income Outstanding +3.4% YOY, Total Issuance +11.8% YOY
Around 80% of total fixed income markets outstanding consists of UST, Mortgage and Corporates
(35%, 23% and 22% of total outstanding respectively). Mortgage issuance was +13.5% YOY, and
Munis, representing 9.7% of the market, saw a 10.6% increase in issuance. UST and Corporates
issuances were up only +2.2% and +2.4% respectively, as market structure issues continue to weigh
on these segments (discussed later in this report).
Note: Issuance is long-term instruments only
Source: SIFMA
US Fixed Income Markets Outstanding ($B)
US Fixed Income Markets Issuance ($B)
0
1,000
2,000
3,000
4,000
5,000
6,000
7,000
8,000
2007 2008 2009 2010 2011 2012 2013 2014 2015 2016
US Fixed Income Markets Issuance ($B)
UST Mortgage Corporates Munis Agency ABS
13
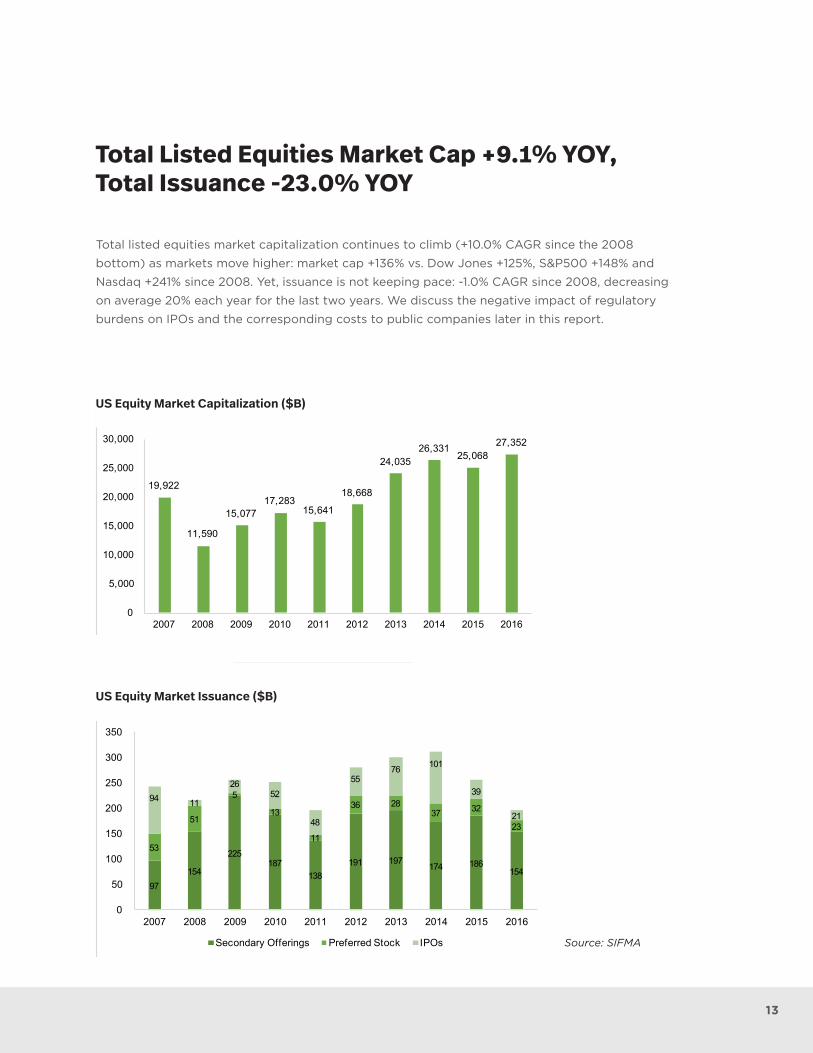
19,922
11,590
15,077 17,283
15,641
18,668
24,035 26,331
25,068 27,352
0
5,000
10,000
15,000
20,000
25,000
30,000
2007 2008 2009 2010 2011 2012 2013 2014 2015 2016
US Equity Market Capitalization ($B)
Total Listed Equities Market Cap +9.1% YOY, Total Issuance -23.0% YOY
Total listed equities market capitalization continues to climb (+10.0% CAGR since the 2008
bottom) as markets move higher: market cap +136% vs. Dow Jones +125%, S&P500 +148% and
Nasdaq +241% since 2008. Yet, issuance is not keeping pace: -1.0% CAGR since 2008, decreasing
on average 20% each year for the last two years. We discuss the negative impact of regulatory
burdens on IPOs and the corresponding costs to public companies later in this report.
Source: SIFMA
US Equity Market Capitalization ($B)
US Equity Market Issuance ($B)
97 154
225 187
138 191 197 174 186
154
53
51
5
13
11
36 28 37 32
23
94 11
26 52
48
55 76 101
39
21
0
50
100
150
200
250
300
350
2007 2008 2009 2010 2011 2012 2013 2014 2015 2016
US Equity Market Issuance ($B)
Secondary Offerings Preferred Stock IPOs

SIFMA 2018 Outlook14
MARKET INSIGHTS
3% 4%2% 1% 1% 1% 2% 2% 1% 2% 1% 2% 2% 1% 1% 1%
8%10%
7%4%
6% 6%8%
5% 6%
16%
5%
12%10% 11%
14%11% 10%
12%
89%
85%
91%
95%
93%94%
92%94%
92%
83%
94%
86%
89%
87%
85%
88%89%
87%
76%
78%
80%
82%
84%
86%
88%
90%
92%
94%
96%
98%
0%
10%
20%
30%
40%
50%
2000
2001
2002
2003
2004
2005
2006
2007
2008
2009
2010
2011
2012
2013
2014
2015
2016
YTD
Number of Small Cap IPOs (as a % of Total) Declined Post Crisis
Large Cap Mid Cap Small Cap (RHS)
Note: As of November 2017; Large cap = >$10B; mid cap = $2B - $10B; small cap = <$2B Source: Dealogic
Regulatory Environment Leads to Decline in IPO Deal Value and # of Deals
Number of Small Cap IPOs (as a % of Total) Declined Post Crisis
330
492
363
237
469 404
79 66 67
192 164 167 185
24 50
131 97 104
169 234
130 83
121
(150)
(50)
50
150
250
350
450
0
10
20
30
40
50
60
70
80
90
100
110
1995
1996
1997
1998
1999
2000
2001
2002
2003
2004
2005
2006
2007
2008
2009
2010
2011
2012
2013
2014
2015
2016
YTD
Regulatory Environment Leads to Decline in IPO Market Value and # of Deals
US Firms ($B) Non-US Firms ($B) # Deals (RHS)
15
Regulations Hindering Capital Formation
The increased regulatory burden and corresponding costs of becoming and remaining a public
company are a few of the factors that continue to hinder capital formation in the U.S. Looking at
the number of IPOs (number as opposed to value prevents skewing of results for large deals, such
as Alibaba in 2014), while averaging 177 per annum from 2004 to 2007, the IPO count is only 111 on
average over the last three years. The IPO count recovered somewhat YTD to 121, yet remains 48%
below the recent 2014 peak. 2014 saw 234 IPOs, as companies rushed to list to take advantage of a
long-awaited surge in investor confidence (after the crisis) and capture the benefits of rising stock
markets.
The U.S. represented only 14% of total global IPOs in 2016, despite averaging 62% in the late 1990s
(dropping to 35% in the early 2000s). Also on the decline is the number of small cap IPOs as a
percent of total U.S. IPOs. This figure remains in the mid- to high-80% range since the financial
crisis, down from the low- to mid-90% range pre-crisis.
Small cap IPOs represent the dream made possible by the capital markets. An individual or
family creates a product or company, works hard to develop the concept and then monetizes
their investment. The decline in the number of small cap IPOs implies fewer innovative American
companies see the benefit of going public in today’s regulatory environment.
While it is difficult to separate market factors from the passing of the JOBS Act in 2012 as
the driver of IPOs, the number of IPOs did increase from 2012 to 2014. According to the U.S.
Treasury’s report on capital markets, 87% of IPO filings since 2012 filed under the JOBS Act
as EGCs (emerging growth companies with <$1B annual revenue and publicly traded shares
<$700M). A SEC staff report noted small IPOs (firms seeking proceeds up to $30M) were 22% of
all IPOs from 2012-2016, up from 17% from 2007-2011.
However, IPO activity has been relatively muted since 2014, and additional regulatory changes
may be needed to improve capital formation.
The JOBS Act Five Years Later
15
SIFMA 2018 Outlook16
MARKET INSIGHTS
Note: Listed domestic companies in the U.S.
Source: World Bank
0
1,000
2,000
3,000
4,000
5,000
6,000
7,000
8,000
9,000
1996
1997
1998
1999
2000
2001
2002
2003
2004
2005
2006
2007
2008
2009
2010
2011
2012
2013
2014
2015
2016
# Public Companies -46% Since 1996, a -3% CAGR
-3% CAGR
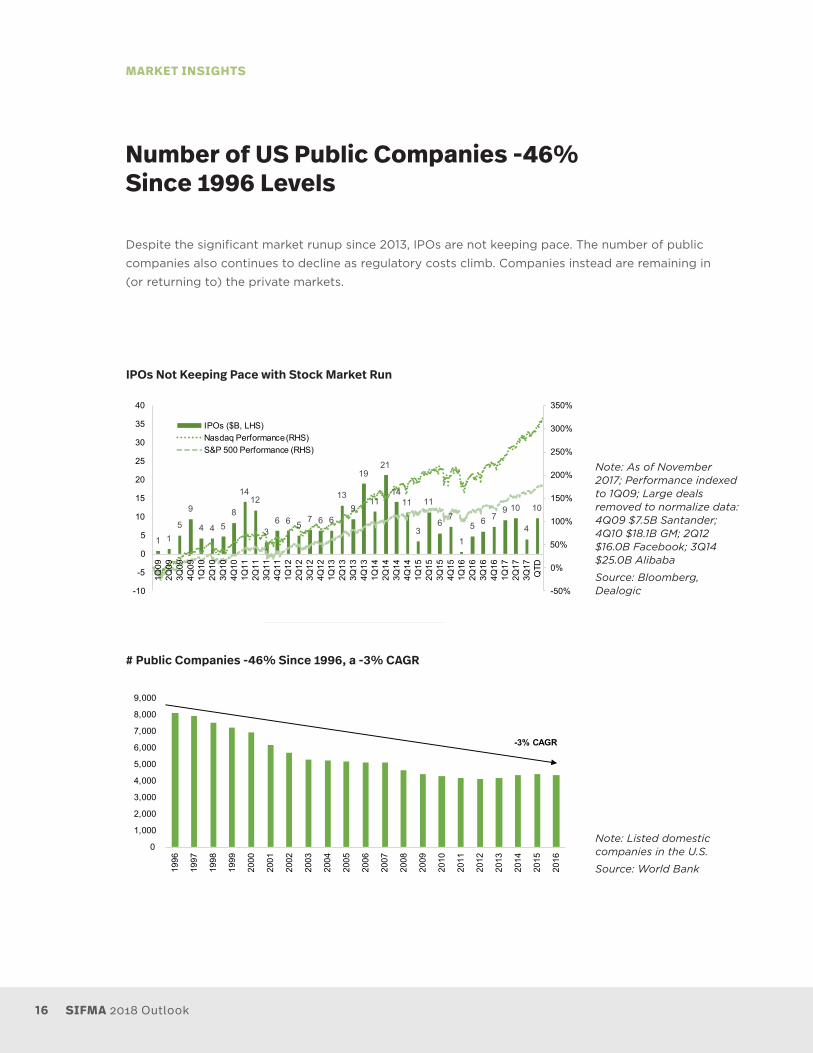
Number of US Public Companies -46% Since 1996 Levels
Despite the significant market runup since 2013, IPOs are not keeping pace. The number of public
companies also continues to decline as regulatory costs climb. Companies instead are remaining in
(or returning to) the private markets.
Note: As of November 2017; Performance indexed to 1Q09; Large deals removed to normalize data: 4Q09 $7.5B Santander; 4Q10 $18.1B GM; 2Q12 $16.0B Facebook; 3Q14 $25.0B Alibaba
Source: Bloomberg, Dealogic
IPOs Not Keeping Pace with Stock Market Run
# Public Companies -46% Since 1996, a -3% CAGR
1 15
9
4 4 58
1412
36 6 5
7 6 6
139
19
11
21
1411
3
11
67
1
5 6 79 10
4
10
1/2/09 1/2/10 1/2/11 1/2/12 1/2/13 1/2/14 1/2/15 1/2/16 1/2/17
-50%
0%
50%
100%
150%
200%
250%
300%
350%
-10
-5
0
5
10
15
20
25
30
35
40
1Q09
2Q09
3Q09
4Q09
1Q10
2Q10
3Q10
4Q10
1Q11
2Q11
3Q11
4Q11
1Q12
2Q12
3Q12
4Q12
1Q13
2Q13
3Q13
4Q13
1Q14
2Q14
3Q14
4Q14
1Q15
2Q15
3Q15
4Q15
1Q16
2Q16
3Q16
4Q16
1Q17
2Q17
3Q17
QTD
IPOs Not Keeping Pace with Stock Market Run
IPOs ($B, LHS)Nasdaq Performance (RHS)S&P 500 Performance (RHS)
17
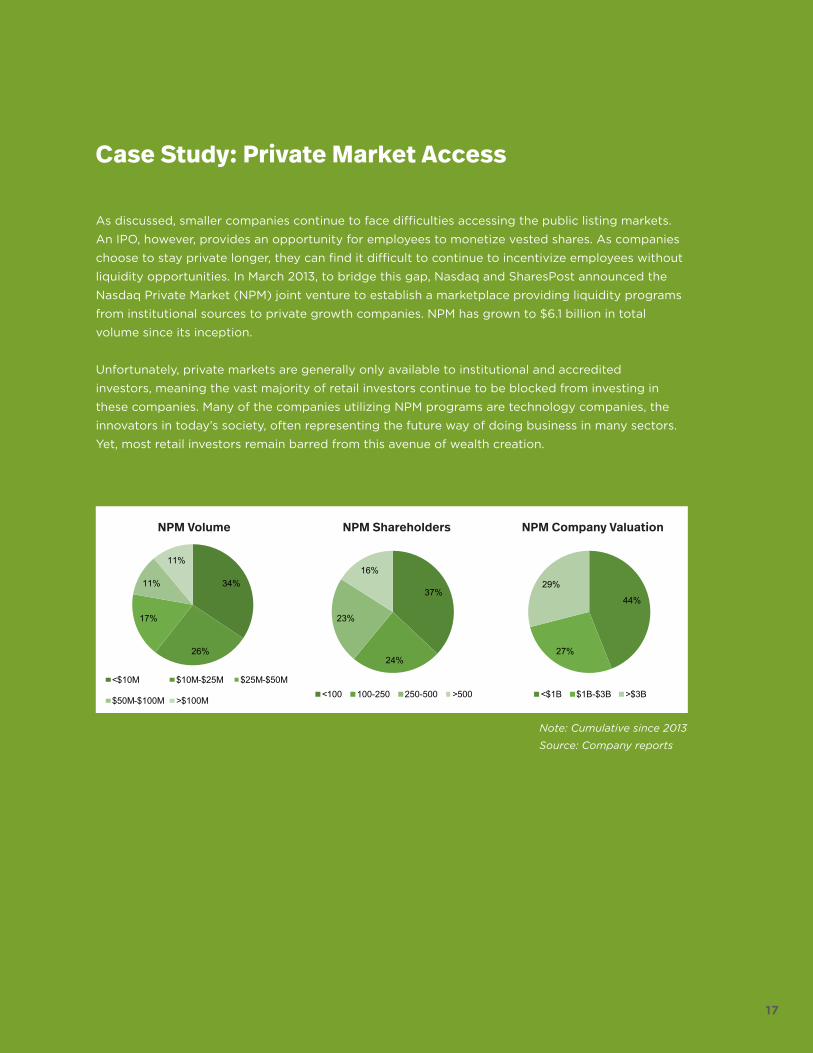
Case Study: Private Market Access
As discussed, smaller companies continue to face difficulties accessing the public listing markets.
An IPO, however, provides an opportunity for employees to monetize vested shares. As companies
choose to stay private longer, they can find it difficult to continue to incentivize employees without
liquidity opportunities. In March 2013, to bridge this gap, Nasdaq and SharesPost announced the
Nasdaq Private Market (NPM) joint venture to establish a marketplace providing liquidity programs
from institutional sources to private growth companies. NPM has grown to $6.1 billion in total
volume since its inception.
Unfortunately, private markets are generally only available to institutional and accredited
investors, meaning the vast majority of retail investors continue to be blocked from investing in
these companies. Many of the companies utilizing NPM programs are technology companies, the
innovators in today’s society, often representing the future way of doing business in many sectors.
Yet, most retail investors remain barred from this avenue of wealth creation.
17
Note: Cumulative since 2013
Source: Company reports
34%
26%
17%
11%
11%
NPM Volume
<$10M $10M-$25M $25M-$50M
$50M-$100M >$100M
44%
27%
29%
NPM Company Valuation
<$1B $1B-$3B >$3B
37%
24%
23%
16%
NPM Shareholders
<100 100-250 250-500 >500
NPM Volume NPM Shareholders NPM Company Valuation
SIFMA 2018 Outlook18
MARKET INSIGHTS
0
5
10
15
20
25
30
35
40
3,500
4,000
4,500
5,000
5,500
6,000
1991
1992
1993
1994
1995
1996
1997
1998
1999
2000
2001
2002
2003
2004
2005
2006
2007
2008
2009
2010
2011
2012
2013
2014
2015
2016
# Broker-Dealers (LHS) # Primary Dealers (RHS)
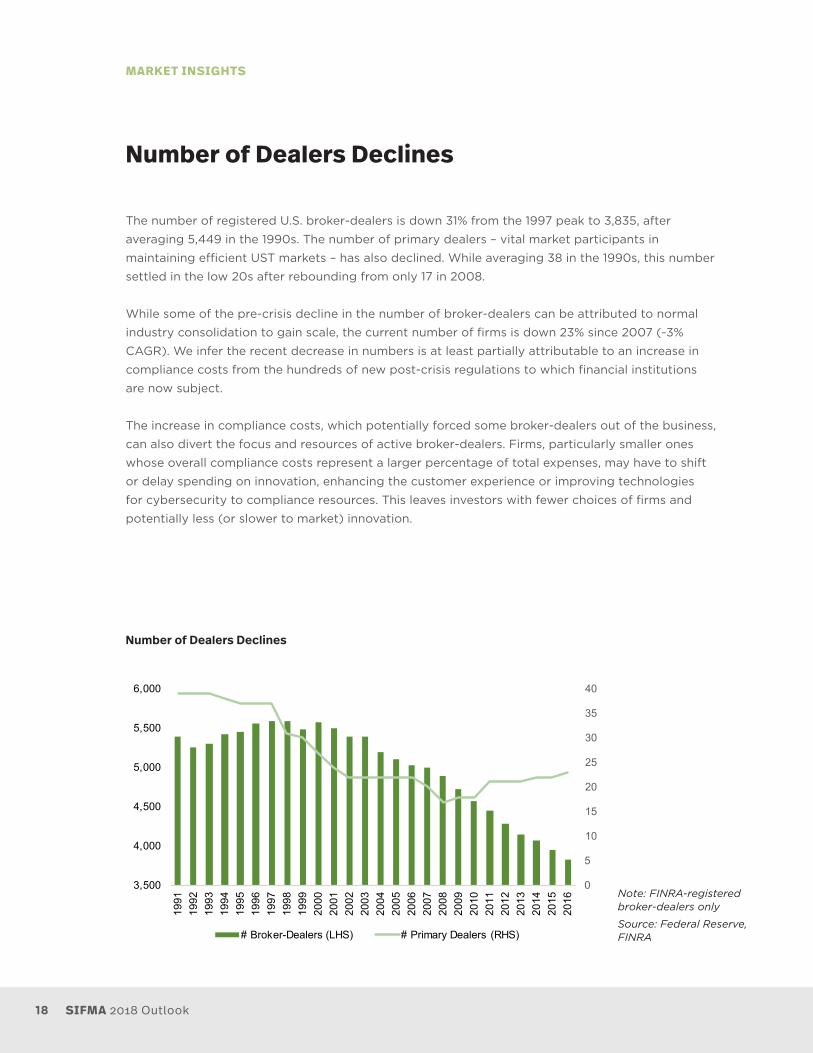
Number of Dealers Declines
The number of registered U.S. broker-dealers is down 31% from the 1997 peak to 3,835, after
averaging 5,449 in the 1990s. The number of primary dealers – vital market participants in
maintaining efficient UST markets – has also declined. While averaging 38 in the 1990s, this number
settled in the low 20s after rebounding from only 17 in 2008.
While some of the pre-crisis decline in the number of broker-dealers can be attributed to normal
industry consolidation to gain scale, the current number of firms is down 23% since 2007 (-3%
CAGR). We infer the recent decrease in numbers is at least partially attributable to an increase in
compliance costs from the hundreds of new post-crisis regulations to which financial institutions
are now subject.
The increase in compliance costs, which potentially forced some broker-dealers out of the business,
can also divert the focus and resources of active broker-dealers. Firms, particularly smaller ones
whose overall compliance costs represent a larger percentage of total expenses, may have to shift
or delay spending on innovation, enhancing the customer experience or improving technologies
for cybersecurity to compliance resources. This leaves investors with fewer choices of firms and
potentially less (or slower to market) innovation.
Note: FINRA-registered broker-dealers only
Source: Federal Reserve, FINRA
Number of Dealers Declines
19
3.9
8.6 8.7
8.110.2 10.3
13.314.3 14.0
13.0 13.5
3.7
8.6 8.88.4
11.0 11.3
15.116.1 15.9
14.815.4
4.6
8.3 8.37.1 7.5
6.6 7.08.1 8.0 7.7 7.8
3
5
7
9
11
13
15
17
FY07 FY08 FY09 FY10 FY11 FY12 FY13 FY14 FY15 FY16 3Q17
Excess Liquidity Trapped in the System
CCAR
G-SIB
Non G-SIB
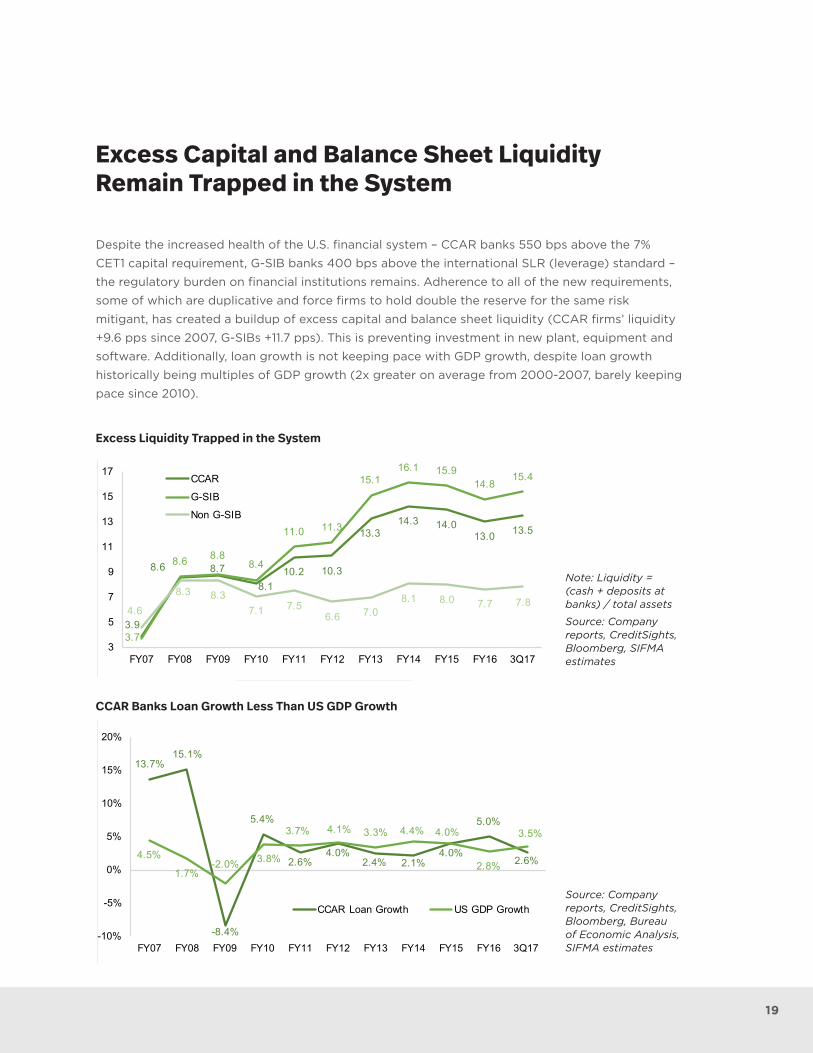
Excess Capital and Balance Sheet Liquidity Remain Trapped in the System
Despite the increased health of the U.S. financial system – CCAR banks 550 bps above the 7%
CET1 capital requirement, G-SIB banks 400 bps above the international SLR (leverage) standard –
the regulatory burden on financial institutions remains. Adherence to all of the new requirements,
some of which are duplicative and force firms to hold double the reserve for the same risk
mitigant, has created a buildup of excess capital and balance sheet liquidity (CCAR firms’ liquidity
+9.6 pps since 2007, G-SIBs +11.7 pps). This is preventing investment in new plant, equipment and
software. Additionally, loan growth is not keeping pace with GDP growth, despite loan growth
historically being multiples of GDP growth (2x greater on average from 2000-2007, barely keeping
pace since 2010).
Note: Liquidity = (cash + deposits at banks) / total assets
Source: Company reports, CreditSights, Bloomberg, SIFMA estimates
Source: Company reports, CreditSights, Bloomberg, Bureau of Economic Analysis, SIFMA estimates
Excess Liquidity Trapped in the System
13.7%15.1%
-8.4%
5.4%
2.6%4.0%
2.4% 2.1%4.0%
5.0%
2.6%4.5%
1.7%-2.0% 3.8%
3.7% 4.1% 3.3% 4.4% 4.0%
2.8%
3.5%
-10%
-5%
0%
5%
10%
15%
20%
FY07 FY08 FY09 FY10 FY11 FY12 FY13 FY14 FY15 FY16 3Q17
CCAR Banks Loan Growth Less Than US GDP Growth
CCAR Loan Growth US GDP Growth
CCAR Banks Loan Growth Less Than US GDP Growth


The U.S. capital markets are deep and mature, and the financial industry that
provides access to them is subject to robust and ever-growing regulatory
oversight. In response to the Presidential Executive Order on Core Principles
for Regulating the United States Financial System, the U.S. Department of the
Treasury has undertaken a comprehensive review of this complex regulatory
infrastructure - including prudential and capital markets frameworks - to ensure
policies promote growth, job creation, investment and financial stability.
With over a 100-year history of substantive contributions to the policymaking
and regulatory process, SIFMA works on issues critical to the industry’s ability
to facilitate the development of and access to the capital markets. These
Industry Viewpoints are the consensus views of more than 13,000 on-the
ground personnel from several hundred SIFMA member firms. In 2017, our work
has included over 130 comment letters to federal, state and industry regulators;
9 testimonies before federal and state legislatures; 16 amicus briefs in court
cases addressing key legal issues facing our industry; nearly 100 conferences
and events; and countless roundtables to exchange industry best practices.
SIFMA also led several initiatives related to critical industry operations including
the successful conversion to the shortened T+2 settlement cycle and multiple
efforts around cybersecurity and business continuity planning.
Industry Viewpoints

SIFMA 2018 Outlook22
INDUSTRY VIEWPOINTS
Cybersecurity is a top priority in the financial industry to ensure the security of customer assets
and information and the efficient, reliable execution of transactions within markets.
The financial industry is committed to furthering the development of industry-wide cybersecurity
initiatives that protect our clients and critical business infrastructure, improve data sharing
between public and private entities and safeguard customer information. An effective and efficient
cybersecurity policy is achieved most easily through harmonized, risk-based global standards that
leverage extensive investments already made. The NIST Cybersecurity Framework represents a
potential global standard.
SIFMA is actively engaged in coordinating the effort to support a safe, secure information
infrastructure, which provides security of customer information and efficient, reliable execution
of transactions. We continually work with industry and government leaders to identify and
communicate cybersecurity best practices for firms of all sizes and capabilities, and educate the
industry on evolving threats and appropriate responses.
"There is likely no greater threat to financial stability than a large-scale cyber event.”
Kenneth E. Bentsen, Jr., President and CEO, SIFMA Testimony before the House Financial Services Committee Subcommittee on Financial Institutions and Consumer Credit, November 2017
CYBERSECURITYwww.sifma.org/cybersecurity
SIFMA Completes Quantum Dawn IV Cybersecurity Exercisewww.sifma.org/cybersecurity-resources
On November 7–8, more than 900 participants from over 50 financial institutions, government
agencies and regulators participated in an industry-wide simulation of a large-scale cyberattack on
the financial markets. "A clear takeaway from the exercise is the importance of a robust partnership
between the industry and government grounded in information sharing. No single actor – not the
federal government, nor any individual firm – has the resources to protect markets from cyber
threats on their own," said Kenneth E. Bentsen, Jr.
SIFMA 2018 Outlook22
2323
PERSONAL DATA AGGREGATIONwww.sifma.org/personal-data-aggregation
The ability to gain data through technology has created opportunities for financial firms to better
engage with clients and build environments where investors can access the information they need
to make informed decisions. An individual’s personal information is invaluable, and its protection is
of paramount importance.
The financial industry is committed to ensuring the safety of the clients we serve at every turn.
SIFMA is coordinating a broad-based industry effort to protect a customer’s financial information,
with a focus on investors' right to access their own data. We are creating a set of industry-wide
principles for protecting, sharing and aggregating customer financial information. We will look at
standard contracts and other ways that we may promote transparency, efficiency and trust in the
marketplace.
“As we continue to grow this digital economy, it’s become apparent that the most important currency is an individual’s personal information. As an industry we have an obligation and a responsibility to protect it.”
Lisa Kidd Hunt, Executive Vice President, International Services and Special Business Development, Charles Schwab & Co., Inc. and Chair, 2017-2018 SIFMA Board of Directors 2017 SIFMA Annual Meeting, October 2017
With the financial services industry a top target, facing tens of thousands of cyberattacks each
day, the exercise underscored the critical need for an effective allocation of cybersecurity
resources at financial institutions. Large financial institutions report that approximately 40 percent
of corporate cybersecurity activities are compliance-oriented rather than security-oriented.
Enhanced harmonization of regulatory standards and supervision to reduce the amount of
duplicative or redundant rules would help enable firms to devote more resources to security and
better protect investors.
SIFMA 2018 Outlook24
INDUSTRY VIEWPOINTS
In response to the “flash crash” in 2010, the Securities and Exchange Commission (SEC) has directed
self-regulatory organizations (SROs), comprising securities exchanges and the Financial Industry
Regulatory Authority (FINRA), to develop and implement a Consolidated Audit Trail (CAT) that will
enable regulators to efficiently and accurately track all activity throughout the U.S. for equities and
listed options. Thesys Technologies LLC was selected by the SROs in January 2017 to build the CAT.
The design of this system will allow regulators to link every order through its entire life cycle,
including cancellations, modifications and executions. When developed, the CAT will be a single
comprehensive database that will link all orders with the account holder or person who has trading
discretion over the account, thereby enabling regulators to conduct cross-market analysis while
obtaining and merging together large volumes of disparate data from different entities.
SIFMA advocates for a secure CAT system that expedites the retirement of duplicative systems,
while promoting an inclusive governance structure and equitable funding model. As development
continues to support this major initiative, SIFMA is engaged with the SEC, the SROs and Thesys on
data security and implementation issues.
“The CAT would be the world’s largest data repository for securities transactions... In light of increasing cyber risk, we urge regulators to study the costs and benefits to determine if the collection, storage, and use of personally-identifiable information (PII) is necessary.”
Randy Snook, Executive Vice President, SIFMAPress Release: SIFMA Requests Delay in CAT in Light of Ongoing Concerns, November 2017
CONSOLIDATED AUDIT TRAIL (CAT)www.sifma.org/consolidated-audit-trail
Industry Shortens Settlement Cyclewww.sifma.org/shortened-settlement-cycle
Following a multi-year broad-based industry initiative, on September 5, 2017 the financial services
industry successfully transitioned to a shortened standard settlement time frame of trade date plus
two days (T+2) for in-scope securities. A fundamental change to settlement practices and the most
significant operation change in two decades, the new two-day settlement cycle reduces risk and
enhances U.S. market structure while improving market safety and providing efficiency for investors.
SIFMA 2018 Outlook24

2525
“Reg NMS has also contributed to a highly complex stock market with a significant focus on the speed of execution.”
T.R. Lazo, Managing Director and Associate General Counsel, SIFMAFuture of Reg NMS is a Top Issue, June 2017
MARKET STRUCTUREwww.sifma.org/market-structure
Previously, the securities industry settled equities, corporate and municipal bonds,
unit investment trusts, and financial instruments comprising these products on the third business
day after a trade is executed (T+3). Shortening the U.S. settlement cycle provides several benefits,
including reducing operational, systemic and counterparty risk and lowering liquidity needs, while
aligning the U.S. with other T+2 settlement markets across the globe. A shorter settlement cycle
enhances market structure by improving safety and efficiency for investors. SIFMA, as co-chair of the
T+2 Industry Steering Committee together with the Investment Company Institute and The Depository
Trust & Clearing Corporation (DTCC), coordinated efforts to assess the scope, requirements, and
changes needed to facilitate the implementation of T+2 and ensure a successful transition.
The structure of our financial markets must be continually evaluated to ensure regulation evolves
with the dynamic marketplace. It’s important to recognize the clear distinctions between the equity
and fixed income markets; while there is an optimal market structure for each, there is no one-size-
fits-all solution.
The adoption of Regulation NMS in 2005 has had a tremendous impact on the equities market.
More than a decade later, the time is right to consider changes to modernize Regulation NMS
and increase its effectiveness. SIFMA has proposed a series of actionable recommendations that
encourage an overhaul of the market data system and a complete rethinking of the role of SROs
and the NMS Plans they control. Our ultimate goal is to improve market resilience while ensuring
the market continues to benefit investors and play an essential role in capital formation.
Equity market policies must not and cannot be transposed to fixed income, a group of unique
marketplaces where change is happening in both its infrastructure and market participant profile.
As new regulations are contemplated, they must keep pace with an increasingly connected and
technology-driven marketplace that provides access to capital in an extremely efficient manner
(in 2016 alone, over 1,300 companies raised $1.5 trillion in the corporate bond markets to fund
their operations and growth). SIFMA is working to shed light on the uniqueness, importance and
diversity of the Treasury market as rulemakings are considered; increase awareness of developments
in electronic bond trading for corporate and municipal securities; and promote liquidity and
transparency with market-based solutions.
SIFMA 2018 Outlook26
INDUSTRY VIEWPOINTS
U.S. capital markets are a critical source of financing for businesses and governments, particularly
small and mid-sized businesses. Unfortunately, the impact of many new financial regulations
has reduced the efficient allocation of credit and capital which has dampened the potential for
economic growth and job creation. Congress and the SEC should address this concerning trend by
reassessing regulations to allow more businesses to readily access U.S. capital markets.
While the U.S. financial system is significantly stronger, better capitalized and more resilient than
it was in 2008, the economy has performed subpar as compared to prior post-recession periods.
Small and mid-sized businesses, in particular, are a great source of economic growth and job
creation, and financial regulation should be better tailored to support their access to capital.
A continued decline in the number of public companies and a decline in the number of initial public
offerings (IPOs) raises concerns that regulatory burdens are unduly hampering capital formation
generally and may reduce small investors’ ready access to investment opportunities.
Many opportunities exist to reduce regulatory burdens for issuers and enhance capital while
maintaining important protections for investors. We believe our proposals will serve to enhance
access to financing, providing the opportunity for greater economic growth and job creation:
several Jumpstart Our Business Startups Act (JOBS Act) accommodations that are currently
available for Emerging Growth Companies (EGCs) should be extended to all issuers of public
securities; certain existing regulations should be reformed and revised to reduce the burdens on
issuers accessing public markets, such as amending the “smaller reporting company” definition
and expanding the Rule 139 safe harbors on continuing research coverage; private investment and
secondary market trading in restricted securities should be promoted by amending the definition
of accredited investor and revising certain provisions of Reg D; and greater liquidity in secondary
market public resales should be encouraged by making several amendments to Rule 144.
“Clients are concluding that the public market source of capital is unattractive relative to M&A or private equity.”
Ronald J. Kruszewski, Chairman and CEO, Stifel Financial Corp.2017 SIFMA Annual Meeting, October 2017
CAPITAL FORMATIONwww.sifma.org/capital-formation

27
SIFMA strongly supports enhancing investor protections by establishing a heightened and more
stringent broker-dealer best interest standard. The SEC should take the lead in coordination with
the DOL to develop such a principles-based standard of conduct for the benefit of investors.
Unfortunately, the Department of Labor’s fiduciary standard of conduct rule for brokers and
registered investment advisors serving people with Individual Retirement Accounts (IRAs) and 401K
plans is a misguided rule that makes saving for retirement more difficult for the very same savers
it seeks to protect. Since early 2009, SIFMA has consistently advocated for the establishment of a
best interest standard for financial professionals when providing retirement advice. We continue to
support such a standard under the industry’s primary regulator, the U.S. Securities and Exchange
Commission (SEC). Specifically, the standard should: apply across all securities recommendations
made to retail customers in all broker-dealer accounts, not just to IRA accounts; fit within the
existing and long-standing securities regulatory regime for broker-dealers; and require rigorous
examination, oversight and enforcement by the SEC, FINRA and state securities regulators.
“The Department of Labor’s fiduciary rule has not yet fully taken effect, and already retirement savers are feeling the burden.”
Kenneth E. Bentsen, Jr., President and CEO, SIFMAOped for The Hill: Retirement Savers Are at Risk Under Labor’s Financial Advisor Rule, September 2017
BEST INTEREST STANDARDwww.sifma.org/fiduciary
With the adoption of complex, conservative, prudential regulatory requirements, banks are now
subject to multiple risk-based capital ratios, leverage ratios, capital buffers and TLAC ratios.
As a result, banks hold excessive levels of capital and liquidity that are increasingly disconnected
from the level of risk they incur. Although these levels have undoubtedly increased resiliency,
they come at a cost: the more capital required, the less deployed into the economy.
SIFMA Proposes Revisions to Prudential Regulationswww.sifma.org/prudential-regulation
27

SIFMA 2018 Outlook28
INDUSTRY VIEWPOINTS
SIFMA supports tax reform that enhances economic opportunities for individual Americans, promotes
savings and encourages investment, and lowers the tax rate for American businesses that compete
in a global marketplace where the U.S. tax rate is an outlier and the U.S. international tax system is
out of step with our global competitors. SIFMA supports movement to a territorial tax system that
recognizes the unique characteristics of the financial services industry, a transition to such a system
that is fair and equitable for U.S. financial services companies and investors, and tax rules for inbound
investment that encourages foreign investment in the U.S. and does not discriminate against non-U.S.
financial services companies seeking to compete in U.S. markets.
After decades of underinvestment, we face an extreme infrastructure deficit in the United States.
In order to bring our infrastructure into the 21st century and support a growing economy, we need
to invest more in essential projects including highways, water and sewer systems, bridges, airports
and more. The Trump Administration has identified infrastructure as one of the top priorities of the
President’s agenda, but its fate is tied to tax reform.
The problem we face is not a lack of capital, but rather the ability to identify reliable funding
sources to support debt service, return on capital and maintenance costs. At SIFMA, we
recommend fully preserving the tax exemption for municipal bonds; expanding Public-Private
Partnerships (P3s), including the use of Private Activity Bonds (PABs); promoting private
investment in public projects; applying design-build strategies; and reviving direct-pay bonds. In
order to bring our infrastructure into the 21st century, we need to invest more without imposing
burdens that can weigh down our economy.
“Modernizing the Internal Revenue Code is critical to all Americans and has the potential to unleash unprecedented economic growth.”
Kenneth E. Bentsen, Jr., President and CEO, SIFMAPress Statement on Tax Reform Announcement, July 2017
“With heightened recognition across the country, our leaders and citizens, why is infrastructure still in crisis?”
Michael Decker, Managing Director and Co-Head of Municipal Securities, SIFMAAmerica’s Infrastructure: The Time to Build is Now, May 2017
TAX POLICY AND REFORMwww.sifma.org/tax-policy-and-reform
INFRASTRUCTURE FINANCEwww.sifma.org/infrastructure-finance
29
The environment for capital formation and investment can be enhanced by opening global markets,
strengthening investment and regulatory climates in all markets, and promoting consistent
regulation and legislation globally. Working in close coordination with SIFMA’s global affiliate, the
Global Financial Markets Association (GFMA), SIFMA advocates for consistent and coordinated
regulation globally ranging from, for example, prudential requirements and the regulation of OTC
derivatives to the facilitation of cross-border implementation of MiFID II's research provisions.
SIFMA also believes free- and fair-trade agreements promote U.S. economic growth and job
creation by expanding opportunities for financial services firms to compete in overseas markets
and better serve their clients. Trade agreements are most beneficial to the real economy when
they are comprehensive, so SIFMA continues to work with policymakers to ensure financial
services are fully included in them. We strongly support a modernized North American Free Trade
Agreement (NAFTA); continue to advocate for a level playing field between domestic and foreign
financial services firms in China; and coordinate closely with GFMA to help the UK and EU to
deliver Brexit in a way that protects global financial stability.
“It is in our own national interest to ensure American financial services firms can continue to compete in overseas markets.”
Peter Matheson, Managing Director, International Policy and Advocacy, SIFMAOp ed for The Hill: "Modern-Day NAFTA Must Account for Modern Financial Services Firms", July 2017
INTERNATIONAL ISSUESwww.sifma.org/cross-border-policy-and-advocacy
The Global Financial Markets Association (GFMA) is an extension of its regional association
members: the Association for Financial Markets in Europe (AFME) in London and Brussels, the Asia
Securities Industry & Financial Markets Association (ASIFMA) in Hong Kong and SIFMA in New York
and Washington are, respectively, the European, Asian and North American members of GFMA.
GFMA’s mission is to provide a forum for global systemically important banks to develop policies
and strategies on issues of global concern within the regulatory environment.
The GFMA Partnershipwww.gfma.org
29


Our society has an extreme need for financial literacy, an issue that has
broad implications for our communities and the larger economy. At SIFMA,
we are committed to tackle this issue from the ground up, empowering the
next generation with an understanding of the market economy and teaching
good financial habits that when taught young can last a lifetime.
Community and Resources

SIFMA 2018 Outlook
COMMUNITY AND RESOURCES
32
The SIFMA Foundationwww.sifma.org/foundation
This year, the SIFMA Foundation celebrates its 40th anniversary of success strengthening
economic opportunities for individuals of all backgrounds and increasing their understanding of
the benefits of the global marketplace. Through a robust portfolio of dynamic, rigorous online
educational programs that emphasize asset allocation, long-term planning, diversification and
problem solving, the SIFMA Foundation has advanced financial capability for 17 million young
people across the country.
Year after year, SIFMA member firms’ critical support enables the SIFMA Foundation to equip
elementary through high school teachers to teach their students first-hand about personal
finance and the capital markets, prepare them for college and the workplace, and motivate
them to explore jobs and careers in the financial sector. The SIFMA Foundation promotes best
practices and thought leadership through key partnerships, including engaging 6,000 industry
professionals as volunteers and every single member of Congress in advancing financial
capability for 600,000 students each year.
An independent study by Learning Point Associates found SMG students scored significantly
higher on mathematics and financial literacy tests than their non-SMG peers. They also found
that SMG teachers reported the program motivated them to better plan for their future and to
engage in financial planning, research, and use of investment products and services.
The SIFMA Foundation offers a variety of volunteer and community engagement activities in
person and online. From visiting classrooms to judging student essays, the SIFMA Foundation
has a volunteer opportunity just right for you. Sign up today and discover specific ways you can
bring your passion and expertise into classrooms and youth-serving nonprofits.
“Students who played The Stock Market Game™ scored significantly higher on mathematics and financial literacy tests than their peers that did not play.”
Learning Point Associates

33
Accompanied by students, teachers, and parents from P.S. 174 in Queens County, New York, Melanie Mortimer, president of the SIFMA Foundation and Joan Steinberg, Chair of the SIFMA Foundation Board of Directors from 2014-17, and Morgan Stanley Managing Director & Global Head of Philanthropy, rang the Nasdaq opening bell.
© Copyright Nasdaq
“Financial literacy is so much more than stocks and bonds. Thank you so much for this great opportunity for our school and our students. Please know that we appreciate all that the SIFMA Foundation programs contribute to our curriculum.”
Karin Kelly, Principal, P.S. 174
33
SIFMA 2018 Outlook
COMMUNITY AND RESOURCES
34
Board of Directors2017–2018
James R. Allen Chairman & CEO Hilliard Lyons
Dan Arnold President LPL Financial
Kevin Bailey Global Head of Regulatory Affairs Citi
Barry Bausano CEO & President, Deutsche Bank Securities, Chairman, Hedge Funds Deutsche Bank AG
Kenneth E. Bentsen, Jr. President and CEO SIFMA
Valerie G. Brown Executive Chairman Advisor Group, Inc.
William C. Caccamise General Counsel of Global Banking, Global Markets, and International Bank of America Merrill Lynch
Sylvain Cartier Managing Director & Head of Trading, Fixed Income & Currencies, Americas Societe Générale
Michael Crowl Group Managing Director and General Counsel for UBS Group Americas and UBS Wealth Management Americas (WMA) UBS AG
Lisa Dolly Chief Executive Officer Pershing, a BNY Mellon company
John Ettelson President & Chief Executive Officer William Blair
David Findlay President and CEO Nomura Holdings America Inc.
Kim Tillotson Fleming Chairman and Chief Executive Officer Hefren-Tillotson, Inc.
Tim Hockey President and CEO TD Ameritrade
Lisa Kidd Hunt Executive Vice President, Business Initiatives Charles Schwab & Co., Inc.
James B. Kelligrew, Jr. Vice Chairman/Co-Head Wholesale Banking U.S. Bancorp
Jim Kerr CEO D.A. Davidson
Andrew Komaroff Chief Operating Officer Neuberger Berman Group LLC
Thomas M. McDonald Chief Executive Officer McDonald Partners, LLC
Gerard McGraw Chief Financial Officer Fidelity Management & Research, LLC
Charlotte McLaughlin President & CEO PNC Capital Markets
2017 ChairTimothy C. Scheve
2018 Chair Lisa Kidd Hunt
35
Brand Meyer Senior Managing Director Wells Fargo Advisors, LLC
Sandra O’Connor Chief Regulatory Affairs Officer JPMorgan Chase & Co.
Edward Pick Global Head of Sales and Trading Morgan Stanley
Paul E. Purcell Chairman & Chief Executive Officer Robert W. Baird & Co. Incorporated
Paul Reilly Chief Executive Officer Raymond James Financial
John F. W. Rogers Executive Vice President, Chief of Staff and Secretary to the Board Goldman, Sachs & Co.
Thierry Roland CEO of Global Banking & Markets Americas HSBC
Timothy C. Scheve President and Chief Executive Officer Janney Montgomery Scott LLC
Ursula Schliessler Chief Administrative Officer Legg Mason Global Asset Management
Peter W. Schneider President Primerica
Suzanne Shank Chairwoman and CEO Siebert Cisneros Shank & Co., LLC
Paul Stevelman Head of US NatWest Markets
Joseph E. Sweeney President, Advice & Wealth Management, Products and Services Delivery Ameriprise Financial, Inc.
James A. Tricarico, Jr. Chief Legal Officer, Principal Edward Jones
James Wallin Senior Vice President AB
Lewis H. Wirshba Vice Chairman and Managing Director Credit Suisse Holdings (USA)
Gary Wunderlich Chief Executive Officer Wunderlich Securities, Inc.
W. Rufus Yates Senior Executive Vice President, Financial Services Manager BB&T Corp. President & CEO BB&T Securities
TreasurerJames Wallin
Chair-Elect James R. Allen
Vice Chair William C. Caccamise
President and CEOKenneth E. Bentsen, Jr.
COMMUNITY AND RESOURCES
SIFMA 2018 Outlook36
Terms to Know
AI Artificial Intelligence
BCP Business Continuity Planning
DLT Distributed Ledger Technology*
Fintech Financial Technology
NIST National Institute of Standards and Technology
PII Personally Identifiable Information
Regtech Regulatory Technology
CAT Consolidated Audit Trail
EGC Emerging Growth Company
IPO Initial Public Offering
NMS National Market System
SRO Self Regulatory Organization
DCM Debt Capital Markets
ECM Equity Capital Markets
FICC Fixed Income, Currencies and Commodities
* Blockchain is one type of DLT
CCAR Comprehensive Capital Analysis and Review
CET1 Common Equity Tier 1
FRTB Fundamental Review of the Trading Book
G-SIB Global Systemically Important Bank
HQLA High Quality Liquid Assets
LCR Liquidity Coverage Ratio
NSFR Net Stable Funding Ratio
SLR Supplemental Leverage Ratio
TLAC Total Loss-Absorbing Capacity
AUM Assets Under Management
BPS Basis Points
CAGR Compound Annual Growth Rate
PPS Percentage Points
SALT State and Local Tax
UST US Treasuries
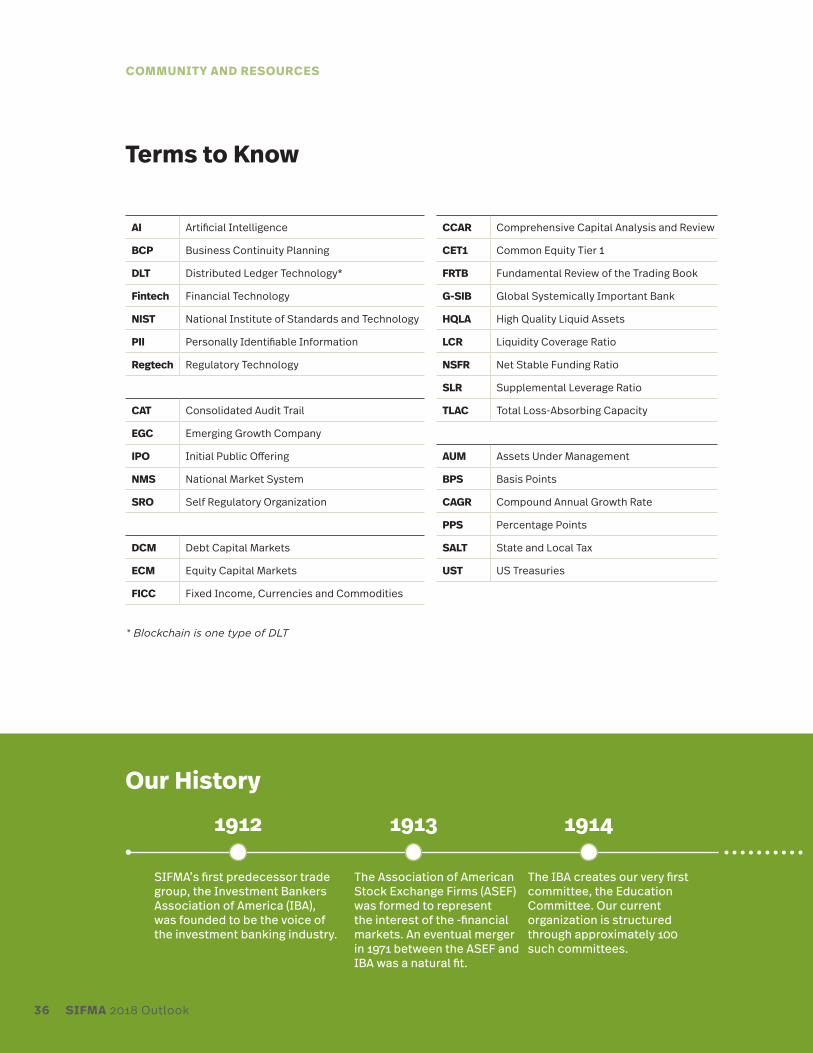
Our History
1912 1913 1914
SIFMA’s first predecessor trade group, the Investment Bankers Association of America (IBA), was founded to be the voice of the investment banking industry.
The Association of American Stock Exchange Firms (ASEF) was formed to represent the interest of the -financial markets. An eventual merger in 1971 between the ASEF and IBA was a natural fit.
The IBA creates our very first committee, the Education Committee. Our current organization is structured through approximately 100 such committees.
SIFMA 2018 Outlook36

37
SIFMA Committees
SIFMA’s unique strength has always been the deep engagement of our members throughout our
broad committee infrastructure. More than 13,000 professionals from hundreds of firms participate
on approximately 100 product, policy, functional and enterprise Committees and countless working
groups. These entities develop policies and practices affecting every aspect of the capital markets,
across business divisions and through operations, risk, compliance and more.
1 CMG includes: (1) Derivatives = OTC Derivatives; (2) Equity = Equity Capital Markets and Listed Option; and (3) FICC = Commodities (via GFMA), Credit Markets, Foreign Exchange (via GFMA), Municipal Securities, Rates and Funding and Securitization
1971 1976 1997 2007 – Present
IBA and ASEF merged to form the Securities Industry Association (SIA), as the industry recognized the need to formally combine efforts and establish one association representing all of Wall Street.
IBA’s Municipal Securities and Government Bonds Committees (established in 1918) incorporated as an independent organization, forming the Public Securities Association (PSA).
PSA expanded over the years and changed its name to The Bond Market Association (TBMA) to reflect the organization’s growing representation of the debt markets.
Starting a new chapter but building on our shared history, the Securities Industry and Financial Markets Association (SIFMA) was created through the merger of SIA and TBMA.
37
Public Policy & Advocacy
Federal Policy
International Policy
State Government Relations
Business Policies & Practices
Asset Management Group (AMG)
Capital Markets Group (CMG)1
Private Client Group (PCG)
Office of the General Counsel
General Counsel
Compliance & Legal
Amicus Program
InfrastructureOperations, Technology and BCP
Communications & Marketing
Research and Surveys
SIFMA 2018 Outlook
COMMUNITY AND RESOURCES
38
BUSINESS POLICIES AND PRACTICES [email protected] 212.313.1000
PUBLIC POLICY AND ADVOCACY 202.962.7300
OFFICE OF THE GENERAL COUNSEL 202.962.7300
MEMBERSHIP [email protected] 212.313.1150
SIFMA Key Contactswww.sifma.org/contact
2018 Conferences & Eventswww.sifma.org/events
FIA SIFMA AMG Asset Management Derivatives ForumFebruary 7–9The Ritz-Carlton, Laguna NiguelDana Point, CA
Anti-Money Laundering & Financial Crimes Conference (AML)February 12–13New York Marriott MarquisNew York, NY
Social Media & Digital Marketing SeminarFebruary 22The Schwab Conference CenterSan Francisco, CA
Insurance- & Risk- Linked Securities Conference (IRLS)March 4–6Eden Roc, Miami Beach, FL
Securities Industry Institute (SII)March 4–9Wharton School of the University of PennsylvaniaPhiladelphia, PA
C&L Annual SeminarMarch 18–21JW Marriott Orlando, Grande LakesOrlando, FL
Private Client ConferenceApril 11–13The Ritz-Carlton, Naples, FL
Equity Market Structure ConferenceApril 18India House Club, New York, NY
Operations Conference & Exhibition (OPS)May 7–10JW Marriott Phoenix Desert Ridge Phoenix, AZ
Prudential Regulation ConferenceJune 19National Press Club, Washington, DC
SIFMA Annual Meeting: The Capital Markets ConferenceOctober 1–2Mandarin Oriental, Washington DCWashington, DC
PRESS AND MEDIA Katrina Cavalli [email protected] 212.313.1181
Lindsay Gilbride [email protected] 202.962.7390
Liz Pierce [email protected] 212.313.1173
RESEARCH INQUIRIES [email protected] 212.313.1000
CONFERENCES AND EVENTS [email protected] 212.313.1000
SECURITIES INDUSTRY INSTITUTE [email protected] 212.313.1108
SIFMA SOCIETIES [email protected] 212.313.1290
WEBSITE INQUIRIES [email protected] 212.313.1000

39
2018 US Holiday Schedulewww.sifma.org/holiday-schedule
All SIFMA holiday recommendations apply to the trading of U.S. dollar-denominated government
securities, mortgage- and asset-backed securities, over-the-counter investment-grade and
high-yield corporate bonds, municipal bonds and secondary money market trading in bankers'
acceptances, commercial paper and Yankee and Euro certificates of deposit. Previously scheduled
SIFMA early close recommendations do not affect the closing time for settlements.
Holiday Recommended Early Close (2:00 p.m. Eastern Time) Recommended Close
New Year’s Day 2018 Friday, December 29, 2017 Monday, January 1, 2018
Martin Luther King Day None Monday, January 15, 2018
Presidents Day None Monday, February 19, 2018
Good Friday Thursday, March 29, 2018 Friday, March 30, 2018
Memorial Day Friday, May 25, 2018 Monday, May 28, 2018
U.S. Independence Day Tuesday, July 3, 2018 Wednesday, July 4, 2018
Labor Day None Monday, September 3, 2018
Columbus Day None Monday, October 8, 2018
Veterans Day None Monday, November 12, 2018
Thanksgiving Day Friday, November 23, 2018 Thursday, November 22, 2018
Christmas Day Monday, December 24, 2018 Tuesday, December 25, 2018
New Year’s Day 2018/2019 Monday, December 31, 2018 Tuesday, January 1, 2019

New York | Washington
www.sifma.org
www.projectinvested.com