2018 ppt template; · - impact from the company’s generic program performance. 6 © 2018 cardinal...
TRANSCRIPT

Q1 FY19CARDINAL HEALTH, INC.
EARNINGS CALL
1
NOVEMBER 8, 2018
Forward-looking statements and GAAP reconciliation
© 2018 Cardinal Health. All Rights Reserved.
Cautions Concerning Forward-Looking Statements
This presentation contains forward-looking statements addressing expectations, prospects, estimates and other matters that
are dependent upon future events or developments. These statements may be identified by words such as "expect,"
"anticipate," "intend," "plan," "believe," "will," "should," "could," "would," "project," "continue," "likely," and similar
expressions, and include statements reflecting future results or guidance, statements of outlook and various accruals and
estimates. These matters are subject to risks and uncertainties that could cause actual results to differ materially from those
projected, anticipated or implied. These risks and uncertainties include competitive pressures in Cardinal Health's various
lines of business; the amount or rate of generic deflation and our ability to offset generic deflation and maintain other
financial and strategic benefits through our generic sourcing venture with CVS Health; our ability to manage uncertainties
associated with the pricing of branded pharmaceuticals, including decreased branded inflation and possible branded price
reductions; risks associated with our ability to stabilize the performance of and reduce costs associated with our Cordis
business; risks associated with the acquisition of the Patient Recovery business, including the ability to successfully
integrate the acquired businesses and the ability to achieve the expected synergies and accretion in earnings; the risk of
non-renewal under our contracts with CVS Health or one or more other key customer or supplier arrangements or changes
to the pricing or other terms of or level of purchases under those arrangements; uncertainties due to government health care
reform including federal health care reform legislation or administrative action; uncertainties with respect to the recently
enacted Tax Cuts and Jobs Act; changes in the distribution patterns or reimbursement rates for health care products and
services; risks associated with the distribution of opioids, including the cost and risk of ongoing investigations and lawsuits
by governmental and regulatory authorities as well as private plaintiffs, the financial impact of enacted and possible taxes or
other assessments on the sale of opioids, and potential reputational or operational harm; and changes in foreign currency
rates and the cost of commodities such as oil-based resins, cotton, latex and diesel fuel. Cardinal Health is subject to
additional risks and uncertainties described in Cardinal Health's Form 10-K, Form 10-Q and Form 8-K reports and exhibits to
those reports. This presentation reflects management's views as of Nov. 8, 2018. Except to the extent required by
applicable law, Cardinal Health undertakes no obligation to update or revise any forward-looking statement. In addition, this
presentation contains non-GAAP financial measures. Cardinal Health provides definitions and reconciliations of non-GAAP
financial measures and their most directly comparable GAAP financial measures in the Financial Appendix at the end of this
presentation and at ir.cardinalhealth.com.
2

3
Q1 results

Q1 FY19 financial summary
© 2018 Cardinal Health. All Rights Reserved.
GAAP Basis ($M)
Q1 FY19
1 The sum of other (income)/expense, net and interest expense, net.2Attributable to Cardinal Health, Inc.
Please see appendix for GAAP to Non-GAAP reconciliations.
$35,2138%
$816211%
$593416%
$1.94439%
Revenue% change
Operating Earnings% change
Net Earnings2
% change
Diluted EPS2
% change
$542(11)%
$39614%
$1.2918%
N/A
$1,6670%
Gross Margin% change
N/A
$1,1559%
SG&A% change
$80(4)%
Interest & Other1
% change
4
N/A
Non-GAAP Basis ($M)
Q1 FY19
$1,1266%

Q1 FY19 pharmaceutical segment results
© 2018 Cardinal Health. All Rights Reserved. 5
Q1 FY19 ($M) Q1 FY18 ($M) YoY change
Revenue $31,416 $28,920 9%
Segment profit $409 $467 (12)%
Segment profit margin 1.30% 1.61% -31 bps
Drivers:
Revenue
+ Pharmaceutical and Specialty distribution customers
- Divestiture of company’s China distribution business
Segment profit
- Impact from the company’s generic program performance
6 © 2018 Cardinal Health. All Rights Reserved.
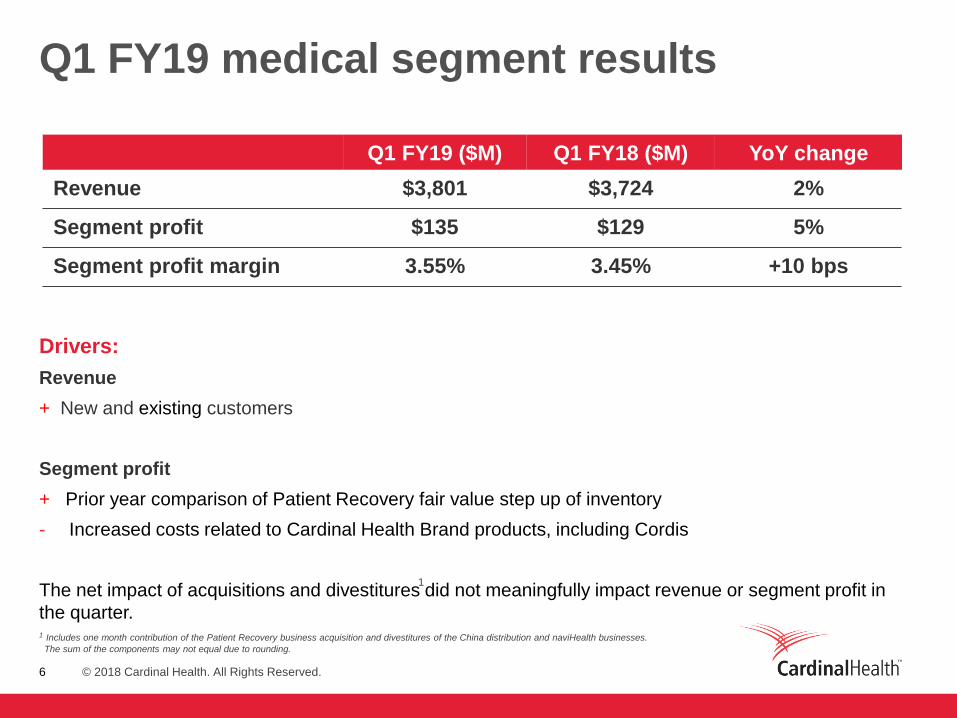
Q1 FY19 medical segment results
Q1 FY19 ($M) Q1 FY18 ($M) YoY change
Revenue $3,801 $3,724 2%
Segment profit $135 $129 5%
Segment profit margin 3.55% 3.45% +10 bps
Drivers:
Revenue
+ New and existing customers
Segment profit
+ Prior year comparison of Patient Recovery fair value step up of inventory
- Increased costs related to Cardinal Health Brand products, including Cordis
The net impact of acquisitions and divestitures did not meaningfully impact revenue or segment profit in
the quarter.1 Includes one month contribution of the Patient Recovery business acquisition and divestitures of the China distribution and naviHealth businesses.
The sum of the components may not equal due to rounding.
1

7
FY19 outlook

8
FY19 financial expectations
FY19 outlook FY18 actual
RevenueLow-single digit
percentage growth$136.8B
Non-GAAP EPS $4.90 to $5.15 $5.00
Non-GAAP ETR 25% - 28% 29.3%
Diluted weighted
average shares
outstanding
302M – 307M 315M
Interest and other $340M - $360M $352M
Capital expenditures $360M - $390M $384M
© 2018 Cardinal Health. All Rights Reserved.

9
FY19 segment outlook
Segment Revenue Profit
PharmaceuticalLow-single digit
percentage growth
High-single to low-double
digit percentage decline
MedicalLow-single digit
percentage growth
Mid to high-single digit
percentage growth
© 2018 Cardinal Health. All Rights Reserved.

10
GAAP TO NON-GAAP RECONCILIATION
STATEMENTS AND SUPPLEMENTAL
FINANCIAL INFORMATION
Q1 FY19 trailing
five quarters

11 © 2018 Cardinal Health. All Rights Reserved.11
Q1 FY19 trailing five quarters segment analysis
Pharmaceutical segment
Q1 FY18 Q2 FY18 Q3 FY18 Q4 FY18 Q1 FY19
Revenue
($M)28,920 31,146 29,720 31,455 31,416
Segment Profit ($M) 467 514 596 416 409
Medical segment
Q1 FY18 Q2 FY18 Q3 FY18 Q4 FY18 Q1 FY19
Revenue
($M)3,724 4,044 3,916 3,898 3,801
Segment Profit ($M) 129 220 199 114 135

12 © 2018 Cardinal Health. All Rights Reserved.12
Gross Operating Earnings/(Loss) Provision for/
Margin SG&A2 Operating Earnings Before (Benefit from) Net Net Effective Diluted
Gross Growth Growth Earnings/ Growth Income Income Earnings/ Earnings3 Tax Diluted EPS
3
Margin Rate SG&A2 Rate (Loss) Rate Taxes Taxes (Loss)
3 Growth Rate Rate EPS3 Growth Rate
(in millions, except per common share amounts)
GAAP 1,667$ —% 1,155 9 % 816$ 211 % 736$ 142$ 593$ 416 % 19.4 % 1.94$ 439 %
State opioid assessment related to prior fiscal years — (29) 29 29 8 21 0.07
Restructuring and employee severance — — 32 32 8 24 0.08
Amortization and other acquisition-related costs — — 156 156 36 120 0.39
Impairments and (gain)/loss on disposal of assets4 — — (511) (511) (134) (377) (1.23)
Litigation (recoveries)/charges, net — — 19 19 5 14 0.05
Non-GAAP 1,667$ —% 1,126$ 6 % 542$ (11)% 461$ 65$ 396$ 14 % 14.0 % 1.29$ 18 %
GAAP 1,672$ 5 % 1,062 15 % 262$ (51)% 178$ 61$ 115$ (63)% 34.2 % 0.36$ (63)%
Restructuring and employee severance — — 132 132 47 85 0.27
Amortization and other acquisition-related costs — — 183 183 58 125 0.40
Impairments and (gain)/loss on disposal of assets — — 1 1 — 1 —
Litigation (recoveries)/charges, net — — 32 32 13 19 0.06
Loss on extinguishment of Debt — — — 1 1 — —
Non-GAAP 1,672$ 5 % 1,062 15 % 610$ (9)% 527$ 180$ 346$ (13)% 34.1 % 1.09$ (12)%
1For more information on these measures, refer to the Use of Non-GAAP Financial Measures and Definitions schedules.2Distribution, selling, general and administrative expenses.3attributable to Cardinal Health, Inc.4First quarter 2019 includes a $508 million gain ($378 million after-tax) related to the naviHealth divestiture
The sum of the components may not equal the total due to rounding.
We generally apply varying tax rates depending on the item's nature and tax jurisdiction where it is incurred.
Cardinal Health, Inc. and Subsidiaries
GAAP / Non-GAAP Reconciliation1
First Quarter 2018
First Quarter 2019

13 © 2018 Cardinal Health. All Rights Reserved.13
Gross Operating Earnings/(Loss) Provision for/
Margin Operating Earnings Before (Benefit from) Net Net Effective Diluted
Gross Growth Earnings/ Growth Income Income Earnings/ Earnings2
Tax Diluted EPS2
Margin Rate (Loss) Rate Taxes Taxes (Loss)2
Growth Rate Rate EPS2
Growth Rate
(in millions, except per common share amounts)
GAAP 7,181$ 10 % 126$ (94)% (228)$ (487)$ 259$ (80)% 213.8 % 0.81$ (80)%
Restructuring and employee severance — 176 176 25 151 0.48
Amortization and other acquisition-related costs — 707 707 176 531 1.69
Impairments and (gain)/loss on disposal of assets4
— 1,417 1,417 (44) 1,461 4.64
Litigation (recoveries)/charges, net — 159 159 48 111 0.35
Loss on extinguishment of debt — — 2 1 1 —
Transitional tax benefit, net3
— — — 936 (936) (2.97)
Non-GAAP 7,181$ 10 % 2,585$ (7)% 2,233$ 655$ 1,578$ (9)% 29.3 % $ 5.00 (7)%
2attributable to Cardinal Health, Inc.3Reflects the estimated net transitional benefit from the re-measurement of our deferred tax assets and liabilities partially offset by the repatriation tax on cash and earnings of foreign subsidiaries. We have not yet completed our analysis of the impact of
the Tax Act and, as such, these amounts are provisional estimates and we may record additional provisional amounts or adjustments to the provisional amounts in future periods.4Fourth quarter and fiscal year 2018 include a goodwill impairment charge of $1.4 billion related to our Medical segment.
The sum of the components may not equal the total due to rounding.
We generally apply varying tax rates depending on the item's nature and tax jurisdiction where it is incurred.
Cardinal Health, Inc. and Subsidiaries
GAAP / Non-GAAP Reconciliation1
Fiscal Year 2018
1For more information on these measures, refer to the Use of Non-GAAP Measures and Definitions schedules.

14 © 2018 Cardinal Health. All Rights Reserved.14
(in millions) 2019 2018 (in millions) 2019 2018
Pharmaceutical Medical
Revenue Revenue
Amount 31,416$ 28,920$ Amount 3,801$ 3,724$
Growth rate 9 % 1 % Growth rate 2 % 14 %
Segment profit Segment profit
Amount 409$ 467$ Amount 135$ $ 1291
Growth rate (12)% (13)% Growth rate 5 % 1 %
Segment profit margin 1.30 % 1.61 % Segment profit margin 3.55 % 3.45 %
1 For the three months ended September 30, 2017 segment profit includes a $42 million impact from the roll-out of the inventory fair value step up related to the Patient
Recovery acquisition.
Cardinal Health, Inc. and Subsidiaries
Segment Information
First Quarter First Quarter

15 © 2018 Cardinal Health. All Rights Reserved.15
In this document, the Company presents certain forward-looking non-GAAPmetrics. The Company does notprovide outlook on a GAAPbasis because changes in the items that the Company excludes from GAAPto calculate the comparable non-
GAAPmeasure can be dependenton future events thatare less capable ofbeing controlled or reliability predicted by management and are notpart of the Company’s routine operating activities. Additionally, management does not forecastmany
of the excluded items for internal use and therefore cannot create or rely on outlook done on a GAAP basis.
The timing and amount of any of the items excluded from GAAP to calculate non-GAAP could significantly impact the Company’s fiscal 2019 GAAP results. Over the past five years, the excluded items have lowered the Company’s EPS from $0.47
to $4.19, which includes a goodwill impairment charge of $4.36 per share related to our Medical segment that we recognized in fiscal 2018.
Cardinal Health, Inc. and Subsidiaries
Forward Looking non-GAAP Measures
16 © 2018 Cardinal Health. All Rights Reserved.16
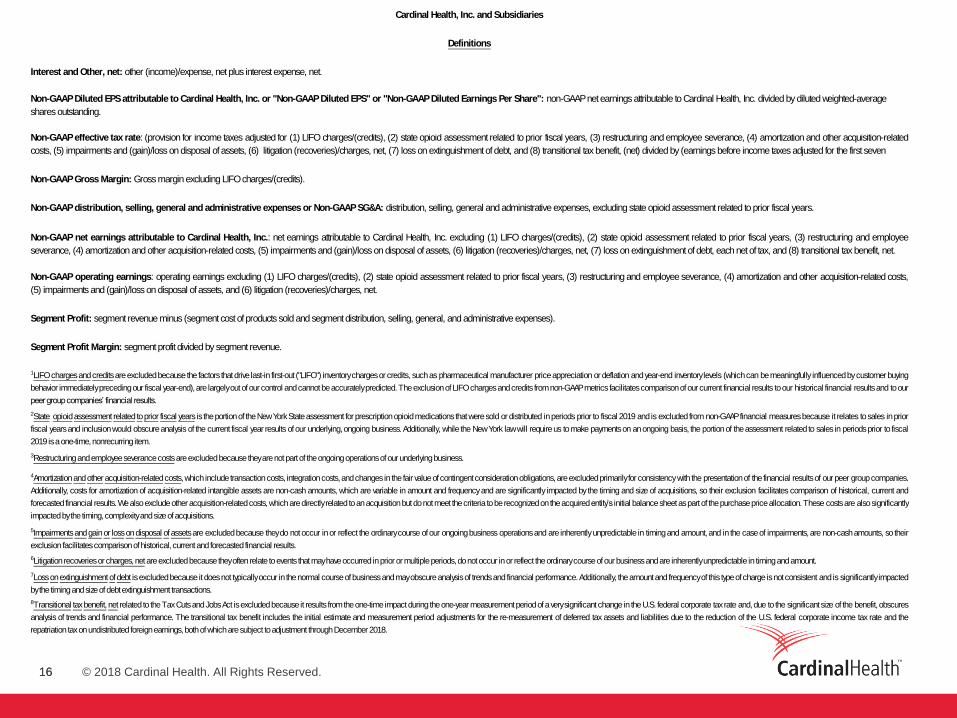
Cardinal Health, Inc. and Subsidiaries
Definitions
Interest and Other, net: other (income)/expense, net plus interest expense, net.
Non-GAAP Diluted EPS attributable to Cardinal Health, Inc. or "Non-GAAP Diluted EPS" or "Non-GAAP Diluted Earnings Per Share": non-GAAP net earnings attributable to Cardinal Health, Inc. divided by diluted weighted-average
shares outstanding.
Non-GAAPeffective tax rate: (provision for income taxes adjusted for (1) LIFO charges/(credits), (2) state opioid assessment related to prior fiscal years, (3) restructuring and employee severance, (4) amortization and other acquisition-related
costs, (5) impairments and (gain)/loss on disposal of assets, (6) litigation (recoveries)/charges, net, (7) loss on extinguishment of debt, and (8) transitional tax benefit, (net) divided by (earnings before income taxes adjusted for the first seven
Non-GAAP Gross Margin: Gross margin excluding LIFO charges/(credits).
1LIFOchargesandcreditsareexcludedbecausethefactorsthatdrive last-in first-out ("LIFO") inventorychargesorcredits, suchas pharmaceutical manufacturer priceappreciation ordeflation andyear-end inventorylevels (whichcan bemeaningfully influencedbycustomerbuying
behavior immediatelyprecedingour fiscal year-end),are largelyoutofourcontrol andcannotbeaccuratelypredicted.TheexclusionofLIFOchargesandcreditsfromnon-GAAPmetricsfacilitatescomparisonofourcurrent financial results toour historical financial resultsand toour
peer group companies’ financial results.
2State opioidassessment relatedtoprior fiscal yearsistheportionof theNewYorkStateassessment forprescriptionopioidmedicationsthatweresold ordistributed inperiods prior to fiscal 2019 andis excludedfrom non-GAAPfinancial measuresbecause it relates tosales inprior
fiscal yearsand inclusionwould obscureanalysis of the current fiscal year results ofour underlying,ongoing business.Additionally, while the NewYork lawwill requireus tomake paymentson anongoing basis, the portionof theassessment relatedto salesin periodsprior to fiscal
2019 is a one-time, nonrecurring item.
Non-GAAP net earnings attributable to Cardinal Health, Inc.: net earnings attributable to Cardinal Health, Inc. excluding (1) LIFO charges/(credits), (2) state opioid assessment related to prior fiscal years, (3) restructuring and employee
severance, (4) amortization and other acquisition-related costs, (5) impairments and (gain)/loss on disposal of assets, (6) litigation (recoveries)/charges, net, (7) loss on extinguishment of debt, each net of tax, and (8) transitional tax benefit, net.
Non-GAAP operating earnings: operating earnings excluding (1) LIFO charges/(credits), (2) state opioid assessment related to prior fiscal years, (3) restructuring and employee severance, (4) amortization and other acquisition-related costs,
(5) impairments and (gain)/loss on disposal of assets, and (6) litigation (recoveries)/charges, net.
Segment Profit: segment revenue minus (segment cost of products sold and segment distribution, selling, general, and administrative expenses).
Segment Profit Margin: segment profit divided by segment revenue.
Non-GAAP distribution, selling, general and administrative expenses or Non-GAAP SG&A: distribution, selling, general and administrative expenses, excluding state opioid assessment related to prior fiscal years.
3Restructuring and employee severance costs are excluded because they are not part of the ongoing operations of our underlying business.
4Amortizationandotheracquisition-relatedcosts,which includetransactioncosts, integrationcosts,andchangesinthefair valueofcontingentconsiderationobligations,areexcludedprimarilyforconsistencywith the presentationof thefinancial resultsof ourpeer groupcompanies.
Additionally, costs for amortization of acquisition-related intangible assets are non-cash amounts, which are variable in amount and frequencyand are significantly impacted bythe timing and size of acquisitions, so their exclusion facilitates comparison of historical, current and
forecastedfinancial results.Wealsoexcludeotheracquisition-relatedcosts,whicharedirectlyrelatedtoanacquisitionbutdonotmeet thecriteria toberecognizedontheacquiredentity’s initial balancesheetaspartof thepurchasepriceallocation.These costsare alsosignificantly
impacted by the timing, complexity and size of acquisitions.
5Impairmentsandgainor lossondisposal ofassets are excludedbecause theydo notoccur inor reflect the ordinarycourse ofour ongoingbusiness operationsand are inherentlyunpredictable in timingand amount,and in the caseof impairments,are non-cashamounts, sotheir
exclusion facilitates comparison of historical, current and forecasted financial results.
6Litigation recoveries or charges, net are excluded because they often relate to events that may have occurred in prior or multiple periods, do not occur in or reflect the ordinary course of our business and are inherently unpredictable in timing and amount.
7Lossonextinguishmentofdebt isexcludedbecauseitdoesnot typicallyoccur in thenormal courseofbusinessandmayobscureanalysisof trendsandfinancial performance.Additionally, theamountandfrequencyof thistypeofchargeisnotconsistent andis significantlyimpacted
by the timing and size of debt extinguishment transactions.
8Transitional taxbenefit,net relatedtotheTaxCutsandJobsAct isexcludedbecauseit resultsfromtheone-timeimpactduringtheone-yearmeasurementperiodofaverysignificantchangeintheU.S. federal corporate taxrate and,due tothe significantsize of the benefit,obscures
analysis of trends and financial performance. The transitional tax benefit includes the initial estimate and measurement period adjustments for the re-measurement of deferred tax assets and liabilities due to the reduction of the U.S. federal corporate income tax rate and the
repatriation tax on undistributed foreign earnings, both of which are subject to adjustment through December 2018.