2018 strategy deck vfinal2 - · pdf file5 mark to market: 2016-2017 strategic objectives(1)...
TRANSCRIPT

Strategic Update James P. Gorman, Chairman and Chief Executive Officer January 18, 2018

2
NoticeThe information provided herein may include certain non-GAAP financial measures. The reconciliation of such measures to the comparable GAAP figures are included in this presentation, or in the Company’s Annual Report on Form 10-K, Definitive Proxy Statement, Quarterly Reports on Form 10-Q and the Company’s Current Reports on Form 8-K, as applicable, including any amendments thereto, which are available on www.morganstanley.com.This presentation may contain forward-looking statements including the attainment of certain financial and other targets, objectives and goals, as well as future effective tax rates. You are cautioned not to place undue reliance on forward-looking statements, which speak only as of the date on which they are made, which reflect management’s current estimates, projections, expectations, assumptions, interpretation or beliefs and which are subject to risks and uncertainties that may cause actual results to differ materially. The Company does not undertake to update the forward-looking statements to reflect the impact of circumstances or events that may arise after the date of forward-looking statements. For a discussion of risks and uncertainties that may affect the future results of the Company, please see the Company’s most recent Annual Report on Form 10-K, Quarterly Reports on Form 10-Q and Current Reports on Form 8-K, as applicable, which are available on www.morganstanley.com. This presentation is not an offer to buy or sell any security.The End Notes are an integral part of this Presentation. See slides 22-28 for information related to the financial metrics in this presentation.Please note this presentation is available at www.morganstanley.com.

3
Operating Performance Metrics(1)
• To provide further transparency and a better understanding of operating performance, our reported results are
adjusted below to exclude the aggregate impact of the net discrete tax provision in the fourth quarter of $1,158MM that
resulted from the enactment of the Tax Cut and Jobs Act (the “Tax Act”) and other intermittent net discrete tax benefits,
unrelated to the Tax Act, of $168MM and $233MM for the fourth quarter and full year, respectively
• These Operating Performance Metrics will be utilized throughout the remainder of this presentation to assess our
Strategic Objectives established in 2016(2)
(3)
(2)(4)
(2)(5)
Quarter Ended December 31, 2017 Twelve Months Ended Dec 31, 2017
($MM) As Reported Aggregate Discrete
Tax Items Adjusted As Reported Aggregate Discrete
Tax Items Adjusted
Income from continuing operations before taxes 2,471 - 2,471 10,403 - 10,403
Income tax provision from continuing operations 1,767 (990) 777 4,125 (925) 3,200
Earnings applicable to Morgan Stanley common shareholders 516 990 1,506 5,631 925 6,556
Earnings Per Share ($) 0.29 0.55 0.84 3.09 0.51 3.60
Effective tax rate from continuing operations 71.5% (40.1%) 31.4% 39.7% (8.9%) 30.8%
Return on Equity 2.9% 5.7% 8.6% 8.1% 1.3% 9.4%
Return on Tangible Common Equity 3.4% 6.4% 9.8% 9.3% 1.5% 10.8%

4
Evolution of Our Key Strategic Objectives
Acquire 100% of WM JV and Improve WM Pre-Tax Margin(1) from
17% Post Integration(2)
Significantly Reduce RWAs in Fixed Income
Lower Expenses and Resize Business Footprint
Firm Specific Opportunities:Deeper ISG and WM Partnership
Build Bank StrategyStrategy Remains Consistent:
Invest for growth and maintain fiscal
vigilance and capital sufficiency
2013: Restructuring 2016: Profitability Continued Execution
Wealth Management Pre-Tax Margin(1): 23-25%
Complete Fixed Income Restructuring While Maintaining
Revenue Footprint
Increase Capital Return to Shareholders
Streamline: $1Bn Expense Reduction; <74% Efficiency Ratio(3)
9-11% ROE in 2017(4)
1
2
3
4
5

5
Mark to Market: 2016-2017 Strategic Objectives(1)
1Streamline: $1Bn Expense Reduction, <74% Efficiency Ratio
2 Complete Fixed Income Restructuring and Maintain Revenue Footprint
3 Wealth Mgmt. Pre-Tax Margin(4): 23 – 25%
4 Increase Capital Return to Shareholders
5 ROE(6): 9 – 11%
2017 ResultsObjective
73% Firm Efficiency Ratio(2)
Full Year Revenues $4.9Bn with Fewer Resources (vs. $4.3Bn ex. DVA in 2014 & 2015(3))
Received Non-Objection to Further Increase Dividend (+25%) and Buyback (+43%)(5)
25.5% Margin in 2017
9.4**% ROE(6)

6
2017 Results in Perspective
Results(3)Mixed Operating Environment
Revenues: $37.9Bn10% YoY Growth
Expenses: $27.5Bn73% Efficiency Ratio(4)
7% YoY Growth
S&P 500: +19% Strong Equity Market Performance
Average VIX: 11 Depressed Equity Market Volatility
Federal Funds:+75bps
Continuation of U.S. Monetary Policy Tightening; Europe Moving off Negative Rates
10 Year UST Volatility at Cycle Lows(1)
Interest Rates Remained Range Bound
US GDP(2): +2.3%US CPI(2): +2.1%
Sustained Modest Domestic Growth and Muted Inflation
Global GDP(2): +3.6% Global Growth Strengthening
Net Income to Common: $6.6**Bn21% YoY Growth
Avg. Common Equity: $70**Bn
9.4**% ROE(5)
31**% Tax Rate

7
4.75.4
6.6
2015 2016 2017
Execution of Our Strategic Plan – Increased Profitability(1)
Net Income to Common ($Bn)
78
9.4
2015 2016 2017
Return on Equity(4)
(%)
**
Return on Tangible Common Equity(5)
(%)
Book Value Per Share($)
35.2436.99
38.54
2015 2016 2017
Tangible Book Value Per Share(6)
($)
30.2631.98
33.48
2015 2016 2017
2.412.88
3.60
2015 2016 2017
Earnings Per Diluted Share ($)
+49%+9% +11%
Improving Profitability…
…Results in Improving Per Share Metrics
89
10.8
2015 2016 2017
(3)(2)
**+39%
**
**
(2) (2) (2)(3) (3) (3)
8
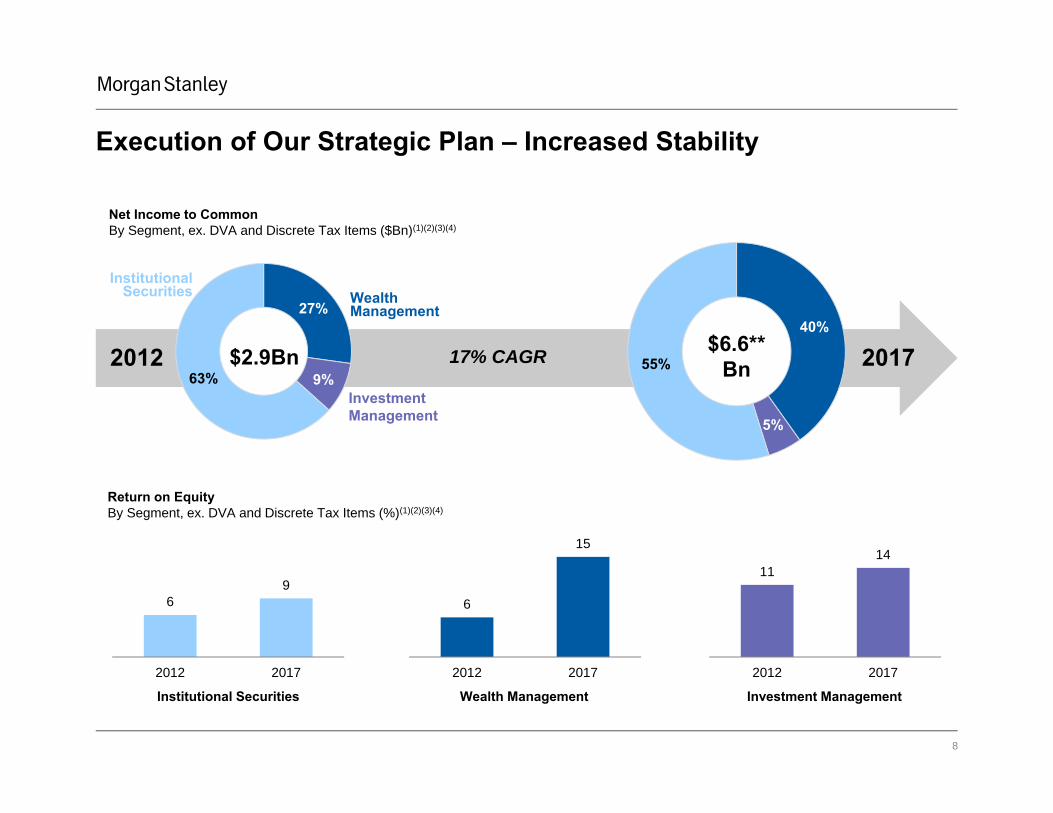
40%
5%
55%
Execution of Our Strategic Plan – Increased Stability
$6.6**Bn2012 2017
27%
9%63%$2.9Bn
6
15
2012 2017
1114
2012 2017
69
2012 2017
Net Income to CommonBy Segment, ex. DVA and Discrete Tax Items ($Bn)(1)(2)(3)(4)
Return on EquityBy Segment, ex. DVA and Discrete Tax Items (%)(1)(2)(3)(4)
Wealth Management Investment ManagementInstitutional Securities
Wealth Management
Investment Management
Institutional Securities
17% CAGR

9
Lending Strategy
Continue to Focus on Execution Opportunities
Wealth Management Margin Expansion
Maintain Deep Institutional Securities Group Footprint
Realize Potential of Investment Management
Platform
Drive Operating Leverage Through Expense Discipline
Maintain Capital Return Profile
2 3 4
6
5
1

10
Lending Strategy Produces Organic Revenue Growth1
Attractive Loan Growth Opportunity...
38
6481
91104
2013 2014 2015 2016 2017
Wealth Management Institutional Securities
U.S. Bank(1) Loans ($Bn)
...Supported by Strong Deposit Franchise
110132
154 155 159
2013 2014 2015 2016 2017
U.S. Bank(1) Deposits ($Bn)
Third Party Deposits(2)
Savings & Other Deposits
Sweep Deposits
Time Deposits$159Bn
2017 Deposit Funding Mix
ISG Secured & Other
Tailored
Securities-BasedMortgages
$104Bn
2017 Lending Mix
Commercial Real EstateCorporate Lending
Wealth Management Sourced Deposits
Wealth Management
Institutional Securities
11
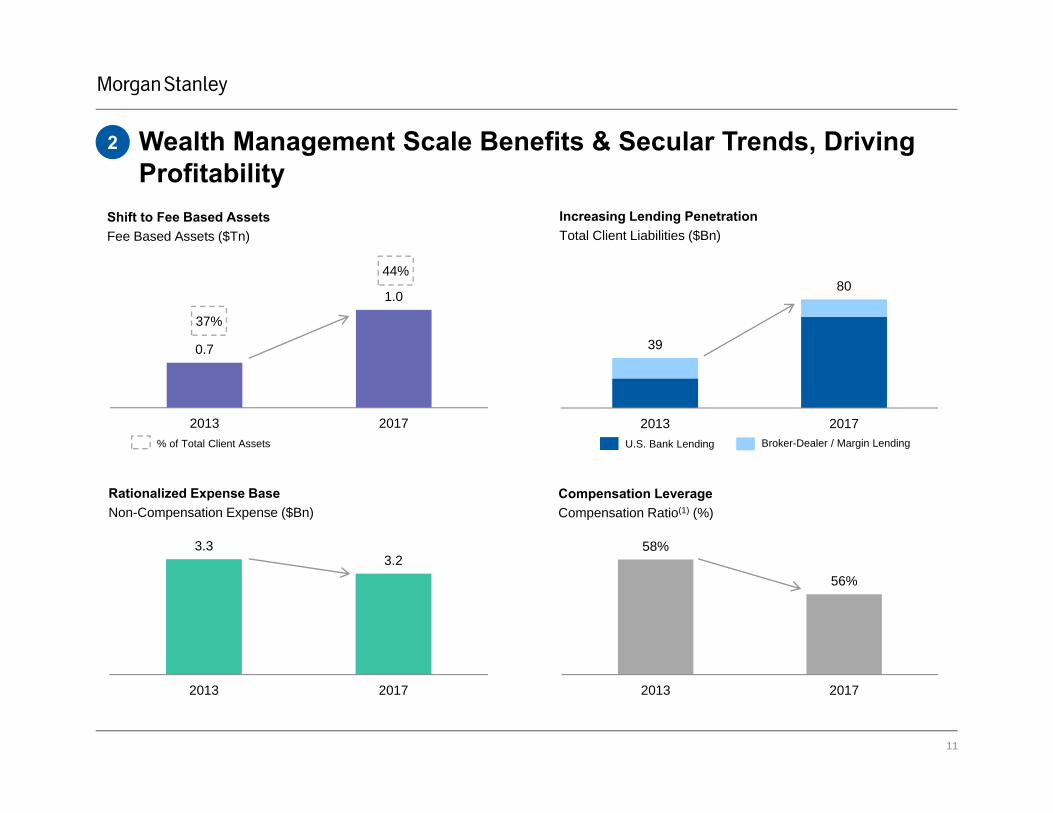
2
0.7
1.0
2013 2017
Shift to Fee Based AssetsFee Based Assets ($Tn)
Increasing Lending PenetrationTotal Client Liabilities ($Bn)
3.33.2
2013 2017
Rationalized Expense BaseNon-Compensation Expense ($Bn)
Compensation Leverage Compensation Ratio(1) (%)
58%
56%
2013 2017
% of Total Client Assets
37%
44%
Wealth Management Scale Benefits & Secular Trends, Driving Profitability
39
80
2013 2017U.S. Bank Lending Broker-Dealer / Margin Lending
12
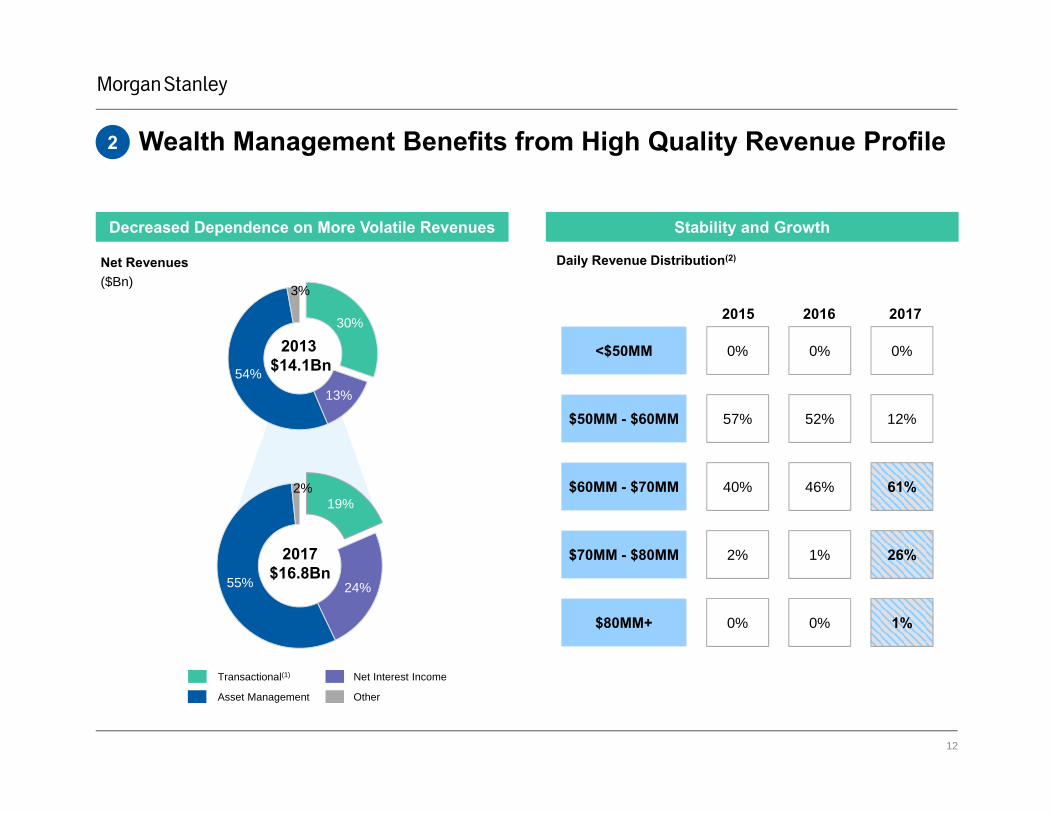
30%
13%54%
3%
Wealth Management Benefits from High Quality Revenue Profile2
Net Revenues ($Bn)
Transactional(1) Net Interest Income
Asset Management
2013 $14.1Bn
19%
24%55%
2%
2017$16.8Bn
Other
Decreased Dependence on More Volatile Revenues Stability and Growth
Daily Revenue Distribution(2)
2016 20172015
0% 0%<$50MM 0%
52% 12%$50MM - $60MM 57%
46% 61%$60MM - $70MM 40%
1% 26%$70MM - $80MM 2%
0% 1%$80MM+ 0%
13
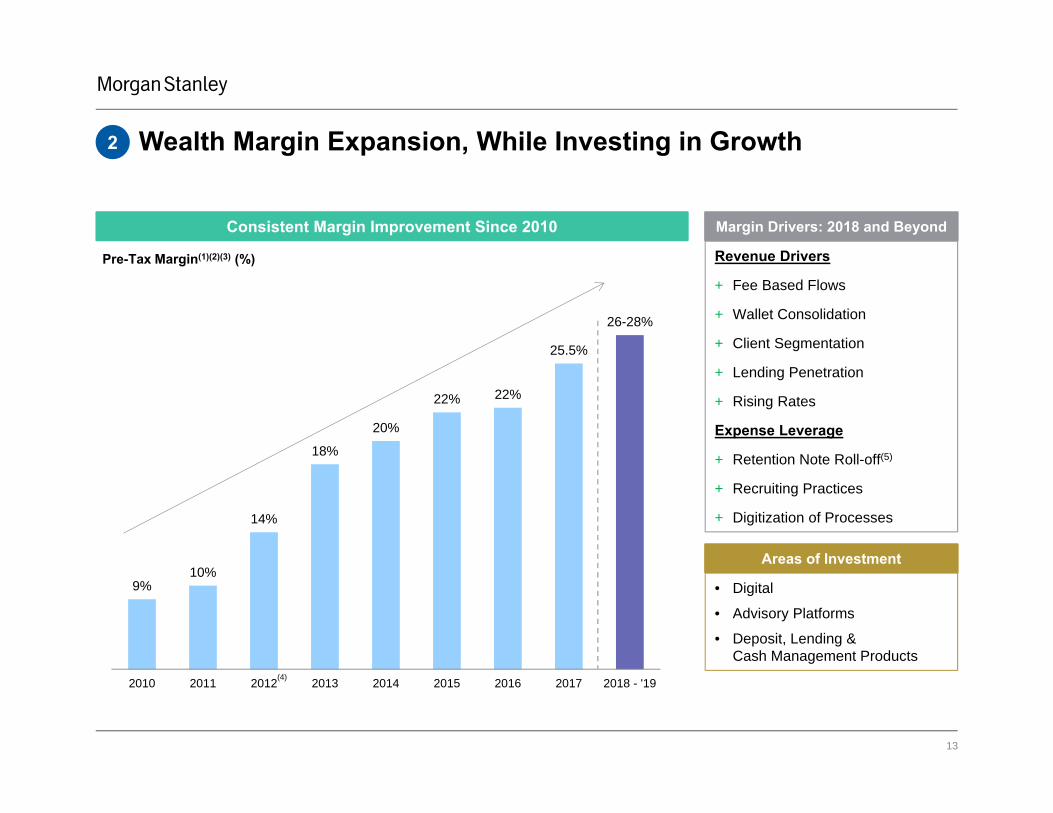
Wealth Margin Expansion, While Investing in Growth2
9%10%
14%
18%
20%
22% 22%
25.5%
26-28%
2010 2011 2012 2013 2014 2015 2016 2017 2018 - '19
Pre-Tax Margin(1)(2)(3) (%)
Margin Drivers: 2018 and BeyondConsistent Margin Improvement Since 2010
Revenue Drivers
+ Fee Based Flows
+ Wallet Consolidation
+ Client Segmentation
+ Lending Penetration
+ Rising Rates
Expense Leverage
+ Retention Note Roll-off(5)
+ Recruiting Practices
+ Digitization of Processes
Areas of Investment
• Digital
• Advisory Platforms
• Deposit, Lending & Cash Management Products
(4)

14
73
~57
2013 2017 Estimate
Gained Wallet Share Across All ISG Businesses(1)(2)(3)
Fixed Income Sales & Trading Wallet, ex-DVA(5)
($Bn)
41
~44
2013 2017 Estimate
Investment Banking Wallet($Bn)
42
~38
2013 2017 Estimate
Equity Sales & Trading Wallet, ex-DVA(4)
($Bn)
Morgan Stanley Wallet Share%
16%
21%
6%9%
11%13%
3
(6) (6) (6)

15
4.2 4.3 4.3
5.14.9
2013 2014 2015 2016 2017
Continue to Maintain Fixed Income Revenue Footprint3
Fixed Income Sales & Trading Net Revenues –ex. DVA(1) ($Bn)
Solid Revenue Footprint...
73
69
63
66
~57
2013 2014 2015 2016 2017Estimate
Total Wallet – ex. DVA(2) ($Bn)
...Despite Smaller Industry Wallet…
Headcount
BalanceSheet
Capital
Expenses
...and Fewer Resources
~$1Bn QuarterlyAverage
Wallet Share(2) 6% 7% 8% 9%
(3)
6%
16
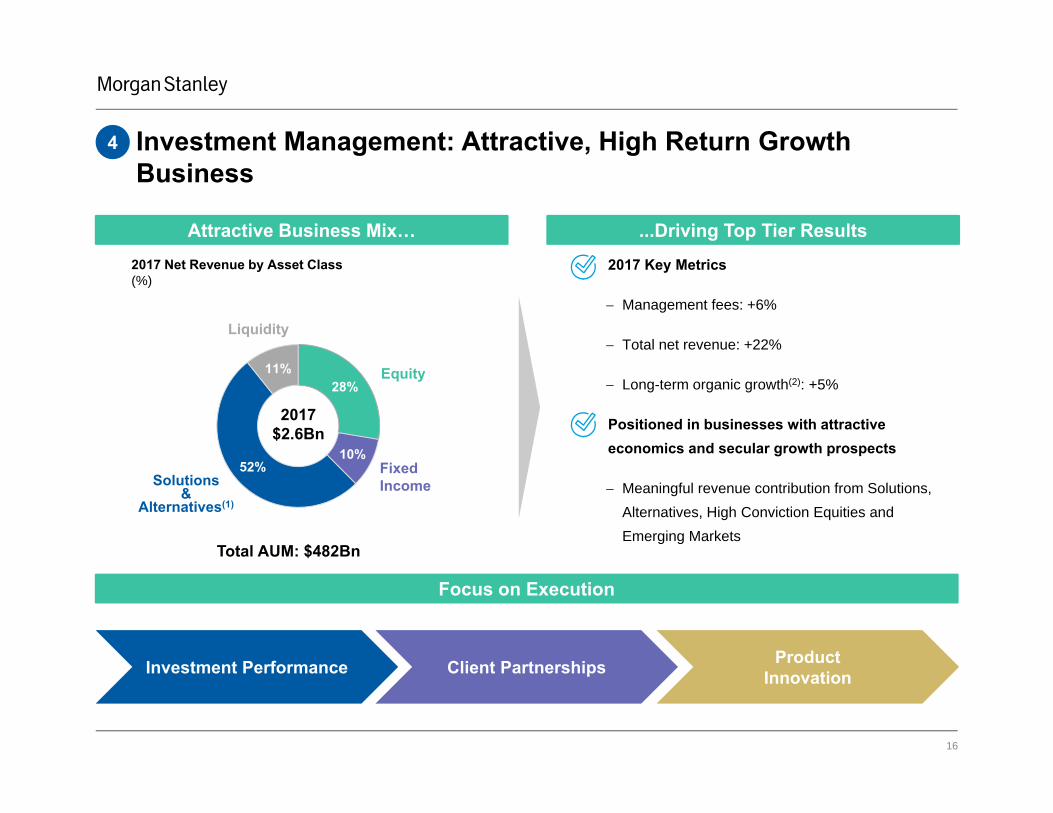
Investment Management: Attractive, High Return Growth Business
4
2017 Net Revenue by Asset Class(%)
Focus on Execution
2017 Key Metrics
Management fees: +6%
Total net revenue: +22%
Long-term organic growth(2): +5%
• Positioned in businesses with attractive economics and secular growth prospects
Meaningful revenue contribution from Solutions, Alternatives, High Conviction Equities and Emerging Markets
Product InnovationInvestment Performance Client Partnerships
28%
10%52%
11%
2017$2.6Bn
Equity
Solutions &
Alternatives(1)
Liquidity
Fixed Income
Attractive Business Mix… ...Driving Top Tier Results
Total AUM: $482Bn

17
Global Capabilities Driving Growth4
Global Client Footprint is Critical...
42%
16%
35%
6%
EMEA
Asia
North America3%
11%
1%
11%
2016 2017
Net Flows, excl. Liquidity(1)
(% of Beginning of Period Assets)
EMEA Asia
…Paired with Top-Tier Performance, Results in Material AUM Growth
3
17
2015 2017
Solutions Strategy – London(3)
AUM ($Bn)
0
12
2015 2017
Concentrated Public Equity Strategy – Hong Kong(3)
AUM ($Bn)
4
20
2010 2017
Core Property Strategy –North America(3)
AUM ($Bn)
Momentum in Overseas Net Flows… ...Driven by Strong International Distribution
2017 Total Gross Sales, excl. Liquidity(2)
Other

18
77%73%
84%
2013 2015 2017 2018 - 2019
Target: <79%
Target: <74%
Remain Fiscally Disciplined, Drive Operating Leverage5
Firm Expense Efficiency Ratio, ex DVA(1) (%)
2018 – 2019 Target: ≤73%

19
6
Morgan Stanley Capital Return ($Bn)
0.3 0.40.8
1.6
3.2
4.8
5.4
2011 2012 2013 2014 2015 2016 2017
Common Dividends
$ 2015 2016 2017
Dividend 0.15 0.20 0.25
Buyback 2.5Bn 3.5Bn 5.0Bn
CCAR Non-Objection(1)
Buybacks
Considerations
• Uncertain Impact of Regulatory Reform and CCAR
• Balance Sheet to Support Growth Initiatives
Increase Capital Return, While Investing for Future Growth

20
68%
32%
Morgan Stanley will Benefit from U.S Corporate Tax Reform
31
22-25
2017 2018PreliminaryGuidance
Effective Tax Rate, (%), excl. Intermittent Net Discrete Tax Items
2017:$10.4Bn
U.S
Non-U.S.
• $1.2Bn net discrete tax provision due to enactment of the Tax Act
Primarily driven by re-measurement of deferred tax assets at lower corporate tax rate
• Partially offset by $168MM intermittent net discrete tax benefit unrelated to the Tax Act
Full year intermittent net discrete tax benefit of $233MM(3)
Significant U.S. Earnings… …Benefitting from Lower Tax Rate(1)Details of 4Q Tax Charge(1)
U.S. focused earnings mix driven by predominantly domestic Wealth Management business
Pre-tax Income by Geography(2)
Income from Continuing Operations before Income Tax Expense / (Benefit), ($Bn)

21
Summary of Strategic Objectives
1 Deliver Wealth Management Pre-Tax Margin(2) of 26-28%
2 Expand ISG Penetration and Leadership
3 Position Investment Management for Growth
4 Realize Firm Expense Efficiency Ratio(3) of ≤73%
ROE(4): 10-13% ROTCE(5): 11.5%-14.5%
2018 – 2019 Objectives(1)
5 Maintain Attractive Capital Return Profile
Medium Term(1)

22
End Notes
These notes refer to the financial metrics presented on Slide 3.
1. Operating Performance Metrics, which exclude the impacts of the Tax Cut and Jobs Act (the ‘Tax Act’) and other intermittent net discrete tax benefits, are non-GAAP financial measures that the Firm considers useful for investors to better assess operating performance and to provide enhanced comparability across periods and with our Strategic Objectives established in prior periods. The Operating Performance Metrics include the recurring-type discrete tax benefits associated with the accounting guidance related to share-based payments of $16 million and $155 million for the fourth quarter (‘4Q17’) and full year 2017, respectively. Operating Performance Metrics appearing in the following pages will be designated with a double asterisk (**).
2. Reported and Adjusted results for Average Common Equity and Average Tangible Common Equity are as follows: a) Average Common Equity reported and adjusted was $70.0 billion and $70.2 billion respectively for 4Q17 and $69.8 billion and $69.9 billion respectively for full year
2017.b) Average Tangible Common Equity reported and adjusted was $60.9 billion and $61.2 billion respectively for 4Q17 and $60.6 billion and $60.7 billion respectively for
the full year 2017.3. The calculation of Earnings Per Share uses Earnings applicable to Morgan Stanley common shareholders divided by Average Diluted Common shares Outstanding of 1,796
million for 4Q17 and 1,821 million for the full year.4. The calculation of Return on Equity (‘ROE’) uses net income applicable to Morgan Stanley less preferred dividends as a percentage of average common equity. ROE is a
non-GAAP financial measure that the Firm considers useful for investors to assess operating performance.5. The calculation of Return on Tangible Common Equity (‘ROTCE’) uses net income applicable to Morgan Stanley less preferred dividends as a percentage of average
tangible common equity. Tangible Common Equity (‘TCE’) equals common equity less goodwill and intangible assets net of allowable mortgage servicing rights deduction. ROTCE and TCE are non-GAAP financial measures that the Firm considers useful for investors to assess operating performance and financial condition respectively.
These notes refer to the financial metrics presented on Slide 4.
1. Pre-tax margin represents income (loss) from continuing operations before taxes divided by Net Revenues. Pre-tax margin is a non-GAAP financial measure that the Firm considers useful for investors to assess operating performance.
2. Morgan Stanley Smith Barney was integrated and re-named Morgan Stanley Wealth Management in September 2012, subsequent to the acquisition of an additional 14% in the Wealth Management JV, which brought the Firm’s ownership to 65%. The 17% pre-tax margin represents the margin in the fourth quarter of 2012.
3. Firm Efficiency ratio represents total non-interest expenses as a percentage of Net Revenues. The Firm Efficiency ratio is a non-GAAP financial measure the Firm considers useful for investors to assess operating performance.
4. The calculation of Return on Equity (‘ROE’) uses net income applicable to Morgan Stanley less preferred dividends as a percentage of average common equity. The ROE target of 9% to 11% excludes intermittent discrete tax items. ROE excluding intermittent discrete tax items is a non-GAAP financial measures that the Firm considers useful for investors to assess operating performance.

23
End Notes
These notes refer to the financial metrics presented on Slide 5.
1. Represents results against the 2017 Strategic Objectives established at the beginning of 2016.2. Firm Efficiency ratio represents total non-interest expenses as a percentage of Net Revenues. The Firm Efficiency ratio is a non-GAAP financial measure the Firm considers
useful for investors to assess operating performance.3. Debt Valuation Adjustment (‘DVA’) represents the change in fair value resulting from fluctuations in our credit spreads and other credit factors related to liabilities carried at
under the fair value option. Fixed Income revenues for 2014 exclude the positive impact of $419 million related to DVA and the negative impact of $466 million related to the initial implementation of funding valuation adjustment (‘FVA’). Fixed Income revenues for 2015 exclude the positive impact of $455 million related to DVA. Fixed Income revenues, excluding DVA and FVA are non-GAAP measures the Firm considers useful for investors to allow better comparability of period to period operating performance.
4. Pre-tax margin represents income (loss) from continuing operations before taxes divided by Net Revenues. Pre-tax margin is a non-GAAP financial measure that the Firm considers useful for investors to assess operating performance.
5. In June 2017, we received a non-objection from the Federal Reserve to our 2017 Capital Plan. The Capital Plan includes the repurchase of up to $5 billion of outstanding common stock for the four quarters beginning in the third quarter of 2017 through the end of the second quarter of 2018, (an increase from $3.5 billion in the 2016 Capital Plan), as well as an increase in the Firm’s quarterly common stock dividend to $0.25 per share from the previous $0.20 per share.
6. The calculation of Return on Equity (‘ROE’) uses net income applicable to Morgan Stanley less preferred dividends as a percentage of average common equity. The ROE target of 9% to 11% and Operating Performance Metric ROE exclude intermittent discrete tax items. ROE excluding intermittent discrete tax items is a non-GAAP financial measure that the Firm considers useful for investors to assess operating performance. Operating Performance Metrics, denoted by double asterisk (**), refer to Slide 3 and note 1 thereto.
These notes refer to the financial metrics presented on Slide 6.
1. Based on 3-month volatility of 10-year U.S. Treasury rates.2. Full-year estimates based on Morgan Stanley Research.3. Operating Performance Metrics, denoted by double asterisk (**), refer to Slide 3 and note 1 thereto.4. Firm Efficiency ratio represents total non-interest expenses as a percentage of Net Revenues. The Firm Efficiency ratio is a non-GAAP financial measure the Firm considers
useful for investors to assess operating performance.5. The calculation of Return on Equity (‘ROE’) uses net income applicable to Morgan Stanley less preferred dividends as a percentage of average common equity. Operating
Performance Metric ROE excludes intermittent discrete tax items. ROE excluding intermittent discrete tax items is a non-GAAP financial measure that the Firm considers useful for investors to assess operating performance.

24
End Notes
These notes refer to the financial metrics presented on Slide 7.
1. Operating Performance Metrics, denoted by double asterisk (**), refer to Slide 3 and note 1 thereto.2. 2015 earnings applicable to Morgan Stanley common shareholders (‘Net Income to Common’) exclude the net of tax positive impact of Debt Valuation Adjustment (‘DVA’)
and intermittent discrete tax benefits (‘DTB’), in the amounts of $399 million and $564 million respectively. For a reconciliation of Return on Equity, Return on Tangible Common Equity and Earnings per Diluted Share, excluding the impact of DVA and DTB, please see page 36 of our Annual Report on Form 10-K for the year ended December 31, 2016 (“2016 Form 10-K”). Results that exclude DVA and DTB are non-GAAP financial measures the Firm considers useful for investors to allow better comparability of period to period operating performance.
3. 2016 Net Income to Common excludes $68 million of DTB. The impact of DTB on average common equity and average tangible common equity was approximately $40 million. Results that exclude DTB are non-GAAP financial measures the Firm considers useful for investors to allow better comparability of period to period operating performance.
4. The calculation of Return on Equity (‘ROE’) uses net income applicable to Morgan Stanley less preferred dividends as a percentage of average common equity. Operating Performance Metric ROE excludes intermittent discrete tax items. ROE excluding intermittent discrete tax items is a non-GAAP financial measure that the Firm considers useful for investors to assess operating performance.
5. The calculation of Return on Tangible Common Equity (‘ROTCE’) uses net income applicable to Morgan Stanley less preferred dividends as a percentage of average tangible common equity. Tangible Common Equity (‘TCE’) equals common equity less goodwill and intangible assets net of allowable mortgage servicing rights deduction. ROTCE and TCE are non-GAAP financial measures that the Firm considers useful for investors to assess operating performance and financial condition respectively.
6. Tangible Book Value per Common Share (‘Tangible Book Value per Share’) equals Tangible Common Equity (‘TCE’) divided by period end common shares outstanding. Tangible Book Value per Share is a non-GAAP financial measure that the Firm considers useful for investors to assess our financial condition.
These notes refer to the financial metrics presented on Slide 8.
1. Consolidated (‘Firm’) Operating Performance Metrics, denoted by double asterisk (**), refer to Slide 3 and note 1 thereto.2. The calculation of Return on Equity by Segment (‘ROE by Segment’) uses net income applicable to Morgan Stanley by segment less preferred dividends allocated to each
segment as a percentage of average common equity allocated to each segment. The Firm's capital estimation and attribution to the business segments are based on the Required Capital framework, an internal capital adequacy measure. This framework is a risk based and leverage use‐of‐capital measure, which is compared with the Firm's regulatory capital to ensure that the Firm maintains an amount of going concern capital after absorbing potential losses from stress events, where applicable, at a point in time. The common equity estimation and attribution to the business segments is based on the Firm's fully phased‐in regulatory capital requirements, including supplementary leverage, and incorporates the Firm's internal stress tests. ROE by Segment is a non-GAAP financial measure that the Firm considers useful for investors to assess operating performance.

25
End Notes
These notes refer to the financial metrics presented on Slide 8 (continued).
3. 2012 earnings applicable to Morgan Stanley common shareholders (‘Net Income to Common’) and ROE by Segment have been adjusted to exclude the impact of Debt Valuation Adjustment (‘DVA’) and intermittent discrete tax benefits (‘DTB’). Results that exclude DVA and DTB are non-GAAP financial measures the Firm considers useful for investors to allow better comparability of period to period operating performance. The reconciliation of Net Income to Common and ROE by Segment, excluding DVA and DTB is as follows:
4. 2017 Net Income to Common and ROE by Segment have been adjusted to exclude the aggregate impact of the net discrete tax provision of $1,158MM that resulted from the enactment of the Tax Cut and Jobs Act (the “Tax Act”) and other intermittent net discrete tax benefits, unrelated to the Tax Act of $233 million. The reconciliation of Adjusted Net Income to Common and ROE by Segment, is as follows:
($ in millions)Institutional Securities
Wealth Management
Investment Management Firm
Net Income (loss) applicable to Morgan Stanley 3,491 2,414 245 6,154Allocated preferred stock dividend / other 415 106 2 523Earnings applicable to Morgan Stanley common shareholders 3,076 2,308 243 5,631Aggregate Discrete Tax Items 516 322 87 925Adjusted Earnings applicable to Morgan Stanley common shareholders 3,592 2,630 330 6,556
($ in billions)Allocated Average Common Equity 40.2 17.2 2.4Allocated Average Common Equity, excluding DVA & DTB 40.2 17.2 2.4
Reported Return on Equity 8% 13% 10%Adjusted Return on Equity 9% 15% 14%
($ in millions)Institutional Securities
Wealth Management
Investment Management Firm
Net Income (loss) applicable to Morgan Stanley (923) 815 176 68Allocated preferred stock dividend / other 83 14 5 98Earnings applicable to Morgan Stanley common shareholders (1,006) 801 171 (30)Impact of DVA (3,118) - - (3,118)Impact of DTB 249 - (107) 142Earnings applicable to Morgan Stanley common shareholders, excluding DVA & DTB 1,863 801 278 2,946
($ in billions)Allocated Average Common Equity 29.0 13.3 2.4Allocated Average Common Equity, excluding DVA & DTB 29.0 13.3 2.4
Reported Return on Equity (3%) 6% 7%Return on Equity, excluding DVA & DTB 6% 6% 11%
*
* Excludes $12 million negative adjustment related to the allocation of earnings to Participating Restricted Stock Units which is not allocated to the segments

26
End Notes
These notes refer to the financial metrics presented on Slide 10.
1. U.S. Bank represents the Firm’s U.S. Bank operating subsidiaries, Morgan Stanley Bank, N.A. and Morgan Stanley Private Bank, National Association.2. Third party deposits include time deposits issued outside of the Firm’s Wealth Management distribution channels and external sweep deposits.
These notes refer to the financial metrics presented on Slide 11.
1. Compensation ratio is calculated as compensation and benefits expense as a percentage of Net Revenues.
These notes refer to the financial metrics presented on Slide 12.
1. Transactional revenues include investment banking, trading, and commissions and fee revenues.2. The daily revenue distribution reflects Net revenues for the Wealth Management segment attributed as follows: Transactional revenues on the day the revenue was
recorded; Asset management, Net interest and Other revenues based on a daily average where the revenue amount for the period is divided by the number of days in the period.
These notes refer to the financial metrics presented on Slide 13.
1. Pre-tax margin represents income (loss) from continuing operations before taxes divided by Net Revenues. Pre-tax margin is a non-GAAP financial measure that the Firm considers useful for investors to assess operating performance.
2. The attainment of margins in 2018 and beyond may be impacted by external factors that cannot be predicted at this time, including macroeconomic and market conditions and future regulations.
3. All periods have been recast to exclude the Managed Futures business, which is now reported in the Investment Management business segment. Additionally, the periods 2010-2013 have been recast to exclude the International Wealth Management business, currently reported in the Institutional Securities business segment.
4. Pre-tax margin for 2012 excludes $193 million of one-time costs in 3Q12 associated with the Morgan Stanley Wealth Management integration and the purchase of an additional 14% stake in the joint venture.
5. Refers to Financial Advisor retention notes issued to financial advisors in 2009 in conjunction with the formation of the Morgan Stanley Smith Barney joint venture.
These notes refer to the financial metrics presented on Slide 14.
1. Wallet represents the aggregated reported Net Revenues of Morgan Stanley and the following peers: Goldman Sachs, JP Morgan, Bank of America, Citigroup, UBS, Deutsche Bank, Credit Suisse, and Barclays. Morgan Stanley’s Wallet Share is calculated as the percentage of Morgan Stanley’s Net Revenues, excluding Debt Valuation Adjustment (‘DVA’) (where applicable) to Wallet.
2. European peer results were translated to USD using average exchange rates for the appropriate period; sourced from Bloomberg.3. Peer data has been adjusted for DVA, where it is reported and where applicable. Goldman Sachs’ Equity Sales & Trading results also exclude the Americas Reinsurance
business in 2013.4. Equity Sales & Trading Net Revenues, for 2013 excludes the negative impact from DVA of $78 million. Equity Sales & Trading Net Revenues, excluding DVA is a non-GAAP
financial measure the Firm considers useful for investors to allow better comparability of period to period operating performance.5. Fixed Income Sales & Trading Net Revenues, for 2013 excludes the negative impact from DVA of $603 million. Fixed Income Sales & Trading Net Revenues, excluding DVA
is a non-GAAP financial measure the Firm considers useful for investors to allow better comparability of period to period operating performance.6. The 2017 estimated wallet uses the actual results for peers that have reported full-year 2017 results as of January 18, 2018. For peers that have not yet reported, the full
year estimate is based on actual 9-month results plus 4Q’16 results multiplied by the average quarterly YoY change for peers that have reported.

27
End Notes
These notes refer to the financial metrics presented on Slide 15.
1. Fixed Income Sales & Trading Net Revenues adjust for Debt Valuation Adjustment (‘DVA’) as follows: 2013 excludes the negative impact of $603 million; 2014 excludes the positive impact of $419 million and a negative impact from the initial implementation of Funding Valuation Adjustments (‘FVA’) of $466 million; and 2015 excludes the positive impact of $455 million. Fixed Income Sales & Trading Net Revenues, excluding DVA and FVA are non-GAAP financial measures the Firm considers useful for investors to allow better comparability of period to period operating performance.
2. Total Wallet represents the aggregated reported Fixed Income Sales & Trading Net Revenues of Morgan Stanley and the following peers: Goldman Sachs, JP Morgan, Bank of America, Citigroup, UBS, Deutsche Bank, Credit Suisse, and Barclays. Morgan Stanley’s Wallet Share is calculated as the percentage of Morgan Stanley’s Sales & Trading Net Revenues, excluding DVA to Total Wallet.
3. The 2017 estimated wallet uses the actual results for peers that have reported full-year 2017 results as of January 18, 2018. For peers that have not yet reported, the full year estimate is based on actual 9-month results plus 4Q’16 results multiplied by the average quarterly YoY change for peers that have reported.
These notes refer to the financial metrics presented on Slide 16.
1. Represents the reporting category of Alternatives / Other.2. Long-term organic growth is defined as Net Flows, excluding Liquidity, divided by Beginning AUM, excluding Liquidity; $12 billion / $254 billion = 5%.
These notes refer to the financial metrics presented on Slide 17.
1. Net Flows represent client inflows less client outflows, including fund reinvestment and distributions. Geography is determined by the location of the sales team that covers the client.
2. Gross Sales represent client inflows only, including both new client assets and current clients adding additional assets. Geography is determined by the location of the sales team that covers the client.
3. The Solutions strategy is a multi-asset strategy, which is included in the Alternative / Other reporting category, managed by a London based investment team. The Concentrated Public Equity strategy is a high conviction equity strategy, which is included in the Equity reporting category, managed by a Hong Kong based investment team. The Core Property strategy is a real estate strategy, which is included in the Alternative / Other reporting category, managed by a US based investment team.
These notes refer to the financial metrics presented on Slide 18.
1. Firm Expense Efficiency ratio represents total non-interest expenses as a percentage of Net Revenues (or in 2013 and 2015, Net Revenues, excluding Debt Valuation Adjustment (‘DVA’)). For 2013, the Expense Efficiency ratio was calculated as non-interest expenses of $27,935 million, divided by Net Revenues of $33,174, which excludes the negative impact of $681 million from DVA. For 2015, the Expense Efficiency ratio was calculated as non-interest expenses of $26,660 million, divided by Net Revenues of $34,537, which excludes the positive impact of $618 million from DVA. The Expense Efficiency ratio, excluding DVA is a non-GAAP financial measure the Firm considers useful for investors to assess operating performance.
28
End Notes
These notes refer to the financial metrics presented on Slide 19.
1. In June 2017, we received a non-objection from the Federal Reserve to our 2017 Capital Plan. The Capital Plan includes the repurchase of up to $5 billion of outstanding common stock for the four quarters beginning in the third quarter of 2017 through the end of the second quarter of 2018, as well as an increase in the Firm’s quarterly common stock dividend to $0.25 per share. In June 2016, we received a conditional non-objection from the Federal Reserve to our 2016 Capital Plan. Pursuant to the conditional non-objection, we were able to execute the capital actions set forth in the 2016 Capital Plan, which included increasing our common stock dividend to $0.20 per share beginning in the third quarter of 2016 and executing share repurchases of $3.5 billion during the period July 1, 2016 through June 30, 2017. The Federal Reserve Board also asked us to submit an additional capital plan by December 29, 2016 addressing weaknesses identified in our capital planning process. On March 2, 2017, the Federal Reserve announced that it would not object to the resubmitted Capital Plan. Our 2015 Capital Plan approved by the Federal Reserve was for share repurchases of $3,125 million for the periods 2Q15 through 2Q16, as well as an increase in the Firm’s quarterly common stock dividend to $0.15 per share. For comparative purposes, we show 80% of the total 2015 buyback approval representing 4 of the 5 approved quarters.
These notes refer to the financial metrics presented on Slide 20.
1. The discrete tax provision and estimated future effective tax rate are based on currently available information as well as our current interpretation, assumptions and expectations related to the Tax Act, and may change as a result of factors such as the future level and geographic mix of pre-tax income and additional clarification, implementation guidance and evolution in the interpretation of the Tax Act over time.
2. Non-U.S. income is defined as income generated from operations located outside the U.S. The breakdown represents our current best estimates of the geographic split between U.S. and non-U.S. income. It is adjusted for approximately $1.2 billion of pre-tax income associated with debt repayment between U.S. and non-U.S. subsidiaries as this is not expected to have any impact on income tax provision in the respective jurisdictions.
3. Excludes $155 million of the recurring-type discrete tax benefits associated with the accounting guidance related to share-based payments.
These notes refer to the financial metrics presented on Slide 21.
1. The attainment of these results may be impacted by external factors that cannot be predicted at this time, including macroeconomic and market conditions, future regulations and outsized litigation expense or penalties.
2. Pre-tax margin represents income (loss) from continuing operations before taxes divided by Net Revenues. Pre-tax margin is a non-GAAP financial measure that the Firm considers useful for investors to assess operating performance.
3. Firm Expense Efficiency ratio represents total non-interest expenses as a percentage of Net Revenues. The Firm Efficiency ratio is a non-GAAP financial measure the Firm considers useful for investors to assess operating performance.
4. The calculation of Return on Equity (‘ROE’) uses net income applicable to Morgan Stanley less preferred dividends as a percentage of average common equity. The ROE target of 10% to 13% excludes intermittent discrete tax items. ROE target, excluding intermittent discrete tax items is a non-GAAP financial measures that the Firm considers useful for investors to assess operating performance.
5. The calculation of Return on Tangible Common Equity (‘ROTCE’) uses net income applicable to Morgan Stanley less preferred dividends as a percentage of average tangible common equity. The ROTCE target of 11.5% to 14.5% excludes intermittent discrete tax items. Tangible Common Equity (‘TCE’) equals common equity less goodwill and intangible assets net of allowable mortgage servicing rights deduction. ROTCE and TCE excluding intermittent discrete tax items are non-GAAP financial measures that the Firm considers useful for investors to assess operating performance.
Strategic Update James P. Gorman, Chairman and Chief Executive Officer January 18, 2018