2018 united states spencer stuart board index · first-time, non-executive directors with an...
TRANSCRIPT
2018 U.S. Spencer StUart board index 1
2018 United StatesSpencer Stuart Board Index
spencer stuart2
spencer stuart perspective for 2018About Spencer StuArt boArd ServiceS
At Spencer Stuart, we know how much leadership matters. We are trusted by organizations around the world to help them make the senior-level leadership decisions that have a lasting impact on their enterprises. Through our executive search, board and leadership advisory services, we help build and enhance high-performing teams for select clients ranging from major multinationals to emerging companies to nonprofit institutions.
Privately held since 1956, we focus on delivering knowledge, insight and results through the collaborative efforts of a team of experts — now spanning 57 offices, 30 countries and more than 50 practice specialties. Boards and leaders consistently turn to Spencer Stuart to help address their evolving leadership needs in areas such as senior-level executive search, board recruitment, board effectiveness, succession planning, in-depth senior management assessment and many other facets of organizational effectiveness.
For more than 30 years, our Board Practice has helped boards around the world identify and recruit independent directors and provided advice to board chairs, CEOs and nominating committees on important governance issues. We serve a range of organizations across geographies and scale, from leading multinationals to smaller organizations. In the past year alone, we conducted more than 600 director searches worldwide, and in North America one-third of those assignments were for companies with revenues under $1 billion.
Our global team of board experts works together to ensure that our clients have unrivaled access to the best existing and potential director talent, and regularly assists boards in increasing the diversity of their composition. We have helped place women in more than 1,800 board director roles and recruited more than 600 diversity executives around the world.
In addition to our work with clients, Spencer Stuart has long played an active role in corporate governance by exploring — both on our own and with other prestigious institutions — key concerns of boards and innovative solutions to the challenges facing them. Publishing the U.S. Spencer Stuart Board Index (SSBI), now in its 33rd edition, is just one of our many ongoing efforts.
Each year, we sponsor and participate in several acclaimed director education programs, including:
» Next-Gen Board Leaders (NGBL), an initiative designed to foster a community of current and aspiring directors to spark discussion around the challenges, opportunities and contributions of a younger generation in today’s boardrooms
» The Global Institutes, sponsored by the WomenCorporateDirectors (WCD) Foundation
» The Corporate Governance Conference at Northwestern University’s Kellogg School of Management
» The New Directors Program, a unique two-year development program designed to provide first-time, non-executive directors with an exclusive forum for peer dialogue on key issues and “unwritten rules” of corporate boards, produced in partnership with the Boston Consulting Group, Frederick W. Cook & Co., Davis Polk, Lazard and PricewaterhouseCoopers
@Spencer Stuart
Social Media @ Spencer StuartStay up to date on the trends and topics that are relevant to your business and career.
© 2018 Spencer Stuart. All rights reserved. For information about copying, distributing and displaying this work, contact: [email protected].
2018 U.S. Spencer StUart board index
Contents
1 Spencer Stuart Perspective for 2018
7 S&P 500 Boards: Trends over One, Five and 10 Years
10 Board Composition10 New Independent Directors 14 Board Size and Independence15 Term Length and Tenure16 Resignation Policies and Restrictions on Other Directorships17 Board Affiliations17 Term Limits 18 Mandatory Retirement 18 Average Age 19 Board Diversity21 CEO Outside Board Service 21 Separation of Board Chair and CEO Roles22 Independent Chair Backgrounds 23 Lead and Presiding Directors
24 Board Organization and Process24 Board Meetings 25 Committee Structure and Independence 26 Committee Meeting Frequency 26 Committee Chair Backgrounds27 Board Evaluations
28 Director Compensation28 Overall Director Compensation 29 Board Retainers and Meeting Fees30 Stock Compensation31 Board Leadership Compensation31 Committee Compensation32 Averages by Industry, Region, Sales
34 Nominating/Governance Committee Member Survey
37 Comparative Board Data

spencer stuart4
header (section title) — (remove when section header present)
2018 U.S. Spencer StUart board index 1
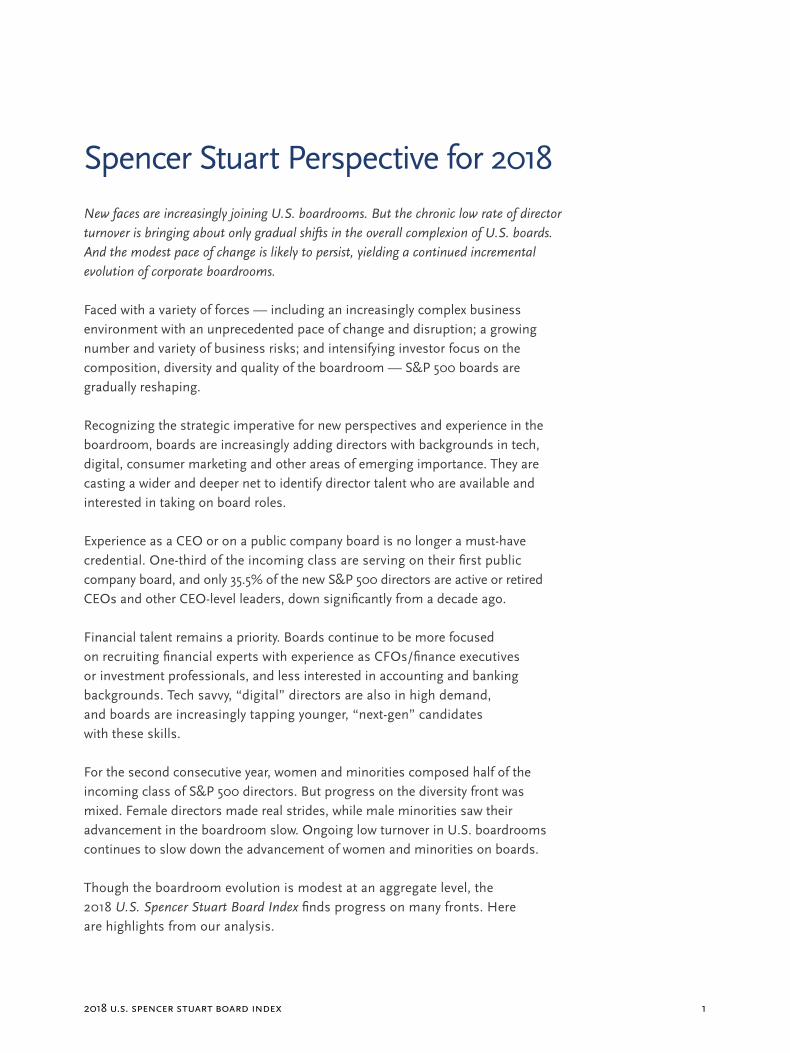
Spencer Stuart Perspective for 2018 New faces are increasingly joining U.S. boardrooms. But the chronic low rate of director turnover is bringing about only gradual shifts in the overall complexion of U.S. boards. And the modest pace of change is likely to persist, yielding a continued incremental evolution of corporate boardrooms.
Faced with a variety of forces — including an increasingly complex business environment with an unprecedented pace of change and disruption; a growing number and variety of business risks; and intensifying investor focus on the composition, diversity and quality of the boardroom — S&P 500 boards are gradually reshaping.
Recognizing the strategic imperative for new perspectives and experience in the boardroom, boards are increasingly adding directors with backgrounds in tech, digital, consumer marketing and other areas of emerging importance. They are casting a wider and deeper net to identify director talent who are available and interested in taking on board roles.
Experience as a CEO or on a public company board is no longer a must-have credential. One-third of the incoming class are serving on their first public company board, and only 35.5% of the new S&P 500 directors are active or retired CEOs and other CEO-level leaders, down significantly from a decade ago.
Financial talent remains a priority. Boards continue to be more focused on recruiting financial experts with experience as CFOs/finance executives or investment professionals, and less interested in accounting and banking backgrounds. Tech savvy, “digital” directors are also in high demand, and boards are increasingly tapping younger, “next-gen” candidates with these skills.
For the second consecutive year, women and minorities composed half of the incoming class of S&P 500 directors. But progress on the diversity front was mixed. Female directors made real strides, while male minorities saw their advancement in the boardroom slow. Ongoing low turnover in U.S. boardrooms continues to slow down the advancement of women and minorities on boards.
Though the boardroom evolution is modest at an aggregate level, the 2018 U.S. Spencer Stuart Board Index finds progress on many fronts. Here are highlights from our analysis.
spencer stuart2
spencer stuart perspective for 2018
boArdS Are bringing in freSh SkillS, quAlificAtionS And perSpectiveS Responding to rapidly changing business challenges, emerging risks and increasing attention to board composition and director relevance and quality by institutional and activist investors and other stakeholders, S&P 500 boards are adding directors with new skills, qualifications and perspectives.
S&P 500 boards appointed 428 new directors during the 2018 proxy year, the most since 2004 and an increase of 8% from 2017. A majority (57%) added at least one new director; 22% appointed two or more directors. However, overall turnover remains modest; S&P 500 boards added 0.88 directors on average.
New types of talent are joining S&P 500 boards. Nearly two-thirds (65%) of the incoming class come from outside the most senior board and company leadership roles. Only 35.5% of the new directors are CEO-level — active or retired CEOs, chairs, vice chairs, presidents or COOs — down from 47% a decade ago. Reflecting this shift, only 45% of CEOs of S&P 500 companies are serving on one or more outside boards, a drop from 51% in 2008 but an increase from 37% last year.
Public company boardroom experience is no longer a requirement. First-time directors represent 33% of the incoming class of S&P 500 directors. Consistent with last year, these first-time directors are younger than their experienced peers and more likely to be actively employed (64% versus 53%). They are less likely to be at the CEO level, and more likely to have other executive experiences such as line or functional leadership. They are also more likely to be minorities.
Financial skills are in high demand. More than a quarter (25.5%) of the incoming directors are financial experts, up from 18% in 2008. Eleven percent (11%) — nearly half of the financial professionals — are experi-enced CFOs/financial executives. In addition, directors with investing/investment management skills are increasingly joining S&P 500 boards. Ten percent (10%) of new directors bring an investor lens to the board-room, up from 4% a decade ago.
Younger, tech savvy executives are also valued directors. Seventeen percent (17%) of the incoming class are age 50 and younger, up slightly from 16% last year. More than one-third of these next-gen directors have backgrounds in the tech/telecommunications sector. The challenge here is finding experts who have a broad business perspective as well as technical expertise. Nearly two-thirds of the next-gen directors are serving on their first public company board. More than half (53%) are women.
428New independent directors
40%New female directors
2018 U.S. Spencer StUart board index 3
Boards appear to be again prioritizing active over retired executives. Reversing a decade-long decline, 56% of the incoming class are actively employed. Ten years ago 68% of directors were employed.
As they evolve their board composition, a growing number of companies are voluntarily enhancing their disclosures to highlight the diversity of their boards and showcase how director skills and qualifications align with company strategies and risks. But only 30% of the surveyed S&P 500 companies published a board matrix spotlighting the skills and qualifications of each director.
progreSS in boArdroom diverSity iS mixedFor the second consecutive year, women and minorities represent half of the class of new S&P 500 directors. But progress is mixed. Women advanced, representing a record-breaking 40% of the incoming class (up from 36% last year). Minority women represent 9% of the new directors, up from 6% last year. Meanwhile, minority men (defined as African-American, Hispanic/Latino or Asian) experienced a slowdown (representing 10% of the incoming class, down from 14% last year).
More than half of the new women directors were added to boards that expanded in size over the past year, an indication that boards are heeding investor calls for enhanced gender diversity in the boardroom. Only three S&P 500 companies have no women directors. Today 87% of S&P 500 boards have two or more women directors, up from 80% last year and 56% a decade ago. Ten S&P 500 companies have 50% or more women on their boards.
The new women directors have markedly different backgrounds from their male peers. Women are more frequently line and functional leaders and financial executives and less frequently at the CEO level. Their industry experiences differ as well, with women more likely to have backgrounds in the tech/telecommunications and consumer sectors and less likely to have private equity/investment backgrounds.
Not only are more women joining S&P 500 boards, but they are also assuming somewhat more committee leadership roles. Women now chair 20% of audit committees, 19% of compensation committees, and 24% of nominating/governance committees, compared to 20%, 17% and 22% last year. However, women represent only 7% of independent board chairs, unchanged from last year, and 10% of lead/presiding directors, versus 9% last year.
With only 8% of all S&P 500 directors joining a board in the past year, moving the needle on boardroom diversity is difficult. As a result, in
17%Next-gen directors
(50 years old and younger)
33%New directors serving on
first corporate board
spencer stuart4
spencer stuart perspective for 2018
spite of the record number of new female directors, representation of women on S&P 500 boards increased incrementally to 24% of all directors, up from 22% in 2017 and 18% in 2013.
Meanwhile, progress has stalled when it comes to minority represent-ation at the top 200 S&P 500 companies. Today, 17% of the independent directors of the top 200 companies are male or female minorities, unchanged from last year and up only slightly from 14% in 2008.
boArd ASSeSSmentS Are StAndArd prActice, but individuAl ASSeSSmentS AppeAr to be fAr leSS prevAlentAnnual assessments have become the norm for boards around the globe, and 98% of the S&P 500 companies in our index reported conducting a board assessment over the past year. Companies are increasingly turning to external parties to assist with board evalua-tions. This year 9% of S&P 500 companies disclosed retaining an independent expert to facilitate the evaluation progress, compared to only 2% last year.
Individual assessments continue to appear to be far less prevalent. Only 38% of S&P 500 companies — largely unchanged from 37% last year and 33% five years ago — report some form of individual director evaluations.
The persistent reluctance to incorporate individual/peer assessments in the evaluation process runs counter to widespread investor views. Today, investors consider meaningful board and peer/self-assessments as “best practice” for evaluating and enhancing board and director performance and promoting boardroom refreshment.
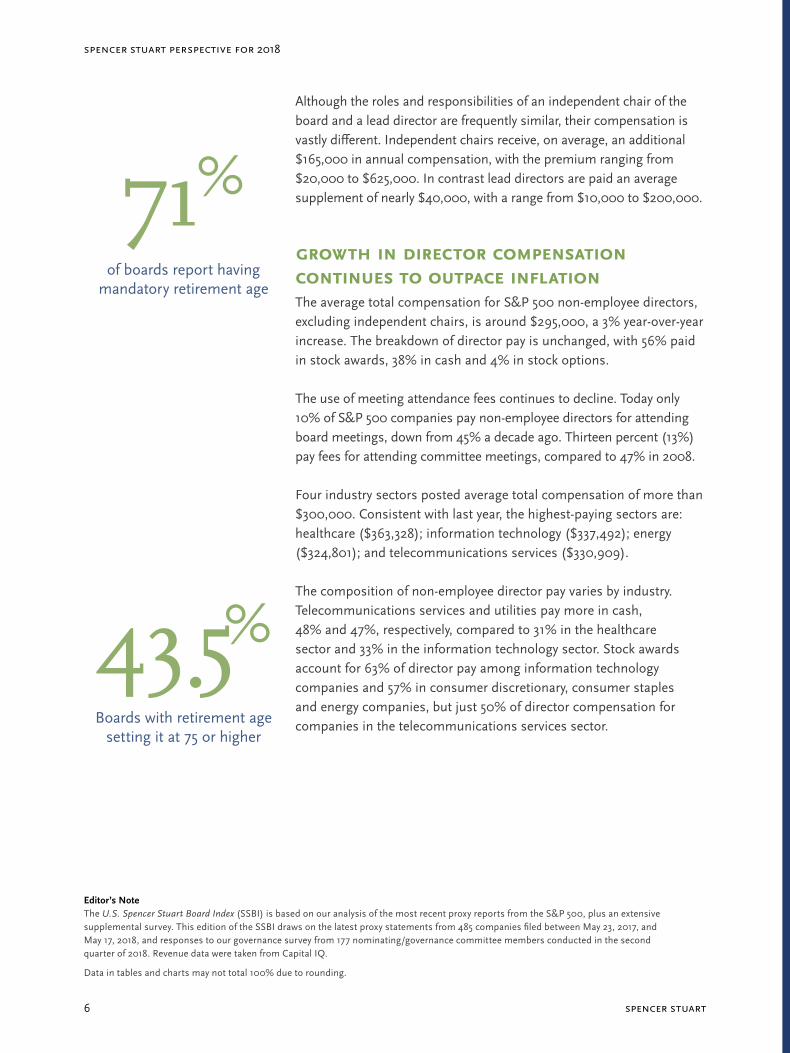
mAndAtory retirement policieS Are An importAnt turnover mechAniSm Meanwhile, S&P 500 boards continue to rely on mandatory retirement policies to facilitate board turnover. Today 71% of S&P 500 boards disclose a mandatory retirement age for directors, largely unchanged over the past five years. Retirement ages continue to climb. Of the universe of S&P 500 companies with retirement age policies, 43.5% set the age at 75 or older, compared with 42% last year and just 11% in 2008. Three boards have a retirement age of 80. More than half mandate retirement at age at 73 or higher.
Over the past year, 406 independent directors left S&P 500 boards.
45%CEOs sitting on one or more
outside boards
35.5%of new directors
are CEO-level
2018 U.S. Spencer StUart board index 5
They departed at an average age of 68.4 and with an average tenure of 12.7 years. More than half (56%) left at 70 or older, and 36% served on the board for 15 or more years. Twenty-one (5%) were 80 or older with an average tenure of 20.6 years, and 28 were 55 or younger with an average tenure of five years. A total of 69 women directors (average tenure 13 years) retired during the past year, replaced by 33 women.
Three-quarters of the independent directors who left S&P 500 boards in the past year served on boards with mandatory retirement ages. The age limits influenced a majority of these departures, with 37% either exceeding or reaching the age limit at retirement, and another 16% exiting the board within three years of the retirement age.
Tenure limitations are rare. Only 25 S&P 500 boards (5%) set explicit term limits for non-executive directors, with terms ranging from nine to 20 years. A majority of the policies are set at 15 years or more. Meanwhile, the average tenure of S&P 500 independent directors is 8.1 years, a slight decrease from 8.6 years in 2013.
Absent changes in boardroom trends and refreshment practices, future turnover rates of S&P 500 boards will remain low. Only 16% of independent directors on boards with age caps are within three years of mandatory retirement. And with independent directors averaging 63 years of age (two years older than a decade ago) and mandatory retirement ages rising, many have a long runway until they reach the age cap. Interestingly, demographics may force turnover on boards without mandatory retirement ages; 28% of directors on boards with no age caps are 70 or older.
independent boArd chAirS Are on the riSe Independent board chairs, a common governance practice outside of the U.S., are slowly gaining ground at S&P 500 companies. Today half of S&P 500 boards split the chair and CEO roles, up from 39% a decade ago. Slightly more than 30% of S&P 500 boards are now chaired by an independent director — a director who meets the applicable NYSE or NASDAQ rules for independence — an increase from 28% last year and 16% in 2008.
With more boards appointing independent chairs, the number of lead and presiding directors has steadily declined. Today 80% of S&P 500 boards report having an independent lead or presiding director, compared with 95% a decade ago.
26%of new directors have finance backgrounds
50%of boards have a separate
chair and CEO
spencer stuart6
spencer stuart perspective for 2018
Although the roles and responsibilities of an independent chair of the board and a lead director are frequently similar, their compensation is vastly different. Independent chairs receive, on average, an additional $165,000 in annual compensation, with the premium ranging from $20,000 to $625,000. In contrast lead directors are paid an average supplement of nearly $40,000, with a range from $10,000 to $200,000.
growth in director compenSAtion continueS to outpAce inflAtionThe average total compensation for S&P 500 non-employee directors, excluding independent chairs, is around $295,000, a 3% year-over-year increase. The breakdown of director pay is unchanged, with 56% paid in stock awards, 38% in cash and 4% in stock options.
The use of meeting attendance fees continues to decline. Today only 10% of S&P 500 companies pay non-employee directors for attending board meetings, down from 45% a decade ago. Thirteen percent (13%) pay fees for attending committee meetings, compared to 47% in 2008.
Four industry sectors posted average total compensation of more than $300,000. Consistent with last year, the highest-paying sectors are: healthcare ($363,328); information technology ($337,492); energy ($324,801); and telecommunications services ($330,909).
The composition of non-employee director pay varies by industry. Telecommunications services and utilities pay more in cash, 48% and 47%, respectively, compared to 31% in the healthcare sector and 33% in the information technology sector. Stock awards account for 63% of director pay among information technology companies and 57% in consumer discretionary, consumer staples and energy companies, but just 50% of director compensation for companies in the telecommunications services sector.
43.5%Boards with retirement age
setting it at 75 or higher
71%of boards report having
mandatory retirement age
Editor’s NoteThe U.S. Spencer Stuart Board Index (SSBI) is based on our analysis of the most recent proxy reports from the S&P 500, plus an extensive supplemental survey. This edition of the SSBI draws on the latest proxy statements from 485 companies filed between May 23, 2017, and May 17, 2018, and responses to our governance survey from 177 nominating/governance committee members conducted in the second quarter of 2018. Revenue data were taken from Capital IQ.
Data in tables and charts may not total 100% due to rounding.
2018 U.S. Spencer StUart board index 7
S&P 500 Boards: Trends over One, Five and 10 Years
spencer stuart8
2018a 2017b 2013c 2008d
5-year % change
10-year % change
Board composition
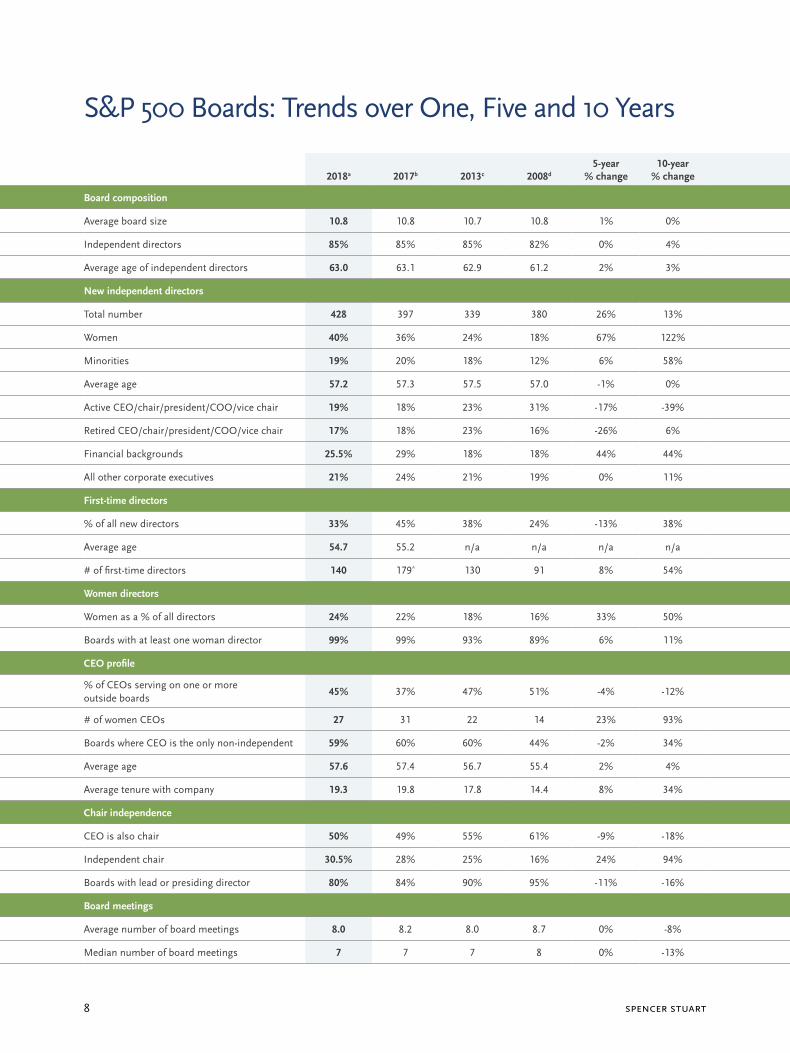
Average board size 10.8 10.8 10.7 10.8 1% 0%
Independent directors 85% 85% 85% 82% 0% 4%
Average age of independent directors 63.0 63.1 62.9 61.2 2% 3%
New independent directors
Total number 428 397 339 380 26% 13%
Women 40% 36% 24% 18% 67% 122%
Minorities 19% 20% 18% 12% 6% 58%
Average age 57.2 57.3 57.5 57.0 -1% 0%
Active CEO/chair/president/COO/vice chair 19% 18% 23% 31% -17% -39%
Retired CEO/chair/president/COO/vice chair 17% 18% 23% 16% -26% 6%
Financial backgrounds 25.5% 29% 18% 18% 44% 44%
All other corporate executives 21% 24% 21% 19% 0% 11%
First-time directors
% of all new directors 33% 45% 38% 24% -13% 38%
Average age 54.7 55.2 n/a n/a n/a n/a
# of first-time directors 140 179* 130 91 8% 54%
Women directors
Women as a % of all directors 24% 22% 18% 16% 33% 50%
Boards with at least one woman director 99% 99% 93% 89% 6% 11%
CEO profile
% of CEOs serving on one or more outside boards
45% 37% 47% 51% -4% -12%
# of women CEOs 27 31 22 14 23% 93%
Boards where CEO is the only non-independent 59% 60% 60% 44% -2% 34%
Average age 57.6 57.4 56.7 55.4 2% 4%
Average tenure with company 19.3 19.8 17.8 14.4 8% 34%
Chair independence
CEO is also chair 50% 49% 55% 61% -9% -18%
Independent chair 30.5% 28% 25% 16% 24% 94%
Boards with lead or presiding director 80% 84% 90% 95% -11% -16%
Board meetings
Average number of board meetings 8.0 8.2 8.0 8.7 0% -8%
Median number of board meetings 7 7 7 8 0% -13%
S&P 500 Boards: Trends over One, Five and 10 Years
2018 U.S. Spencer StUart board index 9
S&P 500 BoardS: TrendS over one, Five and 10 YearS
2018a 2017b 2013c 2008d
5-year % change
10-year % change
Retirement age
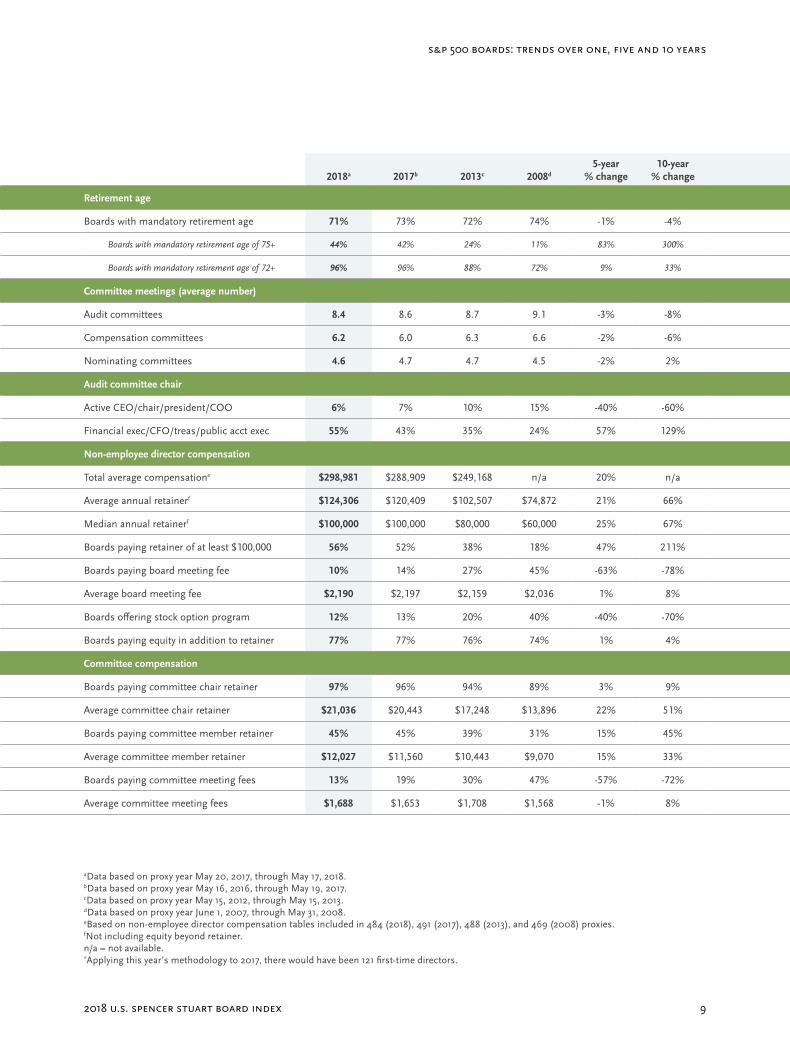
Boards with mandatory retirement age 71% 73% 72% 74% -1% -4%
Boards with mandatory retirement age of 75+ 44% 42% 24% 11% 83% 300%
Boards with mandatory retirement age of 72+ 96% 96% 88% 72% 9% 33%
Committee meetings (average number)
Audit committees 8.4 8.6 8.7 9.1 -3% -8%
Compensation committees 6.2 6.0 6.3 6.6 -2% -6%
Nominating committees 4.6 4.7 4.7 4.5 -2% 2%
Audit committee chair
Active CEO/chair/president/COO 6% 7% 10% 15% -40% -60%
Financial exec/CFO/treas/public acct exec 55% 43% 35% 24% 57% 129%
Non-employee director compensation
Total average compensatione $298,981 $288,909 $249,168 n/a 20% n/a
Average annual retainerf $124,306 $120,409 $102,507 $74,872 21% 66%
Median annual retainerf $100,000 $100,000 $80,000 $60,000 25% 67%
Boards paying retainer of at least $100,000 56% 52% 38% 18% 47% 211%
Boards paying board meeting fee 10% 14% 27% 45% -63% -78%
Average board meeting fee $2,190 $2,197 $2,159 $2,036 1% 8%
Boards offering stock option program 12% 13% 20% 40% -40% -70%
Boards paying equity in addition to retainer 77% 77% 76% 74% 1% 4%
Committee compensation
Boards paying committee chair retainer 97% 96% 94% 89% 3% 9%
Average committee chair retainer $21,036 $20,443 $17,248 $13,896 22% 51%
Boards paying committee member retainer 45% 45% 39% 31% 15% 45%
Average committee member retainer $12,027 $11,560 $10,443 $9,070 15% 33%
Boards paying committee meeting fees 13% 19% 30% 47% -57% -72%
Average committee meeting fees $1,688 $1,653 $1,708 $1,568 -1% 8%
aData based on proxy year May 20, 2017, through May 17, 2018.bData based on proxy year May 16, 2016, through May 19, 2017.cData based on proxy year May 15, 2012, through May 15, 2013.dData based on proxy year June 1, 2007, through May 31, 2008.eBased on non-employee director compensation tables included in 484 (2018), 491 (2017), 488 (2013), and 469 (2008) proxies.fNot including equity beyond retainer.n/a = not available.*Applying this year’s methodology to 2017, there would have been 121 first-time directors.
spencer stuart10
Board Composition
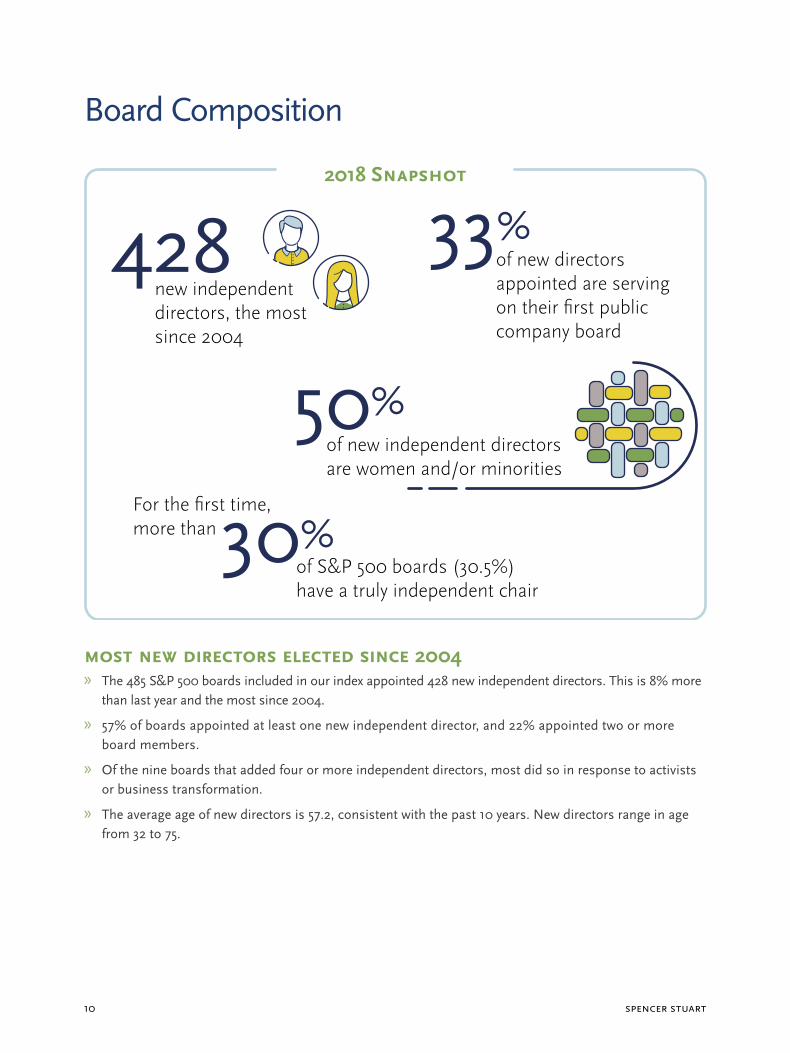
of new directors appointed are serving on their first public company board
33%
of S&P 500 boards (30.5%) have a truly independent chair
For the first time, more than30%
of new independent directors are women and/or minorities
50%
new independent directors, the most since 2004
4282018 Snapshot
moSt new directorS elected Since 2004 » The 485 S&P 500 boards included in our index appointed 428 new independent directors. This is 8% more
than last year and the most since 2004.
» 57% of boards appointed at least one new independent director, and 22% appointed two or more board members.
» Of the nine boards that added four or more independent directors, most did so in response to activists or business transformation.
» The average age of new directors is 57.2, consistent with the past 10 years. New directors range in age from 32 to 75.
2018 U.S. Spencer StUart board index 11
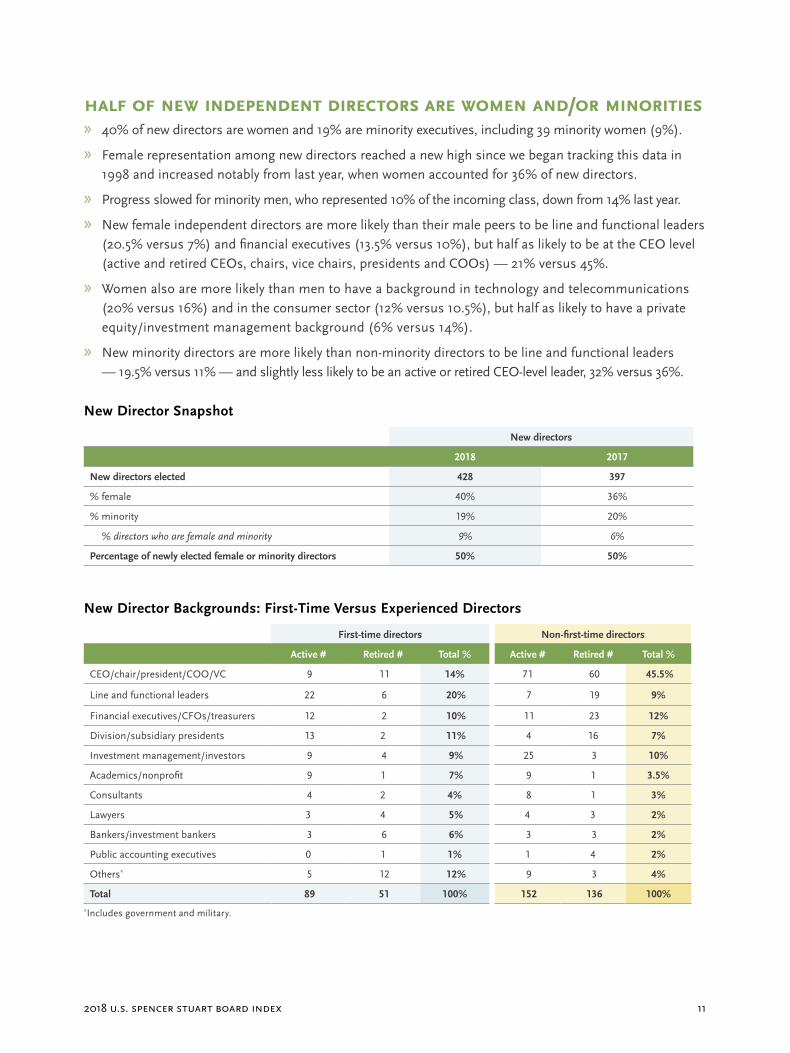
hAlf of new independent directorS Are women And/or minoritieS » 40% of new directors are women and 19% are minority executives, including 39 minority women (9%).
» Female representation among new directors reached a new high since we began tracking this data in 1998 and increased notably from last year, when women accounted for 36% of new directors.
» Progress slowed for minority men, who represented 10% of the incoming class, down from 14% last year.
» New female independent directors are more likely than their male peers to be line and functional leaders (20.5% versus 7%) and financial executives (13.5% versus 10%), but half as likely to be at the CEO level (active and retired CEOs, chairs, vice chairs, presidents and COOs) — 21% versus 45%.
» Women also are more likely than men to have a background in technology and telecommunications (20% versus 16%) and in the consumer sector (12% versus 10.5%), but half as likely to have a private equity/investment management background (6% versus 14%).
» New minority directors are more likely than non-minority directors to be line and functional leaders — 19.5% versus 11% — and slightly less likely to be an active or retired CEO-level leader, 32% versus 36%.
New Director Snapshot
New directors
2018 2017
New directors elected 428 397
% female 40% 36%
% minority 19% 20%
% directors who are female and minority 9% 6%
Percentage of newly elected female or minority directors 50% 50%
New Director Backgrounds: First-Time Versus Experienced Directors
First-time directors Non-first-time directors
Active # Retired # Total % Active # Retired # Total %
CEO/chair/president/COO/VC 9 11 14% 71 60 45.5%
Line and functional leaders 22 6 20% 7 19 9%
Financial executives/CFOs/treasurers 12 2 10% 11 23 12%
Division/subsidiary presidents 13 2 11% 4 16 7%
Investment management/investors 9 4 9% 25 3 10%
Academics/nonprofit 9 1 7% 9 1 3.5%
Consultants 4 2 4% 8 1 3%
Lawyers 3 4 5% 4 3 2%
Bankers/investment bankers 3 6 6% 3 3 2%
Public accounting executives 0 1 1% 1 4 2%
Others* 5 12 12% 9 3 4%
Total 89 51 100% 152 136 100%*Includes government and military.
spencer stuart12
Board Composition
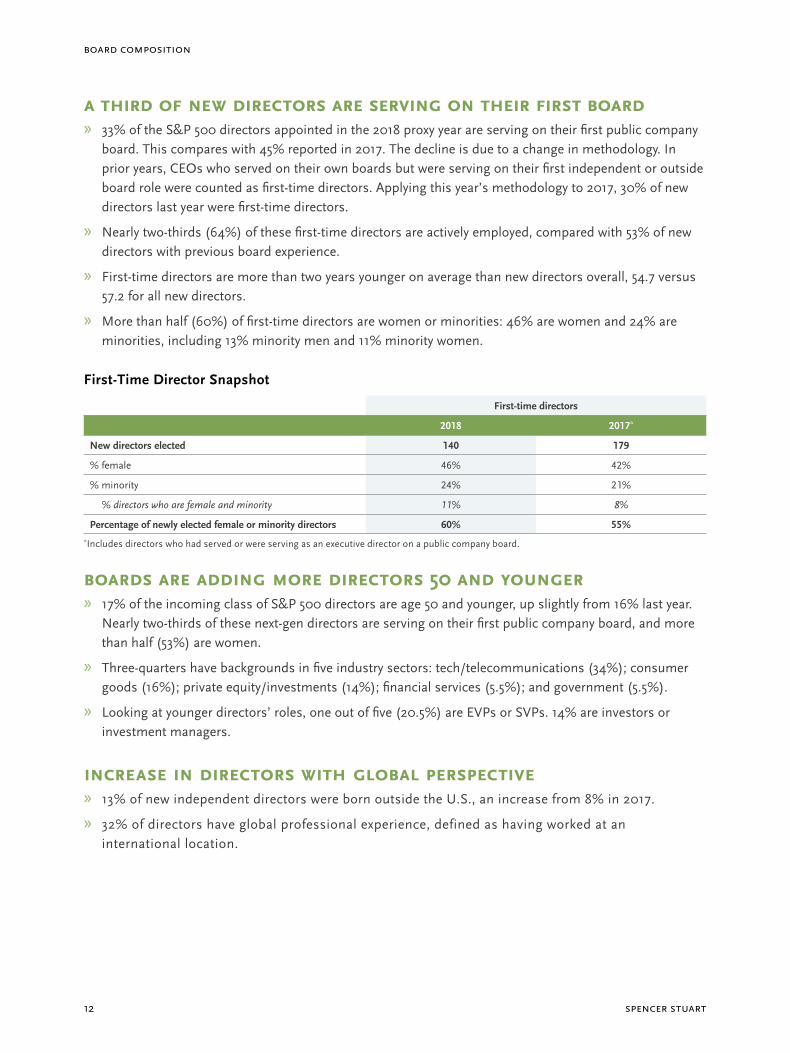
A third of new directorS Are Serving on their firSt boArd » 33% of the S&P 500 directors appointed in the 2018 proxy year are serving on their first public company
board. This compares with 45% reported in 2017. The decline is due to a change in methodology. In prior years, CEOs who served on their own boards but were serving on their first independent or outside board role were counted as first-time directors. Applying this year’s methodology to 2017, 30% of new directors last year were first-time directors.
» Nearly two-thirds (64%) of these first-time directors are actively employed, compared with 53% of new directors with previous board experience.
» First-time directors are more than two years younger on average than new directors overall, 54.7 versus 57.2 for all new directors.
» More than half (60%) of first-time directors are women or minorities: 46% are women and 24% are minorities, including 13% minority men and 11% minority women.
First-Time Director Snapshot
First-time directors
2018 2017*
New directors elected 140 179
% female 46% 42%
% minority 24% 21%
% directors who are female and minority 11% 8%
Percentage of newly elected female or minority directors 60% 55%*Includes directors who had served or were serving as an executive director on a public company board.
boArdS Are Adding more directorS 50 And younger » 17% of the incoming class of S&P 500 directors are age 50 and younger, up slightly from 16% last year.
Nearly two-thirds of these next-gen directors are serving on their first public company board, and more than half (53%) are women.
» Three-quarters have backgrounds in five industry sectors: tech/telecommunications (34%); consumer goods (16%); private equity/investments (14%); financial services (5.5%); and government (5.5%).
» Looking at younger directors’ roles, one out of five (20.5%) are EVPs or SVPs. 14% are investors or investment managers.
increASe in directorS with globAl perSpective » 13% of new independent directors were born outside the U.S., an increase from 8% in 2017.
» 32% of directors have global professional experience, defined as having worked at an international location.
2018 U.S. Spencer StUart board index 13
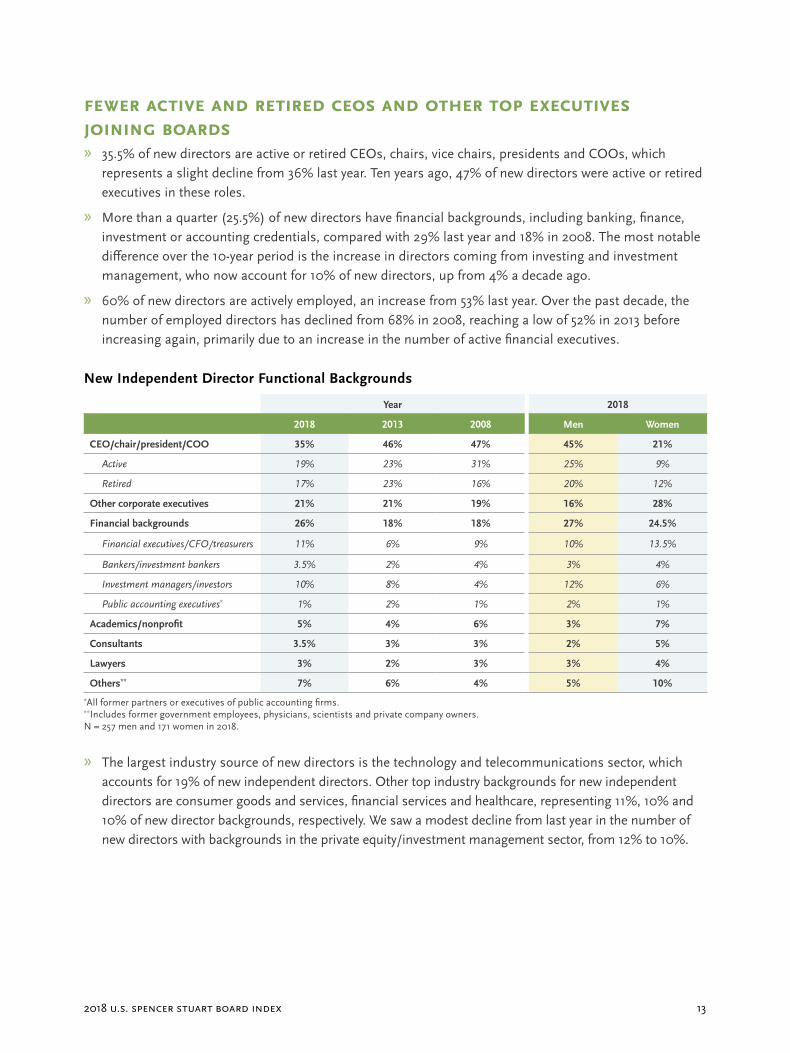
fewer Active And retired ceoS And other top executiveS joining boArdS » 35.5% of new directors are active or retired CEOs, chairs, vice chairs, presidents and COOs, which
represents a slight decline from 36% last year. Ten years ago, 47% of new directors were active or retired executives in these roles.
» More than a quarter (25.5%) of new directors have financial backgrounds, including banking, finance, investment or accounting credentials, compared with 29% last year and 18% in 2008. The most notable difference over the 10-year period is the increase in directors coming from investing and investment management, who now account for 10% of new directors, up from 4% a decade ago.
» 60% of new directors are actively employed, an increase from 53% last year. Over the past decade, the number of employed directors has declined from 68% in 2008, reaching a low of 52% in 2013 before increasing again, primarily due to an increase in the number of active financial executives.
New Independent Director Functional Backgrounds
Year 2018
2018 2013 2008 Men Women
CEO/chair/president/COO 35% 46% 47% 45% 21%
Active 19% 23% 31% 25% 9%
Retired 17% 23% 16% 20% 12%
Other corporate executives 21% 21% 19% 16% 28%
Financial backgrounds 26% 18% 18% 27% 24.5%
Financial executives/CFO/treasurers 11% 6% 9% 10% 13.5%
Bankers/investment bankers 3.5% 2% 4% 3% 4%
Investment managers/investors 10% 8% 4% 12% 6%
Public accounting executives* 1% 2% 1% 2% 1%
Academics/nonprofit 5% 4% 6% 3% 7%
Consultants 3.5% 3% 3% 2% 5%
Lawyers 3% 2% 3% 3% 4%
Others** 7% 6% 4% 5% 10%*All former partners or executives of public accounting firms. **Includes former government employees, physicians, scientists and private company owners. N = 257 men and 171 women in 2018.
» The largest industry source of new directors is the technology and telecommunications sector, which accounts for 19% of new independent directors. Other top industry backgrounds for new independent directors are consumer goods and services, financial services and healthcare, representing 11%, 10% and 10% of new director backgrounds, respectively. We saw a modest decline from last year in the number of new directors with backgrounds in the private equity/investment management sector, from 12% to 10%.
spencer stuart14
Board Composition
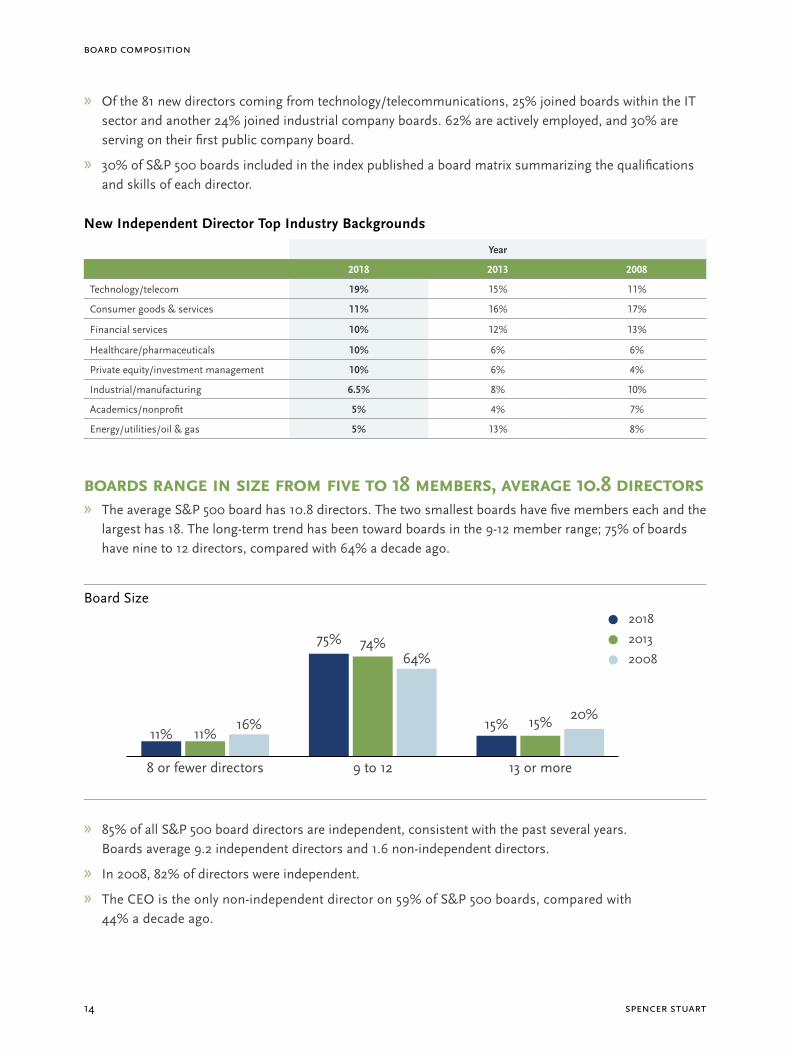
» Of the 81 new directors coming from technology/telecommunications, 25% joined boards within the IT sector and another 24% joined industrial company boards. 62% are actively employed, and 30% are serving on their first public company board.
» 30% of S&P 500 boards included in the index published a board matrix summarizing the qualifications and skills of each director.
New Independent Director Top Industry Backgrounds
Year
2018 2013 2008
Technology/telecom 19% 15% 11%
Consumer goods & services 11% 16% 17%
Financial services 10% 12% 13%
Healthcare/pharmaceuticals 10% 6% 6%
Private equity/investment management 10% 6% 4%
Industrial/manufacturing 6.5% 8% 10%
Academics/nonprofit 5% 4% 7%
Energy/utilities/oil & gas 5% 13% 8%
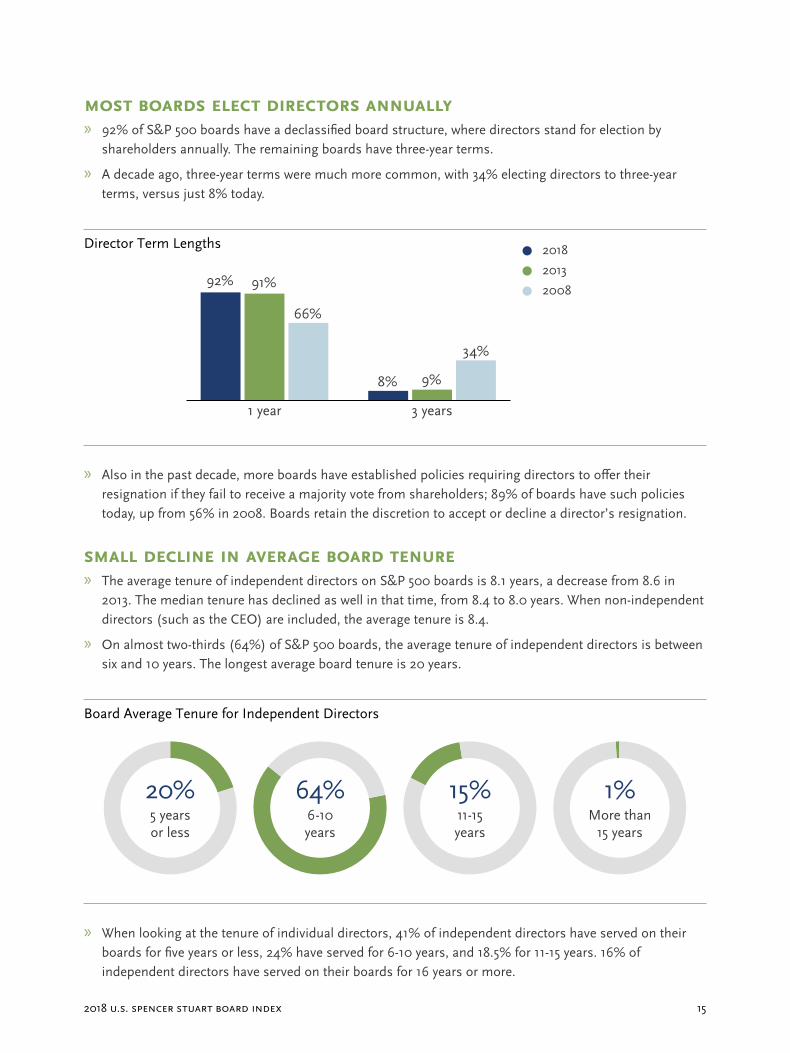
boArdS rAnge in Size from five to 18 memberS, AverAge 10.8 directorS » The average S&P 500 board has 10.8 directors. The two smallest boards have five members each and the
largest has 18. The long-term trend has been toward boards in the 9-12 member range; 75% of boards have nine to 12 directors, compared with 64% a decade ago.
Board Size
» 85% of all S&P 500 board directors are independent, consistent with the past several years. Boards average 9.2 independent directors and 1.6 non-independent directors.
» In 2008, 82% of directors were independent.
» The CEO is the only non-independent director on 59% of S&P 500 boards, compared with 44% a decade ago.
8 or fewer directors
11% 11%16%
9 to 12
75% 74%64%
13 or more
15% 15% 20%
2018
2013
2008
2018 U.S. Spencer StUart board index 15
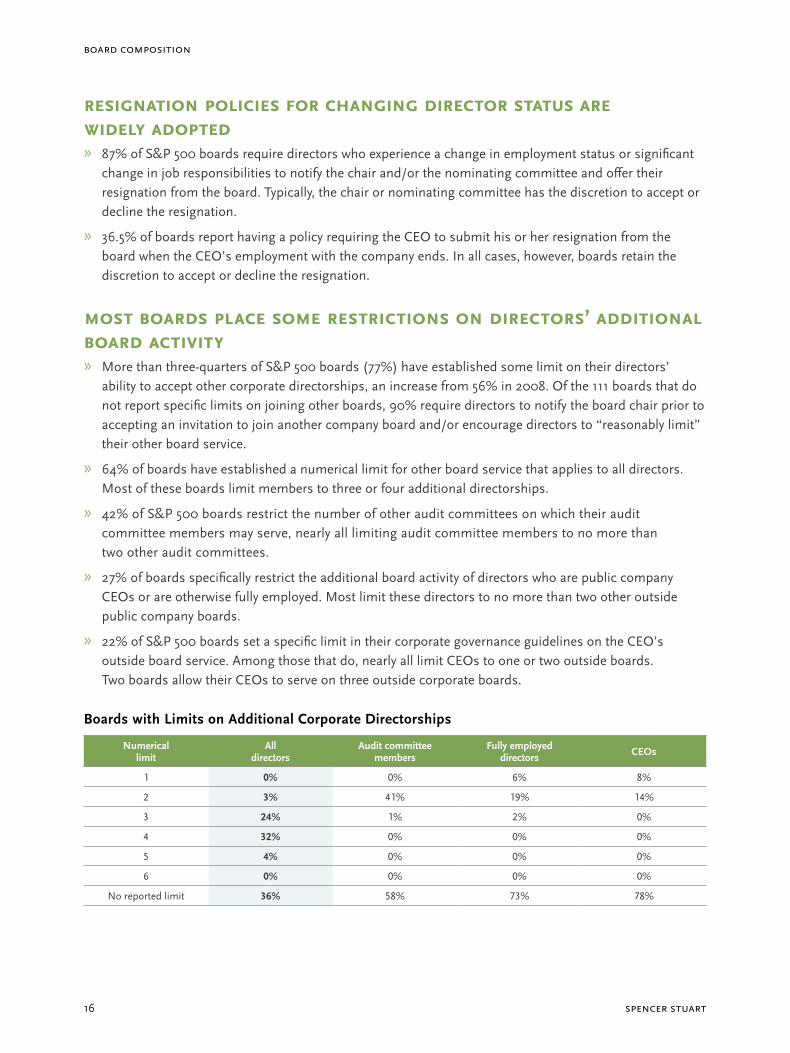
moSt boArdS elect directorS AnnuAlly » 92% of S&P 500 boards have a declassified board structure, where directors stand for election by
shareholders annually. The remaining boards have three-year terms.
» A decade ago, three-year terms were much more common, with 34% electing directors to three-year terms, versus just 8% today.
Director Term Lengths
» Also in the past decade, more boards have established policies requiring directors to offer their resignation if they fail to receive a majority vote from shareholders; 89% of boards have such policies today, up from 56% in 2008. Boards retain the discretion to accept or decline a director’s resignation.
SmAll decline in AverAge boArd tenure » The average tenure of independent directors on S&P 500 boards is 8.1 years, a decrease from 8.6 in
2013. The median tenure has declined as well in that time, from 8.4 to 8.0 years. When non-independent directors (such as the CEO) are included, the average tenure is 8.4.
» On almost two-thirds (64%) of S&P 500 boards, the average tenure of independent directors is between six and 10 years. The longest average board tenure is 20 years.
Board Average Tenure for Independent Directors
» When looking at the tenure of individual directors, 41% of independent directors have served on their boards for five years or less, 24% have served for 6-10 years, and 18.5% for 11-15 years. 16% of independent directors have served on their boards for 16 years or more.
1 year
92% 91%
66%
3 years
8% 9%
34%
2018
2013
2008
5 years or less
20% 64%6-10 years
15%11-15 years
1%More than
15 years
spencer stuart16
Board Composition
reSignAtion policieS for chAnging director StAtuS Are widely Adopted » 87% of S&P 500 boards require directors who experience a change in employment status or significant
change in job responsibilities to notify the chair and/or the nominating committee and offer their resignation from the board. Typically, the chair or nominating committee has the discretion to accept or decline the resignation.
» 36.5% of boards report having a policy requiring the CEO to submit his or her resignation from the board when the CEO’s employment with the company ends. In all cases, however, boards retain the discretion to accept or decline the resignation.
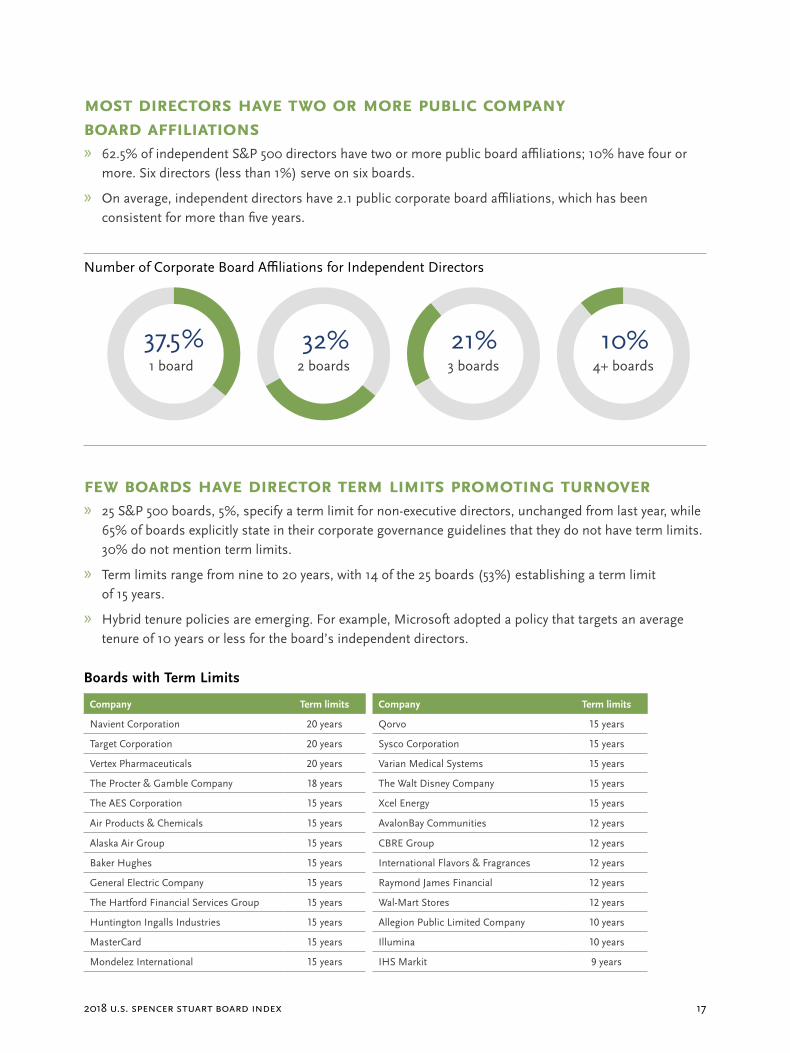
moSt boArdS plAce Some reStrictionS on directorS’ AdditionAl boArd Activity » More than three-quarters of S&P 500 boards (77%) have established some limit on their directors’
ability to accept other corporate directorships, an increase from 56% in 2008. Of the 111 boards that do not report specific limits on joining other boards, 90% require directors to notify the board chair prior to accepting an invitation to join another company board and/or encourage directors to “reasonably limit” their other board service.
» 64% of boards have established a numerical limit for other board service that applies to all directors. Most of these boards limit members to three or four additional directorships.
» 42% of S&P 500 boards restrict the number of other audit committees on which their audit committee members may serve, nearly all limiting audit committee members to no more than two other audit committees.
» 27% of boards specifically restrict the additional board activity of directors who are public company CEOs or are otherwise fully employed. Most limit these directors to no more than two other outside public company boards.
» 22% of S&P 500 boards set a specific limit in their corporate governance guidelines on the CEO’s outside board service. Among those that do, nearly all limit CEOs to one or two outside boards. Two boards allow their CEOs to serve on three outside corporate boards.
Boards with Limits on Additional Corporate Directorships
Numerical limit
All directors
Audit committee members
Fully employed directors CEOs
1 0% 0% 6% 8%
2 3% 41% 19% 14%
3 24% 1% 2% 0%
4 32% 0% 0% 0%
5 4% 0% 0% 0%
6 0% 0% 0% 0%
No reported limit 36% 58% 73% 78%
2018 U.S. Spencer StUart board index 17
moSt directorS hAve two or more public compAny boArd AffiliAtionS » 62.5% of independent S&P 500 directors have two or more public board affiliations; 10% have four or
more. Six directors (less than 1%) serve on six boards.
» On average, independent directors have 2.1 public corporate board affiliations, which has been consistent for more than five years.
Number of Corporate Board Affiliations for Independent Directors
1 board
37.5%2 boards
32%3 boards
21%4+ boards
10%
few boArdS hAve director term limitS promoting turnover » 25 S&P 500 boards, 5%, specify a term limit for non-executive directors, unchanged from last year, while
65% of boards explicitly state in their corporate governance guidelines that they do not have term limits. 30% do not mention term limits.
» Term limits range from nine to 20 years, with 14 of the 25 boards (53%) establishing a term limit of 15 years.
» Hybrid tenure policies are emerging. For example, Microsoft adopted a policy that targets an average tenure of 10 years or less for the board’s independent directors.
Boards with Term Limits
Company Term limits Company Term limits
Navient Corporation 20 years Qorvo 15 years
Target Corporation 20 years Sysco Corporation 15 years
Vertex Pharmaceuticals 20 years Varian Medical Systems 15 years
The Procter & Gamble Company 18 years The Walt Disney Company 15 years
The AES Corporation 15 years Xcel Energy 15 years
Air Products & Chemicals 15 years AvalonBay Communities 12 years
Alaska Air Group 15 years CBRE Group 12 years
Baker Hughes 15 years International Flavors & Fragrances 12 years
General Electric Company 15 years Raymond James Financial 12 years
The Hartford Financial Services Group 15 years Wal-Mart Stores 12 years
Huntington Ingalls Industries 15 years Allegion Public Limited Company 10 years
MasterCard 15 years Illumina 10 years
Mondelez International 15 years IHS Markit 9 years
spencer stuart18
Board Composition
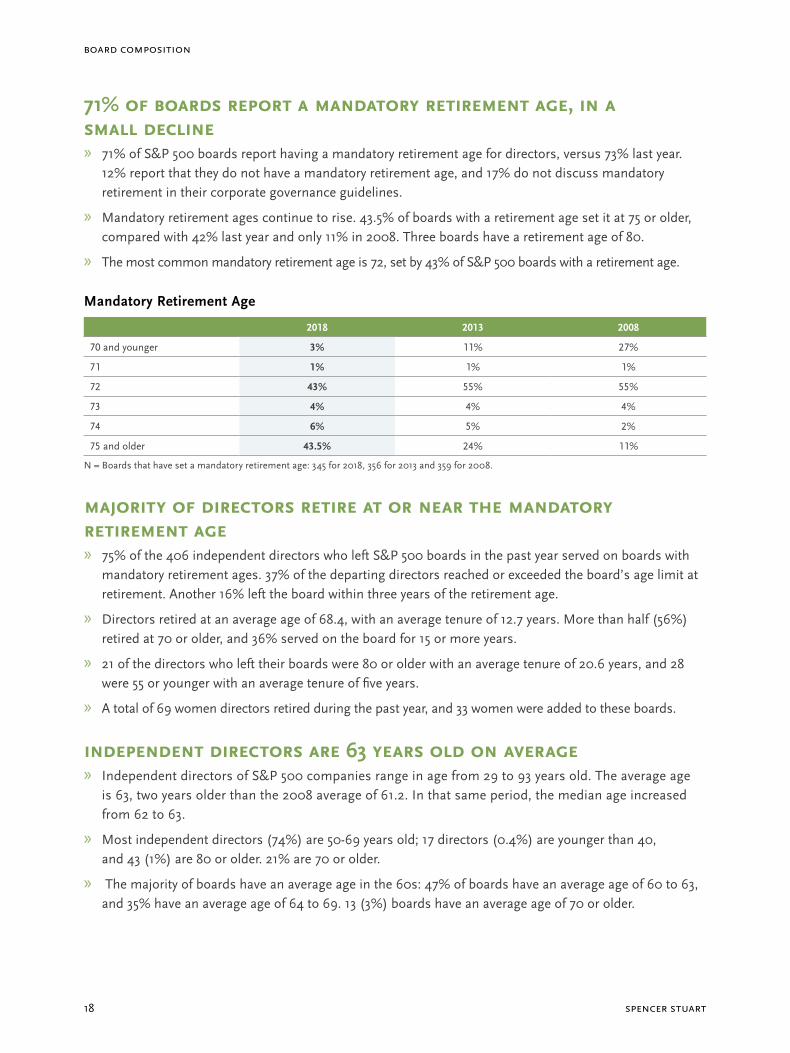
71% of boArdS report A mAndAtory retirement Age, in A SmAll decline » 71% of S&P 500 boards report having a mandatory retirement age for directors, versus 73% last year.
12% report that they do not have a mandatory retirement age, and 17% do not discuss mandatory retirement in their corporate governance guidelines.
» Mandatory retirement ages continue to rise. 43.5% of boards with a retirement age set it at 75 or older, compared with 42% last year and only 11% in 2008. Three boards have a retirement age of 80.
» The most common mandatory retirement age is 72, set by 43% of S&P 500 boards with a retirement age.
Mandatory Retirement Age
2018 2013 2008
70 and younger 3% 11% 27%
71 1% 1% 1%
72 43% 55% 55%
73 4% 4% 4%
74 6% 5% 2%
75 and older 43.5% 24% 11%
N = Boards that have set a mandatory retirement age: 345 for 2018, 356 for 2013 and 359 for 2008.
mAjority of directorS retire At or neAr the mAndAtory retirement Age » 75% of the 406 independent directors who left S&P 500 boards in the past year served on boards with
mandatory retirement ages. 37% of the departing directors reached or exceeded the board’s age limit at retirement. Another 16% left the board within three years of the retirement age.
» Directors retired at an average age of 68.4, with an average tenure of 12.7 years. More than half (56%) retired at 70 or older, and 36% served on the board for 15 or more years.
» 21 of the directors who left their boards were 80 or older with an average tenure of 20.6 years, and 28 were 55 or younger with an average tenure of five years.
» A total of 69 women directors retired during the past year, and 33 women were added to these boards.
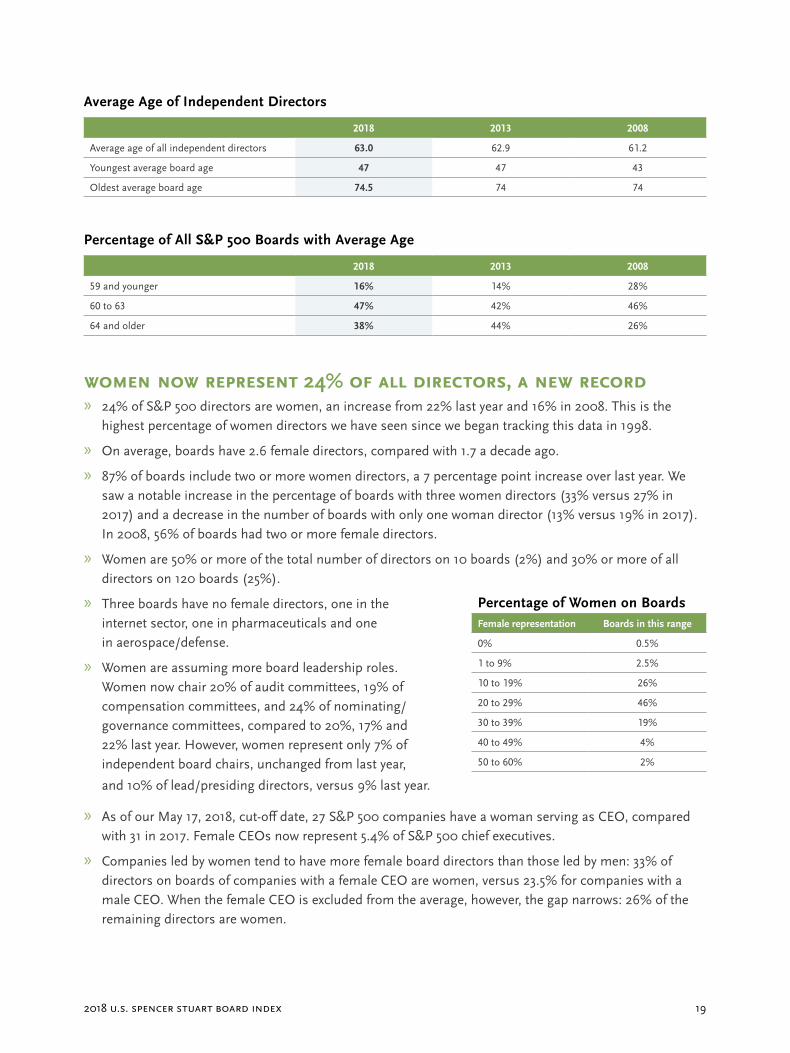
independent directorS Are 63 yeArS old on AverAge » Independent directors of S&P 500 companies range in age from 29 to 93 years old. The average age
is 63, two years older than the 2008 average of 61.2. In that same period, the median age increased from 62 to 63.
» Most independent directors (74%) are 50-69 years old; 17 directors (0.4%) are younger than 40, and 43 (1%) are 80 or older. 21% are 70 or older.
» The majority of boards have an average age in the 60s: 47% of boards have an average age of 60 to 63, and 35% have an average age of 64 to 69. 13 (3%) boards have an average age of 70 or older.
2018 U.S. Spencer StUart board index 19
Average Age of Independent Directors
2018 2013 2008
Average age of all independent directors 63.0 62.9 61.2
Youngest average board age 47 47 43
Oldest average board age 74.5 74 74
Percentage of All S&P 500 Boards with Average Age
2018 2013 2008
59 and younger 16% 14% 28%
60 to 63 47% 42% 46%
64 and older 38% 44% 26%
women now repreSent 24% of All directorS, A new record » 24% of S&P 500 directors are women, an increase from 22% last year and 16% in 2008. This is the
highest percentage of women directors we have seen since we began tracking this data in 1998.
» On average, boards have 2.6 female directors, compared with 1.7 a decade ago.
» 87% of boards include two or more women directors, a 7 percentage point increase over last year. We saw a notable increase in the percentage of boards with three women directors (33% versus 27% in 2017) and a decrease in the number of boards with only one woman director (13% versus 19% in 2017). In 2008, 56% of boards had two or more female directors.
» Women are 50% or more of the total number of directors on 10 boards (2%) and 30% or more of all directors on 120 boards (25%).
» Three boards have no female directors, one in the internet sector, one in pharmaceuticals and one in aerospace/defense.
» Women are assuming more board leadership roles. Women now chair 20% of audit committees, 19% of compensation committees, and 24% of nominating/governance committees, compared to 20%, 17% and 22% last year. However, women represent only 7% of independent board chairs, unchanged from last year,
and 10% of lead/presiding directors, versus 9% last year.
» As of our May 17, 2018, cut-off date, 27 S&P 500 companies have a woman serving as CEO, compared with 31 in 2017. Female CEOs now represent 5.4% of S&P 500 chief executives.
» Companies led by women tend to have more female board directors than those led by men: 33% of directors on boards of companies with a female CEO are women, versus 23.5% for companies with a male CEO. When the female CEO is excluded from the average, however, the gap narrows: 26% of the remaining directors are women.
Percentage of Women on BoardsFemale representation Boards in this range
0% 0.5%
1 to 9% 2.5%
10 to 19% 26%
20 to 29% 46%
30 to 39% 19%
40 to 49% 4%
50 to 60% 2%
spencer stuart20
Board Composition
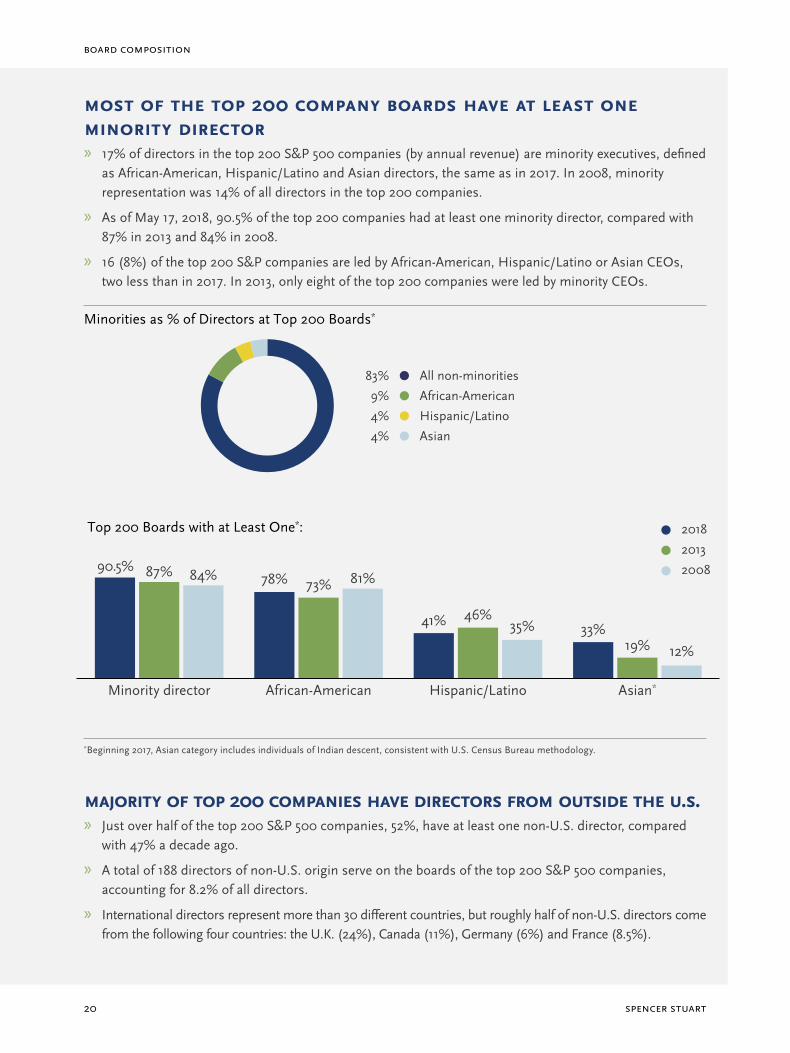
moSt of the top 200 compAny boArdS hAve At leASt one minority director » 17% of directors in the top 200 S&P 500 companies (by annual revenue) are minority executives, defined
as African-American, Hispanic/Latino and Asian directors, the same as in 2017. In 2008, minority representation was 14% of all directors in the top 200 companies.
» As of May 17, 2018, 90.5% of the top 200 companies had at least one minority director, compared with 87% in 2013 and 84% in 2008.
» 16 (8%) of the top 200 S&P companies are led by African-American, Hispanic/Latino or Asian CEOs, two less than in 2017. In 2013, only eight of the top 200 companies were led by minority CEOs.
Minorities as % of Directors at Top 200 Boards*
Top 200 Boards with at Least One*:
*Beginning 2017, Asian category includes individuals of Indian descent, consistent with U.S. Census Bureau methodology.
mAjority of top 200 compAnieS hAve directorS from outSide the u.S. » Just over half of the top 200 S&P 500 companies, 52%, have at least one non-U.S. director, compared
with 47% a decade ago.
» A total of 188 directors of non-U.S. origin serve on the boards of the top 200 S&P 500 companies, accounting for 8.2% of all directors.
» International directors represent more than 30 different countries, but roughly half of non-U.S. directors come from the following four countries: the U.K. (24%), Canada (11%), Germany (6%) and France (8.5%).
Hispanic/Latino
African-American
All non-minorities
Asian
4%
9%
83%
4%
90.5% 87% 84%
Minority director
78% 73% 81%
African-American
41% 46%35%
Hispanic/Latino
33%19% 12%
Asian*
2018
2013
2008
2018 U.S. Spencer StUart board index 21
uptick in the number of ceoS Serving on An outSide public compAny boArd » 45% of S&P 500 CEOs serve on at least one public corporate board in addition to their own board,
compared with 37% in 2017. Still, we’ve seen a 12% decline in the number of CEOs serving on outside public boards since 2008, when 51% of CEOs served on one or more outside public company boards.
» Most CEOs limit their external board service: 38% of CEOs serve on one outside public company board, and just 6% serve on two. Three CEOs serve on three outside public boards.
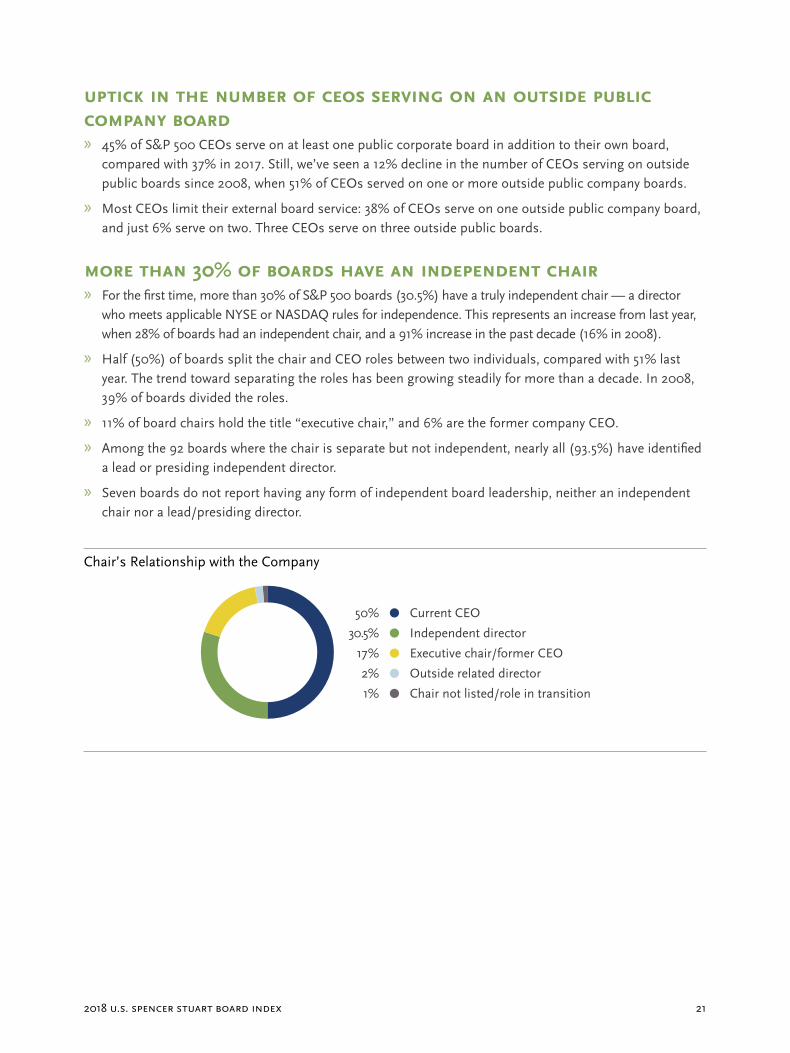
more thAn 30% of boArdS hAve An independent chAir » For the first time, more than 30% of S&P 500 boards (30.5%) have a truly independent chair — a director
who meets applicable NYSE or NASDAQ rules for independence. This represents an increase from last year, when 28% of boards had an independent chair, and a 91% increase in the past decade (16% in 2008).
» Half (50%) of boards split the chair and CEO roles between two individuals, compared with 51% last year. The trend toward separating the roles has been growing steadily for more than a decade. In 2008, 39% of boards divided the roles.
» 11% of board chairs hold the title “executive chair,” and 6% are the former company CEO.
» Among the 92 boards where the chair is separate but not independent, nearly all (93.5%) have identified a lead or presiding independent director.
» Seven boards do not report having any form of independent board leadership, neither an independent chair nor a lead/presiding director.
Chair’s Relationship with the Company
Executive chair/former CEO
Independent director
Current CEO
Chair not listed/role in transition
Outside related director
17%
30.5%
50%
1%
2%
spencer stuart22
Board Composition
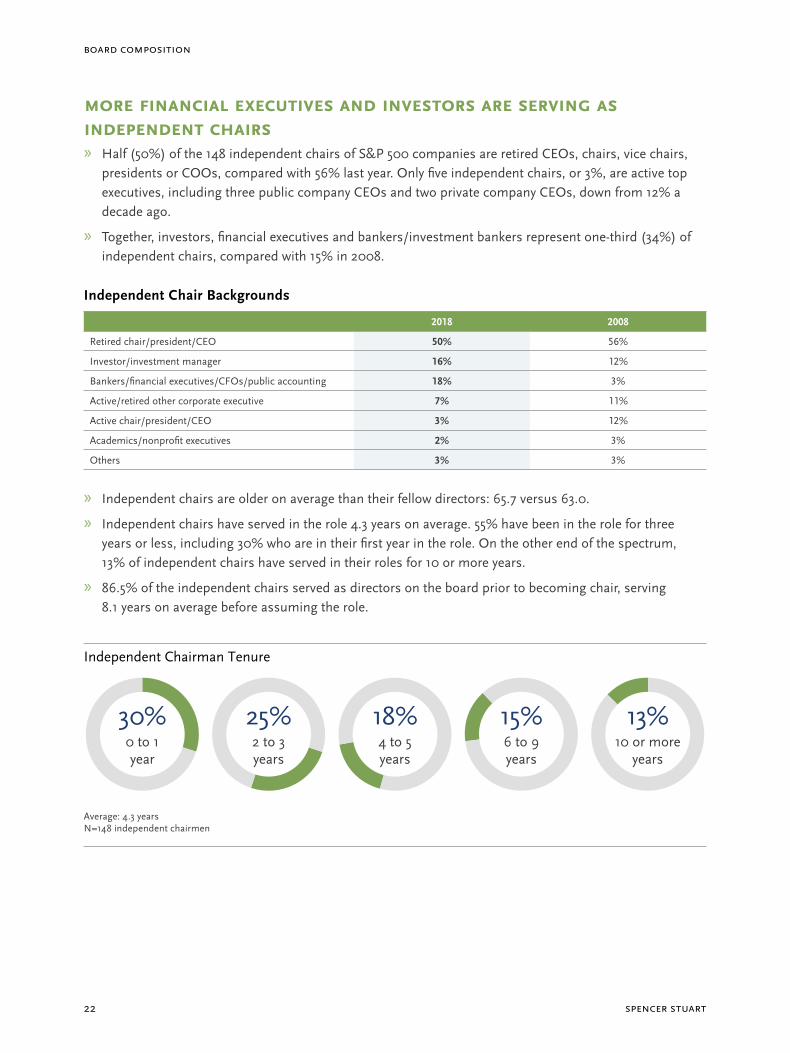
more finAnciAl executiveS And inveStorS Are Serving AS independent chAirS » Half (50%) of the 148 independent chairs of S&P 500 companies are retired CEOs, chairs, vice chairs,
presidents or COOs, compared with 56% last year. Only five independent chairs, or 3%, are active top executives, including three public company CEOs and two private company CEOs, down from 12% a decade ago.
» Together, investors, financial executives and bankers/investment bankers represent one-third (34%) of independent chairs, compared with 15% in 2008.
Independent Chair Backgrounds
2018 2008
Retired chair/president/CEO 50% 56%
Investor/investment manager 16% 12%
Bankers/financial executives/CFOs/public accounting 18% 3%
Active/retired other corporate executive 7% 11%
Active chair/president/CEO 3% 12%
Academics/nonprofit executives 2% 3%
Others 3% 3%
» Independent chairs are older on average than their fellow directors: 65.7 versus 63.0.
» Independent chairs have served in the role 4.3 years on average. 55% have been in the role for three years or less, including 30% who are in their first year in the role. On the other end of the spectrum, 13% of independent chairs have served in their roles for 10 or more years.
» 86.5% of the independent chairs served as directors on the board prior to becoming chair, serving 8.1 years on average before assuming the role.
Independent Chairman Tenure
Average: 4.3 yearsN=148 independent chairmen
0 to 1year
30%2 to 3years
25%4 to 5years
18%6 to 9years
15%10 or more
years
13%
2018 U.S. Spencer StUart board index 23
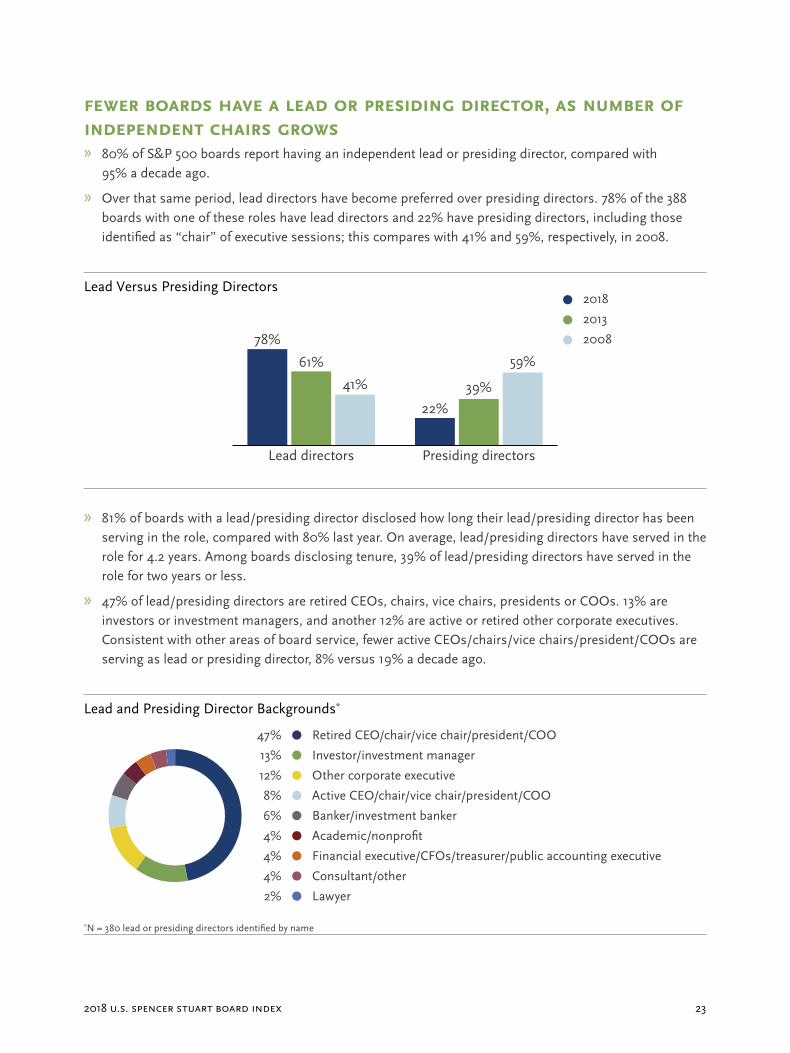
fewer boArdS hAve A leAd or preSiding director, AS number of independent chAirS growS » 80% of S&P 500 boards report having an independent lead or presiding director, compared with
95% a decade ago.
» Over that same period, lead directors have become preferred over presiding directors. 78% of the 388 boards with one of these roles have lead directors and 22% have presiding directors, including those identified as “chair” of executive sessions; this compares with 41% and 59%, respectively, in 2008.
Lead Versus Presiding Directors
» 81% of boards with a lead/presiding director disclosed how long their lead/presiding director has been serving in the role, compared with 80% last year. On average, lead/presiding directors have served in the role for 4.2 years. Among boards disclosing tenure, 39% of lead/presiding directors have served in the role for two years or less.
» 47% of lead/presiding directors are retired CEOs, chairs, vice chairs, presidents or COOs. 13% are investors or investment managers, and another 12% are active or retired other corporate executives. Consistent with other areas of board service, fewer active CEOs/chairs/vice chairs/president/COOs are serving as lead or presiding director, 8% versus 19% a decade ago.
Lead and Presiding Director Backgrounds*
*N = 380 lead or presiding directors identified by name
Lead directors
78%
61%
41%
Presiding directors
22%39%
59%
2018
2013
2008
Other corporate executive
Investor/investment manager
Retired CEO/chair/vice chair/president/COO
Academic/nonprofit
Banker/investment banker
Active CEO/chair/vice chair/president/COO
Lawyer
Consultant/other
Financial executive/CFOs/treasurer/public accounting executive
12%
13%
47%
4%
6%
8%
2%
4%
4%
spencer stuart24
Board Organization and Process
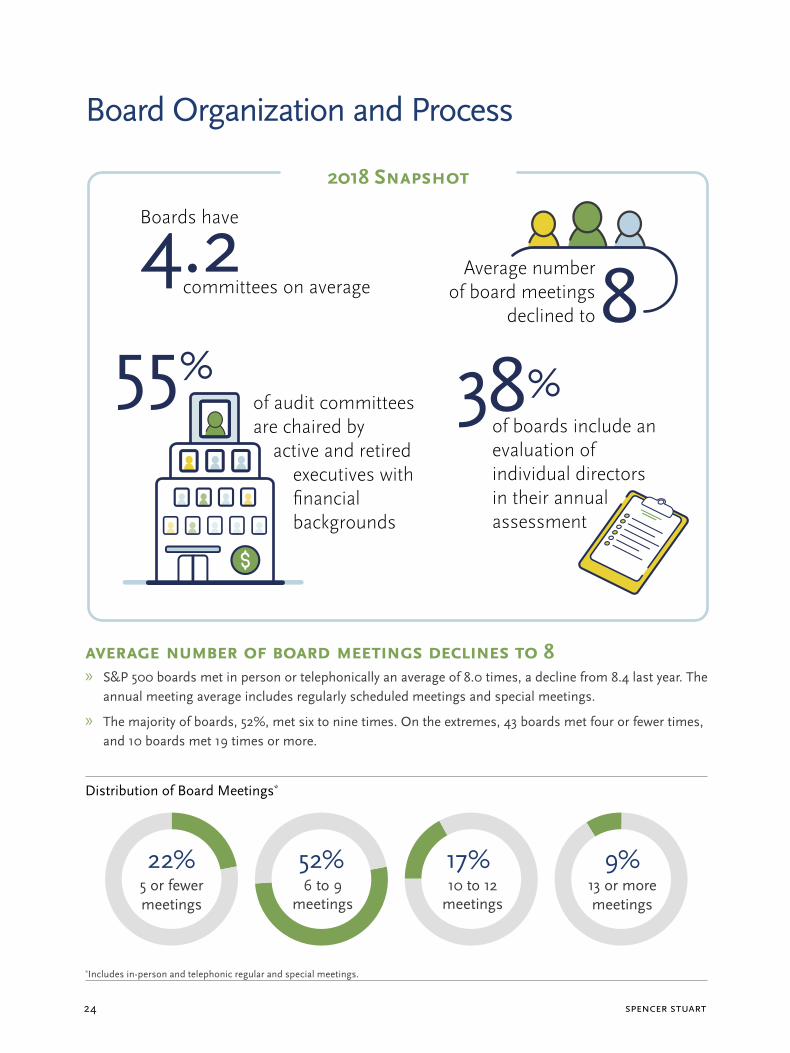
of boards include an evaluation of individual directors in their annual assessment
38%
Boards have
committees on average4.2 Average number
of board meetings declined to 8
of audit committees are chaired by active and retired executives with financial backgrounds
55%
2018 Snapshot
AverAge number of boArd meetingS declineS to 8 » S&P 500 boards met in person or telephonically an average of 8.0 times, a decline from 8.4 last year. The
annual meeting average includes regularly scheduled meetings and special meetings.
» The majority of boards, 52%, met six to nine times. On the extremes, 43 boards met four or fewer times, and 10 boards met 19 times or more.
Distribution of Board Meetings*
*Includes in-person and telephonic regular and special meetings.
5 or fewer meetings
22% 52% 17% 9%6 to 9
meetings13 or moremeetings
10 to 12meetings
2018 U.S. Spencer StUart board index 25
Board Organization and Process
of boards include an evaluation of individual directors in their annual assessment
38%
Boards have
committees on average4.2 Average number
of board meetings declined to 8
of audit committees are chaired by active and retired executives with financial backgrounds
55%
2018 Snapshot
AverAge number of boArd meetingS declineS to 8 » S&P 500 boards met in person or telephonically an average of 8.0 times, a decline from 8.4 last year. The
annual meeting average includes regularly scheduled meetings and special meetings.
» The majority of boards, 52%, met six to nine times. On the extremes, 43 boards met four or fewer times, and 10 boards met 19 times or more.
Distribution of Board Meetings*
*Includes in-person and telephonic regular and special meetings.
5 or fewer meetings
22% 52% 17% 9%6 to 9
meetings13 or moremeetings
10 to 12meetings
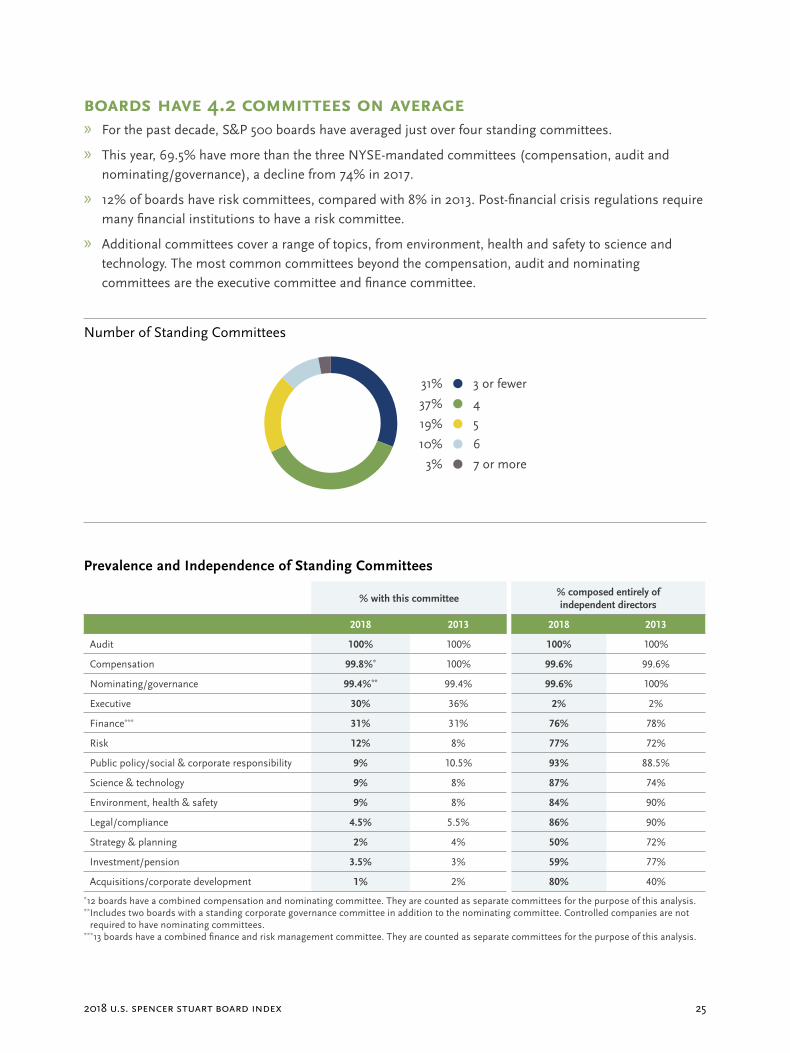
boArdS hAve 4.2 committeeS on AverAge » For the past decade, S&P 500 boards have averaged just over four standing committees.
» This year, 69.5% have more than the three NYSE-mandated committees (compensation, audit and nominating/governance), a decline from 74% in 2017.
» 12% of boards have risk committees, compared with 8% in 2013. Post-financial crisis regulations require many financial institutions to have a risk committee.
» Additional committees cover a range of topics, from environment, health and safety to science and technology. The most common committees beyond the compensation, audit and nominating committees are the executive committee and finance committee.
Number of Standing Committees
Prevalence and Independence of Standing Committees
% with this committee% composed entirely of independent directors
2018 2013 2018 2013
Audit 100% 100% 100% 100%
Compensation 99.8%* 100% 99.6% 99.6%
Nominating/governance 99.4%** 99.4% 99.6% 100%
Executive 30% 36% 2% 2%
Finance*** 31% 31% 76% 78%
Risk 12% 8% 77% 72%
Public policy/social & corporate responsibility 9% 10.5% 93% 88.5%
Science & technology 9% 8% 87% 74%
Environment, health & safety 9% 8% 84% 90%
Legal/compliance 4.5% 5.5% 86% 90%
Strategy & planning 2% 4% 50% 72%
Investment/pension 3.5% 3% 59% 77%
Acquisitions/corporate development 1% 2% 80% 40%
*12 boards have a combined compensation and nominating committee. They are counted as separate committees for the purpose of this analysis.** Includes two boards with a standing corporate governance committee in addition to the nominating committee. Controlled companies are not
required to have nominating committees.***13 boards have a combined finance and risk management committee. They are counted as separate committees for the purpose of this analysis.
5
4
3 or fewer
7 or more
6
19%
37%
31%
3%
10%
spencer stuart26
board organization and process
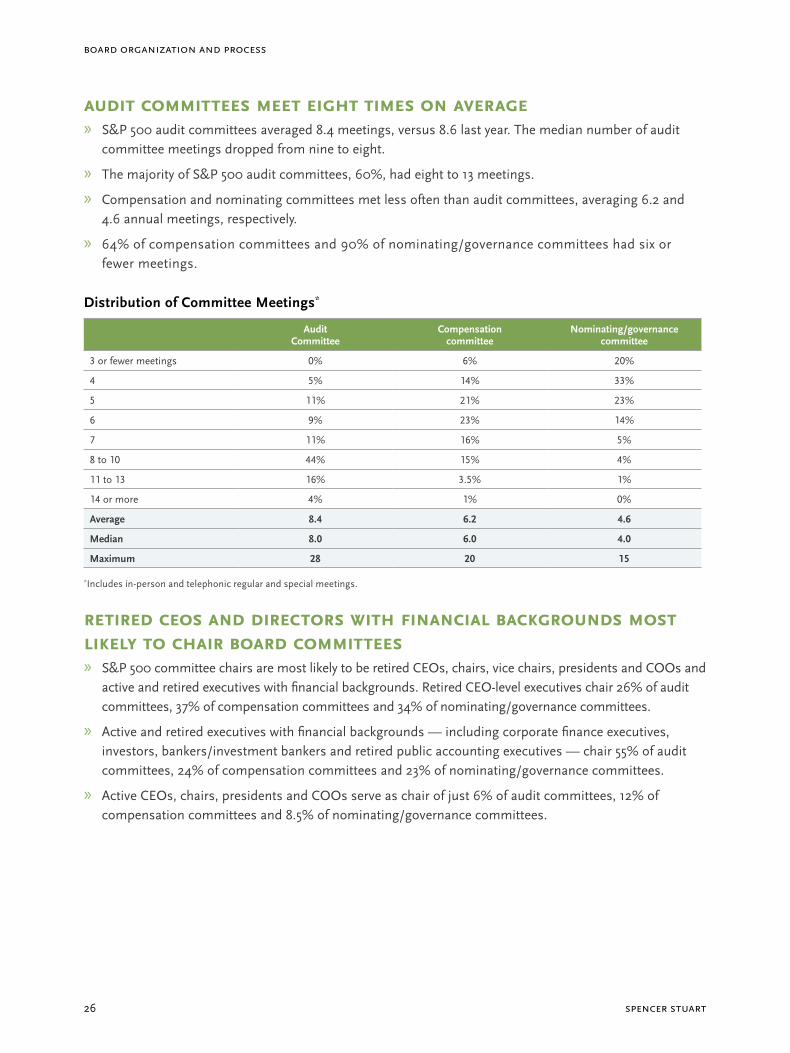
Audit committeeS meet eight timeS on AverAge » S&P 500 audit committees averaged 8.4 meetings, versus 8.6 last year. The median number of audit
committee meetings dropped from nine to eight.
» The majority of S&P 500 audit committees, 60%, had eight to 13 meetings.
» Compensation and nominating committees met less often than audit committees, averaging 6.2 and 4.6 annual meetings, respectively.
» 64% of compensation committees and 90% of nominating/governance committees had six or fewer meetings.
Distribution of Committee Meetings*
Audit Committee
Compensation committee
Nominating/governance committee
3 or fewer meetings 0% 6% 20%
4 5% 14% 33%
5 11% 21% 23%
6 9% 23% 14%
7 11% 16% 5%
8 to 10 44% 15% 4%
11 to 13 16% 3.5% 1%
14 or more 4% 1% 0%
Average 8.4 6.2 4.6
Median 8.0 6.0 4.0
Maximum 28 20 15
*Includes in-person and telephonic regular and special meetings.
retired ceoS And directorS with finAnciAl bAckgroundS moSt likely to chAir boArd committeeS » S&P 500 committee chairs are most likely to be retired CEOs, chairs, vice chairs, presidents and COOs and
active and retired executives with financial backgrounds. Retired CEO-level executives chair 26% of audit committees, 37% of compensation committees and 34% of nominating/governance committees.
» Active and retired executives with financial backgrounds — including corporate finance executives, investors, bankers/investment bankers and retired public accounting executives — chair 55% of audit committees, 24% of compensation committees and 23% of nominating/governance committees.
» Active CEOs, chairs, presidents and COOs serve as chair of just 6% of audit committees, 12% of compensation committees and 8.5% of nominating/governance committees.
2018 U.S. Spencer StUart board index 27
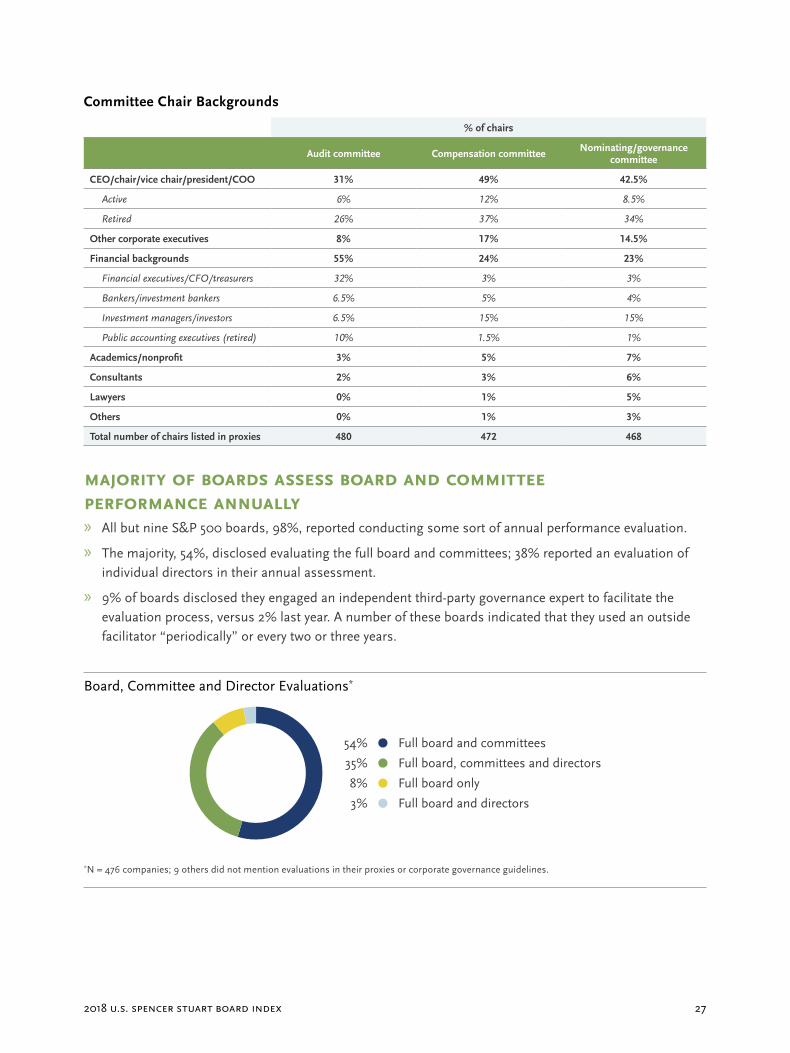
Committee Chair Backgrounds
% of chairs
Audit committee Compensation committee Nominating/governance committee
CEO/chair/vice chair/president/COO 31% 49% 42.5%
Active 6% 12% 8.5%
Retired 26% 37% 34%
Other corporate executives 8% 17% 14.5%
Financial backgrounds 55% 24% 23%
Financial executives/CFO/treasurers 32% 3% 3%
Bankers/investment bankers 6.5% 5% 4%
Investment managers/investors 6.5% 15% 15%
Public accounting executives (retired) 10% 1.5% 1%
Academics/nonprofit 3% 5% 7%
Consultants 2% 3% 6%
Lawyers 0% 1% 5%
Others 0% 1% 3%
Total number of chairs listed in proxies 480 472 468
mAjority of boArdS ASSeSS boArd And committee performAnce AnnuAlly » All but nine S&P 500 boards, 98%, reported conducting some sort of annual performance evaluation.
» The majority, 54%, disclosed evaluating the full board and committees; 38% reported an evaluation of individual directors in their annual assessment.
» 9% of boards disclosed they engaged an independent third-party governance expert to facilitate the evaluation process, versus 2% last year. A number of these boards indicated that they used an outside facilitator “periodically” or every two or three years.
Board, Committee and Director Evaluations*
*N = 476 companies; 9 others did not mention evaluations in their proxies or corporate governance guidelines.
Full board only
Full board, committees and directors
Full board and committees
Full board and directors
8%
35%
54%
3%
spencer stuart28
Director Compensation
10% of S&P 500 boards pay board meeting attendance fees
Only of S&P 500 boards provide stock grants to directors in addition to a cash retainer
77%
The average total compensation for S&P 500 directors increased
3.5%to $298,981
The average annual retainer for S&P 500 directors is $124,306
2018 Snapshot
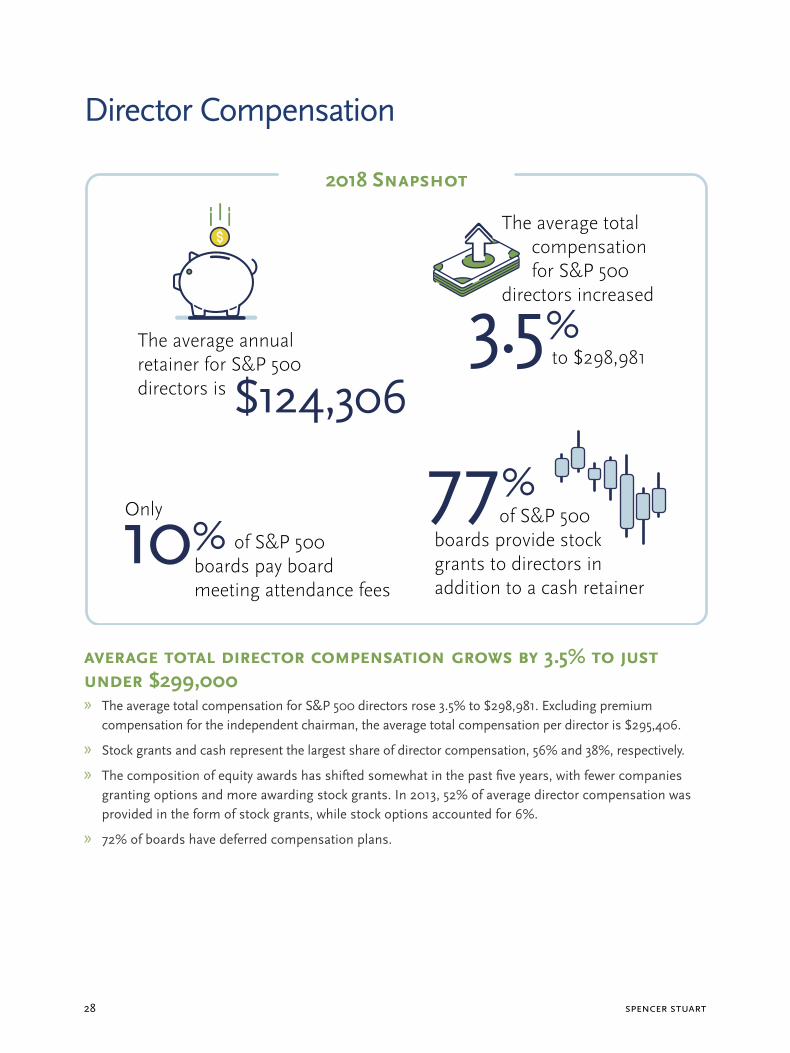
AverAge totAl director compenSAtion growS by 3.5% to juSt under $299,000 » The average total compensation for S&P 500 directors rose 3.5% to $298,981. Excluding premium
compensation for the independent chairman, the average total compensation per director is $295,406.
» Stock grants and cash represent the largest share of director compensation, 56% and 38%, respectively.
» The composition of equity awards has shifted somewhat in the past five years, with fewer companies granting options and more awarding stock grants. In 2013, 52% of average director compensation was provided in the form of stock grants, while stock options accounted for 6%.
» 72% of boards have deferred compensation plans.
2018 U.S. Spencer StUart board index 29
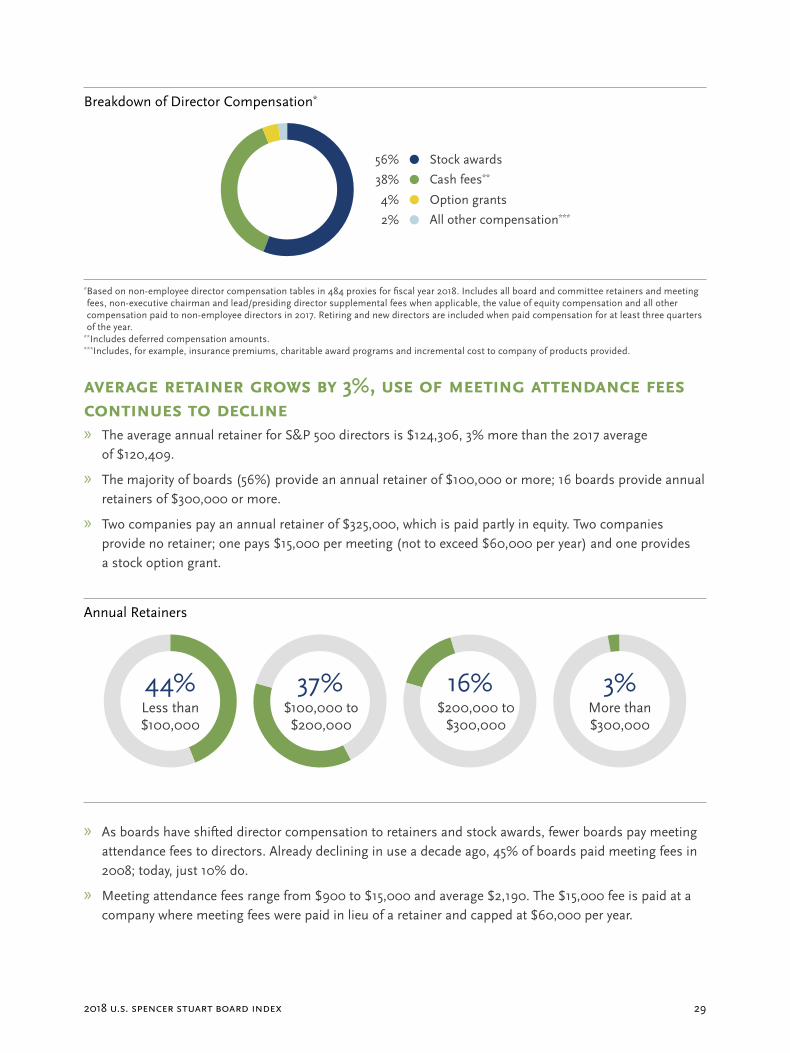
Breakdown of Director Compensation*
* Based on non-employee director compensation tables in 484 proxies for fiscal year 2018. Includes all board and committee retainers and meeting fees, non-executive chairman and lead/presiding director supplemental fees when applicable, the value of equity compensation and all other compensation paid to non-employee directors in 2017. Retiring and new directors are included when paid compensation for at least three quarters of the year.
**Includes deferred compensation amounts.***Includes, for example, insurance premiums, charitable award programs and incremental cost to company of products provided.
AverAge retAiner growS by 3%, uSe of meeting AttendAnce feeS continueS to decline » The average annual retainer for S&P 500 directors is $124,306, 3% more than the 2017 average
of $120,409.
» The majority of boards (56%) provide an annual retainer of $100,000 or more; 16 boards provide annual retainers of $300,000 or more.
» Two companies pay an annual retainer of $325,000, which is paid partly in equity. Two companies provide no retainer; one pays $15,000 per meeting (not to exceed $60,000 per year) and one provides a stock option grant.
Annual Retainers
» As boards have shifted director compensation to retainers and stock awards, fewer boards pay meeting attendance fees to directors. Already declining in use a decade ago, 45% of boards paid meeting fees in 2008; today, just 10% do.
» Meeting attendance fees range from $900 to $15,000 and average $2,190. The $15,000 fee is paid at a company where meeting fees were paid in lieu of a retainer and capped at $60,000 per year.
Stock awards
All other compensation***
Cash fees**38%
Option grants4%
56%
2%
Less than $100,000
44% 37% 16% 3%$100,000 to$200,000
$200,000 t0 $300,000
More than $300,000
spencer stuart30
DIRECTOR COMPENSATION
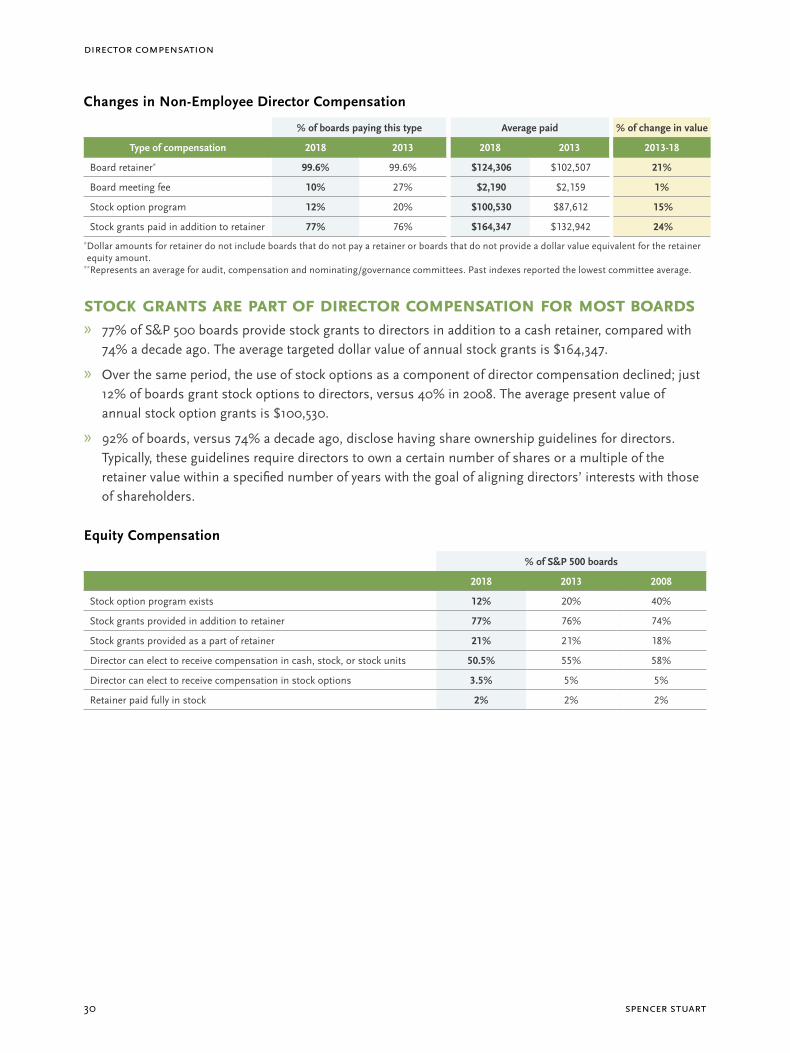
Changes in Non-Employee Director Compensation
% of boards paying this type Average paid % of change in value
Type of compensation 2018 2013 2018 2013 2013-18
Board retainer* 99.6% 99.6% $124,306 $102,507 21%
Board meeting fee 10% 27% $2,190 $2,159 1%
Stock option program 12% 20% $100,530 $87,612 15%
Stock grants paid in addition to retainer 77% 76% $164,347 $132,942 24% * Dollar amounts for retainer do not include boards that do not pay a retainer or boards that do not provide a dollar value equivalent for the retainer equity amount.
**Represents an average for audit, compensation and nominating/governance committees. Past indexes reported the lowest committee average.
Stock grAntS Are pArt of director compenSAtion for moSt boArdS » 77% of S&P 500 boards provide stock grants to directors in addition to a cash retainer, compared with
74% a decade ago. The average targeted dollar value of annual stock grants is $164,347.
» Over the same period, the use of stock options as a component of director compensation declined; just 12% of boards grant stock options to directors, versus 40% in 2008. The average present value of annual stock option grants is $100,530.
» 92% of boards, versus 74% a decade ago, disclose having share ownership guidelines for directors. Typically, these guidelines require directors to own a certain number of shares or a multiple of the retainer value within a specified number of years with the goal of aligning directors’ interests with those of shareholders.
Equity Compensation
% of S&P 500 boards
2018 2013 2008
Stock option program exists 12% 20% 40%
Stock grants provided in addition to retainer 77% 76% 74%
Stock grants provided as a part of retainer 21% 21% 18%
Director can elect to receive compensation in cash, stock, or stock units 50.5% 55% 58%
Director can elect to receive compensation in stock options 3.5% 5% 5%
Retainer paid fully in stock 2% 2% 2%
2018 U.S. Spencer StUart board index 31
premium for boArd leAderShip Service vArieS by role » 93% of the 146 independent S&P 500 board chairs receive an additional fee, ranging from $25,000 to
$500,000 and averaging $164,959. The median premium paid to independent chairs is $150,000.
» 72% of the S&P 500 boards with a lead or presiding director provide additional compensation to directors serving in those roles.
» Lead directors are more likely than presiding directors to receive additional compensation: 84% versus 29%. Lead director compensation also is higher; the average lead director premium is $39,670, 31% higher than the $30,340 average premium for presiding directors.
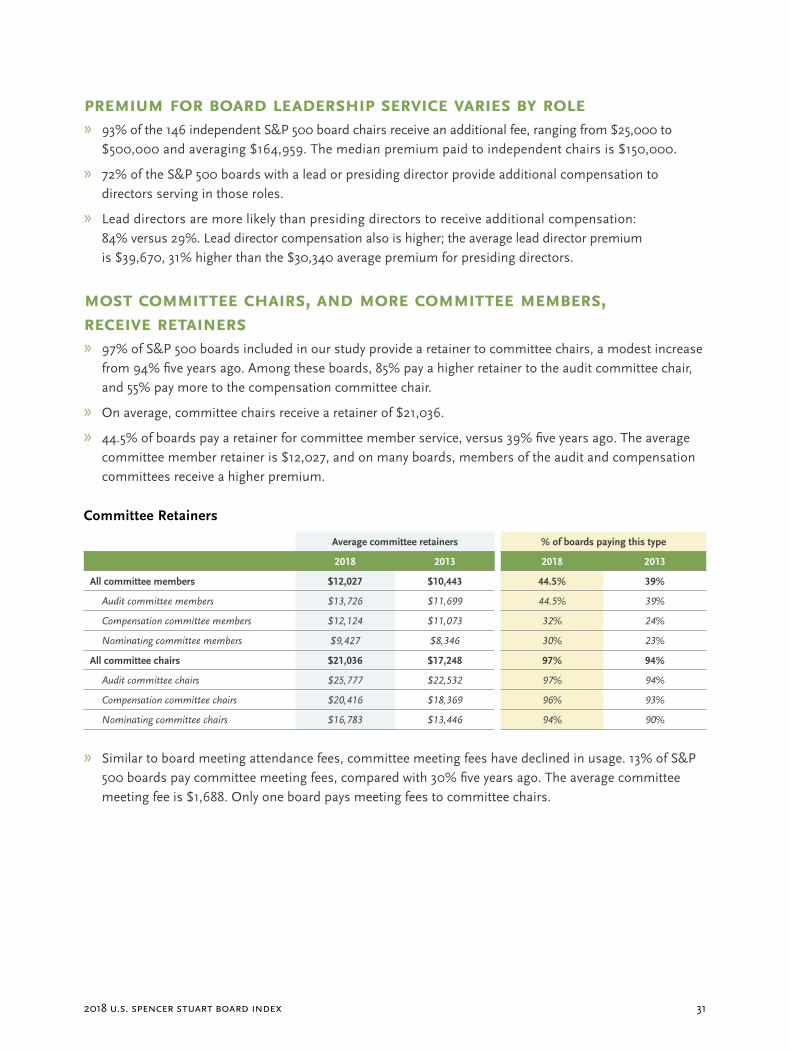
moSt committee chAirS, And more committee memberS, receive retAinerS » 97% of S&P 500 boards included in our study provide a retainer to committee chairs, a modest increase
from 94% five years ago. Among these boards, 85% pay a higher retainer to the audit committee chair, and 55% pay more to the compensation committee chair.
» On average, committee chairs receive a retainer of $21,036.
» 44.5% of boards pay a retainer for committee member service, versus 39% five years ago. The average committee member retainer is $12,027, and on many boards, members of the audit and compensation committees receive a higher premium.
Committee Retainers
Average committee retainers % of boards paying this type
2018 2013 2018 2013
All committee members $12,027 $10,443 44.5% 39%
Audit committee members $13,726 $11,699 44.5% 39%
Compensation committee members $12,124 $11,073 32% 24%
Nominating committee members $9,427 $8,346 30% 23%
All committee chairs $21,036 $17,248 97% 94%
Audit committee chairs $25,777 $22,532 97% 94%
Compensation committee chairs $20,416 $18,369 96% 93%
Nominating committee chairs $16,783 $13,446 94% 90%
» Similar to board meeting attendance fees, committee meeting fees have declined in usage. 13% of S&P 500 boards pay committee meeting fees, compared with 30% five years ago. The average committee meeting fee is $1,688. Only one board pays meeting fees to committee chairs.
spencer stuart32
DIRECTOR COMPENSATION
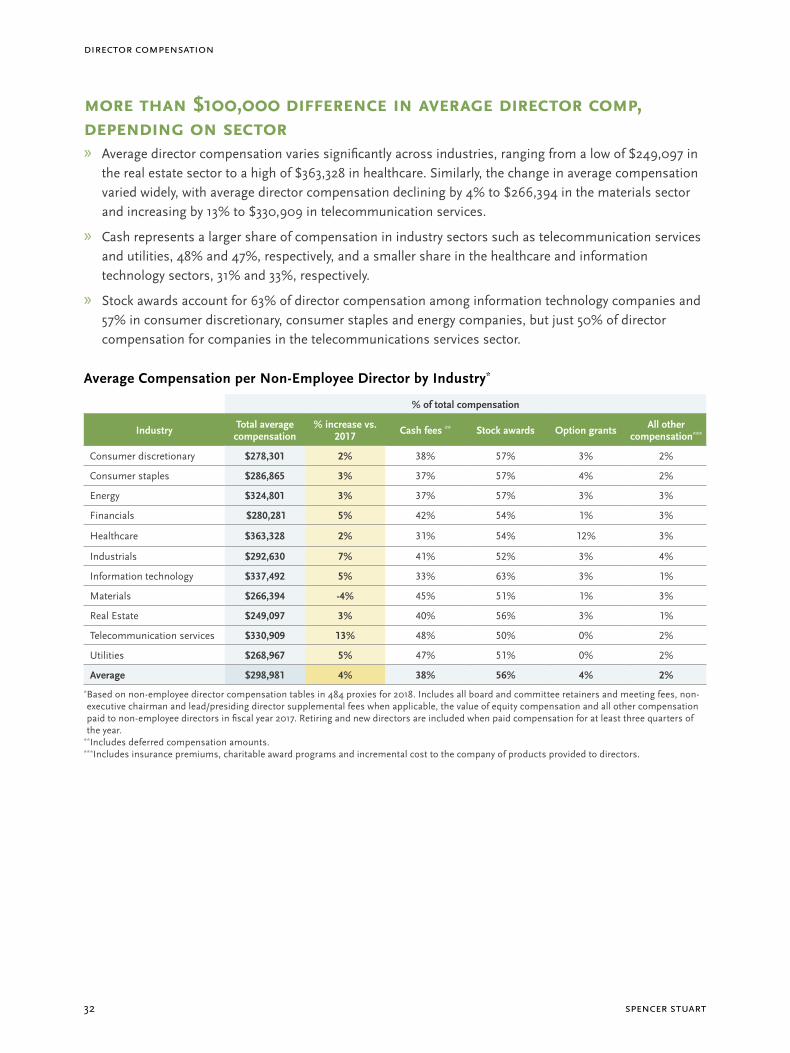
more thAn $100,000 difference in AverAge director comp, depending on Sector » Average director compensation varies significantly across industries, ranging from a low of $249,097 in
the real estate sector to a high of $363,328 in healthcare. Similarly, the change in average compensation varied widely, with average director compensation declining by 4% to $266,394 in the materials sector and increasing by 13% to $330,909 in telecommunication services.
» Cash represents a larger share of compensation in industry sectors such as telecommunication services and utilities, 48% and 47%, respectively, and a smaller share in the healthcare and information technology sectors, 31% and 33%, respectively.
» Stock awards account for 63% of director compensation among information technology companies and 57% in consumer discretionary, consumer staples and energy companies, but just 50% of director compensation for companies in the telecommunications services sector.
Average Compensation per Non-Employee Director by Industry*
% of total compensation
Industry Total average compensation
% increase vs. 2017 Cash fees ** Stock awards Option grants All other
compensation***
Consumer discretionary $278,301 2% 38% 57% 3% 2%
Consumer staples $286,865 3% 37% 57% 4% 2%
Energy $324,801 3% 37% 57% 3% 3%
Financials $280,281 5% 42% 54% 1% 3%
Healthcare $363,328 2% 31% 54% 12% 3%
Industrials $292,630 7% 41% 52% 3% 4%
Information technology $337,492 5% 33% 63% 3% 1%
Materials $266,394 -4% 45% 51% 1% 3%
Real Estate $249,097 3% 40% 56% 3% 1%
Telecommunication services $330,909 13% 48% 50% 0% 2%
Utilities $268,967 5% 47% 51% 0% 2%
Average $298,981 4% 38% 56% 4% 2%* Based on non-employee director compensation tables in 484 proxies for 2018. Includes all board and committee retainers and meeting fees, non-executive chairman and lead/presiding director supplemental fees when applicable, the value of equity compensation and all other compensation paid to non-employee directors in fiscal year 2017. Retiring and new directors are included when paid compensation for at least three quarters of the year.
**Includes deferred compensation amounts.***Includes insurance premiums, charitable award programs and incremental cost to the company of products provided to directors.
2018 U.S. Spencer StUart board index 33
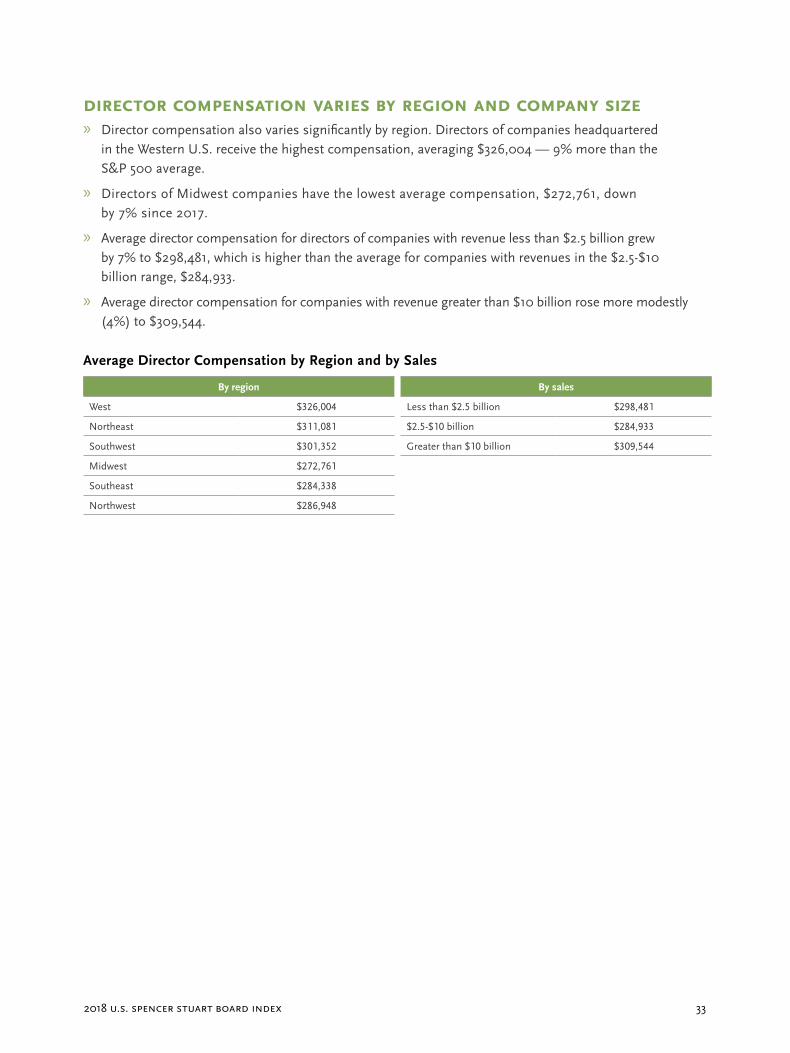
director compenSAtion vArieS by region And compAny Size » Director compensation also varies significantly by region. Directors of companies headquartered
in the Western U.S. receive the highest compensation, averaging $326,004 — 9% more than the S&P 500 average.
» Directors of Midwest companies have the lowest average compensation, $272,761, down by 7% since 2017.
» Average director compensation for directors of companies with revenue less than $2.5 billion grew by 7% to $298,481, which is higher than the average for companies with revenues in the $2.5-$10 billion range, $284,933.
» Average director compensation for companies with revenue greater than $10 billion rose more modestly (4%) to $309,544.
Average Director Compensation by Region and by Sales
By region By sales
West $326,004 Less than $2.5 billion $298,481
Northeast $311,081 $2.5-$10 billion $284,933
Southwest $301,352 Greater than $10 billion $309,544
Midwest $272,761
Southeast $284,338
Northwest $286,948

spencer stuart34
Spencer Stuart nominating/governance committee member Survey reSultS
Board composition and performance What’s top of mind for U.S. directors
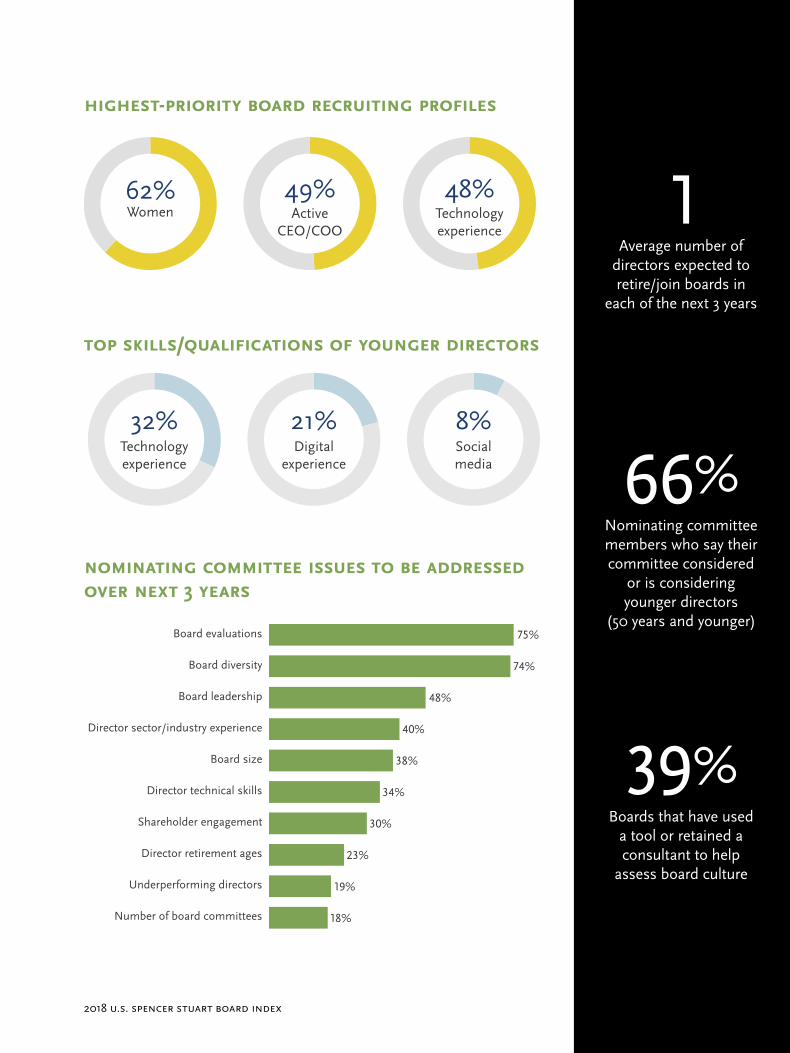
We surveyed 177 nominating/governance committee members between May and June of 2018 to gain a first-person perspective on board trends and priorities. Here are the results.
34
2018 U.S. Spencer StUart board index 35
higheSt-priority boArd recruiting profileS
top SkillS/quAlificAtionS of younger directorS
Women62%
ActiveCEO/COO
49%Technologyexperience
48%
Technologyexperience
32%Digital
experience
21%Socialmedia
8%
1Average number of
directors expected to retire/join boards in
each of the next 3 years
66%Nominating committee members who say their committee considered
or is considering younger directors
(50 years and younger)
39%Boards that have used
a tool or retained a consultant to help
assess board culture
nominAting committee iSSueS to be AddreSSed over next 3 yeArS
Board evaluations
Board diversity
Board leadership
Director sector/industry experience
Board size
Director technical skills
Shareholder engagement
Director retirement ages
Underperforming directors
Number of board committees
75%
48%
74%
40%
38%
34%
30%
23%
19%
18%

spencer stuart36
number of directors
independentdirectors board fees ($)
percentage of total compensation
companY sales
($ in millions)
total
independent
directors
separate
cHair/ceo
aVerage age
aVerage tenure
(Years)
retirement age
meetings per Yearª
board retainer
board retainer
footnotes
aVerage
compensation per
non-emploYee
director
casH
stocK
options
all otHer
Comparative Board Datanumber of directors
independentdirectors board fees ($)
percentage of total compensation
companY sales
($ in millions)
total
independent
directors
separate
cHair/ceo
aVerage age
aVerage tenure
(Years)
retirement age
meetings per Yearª
board retainer
board retainer
footnotes
aVerage
compensation per
non-emploYee
director
casH
stocK
options
all otHer
2018 U.S. Spencer StUart board index 37
number of directors
independentdirectors board fees ($)
percentage of total compensation
companY sales
($ in millions)
total
independent
directors
separate
cHair/ceo
aVerage age
aVerage tenure
(Years)
retirement age
meetings per Yearª
board retainer
board retainer
footnotes
aVerage
compensation per
non-emploYee
director
casH
stocK
options
all otHer
Comparative Board Data
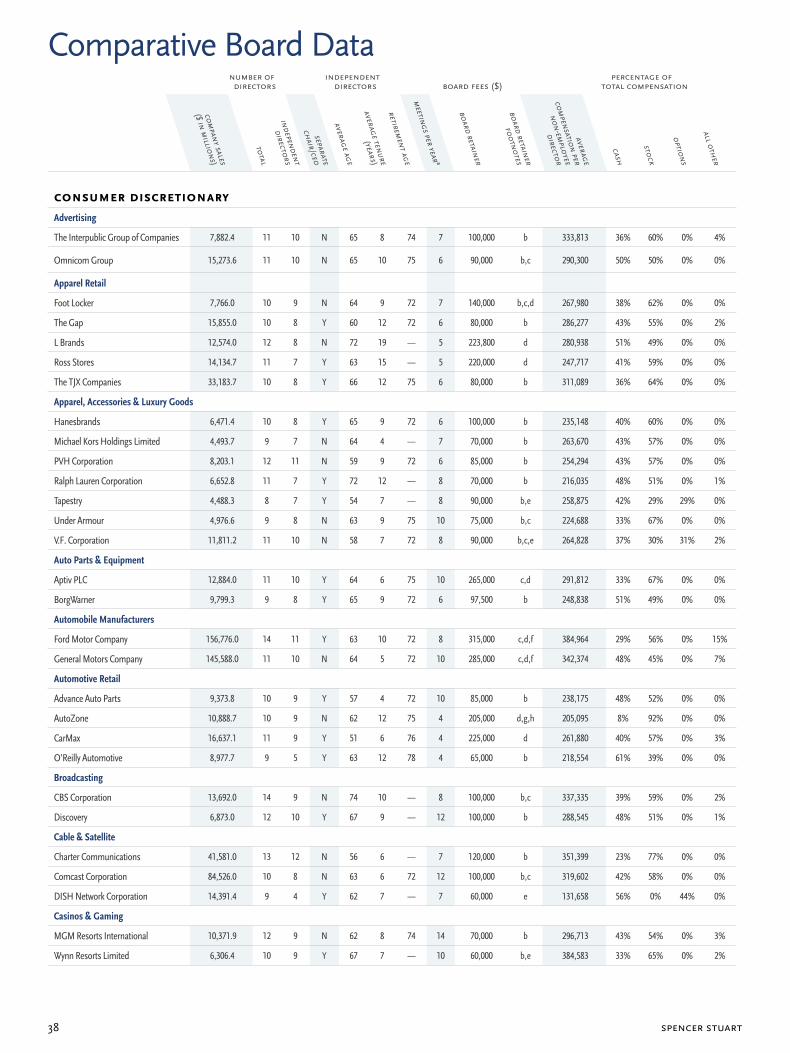
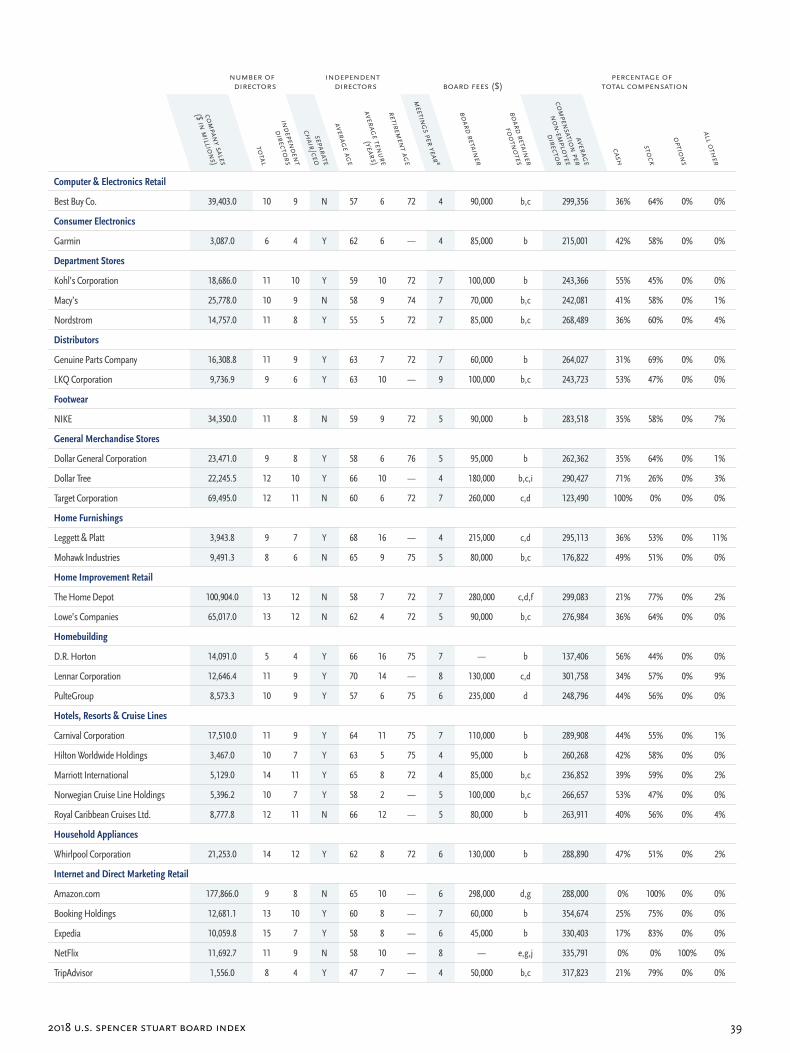
MethodologyBased on the S&P 500 as of May 17, 2018. Fiscal year 2017 company sales data were obtained from Capital IQ; industry/sector categories are
from Capital IQ. All remaining data were pulled from each company’s most recently filed DEF14A proxy statements dated between May 23, 2017
and May 17, 2018. Tenure includes time at company and the company’s predecessors. Corporate boards classified as public company boards and
all data on the number of corporate boards obtained from BoardEx as of May 17, 2018. Total average compensation per non-employee director
is based on director compensation tables included in 485 proxies. The amount includes all board and committee retainers and meeting fees,
supplemental non-executive chairman and lead/presiding director fees, the value of equity compensation, and all other compensation paid
in fiscal year 2017. Total current other corporate board affiliations for new directors were found by counting any public boards a director was
on when they were appointed to their new S&P 500 board, including executive directorships. Found through proxy data and BoardEx data
as of company’s most recent proxy. First-time directors have no independent or non-independent public board service.
spencer stuart38
number of directors
independentdirectors board fees ($)
percentage of total compensation
companY sales
($ in millions)
total
independent
directors
separate
cHair/ceo
aVerage age
aVerage tenure
(Years)
retirement age
meetings per Yearª
board retainer
board retainer
footnotes
aVerage
compensation per
non-emploYee
director
casH
stocK
options
all otHer
Comparative Board Datanumber of directors
independentdirectors board fees ($)
percentage of total compensation
companY sales
($ in millions)
total
independent
directors
separate
cHair/ceo
aVerage age
aVerage tenure
(Years)
retirement age
meetings per Yearª
board retainer
board retainer
footnotes
aVerage
compensation per
non-emploYee
director
casH
stocK
options
all otHer
conSumer diScretionAryAdvertising
The Interpublic Group of Companies 7,882.4 11 10 N 65 8 74 7 100,000 b 333,813 36% 60% 0% 4%
Omnicom Group 15,273.6 11 10 N 65 10 75 6 90,000 b,c 290,300 50% 50% 0% 0%
Apparel Retail
Foot Locker 7,766.0 10 9 N 64 9 72 7 140,000 b,c,d 267,980 38% 62% 0% 0%
The Gap 15,855.0 10 8 Y 60 12 72 6 80,000 b 286,277 43% 55% 0% 2%
L Brands 12,574.0 12 8 N 72 19 — 5 223,800 d 280,938 51% 49% 0% 0%
Ross Stores 14,134.7 11 7 Y 63 15 — 5 220,000 d 247,717 41% 59% 0% 0%
The TJX Companies 33,183.7 10 8 Y 66 12 75 6 80,000 b 311,089 36% 64% 0% 0%
Apparel, Accessories & Luxury Goods
Hanesbrands 6,471.4 10 8 Y 65 9 72 6 100,000 b 235,148 40% 60% 0% 0%
Michael Kors Holdings Limited 4,493.7 9 7 N 64 4 — 7 70,000 b 263,670 43% 57% 0% 0%
PVH Corporation 8,203.1 12 11 N 59 9 72 6 85,000 b 254,294 43% 57% 0% 0%
Ralph Lauren Corporation 6,652.8 11 7 Y 72 12 — 8 70,000 b 216,035 48% 51% 0% 1%
Tapestry 4,488.3 8 7 Y 54 7 — 8 90,000 b,e 258,875 42% 29% 29% 0%
Under Armour 4,976.6 9 8 N 63 9 75 10 75,000 b,c 224,688 33% 67% 0% 0%
V.F. Corporation 11,811.2 11 10 N 58 7 72 8 90,000 b,c,e 264,828 37% 30% 31% 2%
Auto Parts & Equipment
Aptiv PLC 12,884.0 11 10 Y 64 6 75 10 265,000 c,d 291,812 33% 67% 0% 0%
BorgWarner 9,799.3 9 8 Y 65 9 72 6 97,500 b 248,838 51% 49% 0% 0%
Automobile Manufacturers
Ford Motor Company 156,776.0 14 11 Y 63 10 72 8 315,000 c,d,f 384,964 29% 56% 0% 15%
General Motors Company 145,588.0 11 10 N 64 5 72 10 285,000 c,d,f 342,374 48% 45% 0% 7%
Automotive Retail
Advance Auto Parts 9,373.8 10 9 Y 57 4 72 10 85,000 b 238,175 48% 52% 0% 0%
AutoZone 10,888.7 10 9 N 62 12 75 4 205,000 d,g,h 205,095 8% 92% 0% 0%
CarMax 16,637.1 11 9 Y 51 6 76 4 225,000 d 261,880 40% 57% 0% 3%
O’Reilly Automotive 8,977.7 9 5 Y 63 12 78 4 65,000 b 218,554 61% 39% 0% 0%
Broadcasting
CBS Corporation 13,692.0 14 9 N 74 10 — 8 100,000 b,c 337,335 39% 59% 0% 2%
Discovery 6,873.0 12 10 Y 67 9 — 12 100,000 b 288,545 48% 51% 0% 1%
Cable & Satellite
Charter Communications 41,581.0 13 12 N 56 6 — 7 120,000 b 351,399 23% 77% 0% 0%
Comcast Corporation 84,526.0 10 8 N 63 6 72 12 100,000 b,c 319,602 42% 58% 0% 0%
DISH Network Corporation 14,391.4 9 4 Y 62 7 — 7 60,000 e 131,658 56% 0% 44% 0%
Casinos & Gaming
MGM Resorts International 10,371.9 12 9 N 62 8 74 14 70,000 b 296,713 43% 54% 0% 3%
Wynn Resorts Limited 6,306.4 10 9 Y 67 7 — 10 60,000 b,e 384,583 33% 65% 0% 2%
2018 U.S. Spencer StUart board index 39
number of directors
independentdirectors board fees ($)
percentage of total compensation
companY sales
($ in millions)
total
independent
directors
separate
cHair/ceo
aVerage age
aVerage tenure
(Years)
retirement age
meetings per Yearª
board retainer
board retainer
footnotes
aVerage
compensation per
non-emploYee
director
casH
stocK
options
all otHer
Computer & Electronics Retail
Best Buy Co. 39,403.0 10 9 N 57 6 72 4 90,000 b,c 299,356 36% 64% 0% 0%
Consumer Electronics
Garmin 3,087.0 6 4 Y 62 6 — 4 85,000 b 215,001 42% 58% 0% 0%
Department Stores
Kohl’s Corporation 18,686.0 11 10 Y 59 10 72 7 100,000 b 243,366 55% 45% 0% 0%
Macy’s 25,778.0 10 9 N 58 9 74 7 70,000 b,c 242,081 41% 58% 0% 1%
Nordstrom 14,757.0 11 8 Y 55 5 72 7 85,000 b,c 268,489 36% 60% 0% 4%
Distributors
Genuine Parts Company 16,308.8 11 9 Y 63 7 72 7 60,000 b 264,027 31% 69% 0% 0%
LKQ Corporation 9,736.9 9 6 Y 63 10 — 9 100,000 b,c 243,723 53% 47% 0% 0%
Footwear
NIKE 34,350.0 11 8 N 59 9 72 5 90,000 b 283,518 35% 58% 0% 7%
General Merchandise Stores
Dollar General Corporation 23,471.0 9 8 Y 58 6 76 5 95,000 b 262,362 35% 64% 0% 1%
Dollar Tree 22,245.5 12 10 Y 66 10 — 4 180,000 b,c,i 290,427 71% 26% 0% 3%
Target Corporation 69,495.0 12 11 N 60 6 72 7 260,000 c,d 123,490 100% 0% 0% 0%
Home Furnishings
Leggett & Platt 3,943.8 9 7 Y 68 16 — 4 215,000 c,d 295,113 36% 53% 0% 11%
Mohawk Industries 9,491.3 8 6 N 65 9 75 5 80,000 b,c 176,822 49% 51% 0% 0%
Home Improvement Retail
The Home Depot 100,904.0 13 12 N 58 7 72 7 280,000 c,d,f 299,083 21% 77% 0% 2%
Lowe’s Companies 65,017.0 13 12 N 62 4 72 5 90,000 b,c 276,984 36% 64% 0% 0%
Homebuilding
D.R. Horton 14,091.0 5 4 Y 66 16 75 7 — b 137,406 56% 44% 0% 0%
Lennar Corporation 12,646.4 11 9 Y 70 14 — 8 130,000 c,d 301,758 34% 57% 0% 9%
PulteGroup 8,573.3 10 9 Y 57 6 75 6 235,000 d 248,796 44% 56% 0% 0%
Hotels, Resorts & Cruise Lines
Carnival Corporation 17,510.0 11 9 Y 64 11 75 7 110,000 b 289,908 44% 55% 0% 1%
Hilton Worldwide Holdings 3,467.0 10 7 Y 63 5 75 4 95,000 b 260,268 42% 58% 0% 0%
Marriott International 5,129.0 14 11 Y 65 8 72 4 85,000 b,c 236,852 39% 59% 0% 2%
Norwegian Cruise Line Holdings 5,396.2 10 7 Y 58 2 — 5 100,000 b,c 266,657 53% 47% 0% 0%
Royal Caribbean Cruises Ltd. 8,777.8 12 11 N 66 12 — 5 80,000 b 263,911 40% 56% 0% 4%
Household Appliances
Whirlpool Corporation 21,253.0 14 12 Y 62 8 72 6 130,000 b 288,890 47% 51% 0% 2%
Internet and Direct Marketing Retail
Amazon.com 177,866.0 9 8 N 65 10 — 6 298,000 d,g 288,000 0% 100% 0% 0%
Booking Holdings 12,681.1 13 10 Y 60 8 — 7 60,000 b 354,674 25% 75% 0% 0%
Expedia 10,059.8 15 7 Y 58 8 — 6 45,000 b 330,403 17% 83% 0% 0%
NetFlix 11,692.7 11 9 N 58 10 — 8 — e,g,j 335,791 0% 0% 100% 0%
TripAdvisor 1,556.0 8 4 Y 47 7 — 4 50,000 b,c 317,823 21% 79% 0% 0%
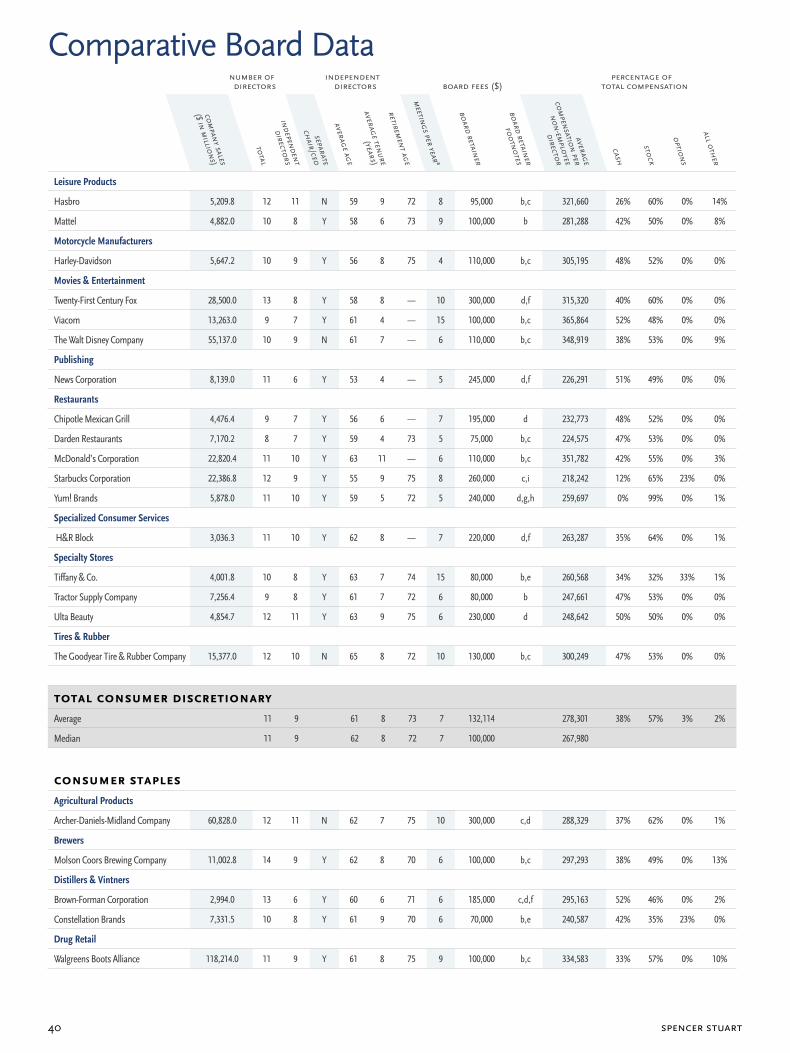
spencer stuart40
number of directors
independentdirectors board fees ($)
percentage of total compensation
companY sales
($ in millions)
total
independent
directors
separate
cHair/ceo
aVerage age
aVerage tenure
(Years)
retirement age
meetings per Yearª
board retainer
board retainer
footnotes
aVerage
compensation per
non-emploYee
director
casH
stocK
options
all otHer
Comparative Board Datanumber of directors
independentdirectors board fees ($)
percentage of total compensation
companY sales
($ in millions)
total
independent
directors
separate
cHair/ceo
aVerage age
aVerage tenure
(Years)
retirement age
meetings per Yearª
board retainer
board retainer
footnotes
aVerage
compensation per
non-emploYee
director
casH
stocK
options
all otHer
Leisure Products
Hasbro 5,209.8 12 11 N 59 9 72 8 95,000 b,c 321,660 26% 60% 0% 14%
Mattel 4,882.0 10 8 Y 58 6 73 9 100,000 b 281,288 42% 50% 0% 8%
Motorcycle Manufacturers
Harley-Davidson 5,647.2 10 9 Y 56 8 75 4 110,000 b,c 305,195 48% 52% 0% 0%
Movies & Entertainment
Twenty-First Century Fox 28,500.0 13 8 Y 58 8 — 10 300,000 d,f 315,320 40% 60% 0% 0%
Viacom 13,263.0 9 7 Y 61 4 — 15 100,000 b,c 365,864 52% 48% 0% 0%
The Walt Disney Company 55,137.0 10 9 N 61 7 — 6 110,000 b,c 348,919 38% 53% 0% 9%
Publishing
News Corporation 8,139.0 11 6 Y 53 4 — 5 245,000 d,f 226,291 51% 49% 0% 0%
Restaurants
Chipotle Mexican Grill 4,476.4 9 7 Y 56 6 — 7 195,000 d 232,773 48% 52% 0% 0%
Darden Restaurants 7,170.2 8 7 Y 59 4 73 5 75,000 b,c 224,575 47% 53% 0% 0%
McDonald’s Corporation 22,820.4 11 10 Y 63 11 — 6 110,000 b,c 351,782 42% 55% 0% 3%
Starbucks Corporation 22,386.8 12 9 Y 55 9 75 8 260,000 c,i 218,242 12% 65% 23% 0%
Yum! Brands 5,878.0 11 10 Y 59 5 72 5 240,000 d,g,h 259,697 0% 99% 0% 1%
Specialized Consumer Services
H&R Block 3,036.3 11 10 Y 62 8 — 7 220,000 d,f 263,287 35% 64% 0% 1%
Specialty Stores
Tiffany & Co. 4,001.8 10 8 Y 63 7 74 15 80,000 b,e 260,568 34% 32% 33% 1%
Tractor Supply Company 7,256.4 9 8 Y 61 7 72 6 80,000 b 247,661 47% 53% 0% 0%
Ulta Beauty 4,854.7 12 11 Y 63 9 75 6 230,000 d 248,642 50% 50% 0% 0%
Tires & Rubber
The Goodyear Tire & Rubber Company 15,377.0 12 10 N 65 8 72 10 130,000 b,c 300,249 47% 53% 0% 0%
totAl conSumer diScretionAryAverage 11 9 61 8 73 7 132,114 278,301 38% 57% 3% 2%
Median 11 9 62 8 72 7 100,000 267,980
conSumer StApleSAgricultural Products
Archer-Daniels-Midland Company 60,828.0 12 11 N 62 7 75 10 300,000 c,d 288,329 37% 62% 0% 1%
Brewers
Molson Coors Brewing Company 11,002.8 14 9 Y 62 8 70 6 100,000 b,c 297,293 38% 49% 0% 13%
Distillers & Vintners
Brown-Forman Corporation 2,994.0 13 6 Y 60 6 71 6 185,000 c,d,f 295,163 52% 46% 0% 2%
Constellation Brands 7,331.5 10 8 Y 61 9 70 6 70,000 b,e 240,587 42% 35% 23% 0%
Drug Retail
Walgreens Boots Alliance 118,214.0 11 9 Y 61 8 75 9 100,000 b,c 334,583 33% 57% 0% 10%
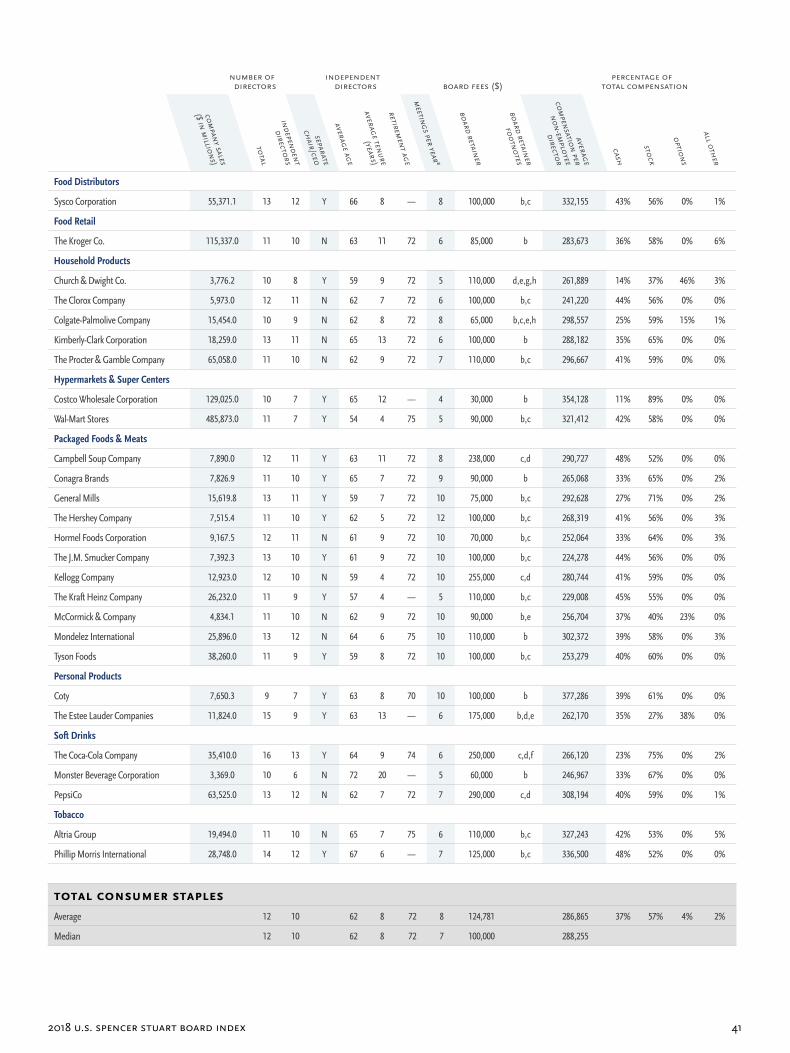
2018 U.S. Spencer StUart board index 41
number of directors
independentdirectors board fees ($)
percentage of total compensation
companY sales
($ in millions)
total
independent
directors
separate
cHair/ceo
aVerage age
aVerage tenure
(Years)
retirement age
meetings per Yearª
board retainer
board retainer
footnotes
aVerage
compensation per
non-emploYee
director
casH
stocK
options
all otHer
Food Distributors
Sysco Corporation 55,371.1 13 12 Y 66 8 — 8 100,000 b,c 332,155 43% 56% 0% 1%
Food Retail
The Kroger Co. 115,337.0 11 10 N 63 11 72 6 85,000 b 283,673 36% 58% 0% 6%
Household Products
Church & Dwight Co. 3,776.2 10 8 Y 59 9 72 5 110,000 d,e,g,h 261,889 14% 37% 46% 3%
The Clorox Company 5,973.0 12 11 N 62 7 72 6 100,000 b,c 241,220 44% 56% 0% 0%
Colgate-Palmolive Company 15,454.0 10 9 N 62 8 72 8 65,000 b,c,e,h 298,557 25% 59% 15% 1%
Kimberly-Clark Corporation 18,259.0 13 11 N 65 13 72 6 100,000 b 288,182 35% 65% 0% 0%
The Procter & Gamble Company 65,058.0 11 10 N 62 9 72 7 110,000 b,c 296,667 41% 59% 0% 0%
Hypermarkets & Super Centers
Costco Wholesale Corporation 129,025.0 10 7 Y 65 12 — 4 30,000 b 354,128 11% 89% 0% 0%
Wal-Mart Stores 485,873.0 11 7 Y 54 4 75 5 90,000 b,c 321,412 42% 58% 0% 0%
Packaged Foods & Meats
Campbell Soup Company 7,890.0 12 11 Y 63 11 72 8 238,000 c,d 290,727 48% 52% 0% 0%
Conagra Brands 7,826.9 11 10 Y 65 7 72 9 90,000 b 265,068 33% 65% 0% 2%
General Mills 15,619.8 13 11 Y 59 7 72 10 75,000 b,c 292,628 27% 71% 0% 2%
The Hershey Company 7,515.4 11 10 Y 62 5 72 12 100,000 b,c 268,319 41% 56% 0% 3%
Hormel Foods Corporation 9,167.5 12 11 N 61 9 72 10 70,000 b,c 252,064 33% 64% 0% 3%
The J.M. Smucker Company 7,392.3 13 10 Y 61 9 72 10 100,000 b,c 224,278 44% 56% 0% 0%
Kellogg Company 12,923.0 12 10 N 59 4 72 10 255,000 c,d 280,744 41% 59% 0% 0%
The Kraft Heinz Company 26,232.0 11 9 Y 57 4 — 5 110,000 b,c 229,008 45% 55% 0% 0%
McCormick & Company 4,834.1 11 10 N 62 9 72 10 90,000 b,e 256,704 37% 40% 23% 0%
Mondelez International 25,896.0 13 12 N 64 6 75 10 110,000 b 302,372 39% 58% 0% 3%
Tyson Foods 38,260.0 11 9 Y 59 8 72 10 100,000 b,c 253,279 40% 60% 0% 0%
Personal Products
Coty 7,650.3 9 7 Y 63 8 70 10 100,000 b 377,286 39% 61% 0% 0%
The Estee Lauder Companies 11,824.0 15 9 Y 63 13 — 6 175,000 b,d,e 262,170 35% 27% 38% 0%
Soft Drinks
The Coca-Cola Company 35,410.0 16 13 Y 64 9 74 6 250,000 c,d,f 266,120 23% 75% 0% 2%
Monster Beverage Corporation 3,369.0 10 6 N 72 20 — 5 60,000 b 246,967 33% 67% 0% 0%
PepsiCo 63,525.0 13 12 N 62 7 72 7 290,000 c,d 308,194 40% 59% 0% 1%
Tobacco
Altria Group 19,494.0 11 10 N 65 7 75 6 110,000 b,c 327,243 42% 53% 0% 5%
Phillip Morris International 28,748.0 14 12 Y 67 6 — 7 125,000 b,c 336,500 48% 52% 0% 0%
totAl conSumer StApleSAverage 12 10 62 8 72 8 124,781 286,865 37% 57% 4% 2%
Median 12 10 62 8 72 7 100,000 288,255
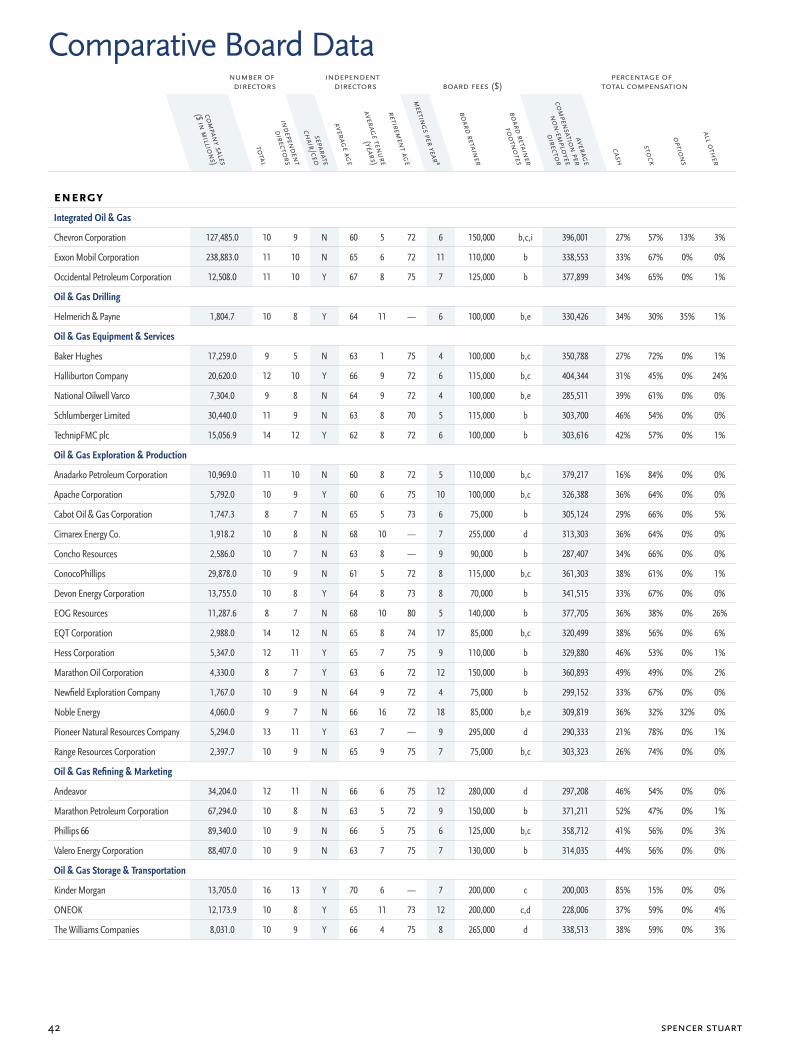
spencer stuart42
number of directors
independentdirectors board fees ($)
percentage of total compensation
companY sales
($ in millions)
total
independent
directors
separate
cHair/ceo
aVerage age
aVerage tenure
(Years)
retirement age
meetings per Yearª
board retainer
board retainer
footnotes
aVerage
compensation per
non-emploYee
director
casH
stocK
options
all otHer
Comparative Board Datanumber of directors
independentdirectors board fees ($)
percentage of total compensation
companY sales
($ in millions)
total
independent
directors
separate
cHair/ceo
aVerage age
aVerage tenure
(Years)
retirement age
meetings per Yearª
board retainer
board retainer
footnotes
aVerage
compensation per
non-emploYee
director
casH
stocK
options
all otHer
energyIntegrated Oil & Gas
Chevron Corporation 127,485.0 10 9 N 60 5 72 6 150,000 b,c,i 396,001 27% 57% 13% 3%
Exxon Mobil Corporation 238,883.0 11 10 N 65 6 72 11 110,000 b 338,553 33% 67% 0% 0%
Occidental Petroleum Corporation 12,508.0 11 10 Y 67 8 75 7 125,000 b 377,899 34% 65% 0% 1%
Oil & Gas Drilling
Helmerich & Payne 1,804.7 10 8 Y 64 11 — 6 100,000 b,e 330,426 34% 30% 35% 1%
Oil & Gas Equipment & Services
Baker Hughes 17,259.0 9 5 N 63 1 75 4 100,000 b,c 350,788 27% 72% 0% 1%
Halliburton Company 20,620.0 12 10 Y 66 9 72 6 115,000 b,c 404,344 31% 45% 0% 24%
National Oilwell Varco 7,304.0 9 8 N 64 9 72 4 100,000 b,e 285,511 39% 61% 0% 0%
Schlumberger Limited 30,440.0 11 9 N 63 8 70 5 115,000 b 303,700 46% 54% 0% 0%
TechnipFMC plc 15,056.9 14 12 Y 62 8 72 6 100,000 b 303,616 42% 57% 0% 1%
Oil & Gas Exploration & Production
Anadarko Petroleum Corporation 10,969.0 11 10 N 60 8 72 5 110,000 b,c 379,217 16% 84% 0% 0%
Apache Corporation 5,792.0 10 9 Y 60 6 75 10 100,000 b,c 326,388 36% 64% 0% 0%
Cabot Oil & Gas Corporation 1,747.3 8 7 N 65 5 73 6 75,000 b 305,124 29% 66% 0% 5%
Cimarex Energy Co. 1,918.2 10 8 N 68 10 — 7 255,000 d 313,303 36% 64% 0% 0%
Concho Resources 2,586.0 10 7 N 63 8 — 9 90,000 b 287,407 34% 66% 0% 0%
ConocoPhillips 29,878.0 10 9 N 61 5 72 8 115,000 b,c 361,303 38% 61% 0% 1%
Devon Energy Corporation 13,755.0 10 8 Y 64 8 73 8 70,000 b 341,515 33% 67% 0% 0%
EOG Resources 11,287.6 8 7 N 68 10 80 5 140,000 b 377,705 36% 38% 0% 26%
EQT Corporation 2,988.0 14 12 N 65 8 74 17 85,000 b,c 320,499 38% 56% 0% 6%
Hess Corporation 5,347.0 12 11 Y 65 7 75 9 110,000 b 329,880 46% 53% 0% 1%
Marathon Oil Corporation 4,330.0 8 7 Y 63 6 72 12 150,000 b 360,893 49% 49% 0% 2%
Newfield Exploration Company 1,767.0 10 9 N 64 9 72 4 75,000 b 299,152 33% 67% 0% 0%
Noble Energy 4,060.0 9 7 N 66 16 72 18 85,000 b,e 309,819 36% 32% 32% 0%
Pioneer Natural Resources Company 5,294.0 13 11 Y 63 7 — 9 295,000 d 290,333 21% 78% 0% 1%
Range Resources Corporation 2,397.7 10 9 N 65 9 75 7 75,000 b,c 303,323 26% 74% 0% 0%
Oil & Gas Refining & Marketing
Andeavor 34,204.0 12 11 N 66 6 75 12 280,000 d 297,208 46% 54% 0% 0%
Marathon Petroleum Corporation 67,294.0 10 8 N 63 5 72 9 150,000 b 371,211 52% 47% 0% 1%
Phillips 66 89,340.0 10 9 N 66 5 75 6 125,000 b,c 358,712 41% 56% 0% 3%
Valero Energy Corporation 88,407.0 10 9 N 63 7 75 7 130,000 b 314,035 44% 56% 0% 0%
Oil & Gas Storage & Transportation
Kinder Morgan 13,705.0 16 13 Y 70 6 — 7 200,000 c 200,003 85% 15% 0% 0%
ONEOK 12,173.9 10 8 Y 65 11 73 12 200,000 c,d 228,006 37% 59% 0% 4%
The Williams Companies 8,031.0 10 9 Y 66 4 75 8 265,000 d 338,513 38% 59% 0% 3%
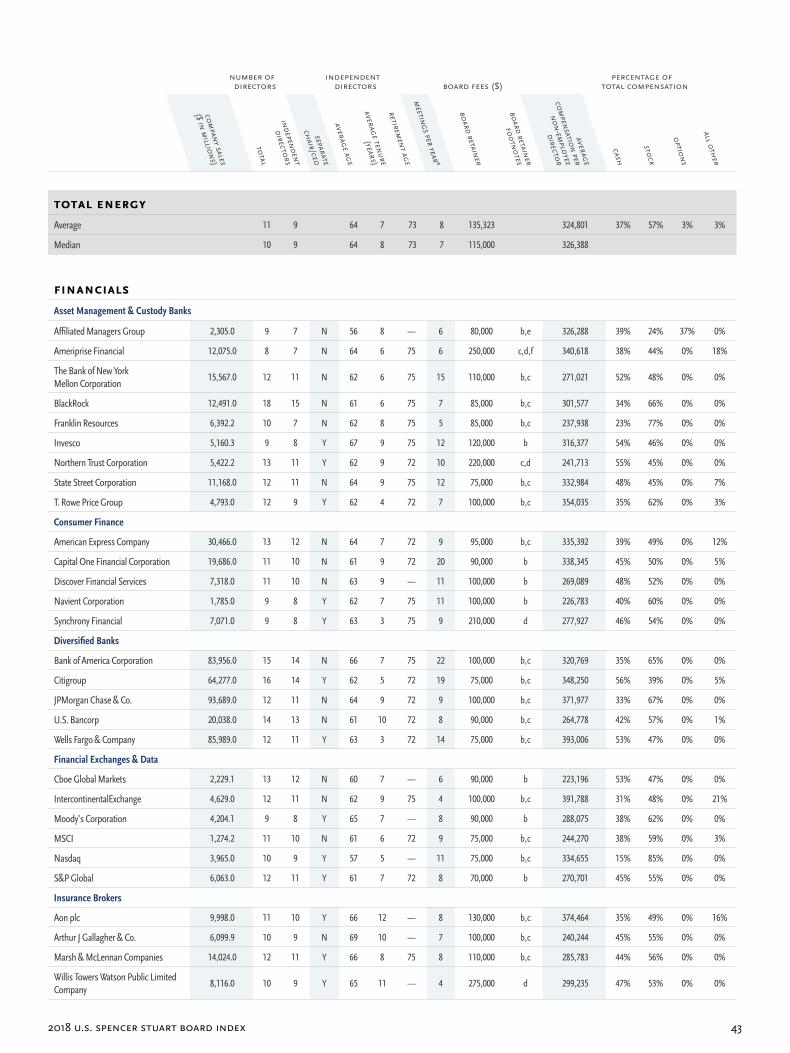
2018 U.S. Spencer StUart board index 43
number of directors
independentdirectors board fees ($)
percentage of total compensation
companY sales
($ in millions)
total
independent
directors
separate
cHair/ceo
aVerage age
aVerage tenure
(Years)
retirement age
meetings per Yearª
board retainer
board retainer
footnotes
aVerage
compensation per
non-emploYee
director
casH
stocK
options
all otHer
totAl energyAverage 11 9 64 7 73 8 135,323 324,801 37% 57% 3% 3%
Median 10 9 64 8 73 7 115,000 326,388
finAnciAlSAsset Management & Custody Banks
Affiliated Managers Group 2,305.0 9 7 N 56 8 — 6 80,000 b,e 326,288 39% 24% 37% 0%
Ameriprise Financial 12,075.0 8 7 N 64 6 75 6 250,000 c,d,f 340,618 38% 44% 0% 18%
The Bank of New York Mellon Corporation
15,567.0 12 11 N 62 6 75 15 110,000 b,c 271,021 52% 48% 0% 0%
BlackRock 12,491.0 18 15 N 61 6 75 7 85,000 b,c 301,577 34% 66% 0% 0%
Franklin Resources 6,392.2 10 7 N 62 8 75 5 85,000 b,c 237,938 23% 77% 0% 0%
Invesco 5,160.3 9 8 Y 67 9 75 12 120,000 b 316,377 54% 46% 0% 0%
Northern Trust Corporation 5,422.2 13 11 Y 62 9 72 10 220,000 c,d 241,713 55% 45% 0% 0%
State Street Corporation 11,168.0 12 11 N 64 9 75 12 75,000 b,c 332,984 48% 45% 0% 7%
T. Rowe Price Group 4,793.0 12 9 Y 62 4 72 7 100,000 b,c 354,035 35% 62% 0% 3%
Consumer Finance
American Express Company 30,466.0 13 12 N 64 7 72 9 95,000 b,c 335,392 39% 49% 0% 12%
Capital One Financial Corporation 19,686.0 11 10 N 61 9 72 20 90,000 b 338,345 45% 50% 0% 5%
Discover Financial Services 7,318.0 11 10 N 63 9 — 11 100,000 b 269,089 48% 52% 0% 0%
Navient Corporation 1,785.0 9 8 Y 62 7 75 11 100,000 b 226,783 40% 60% 0% 0%
Synchrony Financial 7,071.0 9 8 Y 63 3 75 9 210,000 d 277,927 46% 54% 0% 0%
Diversified Banks
Bank of America Corporation 83,956.0 15 14 N 66 7 75 22 100,000 b,c 320,769 35% 65% 0% 0%
Citigroup 64,277.0 16 14 Y 62 5 72 19 75,000 b,c 348,250 56% 39% 0% 5%
JPMorgan Chase & Co. 93,689.0 12 11 N 64 9 72 9 100,000 b,c 371,977 33% 67% 0% 0%
U.S. Bancorp 20,038.0 14 13 N 61 10 72 8 90,000 b,c 264,778 42% 57% 0% 1%
Wells Fargo & Company 85,989.0 12 11 Y 63 3 72 14 75,000 b,c 393,006 53% 47% 0% 0%
Financial Exchanges & Data
Cboe Global Markets 2,229.1 13 12 N 60 7 — 6 90,000 b 223,196 53% 47% 0% 0%
IntercontinentalExchange 4,629.0 12 11 N 62 9 75 4 100,000 b,c 391,788 31% 48% 0% 21%
Moody’s Corporation 4,204.1 9 8 Y 65 7 — 8 90,000 b 288,075 38% 62% 0% 0%
MSCI 1,274.2 11 10 N 61 6 72 9 75,000 b,c 244,270 38% 59% 0% 3%
Nasdaq 3,965.0 10 9 Y 57 5 — 11 75,000 b,c 334,655 15% 85% 0% 0%
S&P Global 6,063.0 12 11 Y 61 7 72 8 70,000 b 270,701 45% 55% 0% 0%
Insurance Brokers
Aon plc 9,998.0 11 10 Y 66 12 — 8 130,000 b,c 374,464 35% 49% 0% 16%
Arthur J Gallagher & Co. 6,099.9 10 9 N 69 10 — 7 100,000 b,c 240,244 45% 55% 0% 0%
Marsh & McLennan Companies 14,024.0 12 11 Y 66 8 75 8 110,000 b,c 285,783 44% 56% 0% 0%
Willis Towers Watson Public Limited Company
8,116.0 10 9 Y 65 11 — 4 275,000 d 299,235 47% 53% 0% 0%
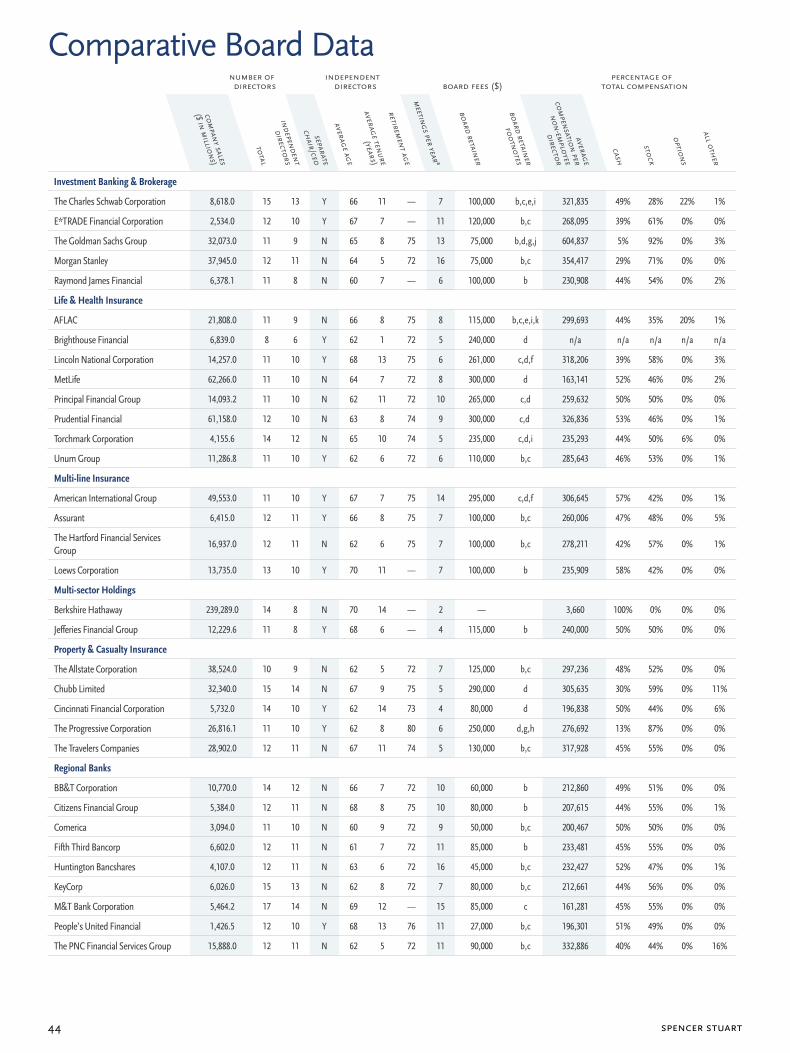
spencer stuart44
number of directors
independentdirectors board fees ($)
percentage of total compensation
companY sales
($ in millions)
total
independent
directors
separate
cHair/ceo
aVerage age
aVerage tenure
(Years)
retirement age
meetings per Yearª
board retainer
board retainer
footnotes
aVerage
compensation per
non-emploYee
director
casH
stocK
options
all otHer
Comparative Board Datanumber of directors
independentdirectors board fees ($)
percentage of total compensation
companY sales
($ in millions)
total
independent
directors
separate
cHair/ceo
aVerage age
aVerage tenure
(Years)
retirement age
meetings per Yearª
board retainer
board retainer
footnotes
aVerage
compensation per
non-emploYee
director
casH
stocK
options
all otHer
Investment Banking & Brokerage
The Charles Schwab Corporation 8,618.0 15 13 Y 66 11 — 7 100,000 b,c,e,i 321,835 49% 28% 22% 1%
E*TRADE Financial Corporation 2,534.0 12 10 Y 67 7 — 11 120,000 b,c 268,095 39% 61% 0% 0%
The Goldman Sachs Group 32,073.0 11 9 N 65 8 75 13 75,000 b,d,g,j 604,837 5% 92% 0% 3%
Morgan Stanley 37,945.0 12 11 N 64 5 72 16 75,000 b,c 354,417 29% 71% 0% 0%
Raymond James Financial 6,378.1 11 8 N 60 7 — 6 100,000 b 230,908 44% 54% 0% 2%
Life & Health Insurance
AFLAC 21,808.0 11 9 N 66 8 75 8 115,000 b,c,e,i,k 299,693 44% 35% 20% 1%
Brighthouse Financial 6,839.0 8 6 Y 62 1 72 5 240,000 d n/a n/a n/a n/a n/a
Lincoln National Corporation 14,257.0 11 10 Y 68 13 75 6 261,000 c,d,f 318,206 39% 58% 0% 3%
MetLife 62,266.0 11 10 N 64 7 72 8 300,000 d 163,141 52% 46% 0% 2%
Principal Financial Group 14,093.2 11 10 N 62 11 72 10 265,000 c,d 259,632 50% 50% 0% 0%
Prudential Financial 61,158.0 12 10 N 63 8 74 9 300,000 c,d 326,836 53% 46% 0% 1%
Torchmark Corporation 4,155.6 14 12 N 65 10 74 5 235,000 c,d,i 235,293 44% 50% 6% 0%
Unum Group 11,286.8 11 10 Y 62 6 72 6 110,000 b,c 285,643 46% 53% 0% 1%
Multi-line Insurance
American International Group 49,553.0 11 10 Y 67 7 75 14 295,000 c,d,f 306,645 57% 42% 0% 1%
Assurant 6,415.0 12 11 Y 66 8 75 7 100,000 b,c 260,006 47% 48% 0% 5%
The Hartford Financial Services Group
16,937.0 12 11 N 62 6 75 7 100,000 b,c 278,211 42% 57% 0% 1%
Loews Corporation 13,735.0 13 10 Y 70 11 — 7 100,000 b 235,909 58% 42% 0% 0%
Multi-sector Holdings
Berkshire Hathaway 239,289.0 14 8 N 70 14 — 2 — 3,660 100% 0% 0% 0%
Jefferies Financial Group 12,229.6 11 8 Y 68 6 — 4 115,000 b 240,000 50% 50% 0% 0%
Property & Casualty Insurance
The Allstate Corporation 38,524.0 10 9 N 62 5 72 7 125,000 b,c 297,236 48% 52% 0% 0%
Chubb Limited 32,340.0 15 14 N 67 9 75 5 290,000 d 305,635 30% 59% 0% 11%
Cincinnati Financial Corporation 5,732.0 14 10 Y 62 14 73 4 80,000 d 196,838 50% 44% 0% 6%
The Progressive Corporation 26,816.1 11 10 Y 62 8 80 6 250,000 d,g,h 276,692 13% 87% 0% 0%
The Travelers Companies 28,902.0 12 11 N 67 11 74 5 130,000 b,c 317,928 45% 55% 0% 0%
Regional Banks
BB&T Corporation 10,770.0 14 12 N 66 7 72 10 60,000 b 212,860 49% 51% 0% 0%
Citizens Financial Group 5,384.0 12 11 N 68 8 75 10 80,000 b 207,615 44% 55% 0% 1%
Comerica 3,094.0 11 10 N 60 9 72 9 50,000 b,c 200,467 50% 50% 0% 0%
Fifth Third Bancorp 6,602.0 12 11 N 61 7 72 11 85,000 b 233,481 45% 55% 0% 0%
Huntington Bancshares 4,107.0 12 11 N 63 6 72 16 45,000 b,c 232,427 52% 47% 0% 1%
KeyCorp 6,026.0 15 13 N 62 8 72 7 80,000 b,c 212,661 44% 56% 0% 0%
M&T Bank Corporation 5,464.2 17 14 N 69 12 — 15 85,000 c 161,281 45% 55% 0% 0%
People’s United Financial 1,426.5 12 10 Y 68 13 76 11 27,000 b,c 196,301 51% 49% 0% 0%
The PNC Financial Services Group 15,888.0 12 11 N 62 5 72 11 90,000 b,c 332,886 40% 44% 0% 16%
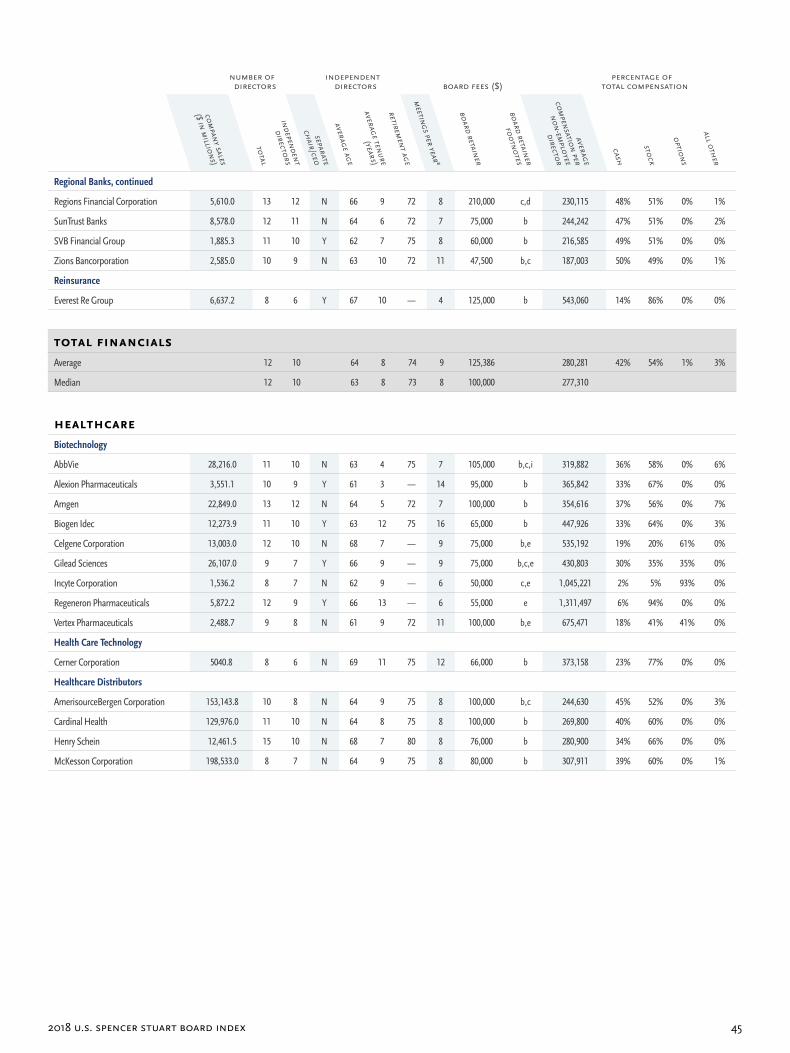
2018 U.S. Spencer StUart board index 45
number of directors
independentdirectors board fees ($)
percentage of total compensation
companY sales
($ in millions)
total
independent
directors
separate
cHair/ceo
aVerage age
aVerage tenure
(Years)
retirement age
meetings per Yearª
board retainer
board retainer
footnotes
aVerage
compensation per
non-emploYee
director
casH
stocK
options
all otHer
Regional Banks, continued
Regions Financial Corporation 5,610.0 13 12 N 66 9 72 8 210,000 c,d 230,115 48% 51% 0% 1%
SunTrust Banks 8,578.0 12 11 N 64 6 72 7 75,000 b 244,242 47% 51% 0% 2%
SVB Financial Group 1,885.3 11 10 Y 62 7 75 8 60,000 b 216,585 49% 51% 0% 0%
Zions Bancorporation 2,585.0 10 9 N 63 10 72 11 47,500 b,c 187,003 50% 49% 0% 1%
Reinsurance
Everest Re Group 6,637.2 8 6 Y 67 10 — 4 125,000 b 543,060 14% 86% 0% 0%
totAl finAnciAlSAverage 12 10 64 8 74 9 125,386 280,281 42% 54% 1% 3%
Median 12 10 63 8 73 8 100,000 277,310
heAlthcAreBiotechnology
AbbVie 28,216.0 11 10 N 63 4 75 7 105,000 b,c,i 319,882 36% 58% 0% 6%
Alexion Pharmaceuticals 3,551.1 10 9 Y 61 3 — 14 95,000 b 365,842 33% 67% 0% 0%
Amgen 22,849.0 13 12 N 64 5 72 7 100,000 b 354,616 37% 56% 0% 7%
Biogen Idec 12,273.9 11 10 Y 63 12 75 16 65,000 b 447,926 33% 64% 0% 3%
Celgene Corporation 13,003.0 12 10 N 68 7 — 9 75,000 b,e 535,192 19% 20% 61% 0%
Gilead Sciences 26,107.0 9 7 Y 66 9 — 9 75,000 b,c,e 430,803 30% 35% 35% 0%
Incyte Corporation 1,536.2 8 7 N 62 9 — 6 50,000 c,e 1,045,221 2% 5% 93% 0%
Regeneron Pharmaceuticals 5,872.2 12 9 Y 66 13 — 6 55,000 e 1,311,497 6% 94% 0% 0%
Vertex Pharmaceuticals 2,488.7 9 8 N 61 9 72 11 100,000 b,e 675,471 18% 41% 41% 0%
Health Care Technology
Cerner Corporation 5040.8 8 6 N 69 11 75 12 66,000 b 373,158 23% 77% 0% 0%
Healthcare Distributors
AmerisourceBergen Corporation 153,143.8 10 8 N 64 9 75 8 100,000 b,c 244,630 45% 52% 0% 3%
Cardinal Health 129,976.0 11 10 N 64 8 75 8 100,000 b 269,800 40% 60% 0% 0%
Henry Schein 12,461.5 15 10 N 68 7 80 8 76,000 b 280,900 34% 66% 0% 0%
McKesson Corporation 198,533.0 8 7 N 64 9 75 8 80,000 b 307,911 39% 60% 0% 1%
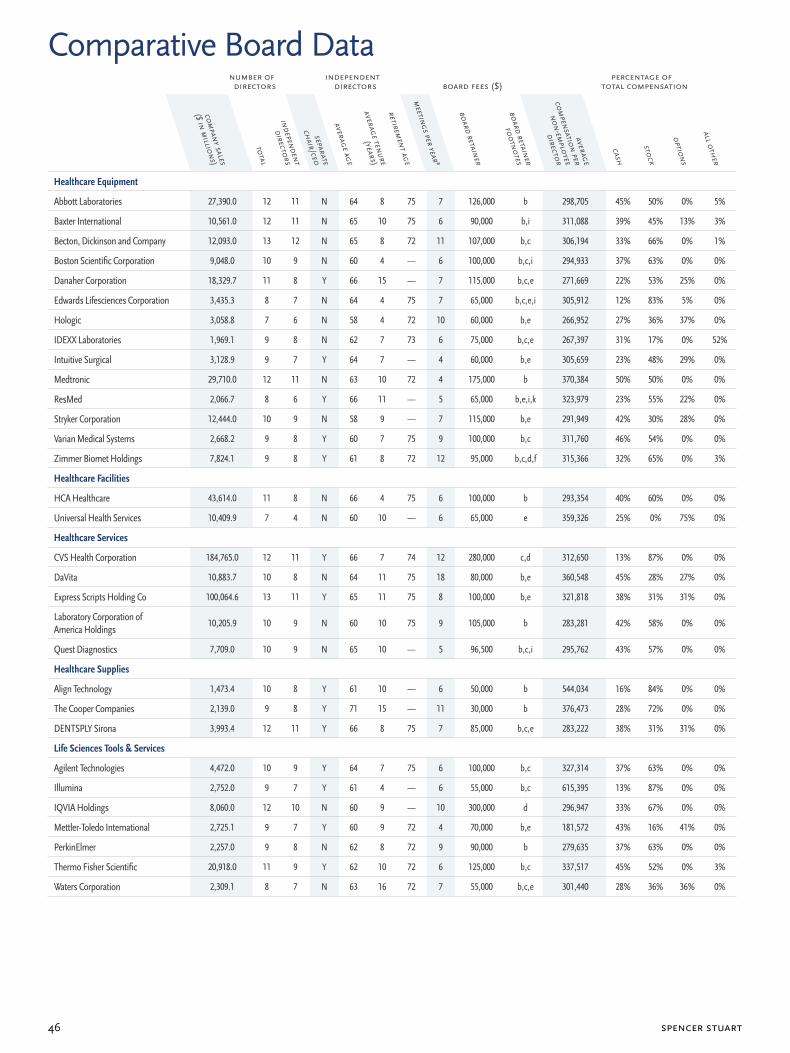
spencer stuart46
number of directors
independentdirectors board fees ($)
percentage of total compensation
companY sales
($ in millions)
total
independent
directors
separate
cHair/ceo
aVerage age
aVerage tenure
(Years)
retirement age
meetings per Yearª
board retainer
board retainer
footnotes
aVerage
compensation per
non-emploYee
director
casH
stocK
options
all otHer
Comparative Board Datanumber of directors
independentdirectors board fees ($)
percentage of total compensation
companY sales
($ in millions)
total
independent
directors
separate
cHair/ceo
aVerage age
aVerage tenure
(Years)
retirement age
meetings per Yearª
board retainer
board retainer
footnotes
aVerage
compensation per
non-emploYee
director
casH
stocK
options
all otHer
Healthcare Equipment
Abbott Laboratories 27,390.0 12 11 N 64 8 75 7 126,000 b 298,705 45% 50% 0% 5%
Baxter International 10,561.0 12 11 N 65 10 75 6 90,000 b,i 311,088 39% 45% 13% 3%
Becton, Dickinson and Company 12,093.0 13 12 N 65 8 72 11 107,000 b,c 306,194 33% 66% 0% 1%
Boston Scientific Corporation 9,048.0 10 9 N 60 4 — 6 100,000 b,c,i 294,933 37% 63% 0% 0%
Danaher Corporation 18,329.7 11 8 Y 66 15 — 7 115,000 b,c,e 271,669 22% 53% 25% 0%
Edwards Lifesciences Corporation 3,435.3 8 7 N 64 4 75 7 65,000 b,c,e,i 305,912 12% 83% 5% 0%
Hologic 3,058.8 7 6 N 58 4 72 10 60,000 b,e 266,952 27% 36% 37% 0%
IDEXX Laboratories 1,969.1 9 8 N 62 7 73 6 75,000 b,c,e 267,397 31% 17% 0% 52%
Intuitive Surgical 3,128.9 9 7 Y 64 7 — 4 60,000 b,e 305,659 23% 48% 29% 0%
Medtronic 29,710.0 12 11 N 63 10 72 4 175,000 b 370,384 50% 50% 0% 0%
ResMed 2,066.7 8 6 Y 66 11 — 5 65,000 b,e,i,k 323,979 23% 55% 22% 0%
Stryker Corporation 12,444.0 10 9 N 58 9 — 7 115,000 b,e 291,949 42% 30% 28% 0%
Varian Medical Systems 2,668.2 9 8 Y 60 7 75 9 100,000 b,c 311,760 46% 54% 0% 0%
Zimmer Biomet Holdings 7,824.1 9 8 Y 61 8 72 12 95,000 b,c,d,f 315,366 32% 65% 0% 3%
Healthcare Facilities
HCA Healthcare 43,614.0 11 8 N 66 4 75 6 100,000 b 293,354 40% 60% 0% 0%
Universal Health Services 10,409.9 7 4 N 60 10 — 6 65,000 e 359,326 25% 0% 75% 0%
Healthcare Services
CVS Health Corporation 184,765.0 12 11 Y 66 7 74 12 280,000 c,d 312,650 13% 87% 0% 0%
DaVita 10,883.7 10 8 N 64 11 75 18 80,000 b,e 360,548 45% 28% 27% 0%
Express Scripts Holding Co 100,064.6 13 11 Y 65 11 75 8 100,000 b,e 321,818 38% 31% 31% 0%
Laboratory Corporation of America Holdings
10,205.9 10 9 N 60 10 75 9 105,000 b 283,281 42% 58% 0% 0%
Quest Diagnostics 7,709.0 10 9 N 65 10 — 5 96,500 b,c,i 295,762 43% 57% 0% 0%
Healthcare Supplies
Align Technology 1,473.4 10 8 Y 61 10 — 6 50,000 b 544,034 16% 84% 0% 0%
The Cooper Companies 2,139.0 9 8 Y 71 15 — 11 30,000 b 376,473 28% 72% 0% 0%
DENTSPLY Sirona 3,993.4 12 11 Y 66 8 75 7 85,000 b,c,e 283,222 38% 31% 31% 0%
Life Sciences Tools & Services
Agilent Technologies 4,472.0 10 9 Y 64 7 75 6 100,000 b,c 327,314 37% 63% 0% 0%
Illumina 2,752.0 9 7 Y 61 4 — 6 55,000 b,c 615,395 13% 87% 0% 0%
IQVIA Holdings 8,060.0 12 10 N 60 9 — 10 300,000 d 296,947 33% 67% 0% 0%
Mettler-Toledo International 2,725.1 9 7 Y 60 9 72 4 70,000 b,e 181,572 43% 16% 41% 0%
PerkinElmer 2,257.0 9 8 N 62 8 72 9 90,000 b 279,635 37% 63% 0% 0%
Thermo Fisher Scientific 20,918.0 11 9 Y 62 10 72 6 125,000 b,c 337,517 45% 52% 0% 3%
Waters Corporation 2,309.1 8 7 N 63 16 72 7 55,000 b,c,e 301,440 28% 36% 36% 0%
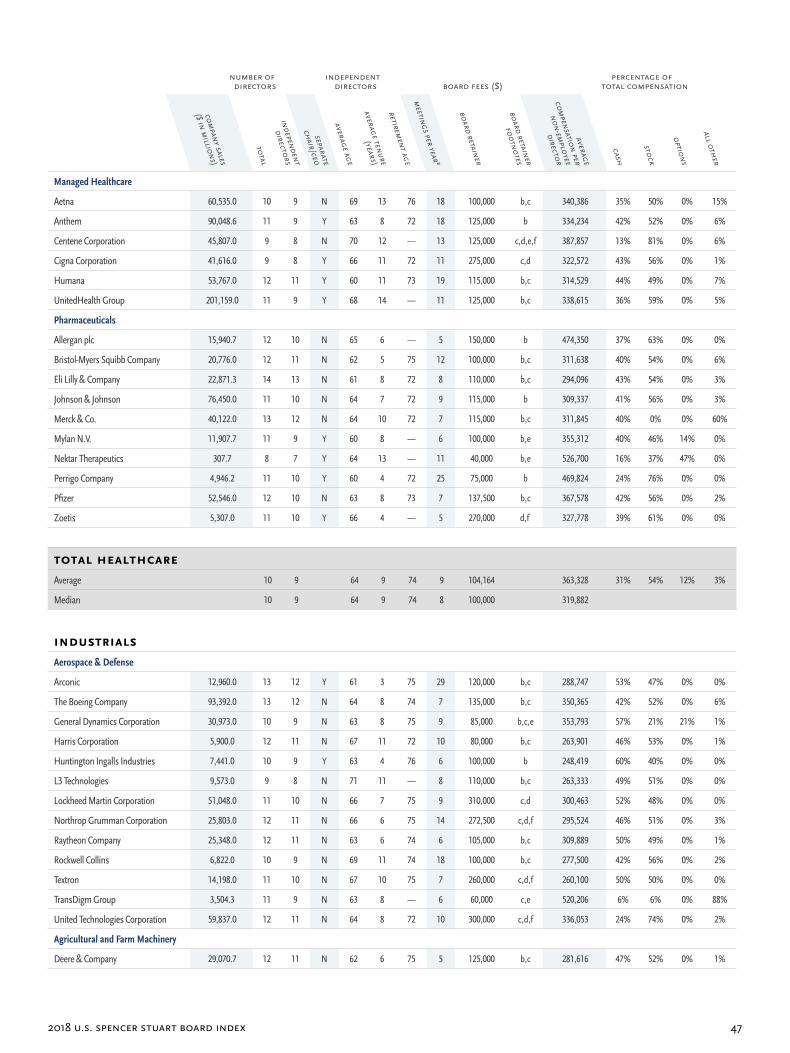
2018 U.S. Spencer StUart board index 47
number of directors
independentdirectors board fees ($)
percentage of total compensation
companY sales
($ in millions)
total
independent
directors
separate
cHair/ceo
aVerage age
aVerage tenure
(Years)
retirement age
meetings per Yearª
board retainer
board retainer
footnotes
aVerage
compensation per
non-emploYee
director
casH
stocK
options
all otHer
Managed Healthcare
Aetna 60,535.0 10 9 N 69 13 76 18 100,000 b,c 340,386 35% 50% 0% 15%
Anthem 90,048.6 11 9 Y 63 8 72 18 125,000 b 334,234 42% 52% 0% 6%
Centene Corporation 45,807.0 9 8 N 70 12 — 13 125,000 c,d,e,f 387,857 13% 81% 0% 6%
Cigna Corporation 41,616.0 9 8 Y 66 11 72 11 275,000 c,d 322,572 43% 56% 0% 1%
Humana 53,767.0 12 11 Y 60 11 73 19 115,000 b,c 314,529 44% 49% 0% 7%
UnitedHealth Group 201,159.0 11 9 Y 68 14 — 11 125,000 b,c 338,615 36% 59% 0% 5%
Pharmaceuticals
Allergan plc 15,940.7 12 10 N 65 6 — 5 150,000 b 474,350 37% 63% 0% 0%
Bristol-Myers Squibb Company 20,776.0 12 11 N 62 5 75 12 100,000 b,c 311,638 40% 54% 0% 6%
Eli Lilly & Company 22,871.3 14 13 N 61 8 72 8 110,000 b,c 294,096 43% 54% 0% 3%
Johnson & Johnson 76,450.0 11 10 N 64 7 72 9 115,000 b 309,337 41% 56% 0% 3%
Merck & Co. 40,122.0 13 12 N 64 10 72 7 115,000 b,c 311,845 40% 0% 0% 60%
Mylan N.V. 11,907.7 11 9 Y 60 8 — 6 100,000 b,e 355,312 40% 46% 14% 0%
Nektar Therapeutics 307.7 8 7 Y 64 13 — 11 40,000 b,e 526,700 16% 37% 47% 0%
Perrigo Company 4,946.2 11 10 Y 60 4 72 25 75,000 b 469,824 24% 76% 0% 0%
Pfizer 52,546.0 12 10 N 63 8 73 7 137,500 b,c 367,578 42% 56% 0% 2%
Zoetis 5,307.0 11 10 Y 66 4 — 5 270,000 d,f 327,778 39% 61% 0% 0%
totAl heAlthcAreAverage 10 9 64 9 74 9 104,164 363,328 31% 54% 12% 3%
Median 10 9 64 9 74 8 100,000 319,882
induStriAlSAerospace & Defense
Arconic 12,960.0 13 12 Y 61 3 75 29 120,000 b,c 288,747 53% 47% 0% 0%
The Boeing Company 93,392.0 13 12 N 64 8 74 7 135,000 b,c 350,365 42% 52% 0% 6%
General Dynamics Corporation 30,973.0 10 9 N 63 8 75 9 85,000 b,c,e 353,793 57% 21% 21% 1%
Harris Corporation 5,900.0 12 11 N 67 11 72 10 80,000 b,c 263,901 46% 53% 0% 1%
Huntington Ingalls Industries 7,441.0 10 9 Y 63 4 76 6 100,000 b 248,419 60% 40% 0% 0%
L3 Technologies 9,573.0 9 8 N 71 11 — 8 110,000 b,c 263,333 49% 51% 0% 0%
Lockheed Martin Corporation 51,048.0 11 10 N 66 7 75 9 310,000 c,d 300,463 52% 48% 0% 0%
Northrop Grumman Corporation 25,803.0 12 11 N 66 6 75 14 272,500 c,d,f 295,524 46% 51% 0% 3%
Raytheon Company 25,348.0 12 11 N 63 6 74 6 105,000 b,c 309,889 50% 49% 0% 1%
Rockwell Collins 6,822.0 10 9 N 69 11 74 18 100,000 b,c 277,500 42% 56% 0% 2%
Textron 14,198.0 11 10 N 67 10 75 7 260,000 c,d,f 260,100 50% 50% 0% 0%
TransDigm Group 3,504.3 11 9 N 63 8 — 6 60,000 c,e 520,206 6% 6% 0% 88%
United Technologies Corporation 59,837.0 12 11 N 64 8 72 10 300,000 c,d,f 336,053 24% 74% 0% 2%
Agricultural and Farm Machinery
Deere & Company 29,070.7 12 11 N 62 6 75 5 125,000 b,c 281,616 47% 52% 0% 1%
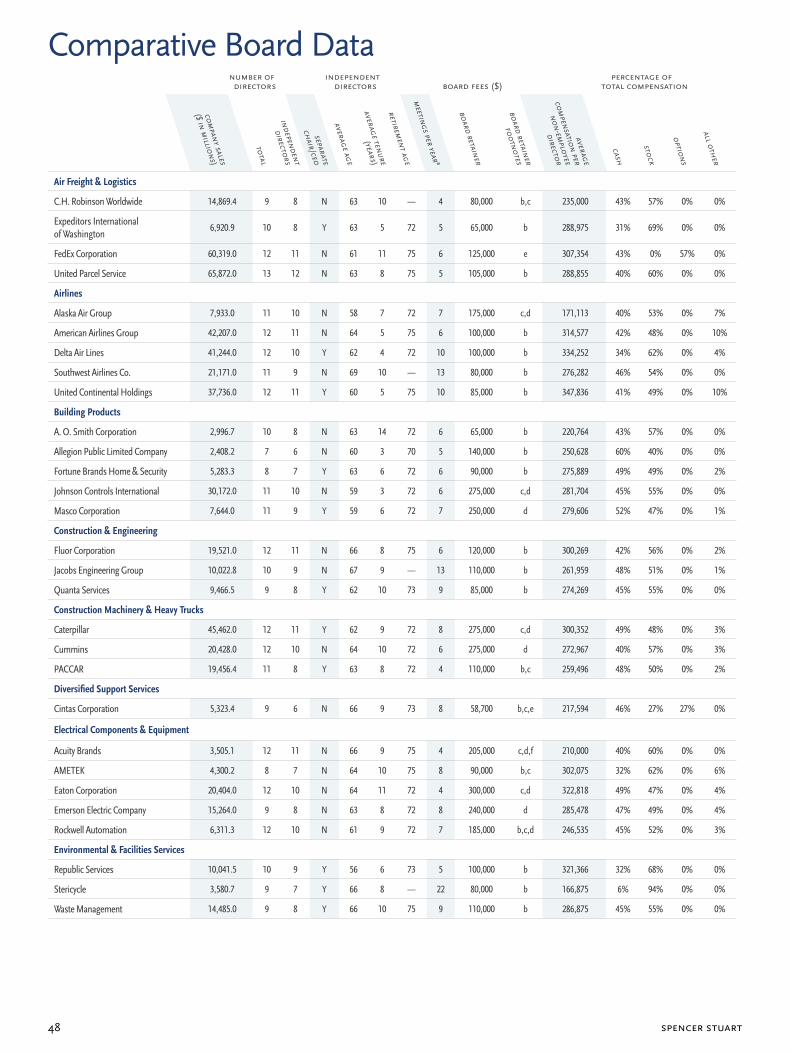
spencer stuart48
number of directors
independentdirectors board fees ($)
percentage of total compensation
companY sales
($ in millions)
total
independent
directors
separate
cHair/ceo
aVerage age
aVerage tenure
(Years)
retirement age
meetings per Yearª
board retainer
board retainer
footnotes
aVerage
compensation per
non-emploYee
director
casH
stocK
options
all otHer
Comparative Board Datanumber of directors
independentdirectors board fees ($)
percentage of total compensation
companY sales
($ in millions)
total
independent
directors
separate
cHair/ceo
aVerage age
aVerage tenure
(Years)
retirement age
meetings per Yearª
board retainer
board retainer
footnotes
aVerage
compensation per
non-emploYee
director
casH
stocK
options
all otHer
Air Freight & Logistics
C.H. Robinson Worldwide 14,869.4 9 8 N 63 10 — 4 80,000 b,c 235,000 43% 57% 0% 0%
Expeditors International of Washington
6,920.9 10 8 Y 63 5 72 5 65,000 b 288,975 31% 69% 0% 0%
FedEx Corporation 60,319.0 12 11 N 61 11 75 6 125,000 e 307,354 43% 0% 57% 0%
United Parcel Service 65,872.0 13 12 N 63 8 75 5 105,000 b 288,855 40% 60% 0% 0%
Airlines
Alaska Air Group 7,933.0 11 10 N 58 7 72 7 175,000 c,d 171,113 40% 53% 0% 7%
American Airlines Group 42,207.0 12 11 N 64 5 75 6 100,000 b 314,577 42% 48% 0% 10%
Delta Air Lines 41,244.0 12 10 Y 62 4 72 10 100,000 b 334,252 34% 62% 0% 4%
Southwest Airlines Co. 21,171.0 11 9 N 69 10 — 13 80,000 b 276,282 46% 54% 0% 0%
United Continental Holdings 37,736.0 12 11 Y 60 5 75 10 85,000 b 347,836 41% 49% 0% 10%
Building Products
A. O. Smith Corporation 2,996.7 10 8 N 63 14 72 6 65,000 b 220,764 43% 57% 0% 0%
Allegion Public Limited Company 2,408.2 7 6 N 60 3 70 5 140,000 b 250,628 60% 40% 0% 0%
Fortune Brands Home & Security 5,283.3 8 7 Y 63 6 72 6 90,000 b 275,889 49% 49% 0% 2%
Johnson Controls International 30,172.0 11 10 N 59 3 72 6 275,000 c,d 281,704 45% 55% 0% 0%
Masco Corporation 7,644.0 11 9 Y 59 6 72 7 250,000 d 279,606 52% 47% 0% 1%
Construction & Engineering
Fluor Corporation 19,521.0 12 11 N 66 8 75 6 120,000 b 300,269 42% 56% 0% 2%
Jacobs Engineering Group 10,022.8 10 9 N 67 9 — 13 110,000 b 261,959 48% 51% 0% 1%
Quanta Services 9,466.5 9 8 Y 62 10 73 9 85,000 b 274,269 45% 55% 0% 0%
Construction Machinery & Heavy Trucks
Caterpillar 45,462.0 12 11 Y 62 9 72 8 275,000 c,d 300,352 49% 48% 0% 3%
Cummins 20,428.0 12 10 N 64 10 72 6 275,000 d 272,967 40% 57% 0% 3%
PACCAR 19,456.4 11 8 Y 63 8 72 4 110,000 b,c 259,496 48% 50% 0% 2%
Diversified Support Services
Cintas Corporation 5,323.4 9 6 N 66 9 73 8 58,700 b,c,e 217,594 46% 27% 27% 0%
Electrical Components & Equipment
Acuity Brands 3,505.1 12 11 N 66 9 75 4 205,000 c,d,f 210,000 40% 60% 0% 0%
AMETEK 4,300.2 8 7 N 64 10 75 8 90,000 b,c 302,075 32% 62% 0% 6%
Eaton Corporation 20,404.0 12 10 N 64 11 72 4 300,000 c,d 322,818 49% 47% 0% 4%
Emerson Electric Company 15,264.0 9 8 N 63 8 72 8 240,000 d 285,478 47% 49% 0% 4%
Rockwell Automation 6,311.3 12 10 N 61 9 72 7 185,000 b,c,d 246,535 45% 52% 0% 3%
Environmental & Facilities Services
Republic Services 10,041.5 10 9 Y 56 6 73 5 100,000 b 321,366 32% 68% 0% 0%
Stericycle 3,580.7 9 7 Y 66 8 — 22 80,000 b 166,875 6% 94% 0% 0%
Waste Management 14,485.0 9 8 Y 66 10 75 9 110,000 b 286,875 45% 55% 0% 0%
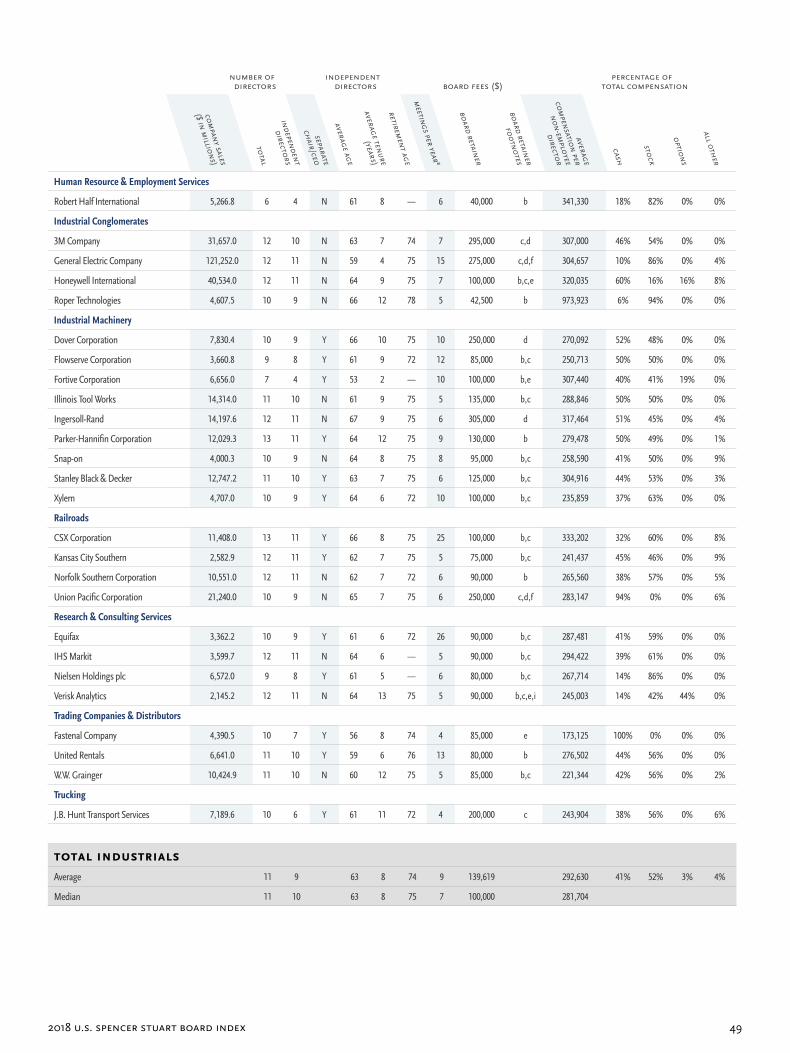
2018 U.S. Spencer StUart board index 49
number of directors
independentdirectors board fees ($)
percentage of total compensation
companY sales
($ in millions)
total
independent
directors
separate
cHair/ceo
aVerage age
aVerage tenure
(Years)
retirement age
meetings per Yearª
board retainer
board retainer
footnotes
aVerage
compensation per
non-emploYee
director
casH
stocK
options
all otHer
Human Resource & Employment Services
Robert Half International 5,266.8 6 4 N 61 8 — 6 40,000 b 341,330 18% 82% 0% 0%
Industrial Conglomerates
3M Company 31,657.0 12 10 N 63 7 74 7 295,000 c,d 307,000 46% 54% 0% 0%
General Electric Company 121,252.0 12 11 N 59 4 75 15 275,000 c,d,f 304,657 10% 86% 0% 4%
Honeywell International 40,534.0 12 11 N 64 9 75 7 100,000 b,c,e 320,035 60% 16% 16% 8%
Roper Technologies 4,607.5 10 9 N 66 12 78 5 42,500 b 973,923 6% 94% 0% 0%
Industrial Machinery
Dover Corporation 7,830.4 10 9 Y 66 10 75 10 250,000 d 270,092 52% 48% 0% 0%
Flowserve Corporation 3,660.8 9 8 Y 61 9 72 12 85,000 b,c 250,713 50% 50% 0% 0%
Fortive Corporation 6,656.0 7 4 Y 53 2 — 10 100,000 b,e 307,440 40% 41% 19% 0%
Illinois Tool Works 14,314.0 11 10 N 61 9 75 5 135,000 b,c 288,846 50% 50% 0% 0%
Ingersoll-Rand 14,197.6 12 11 N 67 9 75 6 305,000 d 317,464 51% 45% 0% 4%
Parker-Hannifin Corporation 12,029.3 13 11 Y 64 12 75 9 130,000 b 279,478 50% 49% 0% 1%
Snap-on 4,000.3 10 9 N 64 8 75 8 95,000 b,c 258,590 41% 50% 0% 9%
Stanley Black & Decker 12,747.2 11 10 Y 63 7 75 6 125,000 b,c 304,916 44% 53% 0% 3%
Xylem 4,707.0 10 9 Y 64 6 72 10 100,000 b,c 235,859 37% 63% 0% 0%
Railroads
CSX Corporation 11,408.0 13 11 Y 66 8 75 25 100,000 b,c 333,202 32% 60% 0% 8%
Kansas City Southern 2,582.9 12 11 Y 62 7 75 5 75,000 b,c 241,437 45% 46% 0% 9%
Norfolk Southern Corporation 10,551.0 12 11 N 62 7 72 6 90,000 b 265,560 38% 57% 0% 5%
Union Pacific Corporation 21,240.0 10 9 N 65 7 75 6 250,000 c,d,f 283,147 94% 0% 0% 6%
Research & Consulting Services
Equifax 3,362.2 10 9 Y 61 6 72 26 90,000 b,c 287,481 41% 59% 0% 0%
IHS Markit 3,599.7 12 11 N 64 6 — 5 90,000 b,c 294,422 39% 61% 0% 0%
Nielsen Holdings plc 6,572.0 9 8 Y 61 5 — 6 80,000 b,c 267,714 14% 86% 0% 0%
Verisk Analytics 2,145.2 12 11 N 64 13 75 5 90,000 b,c,e,i 245,003 14% 42% 44% 0%
Trading Companies & Distributors
Fastenal Company 4,390.5 10 7 Y 56 8 74 4 85,000 e 173,125 100% 0% 0% 0%
United Rentals 6,641.0 11 10 Y 59 6 76 13 80,000 b 276,502 44% 56% 0% 0%
W.W. Grainger 10,424.9 11 10 N 60 12 75 5 85,000 b,c 221,344 42% 56% 0% 2%
Trucking
J.B. Hunt Transport Services 7,189.6 10 6 Y 61 11 72 4 200,000 c 243,904 38% 56% 0% 6%
totAl induStriAlSAverage 11 9 63 8 74 9 139,619 292,630 41% 52% 3% 4%
Median 11 10 63 8 75 7 100,000 281,704
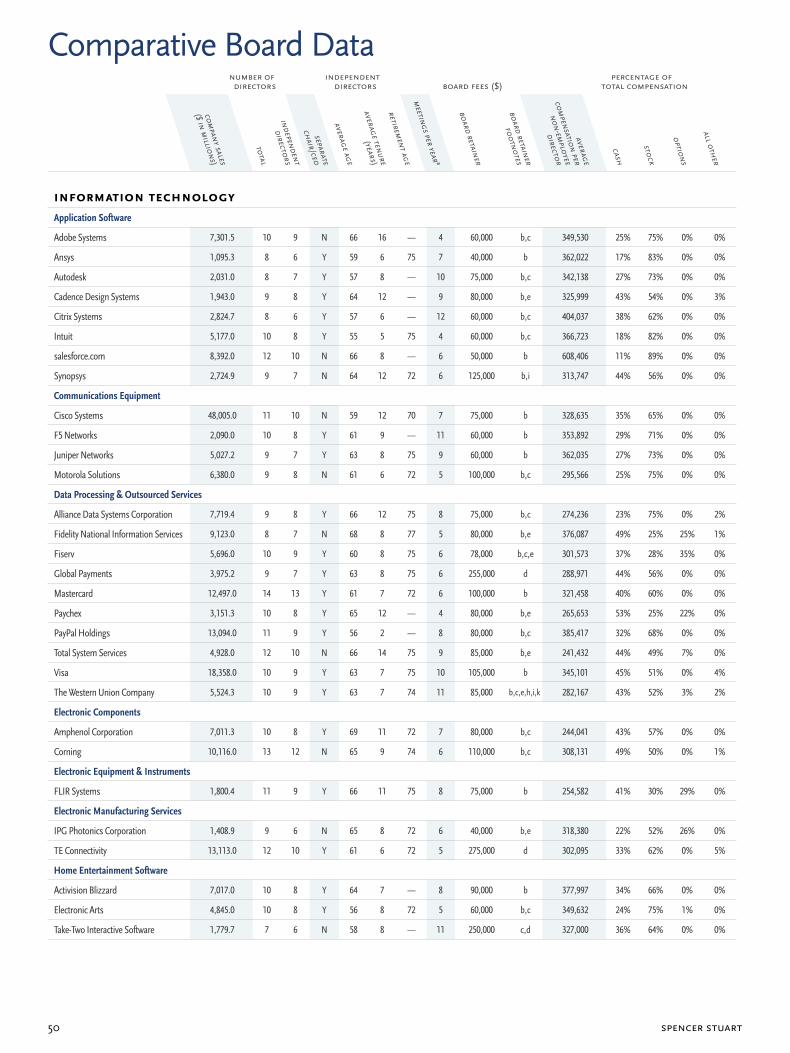
spencer stuart50
number of directors
independentdirectors board fees ($)
percentage of total compensation
companY sales
($ in millions)
total
independent
directors
separate
cHair/ceo
aVerage age
aVerage tenure
(Years)
retirement age
meetings per Yearª
board retainer
board retainer
footnotes
aVerage
compensation per
non-emploYee
director
casH
stocK
options
all otHer
Comparative Board Datanumber of directors
independentdirectors board fees ($)
percentage of total compensation
companY sales
($ in millions)
total
independent
directors
separate
cHair/ceo
aVerage age
aVerage tenure
(Years)
retirement age
meetings per Yearª
board retainer
board retainer
footnotes
aVerage
compensation per
non-emploYee
director
casH
stocK
options
all otHer
informAtion technologyApplication Software
Adobe Systems 7,301.5 10 9 N 66 16 — 4 60,000 b,c 349,530 25% 75% 0% 0%
Ansys 1,095.3 8 6 Y 59 6 75 7 40,000 b 362,022 17% 83% 0% 0%
Autodesk 2,031.0 8 7 Y 57 8 — 10 75,000 b,c 342,138 27% 73% 0% 0%
Cadence Design Systems 1,943.0 9 8 Y 64 12 — 9 80,000 b,e 325,999 43% 54% 0% 3%
Citrix Systems 2,824.7 8 6 Y 57 6 — 12 60,000 b,c 404,037 38% 62% 0% 0%
Intuit 5,177.0 10 8 Y 55 5 75 4 60,000 b,c 366,723 18% 82% 0% 0%
salesforce.com 8,392.0 12 10 N 66 8 — 6 50,000 b 608,406 11% 89% 0% 0%
Synopsys 2,724.9 9 7 N 64 12 72 6 125,000 b,i 313,747 44% 56% 0% 0%
Communications Equipment
Cisco Systems 48,005.0 11 10 N 59 12 70 7 75,000 b 328,635 35% 65% 0% 0%
F5 Networks 2,090.0 10 8 Y 61 9 — 11 60,000 b 353,892 29% 71% 0% 0%
Juniper Networks 5,027.2 9 7 Y 63 8 75 9 60,000 b 362,035 27% 73% 0% 0%
Motorola Solutions 6,380.0 9 8 N 61 6 72 5 100,000 b,c 295,566 25% 75% 0% 0%
Data Processing & Outsourced Services
Alliance Data Systems Corporation 7,719.4 9 8 Y 66 12 75 8 75,000 b,c 274,236 23% 75% 0% 2%
Fidelity National Information Services 9,123.0 8 7 N 68 8 77 5 80,000 b,e 376,087 49% 25% 25% 1%
Fiserv 5,696.0 10 9 Y 60 8 75 6 78,000 b,c,e 301,573 37% 28% 35% 0%
Global Payments 3,975.2 9 7 Y 63 8 75 6 255,000 d 288,971 44% 56% 0% 0%
Mastercard 12,497.0 14 13 Y 61 7 72 6 100,000 b 321,458 40% 60% 0% 0%
Paychex 3,151.3 10 8 Y 65 12 — 4 80,000 b,e 265,653 53% 25% 22% 0%
PayPal Holdings 13,094.0 11 9 Y 56 2 — 8 80,000 b,c 385,417 32% 68% 0% 0%
Total System Services 4,928.0 12 10 N 66 14 75 9 85,000 b,e 241,432 44% 49% 7% 0%
Visa 18,358.0 10 9 Y 63 7 75 10 105,000 b 345,101 45% 51% 0% 4%
The Western Union Company 5,524.3 10 9 Y 63 7 74 11 85,000 b,c,e,h,i,k 282,167 43% 52% 3% 2%
Electronic Components
Amphenol Corporation 7,011.3 10 8 Y 69 11 72 7 80,000 b,c 244,041 43% 57% 0% 0%
Corning 10,116.0 13 12 N 65 9 74 6 110,000 b,c 308,131 49% 50% 0% 1%
Electronic Equipment & Instruments
FLIR Systems 1,800.4 11 9 Y 66 11 75 8 75,000 b 254,582 41% 30% 29% 0%
Electronic Manufacturing Services
IPG Photonics Corporation 1,408.9 9 6 N 65 8 72 6 40,000 b,e 318,380 22% 52% 26% 0%
TE Connectivity 13,113.0 12 10 Y 61 6 72 5 275,000 d 302,095 33% 62% 0% 5%
Home Entertainment Software
Activision Blizzard 7,017.0 10 8 Y 64 7 — 8 90,000 b 377,997 34% 66% 0% 0%
Electronic Arts 4,845.0 10 8 Y 56 8 72 5 60,000 b,c 349,632 24% 75% 1% 0%
Take-Two Interactive Software 1,779.7 7 6 N 58 8 — 11 250,000 c,d 327,000 36% 64% 0% 0%
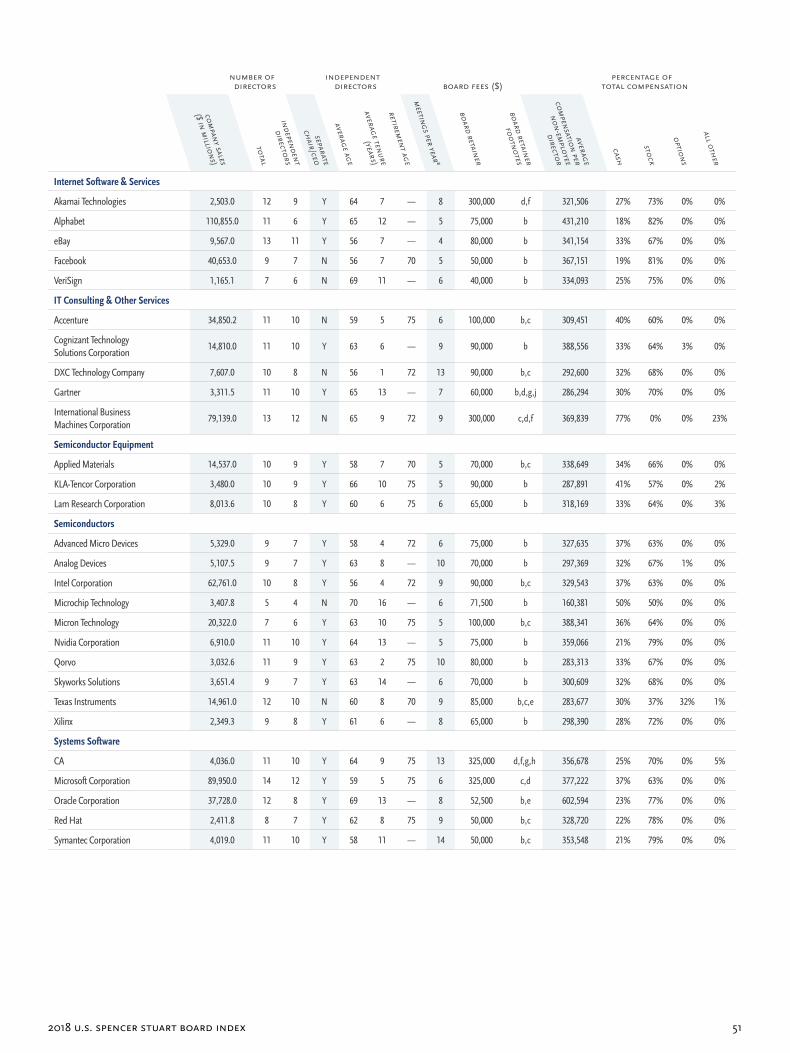
2018 U.S. Spencer StUart board index 51
number of directors
independentdirectors board fees ($)
percentage of total compensation
companY sales
($ in millions)
total
independent
directors
separate
cHair/ceo
aVerage age
aVerage tenure
(Years)
retirement age
meetings per Yearª
board retainer
board retainer
footnotes
aVerage
compensation per
non-emploYee
director
casH
stocK
options
all otHer
Internet Software & Services
Akamai Technologies 2,503.0 12 9 Y 64 7 — 8 300,000 d,f 321,506 27% 73% 0% 0%
Alphabet 110,855.0 11 6 Y 65 12 — 5 75,000 b 431,210 18% 82% 0% 0%
eBay 9,567.0 13 11 Y 56 7 — 4 80,000 b 341,154 33% 67% 0% 0%
Facebook 40,653.0 9 7 N 56 7 70 5 50,000 b 367,151 19% 81% 0% 0%
VeriSign 1,165.1 7 6 N 69 11 — 6 40,000 b 334,093 25% 75% 0% 0%
IT Consulting & Other Services
Accenture 34,850.2 11 10 N 59 5 75 6 100,000 b,c 309,451 40% 60% 0% 0%
Cognizant Technology Solutions Corporation
14,810.0 11 10 Y 63 6 — 9 90,000 b 388,556 33% 64% 3% 0%
DXC Technology Company 7,607.0 10 8 N 56 1 72 13 90,000 b,c 292,600 32% 68% 0% 0%
Gartner 3,311.5 11 10 Y 65 13 — 7 60,000 b,d,g,j 286,294 30% 70% 0% 0%
International Business Machines Corporation
79,139.0 13 12 N 65 9 72 9 300,000 c,d,f 369,839 77% 0% 0% 23%
Semiconductor Equipment
Applied Materials 14,537.0 10 9 Y 58 7 70 5 70,000 b,c 338,649 34% 66% 0% 0%
KLA-Tencor Corporation 3,480.0 10 9 Y 66 10 75 5 90,000 b 287,891 41% 57% 0% 2%
Lam Research Corporation 8,013.6 10 8 Y 60 6 75 6 65,000 b 318,169 33% 64% 0% 3%
Semiconductors
Advanced Micro Devices 5,329.0 9 7 Y 58 4 72 6 75,000 b 327,635 37% 63% 0% 0%
Analog Devices 5,107.5 9 7 Y 63 8 — 10 70,000 b 297,369 32% 67% 1% 0%
Intel Corporation 62,761.0 10 8 Y 56 4 72 9 90,000 b,c 329,543 37% 63% 0% 0%
Microchip Technology 3,407.8 5 4 N 70 16 — 6 71,500 b 160,381 50% 50% 0% 0%
Micron Technology 20,322.0 7 6 Y 63 10 75 5 100,000 b,c 388,341 36% 64% 0% 0%
Nvidia Corporation 6,910.0 11 10 Y 64 13 — 5 75,000 b 359,066 21% 79% 0% 0%
Qorvo 3,032.6 11 9 Y 63 2 75 10 80,000 b 283,313 33% 67% 0% 0%
Skyworks Solutions 3,651.4 9 7 Y 63 14 — 6 70,000 b 300,609 32% 68% 0% 0%
Texas Instruments 14,961.0 12 10 N 60 8 70 9 85,000 b,c,e 283,677 30% 37% 32% 1%
Xilinx 2,349.3 9 8 Y 61 6 — 8 65,000 b 298,390 28% 72% 0% 0%
Systems Software
CA 4,036.0 11 10 Y 64 9 75 13 325,000 d,f,g,h 356,678 25% 70% 0% 5%
Microsoft Corporation 89,950.0 14 12 Y 59 5 75 6 325,000 c,d 377,222 37% 63% 0% 0%
Oracle Corporation 37,728.0 12 8 Y 69 13 — 8 52,500 b,e 602,594 23% 77% 0% 0%
Red Hat 2,411.8 8 7 Y 62 8 75 9 50,000 b,c 328,720 22% 78% 0% 0%
Symantec Corporation 4,019.0 11 10 Y 58 11 — 14 50,000 b,c 353,548 21% 79% 0% 0%
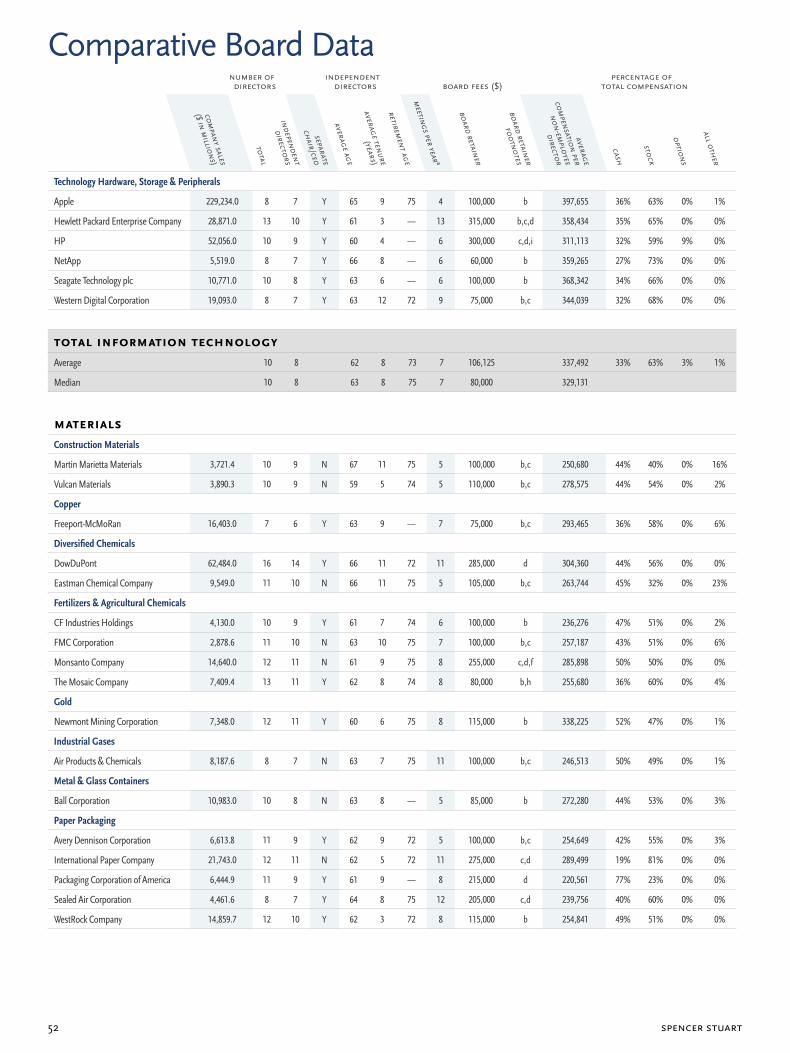
spencer stuart52
number of directors
independentdirectors board fees ($)
percentage of total compensation
companY sales
($ in millions)
total
independent
directors
separate
cHair/ceo
aVerage age
aVerage tenure
(Years)
retirement age
meetings per Yearª
board retainer
board retainer
footnotes
aVerage
compensation per
non-emploYee
director
casH
stocK
options
all otHer
Comparative Board Datanumber of directors
independentdirectors board fees ($)
percentage of total compensation
companY sales
($ in millions)
total
independent
directors
separate
cHair/ceo
aVerage age
aVerage tenure
(Years)
retirement age
meetings per Yearª
board retainer
board retainer
footnotes
aVerage
compensation per
non-emploYee
director
casH
stocK
options
all otHer
Technology Hardware, Storage & Peripherals
Apple 229,234.0 8 7 Y 65 9 75 4 100,000 b 397,655 36% 63% 0% 1%
Hewlett Packard Enterprise Company 28,871.0 13 10 Y 61 3 — 13 315,000 b,c,d 358,434 35% 65% 0% 0%
HP 52,056.0 10 9 Y 60 4 — 6 300,000 c,d,i 311,113 32% 59% 9% 0%
NetApp 5,519.0 8 7 Y 66 8 — 6 60,000 b 359,265 27% 73% 0% 0%
Seagate Technology plc 10,771.0 10 8 Y 63 6 — 6 100,000 b 368,342 34% 66% 0% 0%
Western Digital Corporation 19,093.0 8 7 Y 63 12 72 9 75,000 b,c 344,039 32% 68% 0% 0%
totAl informAtion technologyAverage 10 8 62 8 73 7 106,125 337,492 33% 63% 3% 1%
Median 10 8 63 8 75 7 80,000 329,131
mAteriAlSConstruction Materials
Martin Marietta Materials 3,721.4 10 9 N 67 11 75 5 100,000 b,c 250,680 44% 40% 0% 16%
Vulcan Materials 3,890.3 10 9 N 59 5 74 5 110,000 b,c 278,575 44% 54% 0% 2%
Copper
Freeport-McMoRan 16,403.0 7 6 Y 63 9 — 7 75,000 b,c 293,465 36% 58% 0% 6%
Diversified Chemicals
DowDuPont 62,484.0 16 14 Y 66 11 72 11 285,000 d 304,360 44% 56% 0% 0%
Eastman Chemical Company 9,549.0 11 10 N 66 11 75 5 105,000 b,c 263,744 45% 32% 0% 23%
Fertilizers & Agricultural Chemicals
CF Industries Holdings 4,130.0 10 9 Y 61 7 74 6 100,000 b 236,276 47% 51% 0% 2%
FMC Corporation 2,878.6 11 10 N 63 10 75 7 100,000 b,c 257,187 43% 51% 0% 6%
Monsanto Company 14,640.0 12 11 N 61 9 75 8 255,000 c,d,f 285,898 50% 50% 0% 0%
The Mosaic Company 7,409.4 13 11 Y 62 8 74 8 80,000 b,h 255,680 36% 60% 0% 4%
Gold
Newmont Mining Corporation 7,348.0 12 11 Y 60 6 75 8 115,000 b 338,225 52% 47% 0% 1%
Industrial Gases
Air Products & Chemicals 8,187.6 8 7 N 63 7 75 11 100,000 b,c 246,513 50% 49% 0% 1%
Metal & Glass Containers
Ball Corporation 10,983.0 10 8 N 63 8 — 5 85,000 b 272,280 44% 53% 0% 3%
Paper Packaging
Avery Dennison Corporation 6,613.8 11 9 Y 62 9 72 5 100,000 b,c 254,649 42% 55% 0% 3%
International Paper Company 21,743.0 12 11 N 62 5 72 11 275,000 c,d 289,499 19% 81% 0% 0%
Packaging Corporation of America 6,444.9 11 9 Y 61 9 — 8 215,000 d 220,561 77% 23% 0% 0%
Sealed Air Corporation 4,461.6 8 7 Y 64 8 75 12 205,000 c,d 239,756 40% 60% 0% 0%
WestRock Company 14,859.7 12 10 Y 62 3 72 8 115,000 b 254,841 49% 51% 0% 0%
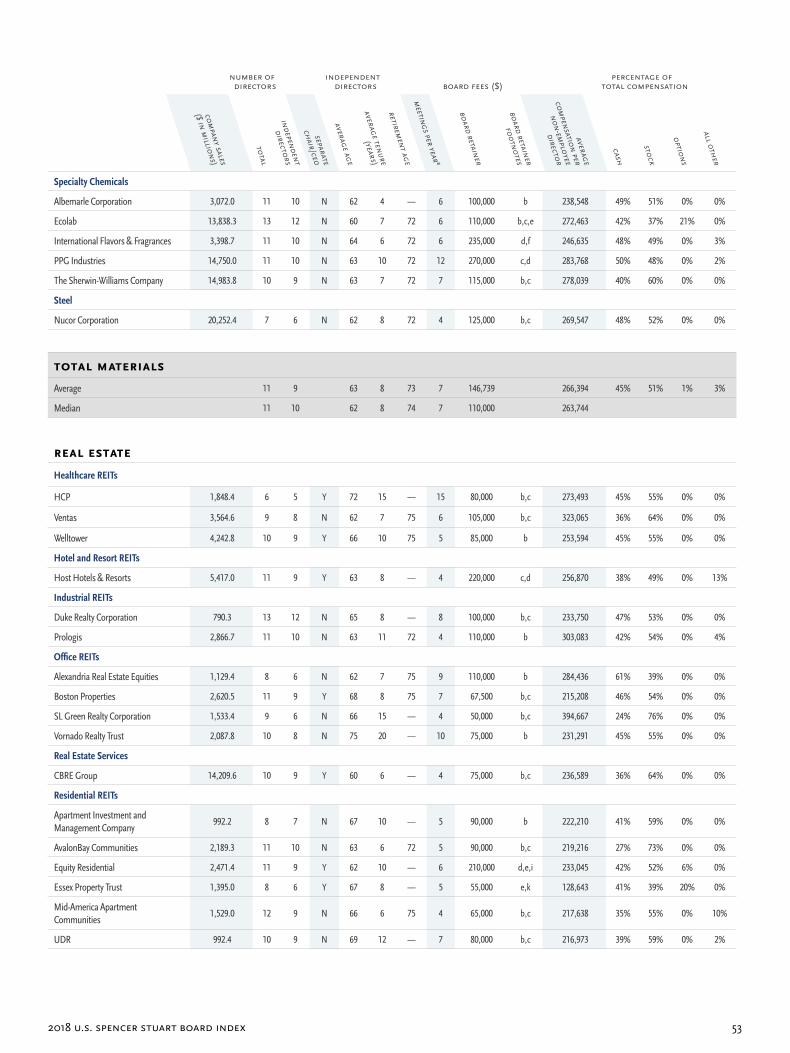
2018 U.S. Spencer StUart board index 53
number of directors
independentdirectors board fees ($)
percentage of total compensation
companY sales
($ in millions)
total
independent
directors
separate
cHair/ceo
aVerage age
aVerage tenure
(Years)
retirement age
meetings per Yearª
board retainer
board retainer
footnotes
aVerage
compensation per
non-emploYee
director
casH
stocK
options
all otHer
Specialty Chemicals
Albemarle Corporation 3,072.0 11 10 N 62 4 — 6 100,000 b 238,548 49% 51% 0% 0%
Ecolab 13,838.3 13 12 N 60 7 72 6 110,000 b,c,e 272,463 42% 37% 21% 0%
International Flavors & Fragrances 3,398.7 11 10 N 64 6 72 6 235,000 d,f 246,635 48% 49% 0% 3%
PPG Industries 14,750.0 11 10 N 63 10 72 12 270,000 c,d 283,768 50% 48% 0% 2%
The Sherwin-Williams Company 14,983.8 10 9 N 63 7 72 7 115,000 b,c 278,039 40% 60% 0% 0%
Steel
Nucor Corporation 20,252.4 7 6 N 62 8 72 4 125,000 b,c 269,547 48% 52% 0% 0%
totAl mAteriAlSAverage 11 9 63 8 73 7 146,739 266,394 45% 51% 1% 3%
Median 11 10 62 8 74 7 110,000 263,744
reAl eStAte
Healthcare REITs
HCP 1,848.4 6 5 Y 72 15 — 15 80,000 b,c 273,493 45% 55% 0% 0%
Ventas 3,564.6 9 8 N 62 7 75 6 105,000 b,c 323,065 36% 64% 0% 0%
Welltower 4,242.8 10 9 Y 66 10 75 5 85,000 b 253,594 45% 55% 0% 0%
Hotel and Resort REITs
Host Hotels & Resorts 5,417.0 11 9 Y 63 8 — 4 220,000 c,d 256,870 38% 49% 0% 13%
Industrial REITs
Duke Realty Corporation 790.3 13 12 N 65 8 — 8 100,000 b,c 233,750 47% 53% 0% 0%
Prologis 2,866.7 11 10 N 63 11 72 4 110,000 b 303,083 42% 54% 0% 4%
Office REITs
Alexandria Real Estate Equities 1,129.4 8 6 N 62 7 75 9 110,000 b 284,436 61% 39% 0% 0%
Boston Properties 2,620.5 11 9 Y 68 8 75 7 67,500 b,c 215,208 46% 54% 0% 0%
SL Green Realty Corporation 1,533.4 9 6 N 66 15 — 4 50,000 b,c 394,667 24% 76% 0% 0%
Vornado Realty Trust 2,087.8 10 8 N 75 20 — 10 75,000 b 231,291 45% 55% 0% 0%
Real Estate Services
CBRE Group 14,209.6 10 9 Y 60 6 — 4 75,000 b,c 236,589 36% 64% 0% 0%
Residential REITs
Apartment Investment and Management Company
992.2 8 7 N 67 10 — 5 90,000 b 222,210 41% 59% 0% 0%
AvalonBay Communities 2,189.3 11 10 N 63 6 72 5 90,000 b,c 219,216 27% 73% 0% 0%
Equity Residential 2,471.4 11 9 Y 62 10 — 6 210,000 d,e,i 233,045 42% 52% 6% 0%
Essex Property Trust 1,395.0 8 6 Y 67 8 — 5 55,000 e,k 128,643 41% 39% 20% 0%
Mid-America Apartment Communities
1,529.0 12 9 N 66 6 75 4 65,000 b,c 217,638 35% 55% 0% 10%
UDR 992.4 10 9 N 69 12 — 7 80,000 b,c 216,973 39% 59% 0% 2%
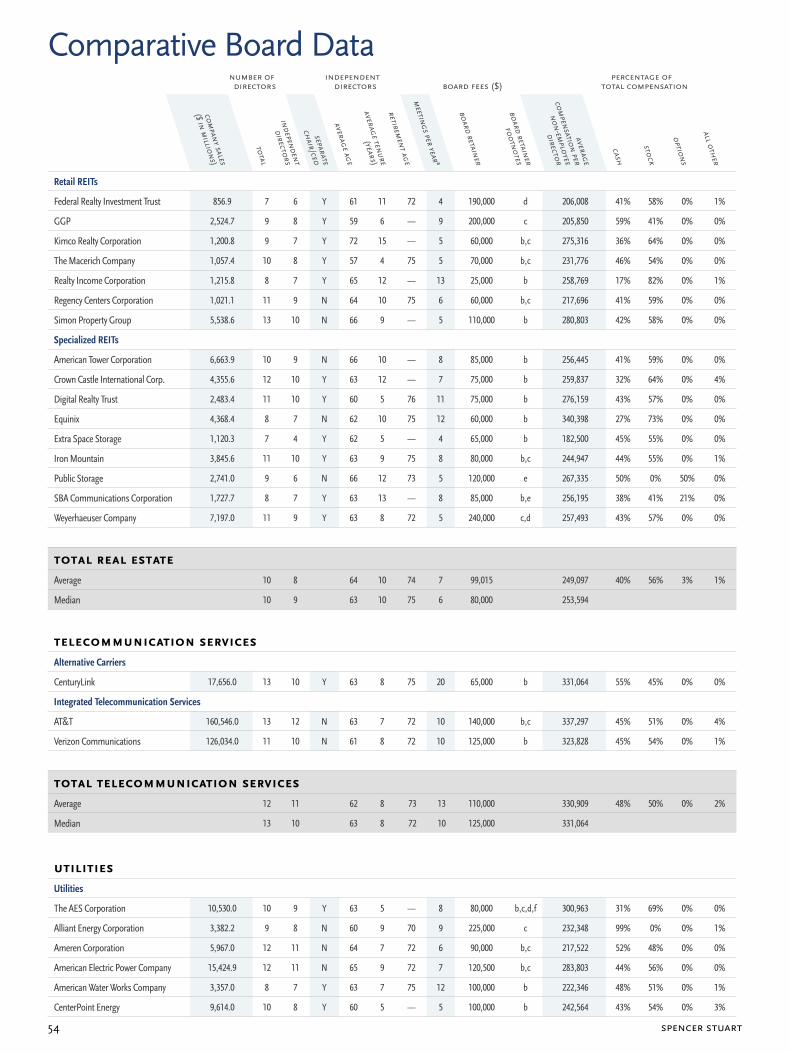
spencer stuart54
number of directors
independentdirectors board fees ($)
percentage of total compensation
companY sales
($ in millions)
total
independent
directors
separate
cHair/ceo
aVerage age
aVerage tenure
(Years)
retirement age
meetings per Yearª
board retainer
board retainer
footnotes
aVerage
compensation per
non-emploYee
director
casH
stocK
options
all otHer
Comparative Board Datanumber of directors
independentdirectors board fees ($)
percentage of total compensation
companY sales
($ in millions)
total
independent
directors
separate
cHair/ceo
aVerage age
aVerage tenure
(Years)
retirement age
meetings per Yearª
board retainer
board retainer
footnotes
aVerage
compensation per
non-emploYee
director
casH
stocK
options
all otHer
Retail REITs
Federal Realty Investment Trust 856.9 7 6 Y 61 11 72 4 190,000 d 206,008 41% 58% 0% 1%
GGP 2,524.7 9 8 Y 59 6 — 9 200,000 c 205,850 59% 41% 0% 0%
Kimco Realty Corporation 1,200.8 9 7 Y 72 15 — 5 60,000 b,c 275,316 36% 64% 0% 0%
The Macerich Company 1,057.4 10 8 Y 57 4 75 5 70,000 b,c 231,776 46% 54% 0% 0%
Realty Income Corporation 1,215.8 8 7 Y 65 12 — 13 25,000 b 258,769 17% 82% 0% 1%
Regency Centers Corporation 1,021.1 11 9 N 64 10 75 6 60,000 b,c 217,696 41% 59% 0% 0%
Simon Property Group 5,538.6 13 10 N 66 9 — 5 110,000 b 280,803 42% 58% 0% 0%
Specialized REITs
American Tower Corporation 6,663.9 10 9 N 66 10 — 8 85,000 b 256,445 41% 59% 0% 0%
Crown Castle International Corp. 4,355.6 12 10 Y 63 12 — 7 75,000 b 259,837 32% 64% 0% 4%
Digital Realty Trust 2,483.4 11 10 Y 60 5 76 11 75,000 b 276,159 43% 57% 0% 0%
Equinix 4,368.4 8 7 N 62 10 75 12 60,000 b 340,398 27% 73% 0% 0%
Extra Space Storage 1,120.3 7 4 Y 62 5 — 4 65,000 b 182,500 45% 55% 0% 0%
Iron Mountain 3,845.6 11 10 Y 63 9 75 8 80,000 b,c 244,947 44% 55% 0% 1%
Public Storage 2,741.0 9 6 N 66 12 73 5 120,000 e 267,335 50% 0% 50% 0%
SBA Communications Corporation 1,727.7 8 7 Y 63 13 — 8 85,000 b,e 256,195 38% 41% 21% 0%
Weyerhaeuser Company 7,197.0 11 9 Y 63 8 72 5 240,000 c,d 257,493 43% 57% 0% 0%
totAl reAl eStAteAverage 10 8 64 10 74 7 99,015 249,097 40% 56% 3% 1%
Median 10 9 63 10 75 6 80,000 253,594
telecommunicAtion ServiceSAlternative Carriers
CenturyLink 17,656.0 13 10 Y 63 8 75 20 65,000 b 331,064 55% 45% 0% 0%
Integrated Telecommunication Services
AT&T 160,546.0 13 12 N 63 7 72 10 140,000 b,c 337,297 45% 51% 0% 4%
Verizon Communications 126,034.0 11 10 N 61 8 72 10 125,000 b 323,828 45% 54% 0% 1%
totAl telecommunicAtion ServiceSAverage 12 11 62 8 73 13 110,000 330,909 48% 50% 0% 2%
Median 13 10 63 8 72 10 125,000 331,064
utilitieSUtilities
The AES Corporation 10,530.0 10 9 Y 63 5 — 8 80,000 b,c,d,f 300,963 31% 69% 0% 0%
Alliant Energy Corporation 3,382.2 9 8 N 60 9 70 9 225,000 c 232,348 99% 0% 0% 1%
Ameren Corporation 5,967.0 12 11 N 64 7 72 6 90,000 b,c 217,522 52% 48% 0% 0%
American Electric Power Company 15,424.9 12 11 N 65 9 72 7 120,500 b,c 283,803 44% 56% 0% 0%
American Water Works Company 3,357.0 8 7 Y 63 7 75 12 100,000 b 222,346 48% 51% 0% 1%
CenterPoint Energy 9,614.0 10 8 Y 60 5 — 5 100,000 b 242,564 43% 54% 0% 3%
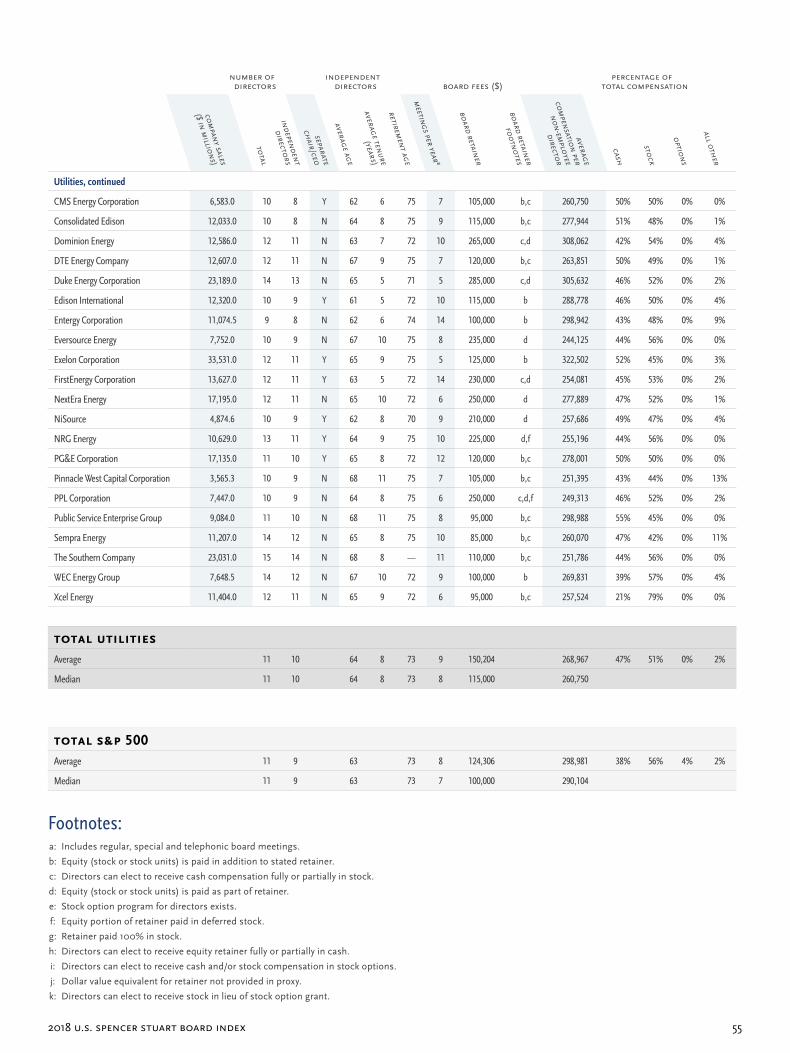
2018 U.S. Spencer StUart board index 55
number of directors
independentdirectors board fees ($)
percentage of total compensation
companY sales
($ in millions)
total
independent
directors
separate
cHair/ceo
aVerage age
aVerage tenure
(Years)
retirement age
meetings per Yearª
board retainer
board retainer
footnotes
aVerage
compensation per
non-emploYee
director
casH
stocK
options
all otHer
Footnotes:a: Includes regular, special and telephonic board meetings.
b: Equity (stock or stock units) is paid in addition to stated retainer.
c: Directors can elect to receive cash compensation fully or partially in stock.
d: Equity (stock or stock units) is paid as part of retainer.
e: Stock option program for directors exists.
f: Equity portion of retainer paid in deferred stock.
g: Retainer paid 100% in stock.
h: Directors can elect to receive equity retainer fully or partially in cash.
i: Directors can elect to receive cash and/or stock compensation in stock options.
j: Dollar value equivalent for retainer not provided in proxy.
k: Directors can elect to receive stock in lieu of stock option grant.
Utilities, continued
CMS Energy Corporation 6,583.0 10 8 Y 62 6 75 7 105,000 b,c 260,750 50% 50% 0% 0%
Consolidated Edison 12,033.0 10 8 N 64 8 75 9 115,000 b,c 277,944 51% 48% 0% 1%
Dominion Energy 12,586.0 12 11 N 63 7 72 10 265,000 c,d 308,062 42% 54% 0% 4%
DTE Energy Company 12,607.0 12 11 N 67 9 75 7 120,000 b,c 263,851 50% 49% 0% 1%
Duke Energy Corporation 23,189.0 14 13 N 65 5 71 5 285,000 c,d 305,632 46% 52% 0% 2%
Edison International 12,320.0 10 9 Y 61 5 72 10 115,000 b 288,778 46% 50% 0% 4%
Entergy Corporation 11,074.5 9 8 N 62 6 74 14 100,000 b 298,942 43% 48% 0% 9%
Eversource Energy 7,752.0 10 9 N 67 10 75 8 235,000 d 244,125 44% 56% 0% 0%
Exelon Corporation 33,531.0 12 11 Y 65 9 75 5 125,000 b 322,502 52% 45% 0% 3%
FirstEnergy Corporation 13,627.0 12 11 Y 63 5 72 14 230,000 c,d 254,081 45% 53% 0% 2%
NextEra Energy 17,195.0 12 11 N 65 10 72 6 250,000 d 277,889 47% 52% 0% 1%
NiSource 4,874.6 10 9 Y 62 8 70 9 210,000 d 257,686 49% 47% 0% 4%
NRG Energy 10,629.0 13 11 Y 64 9 75 10 225,000 d,f 255,196 44% 56% 0% 0%
PG&E Corporation 17,135.0 11 10 Y 65 8 72 12 120,000 b,c 278,001 50% 50% 0% 0%
Pinnacle West Capital Corporation 3,565.3 10 9 N 68 11 75 7 105,000 b,c 251,395 43% 44% 0% 13%
PPL Corporation 7,447.0 10 9 N 64 8 75 6 250,000 c,d,f 249,313 46% 52% 0% 2%
Public Service Enterprise Group 9,084.0 11 10 N 68 11 75 8 95,000 b,c 298,988 55% 45% 0% 0%
Sempra Energy 11,207.0 14 12 N 65 8 75 10 85,000 b,c 260,070 47% 42% 0% 11%
The Southern Company 23,031.0 15 14 N 68 8 — 11 110,000 b,c 251,786 44% 56% 0% 0%
WEC Energy Group 7,648.5 14 12 N 67 10 72 9 100,000 b 269,831 39% 57% 0% 4%
Xcel Energy 11,404.0 12 11 N 65 9 72 6 95,000 b,c 257,524 21% 79% 0% 0%
totAl utilitieSAverage 11 10 64 8 73 9 150,204 268,967 47% 51% 0% 2%
Median 11 10 64 8 73 8 115,000 260,750
totAl S&p 500Average 11 9 63 73 8 124,306 298,981 38% 56% 4% 2%
Median 11 9 63 73 7 100,000 290,104
Research and Insights
The Perception of Organizational Culture
in Latin America
How Boards Can Overcome the Most Common Succession
Planning Obstacles
Delighting the Customer: The Rise of the CXO in a
Big Data World
Getting a Seat at the Table: Executives Can Position
Themselves to Get on Boards
CEO Succession Planning: The CEO’s
Critical Role
How Audit Committees Are Responding to Risk and
Business Changes
Six Lessons CEOs Can Learn from
HR-Forward Companies
New Director Onboarding: 5 Recommendations for Enhancing Your Program
Beyond “Check The Box”: Getting Real Value from
Board Assessments
Visit spencerstuart.com for more information.
Spencer Stuart regularly explores the key concerns of boards and senior management, as well as innovative solutions to the challenges they face.

Spencer Stuart Board Governance Trends is an exclusive source of insight into the way board practices are changing around the world and how they compare across countries. It is a one-stop online resource for the latest data in board composition, governance practices and director compensation among leading public companies in more than 20 countries.
Visit spencerstuart.com for more information.
Board Governance Trends: A Global View
www.spencerstuart.com/research-and-insight/board-indexes

spencer stuart58
header (section title) — (remove when section header present)Amsterdam
Atlanta
Bangalore
Barcelona
Beijing
Bogotá
Boston
Brussels
Buenos Aires
Calgary
Chicago
Copenhagen
Dallas
Dubai
Düsseldorf
Frankfurt
Geneva
Hong Kong
Houston
Istanbul
Johannesburg
Lima
London
Los Angeles
Madrid
Melbourne
Mexico City
Miami
Milan
Minneapolis/St. Paul
Montreal
Moscow
Mumbai
Munich
New Delhi
New York
Orange County
Paris
Philadelphia
Prague
Rome
San Francisco
Santiago
São Paulo
Seattle
Shanghai
Silicon Valley
Singapore
Stamford
Stockholm
Sydney
Tokyo
Toronto
Vienna
Warsaw
Washington, D.C.
Zürich