2018/19 · 2020-06-02 · 1 annual report for 2018/19 financial year vote 04: department of...
TRANSCRIPT

2018
/19
Ann
ual R
epor
t
2018
/19
Ann
ual R
epor
t2018
/19
Ann
ual R
epor
t201
8/19
A
nnua
l Rep
ort
Printed by SwiftPrint, Kimberley. Tel: 053 8392900

1
Annual Report for 2018/19 Financial Year Vote 04: Department of Education
Province of the Northern Cape
- 1 -
VOTE 4
2018/19 ANNUAL REPORT
PR377/2019
ISBN: 978-0-621-47820-4
Title of Publication: Northern Cape Department of Education: Annual Report 2018/2019

2
Annual Report for 2018/19 Financial Year Vote 04: Department of Education
Province of the Northern Cape
2
Contents PART A: GENERAL INFORMATION .................................................................................. 4
1. DEPARTMENT GENERAL INFORMATION ..................................................................................... 5
2. LIST OF ABBREVIATIONS/ACRONYMS ......................................................................................... 6
3. FOREWORD BY THE MEC ............................................................................................................ 8
4. REPORT OF THE ACCOUNTING OFFICER ................................................................................... 11
5. STATEMENT OF RESPONSIBILITY AND CONFIRMATION OF ACCURACY FOR THE ANNUAL REPORT.................................................................................................................................................. 17
6. STRATEGIC OVERVIEW .............................................................................................................. 18
7. LEGISLATIVE AND OTHER MANDATES ...................................................................................... 18
8. ORGANISATIONAL STRUCTURE ................................................................................................. 19
9. ENTITIES REPORTING TO THE MEC ........................................................................................... 19
PART B: PERFORMANCE INFORMATION ....................................................................... 20
1. AUDITOR GENERAL’S REPORT: PREDETERMINED OBJECTIVES ................................................. 21
2. OVERVIEW OF DEPARTMENTAL PERFORMANCE ...................................................................... 21
2.1 Service Delivery Environment ........................................................................................... 21
2.2 Service Delivery Improvement Plan .................................................................................. 23
2.3 Organisational environment ............................................................................................. 25
2.4 Key policy developments and legislative changes ............................................................ 27
3. STRATEGIC OUTCOME ORIENTED GOALS ................................................................................. 27
4. PERFORMANCE INFORMATION BY PROGRAMME .................................................................... 29
4.1 Programme 1: ADMINISTRATION ..................................................................................... 29
4.2 Programme 2: PUBLIC ORDINARY SCHOOL EDUCATION .................................................. 42
4.3 Programme 3: INDEPENDENT SCHOOL SUBSIDIES ........................................................... 53
4.4 Programme 4: PUBLIC SPECIAL SCHOOL EDUCATION ...................................................... 57
4.5 Programme 5: EARLY CHILDHOOD DEVELOPMENT .......................................................... 60
4.6 Programme 6: INFRASTRUCTURE DEVELOPMENT ............................................................ 64
4.7 Programme 7: EXAMINATION AND EDUCATION-RELATED SERVICES .............................. 75
5. TRANSFER PAYMENTS ............................................................................................................... 81
6. CONDITIONAL GRANTS ............................................................................................................. 81
7. DONOR FUNDS .......................................................................................................................... 85
8. CAPITAL INVESTMENT ............................................................................................................... 86
PART C: GOVERNANCE ................................................................................................... 88
1. INTRODUCTION ......................................................................................................................... 89
Annual Report for 2018/19 Financial Year Vote 04: Department of Education
Province of the Northern Cape
3
2. RISK MANAGEMENT .................................................................................................................. 89
3. FRAUD AND CORRUPTION ........................................................................................................ 89
4. MINIMISING CONFLICT OF INTEREST ........................................................................................ 90
5. CODE OF CONDUCT ................................................................................................................... 90
6. HEALTH, SAFETY AND ENVIRONMENTAL ISSUES ...................................................................... 90
7. PORTFOLIO COMMITTEES ......................................................................................................... 91
8. SCOPA RESOLUTIONS ................................................................................................................ 91
9. PRIOR MODIFICATIONS TO AUDIT REPORTS ............................................................................ 92
10. INTERNAL CONTROL UNIT ......................................................................................................... 94
11. INTERNAL AUDIT AND AUDIT COMMITTEES ............................................................................. 94
12. AUDIT COMMITTEE REPORT ..................................................................................................... 96
PART D: HUMAN RESOURCE MANAGEMENT ............................................................... 98
1. INTRODUCTION ......................................................................................................................... 99
2. OVERVIEW OF HUMAN RESOURCES ......................................................................................... 99
3. HUMAN RESOURCES OVERSIGHT STATISTICS ......................................................................... 101
PART E: FINANCIAL INFORMATION.............................................................................. 132
1. REPORT OF THE AUDITOR GENERAL ....................................................................................... 133
2. ANNUAL FINANCIAL STATEMENTS .......................................................................................... 144

3
Annual Report for 2018/19 Financial Year Vote 04: Department of Education
Province of the Northern Cape
2
Contents PART A: GENERAL INFORMATION .................................................................................. 4
1. DEPARTMENT GENERAL INFORMATION ..................................................................................... 5
2. LIST OF ABBREVIATIONS/ACRONYMS ......................................................................................... 6
3. FOREWORD BY THE MEC ............................................................................................................ 8
4. REPORT OF THE ACCOUNTING OFFICER ................................................................................... 11
5. STATEMENT OF RESPONSIBILITY AND CONFIRMATION OF ACCURACY FOR THE ANNUAL REPORT.................................................................................................................................................. 17
6. STRATEGIC OVERVIEW .............................................................................................................. 18
7. LEGISLATIVE AND OTHER MANDATES ...................................................................................... 18
8. ORGANISATIONAL STRUCTURE ................................................................................................. 19
9. ENTITIES REPORTING TO THE MEC ........................................................................................... 19
PART B: PERFORMANCE INFORMATION ....................................................................... 20
1. AUDITOR GENERAL’S REPORT: PREDETERMINED OBJECTIVES ................................................. 21
2. OVERVIEW OF DEPARTMENTAL PERFORMANCE ...................................................................... 21
2.1 Service Delivery Environment ........................................................................................... 21
2.2 Service Delivery Improvement Plan .................................................................................. 23
2.3 Organisational environment ............................................................................................. 25
2.4 Key policy developments and legislative changes ............................................................ 27
3. STRATEGIC OUTCOME ORIENTED GOALS ................................................................................. 27
4. PERFORMANCE INFORMATION BY PROGRAMME .................................................................... 29
4.1 Programme 1: ADMINISTRATION ..................................................................................... 29
4.2 Programme 2: PUBLIC ORDINARY SCHOOL EDUCATION .................................................. 42
4.3 Programme 3: INDEPENDENT SCHOOL SUBSIDIES ........................................................... 53
4.4 Programme 4: PUBLIC SPECIAL SCHOOL EDUCATION ...................................................... 57
4.5 Programme 5: EARLY CHILDHOOD DEVELOPMENT .......................................................... 60
4.6 Programme 6: INFRASTRUCTURE DEVELOPMENT ............................................................ 64
4.7 Programme 7: EXAMINATION AND EDUCATION-RELATED SERVICES .............................. 75
5. TRANSFER PAYMENTS ............................................................................................................... 81
6. CONDITIONAL GRANTS ............................................................................................................. 81
7. DONOR FUNDS .......................................................................................................................... 85
8. CAPITAL INVESTMENT ............................................................................................................... 86
PART C: GOVERNANCE ................................................................................................... 88
1. INTRODUCTION ......................................................................................................................... 89
Annual Report for 2018/19 Financial Year Vote 04: Department of Education
Province of the Northern Cape
3
2. RISK MANAGEMENT .................................................................................................................. 89
3. FRAUD AND CORRUPTION ........................................................................................................ 89
4. MINIMISING CONFLICT OF INTEREST ........................................................................................ 90
5. CODE OF CONDUCT ................................................................................................................... 90
6. HEALTH, SAFETY AND ENVIRONMENTAL ISSUES ...................................................................... 90
7. PORTFOLIO COMMITTEES ......................................................................................................... 91
8. SCOPA RESOLUTIONS ................................................................................................................ 91
9. PRIOR MODIFICATIONS TO AUDIT REPORTS ............................................................................ 92
10. INTERNAL CONTROL UNIT ......................................................................................................... 94
11. INTERNAL AUDIT AND AUDIT COMMITTEES ............................................................................. 94
12. AUDIT COMMITTEE REPORT ..................................................................................................... 96
PART D: HUMAN RESOURCE MANAGEMENT ............................................................... 98
1. INTRODUCTION ......................................................................................................................... 99
2. OVERVIEW OF HUMAN RESOURCES ......................................................................................... 99
3. HUMAN RESOURCES OVERSIGHT STATISTICS ......................................................................... 101
PART E: FINANCIAL INFORMATION.............................................................................. 132
1. REPORT OF THE AUDITOR GENERAL ....................................................................................... 133
2. ANNUAL FINANCIAL STATEMENTS .......................................................................................... 144

4
Annual Report for 2018/19 Financial Year Vote 04: Department of Education
Province of the Northern Cape
4
PART A: GENERAL INFORMATION
Annual Report for 2018/19 Financial Year Vote 04: Department of Education
Province of the Northern Cape
5
1. DEPARTMENT GENERAL INFORMATION
PHYSICAL ADDRESS: IK Nkoane Education House
156 Barkly Road
KIMBERLEY
8301
POSTAL ADDRESS: Private Bag X5029
KIMBERLEY
8300
TELEPHONE NUMBER/S: 053 839 6500
FAX NUMBER: 053 839 6580/1
EMAIL ADDRESS: [email protected]
WEBSITE ADDRESS : www.ncdoe.ncpg.gov.za

5
Annual Report for 2018/19 Financial Year Vote 04: Department of Education
Province of the Northern Cape
4
PART A: GENERAL INFORMATION
Annual Report for 2018/19 Financial Year Vote 04: Department of Education
Province of the Northern Cape
5
1. DEPARTMENT GENERAL INFORMATION
PHYSICAL ADDRESS: IK Nkoane Education House
156 Barkly Road
KIMBERLEY
8301
POSTAL ADDRESS: Private Bag X5029
KIMBERLEY
8300
TELEPHONE NUMBER/S: 053 839 6500
FAX NUMBER: 053 839 6580/1
EMAIL ADDRESS: [email protected]
WEBSITE ADDRESS : www.ncdoe.ncpg.gov.za

6
Annual Report for 2018/19 Financial Year Vote 04: Department of Education
Province of the Northern Cape
6
2. LIST OF ABBREVIATIONS/ACRONYMS
ABET: Adult Basic Education and Training IIAL: Incremental Introduction of African Language. ACE: Advanced Certificate in Education IMGD: Institutional Management and Governance
Development ANA: Annual National Assessment I-SAMS: Integrated School Administration
and Management System ASIDI: Accelerated School Infrastructure Development Initiative
IQMS: Integrated Quality Management System
CEM: Council of Education Ministers KM: Knowledge Management CEMIS: Central Education Management Information System
LSEN: Learners with Special Education Needs
CIPELT: Certificate in Primary English Learning and Teaching.
LTSM: Learning and Teaching Support Materials
DCSID: Differentiated Curriculum for the Severely Intellectually Disabled.
MEO: Multiple Examination Opportunity
DHET: Department of Higher Education and Training
MTEF: Medium-Term Expenditure Framework
DST: Department of Science and Technology
MST: Mathematics, Science and Technology
DTSL: Department of Transport, Safety and Liaison
NCS: National Curriculum Statement
DBE: Department of Basic Education NC (V): National Curriculum (Vocational) DEMIS: District Education Management Information System
NECT: National Education Collaboration Trust
ECD: Early Childhood Development NEPA: National Education Policy Act EE: Employment Equity NGO: Non-Governmental Organisation EEYS: Eskom Expo for Young Scientists NPDE : National Professional Diploma in Education EIG: Education Infrastructure Grant NQF: National Qualifications Framework EMIS: Education Management Information System
NSC: National Senior Certificate
EPP: Education Provisioning Plan NSNP: National School Nutrition Programme EPWP: Expanded Public Works Programme
OHSA: Occupational Health and Safety Act
ETDP: Education, Training and Development Practices
PFMA: Public Finance Management Act
EWP: Employee Wellness Programme PILIR: Policy on Incapacity Leave and Ill-Health Retirement
FAL: First Additional Language PPI: Programme Performance Indicator FET: Further Education and Training PPP: Public-Private Partnership GET: General Education and Training PPM: Programme Performance Measure HEI: Higher Education Institution PSRIP: Primary School Reading Intervention
Programme ICT: Information and Communication Technology
RCL: Representative Council of Learners
Annual Report for 2018/19 Financial Year Vote 04: Department of Education
Province of the Northern Cape
7
SAASTA: South African Agency for Science and Technology Advancement
SETA: Sector Education and Training Authority
SACE: South African Council for Educators SGB: School Governing Body SAICA: South African Institute for Chartered Accountants
SID: Severe Intellectual Disability
SAPESI: South African Primary Education Support Initiative
SITA: State Information Technology Agency
SAQA: South African Qualifications Authority
SMT: School Management Team
SASA: South African Schools’ Act SNE: Special Needs Education SA-SAMS: South African School Administration and Management System
SPMDS: Staff Performance Management and Development System
SAPS: South African Police Services TUC: Teacher Union Collaboration SBA: School-based Assessment WSE: Whole School Evaluation

7
Annual Report for 2018/19 Financial Year Vote 04: Department of Education
Province of the Northern Cape
6
2. LIST OF ABBREVIATIONS/ACRONYMS
ABET: Adult Basic Education and Training IIAL: Incremental Introduction of African Language. ACE: Advanced Certificate in Education IMGD: Institutional Management and Governance
Development ANA: Annual National Assessment I-SAMS: Integrated School Administration
and Management System ASIDI: Accelerated School Infrastructure Development Initiative
IQMS: Integrated Quality Management System
CEM: Council of Education Ministers KM: Knowledge Management CEMIS: Central Education Management Information System
LSEN: Learners with Special Education Needs
CIPELT: Certificate in Primary English Learning and Teaching.
LTSM: Learning and Teaching Support Materials
DCSID: Differentiated Curriculum for the Severely Intellectually Disabled.
MEO: Multiple Examination Opportunity
DHET: Department of Higher Education and Training
MTEF: Medium-Term Expenditure Framework
DST: Department of Science and Technology
MST: Mathematics, Science and Technology
DTSL: Department of Transport, Safety and Liaison
NCS: National Curriculum Statement
DBE: Department of Basic Education NC (V): National Curriculum (Vocational) DEMIS: District Education Management Information System
NECT: National Education Collaboration Trust
ECD: Early Childhood Development NEPA: National Education Policy Act EE: Employment Equity NGO: Non-Governmental Organisation EEYS: Eskom Expo for Young Scientists NPDE : National Professional Diploma in Education EIG: Education Infrastructure Grant NQF: National Qualifications Framework EMIS: Education Management Information System
NSC: National Senior Certificate
EPP: Education Provisioning Plan NSNP: National School Nutrition Programme EPWP: Expanded Public Works Programme
OHSA: Occupational Health and Safety Act
ETDP: Education, Training and Development Practices
PFMA: Public Finance Management Act
EWP: Employee Wellness Programme PILIR: Policy on Incapacity Leave and Ill-Health Retirement
FAL: First Additional Language PPI: Programme Performance Indicator FET: Further Education and Training PPP: Public-Private Partnership GET: General Education and Training PPM: Programme Performance Measure HEI: Higher Education Institution PSRIP: Primary School Reading Intervention
Programme ICT: Information and Communication Technology
RCL: Representative Council of Learners
Annual Report for 2018/19 Financial Year Vote 04: Department of Education
Province of the Northern Cape
7
SAASTA: South African Agency for Science and Technology Advancement
SETA: Sector Education and Training Authority
SACE: South African Council for Educators SGB: School Governing Body SAICA: South African Institute for Chartered Accountants
SID: Severe Intellectual Disability
SAPESI: South African Primary Education Support Initiative
SITA: State Information Technology Agency
SAQA: South African Qualifications Authority
SMT: School Management Team
SASA: South African Schools’ Act SNE: Special Needs Education SA-SAMS: South African School Administration and Management System
SPMDS: Staff Performance Management and Development System
SAPS: South African Police Services TUC: Teacher Union Collaboration SBA: School-based Assessment WSE: Whole School Evaluation

8
Annual Report for 2018/19 Financial Year Vote 04: Department of Education
Province of the Northern Cape
8
3. FOREWORD BY THE MEC The year 2018 was declared as the centenary celebration of two of South Africa’s greatest visionaries and struggle icons of their time, Tata Nelson Mandela and Mama Albertina Sisulu, who believed that the destiny and prosperity of this country is birthed in the classroom. It was Nelson Mandela who said: “Education is the most powerful weapon which you can use to change the world”. We present our 2018/19 Annual Report as a barometer to measure the progress made since last year. We do so with a high level of excitement because we believe that we are confronting our challenges with unparalleled success. The Medium Term Strategy Framework (MTSF 2014-19) continues to guide and direct the activities of the Department in particular, and the Sector in general. Despite South Africa’s globally recognised, progressive and equitable policies on school funding, broader societal poverty and inequalities persist, and these have an effect on learner performance. The painful and unequal history of our country is not proving easy to transform quickly. The public discourse on the schooling system creates an impression that not much has changed – that challenges continue to persist in the same size and nature. However, the system is dynamic and changes have occurred, some subtle, and some more obvious – but in most cases, these changes have been in the right direction, towards ensuring we have a stable system. Governance and capacity in the administration of public services has been identified as a constraint in the concurrent arrangements in the Education Sector. We have had to work more efficiently and smartly to ensure that improving learning outcomes drives all our endeavours. In responding to the Government’s strategic plan (Medium-Term Strategic Framework 2014-2019), the Department is responsible for Outcome 1 (Quality Basic Education) and collaborates with other Departments on Outcome 7 (Rural Development) in respect of Infrastructure and the National School Nutrition Programme (NSNP), Outcome 13 (Social Protection) in respect of Early Childhood Development (ECD) and Outcome 14 (Nation Building) in respect of Fostering Constitutional Values and Promoting Social Cohesion. Substantial progress has been made towards achieving the set targets. However, there is still a need for the sector to strengthen processes, systems and tools. A more rigorous effort should be undertaken to improve Inter-departmental co-ordination to ensure effective collaborative work. For the 2019/20 MTEF period, the following will continue to be priorities of the Department:
Improved quality of teaching and learning through development, supply and effective utilisation of teachers.
Improved quality of teaching and learning through provision of adequate, quality infrastructure and Learning and Teaching Support Materials (LTSM).
Tracking of learner performance through reporting and analysis of the Annual National Assessment (ANA) at Grades 3, 6 and 9 level and improving ANA over time to ensure appropriate feedback to learners and teachers and to benchmark performance over time.
Expanded access to Early Childhood Development and improvement of the quality of Grade R. Strengthening accountability and improving management at the school, community and district
level. Partnerships for education reform and improved quality
National Senior Certificate Examination In 2018, a total of 12 157 full-time candidates were registered for the National Senior Certificate (NSC) Examination in the Northern Cape Province. In comparison to 2017, it represents an increase of 1 638 candidates. A total of 9 909 candidates, compared to the 8 735 candidates the previous year, including progressed learners completed the NSC exams. 7 264 candidates passed, which is 656 more candidates compared to the previous year. This brought the overall pass rate to 73.3%, which is a decline of 2.3%. The overall pass rate, excluding our progressed learners is 75.2%. A total of 2 091 progressed learners made use of the Multiple Examination Opportunity (MEO), therefore their results will only be taken into consideration once they have completed the NSC Examination. A
Annual Report for 2018/19 Financial Year Vote 04: Department of Education
Province of the Northern Cape
9
total of 532 progressed learners opted to complete the 2018 NSC examinations, of which 214 learners obtained their National Senior Certificate and reflects a pass rate of 40.2%, a 12.6% decrease in comparison to 2017. These learners obtained 14 bachelor passes, 82 diploma passes and 118 higher certificate passes. Of the 9 909 full time candidates that wrote and completed the NSC Examination, the number of distinctions increased from 1 538 in 2017 to 1 562 in 2018. The bachelor passes have also increased from 2 205 in 2017 to 2 589 in 2018. 2 798 candidates wrote Mathematics and 1 652 candidates passed which constitutes a pass rate of 59%, an increase of 1.7%. 2 259 candidates wrote Physical Science and 1 512 candidates passed which constitutes a pass rate of 66.9%, an increase of 10.1%. Early Childhood Development Grade R Practitioners from ECD centres across the Province were trained on the National Curriculum Framework (NCF). To ensure effective implementation of NCF, practitioners were supported through support visits and empowerment sessions. Information was shared with 437 community members through advocacy and awareness campaigns on NCF. The stipends of practitioners were increased as follows:
Practitioners with a Grade 12 certificate who are in the process of improving their qualifications moved from R6 000 to R6 300.
Practitioners with ECD NQF level 4 and 5 qualifications moved from R6 000 to R6 500 Practitioners with the Diploma in Grade R Teaching or REQV 13 qualifications and above
moved from R7 500 to R8 000.
Practitioners were supported in the implementation of CAPS through on-site visits, empowerment sessions and district cluster sessions. 90 practitioners, 5 mentors and 4 officials were trained on the Programme, and 2 provincial coordinators and 4 district officials mediated with 2 facilitators. 63 practitioners were monitored and supported. 17 practitioners completed their Diploma in Grade R Teaching in November 2019. The Curriculum Roadshow was conducted in January and February to prepare 610 Grade R practitioners for the 2019 academic year. Infrastructure Public Ordinary Schools The Department is in the process of addressing backlogs regarding the provisioning of classrooms in the Northern Cape. Three additional classrooms were completed within the 2018/19 financial year. A total of 35 schools underwent maintenance. The Department has commenced with the implementation of the 7-year-implementation plan that initiates the Upgrade of Water Supply Programme. 7 schools received upgrades. The Department has also commenced with the implementation of the 7-year-implementation plan that initiates the Upgrade of Electricity Programme in order to have sufficient electricity at schools. 5 schools received upgrades. In terms of the Ablution and Sanitation programme, 25 schools received upgrades where the existing facilities did not meet the minimum suitability for sanitation supply. The majority of schools received double ECD centres which are counted as 2 classrooms within one school. There are four ECD classrooms that were completed in the 2018/19 financial year. National School Nutrition Programme (NSNP) All learners in the 505 schools which applied to participate in the NSNP will be entitled to benefit from the programme (Grades R – 12). 265 458 learners had access to the NSNP meals. 505 SMME’s were contracted to provide schools with groceries and 1 615 food handlers volunteered to cook nutritious meals to learners. A total of 1 025 committee members, contact educators, food handlers and school management team (SMT) members were trained on the implementation of the programme. Sustainable food production encourages learners, educators and community members to develop food gardens. There are 225 sustainable food gardens in the Province.

9
Annual Report for 2018/19 Financial Year Vote 04: Department of Education
Province of the Northern Cape
8
3. FOREWORD BY THE MEC The year 2018 was declared as the centenary celebration of two of South Africa’s greatest visionaries and struggle icons of their time, Tata Nelson Mandela and Mama Albertina Sisulu, who believed that the destiny and prosperity of this country is birthed in the classroom. It was Nelson Mandela who said: “Education is the most powerful weapon which you can use to change the world”. We present our 2018/19 Annual Report as a barometer to measure the progress made since last year. We do so with a high level of excitement because we believe that we are confronting our challenges with unparalleled success. The Medium Term Strategy Framework (MTSF 2014-19) continues to guide and direct the activities of the Department in particular, and the Sector in general. Despite South Africa’s globally recognised, progressive and equitable policies on school funding, broader societal poverty and inequalities persist, and these have an effect on learner performance. The painful and unequal history of our country is not proving easy to transform quickly. The public discourse on the schooling system creates an impression that not much has changed – that challenges continue to persist in the same size and nature. However, the system is dynamic and changes have occurred, some subtle, and some more obvious – but in most cases, these changes have been in the right direction, towards ensuring we have a stable system. Governance and capacity in the administration of public services has been identified as a constraint in the concurrent arrangements in the Education Sector. We have had to work more efficiently and smartly to ensure that improving learning outcomes drives all our endeavours. In responding to the Government’s strategic plan (Medium-Term Strategic Framework 2014-2019), the Department is responsible for Outcome 1 (Quality Basic Education) and collaborates with other Departments on Outcome 7 (Rural Development) in respect of Infrastructure and the National School Nutrition Programme (NSNP), Outcome 13 (Social Protection) in respect of Early Childhood Development (ECD) and Outcome 14 (Nation Building) in respect of Fostering Constitutional Values and Promoting Social Cohesion. Substantial progress has been made towards achieving the set targets. However, there is still a need for the sector to strengthen processes, systems and tools. A more rigorous effort should be undertaken to improve Inter-departmental co-ordination to ensure effective collaborative work. For the 2019/20 MTEF period, the following will continue to be priorities of the Department:
Improved quality of teaching and learning through development, supply and effective utilisation of teachers.
Improved quality of teaching and learning through provision of adequate, quality infrastructure and Learning and Teaching Support Materials (LTSM).
Tracking of learner performance through reporting and analysis of the Annual National Assessment (ANA) at Grades 3, 6 and 9 level and improving ANA over time to ensure appropriate feedback to learners and teachers and to benchmark performance over time.
Expanded access to Early Childhood Development and improvement of the quality of Grade R. Strengthening accountability and improving management at the school, community and district
level. Partnerships for education reform and improved quality
National Senior Certificate Examination In 2018, a total of 12 157 full-time candidates were registered for the National Senior Certificate (NSC) Examination in the Northern Cape Province. In comparison to 2017, it represents an increase of 1 638 candidates. A total of 9 909 candidates, compared to the 8 735 candidates the previous year, including progressed learners completed the NSC exams. 7 264 candidates passed, which is 656 more candidates compared to the previous year. This brought the overall pass rate to 73.3%, which is a decline of 2.3%. The overall pass rate, excluding our progressed learners is 75.2%. A total of 2 091 progressed learners made use of the Multiple Examination Opportunity (MEO), therefore their results will only be taken into consideration once they have completed the NSC Examination. A
Annual Report for 2018/19 Financial Year Vote 04: Department of Education
Province of the Northern Cape
9
total of 532 progressed learners opted to complete the 2018 NSC examinations, of which 214 learners obtained their National Senior Certificate and reflects a pass rate of 40.2%, a 12.6% decrease in comparison to 2017. These learners obtained 14 bachelor passes, 82 diploma passes and 118 higher certificate passes. Of the 9 909 full time candidates that wrote and completed the NSC Examination, the number of distinctions increased from 1 538 in 2017 to 1 562 in 2018. The bachelor passes have also increased from 2 205 in 2017 to 2 589 in 2018. 2 798 candidates wrote Mathematics and 1 652 candidates passed which constitutes a pass rate of 59%, an increase of 1.7%. 2 259 candidates wrote Physical Science and 1 512 candidates passed which constitutes a pass rate of 66.9%, an increase of 10.1%. Early Childhood Development Grade R Practitioners from ECD centres across the Province were trained on the National Curriculum Framework (NCF). To ensure effective implementation of NCF, practitioners were supported through support visits and empowerment sessions. Information was shared with 437 community members through advocacy and awareness campaigns on NCF. The stipends of practitioners were increased as follows:
Practitioners with a Grade 12 certificate who are in the process of improving their qualifications moved from R6 000 to R6 300.
Practitioners with ECD NQF level 4 and 5 qualifications moved from R6 000 to R6 500 Practitioners with the Diploma in Grade R Teaching or REQV 13 qualifications and above
moved from R7 500 to R8 000.
Practitioners were supported in the implementation of CAPS through on-site visits, empowerment sessions and district cluster sessions. 90 practitioners, 5 mentors and 4 officials were trained on the Programme, and 2 provincial coordinators and 4 district officials mediated with 2 facilitators. 63 practitioners were monitored and supported. 17 practitioners completed their Diploma in Grade R Teaching in November 2019. The Curriculum Roadshow was conducted in January and February to prepare 610 Grade R practitioners for the 2019 academic year. Infrastructure Public Ordinary Schools The Department is in the process of addressing backlogs regarding the provisioning of classrooms in the Northern Cape. Three additional classrooms were completed within the 2018/19 financial year. A total of 35 schools underwent maintenance. The Department has commenced with the implementation of the 7-year-implementation plan that initiates the Upgrade of Water Supply Programme. 7 schools received upgrades. The Department has also commenced with the implementation of the 7-year-implementation plan that initiates the Upgrade of Electricity Programme in order to have sufficient electricity at schools. 5 schools received upgrades. In terms of the Ablution and Sanitation programme, 25 schools received upgrades where the existing facilities did not meet the minimum suitability for sanitation supply. The majority of schools received double ECD centres which are counted as 2 classrooms within one school. There are four ECD classrooms that were completed in the 2018/19 financial year. National School Nutrition Programme (NSNP) All learners in the 505 schools which applied to participate in the NSNP will be entitled to benefit from the programme (Grades R – 12). 265 458 learners had access to the NSNP meals. 505 SMME’s were contracted to provide schools with groceries and 1 615 food handlers volunteered to cook nutritious meals to learners. A total of 1 025 committee members, contact educators, food handlers and school management team (SMT) members were trained on the implementation of the programme. Sustainable food production encourages learners, educators and community members to develop food gardens. There are 225 sustainable food gardens in the Province.

10
Annual Report for 2018/19 Financial Year Vote 04: Department of Education
Province of the Northern Cape
10
The aim of Nutrition education is to promote healthy eating habits and lifestyles in schools and communities. 890 food handlers were trained on meal preparation and food safety. 110 293 Grade R – 7 primary school learners were dewormed in all the five districts. Inclusive Education There are currently 2 097 of learners enrolled in Special Schools. In mainstream schools 456 learners were assessed and are being supported in their current schools. Eight of the eleven Special schools, are utilised as Resource Centres. A separate basket of posts was created for post provisioning of special schools with the result, all special schools are receiving a favourable learner teacher ratio of ten to one (10:1). Outreach programmes for these resource centres are facilitated by the Head Office staff e.g. Autism Workshop. A total of 1 727 educators were trained during the 2018/19 financial year. Well-coordinated training programmes were rendered to educators on different topics of inclusion. The purpose of the training was to enable educators to support learners who experience barriers to learning. The Department currently has 26 Full Service Schools. The Full Service School development has taken place in terms of staff development and support. The Department has 8 Skills Centres meant for Learners with Profound to Severe Intellectual Disabilities (LSPID). In conclusion, we recognise and acknowledge the dedication and tireless contribution shown by our officials, teachers, Teacher Unions, Principals’ Associations, School Governing Body Associations, Learner Representative Councils, learner formations, civil society, parents and guardians of learners as well as the private sector in helping us achieve Government’s apex priority, which is Improved Quality of Basic Education. All of us have a duty to ensure that the right of our learners to quality, effective, inclusive, and efficient basic education is not negotiable. We will continue working towards a stable system that looks at the holistic development of a child – our future leaders. We are hereby pleased to present the Annual Report of the Department of Education for the 2018/19 Financial Year.
Annual Report for 2018/19 Financial Year Vote 04: Department of Education
Province of the Northern Cape
11
4. REPORT OF THE ACCOUNTING OFFICER 4.1 Overview of the operations of the Department: The 2018/19 Annual Report seeks to outline the highlights, achievements and challenges of the financial year. The Accounting Officer and Management of the Department are pleased to present to stakeholders the annual report on the operations and financial results for the year under review. This report concludes our commitment in terms of the Government’s five year implementation cycle of the Medium-Term Strategic Framework (MTSF) 2014 to 2019. Coinciding with the celebration of our successful 25 years since the dawn of democracy, we are recommitting ourselves to the 2019 to 2024 Medium Term Strategic Framework. The report seeks to provide a detailed assessment of the Department’s performance in terms of service delivery outcomes and outputs as well as Departmental objectives as set out in the Government’s Medium Term Strategic Plan 2014 to 2019. The 2018/19 reporting period presented the Northern Cape Department of Education with unique challenges that made it difficult to operate. The domestic growth forecasts over the medium term government’s three-year budgeting window were revised downwards by National Treasury. The expenditure ceiling was reduced drastically over the Medium Term Expenditure Framework (MTEF) and is still projected to reduce even further in the 2019/20 MTEF. The Department has been operating within an environment of increasing resource constraints due to a reduced fiscal base and growing demand for essential services. Peculiar to the sector, the Department has registered a notable growth in learner numbers at an average of 1.1 percent year on year during the 2013 to 2019 MTSF. The growth in learner numbers is inversely proportional to the baseline allocation of the Department. This intrinsically places a strain on the compensation of employees’ budget as educator allocations are largely dependent on the learner numbers. The Department continues to deliver its constitutional mandate, to ensure quality education to all learners of the Northern Cape. The Department’s budget had to be reprioritised and enforce efficiency measures across all programmes. Amidst the challenges, it is with pride that the Department reports significant improvements in the financial management ability of the Department. Our performance displays a continuous improvement year-on-year with the Department having received four favourable unqualified audit reports in a row since 201415 as well as consistent improvement in Management Performance Assessment Tool (MPAT) score since 2012 with a score of 3.2 in 2018.

11
Annual Report for 2018/19 Financial Year Vote 04: Department of Education
Province of the Northern Cape
10
The aim of Nutrition education is to promote healthy eating habits and lifestyles in schools and communities. 890 food handlers were trained on meal preparation and food safety. 110 293 Grade R – 7 primary school learners were dewormed in all the five districts. Inclusive Education There are currently 2 097 of learners enrolled in Special Schools. In mainstream schools 456 learners were assessed and are being supported in their current schools. Eight of the eleven Special schools, are utilised as Resource Centres. A separate basket of posts was created for post provisioning of special schools with the result, all special schools are receiving a favourable learner teacher ratio of ten to one (10:1). Outreach programmes for these resource centres are facilitated by the Head Office staff e.g. Autism Workshop. A total of 1 727 educators were trained during the 2018/19 financial year. Well-coordinated training programmes were rendered to educators on different topics of inclusion. The purpose of the training was to enable educators to support learners who experience barriers to learning. The Department currently has 26 Full Service Schools. The Full Service School development has taken place in terms of staff development and support. The Department has 8 Skills Centres meant for Learners with Profound to Severe Intellectual Disabilities (LSPID). In conclusion, we recognise and acknowledge the dedication and tireless contribution shown by our officials, teachers, Teacher Unions, Principals’ Associations, School Governing Body Associations, Learner Representative Councils, learner formations, civil society, parents and guardians of learners as well as the private sector in helping us achieve Government’s apex priority, which is Improved Quality of Basic Education. All of us have a duty to ensure that the right of our learners to quality, effective, inclusive, and efficient basic education is not negotiable. We will continue working towards a stable system that looks at the holistic development of a child – our future leaders. We are hereby pleased to present the Annual Report of the Department of Education for the 2018/19 Financial Year.
Annual Report for 2018/19 Financial Year Vote 04: Department of Education
Province of the Northern Cape
11
4. REPORT OF THE ACCOUNTING OFFICER 4.1 Overview of the operations of the Department: The 2018/19 Annual Report seeks to outline the highlights, achievements and challenges of the financial year. The Accounting Officer and Management of the Department are pleased to present to stakeholders the annual report on the operations and financial results for the year under review. This report concludes our commitment in terms of the Government’s five year implementation cycle of the Medium-Term Strategic Framework (MTSF) 2014 to 2019. Coinciding with the celebration of our successful 25 years since the dawn of democracy, we are recommitting ourselves to the 2019 to 2024 Medium Term Strategic Framework. The report seeks to provide a detailed assessment of the Department’s performance in terms of service delivery outcomes and outputs as well as Departmental objectives as set out in the Government’s Medium Term Strategic Plan 2014 to 2019. The 2018/19 reporting period presented the Northern Cape Department of Education with unique challenges that made it difficult to operate. The domestic growth forecasts over the medium term government’s three-year budgeting window were revised downwards by National Treasury. The expenditure ceiling was reduced drastically over the Medium Term Expenditure Framework (MTEF) and is still projected to reduce even further in the 2019/20 MTEF. The Department has been operating within an environment of increasing resource constraints due to a reduced fiscal base and growing demand for essential services. Peculiar to the sector, the Department has registered a notable growth in learner numbers at an average of 1.1 percent year on year during the 2013 to 2019 MTSF. The growth in learner numbers is inversely proportional to the baseline allocation of the Department. This intrinsically places a strain on the compensation of employees’ budget as educator allocations are largely dependent on the learner numbers. The Department continues to deliver its constitutional mandate, to ensure quality education to all learners of the Northern Cape. The Department’s budget had to be reprioritised and enforce efficiency measures across all programmes. Amidst the challenges, it is with pride that the Department reports significant improvements in the financial management ability of the Department. Our performance displays a continuous improvement year-on-year with the Department having received four favourable unqualified audit reports in a row since 201415 as well as consistent improvement in Management Performance Assessment Tool (MPAT) score since 2012 with a score of 3.2 in 2018.

12
Annual Report for 2018/19 Financial Year Vote 04: Department of Education
Province of the Northern Cape
12
4.2 Overview of the financial results of the Department:
4.2.1 Departmental receipts
Departmental receipts
2018/19 2017/18
Estimate Actual
Amount Collected
(Over)/Under Collection Estimate
Actual Amount
Collected (Over)/Under
Collection
R’000 R’000 R’000 R’000 R’000 R’000 Tax Receipts - - - - - -
Casino taxes - - - - - - Horse racing taxes - - - - - - Liquor licences - - - - - - Motor vehicle licences - - - - - -
Sale of goods and services other than capital assets
5 569 6 013 (444) 5 431 5 708 (277)
Transfers received - - - - - - Fines, penalties and forfeits 20 38 (18) 127 2 125
Interest, dividends and rent on land 964 828 136 23 1 301 (1 278)
Sale of capital assets 400 - 400 - - - Financial transactions in assets and liabilities 2 483 664 1 819 4 596 2 628 1 968
Total 9 436 7 543 1 893 10 177 9 639 538
The Department of Education is not a revenue generating Department. Main source of Departmental receipts under Sale of goods and services other than capital assets are for commission earned on insurance and garnishee deductions, rental from state-owned dwellings and the re-issuing of matric certificates. Other sources of revenue under the same item are examination and re-marking fees, sale of tender documents and parking. Fines, penalties and forfeits revenue is deductions from officials’ salaries for labour relations issues. Revenue from interest, dividends and rent on land is surrenders from Independent Development Trust (IDT) for interest earned on Departmental funds. Revenue reflected under financial transactions in assets and liabilities relates to receipts from prior years. The only tariff charged to the public is for requests to re-issue matric certificates, which is payable to UMALUSI.
4.2.2 Programme Expenditure
Programme Name
2018/19 2017/18 Final
Appropriation Actual
Expenditure (Over)/ Under Expenditure
Final Appropriation
Actual Expenditure
(Over)/Under Expenditure
R’000 R’000 R’000 R’000 R’000 R’000 Administration 660 440 663 742 (3 302) 627 956 618 060 9 896 Public Ordinary School Education
4 786 657 4 797 563 (10 906) 4 266 601 4 384 763 (118 162)
Independent School Education
9 599 9 599 - 9 164 9 164 -
Annual Report for 2018/19 Financial Year Vote 04: Department of Education
Province of the Northern Cape
13
Programme Name
2018/19 2017/18 Final
Appropriation Actual
Expenditure (Over)/ Under Expenditure
Final Appropriation
Actual Expenditure
(Over)/Under Expenditure
R’000 R’000 R’000 R’000 R’000 R’000 Public Special School Education
159 741 160 586 (845) 140 931 141 803 (872)
Early Childhood Development
98 461 98 461 - 94 273 94 273 -
Infrastructure Development 568 428 567 898 530 612 267 609 595 2 672
Examination and Education Related Services
154 226 157 833 (3 607) 144 927 148 647 (3 720)
Total 6 437 552 6 455 682 (18 130) 5 896 119 6 006 305 (110 186)
The Department recorded an over expenditure of R18.130 million or spent 100.3% of its final appropriation of R6.437 billion as at the end of the 2018/19 financial year. Reasons for spending variances is listed in notes to the appropriation statement. Programme 1: Administration spent 100.5% or R663.742 million of its final appropriation of R660.440 million. Programme 2: Public Ordinary School Education recorded an over expenditure of R10.906 million or spent 100.2% of the Programme’s final appropriation of R4.786 billion. Programme 3: Independent Schools spent 100% of its final appropriations. Programme 4: Public Special Schools Education overspent its final appropriation of R159.741 million with R845 thousand or 0.5% of its final appropriation. Programme 5: Early Childhood Development spent 100% of its final allocation. Programme 6: Infrastructure Development underspent its final appropriation of R568.428 million with R530 thousand or 0.01% of its final appropriation. Programme 7: Auxiliary and Associated Services overspent its final appropriation of R154.226 million by R3.607 million or 2.3% of the final appropriation. 4.2.3 Virements / rollovers Virements have been effected in terms of Section 43 of the Public Finance Management Act, 1999 and is reflected in table below:
2018/19 Adjusted
Appropriation Shifting of
Funds Virement Final Appropriation
R’000 R’000 R’000 R’000 1. Administration Current payment 630 778 (787) 3 353 633 348 Transfers and subsidies 628 787 - 1 415 Payments for capital assets 21 266 - 4 415 25 681
Total for Programme 652 672 - 7 768 660 440
2. Public Ordinary School Education
Current payment 4 367 368 (9 989) (1 898) 4 355 481 Transfers and subsidies 420 623 9 824 1 `430 448

13
Annual Report for 2018/19 Financial Year Vote 04: Department of Education
Province of the Northern Cape
12
4.2 Overview of the financial results of the Department:
4.2.1 Departmental receipts
Departmental receipts
2018/19 2017/18
Estimate Actual
Amount Collected
(Over)/Under Collection Estimate
Actual Amount
Collected (Over)/Under
Collection
R’000 R’000 R’000 R’000 R’000 R’000 Tax Receipts - - - - - -
Casino taxes - - - - - - Horse racing taxes - - - - - - Liquor licences - - - - - - Motor vehicle licences - - - - - -
Sale of goods and services other than capital assets
5 569 6 013 (444) 5 431 5 708 (277)
Transfers received - - - - - - Fines, penalties and forfeits 20 38 (18) 127 2 125
Interest, dividends and rent on land 964 828 136 23 1 301 (1 278)
Sale of capital assets 400 - 400 - - - Financial transactions in assets and liabilities 2 483 664 1 819 4 596 2 628 1 968
Total 9 436 7 543 1 893 10 177 9 639 538
The Department of Education is not a revenue generating Department. Main source of Departmental receipts under Sale of goods and services other than capital assets are for commission earned on insurance and garnishee deductions, rental from state-owned dwellings and the re-issuing of matric certificates. Other sources of revenue under the same item are examination and re-marking fees, sale of tender documents and parking. Fines, penalties and forfeits revenue is deductions from officials’ salaries for labour relations issues. Revenue from interest, dividends and rent on land is surrenders from Independent Development Trust (IDT) for interest earned on Departmental funds. Revenue reflected under financial transactions in assets and liabilities relates to receipts from prior years. The only tariff charged to the public is for requests to re-issue matric certificates, which is payable to UMALUSI.
4.2.2 Programme Expenditure
Programme Name
2018/19 2017/18 Final
Appropriation Actual
Expenditure (Over)/ Under Expenditure
Final Appropriation
Actual Expenditure
(Over)/Under Expenditure
R’000 R’000 R’000 R’000 R’000 R’000 Administration 660 440 663 742 (3 302) 627 956 618 060 9 896 Public Ordinary School Education
4 786 657 4 797 563 (10 906) 4 266 601 4 384 763 (118 162)
Independent School Education
9 599 9 599 - 9 164 9 164 -
Annual Report for 2018/19 Financial Year Vote 04: Department of Education
Province of the Northern Cape
13
Programme Name
2018/19 2017/18 Final
Appropriation Actual
Expenditure (Over)/ Under Expenditure
Final Appropriation
Actual Expenditure
(Over)/Under Expenditure
R’000 R’000 R’000 R’000 R’000 R’000 Public Special School Education
159 741 160 586 (845) 140 931 141 803 (872)
Early Childhood Development
98 461 98 461 - 94 273 94 273 -
Infrastructure Development 568 428 567 898 530 612 267 609 595 2 672
Examination and Education Related Services
154 226 157 833 (3 607) 144 927 148 647 (3 720)
Total 6 437 552 6 455 682 (18 130) 5 896 119 6 006 305 (110 186)
The Department recorded an over expenditure of R18.130 million or spent 100.3% of its final appropriation of R6.437 billion as at the end of the 2018/19 financial year. Reasons for spending variances is listed in notes to the appropriation statement. Programme 1: Administration spent 100.5% or R663.742 million of its final appropriation of R660.440 million. Programme 2: Public Ordinary School Education recorded an over expenditure of R10.906 million or spent 100.2% of the Programme’s final appropriation of R4.786 billion. Programme 3: Independent Schools spent 100% of its final appropriations. Programme 4: Public Special Schools Education overspent its final appropriation of R159.741 million with R845 thousand or 0.5% of its final appropriation. Programme 5: Early Childhood Development spent 100% of its final allocation. Programme 6: Infrastructure Development underspent its final appropriation of R568.428 million with R530 thousand or 0.01% of its final appropriation. Programme 7: Auxiliary and Associated Services overspent its final appropriation of R154.226 million by R3.607 million or 2.3% of the final appropriation. 4.2.3 Virements / rollovers Virements have been effected in terms of Section 43 of the Public Finance Management Act, 1999 and is reflected in table below:
2018/19 Adjusted
Appropriation Shifting of
Funds Virement Final Appropriation
R’000 R’000 R’000 R’000 1. Administration Current payment 630 778 (787) 3 353 633 348 Transfers and subsidies 628 787 - 1 415 Payments for capital assets 21 266 - 4 415 25 681
Total for Programme 652 672 - 7 768 660 440
2. Public Ordinary School Education
Current payment 4 367 368 (9 989) (1 898) 4 355 481 Transfers and subsidies 420 623 9 824 1 `430 448

14
Annual Report for 2018/19 Financial Year Vote 04: Department of Education
Province of the Northern Cape
14
2018/19 Adjusted
Appropriation Shifting of
Funds Virement Final Appropriation
R’000 R’000 R’000 R’000 Payments for capital assets 647 165 (84) 728
Total for Programme 4 788 638 - (1 981) 4 786 657 3. Independent School Education Current payment - - - - Transfers and subsidies 9 600 - (1) 9 599 Payments for capital assets - - - -
Total for Programme 9 600 - (1) 9 599
4. Public Special School Education
Current payment 143 179 (849) 795 143 125 Transfers and subsidies 15 300 849 123 16 272 Payments for capital assets 519 - (175) 344
Total for Programme 158 998 - 743 159 741 5. Early Childhood Development Current payment 88 866 - (6 163) 82 703 Transfers and subsidies 14 640 - 1 118 15 758 Payments for capital assets 136 - (136) -
Total for Programme 103 642 - (5 181) 98 461 6. Infrastructure Development Current payment 245 809 (38 552) (12 214) 195 043 Transfers and subsidies - 101 - 101 Payments for capital assets 334 833 38 451 - 373 284
Total for Programme 580 642 - (12 214) 568 428
7. Examination and Education related Services
Current payment 109 812 780 11 123 121 715 Transfers and subsidies 33 060 (939) - 32 121 Payments for capital assets 488 159 (257) 390
Total for Programme 143 360 - 10 866 154 226 TOTAL 6 437 552 - - 6 437 552
Virements were approved by the Accounting Officer within the 8% threshold on the appropriation. The virements were mainly done to offset the over expenditure on Compensation of Employees incurred due to increased number of educator posts which were filled as a result of increased learner numbers. 4.2.4 Unauthorised, Irregular, Fruitless and Wasteful Expenditure
2018/19 Expenditure Amount R’000 Unauthorised Expenditure 18 818 Irregular Expenditure 313 891 Fruitless and Wasteful Expenditure 243
Unauthorised expenditure was largely due to: Increase in learner numbers which had an impact on the provision of additional educators,
classrooms and Learner Teacher Support Material (LTSM), and the payment of leave gratuities. There has been engagement with the relevant oversight structures to source additional funding or for a review of the Department’s baseline allocation, which has not grown in line with the increase in learner numbers over the past few years. Without this funding and review of the Department’s baseline allocation, unauthorised expenditure will not be eliminated.
Annual Report for 2018/19 Financial Year Vote 04: Department of Education
Province of the Northern Cape
15
Irregular expenditure was largely due to: Infrastructure implementing agents not following procurement prescripts for infrastructure capital
projects Learner transport contracts which was carried over from Department of Transport, Safety and
Liaison and which expires 31 December 2019 Non-compliance with SCM prescripts Fruitless and wasteful expenditure was as a result of: Interest paid on overdue accounts. 4.2.5 Future plans of the Department For the 2019/20 MTEF period, the following will continue to be priorities of the Department: Improved quality of teaching and learning through development, supply and effective utilisation of
teachers. Improved quality of teaching and learning through provision of adequate, quality infrastructure and
Learning and Teaching Support Materials (LTSM). Tracking of learner performance through reporting and analysis of the Systemic Evaluation Results
at Grades 3, 6 and 9 level and improving both formative and summative assessment over time to ensure appropriate feedback to learners and teachers and to benchmark performance over time.
Expanded access to Early Childhood Development (covered in Sub-Outcome 4) and improvement of the quality of Grade R.
Strengthening accountability and improving management at the school, community and district level.
Partnerships for education reform and improved quality Introduction and utilisation of ICTs in Curriculum through the acquisition and procurement of Edukite
hard- and software for Mathematics and Physical Science. 4.2.6 Public Private Partnerships The Department did not enter into any Public Private Partnerships for the year under review.
4.2.7 Discontinued activities / activities to be discontinued No discontinued activities for the year under review.
4.2.8 New or proposed activities The Early Childhood Development function is expected to be transferred to Department of Education from Department of Social Development.
4.2.9 Supply chain management
No unsolicited bids were received for the year under review. SCM processes of the Department are documented which, if fully complied with, would not result
in irregular expenditure being incurred. Outsourcing of infrastructure projects to infrastructure implementing agents do not always follow
SCM procedures which results in irregular expenditure for the Department. A revised Service Level Agreement was entered into with infrastructure implementing agents which included

15
Annual Report for 2018/19 Financial Year Vote 04: Department of Education
Province of the Northern Cape
14
2018/19 Adjusted
Appropriation Shifting of
Funds Virement Final Appropriation
R’000 R’000 R’000 R’000 Payments for capital assets 647 165 (84) 728
Total for Programme 4 788 638 - (1 981) 4 786 657 3. Independent School Education Current payment - - - - Transfers and subsidies 9 600 - (1) 9 599 Payments for capital assets - - - -
Total for Programme 9 600 - (1) 9 599
4. Public Special School Education
Current payment 143 179 (849) 795 143 125 Transfers and subsidies 15 300 849 123 16 272 Payments for capital assets 519 - (175) 344
Total for Programme 158 998 - 743 159 741 5. Early Childhood Development Current payment 88 866 - (6 163) 82 703 Transfers and subsidies 14 640 - 1 118 15 758 Payments for capital assets 136 - (136) -
Total for Programme 103 642 - (5 181) 98 461 6. Infrastructure Development Current payment 245 809 (38 552) (12 214) 195 043 Transfers and subsidies - 101 - 101 Payments for capital assets 334 833 38 451 - 373 284
Total for Programme 580 642 - (12 214) 568 428
7. Examination and Education related Services
Current payment 109 812 780 11 123 121 715 Transfers and subsidies 33 060 (939) - 32 121 Payments for capital assets 488 159 (257) 390
Total for Programme 143 360 - 10 866 154 226 TOTAL 6 437 552 - - 6 437 552
Virements were approved by the Accounting Officer within the 8% threshold on the appropriation. The virements were mainly done to offset the over expenditure on Compensation of Employees incurred due to increased number of educator posts which were filled as a result of increased learner numbers. 4.2.4 Unauthorised, Irregular, Fruitless and Wasteful Expenditure
2018/19 Expenditure Amount R’000 Unauthorised Expenditure 18 818 Irregular Expenditure 313 891 Fruitless and Wasteful Expenditure 243
Unauthorised expenditure was largely due to: Increase in learner numbers which had an impact on the provision of additional educators,
classrooms and Learner Teacher Support Material (LTSM), and the payment of leave gratuities. There has been engagement with the relevant oversight structures to source additional funding or for a review of the Department’s baseline allocation, which has not grown in line with the increase in learner numbers over the past few years. Without this funding and review of the Department’s baseline allocation, unauthorised expenditure will not be eliminated.
Annual Report for 2018/19 Financial Year Vote 04: Department of Education
Province of the Northern Cape
15
Irregular expenditure was largely due to: Infrastructure implementing agents not following procurement prescripts for infrastructure capital
projects Learner transport contracts which was carried over from Department of Transport, Safety and
Liaison and which expires 31 December 2019 Non-compliance with SCM prescripts Fruitless and wasteful expenditure was as a result of: Interest paid on overdue accounts. 4.2.5 Future plans of the Department For the 2019/20 MTEF period, the following will continue to be priorities of the Department: Improved quality of teaching and learning through development, supply and effective utilisation of
teachers. Improved quality of teaching and learning through provision of adequate, quality infrastructure and
Learning and Teaching Support Materials (LTSM). Tracking of learner performance through reporting and analysis of the Systemic Evaluation Results
at Grades 3, 6 and 9 level and improving both formative and summative assessment over time to ensure appropriate feedback to learners and teachers and to benchmark performance over time.
Expanded access to Early Childhood Development (covered in Sub-Outcome 4) and improvement of the quality of Grade R.
Strengthening accountability and improving management at the school, community and district level.
Partnerships for education reform and improved quality Introduction and utilisation of ICTs in Curriculum through the acquisition and procurement of Edukite
hard- and software for Mathematics and Physical Science. 4.2.6 Public Private Partnerships The Department did not enter into any Public Private Partnerships for the year under review.
4.2.7 Discontinued activities / activities to be discontinued No discontinued activities for the year under review.
4.2.8 New or proposed activities The Early Childhood Development function is expected to be transferred to Department of Education from Department of Social Development.
4.2.9 Supply chain management
No unsolicited bids were received for the year under review. SCM processes of the Department are documented which, if fully complied with, would not result
in irregular expenditure being incurred. Outsourcing of infrastructure projects to infrastructure implementing agents do not always follow
SCM procedures which results in irregular expenditure for the Department. A revised Service Level Agreement was entered into with infrastructure implementing agents which included

16
Annual Report for 2018/19 Financial Year Vote 04: Department of Education
Province of the Northern Cape
16
departmental officials serving on the bid committees of the implementing agents. 4.2.10 Gifts and Donations received in kind from non-related parties No gifts or donations were received in kind for the year under review.
4.2.11 Exemptions and deviations received from the National Treasury No exemptions from the PFMA, TR or deviation from financial reporting requirements were received from National Treasury for the year under review.
4.2.12 Events after the reporting date No events have occurred after reporting date.
4.2.13 Other No other material fact or circumstances that will have an effect on the understanding of the financial state of affairs which is not addressed elsewhere in this report. 4.2.14 Approval and sign off The Annual Financial Statements for the year ending 31 March 2019 as set out on pages 144 - 249 have been approved by the Accounting Officer.
…………………………………………… GT Pharasi Accounting Officer: Northern Cape Department of Education 31 May 2019
Annual Report for 2018/19 Financial Year Vote 04: Department of Education
Province of the Northern Cape
17
5. STATEMENT OF RESPONSIBILITY AND CONFIRMATION OF ACCURACY FOR THE ANNUAL REPORT
To the best of my knowledge and belief, I confirm the following: All information and amounts disclosed throughout the annual report are consistent. The annual report is complete, accurate and is free from any omissions. The annual report has been prepared in accordance with the guidelines on the annual report as issued by National Treasury. The Annual Financial Statements (Part E) have been prepared in accordance with the modified cash standard and the relevant frameworks and guidelines issued by the National Treasury. The Accounting Officer is responsible for the preparation of the annual financial statements and for the judgements made in this information. The Accounting Officer is responsible for establishing, and implementing a system of internal control that has been designed to provide reasonable assurance as to the integrity and reliability of the performance information, the human resources information and the annual financial statements. The external auditors are engaged to express an independent opinion on the annual financial statements. In my opinion, the annual report fairly reflects the operations, the performance information, the human resources information and the financial affairs of the Department for the financial year ended 31 March 2019.

17
Annual Report for 2018/19 Financial Year Vote 04: Department of Education
Province of the Northern Cape
16
departmental officials serving on the bid committees of the implementing agents. 4.2.10 Gifts and Donations received in kind from non-related parties No gifts or donations were received in kind for the year under review.
4.2.11 Exemptions and deviations received from the National Treasury No exemptions from the PFMA, TR or deviation from financial reporting requirements were received from National Treasury for the year under review.
4.2.12 Events after the reporting date No events have occurred after reporting date.
4.2.13 Other No other material fact or circumstances that will have an effect on the understanding of the financial state of affairs which is not addressed elsewhere in this report. 4.2.14 Approval and sign off The Annual Financial Statements for the year ending 31 March 2019 as set out on pages 144 - 249 have been approved by the Accounting Officer.
…………………………………………… GT Pharasi Accounting Officer: Northern Cape Department of Education 31 May 2019
Annual Report for 2018/19 Financial Year Vote 04: Department of Education
Province of the Northern Cape
17
5. STATEMENT OF RESPONSIBILITY AND CONFIRMATION OF ACCURACY FOR THE ANNUAL REPORT
To the best of my knowledge and belief, I confirm the following: All information and amounts disclosed throughout the annual report are consistent. The annual report is complete, accurate and is free from any omissions. The annual report has been prepared in accordance with the guidelines on the annual report as issued by National Treasury. The Annual Financial Statements (Part E) have been prepared in accordance with the modified cash standard and the relevant frameworks and guidelines issued by the National Treasury. The Accounting Officer is responsible for the preparation of the annual financial statements and for the judgements made in this information. The Accounting Officer is responsible for establishing, and implementing a system of internal control that has been designed to provide reasonable assurance as to the integrity and reliability of the performance information, the human resources information and the annual financial statements. The external auditors are engaged to express an independent opinion on the annual financial statements. In my opinion, the annual report fairly reflects the operations, the performance information, the human resources information and the financial affairs of the Department for the financial year ended 31 March 2019.

18
Annual Report for 2018/19 Financial Year Vote 04: Department of Education
Province of the Northern Cape
18
6. STRATEGIC OVERVIEW
6.1 Vision
A transformed quality education system.
6.2 Mission To deliver quality public education to all learners of the Northern Cape which will enable them to play a meaningful role in a dynamic, developmental and economic society
6.3 Values
Transparency – open to scrutiny by oversight structures in line with all relevant legislation
Excellence – striving towards outstanding standards of performance at all levels of delivery
Accountability - remaining answerable to the public and oversight structures of the Northern Cape
Caring – showing compassion for all our clients
Honesty - displaying irreproachable levels of truthfulness
Integrity – exceptional levels of honour
Needs-driven – being finely attuned to the needs of our clients
Goal-directed – in pursuance of the long-term plans of the country
7. LEGISLATIVE AND OTHER MANDATES Since 1994, a number of policies have been implemented and legislation promulgated to create a framework for transformation and the provision of quality public education and training. The following are some of the key policies and legislation:
• The Constitution of the Republic of South Africa Act, 1996 (Act No. 108 of 1996) • The National Education Policy Act, 1996 (Act No. 27 of 1996) • The South African Schools Act, 1996 (Act No. 84 of 1996) • The Further Education & Training Act, 1998 (Act No. 98 of 1998) • The Adult Basic Education & Training Act, 2000 (Act No. 52 of 2000) • The Employment of Educators Act, 1998 (Act No. 76 of 1998) • The Public Service Act, 1994 (Proc No. 103 of 1994) • The General and Further Education and Training Quality Assurance Act, 2001 (Act No. 58 of
2001) • The South African Qualifications Authority Act, 1995 (Act No. 58 of 1995) • Education White Paper 5 on Early Childhood Education (May 2001) and Education White Paper
6 on Special Needs Education – Building an Inclusive Education & Training System (July 2001) • National Curriculum Statement • The Northern Cape Schools Education Act, 1996 (Act No. 6 of 1996) • The Education Laws Amendment (Conduct of Matriculation Examinations) Act, (Act No. 4 of
1995) • The White Paper on Transforming Public Service Delivery (Batho Pele) (General Notice 18340
of 1 October 1997
Annual Report for 2018/19 Financial Year Vote 04: Department of Education
Province of the Northern Cape
19
• The Public Finance Management Act, 1999 (Act No. 1 of 1999) • The Promotion of Access to Information Act, 2000 (Act No. 2 of 2000) • The Promotion of Administrative Justice Act, 2000 (Act No. 3 of 2000) • The Electronic Communications and Transactions Act, 2002 (Act No. 25 of 2002)
The Draft White Paper on e-Education, August 2003
8. ORGANISATIONAL STRUCTURE
9. ENTITIES REPORTING TO THE MEC
There are no entities reporting to the MEC

19
Annual Report for 2018/19 Financial Year Vote 04: Department of Education
Province of the Northern Cape
18
6. STRATEGIC OVERVIEW
6.1 Vision
A transformed quality education system.
6.2 Mission To deliver quality public education to all learners of the Northern Cape which will enable them to play a meaningful role in a dynamic, developmental and economic society
6.3 Values
Transparency – open to scrutiny by oversight structures in line with all relevant legislation
Excellence – striving towards outstanding standards of performance at all levels of delivery
Accountability - remaining answerable to the public and oversight structures of the Northern Cape
Caring – showing compassion for all our clients
Honesty - displaying irreproachable levels of truthfulness
Integrity – exceptional levels of honour
Needs-driven – being finely attuned to the needs of our clients
Goal-directed – in pursuance of the long-term plans of the country
7. LEGISLATIVE AND OTHER MANDATES Since 1994, a number of policies have been implemented and legislation promulgated to create a framework for transformation and the provision of quality public education and training. The following are some of the key policies and legislation:
• The Constitution of the Republic of South Africa Act, 1996 (Act No. 108 of 1996) • The National Education Policy Act, 1996 (Act No. 27 of 1996) • The South African Schools Act, 1996 (Act No. 84 of 1996) • The Further Education & Training Act, 1998 (Act No. 98 of 1998) • The Adult Basic Education & Training Act, 2000 (Act No. 52 of 2000) • The Employment of Educators Act, 1998 (Act No. 76 of 1998) • The Public Service Act, 1994 (Proc No. 103 of 1994) • The General and Further Education and Training Quality Assurance Act, 2001 (Act No. 58 of
2001) • The South African Qualifications Authority Act, 1995 (Act No. 58 of 1995) • Education White Paper 5 on Early Childhood Education (May 2001) and Education White Paper
6 on Special Needs Education – Building an Inclusive Education & Training System (July 2001) • National Curriculum Statement • The Northern Cape Schools Education Act, 1996 (Act No. 6 of 1996) • The Education Laws Amendment (Conduct of Matriculation Examinations) Act, (Act No. 4 of
1995) • The White Paper on Transforming Public Service Delivery (Batho Pele) (General Notice 18340
of 1 October 1997
Annual Report for 2018/19 Financial Year Vote 04: Department of Education
Province of the Northern Cape
19
• The Public Finance Management Act, 1999 (Act No. 1 of 1999) • The Promotion of Access to Information Act, 2000 (Act No. 2 of 2000) • The Promotion of Administrative Justice Act, 2000 (Act No. 3 of 2000) • The Electronic Communications and Transactions Act, 2002 (Act No. 25 of 2002)
The Draft White Paper on e-Education, August 2003
8. ORGANISATIONAL STRUCTURE
9. ENTITIES REPORTING TO THE MEC
There are no entities reporting to the MEC

20
Annual Report for 2018/19 Financial Year Vote 04: Department of Education
Province of the Northern Cape
20
PART B: PERFORMANCE INFORMATION
Annual Report for 2018/19 Financial Year Vote 04: Department of Education
Province of the Northern Cape
21
1. AUDITOR GENERAL’S REPORT: PREDETERMINED OBJECTIVES
The AGSA currently performs certain audit procedures on the performance information to provide reasonable assurance in the form of an audit conclusion. The audit conclusion on the performance against predetermined objectives is included in the report to management, with material findings being reported under the Predetermined Objectives heading in the Report on other legal and regulatory requirements section of the auditor’s report. Refer to page 133 of the Report of the Auditor General, published as Part E: Financial Information.
2. OVERVIEW OF DEPARTMENTAL PERFORMANCE
2.1 Service Delivery Environment Northern Cape as a Province The Northern Cape is located in the north-western corner of South Africa and has a shoreline of approximately 313 km along the Atlantic Ocean. It is the largest of the nine Provinces of South Africa accounting for 30, 5% of the total land mass of the country. Despite its incredible size as compared to the rest of the country, the province only accommodates 2,2% of the total South African population as per Provincial Mid-Year Estimates 2013 conducted by Statistics South Africa.
Map of District Municipality Location

21
Annual Report for 2018/19 Financial Year Vote 04: Department of Education
Province of the Northern Cape
20
PART B: PERFORMANCE INFORMATION
Annual Report for 2018/19 Financial Year Vote 04: Department of Education
Province of the Northern Cape
21
1. AUDITOR GENERAL’S REPORT: PREDETERMINED OBJECTIVES
The AGSA currently performs certain audit procedures on the performance information to provide reasonable assurance in the form of an audit conclusion. The audit conclusion on the performance against predetermined objectives is included in the report to management, with material findings being reported under the Predetermined Objectives heading in the Report on other legal and regulatory requirements section of the auditor’s report. Refer to page 133 of the Report of the Auditor General, published as Part E: Financial Information.
2. OVERVIEW OF DEPARTMENTAL PERFORMANCE
2.1 Service Delivery Environment Northern Cape as a Province The Northern Cape is located in the north-western corner of South Africa and has a shoreline of approximately 313 km along the Atlantic Ocean. It is the largest of the nine Provinces of South Africa accounting for 30, 5% of the total land mass of the country. Despite its incredible size as compared to the rest of the country, the province only accommodates 2,2% of the total South African population as per Provincial Mid-Year Estimates 2013 conducted by Statistics South Africa.
Map of District Municipality Location

22
Annual Report for 2018/19 Financial Year Vote 04: Department of Education
Province of the Northern Cape
22
The Province is divided into five administrative districts namely:- Frances Baard - Houses the capital of the Province, Kimberley, and accommodates 38.3% of the total provincial population. As per the 2018 – 10th Day school data collection, the District has a total of 141 schools including 118 public ordinary schools, 8 Special Need Education (SNE) schools and 15 Independent schools. With a total number of 3 329 educators, including 193 in Independent schools, 2 951 in Public Ordinary schools and 185 in Special Needs Education Schools (SNE), the District serves 97 225 learners, including 3 061 in the Independent Schools, 92 480 in Public Ordinary schools and 1 684 in the SNE schools. Regardless of schools’ infrastructural challenges in the District, a large percentage of the school infrastructure in the District is deemed to be acceptable as per schools’ infrastructure norms and standard. John Taolo Gaetsewe - This District was previously known as the Kgalagadi District and was demarcated to the Province in 2006. Kuruman is the capital of this District. The District has the highest number of schools with 170 Public ordinary schools, 5 Independent schools and 1 SNE schools as per the 2018-10th day school data collection. While the District has a 77 771 total number of learners, including 76 193 in Public ordinary schools, 1 432 in Independent Schools and 146 in SNE schools, these learners are served by a total number of 2 458 educators, including 2 342 in Public ordinary schools, 100 in Independent schools and 16 in SNE schools. The socio-political and economical history of this District renders it the District with the largest number of extremely disadvantaged schools. Namakwa - This District is located on the boundaries of the Western Cape with Springbok as its capital. The District has the lowest unemployment rate of only 16,8%. The total number of schools in the District stands at 81, including 72 Public Ordinary Schools, 8 Independent Schools and 1 SNE school. These schools are populated with 22 431 learners, including 21 782 in Public ordinary schools, 411 learners in Independent Schools and 238 learners in the SNE schools. The number of educators to serve these learners stands at 825 with 764 in Public Ordinary Schools, 45 in Independent and 16 in SNE schools. This District is one of the largest per square kilometre area. However, this District is home to the lowest population. Most schools in this District are in remote areas and a large number of them have infrastructure assets which are under-utilised. This District has the largest number of school hostels in the Province, due to its geographical size. Pixley Ka Seme – Made up with 92 schools, including 88 Public Ordinary schools and 4 Independent Schools, Pixley Ka-Seme District is the second smallest in terms of resident population. This is also reflected by its learner population which stands at 46 212 including 45 848 in Public ordinary schools and only 364 in the 4 Independent schools. The 46 212 learners are served by 1 522 educators of whom 1 469 are in the Public ordinary schools and 53 in the Independent Schools. The capital of the district is De Aar. This district is vast and the towns are far from each other, resulting in school infrastructure assets being under-utilised. ZF Mgcawu- Formerly known as Siyanda District, has the youngest population in the Province with 36% of the population being between the ages of 15 - 34. The capital of the district is Upington. The total number of schools in ZF Mgcawu stands at 102 including 97 Public ordinary schools, 4 Independent and 1 SNE school. These schools are populated by 57 566 learners in total of whom 57 368 are in the Public ordinary schools, 179 in the Independent Schools and only 19 learners in the SNE schools. The total number of educators, however, stands at 1 910 including 1 883 in the Public Ordinary schools, 24 in the Independent schools and only 3 in the only 1 SNE school in the District. School infrastructure in the District is reported to be well utilised except for the remote areas of Mier. Most of the school infrastructure in the District is also well maintained. Learner Growth – Compensation Jeopardy The 2018 10th day school data collection suggests a consistent growth in learner numbers annually. The average growth over the last five years stands at 1.1%. This growth is recorded at 1.5% representing 4 592 learners. The table (T1) below depicts not only, the growth in terms of Public ordinary schools from 2013 to 2018, but also the projections for the following 5 years. The projected
Annual Report for 2018/19 Financial Year Vote 04: Department of Education
Province of the Northern Cape
23
figures suggest that the department will have well over 300,000 learners in 2023. Also depicted and projected in the same manner in the other two respective tables (T2 and T3) is the respective growth in terms Independent schools and Special Needs Education (SNE) schools.
Public Ordinary Schools
Learners 2013 2014 2015 2016 2017 2018 Average last five years
2019 2020 2021 2022 2023
Provincial 282800 285701 290139 291490 294526 299118
1.1
302408 305734 309097 312497 315934
Growth 2901 4438 1351 3036 4592 3290 3326 3363 3400 3437 % Growth 1.0 1.5 0.5 1.0 1.5 1.1
T1: Learner growth – Public Ordinary Schools
Independent Schools
Learners 2013 2014 2015 2016 2017 2018 Average last five years
2019 2020 2021 2022 2023
Provincial 3316 4227 3630 4080 4656 5447
8.6
5915 6423 6975 7575 8227 Growth 911 -597 450 576 791 468 508 552 600 652 % Growth 21.55
-16.4 11.03 12.37 14.52 8.6
T2: Learner growth – Independent schools
Special Needs Education Schools (SNE)
Learners 2013 2014 2015 2016 2017 2018 Average last five years
2019 2020 2021 2022 2023
Provincial 1691 1897 1966 2103 2149 2087 4.0
2170 2257 2347 2441 2539 Growth 206 69 137 46 -62 83 87 90 94 98 % Growth 10.9 3.5 6.5 2.1 -3.0 4.0
T3: Learner growth – Special Need Education Schools (SNE)
2.2 Service Delivery Improvement Plan The Department has completed a service delivery improvement plan. The tables below highlight the service delivery plan and the achievements to date.
Main services and standards
Main services Beneficiaries Current/actual
standard of service Desired
standard of service
Actual achievement
To provide quality Education and to eradicate the late delivery of textbooks.
All schools within the province.
All schools to have received their textbooks for the 2019 academic year.
100% of schools to receive their LTSM on time.
Delay in deliveries caused by late orders, operational and management. Challenges by the delivery agent. 98% of textbooks delivered at the

23
Annual Report for 2018/19 Financial Year Vote 04: Department of Education
Province of the Northern Cape
22
The Province is divided into five administrative districts namely:- Frances Baard - Houses the capital of the Province, Kimberley, and accommodates 38.3% of the total provincial population. As per the 2018 – 10th Day school data collection, the District has a total of 141 schools including 118 public ordinary schools, 8 Special Need Education (SNE) schools and 15 Independent schools. With a total number of 3 329 educators, including 193 in Independent schools, 2 951 in Public Ordinary schools and 185 in Special Needs Education Schools (SNE), the District serves 97 225 learners, including 3 061 in the Independent Schools, 92 480 in Public Ordinary schools and 1 684 in the SNE schools. Regardless of schools’ infrastructural challenges in the District, a large percentage of the school infrastructure in the District is deemed to be acceptable as per schools’ infrastructure norms and standard. John Taolo Gaetsewe - This District was previously known as the Kgalagadi District and was demarcated to the Province in 2006. Kuruman is the capital of this District. The District has the highest number of schools with 170 Public ordinary schools, 5 Independent schools and 1 SNE schools as per the 2018-10th day school data collection. While the District has a 77 771 total number of learners, including 76 193 in Public ordinary schools, 1 432 in Independent Schools and 146 in SNE schools, these learners are served by a total number of 2 458 educators, including 2 342 in Public ordinary schools, 100 in Independent schools and 16 in SNE schools. The socio-political and economical history of this District renders it the District with the largest number of extremely disadvantaged schools. Namakwa - This District is located on the boundaries of the Western Cape with Springbok as its capital. The District has the lowest unemployment rate of only 16,8%. The total number of schools in the District stands at 81, including 72 Public Ordinary Schools, 8 Independent Schools and 1 SNE school. These schools are populated with 22 431 learners, including 21 782 in Public ordinary schools, 411 learners in Independent Schools and 238 learners in the SNE schools. The number of educators to serve these learners stands at 825 with 764 in Public Ordinary Schools, 45 in Independent and 16 in SNE schools. This District is one of the largest per square kilometre area. However, this District is home to the lowest population. Most schools in this District are in remote areas and a large number of them have infrastructure assets which are under-utilised. This District has the largest number of school hostels in the Province, due to its geographical size. Pixley Ka Seme – Made up with 92 schools, including 88 Public Ordinary schools and 4 Independent Schools, Pixley Ka-Seme District is the second smallest in terms of resident population. This is also reflected by its learner population which stands at 46 212 including 45 848 in Public ordinary schools and only 364 in the 4 Independent schools. The 46 212 learners are served by 1 522 educators of whom 1 469 are in the Public ordinary schools and 53 in the Independent Schools. The capital of the district is De Aar. This district is vast and the towns are far from each other, resulting in school infrastructure assets being under-utilised. ZF Mgcawu- Formerly known as Siyanda District, has the youngest population in the Province with 36% of the population being between the ages of 15 - 34. The capital of the district is Upington. The total number of schools in ZF Mgcawu stands at 102 including 97 Public ordinary schools, 4 Independent and 1 SNE school. These schools are populated by 57 566 learners in total of whom 57 368 are in the Public ordinary schools, 179 in the Independent Schools and only 19 learners in the SNE schools. The total number of educators, however, stands at 1 910 including 1 883 in the Public Ordinary schools, 24 in the Independent schools and only 3 in the only 1 SNE school in the District. School infrastructure in the District is reported to be well utilised except for the remote areas of Mier. Most of the school infrastructure in the District is also well maintained. Learner Growth – Compensation Jeopardy The 2018 10th day school data collection suggests a consistent growth in learner numbers annually. The average growth over the last five years stands at 1.1%. This growth is recorded at 1.5% representing 4 592 learners. The table (T1) below depicts not only, the growth in terms of Public ordinary schools from 2013 to 2018, but also the projections for the following 5 years. The projected
Annual Report for 2018/19 Financial Year Vote 04: Department of Education
Province of the Northern Cape
23
figures suggest that the department will have well over 300,000 learners in 2023. Also depicted and projected in the same manner in the other two respective tables (T2 and T3) is the respective growth in terms Independent schools and Special Needs Education (SNE) schools.
Public Ordinary Schools
Learners 2013 2014 2015 2016 2017 2018 Average last five years
2019 2020 2021 2022 2023
Provincial 282800 285701 290139 291490 294526 299118
1.1
302408 305734 309097 312497 315934
Growth 2901 4438 1351 3036 4592 3290 3326 3363 3400 3437 % Growth 1.0 1.5 0.5 1.0 1.5 1.1
T1: Learner growth – Public Ordinary Schools
Independent Schools
Learners 2013 2014 2015 2016 2017 2018 Average last five years
2019 2020 2021 2022 2023
Provincial 3316 4227 3630 4080 4656 5447
8.6
5915 6423 6975 7575 8227 Growth 911 -597 450 576 791 468 508 552 600 652 % Growth 21.55
-16.4 11.03 12.37 14.52 8.6
T2: Learner growth – Independent schools
Special Needs Education Schools (SNE)
Learners 2013 2014 2015 2016 2017 2018 Average last five years
2019 2020 2021 2022 2023
Provincial 1691 1897 1966 2103 2149 2087 4.0
2170 2257 2347 2441 2539 Growth 206 69 137 46 -62 83 87 90 94 98 % Growth 10.9 3.5 6.5 2.1 -3.0 4.0
T3: Learner growth – Special Need Education Schools (SNE)
2.2 Service Delivery Improvement Plan The Department has completed a service delivery improvement plan. The tables below highlight the service delivery plan and the achievements to date.
Main services and standards
Main services Beneficiaries Current/actual
standard of service Desired
standard of service
Actual achievement
To provide quality Education and to eradicate the late delivery of textbooks.
All schools within the province.
All schools to have received their textbooks for the 2019 academic year.
100% of schools to receive their LTSM on time.
Delay in deliveries caused by late orders, operational and management. Challenges by the delivery agent. 98% of textbooks delivered at the
Annual Report for 2018/19 Financial Year Vote 04: Department of Education
Province of the Northern Cape
23
figures suggest that the department will have well over 300,000 learners in 2023. Also depicted and projected in the same manner in the other two respective tables (T2 and T3) is the respective growth in terms Independent schools and Special Needs Education (SNE) schools.
Public Ordinary Schools
Learners 2013 2014 2015 2016 2017 2018 Average last five years
2019 2020 2021 2022 2023
Provincial 282800 285701 290139 291490 294526 299118
1.1
302408 305734 309097 312497 315934
Growth 2901 4438 1351 3036 4592 3290 3326 3363 3400 3437 % Growth 1.0 1.5 0.5 1.0 1.5 1.1
T1: Learner growth – Public Ordinary Schools
Independent Schools
Learners 2013 2014 2015 2016 2017 2018 Average last five years
2019 2020 2021 2022 2023
Provincial 3316 4227 3630 4080 4656 5447
8.6
5915 6423 6975 7575 8227 Growth 911 -597 450 576 791 468 508 552 600 652 % Growth 21.55
-16.4 11.03 12.37 14.52 8.6
T2: Learner growth – Independent schools
Special Needs Education Schools (SNE)
Learners 2013 2014 2015 2016 2017 2018 Average last five years
2019 2020 2021 2022 2023
Provincial 1691 1897 1966 2103 2149 2087 4.0
2170 2257 2347 2441 2539 Growth 206 69 137 46 -62 83 87 90 94 98 % Growth 10.9 3.5 6.5 2.1 -3.0 4.0
T3: Learner growth – Special Need Education Schools (SNE)
2.2 Service Delivery Improvement Plan The Department has completed a service delivery improvement plan. The tables below highlight the service delivery plan and the achievements to date.
Main services and standards
Main services Beneficiaries Current/actual
standard of service Desired
standard of service
Actual achievement
To provide quality Education and to eradicate the late delivery of textbooks.
All schools within the province.
All schools to have received their textbooks for the 2019 academic year.
100% of schools to receive their LTSM on time.
Delay in deliveries caused by late orders, operational and management. Challenges by the delivery agent. 98% of textbooks delivered at the

24
Annual Report for 2018/19 Financial Year Vote 04: Department of Education
Province of the Northern Cape
24
Main services Beneficiaries Current/actual standard of service
Desired standard of
service
Actual achievement
The procurement for 2020 is currently underway.
start of the academic year.
Batho Pele arrangements with beneficiaries (Consultation access etc.)
Current/actual arrangements
Desired arrangements Actual achievements
Consultation Meetings with all district coordinators &CES’s to plan the operations for the achievement of the management plan objectives. Weekly meetings with the delivery agent once orders have been placed. Inform schools regarding the submission of orders and the deadline for delivery.
District meetings conducted with the delivery agent for speeding up the deliveries.
A revised management plan implemented.
Correspondence to schools posted on HRMS. Provincial forum meetings conducted.
Access All circulars are made available to schools on the HRMS website. All schools have access to the textbook ordering & tracking system. District offices also fax all communiqués to schools
All DBE circulars received have been sent to schools and posted on HRMS.
Courtesy Telephonic communication/follow ups. Regular follow ups with schools &district coordinators.
Openness & Transparency.
Timeous reports. All reports are shared with stakeholders.
Information Departmental circulars, pamphlets and quarterly meetings.
All information regarding LTSM is always made available to schools and stakeholders. HRMS is utilised effectively for this .Meetings and information sessions are also held.
Value for money. Reduced number of complaints from clients.
All available data is used during the ordering process in order to prevent inflation of orders. The ordering of textbooks is centralized in order for the department to benefit from the economies of scale. The LTSM ordering and tracking system is also a
Annual Report for 2018/19 Financial Year Vote 04: Department of Education
Province of the Northern Cape
25
Current/actual arrangements
Desired arrangements Actual achievements
good tool to curb overspending.
Costs Reprioritised budget allocated. R509 929.66 R17 084 719 .44 R4 478 054.03
Orders have been placed and delivered. Calculated total including braille procurement and mop up orders after re-opening = R 22 072 703,13.
Human resources Members of staff. Head office & districts are understaffed as no appointments could be made.
Time Timelines are planned as per the sector plan of the department.
The department mitigated the late placement of orders. The new annual management plan has been drafted and will be implemented stringently.
Service delivery information tool
Current/actual information tools
Desired information tools Actual achievements
The Lithotech system Tool used to order and process textbook orders .All deliveries and reports generated from this system.
This system was used successfully to order and deliver textbooks for 2019.
Complaints mechanism
Current/actual complaints
mechanism Desired complaints mechanism Actual achievements
District offices All complaints and queries are directed to the district offices. Only once complaints cannot be addressed is it then directed to head office.
All complaints were managed by the district offices .Head office addressed queries as received.
2.3 Organisational environment The Northern Cape Department of Education is responsible for Basic Education and provides for Public Ordinary Schooling, Early Childhood Development, Special Schools Education and the provision of subsidies to Independent Schools. This services are provided to learners in the formal schooling system ranging from Grade R to Grade 12.

25
Annual Report for 2018/19 Financial Year Vote 04: Department of Education
Province of the Northern Cape
24
Main services Beneficiaries Current/actual standard of service
Desired standard of
service
Actual achievement
The procurement for 2020 is currently underway.
start of the academic year.
Batho Pele arrangements with beneficiaries (Consultation access etc.)
Current/actual arrangements
Desired arrangements Actual achievements
Consultation Meetings with all district coordinators &CES’s to plan the operations for the achievement of the management plan objectives. Weekly meetings with the delivery agent once orders have been placed. Inform schools regarding the submission of orders and the deadline for delivery.
District meetings conducted with the delivery agent for speeding up the deliveries.
A revised management plan implemented.
Correspondence to schools posted on HRMS. Provincial forum meetings conducted.
Access All circulars are made available to schools on the HRMS website. All schools have access to the textbook ordering & tracking system. District offices also fax all communiqués to schools
All DBE circulars received have been sent to schools and posted on HRMS.
Courtesy Telephonic communication/follow ups. Regular follow ups with schools &district coordinators.
Openness & Transparency.
Timeous reports. All reports are shared with stakeholders.
Information Departmental circulars, pamphlets and quarterly meetings.
All information regarding LTSM is always made available to schools and stakeholders. HRMS is utilised effectively for this .Meetings and information sessions are also held.
Value for money. Reduced number of complaints from clients.
All available data is used during the ordering process in order to prevent inflation of orders. The ordering of textbooks is centralized in order for the department to benefit from the economies of scale. The LTSM ordering and tracking system is also a
Annual Report for 2018/19 Financial Year Vote 04: Department of Education
Province of the Northern Cape
25
Current/actual arrangements
Desired arrangements Actual achievements
good tool to curb overspending.
Costs Reprioritised budget allocated. R509 929.66 R17 084 719 .44 R4 478 054.03
Orders have been placed and delivered. Calculated total including braille procurement and mop up orders after re-opening = R 22 072 703,13.
Human resources Members of staff. Head office & districts are understaffed as no appointments could be made.
Time Timelines are planned as per the sector plan of the department.
The department mitigated the late placement of orders. The new annual management plan has been drafted and will be implemented stringently.
Service delivery information tool
Current/actual information tools
Desired information tools Actual achievements
The Lithotech system Tool used to order and process textbook orders .All deliveries and reports generated from this system.
This system was used successfully to order and deliver textbooks for 2019.
Complaints mechanism
Current/actual complaints
mechanism Desired complaints mechanism Actual achievements
District offices All complaints and queries are directed to the district offices. Only once complaints cannot be addressed is it then directed to head office.
All complaints were managed by the district offices .Head office addressed queries as received.
2.3 Organisational environment The Northern Cape Department of Education is responsible for Basic Education and provides for Public Ordinary Schooling, Early Childhood Development, Special Schools Education and the provision of subsidies to Independent Schools. This services are provided to learners in the formal schooling system ranging from Grade R to Grade 12.

26
Annual Report for 2018/19 Financial Year Vote 04: Department of Education
Province of the Northern Cape
26
The Organisational Services The Department of Education also provide additional support services including psycho-social services, nutrition and school health services. Included here is specialist support to learners in the form of therapist and educational psychologists. Extra-curricular activities in the form of sport, arts and culture in schools are also catered for. This is done to ensure the holistic development of all learners in the schooling system. Human Resource Development activities includes the provision of in-service programmes, learnerships and internships for unemployed youth and the provision of bursaries for out-of school youth as a measure to address the high illiteracy and unemployment amongst the youth. Resources Management and Provision – procurement of goods and services for schools that are not self-managing and provision of learner and teacher support materials and administrative equipment and labour saving devices. In addition, building maintenance and school building programmes are provided. Human Resource Management Five-Year Plan The Human Resource Management Plan is designed to assist the department in achieving the objectives as outlined in the Strategic Plan. This will ensure organisational effectiveness and sustainability in delivering the education mandate as enshrined in the Constitution and the Action Plan 2019: Towards the realisation of Schooling 2030. The focus and priority in the MTEF HR Plan is directed to the following: Early Childhood Development Inclusive Education The Integrated Farm and Small School Strategy Provincial Literacy Strategy, These priorities have been incorporated in the departmental Annual Plan and monitoring and evaluation is done on a quarterly basis. The evaluation of these priorities forms part of this progress report. We are committed to the education mandate and have ensured that effective and efficient systems and controls are in place to improve on our performance. With the involvement and participation of all stakeholders this mandate will become a reality and achievable. Post Provisioning The Department annually issue new staff establishments to all public ordinary schools based on the confirmed and verified learners of the previous year. This process is done through the post provisioning model taking into consideration the Employment of Educators Act (EEA) and the Public Service Act (PSA). Nationally there is a need to revisit and review the prescripts that govern the Posts provisioning process, as there are several critical gaps. There is no adequate provision made, when considering the effective staffing of “Full Service Schools”, where there is the occurrence of both mainstream and special needs learners. There are also no National Norms provided in the calculation of Support Staff at both Schools and School Hostels. Furthermore, there is a definite need to modernise the current Post Provisioning Software, to allow for on-line functionality, that includes Business Intelligence Reporting and analysis tools. Organisational Structure
The organisational structure for the Department of Education was approved on 21 June 2012 by the Executive Council and was further endorsed after consultation with the Department of Public Service and Administration.
Annual Report for 2018/19 Financial Year Vote 04: Department of Education
Province of the Northern Cape
27
This is in line with the Directive on Organisational structuring in the public service. Implementation of the organisational structure has been phased in over a number of years. The phased approach has been adopted due to the limited funding available to fill critical vacancies. To ensure that the structure remains relevant and aligned to the strategic direction of the Department a process of organisational review will be embarked upon in the 2018/19 financial year. In April 2018 the learner transport function was transferred from Department of Transport, Safety and Liaison to the Department of Education. The Department is also busy with a process to incorporate these functions on the organisational structure to be reviewed. It is envisaged that the review of the Organisational Structure will culminate in a new organisational structure that will commence in 2019/20. The primary aim of the review is to strengthen the service delivery points (District Offices) and to furthermore stream-line and ensure that Head Office is more geared at fulfilling its strategic, oversight and monitoring role. In addition, the function related to ECD (Early Childhood Development) will be transferred from the Department of Social Development and will therefore have to be incorporated into the current organisational structure of the NCDoE. The review will also ensure that the organisation is effectively and seamlessly ushered into the fourth industrial revolution with the expressed aim of establishing a modern, growing and successful education system. 2.4 Key policy developments and legislative changes There were no key policy developments and legislative changes during the period under review. 3. STRATEGIC OUTCOME ORIENTED GOALS The Delivery Agreement is also based on the following six sub-outcomes and the related 27 goals: Sub-Outcome 1: Improved quality of teaching and learning through development, supply and effective utilisation of teachers
The quality of the South African education system depends on the expertise (understanding of the curriculum, content knowledge and teaching skills) and commitment of its teachers.
The NDP identifies a four-pronged strategy to ensure an adequate number of dedicated, skilled teachers: (1) Produce, through the university and other systems, more and better qualified teachers, (2) Develop in-service training strategies and support systems that will continually develop the skills of teachers (3) Cooperate with professional bodies and teacher unions to enhance member expertise and commitment (4) Ensure an appropriate pay structure which also rewards good teachers
Sub-Outcome 2: Improved the quality of teaching and learning through provision of Infrastructure and learning materials
School infrastructure is important in supporting education and to create an atmosphere for learning. Both hard (e.g. school buildings, desks, sanitation) and soft (e.g. books, computers) infrastructure is important in providing enabling conditions for learning. Reading material is essential for increasing learning directly; especially quality reading material if used effectively can enhance the effectiveness of teachers in the classroom along with effective ICT infrastructure.
Sub-Outcome 3: Regular annual national assessments to track improvements in the quality of teaching and learning (ANA)
A key problem in the past has been insufficient measurement of the quality of teaching and learning below Grade 12. In 2011 Annual National Assessments (ANA) were introduced in Grades 3 and 6 and in 2012 Grade 9 was included. The Universal ANA (conducted in all schools in the country) is primarily focused on providing information to teachers, parents and schools for use in improving learning and teaching practices. Verification ANA (conducted only in a sample of schools) has a more rigorous

27
Annual Report for 2018/19 Financial Year Vote 04: Department of Education
Province of the Northern Cape
27
This is in line with the Directive on Organisational structuring in the public service. Implementation of the organisational structure has been phased in over a number of years. The phased approach has been adopted due to the limited funding available to fill critical vacancies. To ensure that the structure remains relevant and aligned to the strategic direction of the Department a process of organisational review will be embarked upon in the 2018/19 financial year. In April 2018 the learner transport function was transferred from Department of Transport, Safety and Liaison to the Department of Education. The Department is also busy with a process to incorporate these functions on the organisational structure to be reviewed. It is envisaged that the review of the Organisational Structure will culminate in a new organisational structure that will commence in 2019/20. The primary aim of the review is to strengthen the service delivery points (District Offices) and to furthermore stream-line and ensure that Head Office is more geared at fulfilling its strategic, oversight and monitoring role. In addition, the function related to ECD (Early Childhood Development) will be transferred from the Department of Social Development and will therefore have to be incorporated into the current organisational structure of the NCDoE. The review will also ensure that the organisation is effectively and seamlessly ushered into the fourth industrial revolution with the expressed aim of establishing a modern, growing and successful education system. 2.4 Key policy developments and legislative changes There were no key policy developments and legislative changes during the period under review. 3. STRATEGIC OUTCOME ORIENTED GOALS The Delivery Agreement is also based on the following six sub-outcomes and the related 27 goals: Sub-Outcome 1: Improved quality of teaching and learning through development, supply and effective utilisation of teachers
The quality of the South African education system depends on the expertise (understanding of the curriculum, content knowledge and teaching skills) and commitment of its teachers.
The NDP identifies a four-pronged strategy to ensure an adequate number of dedicated, skilled teachers: (1) Produce, through the university and other systems, more and better qualified teachers, (2) Develop in-service training strategies and support systems that will continually develop the skills of teachers (3) Cooperate with professional bodies and teacher unions to enhance member expertise and commitment (4) Ensure an appropriate pay structure which also rewards good teachers
Sub-Outcome 2: Improved the quality of teaching and learning through provision of Infrastructure and learning materials
School infrastructure is important in supporting education and to create an atmosphere for learning. Both hard (e.g. school buildings, desks, sanitation) and soft (e.g. books, computers) infrastructure is important in providing enabling conditions for learning. Reading material is essential for increasing learning directly; especially quality reading material if used effectively can enhance the effectiveness of teachers in the classroom along with effective ICT infrastructure.
Sub-Outcome 3: Regular annual national assessments to track improvements in the quality of teaching and learning (ANA)
A key problem in the past has been insufficient measurement of the quality of teaching and learning below Grade 12. In 2011 Annual National Assessments (ANA) were introduced in Grades 3 and 6 and in 2012 Grade 9 was included. The Universal ANA (conducted in all schools in the country) is primarily focused on providing information to teachers, parents and schools for use in improving learning and teaching practices. Verification ANA (conducted only in a sample of schools) has a more rigorous

28
Annual Report for 2018/19 Financial Year Vote 04: Department of Education
Province of the Northern Cape
28
methodology (such as external marking of papers and supervision) in order to assess the quality of the Universal ANA and to allow for reliable comparisons between sub-systems and over time.
ANA is critical to ensure the necessary feedback to stakeholders on their inputs and how they can be improved. A key focus over the MTSF is to improve the quality and utilisation of ANA (through increased analysis and feedback about performance and incorporating findings in improvement and school development plans and also into teacher training strategies). ANA must be used to identify schools needing support and the type of support needed.
Sub-Outcome 4: Improved Grade R and planning for extension of ECD
There is substantial evidence that expanding access to ECD and Grade R can improve life chances and school system performance through enhancing school readiness. South Africa has significantly expanded access to Grade R over the last decade. On the basis of survey data it is estimated that by 2013 95% of grade 1 learners had attended formal grade R. Over the MTEF the challenge is to ensure that there are no pockets of inadequate access and to increase the quality of ECD, which is inadequate in many cases. In addition to increasing the quantity and quality of inputs it is also important that a mechanism be introduced to assess the impact of Grade R on school readiness and any change over time, and the underlying factors. Planning for the introduction of an extra year of ECD, led by the Department of Social Development, should also be completed over the MTEF.
Sub-Outcome 5: A credible, outcomes-focused planning and accountability system (building the capacity of the state to intervene and support quality education)
DBE presides over concurrent competences with large number of institutions (provinces, districts and schools). To ensure quality basic education DBE needs to play a more active oversight role while providing greater guidance and support for these institutions. It is critical therefore that existing policies signal clearly that DBE monitors performance and policies are aligned to make the system run better. An effective oversight cannot happen without an effective M&E system that is linked to a functioning district oversight system.
Sub-Outcome 6: Partnerships for a Strong Education System
Quality Learning Teaching Campaign (QLTC) remains the backbone for the involvement of other stakeholders such as teacher unions; School Governing Bodies (SGBs); the Business Sector and Non-Governmental Organisations (NGOs) in ensuring that education remains a societal responsibility. This structure will be enhanced by the Institutional Management and Governance Development (IMDG) unit which is now fully staffed and has representatives at district level.
Annual Report for 2018/19 Financial Year Vote 04: Department of Education
Province of the Northern Cape
29
4. PERFORMANCE INFORMATION BY PROGRAMME 4.1 Programme 1: ADMINISTRATION
Objective of Programme: To provide overall management of, and support to, the education system in accordance with the National Education Policy Act, the Public Finance Management Act and other relevant policies
Sub-programmes
Sub-programme 1.1. Office of the MEC
To provide for the functioning of the office of the Member of the Executive Council (MEC) for education in line with the ministerial handbook.
Sub-programme 1.2. Corporate Services To provide management services which are not education specific for the education system.
Sub-programme 1.3. Education Management To provide education management services for the education system.
Sub-programme 1.4. Human Resource Development To provide human resource development for office-based staff.
Sub-programme 1.5. Education Management Information System (EMIS) To provide an Education Management information System in accordance with the National Education Information Policy.
Sub-programme 1.6. Conditional Grants To provide for projects under programme 1 specified by the Department of Basic Education and funded by conditional grants.
Strategic objectives, performance indicators, planned targets and actual achievements Achievements INSTITUTIONAL FUNDING No-Fee School Policy The South African Education system under the democratic Government inherited the legacy of charging mandatory school fees at public ordinary schools from the previous Education regime. The ‘No-Fee’ School Policy (NFSP) was subsequently implemented on the 01st January 2007 which abolished the levying of mandatory school fees in public ordinary schools to make basic education available to poor learners in the country. For the 2018/2019 financial year, 407 schools located in quintiles 1, 2 and 3 have been declared No Fee Schools which is 74.68% of the total schools in the Northern Cape. This represented 70.25% of learners in no-fee schools. The National percentage for no-fee learners in the Northern Cape Province is 61.50% as per the Revised National Poverty Distribution Table whereby the Province has surpassed this by 8.75%. The allocated funding for no-fee schools represented 83.19% of the total Norms and Standards funding provided towards Public Ordinary Schooling Education.

29
Annual Report for 2018/19 Financial Year Vote 04: Department of Education
Province of the Northern Cape
28
methodology (such as external marking of papers and supervision) in order to assess the quality of the Universal ANA and to allow for reliable comparisons between sub-systems and over time.
ANA is critical to ensure the necessary feedback to stakeholders on their inputs and how they can be improved. A key focus over the MTSF is to improve the quality and utilisation of ANA (through increased analysis and feedback about performance and incorporating findings in improvement and school development plans and also into teacher training strategies). ANA must be used to identify schools needing support and the type of support needed.
Sub-Outcome 4: Improved Grade R and planning for extension of ECD
There is substantial evidence that expanding access to ECD and Grade R can improve life chances and school system performance through enhancing school readiness. South Africa has significantly expanded access to Grade R over the last decade. On the basis of survey data it is estimated that by 2013 95% of grade 1 learners had attended formal grade R. Over the MTEF the challenge is to ensure that there are no pockets of inadequate access and to increase the quality of ECD, which is inadequate in many cases. In addition to increasing the quantity and quality of inputs it is also important that a mechanism be introduced to assess the impact of Grade R on school readiness and any change over time, and the underlying factors. Planning for the introduction of an extra year of ECD, led by the Department of Social Development, should also be completed over the MTEF.
Sub-Outcome 5: A credible, outcomes-focused planning and accountability system (building the capacity of the state to intervene and support quality education)
DBE presides over concurrent competences with large number of institutions (provinces, districts and schools). To ensure quality basic education DBE needs to play a more active oversight role while providing greater guidance and support for these institutions. It is critical therefore that existing policies signal clearly that DBE monitors performance and policies are aligned to make the system run better. An effective oversight cannot happen without an effective M&E system that is linked to a functioning district oversight system.
Sub-Outcome 6: Partnerships for a Strong Education System
Quality Learning Teaching Campaign (QLTC) remains the backbone for the involvement of other stakeholders such as teacher unions; School Governing Bodies (SGBs); the Business Sector and Non-Governmental Organisations (NGOs) in ensuring that education remains a societal responsibility. This structure will be enhanced by the Institutional Management and Governance Development (IMDG) unit which is now fully staffed and has representatives at district level.
Annual Report for 2018/19 Financial Year Vote 04: Department of Education
Province of the Northern Cape
29
4. PERFORMANCE INFORMATION BY PROGRAMME 4.1 Programme 1: ADMINISTRATION
Objective of Programme: To provide overall management of, and support to, the education system in accordance with the National Education Policy Act, the Public Finance Management Act and other relevant policies
Sub-programmes
Sub-programme 1.1. Office of the MEC
To provide for the functioning of the office of the Member of the Executive Council (MEC) for education in line with the ministerial handbook.
Sub-programme 1.2. Corporate Services To provide management services which are not education specific for the education system.
Sub-programme 1.3. Education Management To provide education management services for the education system.
Sub-programme 1.4. Human Resource Development To provide human resource development for office-based staff.
Sub-programme 1.5. Education Management Information System (EMIS) To provide an Education Management information System in accordance with the National Education Information Policy.
Sub-programme 1.6. Conditional Grants To provide for projects under programme 1 specified by the Department of Basic Education and funded by conditional grants.
Strategic objectives, performance indicators, planned targets and actual achievements Achievements INSTITUTIONAL FUNDING No-Fee School Policy The South African Education system under the democratic Government inherited the legacy of charging mandatory school fees at public ordinary schools from the previous Education regime. The ‘No-Fee’ School Policy (NFSP) was subsequently implemented on the 01st January 2007 which abolished the levying of mandatory school fees in public ordinary schools to make basic education available to poor learners in the country. For the 2018/2019 financial year, 407 schools located in quintiles 1, 2 and 3 have been declared No Fee Schools which is 74.68% of the total schools in the Northern Cape. This represented 70.25% of learners in no-fee schools. The National percentage for no-fee learners in the Northern Cape Province is 61.50% as per the Revised National Poverty Distribution Table whereby the Province has surpassed this by 8.75%. The allocated funding for no-fee schools represented 83.19% of the total Norms and Standards funding provided towards Public Ordinary Schooling Education.

30
Annual Report for 2018/19 Financial Year Vote 04: Department of Education
Province of the Northern Cape
30
ECD Funding In pursuance of Strategic outcome orientated goal 7 (Strategic Plan 2015-2019): To provide universal access to quality Early Childhood Development services to all children in the Province, a non-personnel non-capital allocation amounting to R15,181,179 was provided to 377 identified public ordinary schools which hosts 19, 999 Grade R learners during the 2018/2019 financial year. Special Schools Funding amounting to R15,119,200 was provided to eleven designated special schools hosting 2,085 special needs learners in the Northern Cape Province during the 2018 academic year. The allocation is intended to finance key inputs such as LTSM, basic services, maintenance, etc and special needs specialised equipment and assistive devices. SGB Association Funding In compliance with paragraph 145A (b) of the Amended National Norms and Standards for School Funding Policy, the NCDoE provided an amount of R126,680 as a contribution towards the payment of SGB association subscription fees for schools that are registered with governing body associations for the 2018/2019 financial year. Independent Schools To ensure the provision of quality education in Independent schools as per our strategic oriented goal 3, an amount of R9,598,899 was provided to six funded independent schools. Compensation for Fee Exemptions The exemption from the payment of school fees is a mechanism Government has put in place to assist parents to access quality education for their children, irrespective of their background or financial constraints. Funding amounting to R12,383, 559 was allocated and transferred to 118 schools for 26,517 learners whom where either totally, partially or conditionally exempted from the payment of school fees during November 2018 as per the requirements of the Amended National Norms and Standards for School Funding Policy. Annual Financial Statements Sections 42 and 43 of the Amended South African Schools Act require public schools to compile a complete set of annual financial statements which is audited and submit it to the Head of Department by 30 June each year for internal review purposes. For the 2018/2019 financial year, the NCDOE received 95.55% of schools annual financial statements which were analysed and reviewed. Financial Management Capacitation. A random selection of 56 schools which received qualified audit reports within the Northern Cape Province were visited to ensure financial management policies and regulations are adhered to and remedial measures were provided where deemed necessary. Level of Funding Towards Public Ordinary Schools The Northern Cape Province funded all quintile 4 and quintile 5 schools at the minimum threshold as prescribed by the National Table of Targets. A lesser amount was allocated to no-fee schools for the 2018/2019 financial year due to the following considerations: The Northern Cape Province absorbed more no fee learners than prescribed by the National
Poverty Distribution Table. For the 2018/2019 financial year the Province surpassed the prescribed percentage by 8.75%.
Schools that appealed against their quintile ranking were retained in fee paying quintiles and were provided with a higher per capita than the baseline amount prescribed by the National Table of Targets.
Annual Report for 2018/19 Financial Year Vote 04: Department of Education
Province of the Northern Cape
31
Percentage of Schools With A Full Set of Management Responsibilities on the Basis of Assessment. For the 2018/2019 year, 552 Schools in the Northern Cape Province had the full set of financial management responsibilities in terms of the South Africans Schools Act as Amended which represented 99% of schools in the Northern Cape Province. INSTITUTIONAL MANAGEMENT AND GOVERNANCE DEVELOPMENT
Induction of Newly Appointed School Management Team (SMT) Members The induction training for the 2018 cohort of newly appointed school management team members was implemented as part of a multi-disciplinary approach per district in November. Senior managers from head office were deployed to all districts to deliver a message of support. Below is a breakdown of the training intervention:
DISTRICT DEPARTMENTAL HEADS
PRINCIPALS DEPUTY PRINCIPALS
TOTAL ATTENDANCE
FRANCES BAARD 56 10 18 84 JOHN TAOLO GAETSEWE 34 7 10 51 NAMAKWA 9 5 1 15 PIXLEY KA SEME 13 4 9 26 ZF MGCAWU 34 6 12 52 TOTAL ATTENDANCE 146 32 50 228
ETDP SETA Training Intervention for Principals and Deputies Project Management for 65 school principals and deputy principals of underperforming high schools in Frances Baard and John Taolo Gaetsewe: Focus was on data management including results: - interpretation and analysis of SA-SAMS reports as well as Monitoring and Evaluation. University of KZN was the service provider for this training intervention. Forty-six (46) departmental heads in Frances Baard benefitted from a training intervention on curriculum management facilitated by DBE. School Governing Body Members Trained To Promote Functional Schools Governors planned training intervention targeted 2 780 with the following focus areas: 1. Policy Development; 2. Planning & Financial Management; 3. Appointment Process; 4. Managing minor and serious misconduct.
District Planned target Progress Actual Frances Baard 635 740 JT Gaetsewe 855 1682 ZF Mgcawu 485 387 Namakwa 365 425 Pixley Ka Seme 440 622
SGB Training On Roles and Responsibilities 291 principals trained their SGBs on roles and responsibilities – 2 573 … governors at 291 schools benefited.
District Number of Schools
Number of principals inducted newly elected governors
Number of Governors
Number of principals that did not inducted
FRANCES BAARD
126 125 972 1 PIXLEY KA SEME
88 38 383 50

31
Annual Report for 2018/19 Financial Year Vote 04: Department of Education
Province of the Northern Cape
30
ECD Funding In pursuance of Strategic outcome orientated goal 7 (Strategic Plan 2015-2019): To provide universal access to quality Early Childhood Development services to all children in the Province, a non-personnel non-capital allocation amounting to R15,181,179 was provided to 377 identified public ordinary schools which hosts 19, 999 Grade R learners during the 2018/2019 financial year. Special Schools Funding amounting to R15,119,200 was provided to eleven designated special schools hosting 2,085 special needs learners in the Northern Cape Province during the 2018 academic year. The allocation is intended to finance key inputs such as LTSM, basic services, maintenance, etc and special needs specialised equipment and assistive devices. SGB Association Funding In compliance with paragraph 145A (b) of the Amended National Norms and Standards for School Funding Policy, the NCDoE provided an amount of R126,680 as a contribution towards the payment of SGB association subscription fees for schools that are registered with governing body associations for the 2018/2019 financial year. Independent Schools To ensure the provision of quality education in Independent schools as per our strategic oriented goal 3, an amount of R9,598,899 was provided to six funded independent schools. Compensation for Fee Exemptions The exemption from the payment of school fees is a mechanism Government has put in place to assist parents to access quality education for their children, irrespective of their background or financial constraints. Funding amounting to R12,383, 559 was allocated and transferred to 118 schools for 26,517 learners whom where either totally, partially or conditionally exempted from the payment of school fees during November 2018 as per the requirements of the Amended National Norms and Standards for School Funding Policy. Annual Financial Statements Sections 42 and 43 of the Amended South African Schools Act require public schools to compile a complete set of annual financial statements which is audited and submit it to the Head of Department by 30 June each year for internal review purposes. For the 2018/2019 financial year, the NCDOE received 95.55% of schools annual financial statements which were analysed and reviewed. Financial Management Capacitation. A random selection of 56 schools which received qualified audit reports within the Northern Cape Province were visited to ensure financial management policies and regulations are adhered to and remedial measures were provided where deemed necessary. Level of Funding Towards Public Ordinary Schools The Northern Cape Province funded all quintile 4 and quintile 5 schools at the minimum threshold as prescribed by the National Table of Targets. A lesser amount was allocated to no-fee schools for the 2018/2019 financial year due to the following considerations: The Northern Cape Province absorbed more no fee learners than prescribed by the National
Poverty Distribution Table. For the 2018/2019 financial year the Province surpassed the prescribed percentage by 8.75%.
Schools that appealed against their quintile ranking were retained in fee paying quintiles and were provided with a higher per capita than the baseline amount prescribed by the National Table of Targets.
Annual Report for 2018/19 Financial Year Vote 04: Department of Education
Province of the Northern Cape
31
Percentage of Schools With A Full Set of Management Responsibilities on the Basis of Assessment. For the 2018/2019 year, 552 Schools in the Northern Cape Province had the full set of financial management responsibilities in terms of the South Africans Schools Act as Amended which represented 99% of schools in the Northern Cape Province. INSTITUTIONAL MANAGEMENT AND GOVERNANCE DEVELOPMENT
Induction of Newly Appointed School Management Team (SMT) Members The induction training for the 2018 cohort of newly appointed school management team members was implemented as part of a multi-disciplinary approach per district in November. Senior managers from head office were deployed to all districts to deliver a message of support. Below is a breakdown of the training intervention:
DISTRICT DEPARTMENTAL HEADS
PRINCIPALS DEPUTY PRINCIPALS
TOTAL ATTENDANCE
FRANCES BAARD 56 10 18 84 JOHN TAOLO GAETSEWE 34 7 10 51 NAMAKWA 9 5 1 15 PIXLEY KA SEME 13 4 9 26 ZF MGCAWU 34 6 12 52 TOTAL ATTENDANCE 146 32 50 228
ETDP SETA Training Intervention for Principals and Deputies Project Management for 65 school principals and deputy principals of underperforming high schools in Frances Baard and John Taolo Gaetsewe: Focus was on data management including results: - interpretation and analysis of SA-SAMS reports as well as Monitoring and Evaluation. University of KZN was the service provider for this training intervention. Forty-six (46) departmental heads in Frances Baard benefitted from a training intervention on curriculum management facilitated by DBE. School Governing Body Members Trained To Promote Functional Schools Governors planned training intervention targeted 2 780 with the following focus areas: 1. Policy Development; 2. Planning & Financial Management; 3. Appointment Process; 4. Managing minor and serious misconduct.
District Planned target Progress Actual Frances Baard 635 740 JT Gaetsewe 855 1682 ZF Mgcawu 485 387 Namakwa 365 425 Pixley Ka Seme 440 622
SGB Training On Roles and Responsibilities 291 principals trained their SGBs on roles and responsibilities – 2 573 … governors at 291 schools benefited.
District Number of Schools
Number of principals inducted newly elected governors
Number of Governors
Number of principals that did not inducted
FRANCES BAARD
126 125 972 1 PIXLEY KA SEME
88 38 383 50

32
Annual Report for 2018/19 Financial Year Vote 04: Department of Education
Province of the Northern Cape
32
District Number of Schools
Number of principals inducted newly elected governors
Number of Governors
Number of principals that did not inducted
ZF MGCAWU
98 37 471 61
NAMAKWA
73 24 196 49
JT GAETSEWE
171 67 551 104
TOTAL 556 291 2573 265 FEDSAS training of newly elected governors on roles and responsibilities – 93 schools with 666 governors benefited. Representative Council of Learners (RCL) The induction training of 717 RCL members was scheduled for the fourth quarter with 369 beneficiaries. Two districts could not initiate RCL training due to support to schools on SGB functionality. The other districts focussed on training of 224 Teacher Liaison Officers (TLO’s) in circuit clusters to cascade the training to RCLs. With the assistance of the National Education Collaboration Trust (NECT), 151 deputy principals, TLOs and officials were trained on learner leadership development. Department of Basic Education Building Blocks and SGB Functionality Tools The Department of Basic Education (DBE) has developed and introduced the following templates into the system: Building Blocks – to monitor and assess the school management and administration functionality;
and School Governing Body Functionality Tool – to monitor and assess the effective governance of
public schools.
The DBE Building blocks and Functionality Tool Templates for 2018 were placed on HRMS for schools to access. From the five districts, 103 schools submitted Building Blocks and 111 schools completed the SGB Functionality Tools. DBE is doing the analysis of the tools, and will provide the Province with a detailed report on SGB Functionality during 2019. INSTITUTIONAL DEVELOPMENT UNIT Rural Education The unit conducted the Rural Education audit tool in three (3) districts namely, Frances Baard, Pixley Ka Seme and ZF Mgcawu. The number of outstanding Section 14 agreements have been reduced to six (6) and this will be done during the new financial year. School Planning The unit analysed the District Improvements Plans of five (5) districts and gave feedback to all except one. The reason for this is that no suitable date could be established due to programmes in the district. The school planning circular was also issued to all schools. SCHOOL SAFETY Capacity Building School-based training of 163 schools on Prevention of Bullying in schools National School Safety Framework National School Safety Framework: School-based roll-out in special schools; Protocol on management of sexual harassment and abuse in schools and protocol on dealing with incidents of corporal punishment in schools
Annual Report for 2018/19 Financial Year Vote 04: Department of Education
Province of the Northern Cape
33
Protocol on the management of Corporal Punishment in Schools Monitoring and support of schools in the implementation of the National School Safety Framework Monitoring and support of School Safety programmes, The development of School Safety Action Plans Emergency Readiness Establishment of emergency evacuation procedures / processes at schools Emergency evacuation drills at schools District / provincial disaster management forum meetings Incident Reporting Emergency visits / follow-up on reported incidents Collaborative Programmes (Road Safety Debates and Participatory educational techniques)
Implementation of Road Safety Programmes: Road Safety Debates (circuit, district, provincial, national) Monitoring of existing and newly established Scholar Patrols Collaborative Programmes with the South African Police Service
- Linking Schools with Police Stations; Revival of School Safety Committees; Establish reporting
systems , Implement social crime prevention programme (context-specific crime prevention programmes, searches & seizures; drug testing, awareness campaigns); Mobilise schools communities to curb crime and violence in schools; Junior Provincial Commissioner Programme
- Provincial VEP meetings, 16 days of no violence against women and children; Child Protection
Month, Gender-based violence, Victim’s rights,; Women’s month programmes - Services to LGBTIQ+, Advocacy on TIP, Advocacy on Cyber-Bullying - Children at risk and in conflict with the law IN-SCHOOL SPORT Several sporting codes, namely Rugby, Netball, Hockey and Football successfully competed in their respective national tournaments as well as the Kay Motsepe and other sponsored competitions). The National Championships: Winter Games did not take place during the scheduled time which is the June/July school holidays. Some sporting codes competed during the Summer Games in December 2018. A Northern Cape Indigenous Games team competed at the national tournament in Polokwane during the October school holidays. Netball, gymnastics and athletics structures held their elective conferences and elected new office bearers. The athletics track and field teams from Northern Cape were funded by Department of Sport, Arts and Culture. TEACHER DEVELOPMENT 1. Implementing the teacher development structure with the appointment of a director and transferring of two officials to head the Teacher Development Institute 2. 227 SACE Material Development Programs endorsed for teachers to earn CPTD points 3. Mass sign up of CPTD in the province. Recording of points happening but needs improvement 4. TASP - focus is on National Teaching Awards annually, 2016/17 we obtained position 3 in special needs, 2018 we obtained position 2 in Kader Asmal Category, we also working with SACE on professional standards and teacher responsibilities 5. The launch of English Association took place, African Languages to be launched in this financial year 6. Operationalise the TUC with the establishment of the POC in the province to assist in identification of training needs for educators and the implementation thereof

33
Annual Report for 2018/19 Financial Year Vote 04: Department of Education
Province of the Northern Cape
32
District Number of Schools
Number of principals inducted newly elected governors
Number of Governors
Number of principals that did not inducted
ZF MGCAWU
98 37 471 61
NAMAKWA
73 24 196 49
JT GAETSEWE
171 67 551 104
TOTAL 556 291 2573 265 FEDSAS training of newly elected governors on roles and responsibilities – 93 schools with 666 governors benefited. Representative Council of Learners (RCL) The induction training of 717 RCL members was scheduled for the fourth quarter with 369 beneficiaries. Two districts could not initiate RCL training due to support to schools on SGB functionality. The other districts focussed on training of 224 Teacher Liaison Officers (TLO’s) in circuit clusters to cascade the training to RCLs. With the assistance of the National Education Collaboration Trust (NECT), 151 deputy principals, TLOs and officials were trained on learner leadership development. Department of Basic Education Building Blocks and SGB Functionality Tools The Department of Basic Education (DBE) has developed and introduced the following templates into the system: Building Blocks – to monitor and assess the school management and administration functionality;
and School Governing Body Functionality Tool – to monitor and assess the effective governance of
public schools.
The DBE Building blocks and Functionality Tool Templates for 2018 were placed on HRMS for schools to access. From the five districts, 103 schools submitted Building Blocks and 111 schools completed the SGB Functionality Tools. DBE is doing the analysis of the tools, and will provide the Province with a detailed report on SGB Functionality during 2019. INSTITUTIONAL DEVELOPMENT UNIT Rural Education The unit conducted the Rural Education audit tool in three (3) districts namely, Frances Baard, Pixley Ka Seme and ZF Mgcawu. The number of outstanding Section 14 agreements have been reduced to six (6) and this will be done during the new financial year. School Planning The unit analysed the District Improvements Plans of five (5) districts and gave feedback to all except one. The reason for this is that no suitable date could be established due to programmes in the district. The school planning circular was also issued to all schools. SCHOOL SAFETY Capacity Building School-based training of 163 schools on Prevention of Bullying in schools National School Safety Framework National School Safety Framework: School-based roll-out in special schools; Protocol on management of sexual harassment and abuse in schools and protocol on dealing with incidents of corporal punishment in schools
Annual Report for 2018/19 Financial Year Vote 04: Department of Education
Province of the Northern Cape
33
Protocol on the management of Corporal Punishment in Schools Monitoring and support of schools in the implementation of the National School Safety Framework Monitoring and support of School Safety programmes, The development of School Safety Action Plans Emergency Readiness Establishment of emergency evacuation procedures / processes at schools Emergency evacuation drills at schools District / provincial disaster management forum meetings Incident Reporting Emergency visits / follow-up on reported incidents Collaborative Programmes (Road Safety Debates and Participatory educational techniques)
Implementation of Road Safety Programmes: Road Safety Debates (circuit, district, provincial, national) Monitoring of existing and newly established Scholar Patrols Collaborative Programmes with the South African Police Service
- Linking Schools with Police Stations; Revival of School Safety Committees; Establish reporting
systems , Implement social crime prevention programme (context-specific crime prevention programmes, searches & seizures; drug testing, awareness campaigns); Mobilise schools communities to curb crime and violence in schools; Junior Provincial Commissioner Programme
- Provincial VEP meetings, 16 days of no violence against women and children; Child Protection
Month, Gender-based violence, Victim’s rights,; Women’s month programmes - Services to LGBTIQ+, Advocacy on TIP, Advocacy on Cyber-Bullying - Children at risk and in conflict with the law IN-SCHOOL SPORT Several sporting codes, namely Rugby, Netball, Hockey and Football successfully competed in their respective national tournaments as well as the Kay Motsepe and other sponsored competitions). The National Championships: Winter Games did not take place during the scheduled time which is the June/July school holidays. Some sporting codes competed during the Summer Games in December 2018. A Northern Cape Indigenous Games team competed at the national tournament in Polokwane during the October school holidays. Netball, gymnastics and athletics structures held their elective conferences and elected new office bearers. The athletics track and field teams from Northern Cape were funded by Department of Sport, Arts and Culture. TEACHER DEVELOPMENT 1. Implementing the teacher development structure with the appointment of a director and transferring of two officials to head the Teacher Development Institute 2. 227 SACE Material Development Programs endorsed for teachers to earn CPTD points 3. Mass sign up of CPTD in the province. Recording of points happening but needs improvement 4. TASP - focus is on National Teaching Awards annually, 2016/17 we obtained position 3 in special needs, 2018 we obtained position 2 in Kader Asmal Category, we also working with SACE on professional standards and teacher responsibilities 5. The launch of English Association took place, African Languages to be launched in this financial year 6. Operationalise the TUC with the establishment of the POC in the province to assist in identification of training needs for educators and the implementation thereof

34
Annual Report for 2018/19 Financial Year Vote 04: Department of Education
Province of the Northern Cape
34
7. Strengthening of the collaboration with SPU and other HEIs (PTEDC) 8. Have establish a very good working relationship with the ETDP-SETA and to also influence the funding of courses for educators 9. TDI established (Geo & ML) for high enrolment subjects and under performing schools in JTG & FB 10. Teacher Development to take responsibility of Funza Lushaka bursaries and recruiting new and prospective students for Initial Teacher Education 11. Participation and Establishment of PLCs 12. BED program for 20 Foundation Phase teachers with bursaries from the ETDP SETA 13. Improved collaboration with stakeholders working with teacher training ie teacher unions, ETDP SETA, HEI, etc.
LEARNER TRANSPORT
Introduction When the Learner Transport programme was official taken over by the Northern Cape Department of Education (NCDoE) from the Northern Cape Department of Transport, Safety and Liaison (DTSL) on 01 April 2018 the existing contracts with transport service providers were transferred as is. The term of all the contracts ends in December 2019 and the process of advertising new tenders has been initiated. Since the migration of this function to the DTSL in transport operators (service providers) have not received any increases in the tariffs. The last 4.5% increase was effected in 2012 although the price of fuel increased over 46% over the period of 5 years. The transporters variable cost also increased year-on-year without any adjustment from DTSL. The NCDOE reached an agreement with the Northern Cape Learner Transporters to implement a 31% tariff increase backdated to 1 April 2018 to service providers who qualify. The 31% is based on the accumulated CPI Index since 2012. The tariff rate was adjusted to ensure that operators are paid the increased per kilometre category rates. For the first quarter of the 2019 academic year four new routes have been instituted despite the anticipated pressure on the 2019/2020 allocated budget for Learner Transport Programme (LTP).
Progress on implementation of the policy A three-day work sessions to facilitate the introduction of the approved standard operating procedures for Learner Transport Services and the revised Learner Transport Policy was conducted with all relevant district officials in March 2019. All operations regarding the LTP are expected to be executed, monitored and enforced in terms of the policy and the standard operating procedures. Learners Transported Per Quarter
DIS
TRIC
T
Q1-4 progress
No
of
lean
ers
tran
spor
ted
Q1
No
of
lean
ers
tran
spor
ted
Q2
No
of
lean
ers
tran
spor
ted
Q3
No
of
lean
ers
tran
spor
ted
Q4
No
scho
ol
bene
fited
Frances Baard 5 393 6 195 6 195 5 499 57
John Taolo Gaetsewe 9 354 9 508 9 393 9 482 77
ZF Mgcawu 6 534 6 534 6 404 6 762 72
Namakwa 1 228 1 302 1 273 1 294 24
Annual Report for 2018/19 Financial Year Vote 04: Department of Education
Province of the Northern Cape
35
DIS
TRIC
T
Q1-4 progress
No
of
lean
ers
tran
spor
ted
Q1
No
of
lean
ers
tran
spor
ted
Q2
No
of
lean
ers
tran
spor
ted
Q3
No
of
lean
ers
tran
spor
ted
Q4
No
scho
ol
bene
fited
Pixley ka Seme 2 150 2 106 2 055 2 213 37
TOTALS 24 659 25 645 25 320 25 250 267
INFORMATION AND COMMUNICATION TECHNOLOGY (ICT) AND EDUCATION MANAGEMENT AND INFORMATION SYSTEM (EMIS): Number of Public Schools That Use (SA-SAMS) to Electronically Provide Data to LURITS This performance indicator was fully achieved as all of the 556 public schools, including the SNE schools, make use of SA-SAMS to electronically provide data to LURITS
Increase Number of Learners Uploaded to LURITS The number of learners uploaded to LURITS as per the fourth quarter of 2018/19 financial year was at 271 732, representing 91.4% of the annual target of 297 397. The challenge with LURITS is that there are still systemic problems that need to be attended to by DBE relating to misalignment between SA-SAMS and LURITS. The problem has been reported and will be remedied through the release of SA-SAMS patch release 19.1.0
Increase Number of Schools with Internet Connectivity for School Administration The overall achievement of this sub-programme performance is at 100%. The total number of schools with internet connectivity for administration purpose stands at 557. This achievement is due to the fact that all public schools in the province were provided with Vodacom routers with monthly data bundle of about 4GB per school. However, due to challenges in Network coverage 14 schools (3%) have been identified as having unstable connectivity. The engagement with the service provider is underway in order to provide these schools with network boosters. Increase Number of Schools with Internet Connectivity for Teaching and Learning The overall achievement of this sub-programme performance is at 97%. The total number of schools with internet connectivity for teaching and learning purpose is at 542. This achievement was made possible due to the acceleration of the Universal Service and Access Obligation (USAO) project regulated by Government Gazette No. 37718 of 4 June 2014 which obliges the four main network operators to connect schools as part of their operational license. Through this project, the DBE and the DTPS, who are coordinating the project, decided to include all Northern Cape schools to the project due to the fact that the Province has the smallest number of schools in the country. The biggest challenge, though, is the fact that there is still no way forward between key stakeholders (DTPS, DBE, ICASA, USSASA and the Network providers) with regard to the provision and payment of the monthly data bundle to schools. As such the project is running the risk of being turned into a device provision project. There is an urgent need for the above mentioned stakeholders to meet and find a way forward.
Percentage of learners having access to information through connectivity, including broadband The total number of learners having access to information through connectivity is an extrapolation of number of learners in schools provided with USAO connectivity and ICT equipment divided by the total number of learners in public schools (Grade 1 to 12). This connectivity cannot be categorized as broadband connectivity as it does not qualify to be categorized as such. The achievement of this indicator, taking into consideration the explanation provided above, stands at 99%. This is against the annual target of 80%.

35
Annual Report for 2018/19 Financial Year Vote 04: Department of Education
Province of the Northern Cape
34
7. Strengthening of the collaboration with SPU and other HEIs (PTEDC) 8. Have establish a very good working relationship with the ETDP-SETA and to also influence the funding of courses for educators 9. TDI established (Geo & ML) for high enrolment subjects and under performing schools in JTG & FB 10. Teacher Development to take responsibility of Funza Lushaka bursaries and recruiting new and prospective students for Initial Teacher Education 11. Participation and Establishment of PLCs 12. BED program for 20 Foundation Phase teachers with bursaries from the ETDP SETA 13. Improved collaboration with stakeholders working with teacher training ie teacher unions, ETDP SETA, HEI, etc.
LEARNER TRANSPORT
Introduction When the Learner Transport programme was official taken over by the Northern Cape Department of Education (NCDoE) from the Northern Cape Department of Transport, Safety and Liaison (DTSL) on 01 April 2018 the existing contracts with transport service providers were transferred as is. The term of all the contracts ends in December 2019 and the process of advertising new tenders has been initiated. Since the migration of this function to the DTSL in transport operators (service providers) have not received any increases in the tariffs. The last 4.5% increase was effected in 2012 although the price of fuel increased over 46% over the period of 5 years. The transporters variable cost also increased year-on-year without any adjustment from DTSL. The NCDOE reached an agreement with the Northern Cape Learner Transporters to implement a 31% tariff increase backdated to 1 April 2018 to service providers who qualify. The 31% is based on the accumulated CPI Index since 2012. The tariff rate was adjusted to ensure that operators are paid the increased per kilometre category rates. For the first quarter of the 2019 academic year four new routes have been instituted despite the anticipated pressure on the 2019/2020 allocated budget for Learner Transport Programme (LTP).
Progress on implementation of the policy A three-day work sessions to facilitate the introduction of the approved standard operating procedures for Learner Transport Services and the revised Learner Transport Policy was conducted with all relevant district officials in March 2019. All operations regarding the LTP are expected to be executed, monitored and enforced in terms of the policy and the standard operating procedures. Learners Transported Per Quarter
DIS
TRIC
T
Q1-4 progress
No
of
lean
ers
tran
spor
ted
Q1
No
of
lean
ers
tran
spor
ted
Q2
No
of
lean
ers
tran
spor
ted
Q3
No
of
lean
ers
tran
spor
ted
Q4
No
scho
ol
bene
fited
Frances Baard 5 393 6 195 6 195 5 499 57
John Taolo Gaetsewe 9 354 9 508 9 393 9 482 77
ZF Mgcawu 6 534 6 534 6 404 6 762 72
Namakwa 1 228 1 302 1 273 1 294 24
Annual Report for 2018/19 Financial Year Vote 04: Department of Education
Province of the Northern Cape
35
DIS
TRIC
T Q1-4 progress
No
of
lean
ers
tran
spor
ted
Q1
No
of
lean
ers
tran
spor
ted
Q2
No
of
lean
ers
tran
spor
ted
Q3
No
of
lean
ers
tran
spor
ted
Q4
No
scho
ol
bene
fited
Pixley ka Seme 2 150 2 106 2 055 2 213 37
TOTALS 24 659 25 645 25 320 25 250 267
INFORMATION AND COMMUNICATION TECHNOLOGY (ICT) AND EDUCATION MANAGEMENT AND INFORMATION SYSTEM (EMIS): Number of Public Schools That Use (SA-SAMS) to Electronically Provide Data to LURITS This performance indicator was fully achieved as all of the 556 public schools, including the SNE schools, make use of SA-SAMS to electronically provide data to LURITS
Increase Number of Learners Uploaded to LURITS The number of learners uploaded to LURITS as per the fourth quarter of 2018/19 financial year was at 271 732, representing 91.4% of the annual target of 297 397. The challenge with LURITS is that there are still systemic problems that need to be attended to by DBE relating to misalignment between SA-SAMS and LURITS. The problem has been reported and will be remedied through the release of SA-SAMS patch release 19.1.0
Increase Number of Schools with Internet Connectivity for School Administration The overall achievement of this sub-programme performance is at 100%. The total number of schools with internet connectivity for administration purpose stands at 557. This achievement is due to the fact that all public schools in the province were provided with Vodacom routers with monthly data bundle of about 4GB per school. However, due to challenges in Network coverage 14 schools (3%) have been identified as having unstable connectivity. The engagement with the service provider is underway in order to provide these schools with network boosters. Increase Number of Schools with Internet Connectivity for Teaching and Learning The overall achievement of this sub-programme performance is at 97%. The total number of schools with internet connectivity for teaching and learning purpose is at 542. This achievement was made possible due to the acceleration of the Universal Service and Access Obligation (USAO) project regulated by Government Gazette No. 37718 of 4 June 2014 which obliges the four main network operators to connect schools as part of their operational license. Through this project, the DBE and the DTPS, who are coordinating the project, decided to include all Northern Cape schools to the project due to the fact that the Province has the smallest number of schools in the country. The biggest challenge, though, is the fact that there is still no way forward between key stakeholders (DTPS, DBE, ICASA, USSASA and the Network providers) with regard to the provision and payment of the monthly data bundle to schools. As such the project is running the risk of being turned into a device provision project. There is an urgent need for the above mentioned stakeholders to meet and find a way forward.
Percentage of learners having access to information through connectivity, including broadband The total number of learners having access to information through connectivity is an extrapolation of number of learners in schools provided with USAO connectivity and ICT equipment divided by the total number of learners in public schools (Grade 1 to 12). This connectivity cannot be categorized as broadband connectivity as it does not qualify to be categorized as such. The achievement of this indicator, taking into consideration the explanation provided above, stands at 99%. This is against the annual target of 80%.

36
Annual Report for 2018/19 Financial Year Vote 04: Department of Education
Province of the Northern Cape
36
The Percentage of Children Who Turned 9 in the Previous Year Who Are Currently Enrolled In Grade 4 (Or a Higher Grade) The percentage of children who turned 9 in the previous year and who are currently enrolled in Grade 4 or higher stands at 94.5% (22 527 of 23 844) as per the four quarters of the financial year. This is against the annual target of 67% (15 745 of 23 500)
The Percentage of Children Who Turned 12 in the Preceding Year Who Are Currently Enrolled In Grade 7 (Or a Higher Grade) The percentage of children who turned 12 in the previous year and who are currently enrolled in Grade 7 or higher stands at 78.7.5% (16 955 of 21 555) as per the four quarters of the financial year. This is against the annual target of 56% (12 255 of 21 500) Learner Absenteeism Rate At the end of Quarter Four of the 2018-19 financial year, learners’ absenteeism rate stood at 4.3% (2 308 620/54 152 572) against the annual target of 4%. Teacher Absenteeism Rate At the end of Quarter Four of the 2018-19 financial year, teachers’ absenteeism rate stood at 4.8% (99 786/ 2 091 192) against the annual target of 6%.
Annu
al R
epor
t for
201
8/19
Fin
ancia
l Yea
r Vo
te 0
4: D
epar
tmen
t of E
duca
tion
Prov
ince
of t
he N
orth
ern
Cape
37
St
rate
gic
obje
ctiv
es:
Prog
ram
me
1: A
dmin
istr
atio
n
Stra
tegi
c ob
ject
ives
A
ctua
l A
chie
vem
ent
2017
/201
8
Plan
ned
Targ
et
2018
/201
9
Act
ual
Ach
ieve
men
t 20
18/2
019
Dev
iatio
n fr
om
Plan
ned
Targ
et
for 2
018/
2019
C
omm
ent o
n de
viat
ions
To p
rovi
de s
uppo
rt to
the
Dep
artm
ent a
nd it
s 56
1 le
arni
ng a
nd te
achi
ng in
stitu
tions
to b
ring
them
to
optim
al fu
nctio
nalit
y by
203
0.
556
558
557
-1
One
sch
ool,
Wre
nchv
ille
Prim
ary
Sch
ool
was
not
co
mpl
eted
on
time
as c
ontra
ctor
req
uest
ed t
ime
exte
nsio
n
Pe
rfor
man
ce in
dica
tors
Prog
ram
me
1: A
dmin
istr
atio
n
Perf
orm
ance
Indi
cato
r A
ctua
l A
chie
vem
ent
2016
/201
7
Plan
ned
Targ
et
2017
/201
8
Act
ual
Ach
ieve
men
t 20
17/2
018
Dev
iatio
n fr
om P
lann
ed
Targ
et f
or
2017
/201
8 C
omm
ent o
n de
viat
ions
PP
M10
1:N
umbe
r of
pub
lic s
choo
ls t
hat
use
the
Sou
th
Afric
an
Scho
ols
Adm
inis
tratio
n an
d M
anag
emen
t S
yste
ms
(SA
-SA
Ms)
to
el
ectro
nica
lly p
rovi
de d
ata
556
558
557
-1
One
sch
ool,
Wre
nchv
ille
Prim
ary
Sch
ool
was
no
t co
mpl
eted
on
tim
e as
th
e co
ntra
ctor
re
ques
ted
time
exte
nsio
n
PP
M10
2:N
umbe
r of
pub
lic s
choo
ls t
hat
can
be
cont
acte
d el
ectro
nica
lly (e
-mai
l) 55
4 55
6 55
5 -1
O
ne s
choo
l, W
renc
hvill
e P
rimar
y S
choo
l w
as
not
com
plet
ed
on
time
as
the
cont
ract
or
requ
este
d tim
e ex
tens
ion
PP
M10
3:P
erce
ntag
e of
ed
ucat
ion
expe
nditu
re
goin
g to
war
ds n
on-p
erso
nnel
item
s*
23.4
%
23.4
%
23.5
%
0.1%
T
arge
t rea
ched
(1 5
00 7
03/
6 41
7 22
3)
(1 5
42 0
07/
6 55
5 35
2)
PP
M10
4:P
erce
ntag
e of
sch
ools
vis
ited
at l
east
tw
ice
a ye
ar b
y D
istri
ct o
ffici
als
for m
onito
ring
and
supp
ort p
urpo
ses
53
.8%
87
.1%
33
.3%
S
uppo
rt to
sch
ools
had
to b
e in
tens
ified
due
to
an in
crea
se in
the
num
ber o
f und
er-p
erfo
rmin
g pr
imar
y an
d hi
gh s
choo
ls
540
(300
/558
) (4
84/5
56)

37
Annual Report for 2018/19 Financial Year Vote 04: Department of Education
Province of the Northern Cape
36
The Percentage of Children Who Turned 9 in the Previous Year Who Are Currently Enrolled In Grade 4 (Or a Higher Grade) The percentage of children who turned 9 in the previous year and who are currently enrolled in Grade 4 or higher stands at 94.5% (22 527 of 23 844) as per the four quarters of the financial year. This is against the annual target of 67% (15 745 of 23 500)
The Percentage of Children Who Turned 12 in the Preceding Year Who Are Currently Enrolled In Grade 7 (Or a Higher Grade) The percentage of children who turned 12 in the previous year and who are currently enrolled in Grade 7 or higher stands at 78.7.5% (16 955 of 21 555) as per the four quarters of the financial year. This is against the annual target of 56% (12 255 of 21 500) Learner Absenteeism Rate At the end of Quarter Four of the 2018-19 financial year, learners’ absenteeism rate stood at 4.3% (2 308 620/54 152 572) against the annual target of 4%. Teacher Absenteeism Rate At the end of Quarter Four of the 2018-19 financial year, teachers’ absenteeism rate stood at 4.8% (99 786/ 2 091 192) against the annual target of 6%.
Annu
al R
epor
t for
201
8/19
Fin
ancia
l Yea
r Vo
te 0
4: D
epar
tmen
t of E
duca
tion
Prov
ince
of t
he N
orth
ern
Cape
37
St
rate
gic
obje
ctiv
es:
Prog
ram
me
1: A
dmin
istr
atio
n
Stra
tegi
c ob
ject
ives
A
ctua
l A
chie
vem
ent
2017
/201
8
Plan
ned
Targ
et
2018
/201
9
Act
ual
Ach
ieve
men
t 20
18/2
019
Dev
iatio
n fr
om
Plan
ned
Targ
et
for 2
018/
2019
C
omm
ent o
n de
viat
ions
To p
rovi
de s
uppo
rt to
the
Dep
artm
ent a
nd it
s 56
1 le
arni
ng a
nd te
achi
ng in
stitu
tions
to b
ring
them
to
optim
al fu
nctio
nalit
y by
203
0.
556
558
557
-1
One
sch
ool,
Wre
nchv
ille
Prim
ary
Sch
ool
was
not
co
mpl
eted
on
time
as c
ontra
ctor
req
uest
ed t
ime
exte
nsio
n
Pe
rfor
man
ce in
dica
tors
Prog
ram
me
1: A
dmin
istr
atio
n
Perf
orm
ance
Indi
cato
r A
ctua
l A
chie
vem
ent
2016
/201
7
Plan
ned
Targ
et
2017
/201
8
Act
ual
Ach
ieve
men
t 20
17/2
018
Dev
iatio
n fr
om P
lann
ed
Targ
et f
or
2017
/201
8 C
omm
ent o
n de
viat
ions
PP
M10
1:N
umbe
r of
pub
lic s
choo
ls t
hat
use
the
Sou
th
Afric
an
Scho
ols
Adm
inis
tratio
n an
d M
anag
emen
t S
yste
ms
(SA
-SA
Ms)
to
el
ectro
nica
lly p
rovi
de d
ata
556
558
557
-1
One
sch
ool,
Wre
nchv
ille
Prim
ary
Sch
ool
was
no
t co
mpl
eted
on
tim
e as
th
e co
ntra
ctor
re
ques
ted
time
exte
nsio
n
PP
M10
2:N
umbe
r of
pub
lic s
choo
ls t
hat
can
be
cont
acte
d el
ectro
nica
lly (e
-mai
l) 55
4 55
6 55
5 -1
O
ne s
choo
l, W
renc
hvill
e P
rimar
y S
choo
l w
as
not
com
plet
ed
on
time
as
the
cont
ract
or
requ
este
d tim
e ex
tens
ion
PP
M10
3:P
erce
ntag
e of
ed
ucat
ion
expe
nditu
re
goin
g to
war
ds n
on-p
erso
nnel
item
s*
23.4
%
23.4
%
23.5
%
0.1%
T
arge
t rea
ched
(1 5
00 7
03/
6 41
7 22
3)
(1 5
42 0
07/
6 55
5 35
2)
PP
M10
4:P
erce
ntag
e of
sch
ools
vis
ited
at l
east
tw
ice
a ye
ar b
y D
istri
ct o
ffici
als
for m
onito
ring
and
supp
ort p
urpo
ses
53
.8%
87
.1%
33
.3%
S
uppo
rt to
sch
ools
had
to b
e in
tens
ified
due
to
an in
crea
se in
the
num
ber o
f und
er-p
erfo
rmin
g pr
imar
y an
d hi
gh s
choo
ls
540
(300
/558
) (4
84/5
56)

38
Annu
al R
epor
t for
201
8/19
Fin
ancia
l Yea
r Vo
te 0
4: D
epar
tmen
t of E
duca
tion
Prov
ince
of t
he N
orth
ern
Cape
38
Sub-
prog
ram
me
1.2:
Cor
pora
te S
ervi
ces
Perf
orm
ance
Indi
cato
r A
ctua
l A
chie
vem
ent
2016
/201
7
Plan
ned
Targ
et
2017
/201
8
Act
ual
Ach
ieve
men
t 20
17/2
018
Dev
iatio
n fr
om
Plan
ned
Targ
et
for 2
017/
2018
C
omm
ent o
n de
viat
ions
1.2.
1:Pe
rcen
tage
of
lear
ners
hav
ing
acce
ss t
o in
form
atio
n th
roug
h
conn
ectiv
ity,
incl
udin
g br
oadb
and
76.6
%
80%
99
%
19%
10
0 ad
ditio
nal
scho
ols
wer
e co
nnec
ted
by
serv
ice
prov
ider
s in
com
plia
nce
with
the
US
AO
ag
reem
ent
(426
/556
) (2
32 8
00/
291
000)
(2
94 6
79/
297
697)
1.
2.2:
The
perc
enta
ge o
f sc
hool
prin
cipa
ls r
atin
g th
e su
ppor
t se
rvic
es
of
dist
ricts
as
be
ing
satis
fact
ory
N/A
50
%
84%
34
%
Ther
e ar
e su
ffici
ent c
ircui
t man
ager
s to
ser
vice
al
l the
sch
ools
in th
e pr
ovin
ce
(279
/558
) (6
8/81
) 1.
2.3:
Perc
enta
ge
of
scho
ols
prod
ucin
g th
e m
inim
um s
et o
f m
anag
emen
t do
cum
ents
at
a re
quire
d st
anda
rd
69%
43
%
71.2
%
28.2
%
Effe
ct
of
com
puls
ory
indu
ctio
n of
S
MT
mem
bers
that
lead
s to
gre
ater
com
plia
nce
by
scho
ol m
anag
ers
(118
/171
) (2
40/5
58)
(52/
73)
1.2.
4:Pe
rcen
tage
of
S
choo
l G
over
ning
B
odie
s th
at
mee
t th
e m
inim
um
cr
iteria
in
te
rms
of
effe
ctiv
enes
s ev
ery
year
35.9
%
36%
55
.9%
19
.9%
E
ffect
ive
train
ing
and
supp
ort g
iven
to S
choo
l G
over
ning
Bod
ies
by d
istri
ct o
ffici
als
(7
1/19
8)
(200
/558
) (5
2/93
) 1.
2.5:
The
perc
enta
ge o
f sc
hool
s w
ith m
ore
than
on
e fin
anci
al
resp
onsi
bilit
y on
th
e ba
sis
of
asse
ssm
ent
99.3
%
98%
99
.3%
1.
3%
No
scho
ol
forfe
ited
thei
r se
ctio
n 21
st
atus
du
ring
the
perio
d un
der r
evie
w
(552
/556
) (5
47/5
58)
(552
/556
)
1.2.
6:Pe
rcen
tage
of
te
xtbo
oks
deliv
ered
to
sc
hool
s as
per
ord
ers
plac
ed b
efor
e th
e re
open
ing
of s
choo
ls
97%
95
%
98%
3%
O
rder
ing
and
deliv
ery
of
book
s w
as
wel
l m
anag
ed
(159
380
/ 16
4 30
9)
(693
500
/ 73
0 00
0)
(384
224
/ 39
2 06
5)
1.2.
7:C
ompl
ete
and
cons
iste
nt p
ost-p
rovi
sion
ing
polic
y an
d re
gula
tions
in p
lace
and
pro
ceed
with
im
plem
enta
tion
and
mon
itorin
g 10
0%
100%
10
0%
0
1.2.
8:Pe
rcen
tage
of
dist
rict
man
ager
s as
sess
ed
agai
nst d
evel
oped
crit
eria
10
0%
100%
10
0%
0
(5
/5)
(5/5
)
Annu
al R
epor
t for
201
8/19
Fin
ancia
l Yea
r Vo
te 0
4: D
epar
tmen
t of E
duca
tion
Prov
ince
of t
he N
orth
ern
Cape
39
Sub-
prog
ram
me
1.3:
Edu
catio
n M
anag
emen
t
Perf
orm
ance
Indi
cato
r A
ctua
l A
chie
vem
ent
2016
/201
7
Plan
ned
Targ
et
2017
/201
8
Act
ual
Ach
ieve
men
t 20
17/2
018
Dev
iatio
n fr
om
Plan
ned
Targ
et
for 2
017/
2018
C
omm
ent o
n de
viat
ions
1.3.
1:Pe
rcen
tage
of
teac
hers
mee
ting
requ
ired
cont
ent k
now
ledg
e le
vels
afte
r sup
port
58.4
%
70%
73
.9%
3.
9%
Impr
oved
tra
inin
g m
etho
dolo
gies
us
ed
by
faci
litat
ors
(217
/372
) (7
0/10
0)
(387
/524
)
1.3.
2:Pe
rcen
tage
of
lear
ners
who
com
plet
e th
e w
hole
cur
ricul
um e
ach
year
90.7
%
91%
77
.7%
-1
3.3%
H
igh
num
ber o
f nov
ice
educ
ator
s te
achi
ng k
ey
subj
ects
for t
he fi
rst t
ime
(49/
54)
(250
614
/ 27
5 40
0)
(167
/215
)
Sub-
prog
ram
me
1.4:
Hum
an R
esou
rce
Dev
elop
men
t
Perf
orm
ance
Indi
cato
r A
ctua
l A
chie
vem
ent
2016
/201
7
Plan
ned
Targ
et
2017
/201
8
Act
ual
Ach
ieve
men
t 20
17/2
018
Dev
iatio
n fr
om
Plan
ned
Targ
et
for 2
017/
2018
C
omm
ent o
n de
viat
ions
1.4.
1:Th
e av
erag
e ho
urs
per
year
sp
ent
by
teac
hers
on
prof
essi
onal
dev
elop
men
t act
iviti
es
14.3
60
19
.4
-40.
6 W
ork
to ru
le h
ad a
neg
ativ
e im
pact
on
teac
her
deve
lopm
ent p
rogr
amm
e (6
923/
485)
(353
3.75
/182
)
1.4.
2:N
umbe
r of
tea
cher
s w
ho h
ave
writ
ten
the
Sel
f-Dia
gnos
tic A
sses
smen
ts
N/A
10
0 0
-100
Th
e D
epar
tmen
t an
d la
bour
uni
ons
have
not
ag
reed
up
on
a su
itabl
e as
sess
men
t ar
rang
emen
t 1.
4.3:
Perc
enta
ge o
f le
arne
rs i
n sc
hool
s w
ith a
t le
ast
one
educ
ator
with
spe
cial
ist
train
ing
on
incl
usio
n N
/A
10%
16
.1%
6.
1%
Mor
e ed
ucat
ors
have
su
itabl
e re
med
ial
qual
ifica
tions
(2
7 54
0/
275
400)
(4
3110
/ 26
7 70
6)
1.4.
4:Pe
rcen
tage
of
Fu
nza
Lush
aka
burs
ary
hold
ers
plac
ed b
y Ju
ne o
f the
yea
r afte
r qua
lifyi
ng
108
100%
75
.7%
-2
4.3%
S
ome
burs
ary
hold
ers
refu
sed
appo
intm
ents
in
rura
l are
as
(100
/100
) (5
6/74
) 1.
4.5:
Num
ber
of q
ualif
ied
Gra
de R
-12
teac
hers
, ag
ed 3
0 an
d be
low
, ent
erin
g th
e pu
blic
ser
vice
as
teac
hers
for t
he fi
rst t
ime
durin
g th
e fin
anci
al y
ear
187
100
272
172
Tem
pora
ry a
nd s
ubst
itute
edu
cato
rs a
ppoi
nted
in
vac
ant p
osts
resu
lting
from
resi
gnat
ions
and
re
tirem
ents
1.4.
6:Pe
rcen
tage
of
sc
hool
s w
here
al
loca
ted
teac
hing
pos
ts a
re a
ll fil
led
87
.60%
91
%
94.1
%
3.1%
Im
prov
ed r
ecru
itmen
t ef
forts
by
scho
ols
and
dist
ricts
as
wel
l as
app
ropr
iate
app
oint
men
t sy
stem
s pu
t in
plac
e (4
87/5
56)
(508
/558
) (5
23/5
56)

39
Annu
al R
epor
t for
201
8/19
Fin
ancia
l Yea
r Vo
te 0
4: D
epar
tmen
t of E
duca
tion
Prov
ince
of t
he N
orth
ern
Cape
39
Sub-
prog
ram
me
1.3:
Edu
catio
n M
anag
emen
t
Perf
orm
ance
Indi
cato
r A
ctua
l A
chie
vem
ent
2016
/201
7
Plan
ned
Targ
et
2017
/201
8
Act
ual
Ach
ieve
men
t 20
17/2
018
Dev
iatio
n fr
om
Plan
ned
Targ
et
for 2
017/
2018
C
omm
ent o
n de
viat
ions
1.3.
1:Pe
rcen
tage
of
teac
hers
mee
ting
requ
ired
cont
ent k
now
ledg
e le
vels
afte
r sup
port
58.4
%
70%
73
.9%
3.
9%
Impr
oved
tra
inin
g m
etho
dolo
gies
us
ed
by
faci
litat
ors
(217
/372
) (7
0/10
0)
(387
/524
)
1.3.
2:Pe
rcen
tage
of
lear
ners
who
com
plet
e th
e w
hole
cur
ricul
um e
ach
year
90.7
%
91%
77
.7%
-1
3.3%
H
igh
num
ber o
f nov
ice
educ
ator
s te
achi
ng k
ey
subj
ects
for t
he fi
rst t
ime
(49/
54)
(250
614
/ 27
5 40
0)
(167
/215
)
Sub-
prog
ram
me
1.4:
Hum
an R
esou
rce
Dev
elop
men
t
Perf
orm
ance
Indi
cato
r A
ctua
l A
chie
vem
ent
2016
/201
7
Plan
ned
Targ
et
2017
/201
8
Act
ual
Ach
ieve
men
t 20
17/2
018
Dev
iatio
n fr
om
Plan
ned
Targ
et
for 2
017/
2018
C
omm
ent o
n de
viat
ions
1.4.
1:Th
e av
erag
e ho
urs
per
year
sp
ent
by
teac
hers
on
prof
essi
onal
dev
elop
men
t act
iviti
es
14.3
60
19
.4
-40.
6 W
ork
to ru
le h
ad a
neg
ativ
e im
pact
on
teac
her
deve
lopm
ent p
rogr
amm
e (6
923/
485)
(353
3.75
/182
)
1.4.
2:N
umbe
r of
tea
cher
s w
ho h
ave
writ
ten
the
Sel
f-Dia
gnos
tic A
sses
smen
ts
N/A
10
0 0
-100
Th
e D
epar
tmen
t an
d la
bour
uni
ons
have
not
ag
reed
up
on
a su
itabl
e as
sess
men
t ar
rang
emen
t 1.
4.3:
Perc
enta
ge o
f le
arne
rs i
n sc
hool
s w
ith a
t le
ast
one
educ
ator
with
spe
cial
ist
train
ing
on
incl
usio
n N
/A
10%
16
.1%
6.
1%
Mor
e ed
ucat
ors
have
su
itabl
e re
med
ial
qual
ifica
tions
(2
7 54
0/
275
400)
(4
3110
/ 26
7 70
6)
1.4.
4:Pe
rcen
tage
of
Fu
nza
Lush
aka
burs
ary
hold
ers
plac
ed b
y Ju
ne o
f the
yea
r afte
r qua
lifyi
ng
108
100%
75
.7%
-2
4.3%
S
ome
burs
ary
hold
ers
refu
sed
appo
intm
ents
in
rura
l are
as
(100
/100
) (5
6/74
) 1.
4.5:
Num
ber
of q
ualif
ied
Gra
de R
-12
teac
hers
, ag
ed 3
0 an
d be
low
, ent
erin
g th
e pu
blic
ser
vice
as
teac
hers
for t
he fi
rst t
ime
durin
g th
e fin
anci
al y
ear
187
100
272
172
Tem
pora
ry a
nd s
ubst
itute
edu
cato
rs a
ppoi
nted
in
vac
ant p
osts
resu
lting
from
resi
gnat
ions
and
re
tirem
ents
1.4.
6:Pe
rcen
tage
of
sc
hool
s w
here
al
loca
ted
teac
hing
pos
ts a
re a
ll fil
led
87
.60%
91
%
94.1
%
3.1%
Im
prov
ed r
ecru
itmen
t ef
forts
by
scho
ols
and
dist
ricts
as
wel
l as
app
ropr
iate
app
oint
men
t sy
stem
s pu
t in
plac
e (4
87/5
56)
(508
/558
) (5
23/5
56)

40
Annu
al R
epor
t for
201
8/19
Fin
ancia
l Yea
r Vo
te 0
4: D
epar
tmen
t of E
duca
tion
Prov
ince
of t
he N
orth
ern
Cape
40
Sub-
prog
ram
me
1.5:
Edu
catio
n M
anag
emen
t Inf
orm
atio
n Sy
stem
Perf
orm
ance
Indi
cato
r A
ctua
l A
chie
vem
ent
2016
/201
7
Plan
ned
Targ
et
2017
/201
8
Act
ual
Ach
ieve
men
t 20
17/2
018
Dev
iatio
n fr
om
Plan
ned
Targ
et
for 2
017/
2018
C
omm
ent o
n de
viat
ions
1.5.
1:Pe
rcen
tage
of
7 to
15
year
old
s at
tend
ing
educ
atio
n in
stitu
tions
N
/A
99.8
%
102.
4%
2.6%
G
reat
er
in-m
igra
tion
of
scho
ol-a
ge
lear
ners
fro
m o
ther
pro
vinc
es
(195
585
/ 19
5 97
7)
(200
643
/ 19
5 97
7)
Annual Report for 2018/19 Financial Year Vote 04: Department of Education
Province of the Northern Cape
41
Strategy to overcome areas of under performance
Over the MTEF targets will be scaled down because of marginal budget increases Changes to planned targets
There were no changes to planned targets
Linking performance with budgets
Departments must provide a summary of the actual expenditure in comparison to the adjusted appropriation for both the current year and previous year. The information must be provided at a sub-programme level and must agree to the appropriation statement of the audited financial statements. Reasons for variations should be linked to the information discussed above in the organisational environment and the service delivery environment. The department must also report on how expenditure contributed to achievement of outputs. Sub-programme expenditure
The Department was able to reach 17 of the 21 targets, (81%), it set in Programme 1: Administration in the current financial year. A "work-to-rule” industrial action in the first quarter hampered teacher training programmes. Some Funza Lushaka bursary holders did not take up posts offered in rural areas. The Department of Basic Education and educator unions have not been able to agree on a suitable arrangement for educator self-diagnostic assessment. Curriculum completion is being hampered by educators who are teaching subjects for the first time.
Final Actual Final Actual
Appropriation Expenditure Appropriation Expenditure
R’000 R’000 R’000 R’000 R’000 R’000
Office of the MEC 12 202 12 202 - 11 513 11 513 -
Corporate Services 344 336 346 798 (2 462) 326 152 322 943 3 209
Education Management 272 221 272 871 (650) 248 542 248 542 -
Human Resource Development 21 999 22 189 (190) 22 449 22 384 65
EMIS 9 682 9 682 - 19 300 12 678 6 622
Total 660 440 663 742 (3 302) 627 956 618 060 9 896
Programme 1: Administration
2018/2019 2017/2018
(Over)/Under Expenditure
(Over)/Under Expenditure

41
Annual Report for 2018/19 Financial Year Vote 04: Department of Education
Province of the Northern Cape
41
Strategy to overcome areas of under performance
Over the MTEF targets will be scaled down because of marginal budget increases Changes to planned targets
There were no changes to planned targets
Linking performance with budgets
Departments must provide a summary of the actual expenditure in comparison to the adjusted appropriation for both the current year and previous year. The information must be provided at a sub-programme level and must agree to the appropriation statement of the audited financial statements. Reasons for variations should be linked to the information discussed above in the organisational environment and the service delivery environment. The department must also report on how expenditure contributed to achievement of outputs. Sub-programme expenditure
The Department was able to reach 17 of the 21 targets, (81%), it set in Programme 1: Administration in the current financial year. A "work-to-rule” industrial action in the first quarter hampered teacher training programmes. Some Funza Lushaka bursary holders did not take up posts offered in rural areas. The Department of Basic Education and educator unions have not been able to agree on a suitable arrangement for educator self-diagnostic assessment. Curriculum completion is being hampered by educators who are teaching subjects for the first time.
Final Actual Final Actual
Appropriation Expenditure Appropriation Expenditure
R’000 R’000 R’000 R’000 R’000 R’000
Office of the MEC 12 202 12 202 - 11 513 11 513 -
Corporate Services 344 336 346 798 (2 462) 326 152 322 943 3 209
Education Management 272 221 272 871 (650) 248 542 248 542 -
Human Resource Development 21 999 22 189 (190) 22 449 22 384 65
EMIS 9 682 9 682 - 19 300 12 678 6 622
Total 660 440 663 742 (3 302) 627 956 618 060 9 896
Programme 1: Administration
2018/2019 2017/2018
(Over)/Under Expenditure
(Over)/Under Expenditure

42
Annual Report for 2018/19 Financial Year Vote 04: Department of Education
Province of the Northern Cape
42
4.2 Programme 2: PUBLIC ORDINARY SCHOOL EDUCATION
Objective of Programme: To provide public ordinary education from Grade 1 to 12, in accordance with the South African Schools Act and White Paper 6 on inclusive education. (E-learning is also included)
Sub-programmes Sub-programme 2.1: Public Primary Level
To provide specific public primary ordinary schools (including inclusive education) with resources required for the Grade 1 to 7 level.
Sub-programme 2.2: Public Secondary Level To provide specific public secondary ordinary schools (including inclusive education) with resources
required for the Grade 8 to 12 levels. Sub-programme 2.3: Human resource development
To provide departmental services for the development of educators and non-educators in public ordinary schools (including inclusive education).
Sub-programme 2.4: School sport, culture and media services To provide additional and departmentally managed sporting, cultural and reading activities in public
ordinary schools (including inclusive education). Sub-programme 2.5: Conditional grants
To provide for projects (including inclusive education,. under Programme 2 specified by the Department of Basic Education and funded by conditional grants.
Strategic objectives, performance indicators, planned targets and actual achievements
Achievements CURRICULUM MANAGEMENT AND DELIVERY The focus of the activities in the Curriculum Management and Delivery Chief Directorate was to ensure that quality teaching and learning occurred through the provision of support to teachers and learners. A substantial investment was made to support teachers and learners who showed deficiencies in subject content or lacked confidence to obtain a quality NSC.
All activities were responding to the challenges outlined in the analysis of results, the reports on school visits, DBE oversight visits to the province, moderation processes as well as the School Bag Audits conducted at certain points during the year. Cross-cutting Activities The year commenced with the Annual Curriculum Roadshow conducted by the provincial subject co-ordinators as well as Curriculum Support Services for grade R-12 teachers and School Management Teams. This is a provincially driven activity that sets the tone for the year for all districts which starts in January and ends in February. The focus of the GET Roadshow was to:
mediate the handwriting guidelines for grades R-3; give progress on the Incremental introduction of African Language (IIAL)activities; discuss Literacy and Numeracy (LITNUM) strategy and Mathematics, Science and Technology
(MST) activities; discuss the use of SIAS as a critical approach to ensure early identification and remediation, in
the context of concessions and accommodation;
Annual Report for 2018/19 Financial Year Vote 04: Department of Education
Province of the Northern Cape
43
present and discuss centralised moderation reports with the purpose of strengthening languages and mathematics teaching.
In addition, the school-based moderation findings were discussed and how they informed the Provincial Subject Improvement Plans. Guidance was also given on the development of Subject Improvement Plans.
In the FET, the 2018 results were discussed in detail as well as the strengths and weaknesses highlighted in the National Senior Certificate Diagnostic Report. Provincial subject targets were set and teachers were guided on the setting of targets at school level. A curriculum roadshow with Senior Management Teams (SMTs) of underperforming schools was also conducted to provide SMTs with an overview of the status of learner performance. CURRICULUM SUPPORT SERVICES Promotion of Reading 60 reading and mathematics coaches funded by the De Aar and Droogfontein Solar Power (Globeleq), 15 funded by ACCIONA in the John Taolo Gaetsewe (JTG) District and 22 funded by Kolomela have been appointed. This brought the total number of reading and maths coaches to 203. 30 schools in the Province participated in the Spell It programme. This is a literacy improvement programme with a special focus on Grade 4 learners in collaboration with SPELL IT SA. To further strengthen reading, 828 teachers and 20 officials were trained on Phase 2 to 4 Primary School Reading Intervention Programme for English First Additional Language (EFAL) in collaboration with the National Education Collaboration Trust (NECT). A three-day workshop to strengthen reading and mathematics in schools was held for 32 foundation and intermediate phase reading assistants and 38 intermediate and senior phase maths assistants from Pixley ka Seme (PKS) and ZF Mgcawu (ZFM). The teaching and learning of language was enhanced through the participation of 1 032 intermediate phase learners in a Spelling Bee competition and 4 150 Grade 1 – 10 learners in Woorde Open Wêreld (WOW). 30 learners, 3 per grade, represented the province at national level in Stellenbosch. Out of the 10 categories, the provincial learners were declared champions in 6. The provincial Spelling Bee for 30 learners was held in collaboration with CAMP I AM. They sponsored learners with 1 300 learner workbooks and CD’s. A Reading Edutainment school holiday programme was conducted at 10 venues in Frances Baard and Pixley Ka Seme Districts and 1 529 participants were involved in various reading activities. 32 out-of-school youth who are ETDPSETA library assistants were placed in learnerships in the ZF Mgcawu District and 25 library assistants were appointed in 25 schools in Frances Baard District through the EPWP. 1 800 books were donated by SAPESI and distributed to 19 schools.
Improving Maths and Science Participation Rate In an effort to increase the participation rate of leaners in Maths and Science, the following activities were prioritised: 2 680 intermediate phase learners participated in the maths challenge; 1300 grade 7-9 learners wrote the Natural Science Olympiad; 440 grade 7 learners participated in the Astro Quiz. 19 130 learners and 181 teachers were involved in the National Science Week.

43
Annual Report for 2018/19 Financial Year Vote 04: Department of Education
Province of the Northern Cape
42
4.2 Programme 2: PUBLIC ORDINARY SCHOOL EDUCATION
Objective of Programme: To provide public ordinary education from Grade 1 to 12, in accordance with the South African Schools Act and White Paper 6 on inclusive education. (E-learning is also included)
Sub-programmes Sub-programme 2.1: Public Primary Level
To provide specific public primary ordinary schools (including inclusive education) with resources required for the Grade 1 to 7 level.
Sub-programme 2.2: Public Secondary Level To provide specific public secondary ordinary schools (including inclusive education) with resources
required for the Grade 8 to 12 levels. Sub-programme 2.3: Human resource development
To provide departmental services for the development of educators and non-educators in public ordinary schools (including inclusive education).
Sub-programme 2.4: School sport, culture and media services To provide additional and departmentally managed sporting, cultural and reading activities in public
ordinary schools (including inclusive education). Sub-programme 2.5: Conditional grants
To provide for projects (including inclusive education,. under Programme 2 specified by the Department of Basic Education and funded by conditional grants.
Strategic objectives, performance indicators, planned targets and actual achievements
Achievements CURRICULUM MANAGEMENT AND DELIVERY The focus of the activities in the Curriculum Management and Delivery Chief Directorate was to ensure that quality teaching and learning occurred through the provision of support to teachers and learners. A substantial investment was made to support teachers and learners who showed deficiencies in subject content or lacked confidence to obtain a quality NSC.
All activities were responding to the challenges outlined in the analysis of results, the reports on school visits, DBE oversight visits to the province, moderation processes as well as the School Bag Audits conducted at certain points during the year. Cross-cutting Activities The year commenced with the Annual Curriculum Roadshow conducted by the provincial subject co-ordinators as well as Curriculum Support Services for grade R-12 teachers and School Management Teams. This is a provincially driven activity that sets the tone for the year for all districts which starts in January and ends in February. The focus of the GET Roadshow was to:
mediate the handwriting guidelines for grades R-3; give progress on the Incremental introduction of African Language (IIAL)activities; discuss Literacy and Numeracy (LITNUM) strategy and Mathematics, Science and Technology
(MST) activities; discuss the use of SIAS as a critical approach to ensure early identification and remediation, in
the context of concessions and accommodation;
Annual Report for 2018/19 Financial Year Vote 04: Department of Education
Province of the Northern Cape
43
present and discuss centralised moderation reports with the purpose of strengthening languages and mathematics teaching.
In addition, the school-based moderation findings were discussed and how they informed the Provincial Subject Improvement Plans. Guidance was also given on the development of Subject Improvement Plans.
In the FET, the 2018 results were discussed in detail as well as the strengths and weaknesses highlighted in the National Senior Certificate Diagnostic Report. Provincial subject targets were set and teachers were guided on the setting of targets at school level. A curriculum roadshow with Senior Management Teams (SMTs) of underperforming schools was also conducted to provide SMTs with an overview of the status of learner performance. CURRICULUM SUPPORT SERVICES Promotion of Reading 60 reading and mathematics coaches funded by the De Aar and Droogfontein Solar Power (Globeleq), 15 funded by ACCIONA in the John Taolo Gaetsewe (JTG) District and 22 funded by Kolomela have been appointed. This brought the total number of reading and maths coaches to 203. 30 schools in the Province participated in the Spell It programme. This is a literacy improvement programme with a special focus on Grade 4 learners in collaboration with SPELL IT SA. To further strengthen reading, 828 teachers and 20 officials were trained on Phase 2 to 4 Primary School Reading Intervention Programme for English First Additional Language (EFAL) in collaboration with the National Education Collaboration Trust (NECT). A three-day workshop to strengthen reading and mathematics in schools was held for 32 foundation and intermediate phase reading assistants and 38 intermediate and senior phase maths assistants from Pixley ka Seme (PKS) and ZF Mgcawu (ZFM). The teaching and learning of language was enhanced through the participation of 1 032 intermediate phase learners in a Spelling Bee competition and 4 150 Grade 1 – 10 learners in Woorde Open Wêreld (WOW). 30 learners, 3 per grade, represented the province at national level in Stellenbosch. Out of the 10 categories, the provincial learners were declared champions in 6. The provincial Spelling Bee for 30 learners was held in collaboration with CAMP I AM. They sponsored learners with 1 300 learner workbooks and CD’s. A Reading Edutainment school holiday programme was conducted at 10 venues in Frances Baard and Pixley Ka Seme Districts and 1 529 participants were involved in various reading activities. 32 out-of-school youth who are ETDPSETA library assistants were placed in learnerships in the ZF Mgcawu District and 25 library assistants were appointed in 25 schools in Frances Baard District through the EPWP. 1 800 books were donated by SAPESI and distributed to 19 schools.
Improving Maths and Science Participation Rate In an effort to increase the participation rate of leaners in Maths and Science, the following activities were prioritised: 2 680 intermediate phase learners participated in the maths challenge; 1300 grade 7-9 learners wrote the Natural Science Olympiad; 440 grade 7 learners participated in the Astro Quiz. 19 130 learners and 181 teachers were involved in the National Science Week.

44
Annual Report for 2018/19 Financial Year Vote 04: Department of Education
Province of the Northern Cape
44
15 teachers from Frances Baard Districtwere trained on how to assist learners with projects for the district and regional Eskom Expo for Young Scientists (EEYS).
5 students from Sol Plaatje University were appointed by Eskom Expo to mentor 3 primary and 2 high schools as EEYS mentors.
507 learners in the province participated in the Eskom Expo for Young Scientists A two day workshop on Radio Astronomy Material Development for schools was conducted by
officials from the South African Agency for Science and Technology Advancement (SAASTA) and the Department of Science and Technology (DST).
Incremental Introduction of African Languages 192 primary schools that previously did not offer an African language are now offering the language
in Grade 1. 190 teachers were trained on the implementation of IIAL in Grade 2. 4 high schools that previously did not offer an African language are now offering Setswana as FAL
in Grade 8. 2 out of the 4 schools are offering the language in Grades 8 and 9. 1 out of the 4 schools is offering
the language in Grades 8, 9 and 10. FOUNDATION PHASE Provincial English Teachers Association A Provincial English Teachers Association was established and launched in the Northern Cape as well as the National English Teachers Association at DBE.
School Monitoring and Support Visits Though 12 school visits in Pixley Ka Seme and Frances Baard were planned for term 1, none of
the schools were visited due to SADTU’s ‘Work to Rule” action during the term. 6 schools out of 18 were supported 3 Frances Baard schools were monitored for the 2018 Physical Education Day.
Different examples of lesson plans were provided during the school support visits. The mediation of the Framework of the Life skills SBA Booklet as well as the DBE`s Life Skills Monitoring Tool was dealt with. One-on one sessions were held with the JTG Grade 1-3 subject advisors regarding the practical floor plan for Physical education.
Centralised SBA Moderation The Department managed the centralised SBA moderation in all districts for languages as well as Mathematics. A report was collated on the findings of all subjects and submitted to the Exam Unit.
Primary School Reading Intervention Programme (PSRIP) 22 Head Office and District officials were trained by NECT. The Department trained 120 schools with 543 Grades 1-3 teachers out the planned 640 teachers on the PSRIP’s methodologies for English First Additional Language. Differentiated Curriculum for the Severely Intellectually Disabled (DCSID) Workshop Training was done by DBE with officials from all provinces on the implementation of DCSID. In the Northern Cape Province 84 teachers from 5 special schools were trained on the implementation of DCSID. LIFE SKILLS The Life skills unit assisted in the Quality Physical Education Advocacy (PE) Roadshow in Frances Baard. In this regard, 44 Frances Baard schools, 12 Postmasburg schools, were targeted in 2018. The 2018 4th Annual Life Skills Quality Physical Education Symposium with InterSen, FET and School Sports unit at the Protea Big Hole was attended. Adjudication of Quality Physical Education Excellence in PE for teachers was presented. The best PE teacher for Foundation Phase was from John Taolo Gaetsewe District. The Teacher Union Collaboration (TUC) meeting at Kimberley Teachers Centre was
Annual Report for 2018/19 Financial Year Vote 04: Department of Education
Province of the Northern Cape
45
attended by teachers. 5 Curriculum coordinators attended the TUC National meeting and Identification of needs for teachers in the Province. GENERAL EDUCATION AND TRAINING (GET) CURRICULUM
Monitoring and Support School visits were conducted across the Province and teachers supported across Grade 4-9 in all subjects. The underperforming schools were prioritised. Quarterly subject committee meetings were held across the province and teachers were supported on problematic areas in various subjects.
Provincial subject coordinators conducted oversight on-site moderation in 14 schools across the province and supported three schools in Frances Baard through the custodian programme. The purpose of the visit was to quality assure assessment tasks and moderation processes at school level.
The quarterly subject meetings at district and provincial level were held for different subjects and identified content for the third term was discussed. 297 mathematics and 307 language teachers were supported. The following subjects; Creative Arts, Afrikaans and Social Science conducted cluster meetings in Pixley Ka Seme and 29 teachers attended. 39 Afrikaans Intermediate Phase teachers attended a cluster session where literature and reading with comprehension were discussed. In three districts no cluster meetings were held due to unions embarking on the work to rule action.
31 Intermediate Phase EFAL teachers and 4 officials attended the Certificate in Primary English Learning and Teaching (CiPELT) training. The focus was on training teachers on teaching methodologies, resource management and assessment processes.
366 Language teachers were supported in language content and 24 teachers in mathematics content for both intermediate and senior phases.
Literature training for Grades 7 – 9, attracted 24 Afrikaans and 100 Setswana Home Language and First Additional Language teachers was conducted in John Taolo Gaetsewe and Pixley Ka Seme (Douglas cluster) in order to strengthen language development. The focus was on reading and viewing skills in Grades 7-9 with specific emphasis on:
Changes to the Programme of Assessment (Specifically Literature); Setting Paper 4, applying Barrett’s taxonomy, and Features of different Literature genres.
Teacher Training The National Development Plan 2030 demands that the education sector should build an inclusive society which helps and provides equal opportunities for all South Africans to realise their full potential. The GET and Inclusive Education units conducted a three-day workshop, attended by 46 teachers and 28 officials, on Differentiated Curriculum and Assessment Policy Statement (DCAPS) for Learners with Severe Intellectual Disability (SID). The purpose of the workshop was to:
Provide uniform and manageable procedures of implementing curriculum in special schools across provinces;
Standardise the quality of delivery of curriculum across all schools and Provinces; Ensure portability and transferability of subjects when learners are transferred from one school
to another; Strengthen inclusivity for learners with SID
Fundisa for Change in collaboration with the Department of Environmental Affairs conducted a five-day workshop to advocate and address environmental issues. 18 Natural Sciences, Technology and Social Science subject advisors and coordinators were trained on climate change and water content areas.
Mathematics, Science and Technology (MST) As part of the broader MST plan to guide and support GET teachers, departmental heads, subject advisors and subject coordinators, training was conducted for all Grade 5-6 teachers and HODs in the

45
Annual Report for 2018/19 Financial Year Vote 04: Department of Education
Province of the Northern Cape
44
15 teachers from Frances Baard Districtwere trained on how to assist learners with projects for the district and regional Eskom Expo for Young Scientists (EEYS).
5 students from Sol Plaatje University were appointed by Eskom Expo to mentor 3 primary and 2 high schools as EEYS mentors.
507 learners in the province participated in the Eskom Expo for Young Scientists A two day workshop on Radio Astronomy Material Development for schools was conducted by
officials from the South African Agency for Science and Technology Advancement (SAASTA) and the Department of Science and Technology (DST).
Incremental Introduction of African Languages 192 primary schools that previously did not offer an African language are now offering the language
in Grade 1. 190 teachers were trained on the implementation of IIAL in Grade 2. 4 high schools that previously did not offer an African language are now offering Setswana as FAL
in Grade 8. 2 out of the 4 schools are offering the language in Grades 8 and 9. 1 out of the 4 schools is offering
the language in Grades 8, 9 and 10. FOUNDATION PHASE Provincial English Teachers Association A Provincial English Teachers Association was established and launched in the Northern Cape as well as the National English Teachers Association at DBE.
School Monitoring and Support Visits Though 12 school visits in Pixley Ka Seme and Frances Baard were planned for term 1, none of
the schools were visited due to SADTU’s ‘Work to Rule” action during the term. 6 schools out of 18 were supported 3 Frances Baard schools were monitored for the 2018 Physical Education Day.
Different examples of lesson plans were provided during the school support visits. The mediation of the Framework of the Life skills SBA Booklet as well as the DBE`s Life Skills Monitoring Tool was dealt with. One-on one sessions were held with the JTG Grade 1-3 subject advisors regarding the practical floor plan for Physical education.
Centralised SBA Moderation The Department managed the centralised SBA moderation in all districts for languages as well as Mathematics. A report was collated on the findings of all subjects and submitted to the Exam Unit.
Primary School Reading Intervention Programme (PSRIP) 22 Head Office and District officials were trained by NECT. The Department trained 120 schools with 543 Grades 1-3 teachers out the planned 640 teachers on the PSRIP’s methodologies for English First Additional Language. Differentiated Curriculum for the Severely Intellectually Disabled (DCSID) Workshop Training was done by DBE with officials from all provinces on the implementation of DCSID. In the Northern Cape Province 84 teachers from 5 special schools were trained on the implementation of DCSID. LIFE SKILLS The Life skills unit assisted in the Quality Physical Education Advocacy (PE) Roadshow in Frances Baard. In this regard, 44 Frances Baard schools, 12 Postmasburg schools, were targeted in 2018. The 2018 4th Annual Life Skills Quality Physical Education Symposium with InterSen, FET and School Sports unit at the Protea Big Hole was attended. Adjudication of Quality Physical Education Excellence in PE for teachers was presented. The best PE teacher for Foundation Phase was from John Taolo Gaetsewe District. The Teacher Union Collaboration (TUC) meeting at Kimberley Teachers Centre was
Annual Report for 2018/19 Financial Year Vote 04: Department of Education
Province of the Northern Cape
45
attended by teachers. 5 Curriculum coordinators attended the TUC National meeting and Identification of needs for teachers in the Province. GENERAL EDUCATION AND TRAINING (GET) CURRICULUM
Monitoring and Support School visits were conducted across the Province and teachers supported across Grade 4-9 in all subjects. The underperforming schools were prioritised. Quarterly subject committee meetings were held across the province and teachers were supported on problematic areas in various subjects.
Provincial subject coordinators conducted oversight on-site moderation in 14 schools across the province and supported three schools in Frances Baard through the custodian programme. The purpose of the visit was to quality assure assessment tasks and moderation processes at school level.
The quarterly subject meetings at district and provincial level were held for different subjects and identified content for the third term was discussed. 297 mathematics and 307 language teachers were supported. The following subjects; Creative Arts, Afrikaans and Social Science conducted cluster meetings in Pixley Ka Seme and 29 teachers attended. 39 Afrikaans Intermediate Phase teachers attended a cluster session where literature and reading with comprehension were discussed. In three districts no cluster meetings were held due to unions embarking on the work to rule action.
31 Intermediate Phase EFAL teachers and 4 officials attended the Certificate in Primary English Learning and Teaching (CiPELT) training. The focus was on training teachers on teaching methodologies, resource management and assessment processes.
366 Language teachers were supported in language content and 24 teachers in mathematics content for both intermediate and senior phases.
Literature training for Grades 7 – 9, attracted 24 Afrikaans and 100 Setswana Home Language and First Additional Language teachers was conducted in John Taolo Gaetsewe and Pixley Ka Seme (Douglas cluster) in order to strengthen language development. The focus was on reading and viewing skills in Grades 7-9 with specific emphasis on:
Changes to the Programme of Assessment (Specifically Literature); Setting Paper 4, applying Barrett’s taxonomy, and Features of different Literature genres.
Teacher Training The National Development Plan 2030 demands that the education sector should build an inclusive society which helps and provides equal opportunities for all South Africans to realise their full potential. The GET and Inclusive Education units conducted a three-day workshop, attended by 46 teachers and 28 officials, on Differentiated Curriculum and Assessment Policy Statement (DCAPS) for Learners with Severe Intellectual Disability (SID). The purpose of the workshop was to:
Provide uniform and manageable procedures of implementing curriculum in special schools across provinces;
Standardise the quality of delivery of curriculum across all schools and Provinces; Ensure portability and transferability of subjects when learners are transferred from one school
to another; Strengthen inclusivity for learners with SID
Fundisa for Change in collaboration with the Department of Environmental Affairs conducted a five-day workshop to advocate and address environmental issues. 18 Natural Sciences, Technology and Social Science subject advisors and coordinators were trained on climate change and water content areas.
Mathematics, Science and Technology (MST) As part of the broader MST plan to guide and support GET teachers, departmental heads, subject advisors and subject coordinators, training was conducted for all Grade 5-6 teachers and HODs in the

46
Annual Report for 2018/19 Financial Year Vote 04: Department of Education
Province of the Northern Cape
46
respective MST subjects. The training was designed to place special focus on content and teaching methodologies.
A total of 876 MST teachers were trained on developing mathematical and scientific skills and knowledge including the utilisation of various resources such as Sasol Inzalo textbooks and ICT to enhance teaching and learning.
16 MST subject advisors and coordinators attended the MST working session to develop Grade 7 training material. The training is part of a three (3) year implementation plan which was developed as part of the Professional Development Plan for MST teachers in the GET Band. The NCDoE decided on the phased-in approach to ensure focused attention towards identified content areas.
The implementation of Introduction to Communication in Technology has been identified as one of the challenging content areas to teach. 94 female Technology teachers attended a women empowerment workshop in all five districts, to strengthen quality teaching and learning of Technology as a subject in Senior Phase.
13 Grade 4-7 teachers from six schools in Frances Baard district were trained on Inquiry-based learning in teaching Natural Science and Technology. Two sessions, with the focus on practical activities and innovative ways of incorporating ICT in classroom activities, were conducted.
The Curriculum Support Service unit and GET Curriculum unit trained 10 Mathematics and Language assistants to strengthen content knowledge and intervention strategies. This was a five-day workshop where materials were developed and in-depth training on problematic areas took place. Out-of-school youth with Grade 12 certificates were identified and trained in the Postmasburg area.
Learner Competitions The NCDoE in partnership with Banking Association of South Africa conducted the FinLIt (Financial Literacy) Spelling BEE for EMS Grade 7-9 learners. A total of 46 learners from 21 schools in all five districts participated in the Provincial FinLit Spelling Bee in Upington.
The EMS subject advisors and teachers attended the South African Institute for Chartered Accountants (SAICA) training on conducting the quiz and Olympiad. A total of 25 schools were identified to participate in the Olympiad and 319 grade 7 learners took part in the quiz competition.
The NCDoE in partnership with Diamond Fields Advertiser (DFA) and Northern Cape Provincial Legislature launched the writing competition and poster development for grade 9 learners. Learners were expected to write essays in any language or develop a poster in honour of former President Mandela and Mrs Albertina Sisulu. The NCDoE in partnership with DFA and Northern Cape Provincial Legislature concluded the competition by evaluating essays and posters from all districts. The prize giving ceremony will be held in the next financial year.
Career Talks Career talks and subject choice sessions were conducted and 1 346 Grade 9 learners from 10 schools attended.
Talent search activity was conducted in John Taolo Gaetsewe and Frances Baard Districts with the aim of increasing participation in Mathematics by exposing learners to different career paths.
A Quality Physical Education Symposium was conducted for the first time in the Province. Life Skills and Life Orientation subject advisors and coordinators attended the two-day session.
School-Based Assessment Moderation Decentralised moderation took place in all five districts in Grade 9, subjects moderated were; Languages and Mathematics.
On site moderation was conducted in 14 schools in all five districts to quality assure assessment tasks and moderation processes at school level.
Annual Report for 2018/19 Financial Year Vote 04: Department of Education
Province of the Northern Cape
47
Reporting Workbook utilisation was monitored in all five districts and a total of 64 schools were visited. Empowerment Session A total of 19 subject advisors and coordinators of Mathematics, Technology, Natural Science, Social Science and Life Skills attended the Moodle training. FURTHER EDUCATION AND TRAINING (FET) CURRICULUM In the FET Directorate activities commenced with the Top Achievers’ autumn camp and residential autumn camps for Borderline learners during April. Grade 12 School-based Assessment (SBA) moderation in all five Districts in identified subjects was also conducted. Whole-day teaching for Grade 12 learners in all subjects at identified schools in all were conducted the districts. Quarter 1 activities were concluded with the Top Achievers’ winter camp, residential winter camps for Borderline learners as well as Winter Camps for Technical Mathematics and Technical Science in June and July. The second quarter commenced with the Map Work week. In all schools offering Geography one week per term was dedicated to map work only, focussing on GIS and map calculations and approximately 6 000 learners were supported. In addition, 5-hour map work working sessions were conducted across all 5 districts where 890 learners were supported.
Whole-school day teaching was also arranged where the provincial subject co-ordinators and subject advisors in the Frances Baard and John Taolo Gaetsewe Districts taught at identified schools to either assist the teacher with curriculum coverage or consolidation of content already taught. An entire school day was dedicated to the teaching of one subject to all Grade 12 learners enrolled for that subject. The aim of the intervention, among others, was to improve the relationship with teachers by conducting team-teaching and to improve learner performance. Decentralised school-based assessment moderation was conducted in September 2018. The lead teacher programme continued where subject specialists were deployed to support identified schools who were at risk of not completing the ATP. This programme was used to mitigate the SADTU disengagement and the service delivery strikes in Frances Baard and Pixley Ka Seme. The programme also focussed on schools with teachers not suitably qualified to teach in the FET. Three-hour Big Show revision sessions were held in the Namakwa district on Saturdays where learners from underperforming schools as well as borderline learners revised topics with the most weight in question papers. Extended Spring Camps were conducted to mitigate gaps due to poor content knowledge as well as poor curriculum coverage. 3 150 borderline learners were supported in twelve centres across the 5 districts. Approximately 100 tutors were appointed, and learners attended. An extended spring camp for 110 Top-Achieving Learners was conducted in October. The Department of Science and Technology/University of Stellenbosch/NCDoE Talent Development Camp was conducted during October. 40 Grade 11 learners and 40 Grade 12 learners offering Mathematics and Physical Sciences received additional instruction on selected topics. Extended spring camps were also offered to 220 learners offering Technical Mathematics and Technical Sciences. Training of Accounting and Economics teachers in the ZF Mgcawu district was conducted during August as well as training of Mathematics and Physical Sciences HODs in Frances Baard and JTG. The focus of support in Quarter 3 was mainly to provide support to learners who were at risk of failing and to arrange and to convene a 2019 Curriculum planning meeting. The support commenced with the Last Push Programme in all five districts where lead teachers, subject advisors and provincial subject co-ordinators were deployed to schools and subjects that were at risk of underperforming. The purpose of the programme was to provide critical support to learners in preparation of the 2018 National Senior

47
Annual Report for 2018/19 Financial Year Vote 04: Department of Education
Province of the Northern Cape
46
respective MST subjects. The training was designed to place special focus on content and teaching methodologies.
A total of 876 MST teachers were trained on developing mathematical and scientific skills and knowledge including the utilisation of various resources such as Sasol Inzalo textbooks and ICT to enhance teaching and learning.
16 MST subject advisors and coordinators attended the MST working session to develop Grade 7 training material. The training is part of a three (3) year implementation plan which was developed as part of the Professional Development Plan for MST teachers in the GET Band. The NCDoE decided on the phased-in approach to ensure focused attention towards identified content areas.
The implementation of Introduction to Communication in Technology has been identified as one of the challenging content areas to teach. 94 female Technology teachers attended a women empowerment workshop in all five districts, to strengthen quality teaching and learning of Technology as a subject in Senior Phase.
13 Grade 4-7 teachers from six schools in Frances Baard district were trained on Inquiry-based learning in teaching Natural Science and Technology. Two sessions, with the focus on practical activities and innovative ways of incorporating ICT in classroom activities, were conducted.
The Curriculum Support Service unit and GET Curriculum unit trained 10 Mathematics and Language assistants to strengthen content knowledge and intervention strategies. This was a five-day workshop where materials were developed and in-depth training on problematic areas took place. Out-of-school youth with Grade 12 certificates were identified and trained in the Postmasburg area.
Learner Competitions The NCDoE in partnership with Banking Association of South Africa conducted the FinLIt (Financial Literacy) Spelling BEE for EMS Grade 7-9 learners. A total of 46 learners from 21 schools in all five districts participated in the Provincial FinLit Spelling Bee in Upington.
The EMS subject advisors and teachers attended the South African Institute for Chartered Accountants (SAICA) training on conducting the quiz and Olympiad. A total of 25 schools were identified to participate in the Olympiad and 319 grade 7 learners took part in the quiz competition.
The NCDoE in partnership with Diamond Fields Advertiser (DFA) and Northern Cape Provincial Legislature launched the writing competition and poster development for grade 9 learners. Learners were expected to write essays in any language or develop a poster in honour of former President Mandela and Mrs Albertina Sisulu. The NCDoE in partnership with DFA and Northern Cape Provincial Legislature concluded the competition by evaluating essays and posters from all districts. The prize giving ceremony will be held in the next financial year.
Career Talks Career talks and subject choice sessions were conducted and 1 346 Grade 9 learners from 10 schools attended.
Talent search activity was conducted in John Taolo Gaetsewe and Frances Baard Districts with the aim of increasing participation in Mathematics by exposing learners to different career paths.
A Quality Physical Education Symposium was conducted for the first time in the Province. Life Skills and Life Orientation subject advisors and coordinators attended the two-day session.
School-Based Assessment Moderation Decentralised moderation took place in all five districts in Grade 9, subjects moderated were; Languages and Mathematics.
On site moderation was conducted in 14 schools in all five districts to quality assure assessment tasks and moderation processes at school level.
Annual Report for 2018/19 Financial Year Vote 04: Department of Education
Province of the Northern Cape
47
Reporting Workbook utilisation was monitored in all five districts and a total of 64 schools were visited. Empowerment Session A total of 19 subject advisors and coordinators of Mathematics, Technology, Natural Science, Social Science and Life Skills attended the Moodle training. FURTHER EDUCATION AND TRAINING (FET) CURRICULUM In the FET Directorate activities commenced with the Top Achievers’ autumn camp and residential autumn camps for Borderline learners during April. Grade 12 School-based Assessment (SBA) moderation in all five Districts in identified subjects was also conducted. Whole-day teaching for Grade 12 learners in all subjects at identified schools in all were conducted the districts. Quarter 1 activities were concluded with the Top Achievers’ winter camp, residential winter camps for Borderline learners as well as Winter Camps for Technical Mathematics and Technical Science in June and July. The second quarter commenced with the Map Work week. In all schools offering Geography one week per term was dedicated to map work only, focussing on GIS and map calculations and approximately 6 000 learners were supported. In addition, 5-hour map work working sessions were conducted across all 5 districts where 890 learners were supported.
Whole-school day teaching was also arranged where the provincial subject co-ordinators and subject advisors in the Frances Baard and John Taolo Gaetsewe Districts taught at identified schools to either assist the teacher with curriculum coverage or consolidation of content already taught. An entire school day was dedicated to the teaching of one subject to all Grade 12 learners enrolled for that subject. The aim of the intervention, among others, was to improve the relationship with teachers by conducting team-teaching and to improve learner performance. Decentralised school-based assessment moderation was conducted in September 2018. The lead teacher programme continued where subject specialists were deployed to support identified schools who were at risk of not completing the ATP. This programme was used to mitigate the SADTU disengagement and the service delivery strikes in Frances Baard and Pixley Ka Seme. The programme also focussed on schools with teachers not suitably qualified to teach in the FET. Three-hour Big Show revision sessions were held in the Namakwa district on Saturdays where learners from underperforming schools as well as borderline learners revised topics with the most weight in question papers. Extended Spring Camps were conducted to mitigate gaps due to poor content knowledge as well as poor curriculum coverage. 3 150 borderline learners were supported in twelve centres across the 5 districts. Approximately 100 tutors were appointed, and learners attended. An extended spring camp for 110 Top-Achieving Learners was conducted in October. The Department of Science and Technology/University of Stellenbosch/NCDoE Talent Development Camp was conducted during October. 40 Grade 11 learners and 40 Grade 12 learners offering Mathematics and Physical Sciences received additional instruction on selected topics. Extended spring camps were also offered to 220 learners offering Technical Mathematics and Technical Sciences. Training of Accounting and Economics teachers in the ZF Mgcawu district was conducted during August as well as training of Mathematics and Physical Sciences HODs in Frances Baard and JTG. The focus of support in Quarter 3 was mainly to provide support to learners who were at risk of failing and to arrange and to convene a 2019 Curriculum planning meeting. The support commenced with the Last Push Programme in all five districts where lead teachers, subject advisors and provincial subject co-ordinators were deployed to schools and subjects that were at risk of underperforming. The purpose of the programme was to provide critical support to learners in preparation of the 2018 National Senior

48
Annual Report for 2018/19 Financial Year Vote 04: Department of Education
Province of the Northern Cape
48
Certificate Examination. Compulsory study sessions were also arranged at identified schools across the province to assist those learners whose home environment was not conducive to learning. The focus of the activities in the fourth quarter was to reflect on the strengths and weaknesses of the results of the final 2018 examinations, to set the tone for 2019 and to provide the necessary support to teachers to ensure that quality teaching and learning expectations are met. The annual Teacher Development clinics for identified Grade 12 teachers, as part of its 2019 Programme to enhance Learner Attainment in selected subjects were conducted over weekends in February March. The purpose of the clinics was to equip teachers with the necessary content knowledge and skills required to execute their tasks effectively and successfully in the classroom and school.
The FET Directorate also hosted its 5th Annual Teacher Recognition Award ceremony on 28 February 2019 where performing teachers per quintile per subject were recognised for excellent performance in the 2018 National Senior Certificate Examination. The quarter culminated in a four 5-day autumn camp for Top Achievers’, 5-day autumn camps for borderline learners in the Namakwa, Pixley ka Seme and ZF Mgcawu Districts and 12-day autumn camps for borderline learners in the Frances Baard and John Taolo Gaetsewe districts.
NATIONAL SCHOOL NUTRITION PROGRAMME (NSNP) The National School Nutrition Programme aims to: Contribute to enhanced learning capacity through school feeding, Generate food production and economic activities in school communities in order to improve
household food security, Strengthen nutrition education for the school community.
The National School Nutrition Programme (NSNP) therefore has three main integrated components namely school feeding, sustainable food production and nutrition education.
School Feeding Through school feeding, the Department of Education is attempting to address the plight of poor learners in quintiles 1 to 3 by providing them with a nutritious meal for 189 school days. The Northern Cape Department of Education’s targeting policy is to offer all primary and secondary schools in the Province the opportunity to apply to participate in the NSNP. All learners in the 505 schools which applied to participate in the NSNP will be entitled to benefit from the programme (Grades R – 12). 265 458 learners had access to the NSNP meals. 505 SMME’s were contracted to provide schools with groceries and 1 615 food handlers volunteered to cook nutritious meals to learners. For the year under review 1 025 committee members, contact educators, food handlers and school management team (SMT) members were trained on the implementation of the programme.
Sustainable Food Production Sustainable food production encourages learners, educators and community members to develop food gardens in schools and to use them as living laboratories by integrating them into the curriculum. The Department has embarked on various strategies to implement projects at identified schools with the aim of rolling these projects out to all participating schools. There are 225 sustainable food gardens in the province
Nutrition Education The aim of nutrition education is to promote healthy eating habits and lifestyles in schools and communities. It is through this component that the programme hopes to be able to reach parents, educators, SGBs, SMTs, school gate vendors, tuck shop managers and interested community
Annual Report for 2018/19 Financial Year Vote 04: Department of Education
Province of the Northern Cape
49
members. For the year under review 890 food handlers were trained on meal preparation and food safety. 110 293 grade R – 7 primary learners were de-wormed in all the five districts.165 schools in the province received certification of acceptability (CoA) this is simply saying that from the 505 kitchens in the province only 165 kitchen are compliant with regulation R962.
Highlights United Manganese of Kalahari mine has to date built 14 fully furnished kitchens in the John Taolo Gaetsewe District. Tiger Brand Foundation and Pioneer foods are providing for five (5) schools each in John Taolo Gaetsewe and ZF Mgcawu Districts.

49
Annual Report for 2018/19 Financial Year Vote 04: Department of Education
Province of the Northern Cape
48
Certificate Examination. Compulsory study sessions were also arranged at identified schools across the province to assist those learners whose home environment was not conducive to learning. The focus of the activities in the fourth quarter was to reflect on the strengths and weaknesses of the results of the final 2018 examinations, to set the tone for 2019 and to provide the necessary support to teachers to ensure that quality teaching and learning expectations are met. The annual Teacher Development clinics for identified Grade 12 teachers, as part of its 2019 Programme to enhance Learner Attainment in selected subjects were conducted over weekends in February March. The purpose of the clinics was to equip teachers with the necessary content knowledge and skills required to execute their tasks effectively and successfully in the classroom and school.
The FET Directorate also hosted its 5th Annual Teacher Recognition Award ceremony on 28 February 2019 where performing teachers per quintile per subject were recognised for excellent performance in the 2018 National Senior Certificate Examination. The quarter culminated in a four 5-day autumn camp for Top Achievers’, 5-day autumn camps for borderline learners in the Namakwa, Pixley ka Seme and ZF Mgcawu Districts and 12-day autumn camps for borderline learners in the Frances Baard and John Taolo Gaetsewe districts.
NATIONAL SCHOOL NUTRITION PROGRAMME (NSNP) The National School Nutrition Programme aims to: Contribute to enhanced learning capacity through school feeding, Generate food production and economic activities in school communities in order to improve
household food security, Strengthen nutrition education for the school community.
The National School Nutrition Programme (NSNP) therefore has three main integrated components namely school feeding, sustainable food production and nutrition education.
School Feeding Through school feeding, the Department of Education is attempting to address the plight of poor learners in quintiles 1 to 3 by providing them with a nutritious meal for 189 school days. The Northern Cape Department of Education’s targeting policy is to offer all primary and secondary schools in the Province the opportunity to apply to participate in the NSNP. All learners in the 505 schools which applied to participate in the NSNP will be entitled to benefit from the programme (Grades R – 12). 265 458 learners had access to the NSNP meals. 505 SMME’s were contracted to provide schools with groceries and 1 615 food handlers volunteered to cook nutritious meals to learners. For the year under review 1 025 committee members, contact educators, food handlers and school management team (SMT) members were trained on the implementation of the programme.
Sustainable Food Production Sustainable food production encourages learners, educators and community members to develop food gardens in schools and to use them as living laboratories by integrating them into the curriculum. The Department has embarked on various strategies to implement projects at identified schools with the aim of rolling these projects out to all participating schools. There are 225 sustainable food gardens in the province
Nutrition Education The aim of nutrition education is to promote healthy eating habits and lifestyles in schools and communities. It is through this component that the programme hopes to be able to reach parents, educators, SGBs, SMTs, school gate vendors, tuck shop managers and interested community
Annual Report for 2018/19 Financial Year Vote 04: Department of Education
Province of the Northern Cape
49
members. For the year under review 890 food handlers were trained on meal preparation and food safety. 110 293 grade R – 7 primary learners were de-wormed in all the five districts.165 schools in the province received certification of acceptability (CoA) this is simply saying that from the 505 kitchens in the province only 165 kitchen are compliant with regulation R962.
Highlights United Manganese of Kalahari mine has to date built 14 fully furnished kitchens in the John Taolo Gaetsewe District. Tiger Brand Foundation and Pioneer foods are providing for five (5) schools each in John Taolo Gaetsewe and ZF Mgcawu Districts.

50
Annu
al R
epor
t for
201
8/19
Fin
ancia
l Yea
r Vo
te 0
4: D
epar
tmen
t of E
duca
tion
Prov
ince
of t
he N
orth
ern
Cape
50
Stra
tegi
c ob
ject
ives
:
Prog
ram
me
2: P
ublic
Sch
ool E
duca
tion
Stra
tegi
c ob
ject
ives
A
ctua
l A
chie
vem
ent
2017
/201
8
Plan
ned
Targ
et
2018
/201
9
Act
ual
Ach
ieve
men
t 20
18/2
019
Dev
iatio
n fr
om
Plan
ned
Targ
et
for 2
018/
2019
C
omm
ent o
n de
viat
ions
To m
onito
r th
e im
plem
enta
tion
of t
he N
atio
nal
Cur
ricul
um
Sta
tem
ent
and
track
th
e pe
rform
ance
an
d de
velo
pmen
t of
27
3 00
0 le
arne
rs.
273
604
269
000
275
605
6 60
5 G
reat
er
than
no
rmal
in
crea
se
in
lear
ner
enro
lmen
t. Ta
rget
set
too
low
bec
ause
pla
nnin
g cy
cle
not i
n sy
nc w
ith c
olle
ctin
g of
dat
a.
Perf
orm
ance
indi
cato
rs
Prog
ram
me
2: P
ublic
Ord
inar
y Sc
hool
Edu
catio
n
Perf
orm
ance
Indi
cato
r A
ctua
l A
chie
vem
ent
2017
/201
8
Plan
ned
Targ
et
2018
/201
9
Act
ual
Ach
ieve
men
t 20
18/2
019
Dev
iatio
n fr
om
Plan
ned
Targ
et
for 2
018/
2019
C
omm
ent o
n de
viat
ions
PP
M20
1:N
umbe
r of
fu
ll se
rvic
e sc
hool
s se
rvic
ing
lear
ners
with
lear
ning
bar
riers
23
30
26
-4
D
elay
in tr
aini
ng o
f fou
r sch
ools
due
to in
dust
rial
actio
n in
the
first
qua
rter
PP
M20
2:Th
e pe
rcen
tage
of c
hild
ren
who
turn
ed
9 in
the
pre
viou
s ye
ar a
nd w
ho a
re c
urre
ntly
en
rolle
d in
Gra
de 4
(or a
hig
her g
rade
)
97.1
%
67%
94
.5%
27
.5%
P
rom
otio
n po
licy
is a
llow
ing
mor
e le
arne
rs in
the
sam
e ag
e-co
hort
(23
288/
23
975
) (1
5 74
5/
23 5
00)
(22
527/
23
844
) P
PM
203:
The
perc
enta
ge o
f chi
ldre
n w
ho tu
rned
12
in th
e pr
eced
ing
year
and
who
are
cur
rent
ly
enro
lled
in G
rade
7 (o
r a h
ighe
r gra
de)
88.9
0%
56%
78
.7%
21
.7%
P
rom
otio
n po
licy
is a
llow
ing
mor
e le
arne
rs in
the
sam
e ag
e-co
hort
(19
398/
21
828
) (1
2 25
5/
21 5
00)
(16
955/
21
555
) P
PM
204:
Num
ber o
f sch
ools
pro
vide
d w
ith m
ulti-
med
ia re
sour
ces
42
2 18
16
Th
e D
epar
tmen
t of
Edu
catio
n re
ceiv
ed b
ooks
fro
m S
AP
ES
I, D
BE
and
Qua
liboo
ks.
PP
M20
5:Le
arne
r abs
ente
eism
rate
3.
5%
4%
4.3%
0.
3%
Incr
ease
d ab
sent
eeis
m c
an b
e as
crib
ed t
o th
e se
rvic
e de
liver
y pr
otes
ts i
n th
e Fr
ance
s B
aard
di
stric
t dur
ing
the
seco
nd q
uarte
r (1
817
617
/ 51
783
899
) (2
180
800
/ 54
520
000
) (2
308
620
/ 54
152
572
)
PP
M20
6:Te
ache
r abs
ente
eism
rate
6.
70%
6%
4.
8%
-1.2
%
Dec
line
in th
e fo
llow
ing
leav
e ca
tego
ries:
Te
mpo
rary
Inca
paci
ty L
eave
; Sic
k-Fu
ll P
ay;
V
acat
ion
- Fu
ll P
ay; L
eave
With
out P
ay; F
amily
R
espo
nsib
ility.
(1
0163
9/
1 51
2 88
5)
(113
515
/ 1
891
880)
(9
9 78
6/
2 09
1 19
2)
Annu
al R
epor
t for
201
8/19
Fin
ancia
l Yea
r Vo
te 0
4: D
epar
tmen
t of E
duca
tion
Prov
ince
of t
he N
orth
ern
Cape
51
Prog
ram
me
2: P
ublic
Ord
inar
y Sc
hool
Edu
catio
n
Perf
orm
ance
Indi
cato
r A
ctua
l A
chie
vem
ent
2017
/201
8
Plan
ned
Targ
et
2018
/201
9
Act
ual
Ach
ieve
men
t 20
18/2
019
Dev
iatio
n fr
om
Plan
ned
Targ
et
for 2
018/
2019
C
omm
ent o
n de
viat
ions
PP
M20
7:N
umbe
r of
lear
ners
in p
ublic
ord
inar
y sc
hool
s be
nefit
ing
from
the
“N
o Fe
e Sc
hool
s”
polic
y 18
9 60
1 19
2 45
0 19
2 19
8 -2
52
Few
er le
arne
rs w
ere
enro
lled
in n
o fe
e sc
hool
s th
an t
he p
lann
ed t
arge
t fo
r th
e 20
18 a
cade
mic
ye
ar
PP
M
208:
Num
ber
of
educ
ator
s tra
ined
in
Li
tera
cy/L
angu
age
cont
ent a
nd m
etho
dolo
gy
4 56
3 3
500
3 00
2 -4
98
The
Dep
artm
ent
was
not
abl
e to
wip
e ou
t th
e de
ficit
crea
ted
by t
he u
nion
act
ion
and
serv
ice
deliv
ery
prot
ests
that
occ
urre
d du
ring
the
first
two
quar
ters
of t
he fi
nanc
ial y
ear
PP
M
209:
Num
ber
of
educ
ator
s tra
ined
in
N
umer
acy/
Mat
hem
atic
s co
nten
t an
d m
etho
dolo
gy
2 54
7 1
500
2 19
3 69
3 M
ore
novi
ce e
duca
tors
trai
ned
due
to p
oor
mid
-ye
ar
resu
lts,
and
to
miti
gate
di
srup
tions
in
sc
hool
s du
ring
the
first
tw
o qu
arte
rs
of
the
finan
cial
yea
r
SUB
-PR
OG
RAM
ME
2.1.
Pub
lic P
rimar
y Le
vel &
2.2
. Pub
lic S
econ
dary
Lev
el
Perf
orm
ance
Indi
cato
r A
ctua
l A
chie
vem
ent
2017
/201
8
Plan
ned
Targ
et
2018
/201
9
Act
ual
Ach
ieve
men
t 20
18/2
019
Dev
iatio
n fr
om
Plan
ned
Targ
et
for 2
018/
2019
C
omm
ent o
n de
viat
ions
2.2.
1:Th
e pe
rcen
tage
of
lear
ners
who
are
in
clas
ses
with
no
mor
e th
an 4
5 le
arne
rs
98.0
%
95%
81
.6%
-1
3.4%
In
crea
se i
n le
arne
r en
rolm
ent
and
dela
ys i
n in
frast
ruct
ure
prog
ram
me
(274
540
/ 28
0 09
6)
(273
600
/ 28
8 00
0)
(242
992
/ 29
7 69
7)
2.2.
2:Pe
rcen
tage
of l
earn
ers
in s
choo
ls th
at a
re
fund
ed a
t a m
inim
um le
vel
29.8
%
30%
29
.8%
-0
.2%
Ta
rget
reac
hed
(80
638/
27
0 23
9)
(81
330/
27
1 10
0)
(81
406/
27
3 60
4)

51
Annu
al R
epor
t for
201
8/19
Fin
ancia
l Yea
r Vo
te 0
4: D
epar
tmen
t of E
duca
tion
Prov
ince
of t
he N
orth
ern
Cape
51
Prog
ram
me
2: P
ublic
Ord
inar
y Sc
hool
Edu
catio
n
Perf
orm
ance
Indi
cato
r A
ctua
l A
chie
vem
ent
2017
/201
8
Plan
ned
Targ
et
2018
/201
9
Act
ual
Ach
ieve
men
t 20
18/2
019
Dev
iatio
n fr
om
Plan
ned
Targ
et
for 2
018/
2019
C
omm
ent o
n de
viat
ions
PP
M20
7:N
umbe
r of
lear
ners
in p
ublic
ord
inar
y sc
hool
s be
nefit
ing
from
the
“N
o Fe
e Sc
hool
s”
polic
y 18
9 60
1 19
2 45
0 19
2 19
8 -2
52
Few
er le
arne
rs w
ere
enro
lled
in n
o fe
e sc
hool
s th
an t
he p
lann
ed t
arge
t fo
r th
e 20
18 a
cade
mic
ye
ar
PP
M
208:
Num
ber
of
educ
ator
s tra
ined
in
Li
tera
cy/L
angu
age
cont
ent a
nd m
etho
dolo
gy
4 56
3 3
500
3 00
2 -4
98
The
Dep
artm
ent
was
not
abl
e to
wip
e ou
t th
e de
ficit
crea
ted
by t
he u
nion
act
ion
and
serv
ice
deliv
ery
prot
ests
that
occ
urre
d du
ring
the
first
two
quar
ters
of t
he fi
nanc
ial y
ear
PP
M
209:
Num
ber
of
educ
ator
s tra
ined
in
N
umer
acy/
Mat
hem
atic
s co
nten
t an
d m
etho
dolo
gy
2 54
7 1
500
2 19
3 69
3 M
ore
novi
ce e
duca
tors
trai
ned
due
to p
oor
mid
-ye
ar
resu
lts,
and
to
miti
gate
di
srup
tions
in
sc
hool
s du
ring
the
first
tw
o qu
arte
rs
of
the
finan
cial
yea
r
SUB
-PR
OG
RAM
ME
2.1.
Pub
lic P
rimar
y Le
vel &
2.2
. Pub
lic S
econ
dary
Lev
el
Perf
orm
ance
Indi
cato
r A
ctua
l A
chie
vem
ent
2017
/201
8
Plan
ned
Targ
et
2018
/201
9
Act
ual
Ach
ieve
men
t 20
18/2
019
Dev
iatio
n fr
om
Plan
ned
Targ
et
for 2
018/
2019
C
omm
ent o
n de
viat
ions
2.2.
1:Th
e pe
rcen
tage
of
lear
ners
who
are
in
clas
ses
with
no
mor
e th
an 4
5 le
arne
rs
98.0
%
95%
81
.6%
-1
3.4%
In
crea
se i
n le
arne
r en
rolm
ent
and
dela
ys i
n in
frast
ruct
ure
prog
ram
me
(274
540
/ 28
0 09
6)
(273
600
/ 28
8 00
0)
(242
992
/ 29
7 69
7)
2.2.
2:Pe
rcen
tage
of l
earn
ers
in s
choo
ls th
at a
re
fund
ed a
t a m
inim
um le
vel
29.8
%
30%
29
.8%
-0
.2%
Ta
rget
reac
hed
(80
638/
27
0 23
9)
(81
330/
27
1 10
0)
(81
406/
27
3 60
4)

52
Annual Report for 2018/19 Financial Year Vote 04: Department of Education
Province of the Northern Cape
52
Strategy to overcome areas of under performance Over the MTEF targets will be scaled down because of marginal budget increases Changes to planned targets There were no changes to planned targets Linking performance with budgets
Departments must provide a summary of the actual expenditure in comparison to the adjusted appropriation for both the current year and previous year. The information must be provided at a sub-programme level and must agree to the appropriation statement of the audited financial statements. Reasons for variations should be linked to the information discussed above in the organisational environment and the service delivery environment. The department must also report on how expenditure contributed to achievement of outputs. Sub-programme expenditure
The Department achieved seven (7) of the 11 targets, (63.6%), that it set in Programme 2: Public Ordinary School education. Language training and full service school training targets could not be met due to the first quarter "Work-to-rule" industrial action. Learner absenteeism is slightly up due to service delivery protests in the Frances Baard district during the second quarter. The “No-fee" target was missed by 0.13%. Higher learner enrolment and delays in the infrastructure programme have caused an increase in overcrowding in schools.
Final Actual Final Actual
Appropriation Expenditure Appropriation Expenditure
R’000 R’000 R’000 R’000 R’000 R’000
Public Primary Level 2 895 392 2 906 010 (10 618) 2 544 476 2 662 754 (118 278)
Public Secondary Level 1 642 319 1 642 319 - 1 488 476 1 488 555 (79)
Human Resource Development 32 537 32 825 (288) 28 947 28 805 142
School Sport, Culture and Media Services 21 634 21 634 - 20 259 20 253 6 National School Nutrition Programme grant 170 211 170 211 - 160 807 160 801 6
Maths, Science and Technology grant 24 564 24 564 - 23 636 23 595 41
Total 4 786 657 4 797 563 (10 906) 4 266 601 4 384 763 (118 162)
Programme 2: PUBLIC ORDINARY SCHOOL EDUCATION
2018/2019 2017/2018
(Over)/Under Expenditure
(Over)/Under Expenditure
Annual Report for 2018/19 Financial Year Vote 04: Department of Education
Province of the Northern Cape
53
4.3 Programme 3: INDEPENDENT SCHOOL SUBSIDIES
Objective of Programme: To support independent schools in accordance with the South African Schools Act
Sub-programmes
Sub-programme 3.1: Primary Phase To support independent schools in the Grade 1 to 7 phase.
Sub-programme 3.2: Secondary Phase To support independent schools in the Grade 8 to 12 phase.
Strategic objectives, performance indicators, planned targets and actual achievements
Achievements INDEPENDENT SCHOOLS REGISTERED INDEPENDENT SCHOOLS RECEIVING SUBSIDY
The Department is currently subsidising six (6) of the thirty three (36) registered independent schools and will continue to do so in the 2019/20 financial year. The six subsidised schools according to geographical spread are as follows:
1. Frances Baard - Kimberley Islamic Primary, Shekinah Christian School, St Cyprian’s Grammar School and St Boniface High School.
2. John Taolo Gaetsewe - Kuruman Christian Academy. 3. Namakwa - St. Anna Sekondêre Privaat Skool.
These schools will receive subsidy transfers bi-annually. This function is performed by Institutional Funding.
NUMBER OF LEARNERS AT SUBSIDISED SCHOOLS
Currently (2018/19 financial year) the number of learners at subsidised schools is 1686, this number will be the tentative target for 2019/20 until it is confirmed otherwise by the 10th-day snap survey of 2020.
PERCENTAGE OF REGISTERED INDEPENDENT SCHOOLS VISITED FOR MONITORING AND SUPPORT
Monitoring of 28 schools (subsidised & unsubsidised) out of 36 registered independent schools was done on a quarterly basis. This was done without any extra costs and the unit thus stayed within the targets set by the Department.
HOME EDUCATION
The Unit visited 38 home education sites for the 2018/19 financial year for monitoring. The Home Education sites comply with the conditions for registrations. Advocacy sessions were conducted where parents do not comply and they were made aware of the requirements for Home Education.

53
Annual Report for 2018/19 Financial Year Vote 04: Department of Education
Province of the Northern Cape
52
Strategy to overcome areas of under performance Over the MTEF targets will be scaled down because of marginal budget increases Changes to planned targets There were no changes to planned targets Linking performance with budgets
Departments must provide a summary of the actual expenditure in comparison to the adjusted appropriation for both the current year and previous year. The information must be provided at a sub-programme level and must agree to the appropriation statement of the audited financial statements. Reasons for variations should be linked to the information discussed above in the organisational environment and the service delivery environment. The department must also report on how expenditure contributed to achievement of outputs. Sub-programme expenditure
The Department achieved seven (7) of the 11 targets, (63.6%), that it set in Programme 2: Public Ordinary School education. Language training and full service school training targets could not be met due to the first quarter "Work-to-rule" industrial action. Learner absenteeism is slightly up due to service delivery protests in the Frances Baard district during the second quarter. The “No-fee" target was missed by 0.13%. Higher learner enrolment and delays in the infrastructure programme have caused an increase in overcrowding in schools.
Final Actual Final Actual
Appropriation Expenditure Appropriation Expenditure
R’000 R’000 R’000 R’000 R’000 R’000
Public Primary Level 2 895 392 2 906 010 (10 618) 2 544 476 2 662 754 (118 278)
Public Secondary Level 1 642 319 1 642 319 - 1 488 476 1 488 555 (79)
Human Resource Development 32 537 32 825 (288) 28 947 28 805 142
School Sport, Culture and Media Services 21 634 21 634 - 20 259 20 253 6 National School Nutrition Programme grant 170 211 170 211 - 160 807 160 801 6
Maths, Science and Technology grant 24 564 24 564 - 23 636 23 595 41
Total 4 786 657 4 797 563 (10 906) 4 266 601 4 384 763 (118 162)
Programme 2: PUBLIC ORDINARY SCHOOL EDUCATION
2018/2019 2017/2018
(Over)/Under Expenditure
(Over)/Under Expenditure
Annual Report for 2018/19 Financial Year Vote 04: Department of Education
Province of the Northern Cape
53
4.3 Programme 3: INDEPENDENT SCHOOL SUBSIDIES
Objective of Programme: To support independent schools in accordance with the South African Schools Act
Sub-programmes
Sub-programme 3.1: Primary Phase To support independent schools in the Grade 1 to 7 phase.
Sub-programme 3.2: Secondary Phase To support independent schools in the Grade 8 to 12 phase.
Strategic objectives, performance indicators, planned targets and actual achievements
Achievements INDEPENDENT SCHOOLS REGISTERED INDEPENDENT SCHOOLS RECEIVING SUBSIDY
The Department is currently subsidising six (6) of the thirty three (36) registered independent schools and will continue to do so in the 2019/20 financial year. The six subsidised schools according to geographical spread are as follows:
1. Frances Baard - Kimberley Islamic Primary, Shekinah Christian School, St Cyprian’s Grammar School and St Boniface High School.
2. John Taolo Gaetsewe - Kuruman Christian Academy. 3. Namakwa - St. Anna Sekondêre Privaat Skool.
These schools will receive subsidy transfers bi-annually. This function is performed by Institutional Funding.
NUMBER OF LEARNERS AT SUBSIDISED SCHOOLS
Currently (2018/19 financial year) the number of learners at subsidised schools is 1686, this number will be the tentative target for 2019/20 until it is confirmed otherwise by the 10th-day snap survey of 2020.
PERCENTAGE OF REGISTERED INDEPENDENT SCHOOLS VISITED FOR MONITORING AND SUPPORT
Monitoring of 28 schools (subsidised & unsubsidised) out of 36 registered independent schools was done on a quarterly basis. This was done without any extra costs and the unit thus stayed within the targets set by the Department.
HOME EDUCATION
The Unit visited 38 home education sites for the 2018/19 financial year for monitoring. The Home Education sites comply with the conditions for registrations. Advocacy sessions were conducted where parents do not comply and they were made aware of the requirements for Home Education.

54
Annual Report for 2018/19 Financial Year Vote 04: Department of Education
Province of the Northern Cape
54
Centres that operated illegally were encouraged to follow the legal route and register as independent schools.
A new phenomenon where learners with barriers to learning are grouped together at a centre under the pretext of Home Education is posing a problem. Parents encourage this in the absence of special schools in certain areas, namely, ZF Mgcawu (ZFM) and Frances Baard (FB) Districts.
Annu
al R
epor
t for
201
8/19
Fin
ancia
l Yea
r Vo
te 0
4: D
epar
tmen
t of E
duca
tion
Prov
ince
of t
he N
orth
ern
Cape
- 55
-
St
rate
gic
obje
ctiv
es:
Prog
ram
me
3: In
depe
nden
t Sch
ool S
ubsi
dies
Stra
tegi
c ob
ject
ives
A
ctua
l A
chie
vem
ent
2017
/201
8
Plan
ned
Targ
et
2018
/201
9
Act
ual
Ach
ieve
men
t 20
18/2
019
Dev
iatio
n fr
om
Plan
ned
Targ
et
for 2
018/
2019
C
omm
ent o
n de
viat
ions
To
ensu
re
the
exec
utio
n of
in
stitu
tiona
l m
anag
emen
t pro
cess
es a
nd s
uppo
rt to
6 fu
nded
in
depe
nden
t sch
ools
. 6
6 6
0
Perf
orm
ance
indi
cato
rs
Prog
ram
me
3: In
depe
nden
t Sch
ool S
ubsi
dies
Perf
orm
ance
Indi
cato
r A
ctua
l A
chie
vem
ent
2017
/201
8
Plan
ned
Targ
et
2018
/201
9
Act
ual
Ach
ieve
men
t 20
18/2
019
Dev
iatio
n fr
om
Plan
ned
Targ
et
for 2
018/
2019
C
omm
ent o
n de
viat
ions
PP
M30
1:P
erce
ntag
e of
reg
iste
red
inde
pend
ent
scho
ols
rece
ivin
g su
bsid
ies
16.7
%
16.7
%
16.7
%
0
(6/3
6)
(6/3
6)
(6/3
6)
PP
M30
2:N
umbe
r of
le
arne
rs
at
subs
idis
ed
regi
ster
ed in
depe
nden
t sch
ools
1
686
1 69
0 1
825
135
Mor
e le
arne
rs e
nrol
led
in in
depe
nden
t sch
ools
than
an
ticip
ated
PP
M30
3:P
erce
ntag
e of
reg
iste
red
inde
pend
ent
scho
ols
visi
ted
for m
onito
ring
and
supp
ort
100%
80
%
80%
0
(3
6/36
) (2
8/36
) (2
8/36
)

55
Annual Report for 2018/19 Financial Year Vote 04: Department of Education
Province of the Northern Cape
54
Centres that operated illegally were encouraged to follow the legal route and register as independent schools.
A new phenomenon where learners with barriers to learning are grouped together at a centre under the pretext of Home Education is posing a problem. Parents encourage this in the absence of special schools in certain areas, namely, ZF Mgcawu (ZFM) and Frances Baard (FB) Districts.
Annu
al R
epor
t for
201
8/19
Fin
ancia
l Yea
r Vo
te 0
4: D
epar
tmen
t of E
duca
tion
Prov
ince
of t
he N
orth
ern
Cape
- 55
-
St
rate
gic
obje
ctiv
es:
Prog
ram
me
3: In
depe
nden
t Sch
ool S
ubsi
dies
Stra
tegi
c ob
ject
ives
A
ctua
l A
chie
vem
ent
2017
/201
8
Plan
ned
Targ
et
2018
/201
9
Act
ual
Ach
ieve
men
t 20
18/2
019
Dev
iatio
n fr
om
Plan
ned
Targ
et
for 2
018/
2019
C
omm
ent o
n de
viat
ions
To
ensu
re
the
exec
utio
n of
in
stitu
tiona
l m
anag
emen
t pro
cess
es a
nd s
uppo
rt to
6 fu
nded
in
depe
nden
t sch
ools
. 6
6 6
0
Perf
orm
ance
indi
cato
rs
Prog
ram
me
3: In
depe
nden
t Sch
ool S
ubsi
dies
Perf
orm
ance
Indi
cato
r A
ctua
l A
chie
vem
ent
2017
/201
8
Plan
ned
Targ
et
2018
/201
9
Act
ual
Ach
ieve
men
t 20
18/2
019
Dev
iatio
n fr
om
Plan
ned
Targ
et
for 2
018/
2019
C
omm
ent o
n de
viat
ions
PP
M30
1:P
erce
ntag
e of
reg
iste
red
inde
pend
ent
scho
ols
rece
ivin
g su
bsid
ies
16.7
%
16.7
%
16.7
%
0
(6/3
6)
(6/3
6)
(6/3
6)
PP
M30
2:N
umbe
r of
le
arne
rs
at
subs
idis
ed
regi
ster
ed in
depe
nden
t sch
ools
1
686
1 69
0 1
825
135
Mor
e le
arne
rs e
nrol
led
in in
depe
nden
t sch
ools
than
an
ticip
ated
PP
M30
3:P
erce
ntag
e of
reg
iste
red
inde
pend
ent
scho
ols
visi
ted
for m
onito
ring
and
supp
ort
100%
80
%
80%
0
(3
6/36
) (2
8/36
) (2
8/36
)

56
Annual Report for 2018/19 Financial Year Vote 04: Department of Education
Province of the Northern Cape
56
Strategy to overcome areas of under performance Over the MTEF targets will be scaled down because of marginal budget increases. Changes to planned targets
There were no changes to planned targets.
Linking performance with budgets
Departments must provide a summary of the actual expenditure in comparison to the adjusted appropriation for both the current year and previous year. The information must be provided at a sub-programme level and must agree to the appropriation statement of the audited financial statements. Reasons for variations should be linked to the information discussed above in the organisational environment and the service delivery environment. The department must also report on how expenditure contributed to achievement of outputs. Sub-programme expenditure
All the targets set in Programme 3: Independent School Subsidies were achieved by the Department.
Final Actual Final Actual
Appropriation Expenditure Appropriation Expenditure
R’000 R’000 R’000 R’000 R’000 R’000
Independent Primary Level 1 639 1 639 - 1 402 1 402 -
Independent Secondary Level 7 960 7 960 - 7 762 7 762 -
Total 9 599 9 599 - 9 164 9 164 -
Programme 3: INDEPENDENT SCHOOL SUBSIDY
2018/2019 2017/2018
(Over)/Under Expenditure
(Over)/Under Expenditure
Annual Report for 2018/19 Financial Year Vote 04: Department of Education
Province of the Northern Cape
57
4.4 Programme 4: PUBLIC SPECIAL SCHOOL EDUCATION
Objective of Programme: To provide compulsory public education in special schools in accordance with the South African Schools Act and White Paper 6 on inclusive education. (E-learning activities are also included)
Sub-programmes Sub-programme 4.1: Schools
To provide specific public special schools with resources. (Including E-learning and inclusive education)
Sub-programme 4.2: Human Resource Development To provide departmental services for the development of educators and non-educators in public special schools (including inclusive education).
Sub-programme 4.3: School sport, culture and media services. To provide additional and departmentally managed sporting, cultural and reading activities in public special schools (including inclusive education).
Sub-programme 4.4: Conditional Grants To provide for projects under Programme 4 specified by the Department of Basic Education and funded by conditional grants (including inclusive education).
Strategic objectives, performance indicators, planned targets and actual achievements
Achievements Number of learners with special needs in Special Schools There are currently 2 097 of learners enrolled in Special Schools. In mainstream schools 456 learners were assessed and are being supported in their current schools. Percentage of special schools serving as Resource Centres • Are special schools with a dual role • Of the eleven Special schools, eight are utilised as Resource Centres. • A separate basket of posts was created for post provisioning of special schools • All special schools are receiving a favourable learner teacher ratio of ten to one (10:1) • Outreach programmes from these resource centres are facilitated by the Head Office staff e.g.
Autism Workshop Number of educators trained in inclusive support programmes With a training target of 2 000 educators on inclusive programmes, 1 727 educators were trained during this financial year. Well-coordinated training programmes were rendered to educators on different topics of inclusion. The needs of the schools and educators were driving these trainings. The purpose of the training was to enable educators to support learners who experience barriers to learning in the schools. The SIAS Policy (2014) training for all districts and head office took place and has resulted in 1 185 learners being supported through identification and assessment. Number of full service schools serving as learners with learning barriers A target of 30 Full Service School was set for 2018/2019 financial year. The Department currently has 26 Full Service Schools. The Full Service School development has taken place in terms of staff development and support however the challenge of favourable staff by giving them a minimum of additional one staff member and infrastructure remains a work in progress. Number of skills centres and schools of skills The number of the centres for Learners with Profound Severe Intellectual Disabilities (LSPID) is eight (8). There are two Schools of Skill in the province that are piloting phase.

57
Annual Report for 2018/19 Financial Year Vote 04: Department of Education
Province of the Northern Cape
56
Strategy to overcome areas of under performance Over the MTEF targets will be scaled down because of marginal budget increases. Changes to planned targets
There were no changes to planned targets.
Linking performance with budgets
Departments must provide a summary of the actual expenditure in comparison to the adjusted appropriation for both the current year and previous year. The information must be provided at a sub-programme level and must agree to the appropriation statement of the audited financial statements. Reasons for variations should be linked to the information discussed above in the organisational environment and the service delivery environment. The department must also report on how expenditure contributed to achievement of outputs. Sub-programme expenditure
All the targets set in Programme 3: Independent School Subsidies were achieved by the Department.
Final Actual Final Actual
Appropriation Expenditure Appropriation Expenditure
R’000 R’000 R’000 R’000 R’000 R’000
Independent Primary Level 1 639 1 639 - 1 402 1 402 -
Independent Secondary Level 7 960 7 960 - 7 762 7 762 -
Total 9 599 9 599 - 9 164 9 164 -
Programme 3: INDEPENDENT SCHOOL SUBSIDY
2018/2019 2017/2018
(Over)/Under Expenditure
(Over)/Under Expenditure
Annual Report for 2018/19 Financial Year Vote 04: Department of Education
Province of the Northern Cape
57
4.4 Programme 4: PUBLIC SPECIAL SCHOOL EDUCATION
Objective of Programme: To provide compulsory public education in special schools in accordance with the South African Schools Act and White Paper 6 on inclusive education. (E-learning activities are also included)
Sub-programmes Sub-programme 4.1: Schools
To provide specific public special schools with resources. (Including E-learning and inclusive education)
Sub-programme 4.2: Human Resource Development To provide departmental services for the development of educators and non-educators in public special schools (including inclusive education).
Sub-programme 4.3: School sport, culture and media services. To provide additional and departmentally managed sporting, cultural and reading activities in public special schools (including inclusive education).
Sub-programme 4.4: Conditional Grants To provide for projects under Programme 4 specified by the Department of Basic Education and funded by conditional grants (including inclusive education).
Strategic objectives, performance indicators, planned targets and actual achievements
Achievements Number of learners with special needs in Special Schools There are currently 2 097 of learners enrolled in Special Schools. In mainstream schools 456 learners were assessed and are being supported in their current schools. Percentage of special schools serving as Resource Centres • Are special schools with a dual role • Of the eleven Special schools, eight are utilised as Resource Centres. • A separate basket of posts was created for post provisioning of special schools • All special schools are receiving a favourable learner teacher ratio of ten to one (10:1) • Outreach programmes from these resource centres are facilitated by the Head Office staff e.g.
Autism Workshop Number of educators trained in inclusive support programmes With a training target of 2 000 educators on inclusive programmes, 1 727 educators were trained during this financial year. Well-coordinated training programmes were rendered to educators on different topics of inclusion. The needs of the schools and educators were driving these trainings. The purpose of the training was to enable educators to support learners who experience barriers to learning in the schools. The SIAS Policy (2014) training for all districts and head office took place and has resulted in 1 185 learners being supported through identification and assessment. Number of full service schools serving as learners with learning barriers A target of 30 Full Service School was set for 2018/2019 financial year. The Department currently has 26 Full Service Schools. The Full Service School development has taken place in terms of staff development and support however the challenge of favourable staff by giving them a minimum of additional one staff member and infrastructure remains a work in progress. Number of skills centres and schools of skills The number of the centres for Learners with Profound Severe Intellectual Disabilities (LSPID) is eight (8). There are two Schools of Skill in the province that are piloting phase.

58
Annu
al R
epor
t for
201
8/19
Fin
ancia
l Yea
r Vo
te 0
4: D
epar
tmen
t of E
duca
tion
Prov
ince
of t
he N
orth
ern
Cape
- 58
- St
rate
gic
obje
ctiv
es:
Prog
ram
me
4: P
ublic
Spe
cial
Sch
ool E
duca
tion
Stra
tegi
c ob
ject
ives
A
ctua
l A
chie
vem
ent
2017
/201
8
Plan
ned
Targ
et
2018
/201
9
Act
ual
Ach
ieve
men
t 20
18/2
019
Dev
iatio
n fr
om
Plan
ned
Targ
et
for 2
018/
2019
C
omm
ent o
n de
viat
ions
To e
xpan
d th
e re
ach
of e
duca
tion
prog
ram
mes
to
supp
ort
2 12
0 le
arne
rs w
ith s
peci
al e
duca
tiona
l ne
eds.
2
197
2 11
0 2
097
-13
Few
er le
arne
rs r
efer
red
to th
e se
cure
-car
e ce
ntre
s as
th
ey
are
mos
tly
the
cont
ribut
ors
to
this
pe
rform
ance
.
Pe
rfor
man
ce in
dica
tors
Prog
ram
me
4: P
ublic
Spe
cial
Sch
ool E
duca
tion
Perf
orm
ance
Indi
cato
r A
ctua
l A
chie
vem
ent
2017
/201
8
Plan
ned
Targ
et
2018
/201
9
Act
ual
Ach
ieve
men
t 20
18/2
019
Dev
iatio
n fr
om
Plan
ned
Targ
et
for 2
018/
2019
C
omm
ent o
n de
viat
ions
PP
M40
1:P
erce
ntag
e of
spe
cial
sch
ools
ser
ving
as
Res
ourc
e C
entre
s 72
.7%
72
.7%
72
.7%
0
(8
/11)
(8
/11)
(8
/11)
P
PM
402:
Num
ber
of l
earn
ers
in p
ublic
spe
cial
sc
hool
s 2
197
2 11
0 2
097
-13
Few
er le
arne
rs re
ferr
ed to
the
secu
re-c
are
cent
res
PP
M40
3:N
umbe
r of
the
rapi
sts/
spec
ialis
t st
aff
in
spec
ial s
choo
ls
11
12
12
0
Su
b-pr
ogra
mm
e 4.
2: H
uman
Res
ourc
e D
evel
opm
ent
Perf
orm
ance
Indi
cato
r A
ctua
l A
chie
vem
ent
2017
/201
8
Plan
ned
Targ
et
2018
/201
9
Act
ual
Ach
ieve
men
t 20
18/2
019
Dev
iatio
n fr
om
Plan
ned
Targ
et
for 2
018/
2019
C
omm
ent o
n de
viat
ions
4.2.
1:N
umbe
r of
edu
cato
rs t
rain
ed i
n in
clus
ive
supp
ort p
rogr
amm
es
2 05
4 2
000
1 41
1 -5
89
The
Dep
artm
ent w
as n
ot a
ble
to w
ipe
out t
he d
efic
it cr
eate
d by
the
uni
on a
ctio
n an
d se
rvic
e de
liver
y pr
otes
ts th
at o
ccur
red
durin
g th
e fir
st tw
o qu
arte
rs o
f th
e fin
anci
al y
ear
Annual Report for 2018/19 Financial Year Vote 04: Department of Education
Province of the Northern Cape
- 59 -
Strategy to overcome areas of under performance
Over the MTEF, targets will be scaled down because of marginal budget increases. Changes to planned targets
There were no changes to planned targets.
Linking performance with budgets
Departments must provide a summary of the actual expenditure in comparison to the adjusted appropriation for both the current year and previous year. The information must be provided at a sub-programme level and must agree to the appropriation statement of the audited financial statements. Reasons for variations should be linked to the information discussed above in the organisational environment and the service delivery environment. The department must also report on how expenditure contributed to achievement of outputs. Sub-programme expenditure
The Department achieved only two (2) of the four (4) targets, 50%, set in Programme 4: Public Special School Education. Training on inclusive support programmes was hampered by union action and service delivery protests during the first two quarters. Fewer learners were referred to secure-care centres than in the previous year.
Final Actual Final Actual
Appropriation Expenditure Appropriation Expenditure
R’000 R’000 R’000 R’000 R’000 R’000
Schools 152 806 153 655 (849) 138 872 140 208 (1 336)
Human Resource Development 98 98 - 38 38 -
School Sport, Culture and Media Services - - - - - -
Learners for Profound Disabilities 6 837 6 833 4 2 021 1 557 464
Total 159 741 160 586 (845) 140 931 141 803 (872)
Programme 4: Public Special School Education
2018/2019 2017/2018
(Over)/Under Expenditure
(Over)/Under Expenditure

59
Annual Report for 2018/19 Financial Year Vote 04: Department of Education
Province of the Northern Cape
- 59 -
Strategy to overcome areas of under performance
Over the MTEF, targets will be scaled down because of marginal budget increases. Changes to planned targets
There were no changes to planned targets.
Linking performance with budgets
Departments must provide a summary of the actual expenditure in comparison to the adjusted appropriation for both the current year and previous year. The information must be provided at a sub-programme level and must agree to the appropriation statement of the audited financial statements. Reasons for variations should be linked to the information discussed above in the organisational environment and the service delivery environment. The department must also report on how expenditure contributed to achievement of outputs. Sub-programme expenditure
The Department achieved only two (2) of the four (4) targets, 50%, set in Programme 4: Public Special School Education. Training on inclusive support programmes was hampered by union action and service delivery protests during the first two quarters. Fewer learners were referred to secure-care centres than in the previous year.
Final Actual Final Actual
Appropriation Expenditure Appropriation Expenditure
R’000 R’000 R’000 R’000 R’000 R’000
Schools 152 806 153 655 (849) 138 872 140 208 (1 336)
Human Resource Development 98 98 - 38 38 -
School Sport, Culture and Media Services - - - - - -
Learners for Profound Disabilities 6 837 6 833 4 2 021 1 557 464
Total 159 741 160 586 (845) 140 931 141 803 (872)
Programme 4: Public Special School Education
2018/2019 2017/2018
(Over)/Under Expenditure
(Over)/Under Expenditure

60
Annual Report for 2018/19 Financial Year Vote 04: Department of Education
Province of the Northern Cape
60
4.5 Programme 5: EARLY CHILDHOOD DEVELOPMENT
Objective of Programme: To provide Early Childhood Education (ECD) at the Grade R and pre-grade R in accordance with White Paper 5. (E-learning is also included)
Sub-programmes
Sub-programme 5.1: Grade R in Public Schools
To provide specific public ordinary schools with resources required for Grade R. Sub-programme 5.2: Grade R in early childhood development centres
To support Grade R at early childhood development centres. Sub-programme 5.3: Pre-Grade R Training
To provide training and payment of stipends of Pre-Grade R practitioners/ educators Sub-programme 5.4: Human Resource Development
To provide departmental services for the development of practitioners/ educators and non-educators in grade R at public schools and ECD centres.
Sub-programme 5.5: Conditional Grant To provide for projects under programme 5 specified by the Department of Basic Education and
funded by conditional grants
Strategic objectives, performance indicators, planned targets and actual achievements
Achievements There is overwhelming evidence that attest to the importance of the provision of quality programmes at an early age. A child’s early years are the foundation for his or her future development and they provide a strong base for lifelong learning and learning abilities. Lack of opportunities and quality of intervention during early childhood can significantly disadvantage young children and diminish their potential for success. To address critical gaps and ensure that comprehensive Early Childhood Development (ECD) services are provided, the following activities were undertaken:
Pre-Grade R Practitioners from ECD centres across the Province were trained on the National Curriculum Framework (NCF). To ensure effective implementation of NCF, practitioners were supported through support visits and empowerment sessions. Information was shared with 437 community members through advocacy and awareness campaigns on NCF. 22 provincial staff and officials from Frances Baard and Namakwa districts were trained on the NCF. 14 officials from other relevant government departments and service providers were oriented on NCF by the Province. Fun Days were held to promote access to ECD programmes.
A Provincial training subcommittee was established with relevant government departments and non-governmental organisations to coordinate and manage all programmes related to training in ECD. 20 caregivers who enrolled in the Diploma in Grade R Teaching have been recruited to benefit from the EPWP programme.
Expansion An amount of R14 746 875 was transferred to schools that offer Grade R. 12 schools opened additional Grade R classes in January 2019. The contracts of practitioners were renewed in January 2019, with 12,4 percent of practitioners in public schools having a qualification of REQV 12 and above. The stipends of practitioners were increased as follows:
Practitioners with a Grade 12 certificate who are in the process of improving their qualifications moved from R6 000 to R6 300.
Annual Report for 2018/19 Financial Year Vote 04: Department of Education
Province of the Northern Cape
61
Practitioners with ECD NQF level 4 and 5 moved from R6 000 to R6 500 Practitioners with the Diploma in Grade R Teaching or REQV 13 and above moved from R7 500
to R8 000.
Outdoor furniture and basic minimum resources could not be provided to new or additional classrooms due to financial constraints. In order to improve quality in ECD, consultation sessions and additional support was provided to Diploma in Grade R students who did not complete their studies in 2017. Seventy additional students were enrolled for the Diploma in Grade R Teaching programme through additional funding from De Aar Solar Power, Droogfontein Solar Power and Sishen Iron Ore Company (SIOC) Development Trust. In July 2018, 20 Students who graduated with a Diploma in Grade R Teaching were offered bursaries by ETDP-SETA to study the Bachelor of Education: Foundation Phase.
Grade R Practitioners were supported in the implementation of CAPS through on-site visits, empowerment sessions and district cluster sessions. Moreover, to improve language and mathematics competencies of teachers and learners, the Basic Concept Programme was introduced in John Taolo Gaetsewe and Pixley ka Seme Districts in February 2019. 90 practitioners, 5 mentors and 4 officials were trained on the Programme, and 2 provincial coordinators and 4 district officials mediated with 2 facilitators. 63 practitioners were monitored and supported. 17 practitioners completed their Diploma in Grade R Teaching in November 2019. The Curriculum Roadshow was conducted in January and February to prepare 610 Grade R practitioners for the 2019 academic year. The following were discussed: mediation of the provincial subject improvement plans, diagnostic and SBA reports, development of exemplar tasks and introduction of curriculum coverage tools for exit grades.

61
Annual Report for 2018/19 Financial Year Vote 04: Department of Education
Province of the Northern Cape
60
4.5 Programme 5: EARLY CHILDHOOD DEVELOPMENT
Objective of Programme: To provide Early Childhood Education (ECD) at the Grade R and pre-grade R in accordance with White Paper 5. (E-learning is also included)
Sub-programmes
Sub-programme 5.1: Grade R in Public Schools
To provide specific public ordinary schools with resources required for Grade R. Sub-programme 5.2: Grade R in early childhood development centres
To support Grade R at early childhood development centres. Sub-programme 5.3: Pre-Grade R Training
To provide training and payment of stipends of Pre-Grade R practitioners/ educators Sub-programme 5.4: Human Resource Development
To provide departmental services for the development of practitioners/ educators and non-educators in grade R at public schools and ECD centres.
Sub-programme 5.5: Conditional Grant To provide for projects under programme 5 specified by the Department of Basic Education and
funded by conditional grants
Strategic objectives, performance indicators, planned targets and actual achievements
Achievements There is overwhelming evidence that attest to the importance of the provision of quality programmes at an early age. A child’s early years are the foundation for his or her future development and they provide a strong base for lifelong learning and learning abilities. Lack of opportunities and quality of intervention during early childhood can significantly disadvantage young children and diminish their potential for success. To address critical gaps and ensure that comprehensive Early Childhood Development (ECD) services are provided, the following activities were undertaken:
Pre-Grade R Practitioners from ECD centres across the Province were trained on the National Curriculum Framework (NCF). To ensure effective implementation of NCF, practitioners were supported through support visits and empowerment sessions. Information was shared with 437 community members through advocacy and awareness campaigns on NCF. 22 provincial staff and officials from Frances Baard and Namakwa districts were trained on the NCF. 14 officials from other relevant government departments and service providers were oriented on NCF by the Province. Fun Days were held to promote access to ECD programmes.
A Provincial training subcommittee was established with relevant government departments and non-governmental organisations to coordinate and manage all programmes related to training in ECD. 20 caregivers who enrolled in the Diploma in Grade R Teaching have been recruited to benefit from the EPWP programme.
Expansion An amount of R14 746 875 was transferred to schools that offer Grade R. 12 schools opened additional Grade R classes in January 2019. The contracts of practitioners were renewed in January 2019, with 12,4 percent of practitioners in public schools having a qualification of REQV 12 and above. The stipends of practitioners were increased as follows:
Practitioners with a Grade 12 certificate who are in the process of improving their qualifications moved from R6 000 to R6 300.
Annual Report for 2018/19 Financial Year Vote 04: Department of Education
Province of the Northern Cape
61
Practitioners with ECD NQF level 4 and 5 moved from R6 000 to R6 500 Practitioners with the Diploma in Grade R Teaching or REQV 13 and above moved from R7 500
to R8 000.
Outdoor furniture and basic minimum resources could not be provided to new or additional classrooms due to financial constraints. In order to improve quality in ECD, consultation sessions and additional support was provided to Diploma in Grade R students who did not complete their studies in 2017. Seventy additional students were enrolled for the Diploma in Grade R Teaching programme through additional funding from De Aar Solar Power, Droogfontein Solar Power and Sishen Iron Ore Company (SIOC) Development Trust. In July 2018, 20 Students who graduated with a Diploma in Grade R Teaching were offered bursaries by ETDP-SETA to study the Bachelor of Education: Foundation Phase.
Grade R Practitioners were supported in the implementation of CAPS through on-site visits, empowerment sessions and district cluster sessions. Moreover, to improve language and mathematics competencies of teachers and learners, the Basic Concept Programme was introduced in John Taolo Gaetsewe and Pixley ka Seme Districts in February 2019. 90 practitioners, 5 mentors and 4 officials were trained on the Programme, and 2 provincial coordinators and 4 district officials mediated with 2 facilitators. 63 practitioners were monitored and supported. 17 practitioners completed their Diploma in Grade R Teaching in November 2019. The Curriculum Roadshow was conducted in January and February to prepare 610 Grade R practitioners for the 2019 academic year. The following were discussed: mediation of the provincial subject improvement plans, diagnostic and SBA reports, development of exemplar tasks and introduction of curriculum coverage tools for exit grades.

62
Annu
al R
epor
t for
201
8/19
Fin
ancia
l Yea
r Vo
te 0
4: D
epar
tmen
t of E
duca
tion
Prov
ince
of t
he N
orth
ern
Cape
- 62
- St
rate
gic
obje
ctiv
es:
Prog
ram
me
5: E
arly
Chi
ldho
od D
evel
opm
ent
Stra
tegi
c ob
ject
ives
A
ctua
l A
chie
vem
ent
2017
/201
8
Plan
ned
Targ
et
2018
/201
9
Act
ual
Ach
ieve
men
t 20
18/2
019
Dev
iatio
n fr
om
Plan
ned
Targ
et
for 2
018/
2019
C
omm
ent o
n de
viat
ions
To
prov
ide
qual
ity
Ear
ly
Chi
ldho
od
Dev
elop
men
t se
rvic
es t
o 38
3 pu
blic
sch
ools
of
ferin
g G
rade
R
381
381
377
-4
Cla
sses
at f
our s
choo
ls w
ere
term
inat
ed d
ue to
the
low
lea
rner
num
bers
whi
ch d
id n
ot j
ustif
y th
e ap
poin
tmen
t of a
pra
ctiti
oner
Pe
rfor
man
ce in
dica
tors
Prog
ram
me
5: E
arly
Chi
ldho
od D
evel
opm
ent
Perf
orm
ance
Indi
cato
r A
ctua
l A
chie
vem
ent
2017
/201
8
Plan
ned
Targ
et
2018
/201
9
Act
ual
Ach
ieve
men
t 20
18/2
019
Dev
iatio
n fr
om
Plan
ned
Targ
et
for 2
018/
2019
C
omm
ent o
n de
viat
ions
PP
M50
1:N
umbe
r of
pub
lic s
choo
ls t
hat
offe
r G
rade
R
381
381
377
-4
Cla
sses
at f
our s
choo
ls w
ere
term
inat
ed d
ue to
the
low
le
arne
r num
bers
whi
ch d
id n
ot ju
stify
the
appo
intm
ent o
f a
prac
titio
ner
PP
M50
2:P
erce
ntag
e of
Gra
de 1
lear
ners
who
ha
ve re
ceiv
ed fo
rmal
Gra
de R
edu
catio
n
89.0
%
82%
82
.6%
0.
6%
Res
ult o
f effe
ctiv
e ad
voca
cy a
nd p
ositi
ve r
espo
nse
by
the
com
mun
ity
(19
645/
22
084
) (1
9 27
0/
23 5
00)
(20
552/
24
885
)
Sub-
prog
ram
me
5.1:
Gra
de R
in P
ublic
Sch
ools
Perf
orm
ance
Indi
cato
r A
ctua
l A
chie
vem
ent
2017
/201
8
Plan
ned
Targ
et
2018
/201
9
Act
ual
Ach
ieve
men
t 20
18/2
019
Dev
iatio
n fr
om
Plan
ned
Targ
et
for 2
018/
2019
C
omm
ent o
n de
viat
ions
5.1.
1:Pe
rcen
tage
of G
rade
R p
ract
ition
ers
with
NQ
F le
vel
6 an
d ab
ove
qual
ifica
tion
each
yea
r
7.5%
10
%
12.3
%
2.3%
M
ore
prac
titio
ners
gr
adua
ted
afte
r ad
ditio
nal
reso
urce
s w
ere
avai
led
by th
e D
epar
tmen
t (5
3/70
2)
(77/
770)
(8
4/68
5)
Annual Report for 2018/19 Financial Year Vote 04: Department of Education
Province of the Northern Cape
- 63 -
Strategy to overcome areas of under performance Over the MTEF targets will be scaled down because of marginal budget increases. Changes to planned targets
There were no changes to planned targets
Linking performance with budgets
Departments must provide a summary of the actual expenditure in comparison to the adjusted appropriation for both the current year and previous year. The information must be provided at a sub-programme level and must agree to the appropriation statement of the audited financial statements. Reasons for variations should be linked to the information discussed above in the organisational environment and the service delivery environment. The department must also report on how expenditure contributed to achievement of outputs. Sub-programme expenditure
In Programme 5: Early Childhood Development the Department achieved two (2) out of three (3), 66,7%, of the targets set. The services of practitioners at four schools were terminated due to low learner numbers.
Final Actual Final Actual
Appropriation Expenditure Appropriation Expenditure
R’000 R’000 R’000 R’000 R’000 R’000
Grade R in Public Schools 91 273 91 273 - 86 786 86 616 170
Grade R in early childhood development centres 6 965 6 965 - 6 076 6 076 -
Pre-grade R Training 216 216 - 1 335 1 505 (170)
Human Resource Development 7 7 - 76 76 -
Total 98 461 98 461 - 94 273 94 273 -
Programme 5: Early Childhood Development
2018/2019 2017/2018
(Over)/Under Expenditure
(Over)/Under Expenditure

63
Annual Report for 2018/19 Financial Year Vote 04: Department of Education
Province of the Northern Cape
- 63 -
Strategy to overcome areas of under performance Over the MTEF targets will be scaled down because of marginal budget increases. Changes to planned targets
There were no changes to planned targets
Linking performance with budgets
Departments must provide a summary of the actual expenditure in comparison to the adjusted appropriation for both the current year and previous year. The information must be provided at a sub-programme level and must agree to the appropriation statement of the audited financial statements. Reasons for variations should be linked to the information discussed above in the organisational environment and the service delivery environment. The department must also report on how expenditure contributed to achievement of outputs. Sub-programme expenditure
In Programme 5: Early Childhood Development the Department achieved two (2) out of three (3), 66,7%, of the targets set. The services of practitioners at four schools were terminated due to low learner numbers.
Final Actual Final Actual
Appropriation Expenditure Appropriation Expenditure
R’000 R’000 R’000 R’000 R’000 R’000
Grade R in Public Schools 91 273 91 273 - 86 786 86 616 170
Grade R in early childhood development centres 6 965 6 965 - 6 076 6 076 -
Pre-grade R Training 216 216 - 1 335 1 505 (170)
Human Resource Development 7 7 - 76 76 -
Total 98 461 98 461 - 94 273 94 273 -
Programme 5: Early Childhood Development
2018/2019 2017/2018
(Over)/Under Expenditure
(Over)/Under Expenditure

64
Annual Report for 2018/19 Financial Year Vote 04: Department of Education
Province of the Northern Cape
64
4.6 Programme 6: INFRASTRUCTURE DEVELOPMENT
Objective of Programme: To provide and maintain infrastructure facilities for schools and non-schools
Sub-programmes Sub-programme 61: Administration To provide and maintain infrastructure facilities for administration Sub-programme 6.2: Public Ordinary Schools To provide and maintain infrastructure facilities for public ordinary school Sub-programme 6.3: Public Special Schools To provide and maintain infrastructure facilities for public special school Sub-programme 6.4: Early Childhood Development To provide and maintain infrastructure facilities for early childhood development
Discuss the purpose of each programme List the sub-programmes List the strategic objectives for the financial year under review Strategic objectives, performance indicators, planned targets and actual achievements
Achievements INFRASTRUCTURE PUBLIC ORDINARY SCHOOLS Number of Classrooms Built In Public Ordinary Schools The Department is in the process of addressing backlogs regarding the provisioning of classrooms in the Northern Cape. New classrooms are built and in addition to the planned maintenance at schools, repairs and renovations are done on existing classrooms to bring them up to an acceptable standard. Three classrooms were completed within the 2018/19 financial year.
EMIS NUMBER
PROJECT NAME
DISTRICT MUNICIPALITY SECTOR
URBAN OR RURAL
PROJECT NO. PROJECT STATUS
IDMS PROJECT STATUS
SUB-PROGRAMME
QUARTER COMPLETED
300100181 BONTLENG PRIMARY SCHOOL
FRANCES BAARD PUBLIC URBAN DRPW027/2016
PRACTICAL COMPLETION (100%)
STAGE 8: HANDOVER
CLASSROOM BLOCK 3
The completion dates of the new Steynsville Primary, new Wrenchville Primary and replacement Karos Intermediate schools were set for the 2018/19 financial year. However, contractors requested extensions and it is now estimated that they will be completed during the 1st Quarter of 2019/20 financial year. Number of Specialist Rooms Built in Public Ordinary Schools Specialist rooms include media centres, computer rooms, libraries and laboratories. This also includes conversions of existing facilities into these specialist rooms. The Department is addressing backlogs regarding the provisioning of these rooms in the Northern Cape. This is done in addition to the planned maintenance at schools and repairs and renovations that are done on existing facilities to bring them up to an acceptable standard. The completion date of the new Wrenchville Primary School was set for the 2017/18 financial year, however the contractor was terminated on 13/02/2018 after several extension of times that were approved. A new contractor was appointed and the construction is now estimated to be completed in the 2019/20 financial year. No specialist rooms where completed within the 2018/19 financial year.
Annual Report for 2018/19 Financial Year Vote 04: Department of Education
Province of the Northern Cape
65
Number of New Schools Completed and Ready for Occupation (Includes Replacement Schools) The completion of new schools takes a period of 3 years and as these larger projects are implemented by Independent Development Trust (IDT) the progress is sometimes slow. The new and replacement schools to be completed are still in construction. Number of New Schools Under Construction (Includes Replacement Schools) The demand for new school infrastructure is determined by the demand for social infrastructure such as housing, in this instance new schools will be planned for these areas. The replacement of inappropriate schools constructed from asbestos are also included into this target. A total of 7 schools were in construction during the 2018/19 financial year and some of the targeted schools had challenges and did not start with construction as was planned. The new Magojaneng Primary and Secondary schools, were reprioritised to the outer years due to budget availability thus affecting the actual completed for the 2018/19 financial year. The new State of the Art Redirile and new Barkley Rooirand schools have not yet started with construction. This indicator will therefore underperform by 4 schools. The implementation of new and replacement schools in construction are indicated in the table below:
EMIS NUMBER PROJECT NAME DISTRICT
MUNICIPALITY LOCAL MUNICIPALITY IA PROJECT
STATUS PROGRAMME
300016203 GROENPUNT PRIMÊRE SKOOL
FRANCES BAARD SOL PLAATJE IDT CONSTRUCTION
76%-99% REPLACEMENT SCHOOL
300000008 DITHAKONG NEW SCHOOL AND HOSTEL
JOHN TAOLO GAETSEWE
JOE MOROLONG IDT CONSTRUCTION
1%-25% NEW SCHOOL
300043304 KAROS INTERMEDIATE SCHOOL
ZF MGCAWU DAWID KRUIPER IDT CONSTRUCTION
76%-99% REPLACEMENT SCHOOL
300100707 KHIBA SECONDARY SCHOOL
JOHN TAOLO GAETSEWE
GA-SEGONYANA IDT CONSTRUCTION
51%-75% REPLACEMENT SCHOOL
300000021 STEYNSVILLE NEW PRIMARY SCHOOL
PIXLEY KA SEME THEMBELIHLE IDT CONSTRUCTION
76%-99% NEW SCHOOL
300000024 VAAL ORANJE OFF-SHOOT PRIMARY SCHOOL
PIXLEY KA SEME SIYANCUMA IDT CONSTRUCTION
26%-50% NEW SCHOOL
300000014 WRENCHVILLE NEW PRIMARY SCHOOL
JOHN TAOLO GAETSEWE
GA-SEGONYANA IDT CONSTRUCTION
76%-99% NEW SCHOOL
Number of Hostels Built No hostels were targeted for completion within the 2018/19 financial year. Number of Public Ordinary Schools Undergoing Scheduled Maintenance Maintenance can be classified into two (2) different categories, namely, corrective and preventative maintenance. Corrective maintenance is maintenance carried out after a failure has occurred and intended to restore an item to a state in which it can perform its required function. Corrective maintenance can be planned or unplanned whereas preventative maintenance is maintenance carried out at pre-determined intervals, or corresponding to prescribed criteria, and intended to reduce the probability of failure or the performance degradation of an item. The Department had targeted 39 schools to receive maintenance and a total of 35 schools underwent maintenance in the 2018/19 financial year.

65
Annual Report for 2018/19 Financial Year Vote 04: Department of Education
Province of the Northern Cape
64
4.6 Programme 6: INFRASTRUCTURE DEVELOPMENT
Objective of Programme: To provide and maintain infrastructure facilities for schools and non-schools
Sub-programmes Sub-programme 61: Administration To provide and maintain infrastructure facilities for administration Sub-programme 6.2: Public Ordinary Schools To provide and maintain infrastructure facilities for public ordinary school Sub-programme 6.3: Public Special Schools To provide and maintain infrastructure facilities for public special school Sub-programme 6.4: Early Childhood Development To provide and maintain infrastructure facilities for early childhood development
Discuss the purpose of each programme List the sub-programmes List the strategic objectives for the financial year under review Strategic objectives, performance indicators, planned targets and actual achievements
Achievements INFRASTRUCTURE PUBLIC ORDINARY SCHOOLS Number of Classrooms Built In Public Ordinary Schools The Department is in the process of addressing backlogs regarding the provisioning of classrooms in the Northern Cape. New classrooms are built and in addition to the planned maintenance at schools, repairs and renovations are done on existing classrooms to bring them up to an acceptable standard. Three classrooms were completed within the 2018/19 financial year.
EMIS NUMBER
PROJECT NAME
DISTRICT MUNICIPALITY SECTOR
URBAN OR RURAL
PROJECT NO. PROJECT STATUS
IDMS PROJECT STATUS
SUB-PROGRAMME
QUARTER COMPLETED
300100181 BONTLENG PRIMARY SCHOOL
FRANCES BAARD PUBLIC URBAN DRPW027/2016
PRACTICAL COMPLETION (100%)
STAGE 8: HANDOVER
CLASSROOM BLOCK 3
The completion dates of the new Steynsville Primary, new Wrenchville Primary and replacement Karos Intermediate schools were set for the 2018/19 financial year. However, contractors requested extensions and it is now estimated that they will be completed during the 1st Quarter of 2019/20 financial year. Number of Specialist Rooms Built in Public Ordinary Schools Specialist rooms include media centres, computer rooms, libraries and laboratories. This also includes conversions of existing facilities into these specialist rooms. The Department is addressing backlogs regarding the provisioning of these rooms in the Northern Cape. This is done in addition to the planned maintenance at schools and repairs and renovations that are done on existing facilities to bring them up to an acceptable standard. The completion date of the new Wrenchville Primary School was set for the 2017/18 financial year, however the contractor was terminated on 13/02/2018 after several extension of times that were approved. A new contractor was appointed and the construction is now estimated to be completed in the 2019/20 financial year. No specialist rooms where completed within the 2018/19 financial year.
Annual Report for 2018/19 Financial Year Vote 04: Department of Education
Province of the Northern Cape
65
Number of New Schools Completed and Ready for Occupation (Includes Replacement Schools) The completion of new schools takes a period of 3 years and as these larger projects are implemented by Independent Development Trust (IDT) the progress is sometimes slow. The new and replacement schools to be completed are still in construction. Number of New Schools Under Construction (Includes Replacement Schools) The demand for new school infrastructure is determined by the demand for social infrastructure such as housing, in this instance new schools will be planned for these areas. The replacement of inappropriate schools constructed from asbestos are also included into this target. A total of 7 schools were in construction during the 2018/19 financial year and some of the targeted schools had challenges and did not start with construction as was planned. The new Magojaneng Primary and Secondary schools, were reprioritised to the outer years due to budget availability thus affecting the actual completed for the 2018/19 financial year. The new State of the Art Redirile and new Barkley Rooirand schools have not yet started with construction. This indicator will therefore underperform by 4 schools. The implementation of new and replacement schools in construction are indicated in the table below:
EMIS NUMBER PROJECT NAME DISTRICT
MUNICIPALITY LOCAL MUNICIPALITY IA PROJECT
STATUS PROGRAMME
300016203 GROENPUNT PRIMÊRE SKOOL
FRANCES BAARD SOL PLAATJE IDT CONSTRUCTION
76%-99% REPLACEMENT SCHOOL
300000008 DITHAKONG NEW SCHOOL AND HOSTEL
JOHN TAOLO GAETSEWE
JOE MOROLONG IDT CONSTRUCTION
1%-25% NEW SCHOOL
300043304 KAROS INTERMEDIATE SCHOOL
ZF MGCAWU DAWID KRUIPER IDT CONSTRUCTION
76%-99% REPLACEMENT SCHOOL
300100707 KHIBA SECONDARY SCHOOL
JOHN TAOLO GAETSEWE
GA-SEGONYANA IDT CONSTRUCTION
51%-75% REPLACEMENT SCHOOL
300000021 STEYNSVILLE NEW PRIMARY SCHOOL
PIXLEY KA SEME THEMBELIHLE IDT CONSTRUCTION
76%-99% NEW SCHOOL
300000024 VAAL ORANJE OFF-SHOOT PRIMARY SCHOOL
PIXLEY KA SEME SIYANCUMA IDT CONSTRUCTION
26%-50% NEW SCHOOL
300000014 WRENCHVILLE NEW PRIMARY SCHOOL
JOHN TAOLO GAETSEWE
GA-SEGONYANA IDT CONSTRUCTION
76%-99% NEW SCHOOL
Number of Hostels Built No hostels were targeted for completion within the 2018/19 financial year. Number of Public Ordinary Schools Undergoing Scheduled Maintenance Maintenance can be classified into two (2) different categories, namely, corrective and preventative maintenance. Corrective maintenance is maintenance carried out after a failure has occurred and intended to restore an item to a state in which it can perform its required function. Corrective maintenance can be planned or unplanned whereas preventative maintenance is maintenance carried out at pre-determined intervals, or corresponding to prescribed criteria, and intended to reduce the probability of failure or the performance degradation of an item. The Department had targeted 39 schools to receive maintenance and a total of 35 schools underwent maintenance in the 2018/19 financial year.

66
Annual Report for 2018/19 Financial Year Vote 04: Department of Education
Province of the Northern Cape
66
EMIS NUMBER
PROJECT NAME
DISTRICT MUNICIPALITY
SECTOR
URBAN OR RURAL
PROJECT NO. IDMS PROJECT STATUS
PROJECT STATUS
SUB-PROGRAMME
QU
AR
TER
C
OM
PLET
ED
300023401
ENOCH MTHETHO SECONDARY SCHOOL
PIXLEY KA SEME PUBLIC URBAN ST084/2018
STAGE 9: PACKAGE COMPLETION
CLOSED OUT
MAINTENANCE - CORRECTIVE 1
300100402 GAMASEGO PRIMARY SCHOOL
JOHN TAOLO GAETSEWE PUBLIC RURAL ST082/2018
STAGE 9: PACKAGE COMPLETION
FINAL COMPLETION
MAINTENANCE - CORRECTIVE 1
300033401 HANTAM SEKONDÊRE SKOOL
NAMAKWA PUBLIC URBAN ST017/2017
STAGE 9: PACKAGE COMPLETION
CLOSED OUT
MAINTENANCE - PREVENTATIVE
1
300100561 ITEKELENG PRIMARY SCHOOL
JOHN TAOLO GAETSEWE PUBLIC RURAL OR-026687
STAGE 9: PACKAGE COMPLETION
CLOSED OUT
MAINTENANCE - CORRECTIVE 1
300100778 KUDUMANE PRIMARY SCHOOL
JOHN TAOLO GAETSEWE PUBLIC RURAL DOE03NCAR02
6 STAGE 8: HANDOVER
PRACTICAL COMPLETION (100%)
MAINTENANCE - PREVENTATIVE
1
300015207
MASIZA SENIOR PRIMARY SCHOOL
FRANCES BAARD PUBLIC URBAN ST063/2017
STAGE 9: PACKAGE COMPLETION
CLOSED OUT
MAINTENANCE - CORRECTIVE 1
300101922 SEGWANENG PRIMARY SCHOOL
JOHN TAOLO GAETSEWE PUBLIC RURAL OR-025923
STAGE 9: PACKAGE COMPLETION
CLOSED OUT
MAINTENANCE - CORRECTIVE 1
300024202 CAREL VAN ZYL PRIMARY SCHOOL
PIXLEY KA SEME PUBLIC URBAN OR-027073
STAGE 9: PACKAGE COMPLETION
CLOSED OUT
MAINTENANCE - CORRECTIVE 2
300044203 DEBEN PRIMÊRE SKOOL
JOHN TAOLO GAETSEWE PUBLIC RURAL JTGDT/2016/00
5
STAGE 9: PACKAGE COMPLETION
FINAL COMPLETION
MAINTENANCE - PREVENTATIVE
2
300100363 ETHEL PRIMARY SCHOOL
JOHN TAOLO GAETSEWE PUBLIC RURAL ST081/2018
STAGE 9: PACKAGE COMPLETION
FINAL COMPLETION
MAINTENANCE - CORRECTIVE 2
300011401 FLOORS HIGH SCHOOL
FRANCES BAARD PUBLIC URBAN ST058/2017
STAGE 9: PACKAGE COMPLETION
CLOSED OUT
MAINTENANCE - PREVENTATIVE
2
300022305 HOËRSKOOL STEYNVILLE
PIXLEY KA SEME PUBLIC URBAN ST085/2018
STAGE 9: PACKAGE COMPLETION
CLOSED OUT
MAINTENANCE - CORRECTIVE 2
300100690 KGOMOTSO SECONDARY SCHOOL
FRANCES BAARD PUBLIC URBAN OR-026014
STAGE 9: PACKAGE COMPLETION
FINAL COMPLETION
MAINTENANCE - PREVENTATIVE
2
300100774 KS SHUPING SECONDARY SCHOOL
JOHN TAOLO GAETSEWE PUBLIC RURAL OR-026830
STAGE 9: PACKAGE COMPLETION
CLOSED OUT
MAINTENANCE - CORRECTIVE 2
300100821 LEBANG SECONDARY SCHOOL
JOHN TAOLO GAETSEWE PUBLIC RURAL ST088/2018 STAGE 8:
HANDOVER
PRACTICAL COMPLETION (100%)
MAINTENANCE - CORRECTIVE 2
300100890 LETLHAKAJANENG PRIMARY SCHOOL
JOHN TAOLO GAETSEWE PUBLIC RURAL ST079/2018
STAGE 9: PACKAGE COMPLETION
CLOSED OUT
MAINTENANCE - PREVENTATIVE
2
300101239 MMITSATSHIPI PRIMARY SCHOOL
JOHN TAOLO GAETSEWE PUBLIC RURAL OR-026078
STAGE 9: PACKAGE COMPLETION
CLOSED OUT
MAINTENANCE - CORRECTIVE 2
300021403 MONWABISI HIGH SCHOOL
PIXLEY KA SEME PUBLIC URBAN ST087/2018
STAGE 9: PACKAGE COMPLETION
CLOSED OUT
MAINTENANCE - CORRECTIVE 2
300023303 NOUPOORT GEKOMBINEERDE SKOOL
PIXLEY KA SEME PUBLIC URBAN ST108/2018 STAGE 8:
HANDOVER
PRACTICAL COMPLETION (100%)
MAINTENANCE - PREVENTATIVE
2
300023402 PHAKAMISANI HIGH SCHOOL
PIXLEY KA SEME PUBLIC URBAN ST056/2017
STAGE 9: PACKAGE COMPLETION
FINAL COMPLETION
MAINTENANCE - CORRECTIVE 2
300101617 PHAKANE SECONDARY SCHOOL
JOHN TAOLO GAETSEWE PUBLIC URBAN OR-025918
STAGE 9: PACKAGE COMPLETION
CLOSED OUT
MAINTENANCE - CORRECTIVE 2
300021305 PHILIPSTOWN PRIMARY SCHOOL
PIXLEY KA SEME PUBLIC URBAN ST086/2018
STAGE 9: PACKAGE COMPLETION
CLOSED OUT
MAINTENANCE - CORRECTIVE 2
Annual Report for 2018/19 Financial Year Vote 04: Department of Education
Province of the Northern Cape
67
EMIS NUMBER
PROJECT NAME
DISTRICT MUNICIPALITY
SECTOR
URBAN OR RURAL
PROJECT NO. IDMS PROJECT STATUS
PROJECT STATUS
SUB-PROGRAMME
QU
AR
TER
C
OM
PLET
ED
300101813 REITLAMILE INTERMEDIATE SCHOOL
FRANCES BAARD PUBLIC URBAN OR-026015
STAGE 9: PACKAGE COMPLETION
CLOSED OUT
MAINTENANCE - CORRECTIVE 2
300014208 RIETRIVIER PRIMARY SCHOOL
FRANCES BAARD PUBLIC URBAN OR-025338
STAGE 9: PACKAGE COMPLETION
CLOSED OUT
MAINTENANCE - CORRECTIVE 2
300031305
SACRED HEART (RK) PRIMÊRE SKOOL
NAMAKWA PUBLIC URBAN ST094/2018
STAGE 9: PACKAGE COMPLETION
CLOSED OUT
MAINTENANCE - CORRECTIVE 2
300014403
WILLIAM PESCOD SECONDARY SCHOOL
FRANCES BAARD PUBLIC URBAN ST119/2018
STAGE 9: PACKAGE COMPLETION
CLOSED OUT
MAINTENANCE - CORRECTIVE 2
300045218 WRENCHVILLE PRIMÊRE SKOOL
JOHN TAOLO GAETSEWE PUBLIC URBAN OR-026710
STAGE 9: PACKAGE COMPLETION
CLOSED OUT
MAINTENANCE - CORRECTIVE 2
300100042 BADIHILE PRIMARY SCHOOL
JOHN TAOLO GAETSEWE PUBLIC RURAL OR-026505
STAGE 9: PACKAGE COMPLETION
CLOSED OUT
MAINTENANCE - CORRECTIVE 3
300021202
EMTHANJENI PUBLIC PRIMARY SCHOOL
PIXLEY KA SEME PUBLIC URBAN OR-027656 STAGE 8:
HANDOVER
PRACTICAL COMPLETION (100%)
MAINTENANCE - CORRECTIVE 3
300021203 HAYES PRIMÊRE SKOOL
PIXLEY KA SEME PUBLIC RURAL OR-027651 STAGE 8:
HANDOVER
PRACTICAL COMPLETION (100%)
MAINTENANCE - CORRECTIVE 3
300043305 LEERKRANS INTERMEDIATE SCHOOL
ZF MGCAWU PUBLIC URBAN OR-027382 STAGE 8: HANDOVER
PRACTICAL COMPLETION (100%)
MAINTENANCE - CORRECTIVE 3
300021405 VERITAS SEKONDÊRE SKOOL
PIXLEY KA SEME PUBLIC URBAN OR-027079
STAGE 9: PACKAGE COMPLETION
CLOSED OUT
MAINTENANCE - CORRECTIVE 3
300012302 DL JANSEN PRIMÊRE SKOOL
FRANCES BAARD PUBLIC URBAN OR-027426
STAGE 9: PACKAGE COMPLETION
CLOSED OUT
MAINTENANCE - CORRECTIVE 4
300010706
ELIZABETH CONRADIE SPECIAL SCHOOL
FRANCES BAARD
SPECIAL SCHOOL
URBAN ST114/2018
STAGE 9: PACKAGE COMPLETION
CLOSED OUT
MAINTENANCE - PREVENTATIVE
4
300041101 FANIE MALAN LAERSKOOL ZF MGCAWU PUBLIC URBAN ST158/2018
STAGE 9: PACKAGE COMPLETION
CLOSED OUT
MAINTENANCE - CORRECTIVE 4
300043302 GROOTDRINK INTERMEDIATE SCHOOL
ZF MGCAWU PUBLIC URBAN PWU49/2018 STAGE 8: HANDOVER
PRACTICAL COMPLETION (100%)
MAINTENANCE - CORRECTIVE 4
300043402 HOËRSKOOL GROBLERSHOOP
ZF MGCAWU PUBLIC URBAN PWU91/2018 STAGE 8: HANDOVER
PRACTICAL COMPLETION (100%)
MAINTENANCE - CORRECTIVE 4
300041205 JJ ADAMS INTERMEDIATE SCHOOL
ZF MGCAWU PUBLIC URBAN PWU69/2018 STAGE 8: HANDOVER
PRACTICAL COMPLETION (100%)
MAINTENANCE - PREVENTATIVE
4
300043303 KAKAMAS INTERMEDIATE SCHOOL
ZF MGCAWU PUBLIC URBAN PWU51/2018 STAGE 8: HANDOVER
PRACTICAL COMPLETION (100%)
MAINTENANCE - CORRECTIVE 4
300100691 KGONO PRIMARY SCHOOL
FRANCES BAARD PUBLIC URBAN OR-027437
STAGE 9: PACKAGE COMPLETION
CLOSED OUT
MAINTENANCE - CORRECTIVE 4
300101991 SHALANA PRIMARY SCHOOL
JOHN TAOLO GAETSEWE PUBLIC RURAL OR-026954 STAGE 8:
HANDOVER
PRACTICAL COMPLETION (100%)
MAINTENANCE - CORRECTIVE 4

67
Annual Report for 2018/19 Financial Year Vote 04: Department of Education
Province of the Northern Cape
66
EMIS NUMBER
PROJECT NAME
DISTRICT MUNICIPALITY
SECTOR
URBAN OR RURAL
PROJECT NO. IDMS PROJECT STATUS
PROJECT STATUS
SUB-PROGRAMME
QU
AR
TER
C
OM
PLET
ED
300023401
ENOCH MTHETHO SECONDARY SCHOOL
PIXLEY KA SEME PUBLIC URBAN ST084/2018
STAGE 9: PACKAGE COMPLETION
CLOSED OUT
MAINTENANCE - CORRECTIVE 1
300100402 GAMASEGO PRIMARY SCHOOL
JOHN TAOLO GAETSEWE PUBLIC RURAL ST082/2018
STAGE 9: PACKAGE COMPLETION
FINAL COMPLETION
MAINTENANCE - CORRECTIVE 1
300033401 HANTAM SEKONDÊRE SKOOL
NAMAKWA PUBLIC URBAN ST017/2017
STAGE 9: PACKAGE COMPLETION
CLOSED OUT
MAINTENANCE - PREVENTATIVE
1
300100561 ITEKELENG PRIMARY SCHOOL
JOHN TAOLO GAETSEWE PUBLIC RURAL OR-026687
STAGE 9: PACKAGE COMPLETION
CLOSED OUT
MAINTENANCE - CORRECTIVE 1
300100778 KUDUMANE PRIMARY SCHOOL
JOHN TAOLO GAETSEWE PUBLIC RURAL DOE03NCAR02
6 STAGE 8: HANDOVER
PRACTICAL COMPLETION (100%)
MAINTENANCE - PREVENTATIVE
1
300015207
MASIZA SENIOR PRIMARY SCHOOL
FRANCES BAARD PUBLIC URBAN ST063/2017
STAGE 9: PACKAGE COMPLETION
CLOSED OUT
MAINTENANCE - CORRECTIVE 1
300101922 SEGWANENG PRIMARY SCHOOL
JOHN TAOLO GAETSEWE PUBLIC RURAL OR-025923
STAGE 9: PACKAGE COMPLETION
CLOSED OUT
MAINTENANCE - CORRECTIVE 1
300024202 CAREL VAN ZYL PRIMARY SCHOOL
PIXLEY KA SEME PUBLIC URBAN OR-027073
STAGE 9: PACKAGE COMPLETION
CLOSED OUT
MAINTENANCE - CORRECTIVE 2
300044203 DEBEN PRIMÊRE SKOOL
JOHN TAOLO GAETSEWE PUBLIC RURAL JTGDT/2016/00
5
STAGE 9: PACKAGE COMPLETION
FINAL COMPLETION
MAINTENANCE - PREVENTATIVE
2
300100363 ETHEL PRIMARY SCHOOL
JOHN TAOLO GAETSEWE PUBLIC RURAL ST081/2018
STAGE 9: PACKAGE COMPLETION
FINAL COMPLETION
MAINTENANCE - CORRECTIVE 2
300011401 FLOORS HIGH SCHOOL
FRANCES BAARD PUBLIC URBAN ST058/2017
STAGE 9: PACKAGE COMPLETION
CLOSED OUT
MAINTENANCE - PREVENTATIVE
2
300022305 HOËRSKOOL STEYNVILLE
PIXLEY KA SEME PUBLIC URBAN ST085/2018
STAGE 9: PACKAGE COMPLETION
CLOSED OUT
MAINTENANCE - CORRECTIVE 2
300100690 KGOMOTSO SECONDARY SCHOOL
FRANCES BAARD PUBLIC URBAN OR-026014
STAGE 9: PACKAGE COMPLETION
FINAL COMPLETION
MAINTENANCE - PREVENTATIVE
2
300100774 KS SHUPING SECONDARY SCHOOL
JOHN TAOLO GAETSEWE PUBLIC RURAL OR-026830
STAGE 9: PACKAGE COMPLETION
CLOSED OUT
MAINTENANCE - CORRECTIVE 2
300100821 LEBANG SECONDARY SCHOOL
JOHN TAOLO GAETSEWE PUBLIC RURAL ST088/2018 STAGE 8:
HANDOVER
PRACTICAL COMPLETION (100%)
MAINTENANCE - CORRECTIVE 2
300100890 LETLHAKAJANENG PRIMARY SCHOOL
JOHN TAOLO GAETSEWE PUBLIC RURAL ST079/2018
STAGE 9: PACKAGE COMPLETION
CLOSED OUT
MAINTENANCE - PREVENTATIVE
2
300101239 MMITSATSHIPI PRIMARY SCHOOL
JOHN TAOLO GAETSEWE PUBLIC RURAL OR-026078
STAGE 9: PACKAGE COMPLETION
CLOSED OUT
MAINTENANCE - CORRECTIVE 2
300021403 MONWABISI HIGH SCHOOL
PIXLEY KA SEME PUBLIC URBAN ST087/2018
STAGE 9: PACKAGE COMPLETION
CLOSED OUT
MAINTENANCE - CORRECTIVE 2
300023303 NOUPOORT GEKOMBINEERDE SKOOL
PIXLEY KA SEME PUBLIC URBAN ST108/2018 STAGE 8:
HANDOVER
PRACTICAL COMPLETION (100%)
MAINTENANCE - PREVENTATIVE
2
300023402 PHAKAMISANI HIGH SCHOOL
PIXLEY KA SEME PUBLIC URBAN ST056/2017
STAGE 9: PACKAGE COMPLETION
FINAL COMPLETION
MAINTENANCE - CORRECTIVE 2
300101617 PHAKANE SECONDARY SCHOOL
JOHN TAOLO GAETSEWE PUBLIC URBAN OR-025918
STAGE 9: PACKAGE COMPLETION
CLOSED OUT
MAINTENANCE - CORRECTIVE 2
300021305 PHILIPSTOWN PRIMARY SCHOOL
PIXLEY KA SEME PUBLIC URBAN ST086/2018
STAGE 9: PACKAGE COMPLETION
CLOSED OUT
MAINTENANCE - CORRECTIVE 2
Annual Report for 2018/19 Financial Year Vote 04: Department of Education
Province of the Northern Cape
67
EMIS NUMBER
PROJECT NAME
DISTRICT MUNICIPALITY
SECTOR
URBAN OR RURAL
PROJECT NO. IDMS PROJECT STATUS
PROJECT STATUS
SUB-PROGRAMME
QU
AR
TER
C
OM
PLET
ED
300101813 REITLAMILE INTERMEDIATE SCHOOL
FRANCES BAARD PUBLIC URBAN OR-026015
STAGE 9: PACKAGE COMPLETION
CLOSED OUT
MAINTENANCE - CORRECTIVE 2
300014208 RIETRIVIER PRIMARY SCHOOL
FRANCES BAARD PUBLIC URBAN OR-025338
STAGE 9: PACKAGE COMPLETION
CLOSED OUT
MAINTENANCE - CORRECTIVE 2
300031305
SACRED HEART (RK) PRIMÊRE SKOOL
NAMAKWA PUBLIC URBAN ST094/2018
STAGE 9: PACKAGE COMPLETION
CLOSED OUT
MAINTENANCE - CORRECTIVE 2
300014403
WILLIAM PESCOD SECONDARY SCHOOL
FRANCES BAARD PUBLIC URBAN ST119/2018
STAGE 9: PACKAGE COMPLETION
CLOSED OUT
MAINTENANCE - CORRECTIVE 2
300045218 WRENCHVILLE PRIMÊRE SKOOL
JOHN TAOLO GAETSEWE PUBLIC URBAN OR-026710
STAGE 9: PACKAGE COMPLETION
CLOSED OUT
MAINTENANCE - CORRECTIVE 2
300100042 BADIHILE PRIMARY SCHOOL
JOHN TAOLO GAETSEWE PUBLIC RURAL OR-026505
STAGE 9: PACKAGE COMPLETION
CLOSED OUT
MAINTENANCE - CORRECTIVE 3
300021202
EMTHANJENI PUBLIC PRIMARY SCHOOL
PIXLEY KA SEME PUBLIC URBAN OR-027656 STAGE 8:
HANDOVER
PRACTICAL COMPLETION (100%)
MAINTENANCE - CORRECTIVE 3
300021203 HAYES PRIMÊRE SKOOL
PIXLEY KA SEME PUBLIC RURAL OR-027651 STAGE 8:
HANDOVER
PRACTICAL COMPLETION (100%)
MAINTENANCE - CORRECTIVE 3
300043305 LEERKRANS INTERMEDIATE SCHOOL
ZF MGCAWU PUBLIC URBAN OR-027382 STAGE 8: HANDOVER
PRACTICAL COMPLETION (100%)
MAINTENANCE - CORRECTIVE 3
300021405 VERITAS SEKONDÊRE SKOOL
PIXLEY KA SEME PUBLIC URBAN OR-027079
STAGE 9: PACKAGE COMPLETION
CLOSED OUT
MAINTENANCE - CORRECTIVE 3
300012302 DL JANSEN PRIMÊRE SKOOL
FRANCES BAARD PUBLIC URBAN OR-027426
STAGE 9: PACKAGE COMPLETION
CLOSED OUT
MAINTENANCE - CORRECTIVE 4
300010706
ELIZABETH CONRADIE SPECIAL SCHOOL
FRANCES BAARD
SPECIAL SCHOOL
URBAN ST114/2018
STAGE 9: PACKAGE COMPLETION
CLOSED OUT
MAINTENANCE - PREVENTATIVE
4
300041101 FANIE MALAN LAERSKOOL ZF MGCAWU PUBLIC URBAN ST158/2018
STAGE 9: PACKAGE COMPLETION
CLOSED OUT
MAINTENANCE - CORRECTIVE 4
300043302 GROOTDRINK INTERMEDIATE SCHOOL
ZF MGCAWU PUBLIC URBAN PWU49/2018 STAGE 8: HANDOVER
PRACTICAL COMPLETION (100%)
MAINTENANCE - CORRECTIVE 4
300043402 HOËRSKOOL GROBLERSHOOP
ZF MGCAWU PUBLIC URBAN PWU91/2018 STAGE 8: HANDOVER
PRACTICAL COMPLETION (100%)
MAINTENANCE - CORRECTIVE 4
300041205 JJ ADAMS INTERMEDIATE SCHOOL
ZF MGCAWU PUBLIC URBAN PWU69/2018 STAGE 8: HANDOVER
PRACTICAL COMPLETION (100%)
MAINTENANCE - PREVENTATIVE
4
300043303 KAKAMAS INTERMEDIATE SCHOOL
ZF MGCAWU PUBLIC URBAN PWU51/2018 STAGE 8: HANDOVER
PRACTICAL COMPLETION (100%)
MAINTENANCE - CORRECTIVE 4
300100691 KGONO PRIMARY SCHOOL
FRANCES BAARD PUBLIC URBAN OR-027437
STAGE 9: PACKAGE COMPLETION
CLOSED OUT
MAINTENANCE - CORRECTIVE 4
300101991 SHALANA PRIMARY SCHOOL
JOHN TAOLO GAETSEWE PUBLIC RURAL OR-026954 STAGE 8:
HANDOVER
PRACTICAL COMPLETION (100%)
MAINTENANCE - CORRECTIVE 4

68
Annual Report for 2018/19 Financial Year Vote 04: Department of Education
Province of the Northern Cape
68
Number of Public Ordinary Schools Provided With Water Supply The Department has commenced with the implementation of the 7-year-implementation plan that initiates the Upgrade of Water Supply Programme. 7 schools received upgrades where the facilities did not meet the minimum suitability for water supply within the 2018/19 financial year.
EMIS NUMBER PROJECT NAME DISTRICT
MUNICIPALITY SECTOR URBAN OR RURAL
PROJECT NO. IDMS PROJECT STATUS
PROJECT STATUS
SUB-PROGRAMME
QU
AR
TER
C
OM
PLET
ED
300031401 CONCORDIA SEKONDÊRE SKOOL
NAMAKWA PUBLIC URBAN ST100/2018 STAGE 8: HANDOVER
PRACTICAL COMPLETION (100%)
WATER 1
300024303 HOËRSKOOL RICHMOND
PIXLEY KA SEME PUBLIC URBAN OR-026039
STAGE 9: PACKAGE COMPLETION
CLOSED OUT WATER 1
300100778 KUDUMANE PRIMARY SCHOOL
JOHN TAOLO GAETSEWE PUBLIC RURAL DOE03NCAR026 STAGE 8:
HANDOVER
PRACTICAL COMPLETION (100%)
WATER 1
300044303 MAIKAELELO PRIMARY SCHOOL
JOHN TAOLO GAETSEWE PUBLIC RURAL OR-021510
STAGE 9: PACKAGE COMPLETION
CLOSED OUT WATER 1
300100821 LEBANG SECONDARY SCHOOL
JOHN TAOLO GAETSEWE PUBLIC RURAL ST088/2018 STAGE 8:
HANDOVER
PRACTICAL COMPLETION (100%)
WATER 2
300011211 SALT LAKE PRIMARY SCHOOL
PIXLEY KA SEME PUBLIC RURAL ST083/2018
STAGE 9: PACKAGE COMPLETION
CLOSED OUT WATER 2
300042223 CORNELIUS JANSEN PRIMÊRE SKOOL
ZF MGCAWU PUBLIC RURAL OR-027072 STAGE 9: PACKAGE COMPLETION
CLOSED OUT WATER 3
300104019 TSOE PRIMARY SCHOOL
JOHN TAOLO GAETSEWE PUBLIC RURAL OR-026720
STAGE 9: PACKAGE COMPLETION
CLOSED OUT WATER 3
Number of Public Ordinary Schools Provided With Electricity Supply The Department has commenced with the implementation of the 7-year-implementation plan that initiates the Upgrade of Electricity Programme in order to have sufficient electricity at schools. 5 schools received upgrades where the facilities did not meet the minimum suitability for electricity supply within the 2018/19 financial year.
EMIS NUMBER
PROJECT NAME
DISTRICT MUNICIPALITY SECTOR
URBAN OR RURAL
PROJECT NO.
IDMS PROJECT STATUS
PROJECT STATUS
SUB-PROGRAMME
QU
AR
TER
C
OM
PLET
ED
300100690 KGOMOTSO SECONDARY SCHOOL
FRANCES BAARD PUBLIC URBAN OR-
026014
STAGE 9: PACKAGE COMPLETION
FINAL COMPLETION ELECTRICITY 2
300101813 REITLAMILE INTERMEDIATE SCHOOL
FRANCES BAARD PUBLIC URBAN OR-
026015
STAGE 9: PACKAGE COMPLETION
CLOSED OUT ELECTRICITY 2
300014208 RIETRIVIER PRIMARY SCHOOL
FRANCES BAARD PUBLIC URBAN OR-
025338
STAGE 9: PACKAGE COMPLETION
CLOSED OUT ELECTRICITY 2
300012208 VOORSPOED PRIMARY SCHOOL
FRANCES BAARD PUBLIC RURAL OR-
026008
STAGE 9: PACKAGE COMPLETION
CLOSED OUT ELECTRICITY 2
300100691 KGONO PRIMARY SCHOOL
FRANCES BAARD PUBLIC URBAN OR-
027437
STAGE 9: PACKAGE COMPLETION
CLOSED OUT ELECTRICITY 4
Number of Public Ordinary Schools Supplied With Sanitation Facilities The Ablution and Sanitation programme is applied where facilities do not meet the minimum suitability for Sanitation. Plain pit and bucket latrines are not allowed at schools according to the Norms and Standards for Public School Infrastructure. 25 schools received upgrades where the existing facilities did not meet the minimum suitability for sanitation supply within the 2018/19 financial year.
EMIS NUMBER PROJECT NAME DISTRICT
MUNICIPALITY SECTOR URBAN OR RURAL
PROJECT NO.
IDMS PROJECT STATUS
PROJECT STATUS
SUB-PROGRAMME
QU
AR
TER
C
OM
PLET
ED
300041204 GROOT MIER (VGK) PRIMÊRE SKOOL
ZF MGCAWU PUBLIC URBAN SIYANDA200418-3 (3)
STAGE 9: PACKAGE COMPLETION
CLOSED OUT SANITATION 1
300042403 HOERSKOOL SAUL DAMON ZF MGCAWU PUBLIC URBAN DRPW019/20
16 STAGE 9: PACKAGE
FINAL COMPLETION
ABLUTION BLOCK 1
Annual Report for 2018/19 Financial Year Vote 04: Department of Education
Province of the Northern Cape
69
EMIS NUMBER PROJECT NAME DISTRICT
MUNICIPALITY SECTOR URBAN OR RURAL
PROJECT NO.
IDMS PROJECT STATUS
PROJECT STATUS
SUB-PROGRAMME
QU
AR
TER
C
OM
PLET
ED
COMPLETION
300032202 KHEIS MET PRIMÊRE SKOOL NAMAKWA PUBLIC URBAN NAMAKWA2
00418-4 (2)
STAGE 9: PACKAGE COMPLETION
CLOSED OUT SANITATION 1
300041207 KLEIN MIER (VGK) PRIMÊRE SKOOL ZF MGCAWU PUBLIC URBAN SIYANDA200
418-3 (2)
STAGE 9: PACKAGE COMPLETION
CLOSED OUT SANITATION 1
300032203 KLIPFONTEIN MET PRIMÊRE SKOOL
NAMAKWA PUBLIC RURAL NAMAKWA200418-4 (4)
STAGE 9: PACKAGE COMPLETION
CLOSED OUT SANITATION 1
300032211 LEPELSFONTEIN RK PRIMÊRE SKOOL
NAMAKWA PUBLIC URBAN NAMAKWA200418-4 (1)
STAGE 9: PACKAGE COMPLETION
CLOSED OUT SANITATION 1
300034209 PAULSHOEK MET PRIMÊRE SKOOL NAMAKWA PUBLIC URBAN NAMAKWA2
00418-4 (6)
STAGE 9: PACKAGE COMPLETION
CLOSED OUT SANITATION 1
300031210 ROOIWAL (VGK) PRIMÊRE SKOOL NAMAKWA PUBLIC RURAL NAMAKWA2
00418-4 (8)
STAGE 9: PACKAGE COMPLETION
CLOSED OUT SANITATION 1
300032207 SOEBATSFONTEIN NGK PRIMÊRE SKOOL
NAMAKWA PUBLIC URBAN NAMAKWA200418-4 (7)
STAGE 9: PACKAGE COMPLETION
CLOSED OUT SANITATION 1
300032208 SPOEGRIVIER MET PRIMÊRE SKOOL
NAMAKWA PUBLIC URBAN NAMAKWA200418-4 (3)
STAGE 9: PACKAGE COMPLETION
CLOSED OUT SANITATION 1
300102209 TSELANCHO INTERMEDIATE SCHOOL
JOHN TAOLO GAETSEWE PUBLIC RURAL SIYANDA200
418-3 (1)
STAGE 9: PACKAGE COMPLETION
CLOSED OUT SANITATION 1
300032210 TWEERIVIER METODISTE PRIMÊRE SKOOL
NAMAKWA PUBLIC URBAN NAMAKWA200418-4 (5)
STAGE 9: PACKAGE COMPLETION
CLOSED OUT SANITATION 1
300033206 HANTAM PRIMÊRE SKOOL NAMAKWA PUBLIC URBAN DRPW024/20
16
STAGE 9: PACKAGE COMPLETION
FINAL COMPLETION
ABLUTION BLOCK 2
300100532 IKEMELENG PRIMARY SCHOOL
JOHN TAOLO GAETSEWE PUBLIC RURAL OR-027069
STAGE 9: PACKAGE COMPLETION
CLOSED OUT SANITATION 2
300024305 IKHAYA PRIMARY SCHOOL
PIXLEY KA SEME PUBLIC URBAN OR-026719
STAGE 9: PACKAGE COMPLETION
CLOSED OUT SANITATION 2
300100316 DITSHIPENG INTERMEDIATE SCHOOL
JOHN TAOLO GAETSEWE PUBLIC RURAL JTGDT/2018/
028
STAGE 9: PACKAGE COMPLETION
FINAL COMPLETION
SANITATION 3
300100629 KAREEPAN PRIMARY SCHOOL
JOHN TAOLO GAETSEWE PUBLIC RURAL JTGDT/2018/
029
STAGE 9: PACKAGE COMPLETION
FINAL COMPLETION
SANITATION 3
300100999 MAHIKANENG PRIMARY SCHOOL
JOHN TAOLO GAETSEWE PUBLIC RURAL JTGDT/2018/
030
STAGE 9: PACKAGE COMPLETION
FINAL COMPLETION
SANITATION 3
300101125 MASANKONG PRIMARY SCHOOL
JOHN TAOLO GAETSEWE PUBLIC RURAL JTGDT/2018/
032
STAGE 9: PACKAGE COMPLETION
FINAL COMPLETION
SANITATION 3
300104002 MATHANTHANYANENG PRIMARY SCHOOL
JOHN TAOLO GAETSEWE PUBLIC RURAL JTGDT/2018/
033
STAGE 9: PACKAGE COMPLETION
FINAL COMPLETION
SANITATION 3
300033309 ROGGEVELD INTERMEDIATE SCHOOL
NAMAKWA PUBLIC URBAN DRPW025/2016
STAGE 8: HANDOVER
PRACTICAL COMPLETION (100%)
ABLUTION BLOCK 3
300031306 ST CYPRIANS INTERMEDIATE SCHOOL
NAMAKWA PUBLIC URBAN DRPW026/2016
STAGE 8: HANDOVER
PRACTICAL COMPLETION (100%)
ABLUTION BLOCK 3
300102314 VLAKFONTEIN INTERMEDIATE SCHOOL
JOHN TAOLO GAETSEWE PUBLIC URBAN JTGDT/2018/
037
STAGE 9: PACKAGE COMPLETION
FINAL COMPLETION
SANITATION 3
300101037 MAKOLOKOMENG PRIMARY SCHOOL
JOHN TAOLO GAETSEWE PUBLIC RURAL JTGDT/2018/
031 STAGE 8: HANDOVER
PRACTICAL COMPLETION (100%)
SANITATION 4

69
Annual Report for 2018/19 Financial Year Vote 04: Department of Education
Province of the Northern Cape
68
Number of Public Ordinary Schools Provided With Water Supply The Department has commenced with the implementation of the 7-year-implementation plan that initiates the Upgrade of Water Supply Programme. 7 schools received upgrades where the facilities did not meet the minimum suitability for water supply within the 2018/19 financial year.
EMIS NUMBER PROJECT NAME DISTRICT
MUNICIPALITY SECTOR URBAN OR RURAL
PROJECT NO. IDMS PROJECT STATUS
PROJECT STATUS
SUB-PROGRAMME
QU
AR
TER
C
OM
PLET
ED
300031401 CONCORDIA SEKONDÊRE SKOOL
NAMAKWA PUBLIC URBAN ST100/2018 STAGE 8: HANDOVER
PRACTICAL COMPLETION (100%)
WATER 1
300024303 HOËRSKOOL RICHMOND
PIXLEY KA SEME PUBLIC URBAN OR-026039
STAGE 9: PACKAGE COMPLETION
CLOSED OUT WATER 1
300100778 KUDUMANE PRIMARY SCHOOL
JOHN TAOLO GAETSEWE PUBLIC RURAL DOE03NCAR026 STAGE 8:
HANDOVER
PRACTICAL COMPLETION (100%)
WATER 1
300044303 MAIKAELELO PRIMARY SCHOOL
JOHN TAOLO GAETSEWE PUBLIC RURAL OR-021510
STAGE 9: PACKAGE COMPLETION
CLOSED OUT WATER 1
300100821 LEBANG SECONDARY SCHOOL
JOHN TAOLO GAETSEWE PUBLIC RURAL ST088/2018 STAGE 8:
HANDOVER
PRACTICAL COMPLETION (100%)
WATER 2
300011211 SALT LAKE PRIMARY SCHOOL
PIXLEY KA SEME PUBLIC RURAL ST083/2018
STAGE 9: PACKAGE COMPLETION
CLOSED OUT WATER 2
300042223 CORNELIUS JANSEN PRIMÊRE SKOOL
ZF MGCAWU PUBLIC RURAL OR-027072 STAGE 9: PACKAGE COMPLETION
CLOSED OUT WATER 3
300104019 TSOE PRIMARY SCHOOL
JOHN TAOLO GAETSEWE PUBLIC RURAL OR-026720
STAGE 9: PACKAGE COMPLETION
CLOSED OUT WATER 3
Number of Public Ordinary Schools Provided With Electricity Supply The Department has commenced with the implementation of the 7-year-implementation plan that initiates the Upgrade of Electricity Programme in order to have sufficient electricity at schools. 5 schools received upgrades where the facilities did not meet the minimum suitability for electricity supply within the 2018/19 financial year.
EMIS NUMBER
PROJECT NAME
DISTRICT MUNICIPALITY SECTOR
URBAN OR RURAL
PROJECT NO.
IDMS PROJECT STATUS
PROJECT STATUS
SUB-PROGRAMME
QU
AR
TER
C
OM
PLET
ED
300100690 KGOMOTSO SECONDARY SCHOOL
FRANCES BAARD PUBLIC URBAN OR-
026014
STAGE 9: PACKAGE COMPLETION
FINAL COMPLETION ELECTRICITY 2
300101813 REITLAMILE INTERMEDIATE SCHOOL
FRANCES BAARD PUBLIC URBAN OR-
026015
STAGE 9: PACKAGE COMPLETION
CLOSED OUT ELECTRICITY 2
300014208 RIETRIVIER PRIMARY SCHOOL
FRANCES BAARD PUBLIC URBAN OR-
025338
STAGE 9: PACKAGE COMPLETION
CLOSED OUT ELECTRICITY 2
300012208 VOORSPOED PRIMARY SCHOOL
FRANCES BAARD PUBLIC RURAL OR-
026008
STAGE 9: PACKAGE COMPLETION
CLOSED OUT ELECTRICITY 2
300100691 KGONO PRIMARY SCHOOL
FRANCES BAARD PUBLIC URBAN OR-
027437
STAGE 9: PACKAGE COMPLETION
CLOSED OUT ELECTRICITY 4
Number of Public Ordinary Schools Supplied With Sanitation Facilities The Ablution and Sanitation programme is applied where facilities do not meet the minimum suitability for Sanitation. Plain pit and bucket latrines are not allowed at schools according to the Norms and Standards for Public School Infrastructure. 25 schools received upgrades where the existing facilities did not meet the minimum suitability for sanitation supply within the 2018/19 financial year.
EMIS NUMBER PROJECT NAME DISTRICT
MUNICIPALITY SECTOR URBAN OR RURAL
PROJECT NO.
IDMS PROJECT STATUS
PROJECT STATUS
SUB-PROGRAMME
QU
AR
TER
C
OM
PLET
ED
300041204 GROOT MIER (VGK) PRIMÊRE SKOOL
ZF MGCAWU PUBLIC URBAN SIYANDA200418-3 (3)
STAGE 9: PACKAGE COMPLETION
CLOSED OUT SANITATION 1
300042403 HOERSKOOL SAUL DAMON ZF MGCAWU PUBLIC URBAN DRPW019/20
16 STAGE 9: PACKAGE
FINAL COMPLETION
ABLUTION BLOCK 1
Annual Report for 2018/19 Financial Year Vote 04: Department of Education
Province of the Northern Cape
69
EMIS NUMBER PROJECT NAME DISTRICT
MUNICIPALITY SECTOR URBAN OR RURAL
PROJECT NO.
IDMS PROJECT STATUS
PROJECT STATUS
SUB-PROGRAMME
QU
AR
TER
C
OM
PLET
ED
COMPLETION
300032202 KHEIS MET PRIMÊRE SKOOL NAMAKWA PUBLIC URBAN NAMAKWA2
00418-4 (2)
STAGE 9: PACKAGE COMPLETION
CLOSED OUT SANITATION 1
300041207 KLEIN MIER (VGK) PRIMÊRE SKOOL ZF MGCAWU PUBLIC URBAN SIYANDA200
418-3 (2)
STAGE 9: PACKAGE COMPLETION
CLOSED OUT SANITATION 1
300032203 KLIPFONTEIN MET PRIMÊRE SKOOL
NAMAKWA PUBLIC RURAL NAMAKWA200418-4 (4)
STAGE 9: PACKAGE COMPLETION
CLOSED OUT SANITATION 1
300032211 LEPELSFONTEIN RK PRIMÊRE SKOOL
NAMAKWA PUBLIC URBAN NAMAKWA200418-4 (1)
STAGE 9: PACKAGE COMPLETION
CLOSED OUT SANITATION 1
300034209 PAULSHOEK MET PRIMÊRE SKOOL NAMAKWA PUBLIC URBAN NAMAKWA2
00418-4 (6)
STAGE 9: PACKAGE COMPLETION
CLOSED OUT SANITATION 1
300031210 ROOIWAL (VGK) PRIMÊRE SKOOL NAMAKWA PUBLIC RURAL NAMAKWA2
00418-4 (8)
STAGE 9: PACKAGE COMPLETION
CLOSED OUT SANITATION 1
300032207 SOEBATSFONTEIN NGK PRIMÊRE SKOOL
NAMAKWA PUBLIC URBAN NAMAKWA200418-4 (7)
STAGE 9: PACKAGE COMPLETION
CLOSED OUT SANITATION 1
300032208 SPOEGRIVIER MET PRIMÊRE SKOOL
NAMAKWA PUBLIC URBAN NAMAKWA200418-4 (3)
STAGE 9: PACKAGE COMPLETION
CLOSED OUT SANITATION 1
300102209 TSELANCHO INTERMEDIATE SCHOOL
JOHN TAOLO GAETSEWE PUBLIC RURAL SIYANDA200
418-3 (1)
STAGE 9: PACKAGE COMPLETION
CLOSED OUT SANITATION 1
300032210 TWEERIVIER METODISTE PRIMÊRE SKOOL
NAMAKWA PUBLIC URBAN NAMAKWA200418-4 (5)
STAGE 9: PACKAGE COMPLETION
CLOSED OUT SANITATION 1
300033206 HANTAM PRIMÊRE SKOOL NAMAKWA PUBLIC URBAN DRPW024/20
16
STAGE 9: PACKAGE COMPLETION
FINAL COMPLETION
ABLUTION BLOCK 2
300100532 IKEMELENG PRIMARY SCHOOL
JOHN TAOLO GAETSEWE PUBLIC RURAL OR-027069
STAGE 9: PACKAGE COMPLETION
CLOSED OUT SANITATION 2
300024305 IKHAYA PRIMARY SCHOOL
PIXLEY KA SEME PUBLIC URBAN OR-026719
STAGE 9: PACKAGE COMPLETION
CLOSED OUT SANITATION 2
300100316 DITSHIPENG INTERMEDIATE SCHOOL
JOHN TAOLO GAETSEWE PUBLIC RURAL JTGDT/2018/
028
STAGE 9: PACKAGE COMPLETION
FINAL COMPLETION
SANITATION 3
300100629 KAREEPAN PRIMARY SCHOOL
JOHN TAOLO GAETSEWE PUBLIC RURAL JTGDT/2018/
029
STAGE 9: PACKAGE COMPLETION
FINAL COMPLETION
SANITATION 3
300100999 MAHIKANENG PRIMARY SCHOOL
JOHN TAOLO GAETSEWE PUBLIC RURAL JTGDT/2018/
030
STAGE 9: PACKAGE COMPLETION
FINAL COMPLETION
SANITATION 3
300101125 MASANKONG PRIMARY SCHOOL
JOHN TAOLO GAETSEWE PUBLIC RURAL JTGDT/2018/
032
STAGE 9: PACKAGE COMPLETION
FINAL COMPLETION
SANITATION 3
300104002 MATHANTHANYANENG PRIMARY SCHOOL
JOHN TAOLO GAETSEWE PUBLIC RURAL JTGDT/2018/
033
STAGE 9: PACKAGE COMPLETION
FINAL COMPLETION
SANITATION 3
300033309 ROGGEVELD INTERMEDIATE SCHOOL
NAMAKWA PUBLIC URBAN DRPW025/2016
STAGE 8: HANDOVER
PRACTICAL COMPLETION (100%)
ABLUTION BLOCK 3
300031306 ST CYPRIANS INTERMEDIATE SCHOOL
NAMAKWA PUBLIC URBAN DRPW026/2016
STAGE 8: HANDOVER
PRACTICAL COMPLETION (100%)
ABLUTION BLOCK 3
300102314 VLAKFONTEIN INTERMEDIATE SCHOOL
JOHN TAOLO GAETSEWE PUBLIC URBAN JTGDT/2018/
037
STAGE 9: PACKAGE COMPLETION
FINAL COMPLETION
SANITATION 3
300101037 MAKOLOKOMENG PRIMARY SCHOOL
JOHN TAOLO GAETSEWE PUBLIC RURAL JTGDT/2018/
031 STAGE 8: HANDOVER
PRACTICAL COMPLETION (100%)
SANITATION 4

70
Annual Report for 2018/19 Financial Year Vote 04: Department of Education
Province of the Northern Cape
70
EMIS NUMBER PROJECT NAME DISTRICT
MUNICIPALITY SECTOR URBAN OR RURAL
PROJECT NO.
IDMS PROJECT STATUS
PROJECT STATUS
SUB-PROGRAMME
QU
AR
TER
C
OM
PLET
ED
300101862 RUSFONTEIN PRIMARY SCHOOL
JOHN TAOLO GAETSEWE PUBLIC RURAL JTGDT/2018/
036
STAGE 9: PACKAGE COMPLETION
FINAL COMPLETION
SANITATION 4
INFRASTRUCTURE EARLY CHILDHOOD DEVELOPMENT (ECD) Number of Grade R Classrooms Built In Public Ordinary Schools The majority of schools received double ECD centres which are counted as 2 classrooms within one school. All our ECD centres are done by either DRPW or IDT and progress is sometimes slow. We do have regular meetings with these implementing agents and are trying to resolve these issues. There are four ECD classrooms that were completed in the 2018/19 financial year.
EMIS NUMBER
PROJECT NAME
DISTRICT MUNICIPALITY
SECTOR
URBAN OR RURAL
PROJECT NO. IDMS PROJECT STATUS
PROJECT STATUS
SUB-PROGRAMME
QUARTER COMPLETED
300024209
JOHN ROSSOUW PRIMÊRE SKOOL
PIXLEY KA SEME PUBLIC URBAN DRPW011/2016 STAGE 8:
HANDOVER
PRACTICAL COMPLETION (100%)
ECD CLASSROOM 2
300034306 OKIEP LAERSKOOL
NAMAKWA PUBLIC URBAN DRPW012/2016 STAGE 8: HANDOVER
PRACTICAL COMPLETION (100%)
ECD CLASSROOM 3
Additional Information The Department furthermore completed the following projects during the 2018/19 financial year: One administration block; Two school halls have been constructed; and Ten fencing projects.
Conclusion The majority of targeted projects are still in construction and are anticipated to be completed during the 2019/20 financial year, the programme managers are however monitoring progress closely in order to support performance

71
Annual Report for 2018/19 Financial Year Vote 04: Department of Education
Province of the Northern Cape
70
EMIS NUMBER PROJECT NAME DISTRICT
MUNICIPALITY SECTOR URBAN OR RURAL
PROJECT NO.
IDMS PROJECT STATUS
PROJECT STATUS
SUB-PROGRAMME
QU
AR
TER
C
OM
PLET
ED
300101862 RUSFONTEIN PRIMARY SCHOOL
JOHN TAOLO GAETSEWE PUBLIC RURAL JTGDT/2018/
036
STAGE 9: PACKAGE COMPLETION
FINAL COMPLETION
SANITATION 4
INFRASTRUCTURE EARLY CHILDHOOD DEVELOPMENT (ECD) Number of Grade R Classrooms Built In Public Ordinary Schools The majority of schools received double ECD centres which are counted as 2 classrooms within one school. All our ECD centres are done by either DRPW or IDT and progress is sometimes slow. We do have regular meetings with these implementing agents and are trying to resolve these issues. There are four ECD classrooms that were completed in the 2018/19 financial year.
EMIS NUMBER
PROJECT NAME
DISTRICT MUNICIPALITY
SECTOR
URBAN OR RURAL
PROJECT NO. IDMS PROJECT STATUS
PROJECT STATUS
SUB-PROGRAMME
QUARTER COMPLETED
300024209
JOHN ROSSOUW PRIMÊRE SKOOL
PIXLEY KA SEME PUBLIC URBAN DRPW011/2016 STAGE 8:
HANDOVER
PRACTICAL COMPLETION (100%)
ECD CLASSROOM 2
300034306 OKIEP LAERSKOOL
NAMAKWA PUBLIC URBAN DRPW012/2016 STAGE 8: HANDOVER
PRACTICAL COMPLETION (100%)
ECD CLASSROOM 3
Additional Information The Department furthermore completed the following projects during the 2018/19 financial year: One administration block; Two school halls have been constructed; and Ten fencing projects.
Conclusion The majority of targeted projects are still in construction and are anticipated to be completed during the 2019/20 financial year, the programme managers are however monitoring progress closely in order to support performance
Annu
al R
epor
t for
201
8/19
Fin
ancia
l Yea
r Vo
te 0
4: D
epar
tmen
t of E
duca
tion
Prov
ince
of t
he N
orth
ern
Cape
- 71
-
St
rate
gic
obje
ctiv
es:
Prog
ram
me
6: A
dmin
istr
atio
n
Stra
tegi
c ob
ject
ives
A
ctua
l A
chie
vem
ent
2017
/201
8
Plan
ned
Targ
et
2018
/201
9
Act
ual
Ach
ieve
men
t 20
18/2
019
Dev
iatio
n fr
om
Plan
ned
Targ
et
for 2
018/
2019
C
omm
ent o
n de
viat
ions
To p
rovi
de re
quis
ite e
duca
tiona
l inf
rast
ruct
ure
for
all 5
61 c
omm
uniti
es in
the
Nor
ther
n C
ape.
55
6 55
8 55
7 -1
O
ne s
choo
l, W
renc
hville
Prim
ary
Scho
ol w
as
not
com
plet
ed
on
time
as
the
cont
ract
or
requ
este
d tim
e ex
tens
ion
Pe
rfor
man
ce in
dica
tors
Prog
ram
me
6: In
fras
truc
ture
Dev
elop
men
t
Perf
orm
ance
Indi
cato
r A
ctua
l A
chie
vem
ent
2017
/201
8
Plan
ned
Targ
et
2018
/201
9
Act
ual
Ach
ieve
men
t 20
18/2
019
Dev
iatio
n fr
om
Plan
ned
Targ
et
for 2
018/
2019
C
omm
ent o
n de
viat
ions
PP
M60
1:N
umbe
r of
pu
blic
or
dina
ry
scho
ols
prov
ided
with
wat
er s
uppl
y N
/A
N/A
N
/A
N/A
PP
M60
2:N
umbe
r of
pu
blic
or
dina
ry
scho
ols
prov
ided
with
ele
ctric
ity s
uppl
y N
/A
N/A
N
/A
N/A
PP
M60
3:N
umbe
r of
pu
blic
or
dina
ry
scho
ols
supp
lied
with
san
itatio
n fa
cilit
ies
N/A
N
/A
N/A
N
/A
PP
M60
4: N
umbe
r of
add
ition
al c
lass
room
s bu
ilt
in, o
r pro
vide
d fo
r, ex
istin
g pu
blic
ord
inar
y sc
hool
s (in
clud
es re
plac
emen
t sch
ools
) 62
32
3
-29
Rep
lace
men
t S
choo
l –
Kar
os P
rimar
y S
choo
l [1
4 C
lass
room
s] –
Ser
vice
s w
as o
utst
andi
ng
Bor
eset
se
Sec
onda
ry
Sch
ool
[5
Cla
ssro
oms]
–
Ext
ensi
on o
f Tim
e w
as a
ppro
ved
Wes
t End
Prim
ary
Scho
ol [1
0 C
lass
room
s] –
Not
ice
of T
erm
inat
ion
of C
ontra
ctor
due
to p
erfo
rman
ce o
f co
ntra
ctor

72
Annu
al R
epor
t for
201
8/19
Fin
ancia
l Yea
r Vo
te 0
4: D
epar
tmen
t of E
duca
tion
Prov
ince
of t
he N
orth
ern
Cape
72
Prog
ram
me
6: In
fras
truc
ture
Dev
elop
men
t
Perf
orm
ance
Indi
cato
r A
ctua
l A
chie
vem
ent
2017
/201
8
Plan
ned
Targ
et
2018
/201
9
Act
ual
Ach
ieve
men
t 20
18/2
019
Dev
iatio
n fr
om
Plan
ned
Targ
et
for 2
018/
2019
C
omm
ent o
n de
viat
ions
PP
M60
5:N
umbe
r of
add
ition
al s
peci
alis
t ro
oms
built
in
pu
blic
or
dina
ry
scho
ols
(incl
udes
re
plac
emen
t sch
ools
) 9
7 0
-7
Rep
lace
men
t S
choo
l –
Kar
os P
rimar
y S
choo
l [3
S
peci
alis
t Roo
ms]
– S
ervi
ces
was
out
stan
ding
B
ores
etse
Sec
onda
ry S
choo
l [1
Spe
cial
ist R
oom
s] –
E
xten
sion
of T
ime
was
app
rove
d G
roen
punt
Prim
êre
Sko
ol [
3 S
peci
alis
t R
oom
s] –
A
dditi
onal
Sco
pe w
as a
dded
to
the
proj
ect
and
term
inat
ion
of
QS
resu
lted
in
the
proj
ect
not
com
plet
ing
with
in th
e 20
18/1
9 fin
anci
al y
ear
PP
M60
6: N
umbe
r of n
ew s
choo
ls c
ompl
eted
and
re
ady
for
occu
patio
n (in
clud
es
repl
acem
ent
scho
ols)
3
3 0
-3
New
S
choo
l -
Wre
nchv
ille
Prim
ary
Sch
ool
the
prev
ious
con
tract
or w
as te
rmin
ated
Rep
lace
men
t Sc
hool
– K
aros
Prim
ary
Sch
ool
– S
ervi
ces
was
out
stan
ding
Rep
lace
men
t Sch
ool –
Gro
enpu
nt P
rimêr
e Sk
ool –
A
dditi
onal
Sco
pe w
as a
dded
to
the
proj
ect
and
term
inat
ion
of
QS
resu
lted
in
the
proj
ect
not
com
plet
ing
with
in th
e 20
18/1
9 fin
anci
al y
ear
PP
M60
7:
Num
ber
of
new
sc
hool
s un
der
cons
truct
ion
(incl
udes
repl
acem
ent s
choo
ls)
5 11
7
-4
Mag
ojan
eng
Prim
ary
and
Hig
h S
choo
ls
wer
e re
prio
ritis
ed
for
oute
r ye
ars
due
to
budg
et
avai
labi
lity.
Red
irile
and
Bar
kley
Roo
irand
hav
e no
t st
arte
d w
ith c
onst
ruct
ion
due
to p
lann
ing
dela
ys
PP
M60
8:N
umbe
r of
new
or
addi
tiona
l G
rade
R
clas
sroo
ms
built
(in
clud
es t
hose
in r
epla
cem
ent
scho
ols)
7
4 4
0
PP
M60
9:N
umbe
r of h
oste
ls b
uilt
1 0
0 0
P
PM
610:
Num
ber
of s
choo
ls
whe
re
sche
dule
d m
aint
enan
ce p
roje
cts
wer
e co
mpl
eted
38
39
41
2
Pro
ject
s m
oved
from
out
er y
ears
to c
urre
nt y
ear d
ue
to b
udge
t ava
ilabi
lity
Annu
al R
epor
t for
201
8/19
Fin
ancia
l Yea
r Vo
te 0
4: D
epar
tmen
t of E
duca
tion
Prov
ince
of t
he N
orth
ern
Cape
73
Pr
ogra
mm
e 6:
Infr
astr
uctu
re D
evel
opm
ent
Perf
orm
ance
Indi
cato
r A
ctua
l A
chie
vem
ent
2017
/201
8
Plan
ned
Targ
et
2018
/201
9
Act
ual
Ach
ieve
men
t 20
18/2
019
Dev
iatio
n fr
om
Plan
ned
Targ
et
for 2
018/
2019
C
omm
ent o
n de
viat
ions
6.2.
1:Th
e pe
rcen
tage
of
publ
ic o
rdin
ary
scho
ols
whe
re u
pgra
des
or a
dditi
onal
sup
ply
was
pro
vide
d in
ter
ms
of w
ater
in li
ne w
ith a
gree
d no
rms
and
stan
dard
s
1.7%
1.
4%
1.4%
0
(9
/545
) (8
/558
) (8
/557
)
6.2.
2:Th
e pe
rcen
tage
of
publ
ic o
rdin
ary
scho
ols
whe
re u
pgra
des
or a
dditi
onal
sup
ply
was
pro
vide
d in
term
s of
ele
ctric
ity a
nd in
line
with
agr
eed
norm
s an
d st
anda
rds
3.1%
5.
0%
0.9%
-4
.1%
Sev
eral
pro
ject
s im
plem
ente
d by
the
Joh
n Ta
olo
Gae
tsew
e D
evel
opm
ent
Trus
t w
ere
com
plet
ed
durin
g th
e 20
17/1
8 fin
anci
al
year
th
ough
th
e do
cum
enta
tion
(PC
) w
as n
ot r
ecei
ved
in t
ime
to
repo
rt on
(1
7/54
5)
(28/
558)
(5
/557
) 6.
2.3:
The
perc
enta
ge o
f pu
blic
ord
inar
y sc
hool
s w
here
upg
rade
s or
add
ition
al s
uppl
y w
as p
rovi
ded
in t
erm
s of
san
itatio
n in
line
with
agr
eed
norm
s an
d st
anda
rds
6.4%
1.
3%
4.5%
3.
2%
Due
to
the
natio
nal
initi
ativ
e to
era
dica
te a
ll pi
t la
trine
s at
sch
ools
, the
dep
artm
ent d
emol
ishe
d th
e ab
lutio
n fa
cilit
ies
at 8
sch
ools
(3
5/54
5)
(7/5
58)
(25/
557)

73
Annu
al R
epor
t for
201
8/19
Fin
ancia
l Yea
r Vo
te 0
4: D
epar
tmen
t of E
duca
tion
Prov
ince
of t
he N
orth
ern
Cape
73
Pr
ogra
mm
e 6:
Infr
astr
uctu
re D
evel
opm
ent
Perf
orm
ance
Indi
cato
r A
ctua
l A
chie
vem
ent
2017
/201
8
Plan
ned
Targ
et
2018
/201
9
Act
ual
Ach
ieve
men
t 20
18/2
019
Dev
iatio
n fr
om
Plan
ned
Targ
et
for 2
018/
2019
C
omm
ent o
n de
viat
ions
6.2.
1:Th
e pe
rcen
tage
of
publ
ic o
rdin
ary
scho
ols
whe
re u
pgra
des
or a
dditi
onal
sup
ply
was
pro
vide
d in
ter
ms
of w
ater
in li
ne w
ith a
gree
d no
rms
and
stan
dard
s
1.7%
1.
4%
1.4%
0
(9
/545
) (8
/558
) (8
/557
)
6.2.
2:Th
e pe
rcen
tage
of
publ
ic o
rdin
ary
scho
ols
whe
re u
pgra
des
or a
dditi
onal
sup
ply
was
pro
vide
d in
term
s of
ele
ctric
ity a
nd in
line
with
agr
eed
norm
s an
d st
anda
rds
3.1%
5.
0%
0.9%
-4
.1%
Sev
eral
pro
ject
s im
plem
ente
d by
the
Joh
n Ta
olo
Gae
tsew
e D
evel
opm
ent
Trus
t w
ere
com
plet
ed
durin
g th
e 20
17/1
8 fin
anci
al
year
th
ough
th
e do
cum
enta
tion
(PC
) w
as n
ot r
ecei
ved
in t
ime
to
repo
rt on
(1
7/54
5)
(28/
558)
(5
/557
) 6.
2.3:
The
perc
enta
ge o
f pu
blic
ord
inar
y sc
hool
s w
here
upg
rade
s or
add
ition
al s
uppl
y w
as p
rovi
ded
in t
erm
s of
san
itatio
n in
line
with
agr
eed
norm
s an
d st
anda
rds
6.4%
1.
3%
4.5%
3.
2%
Due
to
the
natio
nal
initi
ativ
e to
era
dica
te a
ll pi
t la
trine
s at
sch
ools
, the
dep
artm
ent d
emol
ishe
d th
e ab
lutio
n fa
cilit
ies
at 8
sch
ools
(3
5/54
5)
(7/5
58)
(25/
557)

74
Annual Report for 2018/19 Financial Year Vote 04: Department of Education
Province of the Northern Cape
- 74 -
Strategy to overcome areas of under performance
Over the MTEF targets will be scaled down because of marginal budget increases Changes to planned targets
There were no changes to planned targets
Linking performance with budgets
Departments must provide a summary of the actual expenditure in comparison to the adjusted appropriation for both the current year and previous year. The information must be provided at a sub-programme level and must agree to the appropriation statement of the audited financial statements. Reasons for variations should be linked to the information discussed above in the organisational environment and the service delivery environment. The department must also report on how expenditure contributed to achievement of outputs. Sub-programme expenditure
The Department achieved four (4) of the nine (9), (44.4%) indicators set for Programme 6: Infrastructure Development. A new contractor was appointed at Wrenchville after previous contractor was terminated. Both contractors at Steynsville and Karos requested extension of times. Magojaneng Primary and High Schools were reprioritised for outer years due to budget availability. Redirile and Barkley Rooirand have not started with construction due to planning delays. Several projects implemented by the John Taolo Gaetsewe Development Trust were completed during the 2017/18 financial year though the documentation was not received in time to report on. Due to the national initiative to eradicate all pit latrines at schools, the department demolished the ablution facilities at 8 schools.
Final Actual Final Actual
Appropriation Expenditure Appropriation Expenditure
R’000 R’000 R’000 R’000 R’000 R’000
Administration 34 137 33 607 530 68 424 44 996 23 428
Public Ordinary Schools 519 113 519 113 - 503 944 544 170 (40 226)
Special Schools 10 009 10 009 - 22 447 5 387 17 060
Early Childhood Development 5 169 5 169 - 17 452 15 042 2 410
Total 568 428 567 898 530 612 267 609 595 2 672
Programme 6: Infrastructure Development
2018/2019 2017/2018
(Over)/Under Expenditure
(Over)/Under Expenditure
Annual Report for 2018/19 Financial Year Vote 04: Department of Education
Province of the Northern Cape
75
4.7 Programme 7: EXAMINATION AND EDUCATION-RELATED SERVICES
Objective of Programme: To provide the education institutions as a whole with examination and education related services.
Sub-programmes
Sub-programme 7.1: Payments to SETA To provide employee HRD in accordance with the Skills Development Act. Sub-programme 7.2: Professional Services To provide educators and learners in schools with departmentally managed support services. Sub-programme 7.3: Special projects
To provide for special departmentally managed intervention projects in the education system as a whole.
Sub-programme 7.4: External examinations To provide for departmentally managed examination services Sub-programme 7.5: Conditional grant To provide for projects specified by the Department of Education that is applicable to
more than one programme and funded with conditional grants.
Strategic objectives, performance indicators, planned targets and actual achievements
Achievements EXAMINATIONS AND ASSESSMENT Background This programme is responsible for the conduct, administration and management of Examinations and Assessment in all public schools in the province. This includes, amongst others, the following formal examinations and assessments: National Senior Certificate (NSC) – November/June, Senior Certificate Examinations (SC) - June; Grade12 Preparatory Examinations - September; Provincial Common Examinations - June; November ABET L4 – June, November
Strategic activities for the above-mentioned examinations and assessment are: Registration, Resulting and Certification of learners/candidates on an electronic mainframe
system. Manage the setting of Provincial Common Question Papers, as well as providing a final quality
assurance check with regard to external national papers. Manage School-Based Assessment and Integrity Management of all processes. Manage the printing, packing, distribution, collecting and archiving of all question papers and
Assessment documents. Manage pre-marking, as well as provincial central marking processes for the National Senior
Certificate (NSC), Senior Certificate (SC), ABET level 4 as well as remarking and review processes.
Monitoring and invigilation; Auditing and registration of independent centres; Accommodation, Concessions and Assessment in the GET Band.

75
Annual Report for 2018/19 Financial Year Vote 04: Department of Education
Province of the Northern Cape
- 74 -
Strategy to overcome areas of under performance
Over the MTEF targets will be scaled down because of marginal budget increases Changes to planned targets
There were no changes to planned targets
Linking performance with budgets
Departments must provide a summary of the actual expenditure in comparison to the adjusted appropriation for both the current year and previous year. The information must be provided at a sub-programme level and must agree to the appropriation statement of the audited financial statements. Reasons for variations should be linked to the information discussed above in the organisational environment and the service delivery environment. The department must also report on how expenditure contributed to achievement of outputs. Sub-programme expenditure
The Department achieved four (4) of the nine (9), (44.4%) indicators set for Programme 6: Infrastructure Development. A new contractor was appointed at Wrenchville after previous contractor was terminated. Both contractors at Steynsville and Karos requested extension of times. Magojaneng Primary and High Schools were reprioritised for outer years due to budget availability. Redirile and Barkley Rooirand have not started with construction due to planning delays. Several projects implemented by the John Taolo Gaetsewe Development Trust were completed during the 2017/18 financial year though the documentation was not received in time to report on. Due to the national initiative to eradicate all pit latrines at schools, the department demolished the ablution facilities at 8 schools.
Final Actual Final Actual
Appropriation Expenditure Appropriation Expenditure
R’000 R’000 R’000 R’000 R’000 R’000
Administration 34 137 33 607 530 68 424 44 996 23 428
Public Ordinary Schools 519 113 519 113 - 503 944 544 170 (40 226)
Special Schools 10 009 10 009 - 22 447 5 387 17 060
Early Childhood Development 5 169 5 169 - 17 452 15 042 2 410
Total 568 428 567 898 530 612 267 609 595 2 672
Programme 6: Infrastructure Development
2018/2019 2017/2018
(Over)/Under Expenditure
(Over)/Under Expenditure
Annual Report for 2018/19 Financial Year Vote 04: Department of Education
Province of the Northern Cape
75
4.7 Programme 7: EXAMINATION AND EDUCATION-RELATED SERVICES
Objective of Programme: To provide the education institutions as a whole with examination and education related services.
Sub-programmes
Sub-programme 7.1: Payments to SETA To provide employee HRD in accordance with the Skills Development Act. Sub-programme 7.2: Professional Services To provide educators and learners in schools with departmentally managed support services. Sub-programme 7.3: Special projects
To provide for special departmentally managed intervention projects in the education system as a whole.
Sub-programme 7.4: External examinations To provide for departmentally managed examination services Sub-programme 7.5: Conditional grant To provide for projects specified by the Department of Education that is applicable to
more than one programme and funded with conditional grants.
Strategic objectives, performance indicators, planned targets and actual achievements
Achievements EXAMINATIONS AND ASSESSMENT Background This programme is responsible for the conduct, administration and management of Examinations and Assessment in all public schools in the province. This includes, amongst others, the following formal examinations and assessments: National Senior Certificate (NSC) – November/June, Senior Certificate Examinations (SC) - June; Grade12 Preparatory Examinations - September; Provincial Common Examinations - June; November ABET L4 – June, November
Strategic activities for the above-mentioned examinations and assessment are: Registration, Resulting and Certification of learners/candidates on an electronic mainframe
system. Manage the setting of Provincial Common Question Papers, as well as providing a final quality
assurance check with regard to external national papers. Manage School-Based Assessment and Integrity Management of all processes. Manage the printing, packing, distribution, collecting and archiving of all question papers and
Assessment documents. Manage pre-marking, as well as provincial central marking processes for the National Senior
Certificate (NSC), Senior Certificate (SC), ABET level 4 as well as remarking and review processes.
Monitoring and invigilation; Auditing and registration of independent centres; Accommodation, Concessions and Assessment in the GET Band.

76
Annual Report for 2018/19 Financial Year Vote 04: Department of Education
Province of the Northern Cape
76
NOVEMBER 2018 NSC EXAMINATIONS
Overview of the NSC Examination The department used 143 examination centres (including independent centres), 3 marking centres, 724 markers, 146 senior markers, 46 chief markers, 20 deputy chief markers, 46 internal moderators, and 173 873 scripts had to be marked and moderated. The Quality Assurer, Umalusi found that the Department has sound systems in place and the whole examination process was conducted with integrity. The results have been certified by Umalusi as being free of irregularities. Analysis of the NSC Examination In 2018, a total of 12 157 full-time candidates were registered for the National Senior Certificate (NSC) Examination in the Northern Cape Province. In comparison to 2017, it represents an increase of 1 638 candidates. A total of 9 909 candidates, compared to the 8 735 candidates the previous year, including progressed learners completed the NSC exams. 7 264 candidates passed, which is 656 more candidates compared to the previous year. This brought the overall pass rate to 73,3%, which is a decline of 2,3%. The overall pass rate, excluding our progressed learners is 75,2%. A total of 2 091 progressed learners made use of the Multiple Examination Opportunity (MEO), therefore their results will only be taken into consideration once they have completed the NSC Examination. A total of 532 progressed learners opted to complete the 2018 NSC examinations, of which 214 learners obtained their National Senior Certificate and reflects a pass rate of 40,2%, a 12,6% decrease in comparison to 2017. These learners obtained 14 bachelor passes, 82 diploma passes and 118 higher certificate passes. Of the 9 909 full time candidates that wrote and completed the NSC Examination, the number of distinctions increased from 1 538 in 2017 to 1 562 in 2018. The bachelor passes have also increased from 2 205 in 2017 to 2 589 in 2018. 2 798 candidates wrote Mathematics and 1 652 candidates passed which constitutes a pass rate of 59%, an increase of 1,7%. 2 259 candidates wrote Physical Science and 1 512 candidates passed which constitutes a pass rate of 66,9%, an increase of 10,1%. The pass rates for the five Districts are as follows: The Namakwa District has recorded the highest pass percentage of 83,7%, an increase of 0,8%; ZF Mgcawu District with a pass percentage of 74,6%, a decrease of 3,4%; The John Taolo Gaetsewe District recorded a pass percentage of 73,2%,an increase of 1,8%; The Frances Baard District recorded a 71,4% pass rate, a decrease of 4,1%; The Pixley Ka Seme District had a pass percentage of 70,2%, a decrease of 3,9%.
There is no district performing below 70% pass rate. Four (4) schools have recorded a 100% pass rate in the Province, namely: Kimberley Girls High School; Hopetown High School; Hartswater High School; Vaalrivier High School.
The Top Schools are listed as follows: Top Quintile 1 school –Dibotsa High School Top Quintile 2 school –Tetlanyo High School Top Quintile 3 school –Baitiredi High School Top Quintile 4 school –Hopetown High School Top Quintile 5 school –Kimberley Girls High School
The most improved school is in the Frances Baard District, Warrenvale High School, improving their pass rate from 47,4% in 2017 to 95,5% in 2018. The Northern Cape Department of Education classifies a school as underperforming, when the overall pass rate is below 60%. In this regard, we have 32 underperforming schools, mainly in the Frances Baard District.
Annual Report for 2018/19 Financial Year Vote 04: Department of Education
Province of the Northern Cape
77
In 2019, there will only be two examinations to be written. The old February/March Supplementary examination falls away and will be replaced by the 2019 June examination. Candidates who absented themselves from the writing of one or more question papers in the October/November 2018 examination due to ill-health or other unforeseen circumstances must present a medical certificate or other acceptable documentary evidence, to support their application to write the examination. Rules governing entry to the June examination were also printed on the reverse side of the statement of results. All the categories of candidates eligible to write the 2019 June examination, had to submit the 1-page application form by 15 February 2019. A revised registration form was sent to all schools for completion. Identity numbers are compulsory for registration purposes and a copy of the identity document together with the Grade 11 report card had to be attached to the application form.
CONDITIONAL GRANT: HIV & AIDS LIFE SKILLS EDUCATION
The Conditional Grant, is aimed at equipping educators and learners with the necessary skills and knowledge to respond appropriately and positively to the scourge of HIV & AIDS, STI’s, TB as well as teenage pregnancies. The execution of the program, for achieving its objective of awareness and education as preventative strategies are implemented through the following key performance areas, of which the unit’s annual performance for the 2018/19 period has been achieved. Advocacy: The unit planned a target of 2 000 learners to be reached through school based activities for creating awareness, of which a total of 11 126 Learners were reached, rendering a significant overachievement of the KPA, as mobilization for active participation by all schools were effectively implemented, including the successful provincial World TB and World AIDS Day Commemorations. Training & Development: The unit planned a target of 20 educators of which 40 educators were reached, rendering a significant overachievement on educators. Also a planned target of 2 500 learners on teenage pregnancy intervention in JTG, reaching the target of 63 07 learners with the conclusion of the program and 60 educators planned for cluster empowerment, reaching 200 educators through collaborations and integrations, yielding a significant over achievement for the period of reporting. Peer Education: The unit had a planned target of 200 Educators to be trained on cascading of Peer Education Guidelines, of which no program was implemented due to projected CG overspending. The unit planned a set target of 300 grade 12 learners, of which a target of 579 learners were reached, rendering the unit a significant overachievement of the set target, through the Curriculum Integrated Activity. The planned target of 1000 learners for career guidance/ exhibitions was also successfully achieved by 1725, rendering the unit a significant overachievement with the collaboration of all departments, SANDF and NOCCI. Care & Support: The unit planned a set target of 60 educators to be trained on Lay Counselling for supporting vulnerable learners, reaching 35 educators, rendering an under achievement as a result of the union disengagement and a planned target of 60 educators to be trained on First Aid training, reaching 45 educators. All remaining activities for reaching the set target were suspended due to projected CG overspending.

77
Annual Report for 2018/19 Financial Year Vote 04: Department of Education
Province of the Northern Cape
76
NOVEMBER 2018 NSC EXAMINATIONS
Overview of the NSC Examination The department used 143 examination centres (including independent centres), 3 marking centres, 724 markers, 146 senior markers, 46 chief markers, 20 deputy chief markers, 46 internal moderators, and 173 873 scripts had to be marked and moderated. The Quality Assurer, Umalusi found that the Department has sound systems in place and the whole examination process was conducted with integrity. The results have been certified by Umalusi as being free of irregularities. Analysis of the NSC Examination In 2018, a total of 12 157 full-time candidates were registered for the National Senior Certificate (NSC) Examination in the Northern Cape Province. In comparison to 2017, it represents an increase of 1 638 candidates. A total of 9 909 candidates, compared to the 8 735 candidates the previous year, including progressed learners completed the NSC exams. 7 264 candidates passed, which is 656 more candidates compared to the previous year. This brought the overall pass rate to 73,3%, which is a decline of 2,3%. The overall pass rate, excluding our progressed learners is 75,2%. A total of 2 091 progressed learners made use of the Multiple Examination Opportunity (MEO), therefore their results will only be taken into consideration once they have completed the NSC Examination. A total of 532 progressed learners opted to complete the 2018 NSC examinations, of which 214 learners obtained their National Senior Certificate and reflects a pass rate of 40,2%, a 12,6% decrease in comparison to 2017. These learners obtained 14 bachelor passes, 82 diploma passes and 118 higher certificate passes. Of the 9 909 full time candidates that wrote and completed the NSC Examination, the number of distinctions increased from 1 538 in 2017 to 1 562 in 2018. The bachelor passes have also increased from 2 205 in 2017 to 2 589 in 2018. 2 798 candidates wrote Mathematics and 1 652 candidates passed which constitutes a pass rate of 59%, an increase of 1,7%. 2 259 candidates wrote Physical Science and 1 512 candidates passed which constitutes a pass rate of 66,9%, an increase of 10,1%. The pass rates for the five Districts are as follows: The Namakwa District has recorded the highest pass percentage of 83,7%, an increase of 0,8%; ZF Mgcawu District with a pass percentage of 74,6%, a decrease of 3,4%; The John Taolo Gaetsewe District recorded a pass percentage of 73,2%,an increase of 1,8%; The Frances Baard District recorded a 71,4% pass rate, a decrease of 4,1%; The Pixley Ka Seme District had a pass percentage of 70,2%, a decrease of 3,9%.
There is no district performing below 70% pass rate. Four (4) schools have recorded a 100% pass rate in the Province, namely: Kimberley Girls High School; Hopetown High School; Hartswater High School; Vaalrivier High School.
The Top Schools are listed as follows: Top Quintile 1 school –Dibotsa High School Top Quintile 2 school –Tetlanyo High School Top Quintile 3 school –Baitiredi High School Top Quintile 4 school –Hopetown High School Top Quintile 5 school –Kimberley Girls High School
The most improved school is in the Frances Baard District, Warrenvale High School, improving their pass rate from 47,4% in 2017 to 95,5% in 2018. The Northern Cape Department of Education classifies a school as underperforming, when the overall pass rate is below 60%. In this regard, we have 32 underperforming schools, mainly in the Frances Baard District.
Annual Report for 2018/19 Financial Year Vote 04: Department of Education
Province of the Northern Cape
77
In 2019, there will only be two examinations to be written. The old February/March Supplementary examination falls away and will be replaced by the 2019 June examination. Candidates who absented themselves from the writing of one or more question papers in the October/November 2018 examination due to ill-health or other unforeseen circumstances must present a medical certificate or other acceptable documentary evidence, to support their application to write the examination. Rules governing entry to the June examination were also printed on the reverse side of the statement of results. All the categories of candidates eligible to write the 2019 June examination, had to submit the 1-page application form by 15 February 2019. A revised registration form was sent to all schools for completion. Identity numbers are compulsory for registration purposes and a copy of the identity document together with the Grade 11 report card had to be attached to the application form.
CONDITIONAL GRANT: HIV & AIDS LIFE SKILLS EDUCATION
The Conditional Grant, is aimed at equipping educators and learners with the necessary skills and knowledge to respond appropriately and positively to the scourge of HIV & AIDS, STI’s, TB as well as teenage pregnancies. The execution of the program, for achieving its objective of awareness and education as preventative strategies are implemented through the following key performance areas, of which the unit’s annual performance for the 2018/19 period has been achieved. Advocacy: The unit planned a target of 2 000 learners to be reached through school based activities for creating awareness, of which a total of 11 126 Learners were reached, rendering a significant overachievement of the KPA, as mobilization for active participation by all schools were effectively implemented, including the successful provincial World TB and World AIDS Day Commemorations. Training & Development: The unit planned a target of 20 educators of which 40 educators were reached, rendering a significant overachievement on educators. Also a planned target of 2 500 learners on teenage pregnancy intervention in JTG, reaching the target of 63 07 learners with the conclusion of the program and 60 educators planned for cluster empowerment, reaching 200 educators through collaborations and integrations, yielding a significant over achievement for the period of reporting. Peer Education: The unit had a planned target of 200 Educators to be trained on cascading of Peer Education Guidelines, of which no program was implemented due to projected CG overspending. The unit planned a set target of 300 grade 12 learners, of which a target of 579 learners were reached, rendering the unit a significant overachievement of the set target, through the Curriculum Integrated Activity. The planned target of 1000 learners for career guidance/ exhibitions was also successfully achieved by 1725, rendering the unit a significant overachievement with the collaboration of all departments, SANDF and NOCCI. Care & Support: The unit planned a set target of 60 educators to be trained on Lay Counselling for supporting vulnerable learners, reaching 35 educators, rendering an under achievement as a result of the union disengagement and a planned target of 60 educators to be trained on First Aid training, reaching 45 educators. All remaining activities for reaching the set target were suspended due to projected CG overspending.

78
Annual Report for 2018/19 Financial Year Vote 04: Department of Education
Province of the Northern Cape
78
LTSM Distribution: The unit procured posters as LTSM to be distributed to a target of 50 schools, reaching 21 schools during, after which further distribution was suspended and all dispatched LTSM recalled due to a misprint and spelling errors to be corrected by the service provider. Monitoring & Support: District coordinators to monitor and support 70 schools implementing the conditional grant program, reaching 33 Schools, realizing an under achievement as a result of the union disengagement during the period of reporting. CONDITIONAL GRANT: MATHEMATICS, SCIENCE AND TECHNOLOGY (MST) Procured ICT software for 136 schools for Life Sciences.
Procured and delivered workshop equipment, machinery and tools to all 10 selected technical
schools to the amount of R 4.5 m.
Procured and delivered Technical science kits to all 10 selected technical schools
Procured and delivered Life Science genetics kits to 27 MST high and technical focus schools.
Procured and delivered Mathematics kits to all 27 MST high and technical schools.
Procured and delivered Natural Science & Technology (NSTech) kits to all 12 MST focus primary feeder schools
Supported 687 teachers and subject advisors for targeted training and orientation in subject content and methodologies for MST subjects.
Supported training of 28 teachers in integrating ICT in learning and teaching.
Supported 9167 learners for registration in Maths and Science Olympiads, Science expos and competitions.
Annu
al R
epor
t for
201
8/19
Fin
ancia
l Yea
r Vo
te 0
4: D
epar
tmen
t of E
duca
tion
Prov
ince
of t
he N
orth
ern
Cape
- 79
-
Stra
tegi
c ob
ject
ives
:
Pr
ogra
mm
e 7:
Exa
min
atio
n an
d Ed
ucat
ion
Rel
ated
Ser
vice
s
Stra
tegi
c ob
ject
ives
A
ctua
l A
chie
vem
ent
2017
/201
8
Plan
ned
Targ
et
2018
/201
9
Act
ual
Ach
ieve
men
t 20
18/2
019
Dev
iatio
n fr
om
Plan
ned
Targ
et
for 2
018/
2019
C
omm
ent o
n de
viat
ions
To
esta
blis
h a
wor
ld-c
lass
sy
stem
of
st
anda
rdis
ed
asse
ssm
ents
an
d lif
e sk
ills
educ
atio
n w
hich
cat
ers
for 5
61 s
choo
ls.
556
558
557
-1
One
sch
ool,
Wre
nchv
ille P
rimar
y S
choo
l w
as n
ot
com
plet
ed o
n tim
e as
the
con
tract
or r
eque
sted
tim
e ex
tens
ion
Pe
rfor
man
ce in
dica
tors
Prog
ram
me
7: E
xam
inat
ion
and
Educ
atio
n R
elat
ed S
ervi
ces
Perf
orm
ance
Indi
cato
r A
ctua
l A
chie
vem
ent
2017
/201
8
Plan
ned
Targ
et
2018
/201
9
Act
ual
Ach
ieve
men
t 20
18/2
019
Dev
iatio
n fr
om
Plan
ned
Targ
et
for 2
018/
2019
C
omm
ent o
n de
viat
ions
PP
M70
1:P
erce
ntag
e of
lea
rner
s w
ho p
asse
d N
atio
nal S
enio
r Cer
tific
ate
(NSC
)
75.6
%
78%
73
.3%
-4
.7%
In
crea
se in
the
num
ber
of p
rogr
esse
d le
arne
rs a
nd
acco
mpa
nyin
g dr
op i
n th
e pa
ss r
ate
of p
rogr
esse
d le
arne
rs
(6 6
08/
8 73
5)
(7 0
20/
9 00
0)
(7 2
64/
9 90
9)
PP
M70
2:P
erce
ntag
e of
G
rade
12
le
arne
rs
pass
ing
at b
ache
lor l
evel
25.2
%
26%
26
.1%
0.
1%
Targ
et re
ache
d (2
205
/ 8
735)
(2
340
/ 9
000)
(2
589
/ 9
909)
PP
M70
3:P
erce
ntag
e of
G
rade
12
le
arne
rs
achi
evin
g 50
% o
r mor
e in
Mat
hem
atic
s
24.7
%
25%
21
.9%
-3
.1%
In
crea
se in
the
num
ber
of p
rogr
esse
d le
arne
rs a
nd
high
num
ber
of n
ovic
e ed
ucat
ors
teac
hing
Gra
de 1
2 fo
r the
firs
t tim
e
(692
/ 2
796)
(7
00/
2 80
0)
(613
/ 2
798)
PP
M70
4:P
erce
ntag
e of
G
rade
12
le
arne
rs
achi
evin
g 50
% o
r mor
e in
Phy
sica
l Sci
ence
s
22.3
%
22%
26
.5%
4.
5%
Few
er n
ovic
e te
ache
rs r
equi
ring
addi
tiona
l ex
tern
al
supp
ort i
n th
e su
bjec
t (5
23/
2 34
4)
(528
/ 2
400)
(5
98/
2 25
9)
PP
M70
5:N
umbe
r of
se
cond
ary
scho
ols
with
N
atio
nal S
enio
r C
ertif
icat
e (N
SC
) pa
ss r
ate
of
60%
and
abo
ve
114
115
107
-8
An
incr
ease
in
the
num
ber
of p
rogr
esse
d le
arne
rs,
mor
e un
derp
erfo
rmin
g sc
hool
s as
w
ell
as
mor
e sc
hool
s w
ith e
nrol
men
t of o
ver 1
00 le
arne
rs

79
Annual Report for 2018/19 Financial Year Vote 04: Department of Education
Province of the Northern Cape
78
LTSM Distribution: The unit procured posters as LTSM to be distributed to a target of 50 schools, reaching 21 schools during, after which further distribution was suspended and all dispatched LTSM recalled due to a misprint and spelling errors to be corrected by the service provider. Monitoring & Support: District coordinators to monitor and support 70 schools implementing the conditional grant program, reaching 33 Schools, realizing an under achievement as a result of the union disengagement during the period of reporting. CONDITIONAL GRANT: MATHEMATICS, SCIENCE AND TECHNOLOGY (MST) Procured ICT software for 136 schools for Life Sciences.
Procured and delivered workshop equipment, machinery and tools to all 10 selected technical
schools to the amount of R 4.5 m.
Procured and delivered Technical science kits to all 10 selected technical schools
Procured and delivered Life Science genetics kits to 27 MST high and technical focus schools.
Procured and delivered Mathematics kits to all 27 MST high and technical schools.
Procured and delivered Natural Science & Technology (NSTech) kits to all 12 MST focus primary feeder schools
Supported 687 teachers and subject advisors for targeted training and orientation in subject content and methodologies for MST subjects.
Supported training of 28 teachers in integrating ICT in learning and teaching.
Supported 9167 learners for registration in Maths and Science Olympiads, Science expos and competitions.
Annu
al R
epor
t for
201
8/19
Fin
ancia
l Yea
r Vo
te 0
4: D
epar
tmen
t of E
duca
tion
Prov
ince
of t
he N
orth
ern
Cape
- 79
-
Stra
tegi
c ob
ject
ives
:
Pr
ogra
mm
e 7:
Exa
min
atio
n an
d Ed
ucat
ion
Rel
ated
Ser
vice
s
Stra
tegi
c ob
ject
ives
A
ctua
l A
chie
vem
ent
2017
/201
8
Plan
ned
Targ
et
2018
/201
9
Act
ual
Ach
ieve
men
t 20
18/2
019
Dev
iatio
n fr
om
Plan
ned
Targ
et
for 2
018/
2019
C
omm
ent o
n de
viat
ions
To
esta
blis
h a
wor
ld-c
lass
sy
stem
of
st
anda
rdis
ed
asse
ssm
ents
an
d lif
e sk
ills
educ
atio
n w
hich
cat
ers
for 5
61 s
choo
ls.
556
558
557
-1
One
sch
ool,
Wre
nchv
ille P
rimar
y S
choo
l w
as n
ot
com
plet
ed o
n tim
e as
the
con
tract
or r
eque
sted
tim
e ex
tens
ion
Pe
rfor
man
ce in
dica
tors
Prog
ram
me
7: E
xam
inat
ion
and
Educ
atio
n R
elat
ed S
ervi
ces
Perf
orm
ance
Indi
cato
r A
ctua
l A
chie
vem
ent
2017
/201
8
Plan
ned
Targ
et
2018
/201
9
Act
ual
Ach
ieve
men
t 20
18/2
019
Dev
iatio
n fr
om
Plan
ned
Targ
et
for 2
018/
2019
C
omm
ent o
n de
viat
ions
PP
M70
1:P
erce
ntag
e of
lea
rner
s w
ho p
asse
d N
atio
nal S
enio
r Cer
tific
ate
(NSC
)
75.6
%
78%
73
.3%
-4
.7%
In
crea
se in
the
num
ber
of p
rogr
esse
d le
arne
rs a
nd
acco
mpa
nyin
g dr
op i
n th
e pa
ss r
ate
of p
rogr
esse
d le
arne
rs
(6 6
08/
8 73
5)
(7 0
20/
9 00
0)
(7 2
64/
9 90
9)
PP
M70
2:P
erce
ntag
e of
G
rade
12
le
arne
rs
pass
ing
at b
ache
lor l
evel
25.2
%
26%
26
.1%
0.
1%
Targ
et re
ache
d (2
205
/ 8
735)
(2
340
/ 9
000)
(2
589
/ 9
909)
PP
M70
3:P
erce
ntag
e of
G
rade
12
le
arne
rs
achi
evin
g 50
% o
r mor
e in
Mat
hem
atic
s
24.7
%
25%
21
.9%
-3
.1%
In
crea
se in
the
num
ber
of p
rogr
esse
d le
arne
rs a
nd
high
num
ber
of n
ovic
e ed
ucat
ors
teac
hing
Gra
de 1
2 fo
r the
firs
t tim
e
(692
/ 2
796)
(7
00/
2 80
0)
(613
/ 2
798)
PP
M70
4:P
erce
ntag
e of
G
rade
12
le
arne
rs
achi
evin
g 50
% o
r mor
e in
Phy
sica
l Sci
ence
s
22.3
%
22%
26
.5%
4.
5%
Few
er n
ovic
e te
ache
rs r
equi
ring
addi
tiona
l ex
tern
al
supp
ort i
n th
e su
bjec
t (5
23/
2 34
4)
(528
/ 2
400)
(5
98/
2 25
9)
PP
M70
5:N
umbe
r of
se
cond
ary
scho
ols
with
N
atio
nal S
enio
r C
ertif
icat
e (N
SC
) pa
ss r
ate
of
60%
and
abo
ve
114
115
107
-8
An
incr
ease
in
the
num
ber
of p
rogr
esse
d le
arne
rs,
mor
e un
derp
erfo
rmin
g sc
hool
s as
w
ell
as
mor
e sc
hool
s w
ith e
nrol
men
t of o
ver 1
00 le
arne
rs

80
Annual Report for 2018/19 Financial Year Vote 04: Department of Education
Province of the Northern Cape
- 80 -
Strategy to overcome areas of under performance Over the MTEF targets will be scaled down because of marginal budget increases Changes to planned targets
There were no changes to planned targets.
Linking performance with budgets
Departments must provide a summary of the actual expenditure in comparison to the adjusted appropriation for both the current year and previous year. The information must be provided at a sub-programme level and must agree to the appropriation statement of the audited financial statements. Reasons for variations should be linked to the information discussed above in the organisational environment and the service delivery environment. The department must also report on how expenditure contributed to achievement of outputs. Sub-programme expenditure
The Department achieved two (2) of the five (5), (40%) of the targets set in Programme 7: Examination and Education Related Services. This was primarily as a result of an increase in the number of progressed learners.
Final Actual Final Actual
Appropriation Expenditure Appropriation Expenditure
R’000 R’000 R’000 R’000 R’000 R’000
Payment SETA 6 691 6 691 - 6 373 6 373 -
Professional Services 22 691 22 857 (166) 22 682 22 780 (98)
Special Projects 35 620 38 761 (3 141) 26 827 34 677 (7 850)
External Examinations 75 311 75 764 (453) 79 398 75 263 4 135
HIV and AIDS (Life Skills Education) Grant 5 356 5 356 - 5 547 5 536 11 Social Sector Expanded Public Works Programme Incentive Grant for Provinces 6 335 6 246 89 2 017 1 987 30
Expanded Public Works Programme Incentive Grant for Provinces 2 222 2 158 64 2 083 2 031 52
Total 154 226 157 833 (3 607) 144 927 148 647 (3 720)
Programme 7: Examination and Education Related Services
2018/2019 2017/2018
(Over)/Under Expenditure
(Over)/Under Expenditure
Annual Report for 2018/19 Financial Year Vote 04: Department of Education
Province of the Northern Cape
81
5. TRANSFER PAYMENTS 5.1 Transfer payments to public entities
The Department does not have public entities.
6. CONDITIONAL GRANTS 6.1 Conditional grants and earmarked funds paid The Department does not pay conditional grants and earmarked funds 6.2 Conditional grants and earmarked funds received The table/s below details the conditional grants and ear marked funds received during for the period 1 April 2016 to 31 March 2017. Conditional Grant 1: NYS-EPWP SOCIAL SECTOR INCENTIVE GRANT
Department who transferred the grant National Department Of Public Works
Purpose of the grant
Identification and placement of unemployed youth at public schools, district and provincial offices to assist with data capturing(using HRMS and SA SAMS) and administration. Through this programme young are engaged in activities which provide a service to the community whilst developing their skills towards viable economic activism.
Expected outputs of the grant Recruitment and placement of 285 youth on a twelve months short contract in the programme
Actual outputs achieved 285 youth were placed on a twelve month short contract (effective from 01st April 2108 to 31st March 2019). They received a monthly stipend of R 1995.00.
Amount per amended DORA (R’000)
R6 335
Amount received (R’000) R6 335
Reasons if amount as per DORA was not received
NCDoE received the full amount allocated for the 2018/2019 financial year.
Amount spent by the department (R’000)
R6 335
Reasons for the funds unspent by the entity
N/A
Reasons for deviations on performance
N/A

81
Annual Report for 2018/19 Financial Year Vote 04: Department of Education
Province of the Northern Cape
- 80 -
Strategy to overcome areas of under performance Over the MTEF targets will be scaled down because of marginal budget increases Changes to planned targets
There were no changes to planned targets.
Linking performance with budgets
Departments must provide a summary of the actual expenditure in comparison to the adjusted appropriation for both the current year and previous year. The information must be provided at a sub-programme level and must agree to the appropriation statement of the audited financial statements. Reasons for variations should be linked to the information discussed above in the organisational environment and the service delivery environment. The department must also report on how expenditure contributed to achievement of outputs. Sub-programme expenditure
The Department achieved two (2) of the five (5), (40%) of the targets set in Programme 7: Examination and Education Related Services. This was primarily as a result of an increase in the number of progressed learners.
Final Actual Final Actual
Appropriation Expenditure Appropriation Expenditure
R’000 R’000 R’000 R’000 R’000 R’000
Payment SETA 6 691 6 691 - 6 373 6 373 -
Professional Services 22 691 22 857 (166) 22 682 22 780 (98)
Special Projects 35 620 38 761 (3 141) 26 827 34 677 (7 850)
External Examinations 75 311 75 764 (453) 79 398 75 263 4 135
HIV and AIDS (Life Skills Education) Grant 5 356 5 356 - 5 547 5 536 11 Social Sector Expanded Public Works Programme Incentive Grant for Provinces 6 335 6 246 89 2 017 1 987 30
Expanded Public Works Programme Incentive Grant for Provinces 2 222 2 158 64 2 083 2 031 52
Total 154 226 157 833 (3 607) 144 927 148 647 (3 720)
Programme 7: Examination and Education Related Services
2018/2019 2017/2018
(Over)/Under Expenditure
(Over)/Under Expenditure
Annual Report for 2018/19 Financial Year Vote 04: Department of Education
Province of the Northern Cape
81
5. TRANSFER PAYMENTS 5.1 Transfer payments to public entities
The Department does not have public entities.
6. CONDITIONAL GRANTS 6.1 Conditional grants and earmarked funds paid The Department does not pay conditional grants and earmarked funds 6.2 Conditional grants and earmarked funds received The table/s below details the conditional grants and ear marked funds received during for the period 1 April 2016 to 31 March 2017. Conditional Grant 1: NYS-EPWP SOCIAL SECTOR INCENTIVE GRANT
Department who transferred the grant National Department Of Public Works
Purpose of the grant
Identification and placement of unemployed youth at public schools, district and provincial offices to assist with data capturing(using HRMS and SA SAMS) and administration. Through this programme young are engaged in activities which provide a service to the community whilst developing their skills towards viable economic activism.
Expected outputs of the grant Recruitment and placement of 285 youth on a twelve months short contract in the programme
Actual outputs achieved 285 youth were placed on a twelve month short contract (effective from 01st April 2108 to 31st March 2019). They received a monthly stipend of R 1995.00.
Amount per amended DORA (R’000)
R6 335
Amount received (R’000) R6 335
Reasons if amount as per DORA was not received
NCDoE received the full amount allocated for the 2018/2019 financial year.
Amount spent by the department (R’000)
R6 335
Reasons for the funds unspent by the entity
N/A
Reasons for deviations on performance
N/A

82
Annual Report for 2018/19 Financial Year Vote 04: Department of Education
Province of the Northern Cape
82
Measures taken to improve performance
All participants received induction workshops on their roles and responsibilities
Monitoring mechanism by the receiving department
There is a monthly Provincial EPWP Social Sector Incentive Grant Steering Committee meeting hosted by the Provincial Department of Social Development as well as the quarterly site visits led by the National Department of Public Works and National Department of Social Development accompanied by NCDoE, DSAC, DSTL, DSD and DOH. Participants complete monthly attendance registers.
Conditional Grant 2: NATIONAL SCHOOL NUTRITION PROGRAMME Department who transferred the grant
Department of Basic Education (DBE)
Purpose of the grant To provide nutritious meals to targeted schools
Expected outputs of the grant Number of schools that provide nutritious meals to learners to enhanced their learning capacity and improved access to education
Actual outputs achieved
505 schools Quintile 1-3 Primary and Secondary = 208 684 learners Quintile 4-5 Primary and Secondary = 56 774 learners
Total learners = 265 458
Amount per amended DORA (R’000)
R170 211
Amount transferred (R’000) R170 211
Reasons if amount as per DORA not transferred
N/A
Amount spent by the department (R’000)
R170 211
Reasons for the funds unspent by the entity
N/A
Monitoring mechanism by the transferring department
Evaluate performance of the conditional grant annually
Conditional Grant 3: MATHEMATICS, SCIENCE AND TECHNOLOGY-(MST) CONDITIONAL GRANT Department who transferred the grant Department of Basic Education
Purpose of the grant
To provide resources to learners, teachers and schools for the improvement of Mathematics, Science and Technology teaching and learning in selected schools.
To improve achievement of learner participation and success rate, teacher demand, supply, utilisation, development and support, resourcing and partnerships, consistent with target set in Action Plan 2015 and the National Development Plan
Annual Report for 2018/19 Financial Year Vote 04: Department of Education
Province of the Northern Cape
83
Department who transferred the grant Department of Basic Education
Expected outputs of the grant
To provide ICT subjects resources To provide Workshop Equipment, Machinery and tools to 10 selected (focus) technical schools. To provide Laboratories equipment, apparatus and consumables to all MST focus schools. Learner support to all MST subjects. Teacher support to all MST subject teachers.
Actual outputs achieved
Procured ICT software for 136 schools. Procured and delivered Workshop Equipment, Machinery and tools to all 10 selected technical schools. Procured and delivered Technical science kits to all 10 selected technical schools Procured and delivered Life science kits to 27 MST high and technical focus schools. Procured and delivered Mathematics kits to all 27 MST high and technical schools. Procured and delivered Natural Science & Technology (NSTech) kits to all 12 MST focus primary feeder schools Supported 687 teachers and subject advisors for targeted training and orientation in subject content and methodologies for MST subjects. Supported training of 28 teachers in integrating ICT in learning and teaching. Supported 9167 learners for registration in Maths and science Olympiads, Science expos and competitions.
Amount per amended DORA (R’000) R24 564
Amount received (R’000) R24 564
Reasons if amount as per DORA was not received All amount received by the province
Amount spent by the department (R’000) R24 561.5
Reasons for the funds unspent by the entity Not applicable
Reasons for deviations on performance No deviation
Measures taken to improve performance N/A
Monitoring mechanism by the receiving department
Signed monthly and quarterly report submitted to provincial treasury and DBE.

83
Annual Report for 2018/19 Financial Year Vote 04: Department of Education
Province of the Northern Cape
82
Measures taken to improve performance
All participants received induction workshops on their roles and responsibilities
Monitoring mechanism by the receiving department
There is a monthly Provincial EPWP Social Sector Incentive Grant Steering Committee meeting hosted by the Provincial Department of Social Development as well as the quarterly site visits led by the National Department of Public Works and National Department of Social Development accompanied by NCDoE, DSAC, DSTL, DSD and DOH. Participants complete monthly attendance registers.
Conditional Grant 2: NATIONAL SCHOOL NUTRITION PROGRAMME Department who transferred the grant
Department of Basic Education (DBE)
Purpose of the grant To provide nutritious meals to targeted schools
Expected outputs of the grant Number of schools that provide nutritious meals to learners to enhanced their learning capacity and improved access to education
Actual outputs achieved
505 schools Quintile 1-3 Primary and Secondary = 208 684 learners Quintile 4-5 Primary and Secondary = 56 774 learners
Total learners = 265 458
Amount per amended DORA (R’000)
R170 211
Amount transferred (R’000) R170 211
Reasons if amount as per DORA not transferred
N/A
Amount spent by the department (R’000)
R170 211
Reasons for the funds unspent by the entity
N/A
Monitoring mechanism by the transferring department
Evaluate performance of the conditional grant annually
Conditional Grant 3: MATHEMATICS, SCIENCE AND TECHNOLOGY-(MST) CONDITIONAL GRANT Department who transferred the grant Department of Basic Education
Purpose of the grant
To provide resources to learners, teachers and schools for the improvement of Mathematics, Science and Technology teaching and learning in selected schools.
To improve achievement of learner participation and success rate, teacher demand, supply, utilisation, development and support, resourcing and partnerships, consistent with target set in Action Plan 2015 and the National Development Plan
Annual Report for 2018/19 Financial Year Vote 04: Department of Education
Province of the Northern Cape
83
Department who transferred the grant Department of Basic Education
Expected outputs of the grant
To provide ICT subjects resources To provide Workshop Equipment, Machinery and tools to 10 selected (focus) technical schools. To provide Laboratories equipment, apparatus and consumables to all MST focus schools. Learner support to all MST subjects. Teacher support to all MST subject teachers.
Actual outputs achieved
Procured ICT software for 136 schools. Procured and delivered Workshop Equipment, Machinery and tools to all 10 selected technical schools. Procured and delivered Technical science kits to all 10 selected technical schools Procured and delivered Life science kits to 27 MST high and technical focus schools. Procured and delivered Mathematics kits to all 27 MST high and technical schools. Procured and delivered Natural Science & Technology (NSTech) kits to all 12 MST focus primary feeder schools Supported 687 teachers and subject advisors for targeted training and orientation in subject content and methodologies for MST subjects. Supported training of 28 teachers in integrating ICT in learning and teaching. Supported 9167 learners for registration in Maths and science Olympiads, Science expos and competitions.
Amount per amended DORA (R’000) R24 564
Amount received (R’000) R24 564
Reasons if amount as per DORA was not received All amount received by the province
Amount spent by the department (R’000) R24 561.5
Reasons for the funds unspent by the entity Not applicable
Reasons for deviations on performance No deviation
Measures taken to improve performance N/A
Monitoring mechanism by the receiving department
Signed monthly and quarterly report submitted to provincial treasury and DBE.

84
Annual Report for 2018/19 Financial Year Vote 04: Department of Education
Province of the Northern Cape
84
Conditional Grant 4: LEARNERS WITH SEVERE TO PROFOUND INTELLECTUAL DISABILITIES (LSPID)
Department who transferred the grant
Department of Basic Education (DBE)
Purpose of the grant To provide the necessary support, resources and equipment to identified care centres and schools for the provision of education to Children with Severe to Profound Intellectual Disabilities (CSPID)
Expected outputs of the grant
Improved access to Quality Basic Education for children with Severe to Profound Intellectual Disabilities in conditions that ensure dignity, promote self-reliance and facilitate active participation in community: 750 Children/Learners with Severe to Profound Intellectual Disability (C/LSPID) who utilise the Learning Programme for C/LSPID 750 Children/Learners with Severe to Profound Intellectual Disability (C/LSPID) with access to Therapeutic and Psycho-Social Support Services that will enable them to Improve their Participation in Learning
Actual outputs achieved
265 Children/Learners with Severe to Profound Intellectual Disability (C/LSPID) who utilise the Learning Programme for C/LSPID 265 Children/Learners with Severe to Profound Intellectual Disability (C/LSPID) with access to Therapeutic and Psycho-Social Support Services that will enable them to Improve their Participation in Learning
Amount per amended DORA (R’000)
R 6 837
Amount received (R’000) R 6 837
Reasons if amount as per DORA was not received
N/A
Amount spent by the department (R’000)
R 6 837
Reasons for the funds unspent by the entity
N/A
Reasons for deviations on performance
Projected on number of Learners (750) were overestimated
Measures taken to improve performance
Projected number of Learners has been adjusted to 500
Monitoring mechanism by the receiving department
Monthly monitoring and support visits to care centres and internal annual performance evaluation on implementation of the grant.
Annual Report for 2018/19 Financial Year Vote 04: Department of Education
Province of the Northern Cape
85
7. DONOR FUNDS 7.1 Donor Funds Received Donor Fund: Globeleq Development Fund
Name of donor Globeleq Development Fund (De Aar Solar) Full amount of the funding (R’000) R801 Period of the commitment 2015/16 – 2018/19 Purpose of the funding Reading Coach Programme and ECD Practitioner
Training and Scholarship Expected outputs 14 Reading Coaches supported with a stipend.
30 Grade R Practitioners trained. Actual outputs achieved Reading coaches supported.
Practitioners are now in their final year of study. Amount received in current period (R’000)
R1,719
Amount spent by the department (R’000)
R1,293
Reasons for the funds unspent N/A Monitoring mechanism by the donor Monitoring Meetings and Reports
Donor Fund: Globeleq Development Fund
Name of donor Globeleq Development Fund (Droogfontein Solar:) Full amount of the funding (R’000) R690 Period of the commitment 2015/16 – 2018/19 Purpose of the funding Reading Coach Programme and ECD Practitioner
Training and Scholarship Expected outputs 10 Reading Coaches supported with a stipend.
20 Grade R Practitioners trained. Actual outputs achieved Reading coaches supported.
Practitioners are now in their final year of study. Amount received in current period (R’000)
R1,889
Amount spent by the department (R’000)
R1,424
Reasons for the funds unspent N/A Monitoring mechanism by the donor Monitoring Meetings and Reports
Donor Fund: Rooipoort Development (PTY) LTD
Name of donor Rooipoort Development (PTY) Ltd Full amount of the funding (R’000) R1,350 Period of the commitment 2017/18 – 2018/19 Purpose of the funding To provide support and resources to schools through
the reading coaches and reading material Expected outputs 50 Reading and Mathematics Coaches supported with
a stipend. Actual outputs achieved 50 Reading and Mathematics Coaches supported. Amount received in current period (R’000) R900 Amount spent by the department (R’000) R760 Reasons for the funds unspent N/A Monitoring mechanism by the donor Reports are submitted and feedback given during
meetings with the donor.

85
Annual Report for 2018/19 Financial Year Vote 04: Department of Education
Province of the Northern Cape
84
Conditional Grant 4: LEARNERS WITH SEVERE TO PROFOUND INTELLECTUAL DISABILITIES (LSPID)
Department who transferred the grant
Department of Basic Education (DBE)
Purpose of the grant To provide the necessary support, resources and equipment to identified care centres and schools for the provision of education to Children with Severe to Profound Intellectual Disabilities (CSPID)
Expected outputs of the grant
Improved access to Quality Basic Education for children with Severe to Profound Intellectual Disabilities in conditions that ensure dignity, promote self-reliance and facilitate active participation in community: 750 Children/Learners with Severe to Profound Intellectual Disability (C/LSPID) who utilise the Learning Programme for C/LSPID 750 Children/Learners with Severe to Profound Intellectual Disability (C/LSPID) with access to Therapeutic and Psycho-Social Support Services that will enable them to Improve their Participation in Learning
Actual outputs achieved
265 Children/Learners with Severe to Profound Intellectual Disability (C/LSPID) who utilise the Learning Programme for C/LSPID 265 Children/Learners with Severe to Profound Intellectual Disability (C/LSPID) with access to Therapeutic and Psycho-Social Support Services that will enable them to Improve their Participation in Learning
Amount per amended DORA (R’000)
R 6 837
Amount received (R’000) R 6 837
Reasons if amount as per DORA was not received
N/A
Amount spent by the department (R’000)
R 6 837
Reasons for the funds unspent by the entity
N/A
Reasons for deviations on performance
Projected on number of Learners (750) were overestimated
Measures taken to improve performance
Projected number of Learners has been adjusted to 500
Monitoring mechanism by the receiving department
Monthly monitoring and support visits to care centres and internal annual performance evaluation on implementation of the grant.
Annual Report for 2018/19 Financial Year Vote 04: Department of Education
Province of the Northern Cape
85
7. DONOR FUNDS 7.1 Donor Funds Received Donor Fund: Globeleq Development Fund
Name of donor Globeleq Development Fund (De Aar Solar) Full amount of the funding (R’000) R801 Period of the commitment 2015/16 – 2018/19 Purpose of the funding Reading Coach Programme and ECD Practitioner
Training and Scholarship Expected outputs 14 Reading Coaches supported with a stipend.
30 Grade R Practitioners trained. Actual outputs achieved Reading coaches supported.
Practitioners are now in their final year of study. Amount received in current period (R’000)
R1,719
Amount spent by the department (R’000)
R1,293
Reasons for the funds unspent N/A Monitoring mechanism by the donor Monitoring Meetings and Reports
Donor Fund: Globeleq Development Fund
Name of donor Globeleq Development Fund (Droogfontein Solar:) Full amount of the funding (R’000) R690 Period of the commitment 2015/16 – 2018/19 Purpose of the funding Reading Coach Programme and ECD Practitioner
Training and Scholarship Expected outputs 10 Reading Coaches supported with a stipend.
20 Grade R Practitioners trained. Actual outputs achieved Reading coaches supported.
Practitioners are now in their final year of study. Amount received in current period (R’000)
R1,889
Amount spent by the department (R’000)
R1,424
Reasons for the funds unspent N/A Monitoring mechanism by the donor Monitoring Meetings and Reports
Donor Fund: Rooipoort Development (PTY) LTD
Name of donor Rooipoort Development (PTY) Ltd Full amount of the funding (R’000) R1,350 Period of the commitment 2017/18 – 2018/19 Purpose of the funding To provide support and resources to schools through
the reading coaches and reading material Expected outputs 50 Reading and Mathematics Coaches supported with
a stipend. Actual outputs achieved 50 Reading and Mathematics Coaches supported. Amount received in current period (R’000) R900 Amount spent by the department (R’000) R760 Reasons for the funds unspent N/A Monitoring mechanism by the donor Reports are submitted and feedback given during
meetings with the donor.

86
Annual Report for 2018/19 Financial Year Vote 04: Department of Education
Province of the Northern Cape
86
Donor Fund: Sishen Iron-Ore Mining Company
Name of donor SIOC Development Trust Full amount of the funding (R’000) R2 279 Period of the commitment 2018/19 Purpose of the funding Training 20 ECD Practitioners on NQF Level 6 at NMU
for 36 months Expected outputs ECD Practitioner training Actual outputs achieved Bursaries for JTG ECD practitioners paid Amount received in current period (R’000) R639 Amount spent by the department (R’000) R389 Reasons for the funds unspent Funds only received late in the financial year Monitoring mechanism by the donor Monitoring reports
8. CAPITAL INVESTMENT 8.1 Capital investment, maintenance and asset management plan
Overview of plans for the 2018/19 financial year Currently the assets within the portfolio of the Northern Cape Department of Education are at different levels of functionality, condition and utilization and are categorized in line with existing policy as prescribed in The Regulations Relating to Minimum Uniform Norms and Standards for Public School Infrastructure as part of the South African Schools Act, 1996 (Act no. 84 of 1996) that was published in November 2013. These regulations provide a definitive path for planning and delivery that is geared towards the eradication of backlogs and the provision of new infrastructure in the Department’s effort to provide enabling learning environments for all learners in the Province. These efforts include the provision or upgrade of basic services to schools and the eradication of inappropriate structures, which constitutes a first line intervention towards achieving the goals and strategic objectives of the Department. The following key milestones have been achieved as per the Action Plan for the Northern Cape Department of Education: The 3 Year Implementation Programme states that all Public schools in the Northern Cape must have access to water, power and sanitation and all inappropriate structures build from materials such as mud, asbestos, metal and wood, must be eradicated. Within the Northern Cape all schools have been provided with infrastructure in terms of basic services and there is currently three (3) replacement schools in various stages of construction. In terms of new schools the new Wrenchville Primary School is anticipated to complete within the 1st Quarter of the 2019/20 financial year, however this school has been occupied since January 2019. Furthermore an additional 3 new schools are currently in construction and the Groenpunt Primêre Skool Replacement School is in the final stages of completion. The Department within the 2018/19 financial year delivered 5 Public schools with adequate electricity, 8 schools with water, a total of 25 schools received upgrades and additional supply in terms of sanitation, 10 schools received new perimeter security upgrades and 1 school was provided with new administration facility. The Department also provided an additional 3 classrooms and has 29 classrooms in various stages of construction and where appropriate a total of 4 ECD facilities was provided and another 8 ECD Facilities are in various stages of construction.
Annual Report for 2018/19 Financial Year Vote 04: Department of Education
Province of the Northern Cape
87
The Department provided 1 school with a school hall, and total of 41 schools have received either corrective or preventative maintenance in order to repair buildings to their former glory. Outlook for the coming financial year 2019/20 The Department is in the process to address fully inappropriate structures constructed from materials such as mud, asbestos, metal and wood, which must be eradicated. It is anticipated that 1 of the replacement schools will complete and in addition to this there are 3 new schools that is anticipated to complete within the 2019/20 financial year. It is targeted that the Department will within the 2019/20 financial year provide adequate electricity to 11 schools, adequate water to 9 schools, and 14 schools will receive upgrades and additional sanitation. The Department targeted an additional 43 classrooms and a total of 8 ECD facilities to complete. The Department has committed a minimum of 20% of the allocated Education Infrastructure Grant to maintenance of school facilities as per the Division of Revenue Act and therefore it is anticipated that a total of 36 schools will either receive corrective or preventative maintenance in order to repair buildings to their former glory.
Final Appropriation
Actual Expenditure
(Over)/Under Expenditure
Final Appropriation
Actual Expenditure
(Over)/Under Expenditure
R’000 R’000 R’000 R’000 R’000 R’000
New and replacement assets 152 333 152 333 - 299 669 217 814 81 855
Existing infrastructure assets
283 624 283 624 - 232 374 282 324 (49 950)
- Upgrades and additions 164 148 164 148 - 165 198 165 198 -
- Rehabilitation, renovations and refurbishments
11 995 11 995 - 34 107 34 107 -
- Maintenance and repairs 107 481 107 481 - 33 069 83 019 (49 950)
Infrastructure transfer - -
- Current - -
- Capital - -
Total 435 957 435 957 - 532 043 500 138 31 905
Infrastructure projects
2018/2019 2017/2018

87
Annual Report for 2018/19 Financial Year Vote 04: Department of Education
Province of the Northern Cape
86
Donor Fund: Sishen Iron-Ore Mining Company
Name of donor SIOC Development Trust Full amount of the funding (R’000) R2 279 Period of the commitment 2018/19 Purpose of the funding Training 20 ECD Practitioners on NQF Level 6 at NMU
for 36 months Expected outputs ECD Practitioner training Actual outputs achieved Bursaries for JTG ECD practitioners paid Amount received in current period (R’000) R639 Amount spent by the department (R’000) R389 Reasons for the funds unspent Funds only received late in the financial year Monitoring mechanism by the donor Monitoring reports
8. CAPITAL INVESTMENT 8.1 Capital investment, maintenance and asset management plan
Overview of plans for the 2018/19 financial year Currently the assets within the portfolio of the Northern Cape Department of Education are at different levels of functionality, condition and utilization and are categorized in line with existing policy as prescribed in The Regulations Relating to Minimum Uniform Norms and Standards for Public School Infrastructure as part of the South African Schools Act, 1996 (Act no. 84 of 1996) that was published in November 2013. These regulations provide a definitive path for planning and delivery that is geared towards the eradication of backlogs and the provision of new infrastructure in the Department’s effort to provide enabling learning environments for all learners in the Province. These efforts include the provision or upgrade of basic services to schools and the eradication of inappropriate structures, which constitutes a first line intervention towards achieving the goals and strategic objectives of the Department. The following key milestones have been achieved as per the Action Plan for the Northern Cape Department of Education: The 3 Year Implementation Programme states that all Public schools in the Northern Cape must have access to water, power and sanitation and all inappropriate structures build from materials such as mud, asbestos, metal and wood, must be eradicated. Within the Northern Cape all schools have been provided with infrastructure in terms of basic services and there is currently three (3) replacement schools in various stages of construction. In terms of new schools the new Wrenchville Primary School is anticipated to complete within the 1st Quarter of the 2019/20 financial year, however this school has been occupied since January 2019. Furthermore an additional 3 new schools are currently in construction and the Groenpunt Primêre Skool Replacement School is in the final stages of completion. The Department within the 2018/19 financial year delivered 5 Public schools with adequate electricity, 8 schools with water, a total of 25 schools received upgrades and additional supply in terms of sanitation, 10 schools received new perimeter security upgrades and 1 school was provided with new administration facility. The Department also provided an additional 3 classrooms and has 29 classrooms in various stages of construction and where appropriate a total of 4 ECD facilities was provided and another 8 ECD Facilities are in various stages of construction.
Annual Report for 2018/19 Financial Year Vote 04: Department of Education
Province of the Northern Cape
87
The Department provided 1 school with a school hall, and total of 41 schools have received either corrective or preventative maintenance in order to repair buildings to their former glory. Outlook for the coming financial year 2019/20 The Department is in the process to address fully inappropriate structures constructed from materials such as mud, asbestos, metal and wood, which must be eradicated. It is anticipated that 1 of the replacement schools will complete and in addition to this there are 3 new schools that is anticipated to complete within the 2019/20 financial year. It is targeted that the Department will within the 2019/20 financial year provide adequate electricity to 11 schools, adequate water to 9 schools, and 14 schools will receive upgrades and additional sanitation. The Department targeted an additional 43 classrooms and a total of 8 ECD facilities to complete. The Department has committed a minimum of 20% of the allocated Education Infrastructure Grant to maintenance of school facilities as per the Division of Revenue Act and therefore it is anticipated that a total of 36 schools will either receive corrective or preventative maintenance in order to repair buildings to their former glory.
Final Appropriation
Actual Expenditure
(Over)/Under Expenditure
Final Appropriation
Actual Expenditure
(Over)/Under Expenditure
R’000 R’000 R’000 R’000 R’000 R’000
New and replacement assets 152 333 152 333 - 299 669 217 814 81 855
Existing infrastructure assets
283 624 283 624 - 232 374 282 324 (49 950)
- Upgrades and additions 164 148 164 148 - 165 198 165 198 -
- Rehabilitation, renovations and refurbishments
11 995 11 995 - 34 107 34 107 -
- Maintenance and repairs 107 481 107 481 - 33 069 83 019 (49 950)
Infrastructure transfer - -
- Current - -
- Capital - -
Total 435 957 435 957 - 532 043 500 138 31 905
Infrastructure projects
2018/2019 2017/2018

88
Annual Report for 2018/19 Financial Year Vote 04: Department of Education
Province of the Northern Cape
88
PART C: GOVERNANCE
Annual Report for 2018/19 Financial Year Vote 04: Department of Education
Province of the Northern Cape
89
1. INTRODUCTION Commitment by the Department to maintain the highest standards of governance is fundamental to the management of public finances and resources. Users want assurance that the Department has good governance structures in place to effectively, efficiently and economically utilize the state resources, which is funded by the tax payer. 2. RISK MANAGEMENT The Risk Management Policy and Risk Management Strategy was reviewed in the 2017/18 Financial Year and is due for review again in 2020/21 financial year. The reviewed Policy and Strategy was endorsed by the Risk Management Committee and approved by the Accounting Officer. The Policy and Strategy outlines the Department’s commitment to implementing and maintaining an effective, efficient and transparent system of risk management. A risk assessment was conducted for the year under review and strategic and operational risk registers, which includes ICT and Fraud risks, were developed for the Department with mitigating controls for all identified risks. A template developed by National Treasury has been implemented for risk owners to identify new and emerging risks which may occur. The 2018/19 Risk Management Implementation Plan which details the risk management activities for the year was approved by the Accounting Officer with the endorsement by the Risk Management Committee. Progress on the annual Risk Management Implementation Plan is reported on quarterly to the Risk Management Committee and the Audit Committee. The 2018/19 Combined Assurance Plan of the Department, which identifies and specifies the sources of assurance over the strategic risks identified during the 2017/18 risk assessment, was developed and jointly approved by the Accounting Officer and Audit Committee Chairperson. The Risk Management Committee, which advises the Accounting Officer and management on overall risk management in the Department, is functional and quarterly meetings are convened and reports are forwarded to the Audit Committee. Reporting on risk management is a standing item on the Audit Committee meeting agenda. The Audit Committee monitors and provides feedback on the effectiveness of risk management in the Department. The Risk Management function was audited by Internal Audit during the year under review. Risk management in the Department has become entrenched in the Department and progress is visible in the management of risks at both Head Office and District levels. This has to a certain extent transmitted into improvements in the Department’s performance. 3. FRAUD AND CORRUPTION The Fraud Prevention Policy and Fraud Prevention Strategy was reviewed in the 2017/18 Financial Year and is valid for a period of three years. The reviewed Policy and Strategy was endorsed by the Risk Management Committee and signed off by the Accounting Officer. These documents outline the process to prevent, detect and investigate reported cases of fraud in the Department. In addition to the above-mentioned documents the Department has an approved Whistle-Blowing Policy which was also reviewed during the 2017/18 Financial Year and is valid for three years. The Whistle-Blowing Policy of the Department complies with the Protected Disclosure Act of 2000 and officials who discloses information of unlawful or corrupt conduct by their employer or fellow officials are protected from occupational detriment, provided the disclosure is made in good faith. The process for disclosure and investigation is outlined in the Policy. Should the investigation reveal that a possible misconduct has occurred, this will be dealt with in terms of the disciplinary procedure as outlined in the Employment of Educators Act (Act 76 of 1998) and/or

89
Annual Report for 2018/19 Financial Year Vote 04: Department of Education
Province of the Northern Cape
88
PART C: GOVERNANCE
Annual Report for 2018/19 Financial Year Vote 04: Department of Education
Province of the Northern Cape
89
1. INTRODUCTION Commitment by the Department to maintain the highest standards of governance is fundamental to the management of public finances and resources. Users want assurance that the Department has good governance structures in place to effectively, efficiently and economically utilize the state resources, which is funded by the tax payer. 2. RISK MANAGEMENT The Risk Management Policy and Risk Management Strategy was reviewed in the 2017/18 Financial Year and is due for review again in 2020/21 financial year. The reviewed Policy and Strategy was endorsed by the Risk Management Committee and approved by the Accounting Officer. The Policy and Strategy outlines the Department’s commitment to implementing and maintaining an effective, efficient and transparent system of risk management. A risk assessment was conducted for the year under review and strategic and operational risk registers, which includes ICT and Fraud risks, were developed for the Department with mitigating controls for all identified risks. A template developed by National Treasury has been implemented for risk owners to identify new and emerging risks which may occur. The 2018/19 Risk Management Implementation Plan which details the risk management activities for the year was approved by the Accounting Officer with the endorsement by the Risk Management Committee. Progress on the annual Risk Management Implementation Plan is reported on quarterly to the Risk Management Committee and the Audit Committee. The 2018/19 Combined Assurance Plan of the Department, which identifies and specifies the sources of assurance over the strategic risks identified during the 2017/18 risk assessment, was developed and jointly approved by the Accounting Officer and Audit Committee Chairperson. The Risk Management Committee, which advises the Accounting Officer and management on overall risk management in the Department, is functional and quarterly meetings are convened and reports are forwarded to the Audit Committee. Reporting on risk management is a standing item on the Audit Committee meeting agenda. The Audit Committee monitors and provides feedback on the effectiveness of risk management in the Department. The Risk Management function was audited by Internal Audit during the year under review. Risk management in the Department has become entrenched in the Department and progress is visible in the management of risks at both Head Office and District levels. This has to a certain extent transmitted into improvements in the Department’s performance. 3. FRAUD AND CORRUPTION The Fraud Prevention Policy and Fraud Prevention Strategy was reviewed in the 2017/18 Financial Year and is valid for a period of three years. The reviewed Policy and Strategy was endorsed by the Risk Management Committee and signed off by the Accounting Officer. These documents outline the process to prevent, detect and investigate reported cases of fraud in the Department. In addition to the above-mentioned documents the Department has an approved Whistle-Blowing Policy which was also reviewed during the 2017/18 Financial Year and is valid for three years. The Whistle-Blowing Policy of the Department complies with the Protected Disclosure Act of 2000 and officials who discloses information of unlawful or corrupt conduct by their employer or fellow officials are protected from occupational detriment, provided the disclosure is made in good faith. The process for disclosure and investigation is outlined in the Policy. Should the investigation reveal that a possible misconduct has occurred, this will be dealt with in terms of the disciplinary procedure as outlined in the Employment of Educators Act (Act 76 of 1998) and/or

90
Annual Report for 2018/19 Financial Year Vote 04: Department of Education
Province of the Northern Cape
90
the Disciplinary Code and Procedures for the Public Service as contained in PSCBC Resolution 1 of 2003. Where there is prima facie evidence of criminal conduct the matter will be reported to the South African Police Service. The 2018/19 Minimum Anti-Corruption Capacity (MACC) Requirements Implementation Plan was approved by the Accounting Officer. The Plan sets out the minimum anti-corruption capacity (MACC) requirements implementation plan for the Department. The multiplicity of supportive actions which are detailed in the document plays a significant part in preventing and combating corruption in the Northern Cape Department of Education. 4. MINIMISING CONFLICT OF INTEREST Conflict of interest is minimised in the Department through the following processes: Annual declaration of financial interests by senior managers through the e-Disclosure system with
100% submission rate for 2017/18 financial disclosures by SMS members. Financial disclosures for other designated categories of employees was introduced which included
employees on salary levels 11 and 12, those earning equivalent to salary levels 11, 12 and 13 through OSD and Finance and SCM employees.
Declaration by senior managers of close family members, partners or associates who have interests in businesses or entities which may transact with the Department.
Declaration of interest by bid specification, bid evaluation and bid adjudication committee members on any bid which is being considered.
Declaration of interest by recruitment and selection panel members in any of the candidates shortlisted or interviewed for a post.
Newly appointed officials are required to sign the Public Service Code of Conduct which is placed on their personnel files.
Supply Chain Management practitioners are required to annually sign a code of conduct where they declare any business, commercial or financial interest which, due to the position they hold, may raise possible conflict of interest.
All service providers / suppliers who submit bids / quotes must complete the Standard Bidding Document (NCP4 - Declaration of interest) to indicate if they know any government official involved in the awarding / evaluation processes of the specific quotation / bid that may constitute a possible conflict of interest.
5. CODE OF CONDUCT The Department of Education uses the general code of conduct prescribed in the Public Service. All employees are issued with a copy of the Public Service Code of Conduct on appointment and are required to adhere to the code at all times in the execution of their official responsibilities. The Code of Conduct is also uploaded on the Department’s Human Resource Management System (HRMS). Any breach of the code of conduct is addressed through the Departmental disciplinary procedures. 6. HEALTH, SAFETY AND ENVIRONMENTAL ISSUES The Health and Safety Committee for the Department has been established and the members have been appointed by the Head of Department. Their responsibilities as members of this Committee include, amongst others, the following: Representing employees’ interests in terms of occupational health and safety; To carry out health and safety inspections of the workplace as designated above prior to the Health
and Safety Committee meetings; Bring to the attention of employer any deviations in respect to health and safety that is brought to
the Committee’s attention; First Aiders and Health and Safety representatives have been appointed by the HOD in November 2015 and are serving on the Health and Safety Committee at Head Office and at District Offices for a period of 3 years, which ended 31 October 2018. New representatives have not yet been appointed.
Annual Report for 2018/19 Financial Year Vote 04: Department of Education
Province of the Northern Cape
91
The Department has an approved Health and Safety Policy and Plan which was first implemented during 2014/15 financial year. This Plan is reviewed annually for implementation. The following activities took place during the year under review: Inspection were conducted monthly and health hazard risks were identified and report compiled
and submitted. Meetings were conducted quarterly. 35 employees were trained on Occupational Health and Safety. 7. PORTFOLIO COMMITTEES Table below reflects the Portfolio Committee meetings that took place in 2018/19 Financial year:
Date Purpose
05 May 2018 2018/19 Annual Performance Plan and MTEF Budget Presentation
06 November 2018 2017/18 Annual Report Presentation to Joint Portfolio Committee and SCOPA meeting
Matters that were raised in the 2017/8 Annual Report Presentation to Joint Portfolio Committee and SCOPA meeting are addressed below under SCOPA Resolutions. 8. SCOPA RESOLUTIONS
Resolution No.
Subject Details Response by the Department
Resolved (Yes/No)
1. Audit Action Plan An audit action plan must be developed detailing how the department is going to address SCOPA Resolutions. Also submit a progress report on implementation by 31 January 2019 and thereafter on a quarterly basis.
The Department’s response to previous SCOPA Resolutions is reflected in pages 89-91 of the 2017/18 Annual Report of the Department. The Department also drafts an audit action plan based on the findings of the Auditor-General and progress is monitored and reported on quarterly to Provincial Treasury, Audit Committee and the Senior Management Team of the Department. The audit action plan of the Department responding to the 2017/18 audit findings of the Auditor-General and which also incorporates SCOPA Resolutions was submitted to SCOPA.
Yes
2. Irregular, Unauthorised and Fruitless and Wasteful Expenditure
The Accounting Officer must submit evidence to the committee on the outcome of the investigation conducted on irregular expenditure, fruitless, wasteful and unauthorised expenditure and progress report to the committee by 31 January 2019.
The root causes of irregular expenditure are investigated to determine the appropriate action to be taken, whether to be condoned or whether disciplinary action should be taken. The Departmental SCM Policy was reviewed and
Yes

91
Annual Report for 2018/19 Financial Year Vote 04: Department of Education
Province of the Northern Cape
90
the Disciplinary Code and Procedures for the Public Service as contained in PSCBC Resolution 1 of 2003. Where there is prima facie evidence of criminal conduct the matter will be reported to the South African Police Service. The 2018/19 Minimum Anti-Corruption Capacity (MACC) Requirements Implementation Plan was approved by the Accounting Officer. The Plan sets out the minimum anti-corruption capacity (MACC) requirements implementation plan for the Department. The multiplicity of supportive actions which are detailed in the document plays a significant part in preventing and combating corruption in the Northern Cape Department of Education. 4. MINIMISING CONFLICT OF INTEREST Conflict of interest is minimised in the Department through the following processes: Annual declaration of financial interests by senior managers through the e-Disclosure system with
100% submission rate for 2017/18 financial disclosures by SMS members. Financial disclosures for other designated categories of employees was introduced which included
employees on salary levels 11 and 12, those earning equivalent to salary levels 11, 12 and 13 through OSD and Finance and SCM employees.
Declaration by senior managers of close family members, partners or associates who have interests in businesses or entities which may transact with the Department.
Declaration of interest by bid specification, bid evaluation and bid adjudication committee members on any bid which is being considered.
Declaration of interest by recruitment and selection panel members in any of the candidates shortlisted or interviewed for a post.
Newly appointed officials are required to sign the Public Service Code of Conduct which is placed on their personnel files.
Supply Chain Management practitioners are required to annually sign a code of conduct where they declare any business, commercial or financial interest which, due to the position they hold, may raise possible conflict of interest.
All service providers / suppliers who submit bids / quotes must complete the Standard Bidding Document (NCP4 - Declaration of interest) to indicate if they know any government official involved in the awarding / evaluation processes of the specific quotation / bid that may constitute a possible conflict of interest.
5. CODE OF CONDUCT The Department of Education uses the general code of conduct prescribed in the Public Service. All employees are issued with a copy of the Public Service Code of Conduct on appointment and are required to adhere to the code at all times in the execution of their official responsibilities. The Code of Conduct is also uploaded on the Department’s Human Resource Management System (HRMS). Any breach of the code of conduct is addressed through the Departmental disciplinary procedures. 6. HEALTH, SAFETY AND ENVIRONMENTAL ISSUES The Health and Safety Committee for the Department has been established and the members have been appointed by the Head of Department. Their responsibilities as members of this Committee include, amongst others, the following: Representing employees’ interests in terms of occupational health and safety; To carry out health and safety inspections of the workplace as designated above prior to the Health
and Safety Committee meetings; Bring to the attention of employer any deviations in respect to health and safety that is brought to
the Committee’s attention; First Aiders and Health and Safety representatives have been appointed by the HOD in November 2015 and are serving on the Health and Safety Committee at Head Office and at District Offices for a period of 3 years, which ended 31 October 2018. New representatives have not yet been appointed.
Annual Report for 2018/19 Financial Year Vote 04: Department of Education
Province of the Northern Cape
91
The Department has an approved Health and Safety Policy and Plan which was first implemented during 2014/15 financial year. This Plan is reviewed annually for implementation. The following activities took place during the year under review: Inspection were conducted monthly and health hazard risks were identified and report compiled
and submitted. Meetings were conducted quarterly. 35 employees were trained on Occupational Health and Safety. 7. PORTFOLIO COMMITTEES Table below reflects the Portfolio Committee meetings that took place in 2018/19 Financial year:
Date Purpose
05 May 2018 2018/19 Annual Performance Plan and MTEF Budget Presentation
06 November 2018 2017/18 Annual Report Presentation to Joint Portfolio Committee and SCOPA meeting
Matters that were raised in the 2017/8 Annual Report Presentation to Joint Portfolio Committee and SCOPA meeting are addressed below under SCOPA Resolutions. 8. SCOPA RESOLUTIONS
Resolution No.
Subject Details Response by the Department
Resolved (Yes/No)
1. Audit Action Plan An audit action plan must be developed detailing how the department is going to address SCOPA Resolutions. Also submit a progress report on implementation by 31 January 2019 and thereafter on a quarterly basis.
The Department’s response to previous SCOPA Resolutions is reflected in pages 89-91 of the 2017/18 Annual Report of the Department. The Department also drafts an audit action plan based on the findings of the Auditor-General and progress is monitored and reported on quarterly to Provincial Treasury, Audit Committee and the Senior Management Team of the Department. The audit action plan of the Department responding to the 2017/18 audit findings of the Auditor-General and which also incorporates SCOPA Resolutions was submitted to SCOPA.
Yes
2. Irregular, Unauthorised and Fruitless and Wasteful Expenditure
The Accounting Officer must submit evidence to the committee on the outcome of the investigation conducted on irregular expenditure, fruitless, wasteful and unauthorised expenditure and progress report to the committee by 31 January 2019.
The root causes of irregular expenditure are investigated to determine the appropriate action to be taken, whether to be condoned or whether disciplinary action should be taken. The Departmental SCM Policy was reviewed and
Yes

92
Annual Report for 2018/19 Financial Year Vote 04: Department of Education
Province of the Northern Cape
92
Resolution No.
Subject Details Response by the Department
Resolved (Yes/No)
proper implementation of the Departmental SCM policy and processes are being monitored to ensure compliance thereof, by both departmental officials and infrastructure implementing agents. Consequence management, where applicable, will be implemented.
3. Consequence Management
Consequence management must be implemented against any official/s liable for incurring irregular, fruitless, wasteful and unauthorised expenditure.
The outcome of investigations, will determine appropriate action to be taken against officials implicated in incurring irregular, fruitless and wasteful expenditure.
Yes
4. Consequence Management
A report must be submitted to the committee by 31 January 2019 on the investigations and disciplinary outcome.
The report on investigations into irregular expenditure was submitted to SCOPA.
Yes
5. Non-Compliance with Supply Chain Management prescripts
The department must review, strengthen and monitor internal control measures to ensure officials rendering services in the supply chain management unit do comply with PFMA and Treasury Regulations.
The Department’s Supply Chain Management Policy was reviewed during the current year and is reviewed annually to bring it in line with changes in the applicable legislation. Checklist is in place to ensure that SCM officials comply with PFMA, Treasury Regulations and SCM prescripts.
Yes
9. PRIOR MODIFICATIONS TO AUDIT REPORTS The Department received an unqualified audit opinion on the 2017/18 Annual Financial Statements. The discussion below relates to matters of non-compliance.
Nature of qualification, disclaimer, adverse opinion and matters of non-compliance
Financial year in which it first
arose
Progress made in clearing / resolving the matter
Payments were not made within 30 days or an agreed period after receipt of an invoice, as required by treasury regulation 8.2.3.
2008/09 Invoice register is maintained to document the date the invoices are received. Invoice register is periodically (preferably weekly) reviewed to ensure that all invoices are paid on time. Financial accounting to ensure that suppliers are paid on time with the aim of reducing the number of creditors’ days. Budget office to ensure that there is a budget for all orders that are issued especially towards year end to avoid unauthorised expenditure. Budget office to ensure that no commitments are made where the budget has been depleted.
Annual Report for 2018/19 Financial Year Vote 04: Department of Education
Province of the Northern Cape
93
Nature of qualification, disclaimer, adverse opinion and matters of non-compliance
Financial year in which it first
arose
Progress made in clearing / resolving the matter
Effective and appropriate steps were not taken to prevent unauthorised expenditure amounting to R246 382 000, as disclosed in note 8 to the annual financial statements, as required by section 38(1)(c)(ii) of the PFMA and treasury regulation 9.1.1.
2016/17 The unauthorised expenditure is largely due educator posts allocated to cater for the increase in learner numbers. The Department implements stringent cost containment measures to mitigate the over-expenditure. Management of excess educators and incapacity leave to alleviate the pressure.
Effective and appropriate steps were not taken to prevent irregular expenditure amounting to R1 659 144 000, as disclosed in note 23 to the annual financial statements, as required by section 38(1)(c)(ii) of the PFMA and treasury regulation 9.1.1. The majority of the irregular expenditure was caused non-compliance with supply chain management requirements.
2013/14 The root causes of irregular expenditure is being investigated to determine the appropriate action. The irregular expenditure that needs to be condoned by relevant authority is being investigated. Review and monitor proper implementation of the departmental SCM policy and processes to ensure compliance thereof, by both departmental officials and implementing agents is being reviewed and monitored. Consequence management where applicable will be implemented
Some of the goods and services with a transaction value below R500 000 were procured without obtaining the required price quotations, as required by treasury regulation 16A6.1. Similar non-compliance was also reported in the prior year.
2008/09 Deviations are approved before orders are placed in line with the approved Financial Delegations.
Some of the goods and services of a transaction value above R500 000 were procured without inviting competitive bids, as required by treasury regulations 16A6.1. Similar non-compliance was also reported in the prior year.
2008/09 Strengthen the process of compiling the annual procurement plan and ensure better planning throughout the organisation.
Some of the contracts and quotations were awarded to bidders based on preference points that were not calculated in accordance with the requirements of the Preferential Procurement Policy Framework Act and its regulations.
2017/18 SCM processes are in place. Audit query on this finding was resolved.
Some of the construction contracts were awarded to contractors did not qualify for the contract in accordance with section 18(1) of the CIDB Act and CIDB regulations 25(7A).
2017/18 Contractor development programme for potentially emerging grades has been developed for implementation.
Bid documentation for procurement of commodities designated for local content and production, did not meet the stipulated minimum threshold for local production and content as required by the 2017 preferential procurement regulation 8(2).
2017/18 Training was requested on the processes and clarity of local content and production.
Some of the IT related goods and services, classified as mandatory, were not procured through SITA as required by treasury regulation 16A6.3(e) and section 7(3) of the SITA Act.
2017/18 SITA has withdrawn the requirement that IT procurement should be done through the gCommerce portal. Engagement with SITA for the condonement of this expenditure.
I was unable to obtain sufficient appropriate audit evidence that disciplinary steps were taken against officials who had incurred unauthorised expenditure, irregular expenditure and fruitless and wasteful expenditure as required by section 38(1)(h)(iii) of the
2017/18 Investigations into these UIF expenditure are being done to determine the appropriate sanction.

93
Annual Report for 2018/19 Financial Year Vote 04: Department of Education
Province of the Northern Cape
92
Resolution No.
Subject Details Response by the Department
Resolved (Yes/No)
proper implementation of the Departmental SCM policy and processes are being monitored to ensure compliance thereof, by both departmental officials and infrastructure implementing agents. Consequence management, where applicable, will be implemented.
3. Consequence Management
Consequence management must be implemented against any official/s liable for incurring irregular, fruitless, wasteful and unauthorised expenditure.
The outcome of investigations, will determine appropriate action to be taken against officials implicated in incurring irregular, fruitless and wasteful expenditure.
Yes
4. Consequence Management
A report must be submitted to the committee by 31 January 2019 on the investigations and disciplinary outcome.
The report on investigations into irregular expenditure was submitted to SCOPA.
Yes
5. Non-Compliance with Supply Chain Management prescripts
The department must review, strengthen and monitor internal control measures to ensure officials rendering services in the supply chain management unit do comply with PFMA and Treasury Regulations.
The Department’s Supply Chain Management Policy was reviewed during the current year and is reviewed annually to bring it in line with changes in the applicable legislation. Checklist is in place to ensure that SCM officials comply with PFMA, Treasury Regulations and SCM prescripts.
Yes
9. PRIOR MODIFICATIONS TO AUDIT REPORTS The Department received an unqualified audit opinion on the 2017/18 Annual Financial Statements. The discussion below relates to matters of non-compliance.
Nature of qualification, disclaimer, adverse opinion and matters of non-compliance
Financial year in which it first
arose
Progress made in clearing / resolving the matter
Payments were not made within 30 days or an agreed period after receipt of an invoice, as required by treasury regulation 8.2.3.
2008/09 Invoice register is maintained to document the date the invoices are received. Invoice register is periodically (preferably weekly) reviewed to ensure that all invoices are paid on time. Financial accounting to ensure that suppliers are paid on time with the aim of reducing the number of creditors’ days. Budget office to ensure that there is a budget for all orders that are issued especially towards year end to avoid unauthorised expenditure. Budget office to ensure that no commitments are made where the budget has been depleted.
Annual Report for 2018/19 Financial Year Vote 04: Department of Education
Province of the Northern Cape
93
Nature of qualification, disclaimer, adverse opinion and matters of non-compliance
Financial year in which it first
arose
Progress made in clearing / resolving the matter
Effective and appropriate steps were not taken to prevent unauthorised expenditure amounting to R246 382 000, as disclosed in note 8 to the annual financial statements, as required by section 38(1)(c)(ii) of the PFMA and treasury regulation 9.1.1.
2016/17 The unauthorised expenditure is largely due educator posts allocated to cater for the increase in learner numbers. The Department implements stringent cost containment measures to mitigate the over-expenditure. Management of excess educators and incapacity leave to alleviate the pressure.
Effective and appropriate steps were not taken to prevent irregular expenditure amounting to R1 659 144 000, as disclosed in note 23 to the annual financial statements, as required by section 38(1)(c)(ii) of the PFMA and treasury regulation 9.1.1. The majority of the irregular expenditure was caused non-compliance with supply chain management requirements.
2013/14 The root causes of irregular expenditure is being investigated to determine the appropriate action. The irregular expenditure that needs to be condoned by relevant authority is being investigated. Review and monitor proper implementation of the departmental SCM policy and processes to ensure compliance thereof, by both departmental officials and implementing agents is being reviewed and monitored. Consequence management where applicable will be implemented
Some of the goods and services with a transaction value below R500 000 were procured without obtaining the required price quotations, as required by treasury regulation 16A6.1. Similar non-compliance was also reported in the prior year.
2008/09 Deviations are approved before orders are placed in line with the approved Financial Delegations.
Some of the goods and services of a transaction value above R500 000 were procured without inviting competitive bids, as required by treasury regulations 16A6.1. Similar non-compliance was also reported in the prior year.
2008/09 Strengthen the process of compiling the annual procurement plan and ensure better planning throughout the organisation.
Some of the contracts and quotations were awarded to bidders based on preference points that were not calculated in accordance with the requirements of the Preferential Procurement Policy Framework Act and its regulations.
2017/18 SCM processes are in place. Audit query on this finding was resolved.
Some of the construction contracts were awarded to contractors did not qualify for the contract in accordance with section 18(1) of the CIDB Act and CIDB regulations 25(7A).
2017/18 Contractor development programme for potentially emerging grades has been developed for implementation.
Bid documentation for procurement of commodities designated for local content and production, did not meet the stipulated minimum threshold for local production and content as required by the 2017 preferential procurement regulation 8(2).
2017/18 Training was requested on the processes and clarity of local content and production.
Some of the IT related goods and services, classified as mandatory, were not procured through SITA as required by treasury regulation 16A6.3(e) and section 7(3) of the SITA Act.
2017/18 SITA has withdrawn the requirement that IT procurement should be done through the gCommerce portal. Engagement with SITA for the condonement of this expenditure.
I was unable to obtain sufficient appropriate audit evidence that disciplinary steps were taken against officials who had incurred unauthorised expenditure, irregular expenditure and fruitless and wasteful expenditure as required by section 38(1)(h)(iii) of the
2017/18 Investigations into these UIF expenditure are being done to determine the appropriate sanction.

94
Annual Report for 2018/19 Financial Year Vote 04: Department of Education
Province of the Northern Cape
94
Nature of qualification, disclaimer, adverse opinion and matters of non-compliance
Financial year in which it first
arose
Progress made in clearing / resolving the matter
PFMA. This was due to proper and complete records that were not maintained as evidence to support the investigations into expenditure.
10. INTERNAL CONTROL UNIT Internal control located in Financial Management reviews payment batches to ensure that there is compliance with the relevant prescripts. 11. INTERNAL AUDIT AND AUDIT COMMITTEES The Northern Cape Provincial Treasury established the shared internal audit function. The function was established in terms of section 38(1)a()(i) and section 76(4)(e) of the Public Finance Management Act (PFMA) as a shared function for the Northern Cape Provincial Administration, and in terms of paragraph 3.2.3. of the Treasury Regulations. The unit fulfils an independent assurance and consulting function. The internal audit unit follows a risk-based audit approach in providing management and the audit committee with assurance on the adequacy and effectiveness of governance, risk management, and internal control processes. The internal audit function is guided by an internal audit charter, approved by the audit committee and performs its functions as provided for in the PFMA and the internal audit charter. The internal audit unit compiles a rolling three-year risk-based internal audit plan and prepares an annual internal audit plan after taking into consideration the risks faced by the department, strategic objectives, the department’s mandate, audit issues and inputs by management. The audit committee approves the internal audit plan for implementation. The internal audit reviews performed for the financial year under review, were all in line with the approved annual internal audit plan and are detailed in the audit committee annual report. Internal audit findings were communicated timely to management and measures to mitigate the risks were implemented. Significant matters identified during the year were reported to the audit committee. Audit Committee members and attendance Throughout the year under review, the audit committee operated in terms of an approved audit committee charter, which was the committee’s approved terms of reference. The audit committee comprised of three external members and two internal members, all of whom are not employed by the department. The audit committee has, as part of its oversight responsibility on a quarterly basis, followed up on audit findings to ensure that issues raised were addressed timely. Further information relating to the audit committee, as required by the PFMA and Treasury Regulations is included in the audit committee’s report, which is incorporated in the annual report of the entity.
Annual Report for 2018/19 Financial Year Vote 04: Department of Education
Province of the Northern Cape
95
The audit committee members were appointed on a 3-year term with effect from 1 December 2017. The audit committee comprises of five members in total. One internal member resigned and was replaced on 1 April 2019. The audit committee consisted of the members listed hereunder and met five times as per its approved meeting schedule:
Name Qualifications Internal or external
If internal, position in the department
Date appointed
Date Resigned
No. of Meetings attended
Ms M Mbonambi
Bachelor of Accountancy B.Com Honours Certificate in Risk Management and Certificate in Board Governance
External n/a 01 December 2017
n/a 04
Ms A Mafuleka CA (SA) B Com – Honours
External n/a 01 December 2017
n/a 04
Mr VA Makaleni Master in Public Management Bachelor of Commerce (Accounting) Postgraduate Diploma in Corporate Governance Management Advancement Programme (MAP)
External n/a 01 December 2014
n/a 05
Ms Vallabh Bachelor of Arts Post Graduate Diploma in Library and Information Science Certificate Programme in Public Service Management
Internal Chief Director: Performance, Monitoring and Evaluations (OTP)
01 December 2017
n/a 02
Vacant Vacant Vacant Vacant Vacant Vacant Vacant During the year under review the Committee consistently engaged with the senior management of the Department, Internal Audit and the Auditor–General, individually and collectively, to address risks and challenges facing the department.

95
Annual Report for 2018/19 Financial Year Vote 04: Department of Education
Province of the Northern Cape
94
Nature of qualification, disclaimer, adverse opinion and matters of non-compliance
Financial year in which it first
arose
Progress made in clearing / resolving the matter
PFMA. This was due to proper and complete records that were not maintained as evidence to support the investigations into expenditure.
10. INTERNAL CONTROL UNIT Internal control located in Financial Management reviews payment batches to ensure that there is compliance with the relevant prescripts. 11. INTERNAL AUDIT AND AUDIT COMMITTEES The Northern Cape Provincial Treasury established the shared internal audit function. The function was established in terms of section 38(1)a()(i) and section 76(4)(e) of the Public Finance Management Act (PFMA) as a shared function for the Northern Cape Provincial Administration, and in terms of paragraph 3.2.3. of the Treasury Regulations. The unit fulfils an independent assurance and consulting function. The internal audit unit follows a risk-based audit approach in providing management and the audit committee with assurance on the adequacy and effectiveness of governance, risk management, and internal control processes. The internal audit function is guided by an internal audit charter, approved by the audit committee and performs its functions as provided for in the PFMA and the internal audit charter. The internal audit unit compiles a rolling three-year risk-based internal audit plan and prepares an annual internal audit plan after taking into consideration the risks faced by the department, strategic objectives, the department’s mandate, audit issues and inputs by management. The audit committee approves the internal audit plan for implementation. The internal audit reviews performed for the financial year under review, were all in line with the approved annual internal audit plan and are detailed in the audit committee annual report. Internal audit findings were communicated timely to management and measures to mitigate the risks were implemented. Significant matters identified during the year were reported to the audit committee. Audit Committee members and attendance Throughout the year under review, the audit committee operated in terms of an approved audit committee charter, which was the committee’s approved terms of reference. The audit committee comprised of three external members and two internal members, all of whom are not employed by the department. The audit committee has, as part of its oversight responsibility on a quarterly basis, followed up on audit findings to ensure that issues raised were addressed timely. Further information relating to the audit committee, as required by the PFMA and Treasury Regulations is included in the audit committee’s report, which is incorporated in the annual report of the entity.
Annual Report for 2018/19 Financial Year Vote 04: Department of Education
Province of the Northern Cape
95
The audit committee members were appointed on a 3-year term with effect from 1 December 2017. The audit committee comprises of five members in total. One internal member resigned and was replaced on 1 April 2019. The audit committee consisted of the members listed hereunder and met five times as per its approved meeting schedule:
Name Qualifications Internal or external
If internal, position in the department
Date appointed
Date Resigned
No. of Meetings attended
Ms M Mbonambi
Bachelor of Accountancy B.Com Honours Certificate in Risk Management and Certificate in Board Governance
External n/a 01 December 2017
n/a 04
Ms A Mafuleka CA (SA) B Com – Honours
External n/a 01 December 2017
n/a 04
Mr VA Makaleni Master in Public Management Bachelor of Commerce (Accounting) Postgraduate Diploma in Corporate Governance Management Advancement Programme (MAP)
External n/a 01 December 2014
n/a 05
Ms Vallabh Bachelor of Arts Post Graduate Diploma in Library and Information Science Certificate Programme in Public Service Management
Internal Chief Director: Performance, Monitoring and Evaluations (OTP)
01 December 2017
n/a 02
Vacant Vacant Vacant Vacant Vacant Vacant Vacant During the year under review the Committee consistently engaged with the senior management of the Department, Internal Audit and the Auditor–General, individually and collectively, to address risks and challenges facing the department.

96
Annual Report for 2018/19 Financial Year Vote 04: Department of Education
Province of the Northern Cape
96
12. AUDIT COMMITTEE REPORT We are pleased to present the audit committee report of the Northern Cape Department of Education for the financial year ended 31 March 2019. Audit Committee Responsibility The audit committee reports that it has complied with its responsibilities arising from Section 38(1)(a)(ii) of the Public Finance Management Act and Treasury Regulation 3.1.13. The audit committee further reports that it has adopted appropriate formal terms of reference as its audit committee charter, has regulated its affairs in compliance with this charter and has discharged all its responsibilities as contained therein. The Effectiveness of Internal Control Our review of the findings of the internal audit work, which was based on the risk assessments conducted in the department revealed certain weaknesses, which were raised with the department.The following internal audit work was completed during the year under review:
Review of the Annual Financial Statements Review of the Interim Financial Statements Quarterly review on Performance Information Quarterly follow-up audits Asset Management (Mobile Classrooms) Ethics Management Risk Management Fraud Risk Management Learner Transport Learner’s with Severe and Profound Intellectual Disability Grant Information Technology Systems review (assessment of the IT governance systems) Management Assessment Performance Tool
The following were raised as areas of concern:
Review of interim and annual financial statements o The increase in irregular expenditure, unauthorised expenditure and fruitless
and wasteful expenditure. Asset management - mobile classrooms
o It was difficult to perform the existence of the mobile classrooms Fraud Risk Management
o Inadequate IT controls and financial controls have increased the possibility of the risk of fraud due to inadequate segregation of duties
Learner transport o Inherited irregular expenditure contracts from the transferring department
resulting in increase of irregular expenditure. Learner with severe and profound intellectual disability grant
o Learning programmes not followed and implemented o Care centres not registered with the relevant departments. o Capacity within the section to monitor and implement the grant conditions.
The internal audit activity also maintains the combined assurance framework which was developed in collaboration with the departmental risk management unit and the Auditor-
Annual Report for 2018/19 Financial Year Vote 04: Department of Education
Province of the Northern Cape
97
General. This collaboration proved useful and effective in ensuring combined effort in all identified high risk areas to ensure that risks were addressed and brought to an acceptable level. In addition, management developed an audit action plan to address the findings raised by both the Auditor-General and Internal audit. The audit committee monitored the implementation of the plan during the year under review, including the implementation of the audit committee’s recommendation. In-Year Management and Monthly/Quarterly Report The Department reported monthly and quarterly to the Provincial Treasury as is required by the PFMA. Evaluation of Financial Statements The audit committee has:
reviewed and discussed the audited annual financial statements to be included in the annual report, with the Auditor-General South Africa (AGSA) and the Accounting Officer;
reviewed significant adjustments resulting from the audit. reviewed the AGSA audit report; reviewed the AGSA management report and management’s responses thereto; reviewed the department’s compliance with legal and regulatory provisions.
Auditor General’s Report The AGSA’s report was reviewed and the audit committee noted with concern that the department has regressed from the previous year’s unqualified audit to a qualified audit opinion in the financial year 2018/19. The regression emanated from immovable capital assets that were not recognised in accordance with the modified cash standard. The audit committee concurs and accepts the conclusions of the Auditor-General on the annual financial statements and is of the opinion that the audited annual financial statements be accepted and read together with the report of the Auditor-General.
Ms M Mbonambi Chairperson of the Audit Committee 31 July 2019

97
Annual Report for 2018/19 Financial Year Vote 04: Department of Education
Province of the Northern Cape
96
12. AUDIT COMMITTEE REPORT We are pleased to present the audit committee report of the Northern Cape Department of Education for the financial year ended 31 March 2019. Audit Committee Responsibility The audit committee reports that it has complied with its responsibilities arising from Section 38(1)(a)(ii) of the Public Finance Management Act and Treasury Regulation 3.1.13. The audit committee further reports that it has adopted appropriate formal terms of reference as its audit committee charter, has regulated its affairs in compliance with this charter and has discharged all its responsibilities as contained therein. The Effectiveness of Internal Control Our review of the findings of the internal audit work, which was based on the risk assessments conducted in the department revealed certain weaknesses, which were raised with the department.The following internal audit work was completed during the year under review:
Review of the Annual Financial Statements Review of the Interim Financial Statements Quarterly review on Performance Information Quarterly follow-up audits Asset Management (Mobile Classrooms) Ethics Management Risk Management Fraud Risk Management Learner Transport Learner’s with Severe and Profound Intellectual Disability Grant Information Technology Systems review (assessment of the IT governance systems) Management Assessment Performance Tool
The following were raised as areas of concern:
Review of interim and annual financial statements o The increase in irregular expenditure, unauthorised expenditure and fruitless
and wasteful expenditure. Asset management - mobile classrooms
o It was difficult to perform the existence of the mobile classrooms Fraud Risk Management
o Inadequate IT controls and financial controls have increased the possibility of the risk of fraud due to inadequate segregation of duties
Learner transport o Inherited irregular expenditure contracts from the transferring department
resulting in increase of irregular expenditure. Learner with severe and profound intellectual disability grant
o Learning programmes not followed and implemented o Care centres not registered with the relevant departments. o Capacity within the section to monitor and implement the grant conditions.
The internal audit activity also maintains the combined assurance framework which was developed in collaboration with the departmental risk management unit and the Auditor-
Annual Report for 2018/19 Financial Year Vote 04: Department of Education
Province of the Northern Cape
97
General. This collaboration proved useful and effective in ensuring combined effort in all identified high risk areas to ensure that risks were addressed and brought to an acceptable level. In addition, management developed an audit action plan to address the findings raised by both the Auditor-General and Internal audit. The audit committee monitored the implementation of the plan during the year under review, including the implementation of the audit committee’s recommendation. In-Year Management and Monthly/Quarterly Report The Department reported monthly and quarterly to the Provincial Treasury as is required by the PFMA. Evaluation of Financial Statements The audit committee has:
reviewed and discussed the audited annual financial statements to be included in the annual report, with the Auditor-General South Africa (AGSA) and the Accounting Officer;
reviewed significant adjustments resulting from the audit. reviewed the AGSA audit report; reviewed the AGSA management report and management’s responses thereto; reviewed the department’s compliance with legal and regulatory provisions.
Auditor General’s Report The AGSA’s report was reviewed and the audit committee noted with concern that the department has regressed from the previous year’s unqualified audit to a qualified audit opinion in the financial year 2018/19. The regression emanated from immovable capital assets that were not recognised in accordance with the modified cash standard. The audit committee concurs and accepts the conclusions of the Auditor-General on the annual financial statements and is of the opinion that the audited annual financial statements be accepted and read together with the report of the Auditor-General.
Ms M Mbonambi Chairperson of the Audit Committee 31 July 2019

98
Annual Report for 2018/19 Financial Year Vote 04: Department of Education
Province of the Northern Cape
98
PART D: HUMAN RESOURCE MANAGEMENT
Annual Report for 2018/19 Financial Year Vote 04: Department of Education
Province of the Northern Cape
99
1. INTRODUCTION
The information contained in this part of the annual report has been prescribed by the Minister for the Public Service and Administration for all departments in the public service and in line with the under-mentioned policy mandates: Public Service Regulations (Chapter 1, Part III J.3 and J.4). Basic Conditions of Employment Act, 1997 (Act 75 of 1997), Labour Relations Act, 1995 (Act 66 of 1995), Employment Equity Act, 1998 (Act 55 of 1998), Occupational Health and Safety Act, 1993 (Act 85 of 1993), Compensation for Occupational Injuries and Diseases Act, 1993 (Act 130 of 1993), Government Employees Pension Law, 1996 (Proclamation 21 of 1996), Employment of Educators Act, 1998 (Act 76 of 1998), Public Service Act, 1994 (Proclamation 103 of 1994), and Constitution of the Republic of South Africa, 1996, Skills Development Act, 1998 (Act 97 of 1998) Promotion of Equality and Prevention of Unfair Discrimination Act, 2000 (Act 4 of 2000), Promotion of Access to Information Act, 2000 (Act 2 of 2000), Promotion of Administrative Justice Act, 2000 (Act 3 of 2000).
2. OVERVIEW OF HUMAN RESOURCES
The status of human resources in the Department The Chief Directorate Human Resource Management and Development comprises of five Directorates namely: Human Resource Practices and Administration, Employee Relations and People Management, Human Resource Planning, Provisioning and Persal Management, Human Resource Utilisation and Capacity Development and Service Delivery and Transformation. The work of the chief directorate was centred around the capacitation of internal HR systems and processes to enhance the quality of support provided to clients. Efforts were also made to ensure the capacitation and strengthening of the five district offices to ensure effective service delivery.
Workforce planning and key strategies to attract a skilled and capable workforce The implementation of the approved organisational structure continues to be a matter of priority both in Head Office and the District Offices as it pertains to the matching and placement of staff. The aim of the matching and placement process is to ensure that existing staff are placed in posts that would best fit their skills, qualifications and appropriate experience. The Department is further engaged in a national project to update and correct educator profiles on the personnel administration system. The human resource priorities as encapsulated in the Human Resource Plan of the Department focused on the following sector priorities:
o Early Childhood Development: The focus was on the development of conditions of service for ECD practitioners to attract and retain staff. The Department liaised with the Department of Basic Education on the project.
o Inclusive Education: The staff establishments of LSEN schools for the second time this year was run on a separate model from the staff establishments of public ordinary schools. This development ensured that special school received favourable allocations to support learners with special needs and barriers to learning.

99
Annual Report for 2018/19 Financial Year Vote 04: Department of Education
Province of the Northern Cape
98
PART D: HUMAN RESOURCE MANAGEMENT
Annual Report for 2018/19 Financial Year Vote 04: Department of Education
Province of the Northern Cape
99
1. INTRODUCTION
The information contained in this part of the annual report has been prescribed by the Minister for the Public Service and Administration for all departments in the public service and in line with the under-mentioned policy mandates: Public Service Regulations (Chapter 1, Part III J.3 and J.4). Basic Conditions of Employment Act, 1997 (Act 75 of 1997), Labour Relations Act, 1995 (Act 66 of 1995), Employment Equity Act, 1998 (Act 55 of 1998), Occupational Health and Safety Act, 1993 (Act 85 of 1993), Compensation for Occupational Injuries and Diseases Act, 1993 (Act 130 of 1993), Government Employees Pension Law, 1996 (Proclamation 21 of 1996), Employment of Educators Act, 1998 (Act 76 of 1998), Public Service Act, 1994 (Proclamation 103 of 1994), and Constitution of the Republic of South Africa, 1996, Skills Development Act, 1998 (Act 97 of 1998) Promotion of Equality and Prevention of Unfair Discrimination Act, 2000 (Act 4 of 2000), Promotion of Access to Information Act, 2000 (Act 2 of 2000), Promotion of Administrative Justice Act, 2000 (Act 3 of 2000).
2. OVERVIEW OF HUMAN RESOURCES
The status of human resources in the Department The Chief Directorate Human Resource Management and Development comprises of five Directorates namely: Human Resource Practices and Administration, Employee Relations and People Management, Human Resource Planning, Provisioning and Persal Management, Human Resource Utilisation and Capacity Development and Service Delivery and Transformation. The work of the chief directorate was centred around the capacitation of internal HR systems and processes to enhance the quality of support provided to clients. Efforts were also made to ensure the capacitation and strengthening of the five district offices to ensure effective service delivery.
Workforce planning and key strategies to attract a skilled and capable workforce The implementation of the approved organisational structure continues to be a matter of priority both in Head Office and the District Offices as it pertains to the matching and placement of staff. The aim of the matching and placement process is to ensure that existing staff are placed in posts that would best fit their skills, qualifications and appropriate experience. The Department is further engaged in a national project to update and correct educator profiles on the personnel administration system. The human resource priorities as encapsulated in the Human Resource Plan of the Department focused on the following sector priorities:
o Early Childhood Development: The focus was on the development of conditions of service for ECD practitioners to attract and retain staff. The Department liaised with the Department of Basic Education on the project.
o Inclusive Education: The staff establishments of LSEN schools for the second time this year was run on a separate model from the staff establishments of public ordinary schools. This development ensured that special school received favourable allocations to support learners with special needs and barriers to learning.

100
Annual Report for 2018/19 Financial Year Vote 04: Department of Education
Province of the Northern Cape
100
o The Integrated Farm and Small School Strategy: The strategy was approved in January 2014. The Department consistently ensured through appropriate allocations that no rural or farm schools are one-person schools. The continued payment of the rural incentive to PL1 educators further enhanced the efforts of the Department to retain educators with the necessary qualifications and experience in farm and rural schools.
Employee performance management The SMS PMDS Process is viewed as a vital tool which among others, is aimed at:
Translating broader departmental strategic priorities into clear performance milestones for each senior manager.
Further to this, the department, through proper implementation of the Provincial EPMDS Policy for levels 2- 12, creates a basis for ongoing monitoring of performance and providing feedback.
Employee wellness programme All four Employee Health and wellness operational plans as per the DPSA requirements were developed and implemented in the year under review. Several wellness initiatives were implemented successfully such as training on financial wellness, health and wellness sessions, periodic inspections to assess the severity and scope of hazards in the working environment, including the mitigation thereof. Achievements and challenges faced by the department, as well as future human resource plans /goals. In the year under review the Chief Directorate performed fairly well considering the inherent service delivery challenges in the sector. The Department successfully issued all public ordinary and special schools with their 2019 staff establishments by August 2018. This is a huge achievement as the establishments were issued a month in advance of the required date. The Department continues to experience challenges with regards to educators exiting the system for various reasons. However, in an effort to curb that and to stabilise employment in the sector, the Department contracted all temporary educators for a full year and provided these educators with the opportunity to access full service benefits. Furthermore the signing of two key ELRC Collective Agreements namely CA 2 of 2018, led to the amendment of paragraph B8.5.2.and B8.5.3 of the PAM in relation to the re-appointment of educators with a break in-service. This collective agreement has also brought a bit of stability to the sector in curbing or reducing the rate of resignations. Also ELRC CA 4 of 2018 which deals with Conversion of temporary educators to permanent in terms of promoting employment security and stability in the sector. The department was faced with following key challenges that impacted on the effective and efficient response to our core mandate:
The impact of the Provincial Moratorium on the filling of posts especially the filling of absolutely critical posts i.e. Subject Advisers and Coordinators, School Based Support Staff posts,
The struggle to attract and retain candidates in the Infrastructure and Therapist environment (IEG Grant and LSPID Grant).
In terms of collective bargaining the unit managed to achieve 100% compliance with regards to the performance of the Northern Cape Provincial Chamber of the Education Labour Relations Council and therefore promoting labour peace in the sector. The Chief Directorate also managed to reduce the number of disputes lodged by employees as well as ensuring that grievances were addressed promptly and adequately within the required timeframes.
Annual Report for 2018/19 Financial Year Vote 04: Department of Education
Province of the Northern Cape
101
3. HUMAN RESOURCES OVERSIGHT STATISTICS
3.1. Personnel related expenditure
The following tables summarises the final audited personnel related expenditure by programme and by salary bands. In particular, it provides an indication of the following: amount spent on personnel amount spent on salaries, overtime, homeowner’s allowances and medical aid.
Programme Programme Designation
Programme 1 Administration Programme 2 Public ordinary school education Programme 4 Public special school education Programme 5 Early childhood development Programme 6 Infrastructure development Programme 7 Examination & education related services
The following tables summarises the final audited personnel related expenditure by programme and by salary bands. In particular, it provides an indication of the following: amount spent on personnel amount spent on salaries, overtime, homeowner’s allowances and medical aid. Table 3.1.1 Personnel expenditure by programme for the period 1 April 2018 and 31 March 2019
* Training includes training and development and bursaries *Average personnel cost is based on average personnel numbers per month and is inclusive of 780 abnormal appointments
Table 3.1.2 Personnel costs by salary band for the period 1 April 2018 and 31 March 2019
Salary band Personnel
expenditure (R’000)
% of total personnel cost
No. of employees
Average personnel cost per employee
(R’000) Lower skilled (Levels 1-2) 131 121 2.65% 876 151 Skilled (level 3-5) 498 755 10.08% 2467 203 Highly skilled production (levels 6-8) 2 800 052 56.59% 7847 359
Programme Total
expenditure
Personnel expenditure
Training expenditure
Professional and special
services expendit
ure
Personnel expenditure
as a % of total
expenditure
Average personnel cost per
employee)
Number of employees
(R’000) (R’000) (R’000) (R’000) (R’000) Programme 1 663 746 474 166 3 382 71.4% 478.0 992 Programme 2 4 797 563 4 171 930 183 87.0% 387.4 10 768
Programme 3 9 599 - - -
Programme 4 160 585 139 205 117 86.7% 360.6 386 Programme 5 98 461 79 233 - 80.5% 110.8 715 Programme 6 567 898 20 875 21 3.7% 485.5 43 Programme 7 157 833 62 554 4 034 39.6% 453.3 138 Total 6 455 685 4 947 963 7 737 76.6% 379.4 13 042

101
Annual Report for 2018/19 Financial Year Vote 04: Department of Education
Province of the Northern Cape
100
o The Integrated Farm and Small School Strategy: The strategy was approved in January 2014. The Department consistently ensured through appropriate allocations that no rural or farm schools are one-person schools. The continued payment of the rural incentive to PL1 educators further enhanced the efforts of the Department to retain educators with the necessary qualifications and experience in farm and rural schools.
Employee performance management The SMS PMDS Process is viewed as a vital tool which among others, is aimed at:
Translating broader departmental strategic priorities into clear performance milestones for each senior manager.
Further to this, the department, through proper implementation of the Provincial EPMDS Policy for levels 2- 12, creates a basis for ongoing monitoring of performance and providing feedback.
Employee wellness programme All four Employee Health and wellness operational plans as per the DPSA requirements were developed and implemented in the year under review. Several wellness initiatives were implemented successfully such as training on financial wellness, health and wellness sessions, periodic inspections to assess the severity and scope of hazards in the working environment, including the mitigation thereof. Achievements and challenges faced by the department, as well as future human resource plans /goals. In the year under review the Chief Directorate performed fairly well considering the inherent service delivery challenges in the sector. The Department successfully issued all public ordinary and special schools with their 2019 staff establishments by August 2018. This is a huge achievement as the establishments were issued a month in advance of the required date. The Department continues to experience challenges with regards to educators exiting the system for various reasons. However, in an effort to curb that and to stabilise employment in the sector, the Department contracted all temporary educators for a full year and provided these educators with the opportunity to access full service benefits. Furthermore the signing of two key ELRC Collective Agreements namely CA 2 of 2018, led to the amendment of paragraph B8.5.2.and B8.5.3 of the PAM in relation to the re-appointment of educators with a break in-service. This collective agreement has also brought a bit of stability to the sector in curbing or reducing the rate of resignations. Also ELRC CA 4 of 2018 which deals with Conversion of temporary educators to permanent in terms of promoting employment security and stability in the sector. The department was faced with following key challenges that impacted on the effective and efficient response to our core mandate:
The impact of the Provincial Moratorium on the filling of posts especially the filling of absolutely critical posts i.e. Subject Advisers and Coordinators, School Based Support Staff posts,
The struggle to attract and retain candidates in the Infrastructure and Therapist environment (IEG Grant and LSPID Grant).
In terms of collective bargaining the unit managed to achieve 100% compliance with regards to the performance of the Northern Cape Provincial Chamber of the Education Labour Relations Council and therefore promoting labour peace in the sector. The Chief Directorate also managed to reduce the number of disputes lodged by employees as well as ensuring that grievances were addressed promptly and adequately within the required timeframes.
Annual Report for 2018/19 Financial Year Vote 04: Department of Education
Province of the Northern Cape
101
3. HUMAN RESOURCES OVERSIGHT STATISTICS
3.1. Personnel related expenditure
The following tables summarises the final audited personnel related expenditure by programme and by salary bands. In particular, it provides an indication of the following: amount spent on personnel amount spent on salaries, overtime, homeowner’s allowances and medical aid.
Programme Programme Designation
Programme 1 Administration Programme 2 Public ordinary school education Programme 4 Public special school education Programme 5 Early childhood development Programme 6 Infrastructure development Programme 7 Examination & education related services
The following tables summarises the final audited personnel related expenditure by programme and by salary bands. In particular, it provides an indication of the following: amount spent on personnel amount spent on salaries, overtime, homeowner’s allowances and medical aid. Table 3.1.1 Personnel expenditure by programme for the period 1 April 2018 and 31 March 2019
* Training includes training and development and bursaries *Average personnel cost is based on average personnel numbers per month and is inclusive of 780 abnormal appointments
Table 3.1.2 Personnel costs by salary band for the period 1 April 2018 and 31 March 2019
Salary band Personnel
expenditure (R’000)
% of total personnel cost
No. of employees
Average personnel cost per employee
(R’000) Lower skilled (Levels 1-2) 131 121 2.65% 876 151 Skilled (level 3-5) 498 755 10.08% 2467 203 Highly skilled production (levels 6-8) 2 800 052 56.59% 7847 359
Programme Total
expenditure
Personnel expenditure
Training expenditure
Professional and special
services expendit
ure
Personnel expenditure
as a % of total
expenditure
Average personnel cost per
employee)
Number of employees
(R’000) (R’000) (R’000) (R’000) (R’000) Programme 1 663 746 474 166 3 382 71.4% 478.0 992 Programme 2 4 797 563 4 171 930 183 87.0% 387.4 10 768
Programme 3 9 599 - - -
Programme 4 160 585 139 205 117 86.7% 360.6 386 Programme 5 98 461 79 233 - 80.5% 110.8 715 Programme 6 567 898 20 875 21 3.7% 485.5 43 Programme 7 157 833 62 554 4 034 39.6% 453.3 138 Total 6 455 685 4 947 963 7 737 76.6% 379.4 13 042

102
Annual Report for 2018/19 Financial Year Vote 04: Department of Education
Province of the Northern Cape
102
Salary band Personnel
expenditure (R’000)
% of total personnel cost
No. of employees
Average personnel cost per employee
(R’000) Highly skilled supervision (levels 9-12) 1 406 211 28.42% 2403 588
Senior and Top management (levels 13-16) 45 521 0.92% 38 1 206
Abnormal 65 808 1.33% 937 71 Total 4 947 963 100,00% 14 568 341
Table 3.1.3 Salaries, Overtime, Home Owners Allowance and Medical Aid by programme for the period 1 April 2018 and 31 March 2019
Programme
Salaries Overtime Home Owners Allowance
Medical Aid
Amount (R’000
Salaries as a % of personnel
costs
Amount (R’000)
Overtime as a % of personnel
costs
Amount (R’000)
HOA as a % of
personnel costs
Amount (R’000)
Medical aid as a
% of personnel
costs Programme 1 337 135 6,78% 573 0,01% 11 606 0,23% 20 811 0,42%
Programme 2 3 108 334 62,52% 755 0,02% 115 418 2,32% 173 230 3,48%
Programme 4 100 494 2,02% 335 0,01% 4 349 0,09% 7 383 0,15%
Programme 5 14 475 0,29% - - 440 0,01% 836 0,02%
Programme 6 15 862 0,32% 10 - 373 0,01% 484 0,01%
Programme 7 45 692 0,92% 1 628 0,03% 1 619 0,03% 3 033 0,06%
Total 3 621 991 72,85% 3 301 0,07% 133 805 2,69% 205 777 4,14%
Table 3.1.4 Salaries, Overtime, Home Owners Allowance and Medical Aid by salary band for the period 1 April 2018 and 31 March 2019
Salaries Overtime Home Owners
Allowance Medical Aid Salary band
Amount (R’000
Salaries as a % of personne
l costs
Amount
(R’000)
Overtime as a % of personne
l costs
Amount
(R’000)
HOA as a % of
personnel costs
Amount
(R’000)
Medical aid as a
% of personne
l costs
Skilled (level 1-2) 90 688 1.83% 352 0.01% 11 508 0.23% 8 886 0.18%
Skilled (level 3-5) 362 987 7.34% 1 424 0.03% 20 982 0.42% 25 807 0.52%
Highly skilled production (levels 6-8)
2094987 42.34% 667 0.01% 73 140 1.48% 119 018 2.41%
Highly skilled supervision (levels 9-12
1043120 21.08% 858 0.02% 28 165 0.57% 51 678 1.04%
Annual Report for 2018/19 Financial Year Vote 04: Department of Education
Province of the Northern Cape
103
Salaries Overtime Home Owners
Allowance Medical Aid Salary band
Amount (R’000
Salaries as a % of personne
l costs
Amount
(R’000)
Overtime as a % of personne
l costs
Amount
(R’000)
HOA as a % of
personnel costs
Amount
(R’000)
Medical aid as a
% of personne
l costs
Senior management (level 13-16)
27 990 0.57% - - - - 385 0.01%
Abnormal 2 219 0.04% - - 9 0.00% 4 0.00%
Total 3 621 991 73.20% 3 301 0.07% 133 804 2.70% 205 778 4.16%
3.2. Employment and Vacancies
The tables in this section summarise the position with regard to employment and vacancies.
The following tables summarise the number of posts on the establishment, the number of employees, the vacancy rate, and whether there are any staff that are additional to the establishment. This information is presented in terms of three key variables: programme salary band critical occupations (see definition in notes below).
Departments have identified critical occupations that need to be monitored. In terms of current regulations, it is possible to create a post on the establishment that can be occupied by more than one employee. Therefore, the vacancy rate reflects the percentage of posts that are not filled.
Table 3.2.1 Employment and vacancies by programme as on 31 March 2019
Pers
onne
l G
roup
Programme Number of
funded posts
Number of
unfunded posts
Number of
posts filled
Vacancy Rate
Number of employees
additional to the
establishment
Total Number of employees
ALL
PER
SON
NEL
Programme 1 1051 - 950 9,61% - 950 Programme 2 10 825 - 10 800 0,23% - 10 800 Programme 4 397 - 380 4,28% - 380 Programme 5 37 - 31 16,22% - 31 Programme 6 48 - 48 - - 48 Programme 7 168 - 134 20,24% - 134 Totals 12 526 - 12 343 1,46% - 12 343
EDU
CA
TOR
S Programme 1 361 - 297 17,73% - 297 Programme 2 9 064 - 9 158 -1,04% - 9158 Programme 4 233 - 223 4,29% - 223 Programme 5 35 - 29 17,14% - 29 Programme 6 4 - 3 25,00% - 3

103
Annual Report for 2018/19 Financial Year Vote 04: Department of Education
Province of the Northern Cape
102
Salary band Personnel
expenditure (R’000)
% of total personnel cost
No. of employees
Average personnel cost per employee
(R’000) Highly skilled supervision (levels 9-12) 1 406 211 28.42% 2403 588
Senior and Top management (levels 13-16) 45 521 0.92% 38 1 206
Abnormal 65 808 1.33% 937 71 Total 4 947 963 100,00% 14 568 341
Table 3.1.3 Salaries, Overtime, Home Owners Allowance and Medical Aid by programme for the period 1 April 2018 and 31 March 2019
Programme
Salaries Overtime Home Owners Allowance
Medical Aid
Amount (R’000
Salaries as a % of personnel
costs
Amount (R’000)
Overtime as a % of personnel
costs
Amount (R’000)
HOA as a % of
personnel costs
Amount (R’000)
Medical aid as a
% of personnel
costs Programme 1 337 135 6,78% 573 0,01% 11 606 0,23% 20 811 0,42%
Programme 2 3 108 334 62,52% 755 0,02% 115 418 2,32% 173 230 3,48%
Programme 4 100 494 2,02% 335 0,01% 4 349 0,09% 7 383 0,15%
Programme 5 14 475 0,29% - - 440 0,01% 836 0,02%
Programme 6 15 862 0,32% 10 - 373 0,01% 484 0,01%
Programme 7 45 692 0,92% 1 628 0,03% 1 619 0,03% 3 033 0,06%
Total 3 621 991 72,85% 3 301 0,07% 133 805 2,69% 205 777 4,14%
Table 3.1.4 Salaries, Overtime, Home Owners Allowance and Medical Aid by salary band for the period 1 April 2018 and 31 March 2019
Salaries Overtime Home Owners
Allowance Medical Aid Salary band
Amount (R’000
Salaries as a % of personne
l costs
Amount
(R’000)
Overtime as a % of personne
l costs
Amount
(R’000)
HOA as a % of
personnel costs
Amount
(R’000)
Medical aid as a
% of personne
l costs
Skilled (level 1-2) 90 688 1.83% 352 0.01% 11 508 0.23% 8 886 0.18%
Skilled (level 3-5) 362 987 7.34% 1 424 0.03% 20 982 0.42% 25 807 0.52%
Highly skilled production (levels 6-8)
2094987 42.34% 667 0.01% 73 140 1.48% 119 018 2.41%
Highly skilled supervision (levels 9-12
1043120 21.08% 858 0.02% 28 165 0.57% 51 678 1.04%
Annual Report for 2018/19 Financial Year Vote 04: Department of Education
Province of the Northern Cape
103
Salaries Overtime Home Owners
Allowance Medical Aid Salary band
Amount (R’000
Salaries as a % of personne
l costs
Amount
(R’000)
Overtime as a % of personne
l costs
Amount
(R’000)
HOA as a % of
personnel costs
Amount
(R’000)
Medical aid as a
% of personne
l costs
Senior management (level 13-16)
27 990 0.57% - - - - 385 0.01%
Abnormal 2 219 0.04% - - 9 0.00% 4 0.00%
Total 3 621 991 73.20% 3 301 0.07% 133 804 2.70% 205 778 4.16%
3.2. Employment and Vacancies
The tables in this section summarise the position with regard to employment and vacancies.
The following tables summarise the number of posts on the establishment, the number of employees, the vacancy rate, and whether there are any staff that are additional to the establishment. This information is presented in terms of three key variables: programme salary band critical occupations (see definition in notes below).
Departments have identified critical occupations that need to be monitored. In terms of current regulations, it is possible to create a post on the establishment that can be occupied by more than one employee. Therefore, the vacancy rate reflects the percentage of posts that are not filled.
Table 3.2.1 Employment and vacancies by programme as on 31 March 2019
Pers
onne
l G
roup
Programme Number of
funded posts
Number of
unfunded posts
Number of
posts filled
Vacancy Rate
Number of employees
additional to the
establishment
Total Number of employees
ALL
PER
SON
NEL
Programme 1 1051 - 950 9,61% - 950 Programme 2 10 825 - 10 800 0,23% - 10 800 Programme 4 397 - 380 4,28% - 380 Programme 5 37 - 31 16,22% - 31 Programme 6 48 - 48 - - 48 Programme 7 168 - 134 20,24% - 134 Totals 12 526 - 12 343 1,46% - 12 343
EDU
CA
TOR
S
Programme 1 361 - 297 17,73% - 297 Programme 2 9 064 - 9 158 -1,04% - 9158 Programme 4 233 - 223 4,29% - 223 Programme 5 35 - 29 17,14% - 29 Programme 6 4 - 3 25,00% - 3

104
Annual Report for 2018/19 Financial Year Vote 04: Department of Education
Province of the Northern Cape
104
Pers
onne
l G
roup
Programme Number
of funded posts
Number of
unfunded posts
Number of
posts filled
Vacancy Rate
Number of employees
additional to the
establishment
Total Number of employees
Programme 7 85 - 55 35,29% - 55 Totals 9 782 - 9 765 0,17% - 9 765
PUB
LIC
SER
VIC
E
Programme 1 690 - 653 5,36% - 653 Programme 2 1 761 - 1 642 6,76% - 1 642 Programme 4 164 - 157 4,27% - 157 Programme 5 2 - 2 0,00% - 2 Programme 6 45 - 45 - - 45 Programme 7 83 - 79 4,82% - 79 Totals 2 745 - 2 578 6,08% - 2 578
Table 3.2.2 Employment and vacancies by salary band as on 31 March 2019
Pers
onne
l G
roup
Salary band Number of
funded posts
Number of
unfunded posts
Number of
posts filled
Vacancy Rate
Number of employees
additional to the
establishment
Total Number of employees
ALL
PER
SON
NEL
Lower skilled ( 1-2) 867 - 846 2,42% - 846 Skilled(3-5) 1 723 - 1 842 -6,91% - 1 842 Highly skilled production (6-8) 361
- 325 9,97%
- 325
Highly skilled supervision (9-12) 9 532 - 9 297 2,46% - 9 297 Senior management (13-16) 43
- 33 23,26%
- 33
Totals 12 526 - 12 343 1,46% - 12 343
EDU
CA
TOR
S
Lower skilled ( 1-2) - - - - - -
Skilled(3-5) 388 - 598 -54,12% - 598 Highly skilled production (6-8) 2
- 2 0,00%
- 2
Highly skilled supervision (9-12) 9 392 - 9 165 2,42% - 9 165 Senior management (13-16)
- - - - - -
Totals 9 782 - 9 765 0,17% - 9 765
PUB
LIC
SER
VIC
E
Lower skilled ( 1-2) 867 - 846 2,42% - 846 Skilled(3-5) 1 348 - 1 244 7,71% - 1244 Highly skilled production (6-8) 359 - 323 10,03% - 323 Highly skilled supervision (9-12) 128
- 132 -3,13%
- 132
Senior management (13-16) 43 - 33 23,26% - 33 Totals 2 745 - 2 578 6,08% - 2 578
Annual Report for 2018/19 Financial Year Vote 04: Department of Education
Province of the Northern Cape
105
Table 3.2.3 Employment and vacancies by critical occupations as on 31 March 2019
Critical occupation Number of posts on approved
establishment
Number of posts filled
Vacancy Rate
Number of employees additional to the establishment
Technical 35 16 54.29% 3 Professional Services (Office-based Educators and Therapists)
279 193 30.82% 107
Support Staff (Schools) 2 145 1 281 40.28% -
Total 2 459 1 490 39.41% 110
3.3. Filling of SMS Posts
The tables in this section provide information on employment and vacancies as it relates to members of the Senior Management Service by salary level. It also provides information on advertising and filling of SMS posts, reasons for not complying with prescribed timeframes and disciplinary steps taken.
Table 3.3.1 SMS post information as on 31 March 2019
SMS Level
Number of SMS posts per level
Number of SMS posts filled per
level
% of SMS posts filled
per level
Number of SMS posts vacant per
level
% of SMS posts
vacant per level Funded Unfunded
Head of Department 1 - 1 100.00% - - Salary Level 16 - - - - - - Salary Level 15 1 2 1 33.33% - - Salary Level 14 9 - 8 88.89% 1 11.11% Salary Level 13 32 - 24* 75.00% 8 25.00% Total 43 2 34 75.56% 9 24.44% Note: *Two officials are currently on salary level 13 but are carried against salary level 12 posts (out of adjustment)
Table 3.3.2 SMS post information as on 30 September 2018
SMS Level
Number of SMS posts per level
Number of SMS posts filled per
level
% of SMS posts filled
per level
Number of SMS posts vacant per
level
% of SMS posts
vacant per level Funded Unfunded
Head of Department 1 - 1 100.00% - - Salary Level 16 - - - - - - Salary Level 15 1 2 1 33.33% - - Salary Level 14 9 - 8 88.89% 1 11.11% Salary Level 13 30 - 24* 80.00% 5 16.67% Total 41 2 34 79.07% 6 13.95% Note: * Two officials are currently on salary level 13 but are carried against salary level 12 posts (out of adjustment)

105
Annual Report for 2018/19 Financial Year Vote 04: Department of Education
Province of the Northern Cape
104
Pers
onne
l G
roup
Programme Number of
funded posts
Number of
unfunded posts
Number of
posts filled
Vacancy Rate
Number of employees
additional to the
establishment
Total Number of employees
Programme 7 85 - 55 35,29% - 55 Totals 9 782 - 9 765 0,17% - 9 765
PUB
LIC
SER
VIC
E
Programme 1 690 - 653 5,36% - 653 Programme 2 1 761 - 1 642 6,76% - 1 642 Programme 4 164 - 157 4,27% - 157 Programme 5 2 - 2 0,00% - 2 Programme 6 45 - 45 - - 45 Programme 7 83 - 79 4,82% - 79 Totals 2 745 - 2 578 6,08% - 2 578
Table 3.2.2 Employment and vacancies by salary band as on 31 March 2019
Pers
onne
l G
roup
Salary band Number of
funded posts
Number of
unfunded posts
Number of
posts filled
Vacancy Rate
Number of employees
additional to the
establishment
Total Number of employees
ALL
PER
SON
NEL
Lower skilled ( 1-2) 867 - 846 2,42% - 846 Skilled(3-5) 1 723 - 1 842 -6,91% - 1 842 Highly skilled production (6-8) 361
- 325 9,97%
- 325
Highly skilled supervision (9-12) 9 532 - 9 297 2,46% - 9 297 Senior management (13-16) 43
- 33 23,26%
- 33
Totals 12 526 - 12 343 1,46% - 12 343
EDU
CA
TOR
S
Lower skilled ( 1-2) - - - - - -
Skilled(3-5) 388 - 598 -54,12% - 598 Highly skilled production (6-8) 2
- 2 0,00%
- 2
Highly skilled supervision (9-12) 9 392 - 9 165 2,42% - 9 165 Senior management (13-16)
- - - - - -
Totals 9 782 - 9 765 0,17% - 9 765
PUB
LIC
SER
VIC
E
Lower skilled ( 1-2) 867 - 846 2,42% - 846 Skilled(3-5) 1 348 - 1 244 7,71% - 1244 Highly skilled production (6-8) 359 - 323 10,03% - 323 Highly skilled supervision (9-12) 128
- 132 -3,13%
- 132
Senior management (13-16) 43 - 33 23,26% - 33 Totals 2 745 - 2 578 6,08% - 2 578
Annual Report for 2018/19 Financial Year Vote 04: Department of Education
Province of the Northern Cape
105
Table 3.2.3 Employment and vacancies by critical occupations as on 31 March 2019
Critical occupation Number of posts on approved
establishment
Number of posts filled
Vacancy Rate
Number of employees additional to the establishment
Technical 35 16 54.29% 3 Professional Services (Office-based Educators and Therapists)
279 193 30.82% 107
Support Staff (Schools) 2 145 1 281 40.28% -
Total 2 459 1 490 39.41% 110
3.3. Filling of SMS Posts
The tables in this section provide information on employment and vacancies as it relates to members of the Senior Management Service by salary level. It also provides information on advertising and filling of SMS posts, reasons for not complying with prescribed timeframes and disciplinary steps taken.
Table 3.3.1 SMS post information as on 31 March 2019
SMS Level
Number of SMS posts per level
Number of SMS posts filled per
level
% of SMS posts filled
per level
Number of SMS posts vacant per
level
% of SMS posts
vacant per level Funded Unfunded
Head of Department 1 - 1 100.00% - - Salary Level 16 - - - - - - Salary Level 15 1 2 1 33.33% - - Salary Level 14 9 - 8 88.89% 1 11.11% Salary Level 13 32 - 24* 75.00% 8 25.00% Total 43 2 34 75.56% 9 24.44% Note: *Two officials are currently on salary level 13 but are carried against salary level 12 posts (out of adjustment)
Table 3.3.2 SMS post information as on 30 September 2018
SMS Level
Number of SMS posts per level
Number of SMS posts filled per
level
% of SMS posts filled
per level
Number of SMS posts vacant per
level
% of SMS posts
vacant per level Funded Unfunded
Head of Department 1 - 1 100.00% - - Salary Level 16 - - - - - - Salary Level 15 1 2 1 33.33% - - Salary Level 14 9 - 8 88.89% 1 11.11% Salary Level 13 30 - 24* 80.00% 5 16.67% Total 41 2 34 79.07% 6 13.95% Note: * Two officials are currently on salary level 13 but are carried against salary level 12 posts (out of adjustment)

106
Annual Report for 2018/19 Financial Year Vote 04: Department of Education
Province of the Northern Cape
106
Table 3.3.3 Advertising and filling of SMS posts for the period 1 April 2018 and 31 March 2019 SMS Level Total
number of funded
SMS posts
Total number of SMS posts
filled
% of SMS posts filled
Total number of SMS posts vacant
% of SMS posts vacant
Head of Department
1 - - - -
Salary Level 16 - - - - - Salary Level 15 1 - - - - Salary Level 14 9 - - 1 11.11% Salary Level 13 30 - - 5 16.67% Total 41 - - 6 14.63%
Table 3.3.4 Reasons for not having complied with the filling of funded vacant SMS - Advertised within 6 months and filled within 12 months after becoming vacant for the period 1 April 2018 and 31 March 2019
Reasons for vacancies not advertised within six months Provincial moratorium on the filling of posts, linked to the overspending on Personnel, as a result of the increase in learner numbers.
Reasons for vacancies not filled within six months NA
Notes In terms of the Public Service Regulations Chapter 1, Part VII C.1A.3, departments must indicate
good cause or reason for not having complied with the filling of SMS posts within the prescribed timeframes.
Table 3.3.5 Disciplinary steps taken for not complying with the prescribed timeframes for filling SMS posts within 12 months for the period 1 April 2018 and 31 March 2019
Reasons for vacancies not advertised within six months NA
Reasons for vacancies not filled within six months NA
Notes In terms of the Public Service Regulations Chapter 1, Part VII C.1A.2, departments must indicate
good cause or reason for not having complied with the filling of SMS posts within the prescribed timeframes. In the event of non-compliance with this regulation, the relevant executive authority or head of department must take appropriate disciplinary steps in terms of section 16A(1) or (2) of the Public Service Act.
Annual Report for 2018/19 Financial Year Vote 04: Department of Education
Province of the Northern Cape
107
3.4. Job Evaluation
Within a nationally determined framework, executing authorities may evaluate or re-evaluate any job in his or her organisation. In terms of the Regulations all vacancies on salary levels 9 and higher must be evaluated before they are filled. The following table summarises the number of jobs that were evaluated during the year under review. The table also provides statistics on the number of posts that were upgraded or downgraded.
Table 3.4.1 Job Evaluation by Salary band for the period 1 April 2018 and 31 March 2019
Salary band Number of posts on approved
establishment
Number of Jobs
Evaluated
% of posts
evaluated by salary
bands
Posts Upgraded Posts downgraded Number % of
posts evaluated
Number % of posts
evaluated
Lower Skilled (Levels1-2)
876 - - - - - -
Skilled (Levels 3-5) 2 467
5 0.20% - - - -
Highly skilled production (Levels 6-8)
7 847 10 0.13% 1 0.01% 5 0.06%
Highly skilled supervision (Levels 9-12)
2 403 - - - - - -
Senior Management Service Band A
24 - - - - - -
Senior Management Service Band B
8 - - - - - -
Senior Management Service Band C
1 - - - - - -
Senior Management Service Band D
1 - - - - - -
Total 13 627 15 0.11% 1 0.01% 5 0.04%
The following table provides a summary of the number of employees whose positions were upgraded due to their post being upgraded. The number of employees might differ from the number of posts upgraded since not all employees are automatically absorbed into the new posts and some of the posts upgraded could also be vacant.
Table 3.4.2 Profile of employees whose positions were upgraded due to their posts being upgraded for the period 1 April 2018 and 31 March 2019
Gender African Asian Coloured White Total Female - - - - - Male - - - - - Total - - - - -
Employees with a disability -

107
Annual Report for 2018/19 Financial Year Vote 04: Department of Education
Province of the Northern Cape
106
Table 3.3.3 Advertising and filling of SMS posts for the period 1 April 2018 and 31 March 2019 SMS Level Total
number of funded
SMS posts
Total number of SMS posts
filled
% of SMS posts filled
Total number of SMS posts vacant
% of SMS posts vacant
Head of Department
1 - - - -
Salary Level 16 - - - - - Salary Level 15 1 - - - - Salary Level 14 9 - - 1 11.11% Salary Level 13 30 - - 5 16.67% Total 41 - - 6 14.63%
Table 3.3.4 Reasons for not having complied with the filling of funded vacant SMS - Advertised within 6 months and filled within 12 months after becoming vacant for the period 1 April 2018 and 31 March 2019
Reasons for vacancies not advertised within six months Provincial moratorium on the filling of posts, linked to the overspending on Personnel, as a result of the increase in learner numbers.
Reasons for vacancies not filled within six months NA
Notes In terms of the Public Service Regulations Chapter 1, Part VII C.1A.3, departments must indicate
good cause or reason for not having complied with the filling of SMS posts within the prescribed timeframes.
Table 3.3.5 Disciplinary steps taken for not complying with the prescribed timeframes for filling SMS posts within 12 months for the period 1 April 2018 and 31 March 2019
Reasons for vacancies not advertised within six months NA
Reasons for vacancies not filled within six months NA
Notes In terms of the Public Service Regulations Chapter 1, Part VII C.1A.2, departments must indicate
good cause or reason for not having complied with the filling of SMS posts within the prescribed timeframes. In the event of non-compliance with this regulation, the relevant executive authority or head of department must take appropriate disciplinary steps in terms of section 16A(1) or (2) of the Public Service Act.
Annual Report for 2018/19 Financial Year Vote 04: Department of Education
Province of the Northern Cape
107
3.4. Job Evaluation
Within a nationally determined framework, executing authorities may evaluate or re-evaluate any job in his or her organisation. In terms of the Regulations all vacancies on salary levels 9 and higher must be evaluated before they are filled. The following table summarises the number of jobs that were evaluated during the year under review. The table also provides statistics on the number of posts that were upgraded or downgraded.
Table 3.4.1 Job Evaluation by Salary band for the period 1 April 2018 and 31 March 2019
Salary band Number of posts on approved
establishment
Number of Jobs
Evaluated
% of posts
evaluated by salary
bands
Posts Upgraded Posts downgraded Number % of
posts evaluated
Number % of posts
evaluated
Lower Skilled (Levels1-2)
876 - - - - - -
Skilled (Levels 3-5) 2 467
5 0.20% - - - -
Highly skilled production (Levels 6-8)
7 847 10 0.13% 1 0.01% 5 0.06%
Highly skilled supervision (Levels 9-12)
2 403 - - - - - -
Senior Management Service Band A
24 - - - - - -
Senior Management Service Band B
8 - - - - - -
Senior Management Service Band C
1 - - - - - -
Senior Management Service Band D
1 - - - - - -
Total 13 627 15 0.11% 1 0.01% 5 0.04%
The following table provides a summary of the number of employees whose positions were upgraded due to their post being upgraded. The number of employees might differ from the number of posts upgraded since not all employees are automatically absorbed into the new posts and some of the posts upgraded could also be vacant.
Table 3.4.2 Profile of employees whose positions were upgraded due to their posts being upgraded for the period 1 April 2018 and 31 March 2019
Gender African Asian Coloured White Total Female - - - - - Male - - - - - Total - - - - -
Employees with a disability -

108
Annual Report for 2018/19 Financial Year Vote 04: Department of Education
Province of the Northern Cape
108
The following table summarises the number of cases where remuneration bands exceeded the grade determined by job evaluation. Reasons for the deviation are provided in each case.
Table 3.4.3 Employees with salary levels higher than those determined by job evaluation by occupation for the period 1 April 2018 and 31 March 2019
Occupation Number of employees
Job evaluation level
Remuneration level
Reason for deviation
- - - - - Total number of employees whose salaries exceeded the level determined by job evaluation
-
Percentage of total employed -
The following table summarises the beneficiaries of the above in terms of race, gender, and disability.
Table 3.4.4 Profile of employees who have salary levels higher than those determined by job evaluation for the period 1 April 2018 and 31 March 2019
Gender African Asian Coloured White Total Female - - - - - Male - - - - - Total - - - - -
Employees with a disability - - - - -
Notes
If there were no cases where the salary levels were higher than those determined by job evaluation, keep
the heading and replace the table with the following:
Total number of Employees whose salaries exceeded the grades determine by job evaluation
None
Annu
al R
epor
t for
201
8/19
Fin
ancia
l Yea
r Vo
te 0
4: D
epar
tmen
t of E
duca
tion
Prov
ince
of t
he N
orth
ern
Cape
- 109
- 3.
5.
Empl
oym
ent C
hang
es
This
sec
tion
prov
ides
info
rmat
ion
on c
hang
es in
em
ploy
men
t ove
r the
fina
ncia
l yea
r. Tu
rnov
er ra
tes
prov
ide
an in
dica
tion
of tr
ends
in th
e em
ploy
men
t pro
file
of
the
depa
rtmen
t. Th
e fo
llow
ing
tabl
es p
rovi
de a
sum
mar
y of
turn
over
rate
s by
sal
ary
band
and
crit
ical
occ
upat
ions
(see
def
initi
on in
not
es b
elow
).
Tabl
e 3.
5.1
Ann
ual t
urno
ver r
ates
by
sala
ry b
and
for t
he p
erio
d 1
Apr
il 20
18 a
nd 3
1 M
arch
201
9
PERSONNEL GROUP
Sala
ry b
and
Num
ber o
f em
ploy
ees
per
band
as
on 3
1 M
arch
201
9
App
oint
men
ts
Tran
sfer
s in
to th
e de
partm
ent
Term
inat
ions
Tr
ansf
ers
out o
f the
de
partm
ent
Turn
-ove
r ra
te %
ALL PERSONNEL
Low
er s
kille
d ( L
evel
s 1-
2)
873
31
- 60
-
6.87
%
Ski
lled
(Lev
els
3-5)
2
136
1 12
1 1
951
1 44
.57%
H
ighl
y sk
illed
prod
uctio
n (L
evel
s 6-
8)
6 97
9 1
708
4 1
638
36
23.9
9%
Hig
hly
skille
d su
perv
isio
n (L
evel
s 9-
12)
2 29
5 56
2
215
3 9.
50%
S
enio
r Man
agem
ent S
ervi
ce B
ands
A (L
evel
13)
27
1
- 3
1 14
.81%
S
enio
r Man
agem
ent S
ervi
ce B
ands
B (L
evel
14)
8
- -
- -
- S
enio
r Man
agem
ent S
ervi
ce B
ands
C (l
evel
15)
1
- -
- -
- S
enio
r Man
agem
ent S
ervi
ce B
ands
D (L
evel
16)
1
- -
- -
- To
tal
12 3
20
2 91
7 7
2 86
7 41
23
.60%
EDUCATORS
Low
er s
kille
d ( L
evel
s 1-
2)
- 1
- -
- -
Ski
lled
(Lev
els
3-5)
83
0 1
039
- 80
7 1
97.3
5%
Hig
hly
skille
d pr
oduc
tion
(Lev
els
6-8)
6
641
1 68
6 4
1 59
2 36
24
.51%
H
ighl
y sk
illed
supe
rvis
ion
(Lev
els
9-12
) 2
159
41
1 19
8 2
9.26
%
Sen
ior M
anag
emen
t Ser
vice
Ban
ds A
(Lev
el 1
3)
- -
- -
- -
Sen
ior M
anag
emen
t Ser
vice
Ban
ds B
(Lev
el 1
4)
- -
- -
- -
Sen
ior M
anag
emen
t Ser
vice
Ban
ds C
(lev
el 1
5)
- -
- -
- -
Sen
ior M
anag
emen
t Ser
vice
Ban
ds D
(Lev
el 1
6)
- -
- -
- -
Tota
l 9
630
2 76
7 5
2 59
7 39
27
.37%
PUBLIC SERVICE
Low
er s
kille
d ( L
evel
s 1-
2)
873
30
- 60
-
6.87
%
Ski
lled
(Lev
els
3-5)
1
306
82
1 14
4 -
11.0
3%
Hig
hly
skille
d pr
oduc
tion
(Lev
els
6-8)
33
8 22
-
46
- 13
.61%
H
ighl
y sk
illed
supe
rvis
ion
(Lev
els
9-12
) 13
6 15
1
17
1 13
.24%
S
enio
r Man
agem
ent S
ervi
ce B
ands
A (L
evel
13)
27
1
- 3
1 14
.81%

109
Annual Report for 2018/19 Financial Year Vote 04: Department of Education
Province of the Northern Cape
108
The following table summarises the number of cases where remuneration bands exceeded the grade determined by job evaluation. Reasons for the deviation are provided in each case.
Table 3.4.3 Employees with salary levels higher than those determined by job evaluation by occupation for the period 1 April 2018 and 31 March 2019
Occupation Number of employees
Job evaluation level
Remuneration level
Reason for deviation
- - - - - Total number of employees whose salaries exceeded the level determined by job evaluation
-
Percentage of total employed -
The following table summarises the beneficiaries of the above in terms of race, gender, and disability.
Table 3.4.4 Profile of employees who have salary levels higher than those determined by job evaluation for the period 1 April 2018 and 31 March 2019
Gender African Asian Coloured White Total Female - - - - - Male - - - - - Total - - - - -
Employees with a disability - - - - -
Notes
If there were no cases where the salary levels were higher than those determined by job evaluation, keep
the heading and replace the table with the following:
Total number of Employees whose salaries exceeded the grades determine by job evaluation
None
Annu
al R
epor
t for
201
8/19
Fin
ancia
l Yea
r Vo
te 0
4: D
epar
tmen
t of E
duca
tion
Prov
ince
of t
he N
orth
ern
Cape
- 109
- 3.
5.
Empl
oym
ent C
hang
es
This
sec
tion
prov
ides
info
rmat
ion
on c
hang
es in
em
ploy
men
t ove
r the
fina
ncia
l yea
r. Tu
rnov
er ra
tes
prov
ide
an in
dica
tion
of tr
ends
in th
e em
ploy
men
t pro
file
of
the
depa
rtmen
t. Th
e fo
llow
ing
tabl
es p
rovi
de a
sum
mar
y of
turn
over
rate
s by
sal
ary
band
and
crit
ical
occ
upat
ions
(see
def
initi
on in
not
es b
elow
).
Tabl
e 3.
5.1
Ann
ual t
urno
ver r
ates
by
sala
ry b
and
for t
he p
erio
d 1
Apr
il 20
18 a
nd 3
1 M
arch
201
9
PERSONNEL GROUP
Sala
ry b
and
Num
ber o
f em
ploy
ees
per
band
as
on 3
1 M
arch
201
9
App
oint
men
ts
Tran
sfer
s in
to th
e de
partm
ent
Term
inat
ions
Tr
ansf
ers
out o
f the
de
partm
ent
Turn
-ove
r ra
te %
ALL PERSONNEL
Low
er s
kille
d ( L
evel
s 1-
2)
873
31
- 60
-
6.87
%
Ski
lled
(Lev
els
3-5)
2
136
1 12
1 1
951
1 44
.57%
H
ighl
y sk
illed
prod
uctio
n (L
evel
s 6-
8)
6 97
9 1
708
4 1
638
36
23.9
9%
Hig
hly
skille
d su
perv
isio
n (L
evel
s 9-
12)
2 29
5 56
2
215
3 9.
50%
S
enio
r Man
agem
ent S
ervi
ce B
ands
A (L
evel
13)
27
1
- 3
1 14
.81%
S
enio
r Man
agem
ent S
ervi
ce B
ands
B (L
evel
14)
8
- -
- -
- S
enio
r Man
agem
ent S
ervi
ce B
ands
C (l
evel
15)
1
- -
- -
- S
enio
r Man
agem
ent S
ervi
ce B
ands
D (L
evel
16)
1
- -
- -
- To
tal
12 3
20
2 91
7 7
2 86
7 41
23
.60%
EDUCATORS
Low
er s
kille
d ( L
evel
s 1-
2)
- 1
- -
- -
Ski
lled
(Lev
els
3-5)
83
0 1
039
- 80
7 1
97.3
5%
Hig
hly
skille
d pr
oduc
tion
(Lev
els
6-8)
6
641
1 68
6 4
1 59
2 36
24
.51%
H
ighl
y sk
illed
supe
rvis
ion
(Lev
els
9-12
) 2
159
41
1 19
8 2
9.26
%
Sen
ior M
anag
emen
t Ser
vice
Ban
ds A
(Lev
el 1
3)
- -
- -
- -
Sen
ior M
anag
emen
t Ser
vice
Ban
ds B
(Lev
el 1
4)
- -
- -
- -
Sen
ior M
anag
emen
t Ser
vice
Ban
ds C
(lev
el 1
5)
- -
- -
- -
Sen
ior M
anag
emen
t Ser
vice
Ban
ds D
(Lev
el 1
6)
- -
- -
- -
Tota
l 9
630
2 76
7 5
2 59
7 39
27
.37%
PUBLIC SERVICE
Low
er s
kille
d ( L
evel
s 1-
2)
873
30
- 60
-
6.87
%
Ski
lled
(Lev
els
3-5)
1
306
82
1 14
4 -
11.0
3%
Hig
hly
skille
d pr
oduc
tion
(Lev
els
6-8)
33
8 22
-
46
- 13
.61%
H
ighl
y sk
illed
supe
rvis
ion
(Lev
els
9-12
) 13
6 15
1
17
1 13
.24%
S
enio
r Man
agem
ent S
ervi
ce B
ands
A (L
evel
13)
27
1
- 3
1 14
.81%

110
Annu
al R
epor
t for
201
8/19
Fin
ancia
l Yea
r Vo
te 0
4: D
epar
tmen
t of E
duca
tion
Prov
ince
of t
he N
orth
ern
Cape
110
PERSONNEL GROUP
Sala
ry b
and
Num
ber o
f em
ploy
ees
per
band
as
on 3
1 M
arch
201
9
App
oint
men
ts
Tran
sfer
s in
to th
e de
partm
ent
Term
inat
ions
Tr
ansf
ers
out o
f the
de
partm
ent
Turn
-ove
r ra
te %
Sen
ior M
anag
emen
t Ser
vice
Ban
ds B
(Lev
el 1
4)
8 -
- -
- -
Sen
ior M
anag
emen
t Ser
vice
Ban
ds C
(lev
el 1
5)
1 -
- -
- -
Sen
ior M
anag
emen
t Ser
vice
Ban
ds D
(Lev
el 1
6)
1 -
- -
- -
Tota
l 2
690
150
2 27
0 2
10.1
1%
Not
es:
Col
umn
3 (n
umbe
r of e
mpl
oyee
s) in
clud
es a
ll N
atur
e of
App
oint
men
ts a
nd E
xces
s P
erso
nnel
and
exc
lude
s th
e E
xecu
tive
Aut
horit
y. P
ublic
Ser
vant
s an
d E
duca
tors
who
do
not o
ccup
y pe
rman
ent
posi
tions
are
app
oint
ed o
n co
ntra
ct fo
r clo
sed
perio
ds. T
his
incl
udes
em
ploy
ees
appo
inte
d to
sub
stan
tive
vaca
ncie
s w
hich
aris
e as
a re
sult
of n
atur
al a
ttriti
on, d
eath
s, p
rom
otio
ns, e
tc.,
and
empl
oyee
s (e
duca
tors
) app
oint
ed a
s su
bstit
utes
in th
e pl
ace
of th
ose
abse
nt fr
om d
uty
beca
use
of s
ick
leav
e, m
ater
nity
leav
e, e
tc. T
his
impl
ies
that
the
sam
e em
ploy
ee c
an b
e ap
poin
ted
up to
fo
ur ti
mes
in a
par
ticul
ar re
porti
ng y
ear b
ecau
se e
ach
cont
ract
is re
gard
ed a
s a
new
app
oint
men
t. Th
e ex
piry
of t
he c
ontra
ct is
rega
rded
as
a te
rmin
atio
n of
ser
vice
for r
epor
ting
purp
oses
and
this
is
the
reas
on fo
r the
exc
eptio
nally
hig
h nu
mbe
r of t
erm
inat
ions
.
Tabl
e 3.
5.2
Ann
ual t
urno
ver r
ates
by
criti
cal o
ccup
atio
n fo
r the
per
iod
1 A
pril
2018
and
31
Mar
ch 2
019
Crit
ical
occ
upat
ion
Num
ber o
f em
ploy
ees
at
begi
nnin
g of
per
iod-
Apr
il 20
17
App
oint
men
ts a
nd tr
ansf
ers
into
th
e de
part
men
t Te
rmin
atio
ns a
nd tr
ansf
ers
out o
f the
de
part
men
t Tu
rnov
er ra
te
- -
- -
- TO
TAL
- -
- -
Annual Report for 2018/19 Financial Year Vote 04: Department of Education
Province of the Northern Cape
- 111 -
The table below identifies the major reasons why staff left the department. Table 3.5.3.1 Reasons why staff left the department for the period 1 April 2018 and 31 March 2019
Personnel Group Termination Type Number % of Total
Exits
Number of exits as % of the total
number of employees as at 31
March 2019
ALL
PER
SON
NEL
Death / Demise 70 2.41% 0.57% Resignation 378 13.00% 3.06% Expiry of contract 2 027 69.70% 16.42% Dismissal - operational changes - - - Dismissal - misconduct 26 0.89% 0.21% Dismissal - incapacity - - - Discharged due to ill-health 42 1.44% 0.34% Retirement 260 8.94% 2.11%
Employee initiated severance package - - -
Translation in Nature of Appointment 64 2.20% 0.52% Transfer to other Public service Departments 41 1.41% 0.33%
Total 2 908 100.00% 23.56%
EDU
CA
TOR
S
Death / Demise 50 1.90% 0.51%
Resignation 338 12.82% 3.46%
Expiry of contract 1 967 74.62% 20.14%
Dismissal - operational changes - - -
Dismissal - misconduct 18 0.68% 0.18%
Dismissal - incapacity - - -
Discharged due to ill-health 31 1.18% 0.32%
Retirement 191 7.25% 1.96%
Employee initiated severance package - - -
Translation in Nature of Appointment 2 0.08% 0.02% Transfer to other Public service Departments 39 1.48% 0.40%
Total 2 636 100.00% 26.99%
PUB
LIC
SER
VIC
E
Death / Demise 20 7.35% 0.78%
Resignation 40 14.71% 1.55%
Expiry of contract 60 22.06% 2.33%
Dismissal - operational changes - - -
Dismissal - misconduct 8 2.94% 0.31%
Dismissal - incapacity - - -
Discharged due to ill-health 11 4.04% 0.43%
Retirement 69 25.37% 2.68%
Employee initiated severance package - - -
Translation in Nature of Appointment 62 22.79% 2.40% Transfer to other Public service Departments 2 0.74% 0.08%
Total 272 100.00% 10.55%

111
Annual Report for 2018/19 Financial Year Vote 04: Department of Education
Province of the Northern Cape
- 111 -
The table below identifies the major reasons why staff left the department. Table 3.5.3.1 Reasons why staff left the department for the period 1 April 2018 and 31 March 2019
Personnel Group Termination Type Number % of Total
Exits
Number of exits as % of the total
number of employees as at 31
March 2019
ALL
PER
SON
NEL
Death / Demise 70 2.41% 0.57% Resignation 378 13.00% 3.06% Expiry of contract 2 027 69.70% 16.42% Dismissal - operational changes - - - Dismissal - misconduct 26 0.89% 0.21% Dismissal - incapacity - - - Discharged due to ill-health 42 1.44% 0.34% Retirement 260 8.94% 2.11%
Employee initiated severance package - - -
Translation in Nature of Appointment 64 2.20% 0.52% Transfer to other Public service Departments 41 1.41% 0.33%
Total 2 908 100.00% 23.56%
EDU
CA
TOR
S
Death / Demise 50 1.90% 0.51%
Resignation 338 12.82% 3.46%
Expiry of contract 1 967 74.62% 20.14%
Dismissal - operational changes - - -
Dismissal - misconduct 18 0.68% 0.18%
Dismissal - incapacity - - -
Discharged due to ill-health 31 1.18% 0.32%
Retirement 191 7.25% 1.96%
Employee initiated severance package - - -
Translation in Nature of Appointment 2 0.08% 0.02% Transfer to other Public service Departments 39 1.48% 0.40%
Total 2 636 100.00% 26.99%
PUB
LIC
SER
VIC
E
Death / Demise 20 7.35% 0.78%
Resignation 40 14.71% 1.55%
Expiry of contract 60 22.06% 2.33%
Dismissal - operational changes - - -
Dismissal - misconduct 8 2.94% 0.31%
Dismissal - incapacity - - -
Discharged due to ill-health 11 4.04% 0.43%
Retirement 69 25.37% 2.68%
Employee initiated severance package - - -
Translation in Nature of Appointment 62 22.79% 2.40% Transfer to other Public service Departments 2 0.74% 0.08%
Total 272 100.00% 10.55%

112
Annual Report for 2018/19 Financial Year Vote 04: Department of Education
Province of the Northern Cape
112
Table 3.5.3.2 Reasons why staff are resigning for the period 1 April 208 and 31 March 2019
Personnel Group
Termination Type Number % of Total Exits
ALL
PER
SON
NEL
Age 11 2,91% Bad health 15 3,97% Better remuneration 107 28,31% Contract expired 1 0,26% Domestic problems 3 0,79% Emigration 1 0,26% Marriage 8 2,12% Nature of work 54 14,29% Other education department 2 0,53% Other occupation 67 17,72% Personal grievances 11 2,91% Resigning of position 95 25,13% Transfer(spouse) 3 0,79% Total 378 100%
EDU
CA
TOR
S
Age 7 2,07% Bad health 11 3,25% Better remuneration 103 30,47% Contract expired 1 0,30% Domestic problems 3 0,89% Emigration 1 0,30% Marriage 7 2,07% Nature of work 53 15,68% Other education department 2 0,59% Other occupation 58 17,16% Personal grievances 7 2,07% Resigning of position 83 24,56% Transfer(spouse) 2 0,59% Total 338 100%
PUB
LIC
SER
VIC
E
Age 4 10,00% Bad health 4 10,00% Better remuneration 4 10,00% Contract expired - - Domestic problems - - Emigration - - Marriage 1 2,50% Nature of work 1 2,50% Other education department - - Other occupation 9 22,50% Personal grievances 4 10,00% Resigning of position 12 30,00% Transfer(spouse) 1 2,50% Total 40 100,00%
Table 3.5.3.3 Age Groups of Staff Resigning for the period 1 April 2018 and 31 March 2019
Termination type
Resignations Educators
Educators - %
Resignations Public
Service Staff
Public Service -
%
Resignations All Staff
All Staff - %
Ages 20 < - - - - - - Ages 20 – 24 21 6,21% - - 21 5,56%
Annual Report for 2018/19 Financial Year Vote 04: Department of Education
Province of the Northern Cape
113
Termination type
Resignations Educators
Educators - %
Resignations Public
Service Staff
Public Service -
%
Resignations All Staff
All Staff - %
Ages 25 – 29 68 20,12% 1 2,50% 69 18,25% Ages 30 – 34 45 13,31% 6 15,00% 51 13,49% Ages 35 – 39 24 7,10% 6 15,00% 30 7,94% Ages 40 – 44 33 9,76% 6 15,00% 39 10,32% Ages 45 – 49 54 15,98% 5 12,50% 59 15,61% Ages 50 – 54 45 13,31% 6 15,00% 51 13,49% Ages 55 – 59 28 8,28% 2 5,00% 30 7,94% Ages 60 – 64 19 5,62% 5 12,50% 24 6,35% Ages 65 > 1 0,30% 3 7,50% 4 1,06% TOTAL 338 100% 40 100,00% 378 100,00%
Table 3.5.3.4 Severance Packages instated for the period 1 April 2018 and 31 March 2019
PERSONNEL GROUP
Salary band Number of Packages Approved by Department
ALL
PER
SON
NEL
Lower skilled ( Levels 1-2) - Skilled (Levels3-5) - Highly skilled production (Levels 6-8) - Highly skilled supervision (Levels 9-12) - Senior Management Service Bands A (Level 13) - Senior Management Service Bands B (Level 14) - Senior Management Service Bands C (level 15) - Senior Management Service Bands D (Level 16) - Total -
EDU
CA
TOR
S
Lower skilled ( Levels 1-2) - Skilled (Levels3-5) - Highly skilled production (Levels 6-8) - Highly skilled supervision (Levels 9-12) - Senior Management Service Bands A (Level 13) - Senior Management Service Bands B (Level 14) - Senior Management Service Bands C (level 15) - Senior Management Service Bands D (Level 16) - Total -
PUB
LIC
SER
VIC
E
Lower skilled ( Levels 1-2) - Skilled (Levels3-5) - Highly skilled production (Levels 6-8) - Highly skilled supervision (Levels 9-12) - Senior Management Service Bands A (Level 13) - Senior Management Service Bands B (Level 14) - Senior Management Service Bands C (level 15) - Senior Management Service Bands D (Level 16) - Total -

113
Annual Report for 2018/19 Financial Year Vote 04: Department of Education
Province of the Northern Cape
112
Table 3.5.3.2 Reasons why staff are resigning for the period 1 April 208 and 31 March 2019
Personnel Group
Termination Type Number % of Total Exits
ALL
PER
SON
NEL
Age 11 2,91% Bad health 15 3,97% Better remuneration 107 28,31% Contract expired 1 0,26% Domestic problems 3 0,79% Emigration 1 0,26% Marriage 8 2,12% Nature of work 54 14,29% Other education department 2 0,53% Other occupation 67 17,72% Personal grievances 11 2,91% Resigning of position 95 25,13% Transfer(spouse) 3 0,79% Total 378 100%
EDU
CA
TOR
S
Age 7 2,07% Bad health 11 3,25% Better remuneration 103 30,47% Contract expired 1 0,30% Domestic problems 3 0,89% Emigration 1 0,30% Marriage 7 2,07% Nature of work 53 15,68% Other education department 2 0,59% Other occupation 58 17,16% Personal grievances 7 2,07% Resigning of position 83 24,56% Transfer(spouse) 2 0,59% Total 338 100%
PUB
LIC
SER
VIC
E
Age 4 10,00% Bad health 4 10,00% Better remuneration 4 10,00% Contract expired - - Domestic problems - - Emigration - - Marriage 1 2,50% Nature of work 1 2,50% Other education department - - Other occupation 9 22,50% Personal grievances 4 10,00% Resigning of position 12 30,00% Transfer(spouse) 1 2,50% Total 40 100,00%
Table 3.5.3.3 Age Groups of Staff Resigning for the period 1 April 2018 and 31 March 2019
Termination type
Resignations Educators
Educators - %
Resignations Public
Service Staff
Public Service -
%
Resignations All Staff
All Staff - %
Ages 20 < - - - - - - Ages 20 – 24 21 6,21% - - 21 5,56%
Annual Report for 2018/19 Financial Year Vote 04: Department of Education
Province of the Northern Cape
113
Termination type
Resignations Educators
Educators - %
Resignations Public
Service Staff
Public Service -
%
Resignations All Staff
All Staff - %
Ages 25 – 29 68 20,12% 1 2,50% 69 18,25% Ages 30 – 34 45 13,31% 6 15,00% 51 13,49% Ages 35 – 39 24 7,10% 6 15,00% 30 7,94% Ages 40 – 44 33 9,76% 6 15,00% 39 10,32% Ages 45 – 49 54 15,98% 5 12,50% 59 15,61% Ages 50 – 54 45 13,31% 6 15,00% 51 13,49% Ages 55 – 59 28 8,28% 2 5,00% 30 7,94% Ages 60 – 64 19 5,62% 5 12,50% 24 6,35% Ages 65 > 1 0,30% 3 7,50% 4 1,06% TOTAL 338 100% 40 100,00% 378 100,00%
Table 3.5.3.4 Severance Packages instated for the period 1 April 2018 and 31 March 2019
PERSONNEL GROUP
Salary band Number of Packages Approved by Department
ALL
PER
SON
NEL
Lower skilled ( Levels 1-2) - Skilled (Levels3-5) - Highly skilled production (Levels 6-8) - Highly skilled supervision (Levels 9-12) - Senior Management Service Bands A (Level 13) - Senior Management Service Bands B (Level 14) - Senior Management Service Bands C (level 15) - Senior Management Service Bands D (Level 16) - Total -
EDU
CA
TOR
S
Lower skilled ( Levels 1-2) - Skilled (Levels3-5) - Highly skilled production (Levels 6-8) - Highly skilled supervision (Levels 9-12) - Senior Management Service Bands A (Level 13) - Senior Management Service Bands B (Level 14) - Senior Management Service Bands C (level 15) - Senior Management Service Bands D (Level 16) - Total -
PUB
LIC
SER
VIC
E
Lower skilled ( Levels 1-2) - Skilled (Levels3-5) - Highly skilled production (Levels 6-8) - Highly skilled supervision (Levels 9-12) - Senior Management Service Bands A (Level 13) - Senior Management Service Bands B (Level 14) - Senior Management Service Bands C (level 15) - Senior Management Service Bands D (Level 16) - Total -

114
Annual Report for 2018/19 Financial Year Vote 04: Department of Education
Province of the Northern Cape
114
Table 3.5.4 Promotions by critical occupation for the period 1 April 2018 and 31 March 2019 Occupation Employees
1 April 2018
Promotions to another salary level
Salary level promotions as
a % of employees by
occupation
Progressions to another
notch within a salary level
Notch progression as a % of employees by occupation
- - - - - - TOTAL - - - - -
Table 3.5.5 Promotions by salary band for the period 1 April 2018 and 31 March 2019
PER
SON
NEL
G
RO
UP
Salary Band Employees 31 March
2018
Promotions to another salary level
Salary bands
promotions as a % of
employees by salary
level
Progressions to another
notch within a salary level
Notch progression
as a % of employees by salary
bands
ALL
PER
SON
NEL
Lower skilled ( Levels 1-2) 873
- - 449 51,43%
Skilled (Levels3-5) 2 136 2 0,09% 1 357 63,53% Highly skilled production (Levels 6-8) 6 979 257 3,68% 5 238 75,05% Highly skilled supervision (Levels 9-12) 2 295 166 7,23% 2 002 87,23% Senior Management (Level 13-16) 37 - - 32 86,49%
Total 12 320 425 3,45% 9 078 73,69%
EDU
CA
TOR
S
Lower skilled ( Levels 1-2) - - - - - Skilled (Levels3-5) 830 - - 244 29,40% Highly skilled production (Levels 6-8) 6 641 253 3,81% 5 047 76,00% Highly skilled supervision (Levels 9-12) 2 159 166 7,69% 1 909 88,42% Senior Management (Level 13-16) - - - - -
Total 9 630 419 4,35% 7 200 74,77%
PUB
LIC
SER
VIC
E
Lower skilled ( Levels 1-2) 873 - - 449 51,43% Skilled (Levels3-5) 1 306 2 0,15% 1 113 85,22% Highly skilled production (Levels 6-8) 338 4 1,18% 191 56,51% Highly skilled supervision (Levels 9-12) 136 - - 93 68,38% Senior Management (Level 13-16) 37 - - 32 86,49%
Total 2 690 6 0,22% 1 878 69,81%
Annual Report for 2018/19 Financial Year Vote 04: Department of Education
Province of the Northern Cape
115
3.6. Employment Equity
Table 3.6.1 Total number of employees (including employees with disabilities) in each of the following occupational categories as on 31 March 2019
Occupational category Male Female Foreigner Total
A C I W A C I W M F
Top Management (Level 14 -16)
4 2 - - 2 2 - - - - 10
Senior Management (Levels 13)
8 7 - - 3 4 - 1 1 - 24
Professionally qualified and experienced (Level 11 – 12)
95 142 1 35 45 41 - 9 - - 368
Skilled technical and academically qualified workers and skilled production (Level 8 -10)
572 731 1 128 1 225 929 1 352 6 3 3 948
Semi-skilled (Level 4 – 7) 783 760 4 90 2 062 2 080 6 649 273 104 6 811
Unskilled (Level 1 -3) 209 285 1 6 312 338 1 9 12 9 1 182
Total 1 671 1 927 7 259 3649 3 394 8 1020 292 116 12 343 Table 3.6.2 Total number of employees (including employees with disabilities) in each of the following occupational bands as on 31 March 2019
Occupational band Male Female Foreigner
Total
A C I W A C I W M F
Top Management (Level 14 -16) - - - - - - - - - - -
Senior Management (Levels 13) - - - - - - - - - - -
Professionally qualified and experienced (Level 11 – 12)
- - - - - - - - - - -
Skilled technical and academically qualified workers and skilled production (Level 8 -10)
- - - - - - - - - - -
Semi-skilled (Level 4 – 7) 2 1 - - 1 1 - - - - 5
Unskilled (Level 1 -3) 1 - - - - - - - - - 1
Total 3 1 - - 1 1 - - - - 6 Table 3.6.3 Recruitment for the period 1 April 2018 to 31 March 2019
Occupational band Male Female Foreigner Total
A C I W A C I W M F Top Management (Level 14 -16) - - - - - - - - - - -
Senior Management (Levels 13) 1 - - - - - - - - - 1
Professionally qualified and experienced (Level 11 – 12) 3 2 - - 3 - - 3 - - 11 Skilled technical and academically qualified workers and skilled production (Level 8 -10) 60 81 - 4 101 79 - 17 - - 342

115
Annual Report for 2018/19 Financial Year Vote 04: Department of Education
Province of the Northern Cape
114
Table 3.5.4 Promotions by critical occupation for the period 1 April 2018 and 31 March 2019 Occupation Employees
1 April 2018
Promotions to another salary level
Salary level promotions as
a % of employees by
occupation
Progressions to another
notch within a salary level
Notch progression as a % of employees by occupation
- - - - - - TOTAL - - - - -
Table 3.5.5 Promotions by salary band for the period 1 April 2018 and 31 March 2019
PER
SON
NEL
G
RO
UP
Salary Band Employees 31 March
2018
Promotions to another salary level
Salary bands
promotions as a % of
employees by salary
level
Progressions to another
notch within a salary level
Notch progression
as a % of employees by salary
bands
ALL
PER
SON
NEL
Lower skilled ( Levels 1-2) 873
- - 449 51,43%
Skilled (Levels3-5) 2 136 2 0,09% 1 357 63,53% Highly skilled production (Levels 6-8) 6 979 257 3,68% 5 238 75,05% Highly skilled supervision (Levels 9-12) 2 295 166 7,23% 2 002 87,23% Senior Management (Level 13-16) 37 - - 32 86,49%
Total 12 320 425 3,45% 9 078 73,69%
EDU
CA
TOR
S
Lower skilled ( Levels 1-2) - - - - - Skilled (Levels3-5) 830 - - 244 29,40% Highly skilled production (Levels 6-8) 6 641 253 3,81% 5 047 76,00% Highly skilled supervision (Levels 9-12) 2 159 166 7,69% 1 909 88,42% Senior Management (Level 13-16) - - - - -
Total 9 630 419 4,35% 7 200 74,77%
PUB
LIC
SER
VIC
E
Lower skilled ( Levels 1-2) 873 - - 449 51,43% Skilled (Levels3-5) 1 306 2 0,15% 1 113 85,22% Highly skilled production (Levels 6-8) 338 4 1,18% 191 56,51% Highly skilled supervision (Levels 9-12) 136 - - 93 68,38% Senior Management (Level 13-16) 37 - - 32 86,49%
Total 2 690 6 0,22% 1 878 69,81%
Annual Report for 2018/19 Financial Year Vote 04: Department of Education
Province of the Northern Cape
115
3.6. Employment Equity
Table 3.6.1 Total number of employees (including employees with disabilities) in each of the following occupational categories as on 31 March 2019
Occupational category Male Female Foreigner Total
A C I W A C I W M F
Top Management (Level 14 -16)
4 2 - - 2 2 - - - - 10
Senior Management (Levels 13)
8 7 - - 3 4 - 1 1 - 24
Professionally qualified and experienced (Level 11 – 12)
95 142 1 35 45 41 - 9 - - 368
Skilled technical and academically qualified workers and skilled production (Level 8 -10)
572 731 1 128 1 225 929 1 352 6 3 3 948
Semi-skilled (Level 4 – 7) 783 760 4 90 2 062 2 080 6 649 273 104 6 811
Unskilled (Level 1 -3) 209 285 1 6 312 338 1 9 12 9 1 182
Total 1 671 1 927 7 259 3649 3 394 8 1020 292 116 12 343 Table 3.6.2 Total number of employees (including employees with disabilities) in each of the following occupational bands as on 31 March 2019
Occupational band Male Female Foreigner
Total
A C I W A C I W M F
Top Management (Level 14 -16) - - - - - - - - - - -
Senior Management (Levels 13) - - - - - - - - - - -
Professionally qualified and experienced (Level 11 – 12)
- - - - - - - - - - -
Skilled technical and academically qualified workers and skilled production (Level 8 -10)
- - - - - - - - - - -
Semi-skilled (Level 4 – 7) 2 1 - - 1 1 - - - - 5
Unskilled (Level 1 -3) 1 - - - - - - - - - 1
Total 3 1 - - 1 1 - - - - 6 Table 3.6.3 Recruitment for the period 1 April 2018 to 31 March 2019
Occupational band Male Female Foreigner Total
A C I W A C I W M F Top Management (Level 14 -16) - - - - - - - - - - -
Senior Management (Levels 13) 1 - - - - - - - - - 1
Professionally qualified and experienced (Level 11 – 12) 3 2 - - 3 - - 3 - - 11 Skilled technical and academically qualified workers and skilled production (Level 8 -10) 60 81 - 4 101 79 - 17 - - 342

116
Annual Report for 2018/19 Financial Year Vote 04: Department of Education
Province of the Northern Cape
116
Occupational band Male Female Foreigner Total
A C I W A C I W M F
Semi-skilled (Level 4 – 7) 229 228 - 23 421 527 - 176 228 80 1 912 Unskilled (Level 1 -3) 67 123 - 4 146 247 - 19 24 21 651 Total 360 434 - 31 671 853 - 215 252 101 2 917
Table 3.6.4 Promotions for the period 1 April 2018 to 31 March 2019 Occupational band Male Female Foreigner Total
A C I W A C I W M F
Top Management (Level 14 -16) - - - - - - - - - - - Senior Management (Levels 13) - - - - - - - - - - - Professionally qualified and experienced (Level 11 – 12) 7 5 - 3 4 2 - 2 - - 23 Skilled technical and academically qualified workers and skilled production (Level 8 -10) 55 67 - 10 104 89 - 21 2 1 349 Semi-skilled (Level 4 – 7) 4 7 - - 21 13 - - 8 1 54
Unskilled (Level 1 -3) - - - - - - - - - - - Total 66 79 - 13 129 104 - 23 10 2 426
Table 3.6.5 Terminations for the period 1 April 2018 to 31 March 2019
Occupational band Male Female Foreigner Total
A C I W A C I W M F
Top Management (Level 14 -16) - - - - - - - - - - - Senior Management (Levels 13) - 2 - - - 1 - - - - 3
Professionally qualified and experienced (Level 11 – 12) 6 10 - 7 10 3 - 6 - - 42 Skilled technical and academically qualified workers and skilled production (Level 8 -10) 73 111 - 18 145 141 - 49 1 - 538
Semi-skilled (Level 4 – 7) 174 223 - 25 356 518 - 162 202 65 1 725 Unskilled (Level 1 -3) 66 101 - 1 108 184 - 6 17 12 495 Total 319 447 - 51 619 847 - 223 220 77 2 803
Table 3.6.6 Disciplinary action for the period 1 April 2018 to 31 March 2019
Disciplinary action
Male Female Total African Coloured Indian White African Coloured Indian White
12 09 00 03 04 07 00 02 37 Table 3.6.7 Skills development for the period 1 April 2018 to 31 March 2019
Occupational category Male Female Total
A C I W A C I W Top Management (Level 14 -16) 1 - - - - - - - 1
Senior Management (Levels 13) 2 1 - - - 1 - - 4
Professionally qualified and experienced (Level 11 – 12)
12 12 1 3 10 9 - 2 49
Annual Report for 2018/19 Financial Year Vote 04: Department of Education
Province of the Northern Cape
117
Occupational category Male Female Total
A C I W A C I W
Skilled technical and academically qualified workers and skilled production (Level 8 -10)
100 96 2 25 82 79 2 20 406
Semi-skilled (Level 4 – 7) 156 148 4 38 127 123 3 31 630
Unskilled (Level 1 -3) 9 1 - - 8 2 - - 20
Total 280 258 7 66 227 214 5 53 1 110
Employees with disabilities - - - - - - - - -
3.7. Signing of Performance Agreements by SMS Members
All members of the SMS must conclude and sign performance agreements within specific timeframes. Information regarding the signing of performance agreements by SMS members, the reasons for not complying within the prescribed timeframes and disciplinary steps taken is presented here.
Table 3.7.1 Signing of Performance Agreements by SMS members as on 31 May 2019 SMS Level Total number of
funded SMS posts Total number
of SMS members
Total number of signed
performance agreements
Signed performance
agreements as % of total number of SMS members
Head of Department 1 1 1 100.00% Salary Level 16 - - - - Salary Level 15 3 1 1 100.00% Salary Level 14 8 8 8 100.00% Salary Level 13 32 25 25 100.00% Total 44 35 35 100.00%
Table 3.7.2 Reasons for not having concluded Performance agreements for all SMS members as on 31 March 2019
Reasons NA
Table 3.7.3 Disciplinary steps taken against SMS members for not having concluded Performance agreements as on 31 March 2019
Reasons NA
3.8. Performance Rewards
To encourage good performance, the department has granted the following performance rewards during the year under review. The information is presented in terms of race, gender, disability, salary bands and critical occupations (see definition in notes below). Table 3.8.1 Performance Rewards by race, gender and disability for the period 1 April 2018 to 31 March 2019
Race and Gender
Beneficiary Profile Cost Number of
beneficiaries Number of employees
% of total within group
Cost (R’000)
Average cost per
beneficiary African 113 1 275 8,86% 1 355,32 11,99

117
Annual Report for 2018/19 Financial Year Vote 04: Department of Education
Province of the Northern Cape
116
Occupational band Male Female Foreigner Total
A C I W A C I W M F
Semi-skilled (Level 4 – 7) 229 228 - 23 421 527 - 176 228 80 1 912 Unskilled (Level 1 -3) 67 123 - 4 146 247 - 19 24 21 651 Total 360 434 - 31 671 853 - 215 252 101 2 917
Table 3.6.4 Promotions for the period 1 April 2018 to 31 March 2019 Occupational band Male Female Foreigner Total
A C I W A C I W M F
Top Management (Level 14 -16) - - - - - - - - - - - Senior Management (Levels 13) - - - - - - - - - - - Professionally qualified and experienced (Level 11 – 12) 7 5 - 3 4 2 - 2 - - 23 Skilled technical and academically qualified workers and skilled production (Level 8 -10) 55 67 - 10 104 89 - 21 2 1 349 Semi-skilled (Level 4 – 7) 4 7 - - 21 13 - - 8 1 54
Unskilled (Level 1 -3) - - - - - - - - - - - Total 66 79 - 13 129 104 - 23 10 2 426
Table 3.6.5 Terminations for the period 1 April 2018 to 31 March 2019
Occupational band Male Female Foreigner Total
A C I W A C I W M F
Top Management (Level 14 -16) - - - - - - - - - - - Senior Management (Levels 13) - 2 - - - 1 - - - - 3
Professionally qualified and experienced (Level 11 – 12) 6 10 - 7 10 3 - 6 - - 42 Skilled technical and academically qualified workers and skilled production (Level 8 -10) 73 111 - 18 145 141 - 49 1 - 538
Semi-skilled (Level 4 – 7) 174 223 - 25 356 518 - 162 202 65 1 725 Unskilled (Level 1 -3) 66 101 - 1 108 184 - 6 17 12 495 Total 319 447 - 51 619 847 - 223 220 77 2 803
Table 3.6.6 Disciplinary action for the period 1 April 2018 to 31 March 2019
Disciplinary action
Male Female Total African Coloured Indian White African Coloured Indian White
12 09 00 03 04 07 00 02 37 Table 3.6.7 Skills development for the period 1 April 2018 to 31 March 2019
Occupational category Male Female Total
A C I W A C I W Top Management (Level 14 -16) 1 - - - - - - - 1
Senior Management (Levels 13) 2 1 - - - 1 - - 4
Professionally qualified and experienced (Level 11 – 12)
12 12 1 3 10 9 - 2 49
Annual Report for 2018/19 Financial Year Vote 04: Department of Education
Province of the Northern Cape
117
Occupational category Male Female Total
A C I W A C I W
Skilled technical and academically qualified workers and skilled production (Level 8 -10)
100 96 2 25 82 79 2 20 406
Semi-skilled (Level 4 – 7) 156 148 4 38 127 123 3 31 630
Unskilled (Level 1 -3) 9 1 - - 8 2 - - 20
Total 280 258 7 66 227 214 5 53 1 110
Employees with disabilities - - - - - - - - -
3.7. Signing of Performance Agreements by SMS Members
All members of the SMS must conclude and sign performance agreements within specific timeframes. Information regarding the signing of performance agreements by SMS members, the reasons for not complying within the prescribed timeframes and disciplinary steps taken is presented here.
Table 3.7.1 Signing of Performance Agreements by SMS members as on 31 May 2019 SMS Level Total number of
funded SMS posts Total number
of SMS members
Total number of signed
performance agreements
Signed performance
agreements as % of total number of SMS members
Head of Department 1 1 1 100.00% Salary Level 16 - - - - Salary Level 15 3 1 1 100.00% Salary Level 14 8 8 8 100.00% Salary Level 13 32 25 25 100.00% Total 44 35 35 100.00%
Table 3.7.2 Reasons for not having concluded Performance agreements for all SMS members as on 31 March 2019
Reasons NA
Table 3.7.3 Disciplinary steps taken against SMS members for not having concluded Performance agreements as on 31 March 2019
Reasons NA
3.8. Performance Rewards
To encourage good performance, the department has granted the following performance rewards during the year under review. The information is presented in terms of race, gender, disability, salary bands and critical occupations (see definition in notes below). Table 3.8.1 Performance Rewards by race, gender and disability for the period 1 April 2018 to 31 March 2019
Race and Gender
Beneficiary Profile Cost Number of
beneficiaries Number of employees
% of total within group
Cost (R’000)
Average cost per
beneficiary African 113 1 275 8,86% 1 355,32 11,99

118
Annual Report for 2018/19 Financial Year Vote 04: Department of Education
Province of the Northern Cape
118
Race and Gender
Beneficiary Profile Cost Number of
beneficiaries Number of employees
% of total within group
Cost (R’000)
Average cost per
beneficiary Male 41 490 8,37% 635,65 15,50 Female 72 785 9,17% 719,67 10,00 Asian - 6 - - - Male - 3 - - - Female - 3 - - - Coloured 156 1 305 11,95% 1 562,48 10,02 Male 66 508 12,99% 636,21 9,64 Female 90 797 11,29% 926,27 10,29 White 20 98 20,41% 302,92 15,15 Male 1 8 12,50% 19,13 19,13 Female 19 90 21,11% 283,80 14,94
Disabled 1 6 16,67% 13,15 13,15 Total 290 2 690 10,78% 3 233,87 11,15
Table 3.8.2 Performance Rewards by salary band for personnel below Senior Management Service for the period 1 April 2018 to 31 March 2019
Beneficiary Profile Cost Total cost as a % of the total
personnel expenditure
Salary band Number of beneficiaries
Number of employees
% of total within salary
bands
Total Cost (R’000)
Average cost per
employee
Lower Skilled (Levels 1-2) 85 873 9,74% 423309.45 4 980,11 8.56%
Skilled (level 3-5) 132 1306 10,11% 1031698.35 7 815,90 20.85%
Highly skilled production (level 6-8)
43 338 12,72% 593385.75 13 799,67 11.99%
Highly skilled supervision (level 9-12)
20 136 14,71% 551273.1 27 563,66 11.14%
Total 280 2653 10,55% 2 599 666.65 9 284,52 52.54% Table 3.8.3 Performance Rewards by critical occupation for the period 1 April 2018 to 31 March 2019
Critical occupation Beneficiary Profile Cost Number of
beneficiaries Number of employees
% of total within
occupation
Total Cost (R’000)
Average cost per employee
C6020100 - - - - - C6010302 - - - - - C6010308 - - - - - Total - - - - -
Annual Report for 2018/19 Financial Year Vote 04: Department of Education
Province of the Northern Cape
119
Table 3.8.4 Performance related rewards (cash bonus), by salary band for Senior Management Service for the period 1 April 2018 to 31 March 2019
Salary band
Beneficiary Profile Cost Total cost as a % of the total personnel expenditure
Number of beneficiaries
Number of employees
% of total within salary
bands
Total Cost (R)
Average cost per
beneficiary (R)
Band A 6 27 22,22% 301 631,40 50 271,90 0,01 Band B 2 8 25,00% 116 142,30 58 071,15 0,00 Band C 1 1 100,00% 71 680,35 71 680,35 0,00 Band D 1 1 100,00% 144 753,84 144 753,84 0,00 Total 10 37 27,03% 634 207,89 63 420,79 0,01
3.9. Foreign Workers The tables below summarise the employment of foreign nationals in the department in terms of salary band and major occupation.
Table 3.9.1 Foreign workers by salary band for the period 1 April 2018 and 31 March 2019
Personnel Group Salary band
01 April 2018 31 March 2019 Change
Number % of total Number % of
total Number % in salary total
ALL PERSONNEL
Lower Skills (Level 1-2) - - - - - - Skilled (levels 3-5) 100 28,09% 97 23,77% -3 -5,77% Highly skilled production (levels 6-8) 250 70,22% 306 75,00% 56 107,69% Highly skilled supervision (levels 9 -12) 5 1,40% 4 0,98% -1 -1,92% Top and Senior management (levels 13-16) 1 0,28% 1 0,25% - -
Total 356 100,00% 408 100,00% 52 100,00%
EDUCATORS
Lower Skills (Level 1-2) - - - - - - Skilled (levels 3-5) 100 28,17% 97 23,83% -3 -5,77% Highly skilled production (levels 6-8) 250 70,42% 306 75,18% 56 107,69% Highly skilled supervision (levels 9 -12) 5 1,41% 4 0,98% -1 -1,92% Top and Senior management (levels 13-16) - - - - - -
Total 355 100,00% 407 100,00% 52 100,00%
PUBLIC SERVICE
Lower Skills (Level 1-2) - - - - - - Skilled (levels 3-5) - - - - - - Highly skilled production (levels 6-8) - - - - - - Highly skilled supervision (levels 9 -12) - - - - - - Top and Senior management (levels 13-16) 1 100,00% 1 100,00% - -
Total 1 100,00% 1 100,00% - - Table 3.9.2 Foreign workers by major occupation for the period 1 April 2018 and 31 March 2019
Major occupation
01 April 2018 31 March 2019 Change Number % of total Number % of total Number % Change
Educators 356 100.00% 407 100.00% 51 100.00% Total 356 100.00% 407 100.00% 51 100.00%

119
Annual Report for 2018/19 Financial Year Vote 04: Department of Education
Province of the Northern Cape
118
Race and Gender
Beneficiary Profile Cost Number of
beneficiaries Number of employees
% of total within group
Cost (R’000)
Average cost per
beneficiary Male 41 490 8,37% 635,65 15,50 Female 72 785 9,17% 719,67 10,00 Asian - 6 - - - Male - 3 - - - Female - 3 - - - Coloured 156 1 305 11,95% 1 562,48 10,02 Male 66 508 12,99% 636,21 9,64 Female 90 797 11,29% 926,27 10,29 White 20 98 20,41% 302,92 15,15 Male 1 8 12,50% 19,13 19,13 Female 19 90 21,11% 283,80 14,94
Disabled 1 6 16,67% 13,15 13,15 Total 290 2 690 10,78% 3 233,87 11,15
Table 3.8.2 Performance Rewards by salary band for personnel below Senior Management Service for the period 1 April 2018 to 31 March 2019
Beneficiary Profile Cost Total cost as a % of the total
personnel expenditure
Salary band Number of beneficiaries
Number of employees
% of total within salary
bands
Total Cost (R’000)
Average cost per
employee
Lower Skilled (Levels 1-2) 85 873 9,74% 423309.45 4 980,11 8.56%
Skilled (level 3-5) 132 1306 10,11% 1031698.35 7 815,90 20.85%
Highly skilled production (level 6-8)
43 338 12,72% 593385.75 13 799,67 11.99%
Highly skilled supervision (level 9-12)
20 136 14,71% 551273.1 27 563,66 11.14%
Total 280 2653 10,55% 2 599 666.65 9 284,52 52.54% Table 3.8.3 Performance Rewards by critical occupation for the period 1 April 2018 to 31 March 2019
Critical occupation Beneficiary Profile Cost Number of
beneficiaries Number of employees
% of total within
occupation
Total Cost (R’000)
Average cost per employee
C6020100 - - - - - C6010302 - - - - - C6010308 - - - - - Total - - - - -
Annual Report for 2018/19 Financial Year Vote 04: Department of Education
Province of the Northern Cape
119
Table 3.8.4 Performance related rewards (cash bonus), by salary band for Senior Management Service for the period 1 April 2018 to 31 March 2019
Salary band
Beneficiary Profile Cost Total cost as a % of the total personnel expenditure
Number of beneficiaries
Number of employees
% of total within salary
bands
Total Cost (R)
Average cost per
beneficiary (R)
Band A 6 27 22,22% 301 631,40 50 271,90 0,01 Band B 2 8 25,00% 116 142,30 58 071,15 0,00 Band C 1 1 100,00% 71 680,35 71 680,35 0,00 Band D 1 1 100,00% 144 753,84 144 753,84 0,00 Total 10 37 27,03% 634 207,89 63 420,79 0,01
3.9. Foreign Workers The tables below summarise the employment of foreign nationals in the department in terms of salary band and major occupation.
Table 3.9.1 Foreign workers by salary band for the period 1 April 2018 and 31 March 2019
Personnel Group Salary band
01 April 2018 31 March 2019 Change
Number % of total Number % of
total Number % in salary total
ALL PERSONNEL
Lower Skills (Level 1-2) - - - - - - Skilled (levels 3-5) 100 28,09% 97 23,77% -3 -5,77% Highly skilled production (levels 6-8) 250 70,22% 306 75,00% 56 107,69% Highly skilled supervision (levels 9 -12) 5 1,40% 4 0,98% -1 -1,92% Top and Senior management (levels 13-16) 1 0,28% 1 0,25% - -
Total 356 100,00% 408 100,00% 52 100,00%
EDUCATORS
Lower Skills (Level 1-2) - - - - - - Skilled (levels 3-5) 100 28,17% 97 23,83% -3 -5,77% Highly skilled production (levels 6-8) 250 70,42% 306 75,18% 56 107,69% Highly skilled supervision (levels 9 -12) 5 1,41% 4 0,98% -1 -1,92% Top and Senior management (levels 13-16) - - - - - -
Total 355 100,00% 407 100,00% 52 100,00%
PUBLIC SERVICE
Lower Skills (Level 1-2) - - - - - - Skilled (levels 3-5) - - - - - - Highly skilled production (levels 6-8) - - - - - - Highly skilled supervision (levels 9 -12) - - - - - - Top and Senior management (levels 13-16) 1 100,00% 1 100,00% - -
Total 1 100,00% 1 100,00% - - Table 3.9.2 Foreign workers by major occupation for the period 1 April 2018 and 31 March 2019
Major occupation
01 April 2018 31 March 2019 Change Number % of total Number % of total Number % Change
Educators 356 100.00% 407 100.00% 51 100.00% Total 356 100.00% 407 100.00% 51 100.00%

120
Annu
al R
epor
t for
201
8/19
Fin
ancia
l Yea
r Vo
te 0
4: D
epar
tmen
t of E
duca
tion
Prov
ince
of t
he N
orth
ern
Cape
- 120
- 3.
10.
Leav
e ut
ilisat
ion
Th
e Pu
blic
Ser
vice
Com
mis
sion
iden
tifie
d th
e ne
ed fo
r car
eful
mon
itorin
g of
sic
k le
ave
with
in th
e pu
blic
ser
vice
. The
follo
win
g ta
bles
pro
vide
an
indi
catio
n of
th
e us
e of
sic
k le
ave
and
disa
bilit
y le
ave.
In b
oth
case
s, th
e es
timat
ed c
ost o
f the
leav
e is
als
o pr
ovid
ed.
Tabl
e 3.
10.1
Sic
k le
ave
for t
he p
erio
d 1
Janu
ary
2018
to 3
1 D
ecem
ber 2
018
Pers
onne
l G
roup
Sa
lary
ban
d To
tal d
ays
Day
s w
ith
med
ical
ce
rtifi
catio
n
% D
ays
with
M
edic
al
cert
ifica
tion
Num
ber o
f Em
ploy
ees
usin
g si
ck
leav
e
% o
f tot
al
empl
oyee
s us
ing
sick
le
ave
Ave
rage
da
ys p
er
(sic
k)
empl
oyee
Ave
rage
da
ys p
er
(all)
em
ploy
ee
Estim
ated
C
ost
(R’0
00)
ALL
PER
SON
NEL
Low
er S
kills
(Lev
el 1
-2)
3 87
0 3
385
87.4
7%
499
6.58
%
8 5
R 1
575
S
kille
d (le
vels
3-5
) 10
765
9
438
87.6
7%
1 21
5 16
.01%
9
5 R
6 8
25
Hig
hly
skille
d pr
oduc
tion
(leve
ls 6
-8)
45 1
02
40 0
59
88.8
2%
4 42
8 58
.35%
10
6
R 5
0 98
7 H
ighl
y sk
illed
supe
rvis
ion
(leve
ls 9
-12
) 21
422
19
986
93
.30%
1
419
18.7
0%
15
9 R
37
088
Top
and
Sen
ior m
anag
emen
t (le
vels
13
-16)
30
7 27
5 89
.58%
28
0.
37%
11
8
R 8
62
Tota
l 81
466
73
143
89
.78%
75
89
100.
00%
53
33
R
97
337
EDU
CAT
OR
S
Low
er S
kills
(Lev
el 1
-2)
- -
- -
- -
- -
Ski
lled
(leve
ls 3
-5)
1 70
6 1
366
80.0
7%
338
5.81
%
5 2
R 1
119
H
ighl
y sk
illed
prod
uctio
n (le
vels
6-8
) 41
700
37
078
88
.92%
4
166
71.6
3%
10
6 R
47
240
Hig
hly
skille
d su
perv
isio
n (le
vels
9 -
12)
20 5
52
19 2
54
93.6
8%
1 31
2 22
.56%
16
10
R
35
513
Top
and
Sen
ior m
anag
emen
t (le
vels
13
-16)
-
- -
- -
- -
-
Tota
l 63
958
57
698
90
.21%
58
16
100.
00%
31
18
R
83
872
PUB
LIC
SE
RVI
CE
Low
er S
kills
(Lev
el 1
-2)
3 87
0 3
385
87.4
7%
499
28.1
4%
8 5
R 1
575
S
kille
d (le
vels
3-5
) 9
059
8 07
2 89
.10%
87
7 49
.46%
10
7
R 5
706
H
ighl
y sk
illed
prod
uctio
n (le
vels
6-8
) 3
402
2 98
1 87
.62%
26
2 14
.78%
13
10
R
3 7
48
Hig
hly
skille
d su
perv
isio
n (le
vels
9 -
12)
870
732
84.1
4%
107
6.03
%
8 6
R 1
575
Top
and
Sen
ior m
anag
emen
t (le
vels
13
-16)
30
7 27
5 89
.58%
28
1.
58%
11
8
R 8
62
Tota
l 17
508
15
445
88
.22%
17
73
100.
00%
50
36
R
13
466
Annu
al R
epor
t for
201
8/19
Fin
ancia
l Yea
r Vo
te 0
4: D
epar
tmen
t of E
duca
tion
Prov
ince
of t
he N
orth
ern
Cape
121
Tabl
e 3.
10.2
Dis
abilit
y le
ave
(tem
pora
ry a
nd p
erm
anen
t) fo
r the
per
iod
1 Ja
nuar
y 20
18 to
31
Dec
embe
r 201
8 Pe
rson
nel
Gro
up
Sala
ry b
and
Tota
l day
s D
ays
with
m
edic
al
cert
ifica
tion
% D
ays
with
M
edic
al
cert
ifica
tion
Num
ber o
f Em
ploy
ees
usin
g si
ck
leav
e
% o
f tot
al
empl
oyee
s us
ing
sick
le
ave
Ave
rage
da
ys p
er
(sic
k)
empl
oyee
Ave
rage
da
ys p
er
(all)
em
ploy
ee
Estim
ated
C
ost
(R’0
00)
ALL
PER
SON
NEL
Low
er S
kills
(Lev
el 1
-2)
1 25
3 1
253
100,
00%
57
6,
28%
22
1,
47
R 5
11
Ski
lled
(leve
ls 3
-5)
4 11
2 4
110
99,9
5%
146
16,1
0%
28
1,87
R
2 5
40
Hig
hly
skille
d pr
oduc
tion
(leve
ls 6
-8)
20 4
22
20 4
15
99,9
7%
464
51,1
6%
44
2,84
R
23
298
Hig
hly
skille
d su
perv
isio
n (le
vels
9 -1
2)
12 3
39
12 3
16
99,8
1%
236
26,0
2%
52
5,38
R
21
164
Top
and
Sen
ior m
anag
emen
t (le
vels
13
-16)
14
5 14
5 10
0,00
%
4 0,
44%
36
3,
92
R 3
94
Tota
l 38
271
38
239
99
,92%
90
7 10
0,00
%
42
3,04
R
47
906
EDU
CAT
OR
S
Low
er S
kills
(Lev
el 1
-2)
- -
- -
- -
- -
Ski
lled
(leve
ls 3
-5)
169
169
100,
00%
7
1,11
%
24
0,18
R
95
Hig
hly
skille
d pr
oduc
tion
(leve
ls 6
-8)
18 7
20
18 7
13
99,9
6%
404
63,8
2%
46
2,73
R
21
380
Hig
hly
skille
d su
perv
isio
n (le
vels
9 -1
2)
12 1
49
12 1
26
99,8
1%
222
35,0
7%
55
5,62
R
20
825
Top
and
Sen
ior m
anag
emen
t (le
vels
13
-16)
-
- -
- -
- -
- To
tal
31 0
38
31 0
08
99,9
0%
633
100,
00%
49
3,
12
R 4
2 30
1
PUB
LIC
SE
RVI
CE
Low
er S
kills
(Lev
el 1
-2)
1 25
3 1
253
100,
00%
57
20
,80%
22
1,
47
R 5
11
Ski
lled
(leve
ls 3
-5)
3 94
3 3
941
99,9
5%
139
50,7
3%
28
3,11
R
2 4
45
Hig
hly
skille
d pr
oduc
tion
(leve
ls 6
-8)
1 70
2 1
702
100,
00%
60
21
,90%
28
5,
08
R 1
918
H
ighl
y sk
illed
supe
rvis
ion
(leve
ls 9
-12)
19
0 19
0 10
0,00
%
14
5,11
%
14
1,41
R
339
To
p an
d S
enio
r man
agem
ent (
leve
ls
13-1
6)
145
145
100,
00%
4
1,46
%
36
3,92
R
394
To
tal
7 23
3 7
231
99,9
7%
274
100,
00%
26
2,
75
R 5
606

121
Annu
al R
epor
t for
201
8/19
Fin
ancia
l Yea
r Vo
te 0
4: D
epar
tmen
t of E
duca
tion
Prov
ince
of t
he N
orth
ern
Cape
121
Tabl
e 3.
10.2
Dis
abilit
y le
ave
(tem
pora
ry a
nd p
erm
anen
t) fo
r the
per
iod
1 Ja
nuar
y 20
18 to
31
Dec
embe
r 201
8 Pe
rson
nel
Gro
up
Sala
ry b
and
Tota
l day
s D
ays
with
m
edic
al
cert
ifica
tion
% D
ays
with
M
edic
al
cert
ifica
tion
Num
ber o
f Em
ploy
ees
usin
g si
ck
leav
e
% o
f tot
al
empl
oyee
s us
ing
sick
le
ave
Ave
rage
da
ys p
er
(sic
k)
empl
oyee
Ave
rage
da
ys p
er
(all)
em
ploy
ee
Estim
ated
C
ost
(R’0
00)
ALL
PER
SON
NEL
Low
er S
kills
(Lev
el 1
-2)
1 25
3 1
253
100,
00%
57
6,
28%
22
1,
47
R 5
11
Ski
lled
(leve
ls 3
-5)
4 11
2 4
110
99,9
5%
146
16,1
0%
28
1,87
R
2 5
40
Hig
hly
skille
d pr
oduc
tion
(leve
ls 6
-8)
20 4
22
20 4
15
99,9
7%
464
51,1
6%
44
2,84
R
23
298
Hig
hly
skille
d su
perv
isio
n (le
vels
9 -1
2)
12 3
39
12 3
16
99,8
1%
236
26,0
2%
52
5,38
R
21
164
Top
and
Sen
ior m
anag
emen
t (le
vels
13
-16)
14
5 14
5 10
0,00
%
4 0,
44%
36
3,
92
R 3
94
Tota
l 38
271
38
239
99
,92%
90
7 10
0,00
%
42
3,04
R
47
906
EDU
CAT
OR
S
Low
er S
kills
(Lev
el 1
-2)
- -
- -
- -
- -
Ski
lled
(leve
ls 3
-5)
169
169
100,
00%
7
1,11
%
24
0,18
R
95
Hig
hly
skille
d pr
oduc
tion
(leve
ls 6
-8)
18 7
20
18 7
13
99,9
6%
404
63,8
2%
46
2,73
R
21
380
Hig
hly
skille
d su
perv
isio
n (le
vels
9 -1
2)
12 1
49
12 1
26
99,8
1%
222
35,0
7%
55
5,62
R
20
825
Top
and
Sen
ior m
anag
emen
t (le
vels
13
-16)
-
- -
- -
- -
- To
tal
31 0
38
31 0
08
99,9
0%
633
100,
00%
49
3,
12
R 4
2 30
1
PUB
LIC
SE
RVI
CE
Low
er S
kills
(Lev
el 1
-2)
1 25
3 1
253
100,
00%
57
20
,80%
22
1,
47
R 5
11
Ski
lled
(leve
ls 3
-5)
3 94
3 3
941
99,9
5%
139
50,7
3%
28
3,11
R
2 4
45
Hig
hly
skille
d pr
oduc
tion
(leve
ls 6
-8)
1 70
2 1
702
100,
00%
60
21
,90%
28
5,
08
R 1
918
H
ighl
y sk
illed
supe
rvis
ion
(leve
ls 9
-12)
19
0 19
0 10
0,00
%
14
5,11
%
14
1,41
R
339
To
p an
d S
enio
r man
agem
ent (
leve
ls
13-1
6)
145
145
100,
00%
4
1,46
%
36
3,92
R
394
To
tal
7 23
3 7
231
99,9
7%
274
100,
00%
26
2,
75
R 5
606

122
Annual Report for 2018/19 Financial Year Vote 04: Department of Education
Province of the Northern Cape
- 122 -
The table below summarises the utilisation of annual leave. The wage agreement concluded with trade unions in the PSCBC in 2000 requires management of annual leave to prevent high levels of accrued leave being paid at the time of termination of service.
Table 3.10.3 Annual Leave for the period 1 January 2018 to 31 December 2018
Group Salary band Total days taken
Average number of
days taken per employee
Number of employees with annual
leave
All
Pers
onne
l
Lower skilled (Levels 1-2) 14 251 18 800
Skilled (Levels 3-5) 24 235 20 1 223 Highly skilled production (Levels 6-8) 8 265 21 394 Highly skilled supervision(Levels 9-12) 15 273 23 651 Senior management (Levels 13-16) 919 24 38 Total 62 943 20 3 106
Educ
ator
s
Lower skilled (Levels 1-2) - - - Skilled (Levels 3-5) - - - Highly skilled production (Levels 6-8) 443 7 63 Highly skilled supervision(Levels 9-12) 12 100 23 516 Senior management (Levels 13-16) - - - Total 12 543 22 579
Publ
ic S
ervi
ce
Lower skilled (Levels 1-2) 14 251 18 800
Skilled (Levels 3-5) 24 235 20 1 223 Highly skilled production (Levels 6-8) 7 822 24 331 Highly skilled supervision(Levels 9-12) 3 173 24 135 Senior management (Levels 13-16) 919 24 38 Total 50 400 20 2 527
Note: The annual leave entitlement and measures in respect of office-based educators make provision for office-based educators to qualify for annual leave of between 22 and 30 days per annum, based on the number of years of service. All institution-based educators are regarded as being on annual leave during institution closure periods.
Annual Report for 2018/19 Financial Year Vote 04: Department of Education
Province of the Northern Cape
123
Table 3.10.4 Capped leave for the period 1 January 2018 to 31 December 2018 Group Salary band Total
capped leave
available as at 23
Dec 2016
Total days of capped leave taken
Number of
Employees using capped leave
Average number of days
taken per employee
Number of
employees with
capped leave as at 22 Dec
2017
Total capped leave
available as at 22 Dec 2017
All
Pers
onne
l
Lower skilled (Levels 1-2) 145 - - - 3 144 Skilled Levels 3-5) 22 125 2 203 64 34 413 18 506 Highly skilled production (Levels 6-8) 103 351 8 116 162 50 1 646 89 526 Highly skilled supervision(Levels 9-12)
122 151 8 494 175 49 1 772
110 455
Senior management (Levels 13-16) 1 292 189 3 63 22 1 356 Total
249 064 19 002 404 47 3 856 219 987
Educ
ator
s
Lower skilled (Levels 1-2) - - - - - - Skilled Levels 3-5) 296 64 1 64 2 106 Highly skilled production (Levels 6-8) 92 336 7 233 132 55 1 457 79 439 Highly skilled supervision(Levels 9-12)
119 526 8 448 173 49 1 714
107 827
Senior management (Levels 13-16) - - - - - - Total
212 158 15 745 306 51 3173 187 372
Publ
ic S
ervi
ce
Lower skilled (Levels 1-2) 145 - - - 3 144 Skilled Levels 3-5) 21 829 2 139 63 34 411 18 400 Highly skilled production (Levels 6-8) 11 015 883 30 29 189 10 087 Highly skilled supervision(Levels 9-12) 2 626 46 2 23 58 2 628 Senior management (Levels 13-16) 1 292 189 3 63 22 1 356 Total 36 906 3 257 98 33 683 32 615

123
Annual Report for 2018/19 Financial Year Vote 04: Department of Education
Province of the Northern Cape
- 122 -
The table below summarises the utilisation of annual leave. The wage agreement concluded with trade unions in the PSCBC in 2000 requires management of annual leave to prevent high levels of accrued leave being paid at the time of termination of service.
Table 3.10.3 Annual Leave for the period 1 January 2018 to 31 December 2018
Group Salary band Total days taken
Average number of
days taken per employee
Number of employees with annual
leave
All
Pers
onne
l
Lower skilled (Levels 1-2) 14 251 18 800
Skilled (Levels 3-5) 24 235 20 1 223 Highly skilled production (Levels 6-8) 8 265 21 394 Highly skilled supervision(Levels 9-12) 15 273 23 651 Senior management (Levels 13-16) 919 24 38 Total 62 943 20 3 106
Educ
ator
s
Lower skilled (Levels 1-2) - - - Skilled (Levels 3-5) - - - Highly skilled production (Levels 6-8) 443 7 63 Highly skilled supervision(Levels 9-12) 12 100 23 516 Senior management (Levels 13-16) - - - Total 12 543 22 579
Publ
ic S
ervi
ce
Lower skilled (Levels 1-2) 14 251 18 800
Skilled (Levels 3-5) 24 235 20 1 223 Highly skilled production (Levels 6-8) 7 822 24 331 Highly skilled supervision(Levels 9-12) 3 173 24 135 Senior management (Levels 13-16) 919 24 38 Total 50 400 20 2 527
Note: The annual leave entitlement and measures in respect of office-based educators make provision for office-based educators to qualify for annual leave of between 22 and 30 days per annum, based on the number of years of service. All institution-based educators are regarded as being on annual leave during institution closure periods.
Annual Report for 2018/19 Financial Year Vote 04: Department of Education
Province of the Northern Cape
123
Table 3.10.4 Capped leave for the period 1 January 2018 to 31 December 2018 Group Salary band Total
capped leave
available as at 23
Dec 2016
Total days of capped leave taken
Number of
Employees using capped leave
Average number of days
taken per employee
Number of
employees with
capped leave as at 22 Dec
2017
Total capped leave
available as at 22 Dec 2017
All
Pers
onne
l
Lower skilled (Levels 1-2) 145 - - - 3 144 Skilled Levels 3-5) 22 125 2 203 64 34 413 18 506 Highly skilled production (Levels 6-8) 103 351 8 116 162 50 1 646 89 526 Highly skilled supervision(Levels 9-12)
122 151 8 494 175 49 1 772
110 455
Senior management (Levels 13-16) 1 292 189 3 63 22 1 356 Total
249 064 19 002 404 47 3 856 219 987
Educ
ator
s
Lower skilled (Levels 1-2) - - - - - - Skilled Levels 3-5) 296 64 1 64 2 106 Highly skilled production (Levels 6-8) 92 336 7 233 132 55 1 457 79 439 Highly skilled supervision(Levels 9-12)
119 526 8 448 173 49 1 714
107 827
Senior management (Levels 13-16) - - - - - - Total
212 158 15 745 306 51 3173 187 372
Publ
ic S
ervi
ce
Lower skilled (Levels 1-2) 145 - - - 3 144 Skilled Levels 3-5) 21 829 2 139 63 34 411 18 400 Highly skilled production (Levels 6-8) 11 015 883 30 29 189 10 087 Highly skilled supervision(Levels 9-12) 2 626 46 2 23 58 2 628 Senior management (Levels 13-16) 1 292 189 3 63 22 1 356 Total 36 906 3 257 98 33 683 32 615

124
Annual Report for 2018/19 Financial Year Vote 04: Department of Education
Province of the Northern Cape
124
The following table summarise payments made to employees as a result of leave that was not taken. Table 3.10.5 Leave payouts for the period 1 April 2018 and 31 March 2019
Reason Total amount (R’000)
Number of employees
Average per employee
(R’000) Leave payout for 2017/18 due to non-utilisation of leave for the previous cycle
- - -
Capped leave payouts on termination of service for 2018/19
30 154 221 100
Current leave payout on termination of service for 2018/19
- - -
Total 30 154 221 100 3.11. HIV/AIDS & Health Promotion Programmes Table 3.11.1 Steps taken to reduce the risk of occupational exposure
Units/categories of employees identified to be at high risk of contracting HIV & related diseases (if any)
Key steps taken to reduce the risk
Not applicable to Department of Education Table 3.11.2 Details of Health Promotion and HIV/AIDS Programmes (tick the applicable boxes and provide the required information)
Question Yes No Details, if yes 1. Has the department designated a member of the SMS to implement the provisions contained in Part VI E of Chapter 1 of the Public Service Regulations, 2001? If so, provide her/his name and position.
Mr MC Mothelesi Director: HR Practices & Admin
2. Does the department have a dedicated unit or has it designated specific staff members to promote the health and well-being of your employees? If so, indicate the number of employees who are involved in this task and the annual budget that is available for this purpose.
7 Head Office 3 x Districts
Total: 10 officials Budget: 283 800,00
3. Has the department introduced an Employee Assistance or Health Promotion Programme for your employees? If so, indicate the key elements/services of this Programme.
EHW introduced the GEMS health sessions taking place weekly in the department. Outdoor teambuilding sessions happening quarterly. Promotion of voluntary testing & counselling.
4. Has the department established (a) committee(s) as contemplated in Part VI E.5 (e) of Chapter 1 of the Public Service Regulations, 2001? If so, please provide the names of the members of the committee and the stakeholder(s) that they represent.
Occupational Health & Safety committee for Head office & districts. Ms KP Cwaile: EHW Mr JB Maruping: EHW
Ms D Mapatsi: EHW Ms S Duba: EHW Ms B Setshogela: EHW
Annual Report for 2018/19 Financial Year Vote 04: Department of Education
Province of the Northern Cape
125
Question Yes No Details, if yes Ms A Simons: EHW Ms A van Wyk: EHW
Mr P Dehuis: EHW Mr M Selani: Infrastructure Mr P Wolfe: Communications Ms Z Toffar: IT Mr N Nkukwana; Security Ms H Burrow: Curriculum
Ms R Moncho: Registry Ms A Moilwa: Legal Ms A Femmers: Finance Ms V Nqoyi: ERPM Ms DTonyane: SCM
Pixley Ka Seme Ms N Mvenya: EHW Mr C Dombo: ERPM Frances Baard
Ms M Seboletswe: EHW Ms P Abrams: HR Mr R Diraditsile: EPMDS Namakwa Mr D Cloete: EHW
Ms D Brand: Finance Mr H Mans: Curriculum
5. Has the department reviewed its employment policies and practices to ensure that these do not unfairly discriminate against employees on the basis of their HIV status? If so, list the employment policies/practices so reviewed.
All 4 policies are currently under review.
HIV/AIDS. TB & STI policy SHERQ policy Health & Productivity policy Wellness policy
6. Has the department introduced measures to protect HIV-positive employees or those perceived to be HIV-positive from discrimination? If so, list the key elements of these measures.
Privacy and confidentiality of personal information of all employees is strictly maintained at all times, and an environment is created wherein all employees’ HIV status confidential and should not be disclosed to any person without the affect person’s written consent.

125
Annual Report for 2018/19 Financial Year Vote 04: Department of Education
Province of the Northern Cape
124
The following table summarise payments made to employees as a result of leave that was not taken. Table 3.10.5 Leave payouts for the period 1 April 2018 and 31 March 2019
Reason Total amount (R’000)
Number of employees
Average per employee
(R’000) Leave payout for 2017/18 due to non-utilisation of leave for the previous cycle
- - -
Capped leave payouts on termination of service for 2018/19
30 154 221 100
Current leave payout on termination of service for 2018/19
- - -
Total 30 154 221 100 3.11. HIV/AIDS & Health Promotion Programmes Table 3.11.1 Steps taken to reduce the risk of occupational exposure
Units/categories of employees identified to be at high risk of contracting HIV & related diseases (if any)
Key steps taken to reduce the risk
Not applicable to Department of Education Table 3.11.2 Details of Health Promotion and HIV/AIDS Programmes (tick the applicable boxes and provide the required information)
Question Yes No Details, if yes 1. Has the department designated a member of the SMS to implement the provisions contained in Part VI E of Chapter 1 of the Public Service Regulations, 2001? If so, provide her/his name and position.
Mr MC Mothelesi Director: HR Practices & Admin
2. Does the department have a dedicated unit or has it designated specific staff members to promote the health and well-being of your employees? If so, indicate the number of employees who are involved in this task and the annual budget that is available for this purpose.
7 Head Office 3 x Districts
Total: 10 officials Budget: 283 800,00
3. Has the department introduced an Employee Assistance or Health Promotion Programme for your employees? If so, indicate the key elements/services of this Programme.
EHW introduced the GEMS health sessions taking place weekly in the department. Outdoor teambuilding sessions happening quarterly. Promotion of voluntary testing & counselling.
4. Has the department established (a) committee(s) as contemplated in Part VI E.5 (e) of Chapter 1 of the Public Service Regulations, 2001? If so, please provide the names of the members of the committee and the stakeholder(s) that they represent.
Occupational Health & Safety committee for Head office & districts. Ms KP Cwaile: EHW Mr JB Maruping: EHW
Ms D Mapatsi: EHW Ms S Duba: EHW Ms B Setshogela: EHW
Annual Report for 2018/19 Financial Year Vote 04: Department of Education
Province of the Northern Cape
125
Question Yes No Details, if yes Ms A Simons: EHW Ms A van Wyk: EHW
Mr P Dehuis: EHW Mr M Selani: Infrastructure Mr P Wolfe: Communications Ms Z Toffar: IT Mr N Nkukwana; Security Ms H Burrow: Curriculum
Ms R Moncho: Registry Ms A Moilwa: Legal Ms A Femmers: Finance Ms V Nqoyi: ERPM Ms DTonyane: SCM
Pixley Ka Seme Ms N Mvenya: EHW Mr C Dombo: ERPM Frances Baard
Ms M Seboletswe: EHW Ms P Abrams: HR Mr R Diraditsile: EPMDS Namakwa Mr D Cloete: EHW
Ms D Brand: Finance Mr H Mans: Curriculum
5. Has the department reviewed its employment policies and practices to ensure that these do not unfairly discriminate against employees on the basis of their HIV status? If so, list the employment policies/practices so reviewed.
All 4 policies are currently under review.
HIV/AIDS. TB & STI policy SHERQ policy Health & Productivity policy Wellness policy
6. Has the department introduced measures to protect HIV-positive employees or those perceived to be HIV-positive from discrimination? If so, list the key elements of these measures.
Privacy and confidentiality of personal information of all employees is strictly maintained at all times, and an environment is created wherein all employees’ HIV status confidential and should not be disclosed to any person without the affect person’s written consent.

126
Annual Report for 2018/19 Financial Year Vote 04: Department of Education
Province of the Northern Cape
126
Question Yes No Details, if yes 7. Does the department encourage its employees to undergo Voluntary Counselling and Testing? If so, list the results that you have you achieved.
Females 81 Males 28
8. Has the department developed measures/indicators to monitor & evaluate the impact of its health promotion programme? If so, list these measures/indicators.
The Unit evaluate its performance through the following reports:
Internal Quarterly planning according to the Health Calendar. Submitting of reports to OTP & DPSA GEMS Reports
3.12. Labour Relations
Table 3.12.1 Collective agreements for the period 1 April 2018 and 31 March 2019
Subject matter Date Vote weights for the trade unions that are parties to council 3 July 2018
Amendments to paragraph B8.5.2 & B 8.5.3 of the Personnel Administrative Measures
25 September 2018
Providing for compulsory inquiries by arbitrators in cases of disciplinary action against educators charged with sexual misconduct in respect of learners
25 September 2018
The appointment and conversion of temporary educators to posts on the educator establishment
25 September 2018
Total number of Collective agreements 3
The following table summarises the outcome of disciplinary hearings conducted within the department for the year under review. Table 3.12.2 Misconduct and disciplinary hearings finalised for the period 1 April 2018 and 31 March 2019
Outcomes of disciplinary hearings Number % of total Correctional counselling 03 6,00%
Verbal warning - -
Written warning 02 4,00%
Final written warning 17 34,00%
Suspended without pay 7 14,00%
Fine 4 8,00%
Demotion 1 2,00%
Dismissal 15 30.00%
Not guilty 1 2,00%
Case withdrawn - -
Annual Report for 2018/19 Financial Year Vote 04: Department of Education
Province of the Northern Cape
127
Outcomes of disciplinary hearings Number % of total Total 50 100,00%
Total number of Disciplinary hearings finalised 44
Table 3.12.3 Types of misconduct addressed at disciplinary hearings for the period 1 April 2018 and 31 March 2019
Type of misconduct Number % of total
Continuous late coming 01 2,00% Mismanagement of school finances 01 2,00% Assault of learner 03 6,00% Under the influence of alcohol at work 01 2,00% Examination irregularity 09 18,00% Dishonesty and fraud 02 4,00% Abscondment 08 16,00% Improper, disgraceful behaviour 01 2,00% Sexual relationship with a learner 05 10,00% Illegal possession of an intoxicating, illegal or stupefying substance 01 2,00% Insubordination 01 2,00% Distribution of letters without the knowledge of supervisor 01 2,00% Transporting of unauthorized passengers 01 2,00% Total 50 100,00%
Table 3.12.4 Grievances logged for the period 1 April 2018 and 31 March 2019
Grievances Number % of Total Number of grievances resolved 18 66,67% Number of grievances not resolved 09 33,33% Total number of grievances lodged 27 100,00%
Table 3.12.5 Disputes logged with Councils for the period 1 April 2018 and 31 March 2019
Disputes Number % of Total Number of disputes upheld 09 64,29%
Number of disputes dismissed 05 35,71%
Total number of disputes lodged 14 100,00%
Table 3.12.6 Strike actions for the period 1 April 2018 and 31 March 2019
Total number of persons working days lost - Total costs working days lost - Amount recovered as a result of no work no pay (R’000)
Table 3.12.7 Precautionary suspensions for the period 1 April 2018 and 31 March 2019
Number of people suspended 04 Number of people who’s suspension exceeded 30 days
04
Average number of days suspended 116.28 Cost of suspension(R’000) R913

127
Annual Report for 2018/19 Financial Year Vote 04: Department of Education
Province of the Northern Cape
126
Question Yes No Details, if yes 7. Does the department encourage its employees to undergo Voluntary Counselling and Testing? If so, list the results that you have you achieved.
Females 81 Males 28
8. Has the department developed measures/indicators to monitor & evaluate the impact of its health promotion programme? If so, list these measures/indicators.
The Unit evaluate its performance through the following reports:
Internal Quarterly planning according to the Health Calendar. Submitting of reports to OTP & DPSA GEMS Reports
3.12. Labour Relations
Table 3.12.1 Collective agreements for the period 1 April 2018 and 31 March 2019
Subject matter Date Vote weights for the trade unions that are parties to council 3 July 2018
Amendments to paragraph B8.5.2 & B 8.5.3 of the Personnel Administrative Measures
25 September 2018
Providing for compulsory inquiries by arbitrators in cases of disciplinary action against educators charged with sexual misconduct in respect of learners
25 September 2018
The appointment and conversion of temporary educators to posts on the educator establishment
25 September 2018
Total number of Collective agreements 3
The following table summarises the outcome of disciplinary hearings conducted within the department for the year under review. Table 3.12.2 Misconduct and disciplinary hearings finalised for the period 1 April 2018 and 31 March 2019
Outcomes of disciplinary hearings Number % of total Correctional counselling 03 6,00%
Verbal warning - -
Written warning 02 4,00%
Final written warning 17 34,00%
Suspended without pay 7 14,00%
Fine 4 8,00%
Demotion 1 2,00%
Dismissal 15 30.00%
Not guilty 1 2,00%
Case withdrawn - -
Annual Report for 2018/19 Financial Year Vote 04: Department of Education
Province of the Northern Cape
127
Outcomes of disciplinary hearings Number % of total Total 50 100,00%
Total number of Disciplinary hearings finalised 44
Table 3.12.3 Types of misconduct addressed at disciplinary hearings for the period 1 April 2018 and 31 March 2019
Type of misconduct Number % of total
Continuous late coming 01 2,00% Mismanagement of school finances 01 2,00% Assault of learner 03 6,00% Under the influence of alcohol at work 01 2,00% Examination irregularity 09 18,00% Dishonesty and fraud 02 4,00% Abscondment 08 16,00% Improper, disgraceful behaviour 01 2,00% Sexual relationship with a learner 05 10,00% Illegal possession of an intoxicating, illegal or stupefying substance 01 2,00% Insubordination 01 2,00% Distribution of letters without the knowledge of supervisor 01 2,00% Transporting of unauthorized passengers 01 2,00% Total 50 100,00%
Table 3.12.4 Grievances logged for the period 1 April 2018 and 31 March 2019
Grievances Number % of Total Number of grievances resolved 18 66,67% Number of grievances not resolved 09 33,33% Total number of grievances lodged 27 100,00%
Table 3.12.5 Disputes logged with Councils for the period 1 April 2018 and 31 March 2019
Disputes Number % of Total Number of disputes upheld 09 64,29%
Number of disputes dismissed 05 35,71%
Total number of disputes lodged 14 100,00%
Table 3.12.6 Strike actions for the period 1 April 2018 and 31 March 2019
Total number of persons working days lost - Total costs working days lost - Amount recovered as a result of no work no pay (R’000)
Table 3.12.7 Precautionary suspensions for the period 1 April 2018 and 31 March 2019
Number of people suspended 04 Number of people who’s suspension exceeded 30 days
04
Average number of days suspended 116.28 Cost of suspension(R’000) R913

128
Annual Report for 2018/19 Financial Year Vote 04: Department of Education
Province of the Northern Cape
128
3.13. Skills development
This section highlights the efforts of the department with regard to skills development.
Table 3.13.1 Training needs identified for the period 1 April 2018 and 31 March 2019 Occupational category Gender Number of
employees as at 1
April 2017
Training needs identified at start of the reporting period
Learnerships Skills Programmes
& other short
courses
Other forms of training
Total
Top Management (Level 14 -16)
Female 4 - 2 - 2 Male 5 - 3 - 3
Senior Management (Levels 13)
Female 10 - 4 - 4 Male 19 - 16 - 16
Professionally qualified and experienced (Level 11 – 12)
Female 21 - 200 20 220 Male
28 - 120 30 150
Skilled technical and academically qualified workers and skilled production (Level 8 -10)
Female 100 - 40 - 40 Male
87 - 18 - 18
Semi-skilled (Level 4 – 7)
Female 1 123 10 300 50 360 Male 481 5 200 40 245
Unskilled (Level 1 -3) Female 486 20 250 - 270 Male 451 15 370 - 385
Total 2 816 50 1 523 140 1 713
Table 3.13.2 Training provided for the period 1 April 2018 and 31 March 2019 Occupational category Gender Number of
employees as at 1
April 2017
Training provided within the reporting period Learnershi
ps Skills
Programmes & other
short courses
Other forms of training
Total
Top Management (Level 14 -16)
Female 4 - - - - Male 5 - - - -
Senior Management (Levels 13)
Female 10 - 13 - 13 Male 19 - 17 - 17
Professionally qualified and experienced (Level 11 – 12)
Female 21 - 100 - 100 Male 28 - 49 - 49
Skilled technical and academically qualified workers and skilled production (Level 8 -10)
Female 100 - 130 - 130 Male
87 - 56 - 56
Semi-skilled (Level 4 – 7) Female 1 123 - 840 - 840 Male 481 - 325 - 325
Unskilled (Level 1 -3) Female 486 17 27 - 27 Male 451 13 19 - 19
Total 2816 30 1 557 - 1 557 * EEA staff excluded
Annual Report for 2018/19 Financial Year Vote 04: Department of Education
Province of the Northern Cape
129
3.14. Injury on duty
The following tables provide basic information on injury on duty. Table 3.14.1 Injury on duty for the period 1 April 2018 and 31 March 2019
Nature of injury on duty Number % of total
Required basic medical attention only 14 100,00% Temporary Total Disablement - - Permanent Disablement - - Fatal - - Total 14 100,00%
3.15. Utilisation of Consultants The following tables relates information on the utilisation of consultants in the department. In terms of the Public Service Regulations “consultant’ means a natural or juristic person or a partnership who or which provides in terms of a specific contract on an ad hoc basis any of the following professional services to a department against remuneration received from any source:
(a) The rendering of expert advice; (b) The drafting of proposals for the execution of specific tasks; and (c) The execution of a specific task which is of a technical or intellectual nature, but excludes
an employee of a department.
Table 3.15.1 Report on consultant appointments using appropriated funds for the period 1 April 2018 and 31 March 2019
Project title Total number of consultants that worked
on project
Duration (work days)
Contract value in
Rand Financial Management and Audit Assistance
4 240 28 935 422
HR Information Management and Support
1 120 469 200
HR System Development and Support 3 50 488 604 Data Warehousing and Machine Learning
2 240 6 000 000
Learner Transport Organisational Review
2 470 000
Organisational Review 4 - 2 870 000

129
Annual Report for 2018/19 Financial Year Vote 04: Department of Education
Province of the Northern Cape
128
3.13. Skills development
This section highlights the efforts of the department with regard to skills development.
Table 3.13.1 Training needs identified for the period 1 April 2018 and 31 March 2019 Occupational category Gender Number of
employees as at 1
April 2017
Training needs identified at start of the reporting period
Learnerships Skills Programmes
& other short
courses
Other forms of training
Total
Top Management (Level 14 -16)
Female 4 - 2 - 2 Male 5 - 3 - 3
Senior Management (Levels 13)
Female 10 - 4 - 4 Male 19 - 16 - 16
Professionally qualified and experienced (Level 11 – 12)
Female 21 - 200 20 220 Male
28 - 120 30 150
Skilled technical and academically qualified workers and skilled production (Level 8 -10)
Female 100 - 40 - 40 Male
87 - 18 - 18
Semi-skilled (Level 4 – 7)
Female 1 123 10 300 50 360 Male 481 5 200 40 245
Unskilled (Level 1 -3) Female 486 20 250 - 270 Male 451 15 370 - 385
Total 2 816 50 1 523 140 1 713
Table 3.13.2 Training provided for the period 1 April 2018 and 31 March 2019 Occupational category Gender Number of
employees as at 1
April 2017
Training provided within the reporting period Learnershi
ps Skills
Programmes & other
short courses
Other forms of training
Total
Top Management (Level 14 -16)
Female 4 - - - - Male 5 - - - -
Senior Management (Levels 13)
Female 10 - 13 - 13 Male 19 - 17 - 17
Professionally qualified and experienced (Level 11 – 12)
Female 21 - 100 - 100 Male 28 - 49 - 49
Skilled technical and academically qualified workers and skilled production (Level 8 -10)
Female 100 - 130 - 130 Male
87 - 56 - 56
Semi-skilled (Level 4 – 7) Female 1 123 - 840 - 840 Male 481 - 325 - 325
Unskilled (Level 1 -3) Female 486 17 27 - 27 Male 451 13 19 - 19
Total 2816 30 1 557 - 1 557 * EEA staff excluded
Annual Report for 2018/19 Financial Year Vote 04: Department of Education
Province of the Northern Cape
129
3.14. Injury on duty
The following tables provide basic information on injury on duty. Table 3.14.1 Injury on duty for the period 1 April 2018 and 31 March 2019
Nature of injury on duty Number % of total
Required basic medical attention only 14 100,00% Temporary Total Disablement - - Permanent Disablement - - Fatal - - Total 14 100,00%
3.15. Utilisation of Consultants The following tables relates information on the utilisation of consultants in the department. In terms of the Public Service Regulations “consultant’ means a natural or juristic person or a partnership who or which provides in terms of a specific contract on an ad hoc basis any of the following professional services to a department against remuneration received from any source:
(a) The rendering of expert advice; (b) The drafting of proposals for the execution of specific tasks; and (c) The execution of a specific task which is of a technical or intellectual nature, but excludes
an employee of a department.
Table 3.15.1 Report on consultant appointments using appropriated funds for the period 1 April 2018 and 31 March 2019
Project title Total number of consultants that worked
on project
Duration (work days)
Contract value in
Rand Financial Management and Audit Assistance
4 240 28 935 422
HR Information Management and Support
1 120 469 200
HR System Development and Support 3 50 488 604 Data Warehousing and Machine Learning
2 240 6 000 000
Learner Transport Organisational Review
2 470 000
Organisational Review 4 - 2 870 000

130
Annual Report for 2018/19 Financial Year Vote 04: Department of Education
Province of the Northern Cape
130
Table 3.15.2 Analysis of consultant appointments using appropriated funds, in terms of Historically Disadvantaged Individuals (HDIs) for the period 1 April 2018 and 31 March 2019
Project title Percentage ownership by HDI
groups
Percentage management by HDI
groups
Number of consultants from HDI groups that work on
the project Financial Management and Audit Assistance
100% 100% 4
HR Information Management and Support
36.9% 7.9% None
HR System Development and Support
36.3% 63.6% 3
Data Warehousing and Machine Learning
81.0% 81.0% 2
Learner Transport Organisational Review
100% 100% 2
Organisational Review 100% 100% 75%
Table 3.15.3 Report on consultant appointments using Donor funds for the period 1 April 2017 and 31 March 2018
Project title Total Number of consultants that worked
on project
Duration (Work days)
Donor and contract value in Rand
- - - -
Total number of projects Total individual consultants
Total duration
Work days
Total contract value in Rand
- - - -
Table 3.15.4 Analysis of consultant appointments using Donor funds, in terms of Historically Disadvantaged Individuals (HDIs) for the period 1 April 2017 and 31 March 2018
Project title Percentage ownership by HDI groups
Percentage management by HDI
groups
Number of consultants from HDI groups that work on the project
Table 3.15.3 Report on consultant appointments using Donor funds for the period 1 April 2018 and 31 March 2019
Project title Total Number of consultants that worked
on project
Duration (Work days)
Donor and contract value in Rand
- - - -
Total number of projects Total individual consultants
Total duration
Work days
Total contract value in Rand
- - - -
Annual Report for 2018/19 Financial Year Vote 04: Department of Education
Province of the Northern Cape
131
Table 3.15.4 Analysis of consultant appointments using Donor funds, in terms of Historically Disadvantaged Individuals (HDIs) for the period 1 April 2018 and 31 March 2019
Project title Percentage ownership by HDI groups
Percentage management by HDI
groups
Number of consultants from HDI groups that work on the project
3.16. Severance Packages
Table 3.16.1 Granting of employee initiated severance packages for the period 1 April 2018 and 31 March 2019
Salary band Number of applications
received
Number of applications
referred to the MPSA
Number of applications supported by
MPSA
Number of packages
approved by department
Lower skilled (Levels 1-2)
- - - -
Skilled Levels 3-5) - - - - Highly skilled production (Levels 6-8)
- - - -
Highly skilled supervision(Levels 9-12)
- - - -
Senior management (Levels 13-16)
- - - -
Total - - - -

131
Annual Report for 2018/19 Financial Year Vote 04: Department of Education
Province of the Northern Cape
130
Table 3.15.2 Analysis of consultant appointments using appropriated funds, in terms of Historically Disadvantaged Individuals (HDIs) for the period 1 April 2018 and 31 March 2019
Project title Percentage ownership by HDI
groups
Percentage management by HDI
groups
Number of consultants from HDI groups that work on
the project Financial Management and Audit Assistance
100% 100% 4
HR Information Management and Support
36.9% 7.9% None
HR System Development and Support
36.3% 63.6% 3
Data Warehousing and Machine Learning
81.0% 81.0% 2
Learner Transport Organisational Review
100% 100% 2
Organisational Review 100% 100% 75%
Table 3.15.3 Report on consultant appointments using Donor funds for the period 1 April 2017 and 31 March 2018
Project title Total Number of consultants that worked
on project
Duration (Work days)
Donor and contract value in Rand
- - - -
Total number of projects Total individual consultants
Total duration
Work days
Total contract value in Rand
- - - -
Table 3.15.4 Analysis of consultant appointments using Donor funds, in terms of Historically Disadvantaged Individuals (HDIs) for the period 1 April 2017 and 31 March 2018
Project title Percentage ownership by HDI groups
Percentage management by HDI
groups
Number of consultants from HDI groups that work on the project
Table 3.15.3 Report on consultant appointments using Donor funds for the period 1 April 2018 and 31 March 2019
Project title Total Number of consultants that worked
on project
Duration (Work days)
Donor and contract value in Rand
- - - -
Total number of projects Total individual consultants
Total duration
Work days
Total contract value in Rand
- - - -
Annual Report for 2018/19 Financial Year Vote 04: Department of Education
Province of the Northern Cape
131
Table 3.15.4 Analysis of consultant appointments using Donor funds, in terms of Historically Disadvantaged Individuals (HDIs) for the period 1 April 2018 and 31 March 2019
Project title Percentage ownership by HDI groups
Percentage management by HDI
groups
Number of consultants from HDI groups that work on the project
3.16. Severance Packages
Table 3.16.1 Granting of employee initiated severance packages for the period 1 April 2018 and 31 March 2019
Salary band Number of applications
received
Number of applications
referred to the MPSA
Number of applications supported by
MPSA
Number of packages
approved by department
Lower skilled (Levels 1-2)
- - - -
Skilled Levels 3-5) - - - - Highly skilled production (Levels 6-8)
- - - -
Highly skilled supervision(Levels 9-12)
- - - -
Senior management (Levels 13-16)
- - - -
Total - - - -

132
Annual Report for 2018/19 Financial Year Vote 04: Department of Education
Province of the Northern Cape
132
PART E: FINANCIAL INFORMATION
Annual Report for 2018/19 Financial Year Vote 04: Department of Education
Province of the Northern Cape
133
1. REPORT OF THE AUDITOR GENERAL
Report of the Auditor-General to the Northern Cape Provincial Legislature on Vote No.4: Department of Education
Report on the audit of the financial statements Qualified opinion 1. I have audited the financial statements of the Department of Education set out on
pages 144 - 249, which comprise the appropriation statement, the statement of financial position as at 31 March 2019, the statement of financial performance, statement of changes in net assets and cash flow statement for the year then ended, as well as the notes to the financial statements, including a summary of significant accounting policies.
2. In my opinion, except for the effects of the matter described in the basis for qualified opinion section of this auditor’s report, the financial statements present fairly, in all material respects, the financial position of the Department of Education as at 31 March 2019, and its financial performance and cash flows for the year then ended in accordance with Modified Cash Standard (MCS) prescribed by National Treasury and the requirements of the Public Finance Management Act of South Africa, 1999 (Act No. 1 of 1999) (PFMA) and the Division of Revenue Act of South Africa, 2018 (Act No. 1 of 2018) (DoRA).
Basis for qualified opinion Immovable tangible capital assets 3. The department did not have adequate systems in place to account for immovable
tangible capital assets in accordance with Chapter 11, Capital Assets as disclosed in note 30 to the financial statements, which resulted in work in progress being overstated by R88 031 938 and immovable tangible capital assets and contracts terminated being understated by R86 139 198 and R1 892 740, respectively.
Context for the opinion 4. I conducted my audit in accordance with the International Standards on Auditing
(ISAs). My responsibilities under those standards are further described in the auditor-general’s responsibilities for the audit of the financial statements section of this auditor’s report.

133
Annual Report for 2018/19 Financial Year Vote 04: Department of Education
Province of the Northern Cape
132
PART E: FINANCIAL INFORMATION
Annual Report for 2018/19 Financial Year Vote 04: Department of Education
Province of the Northern Cape
133
1. REPORT OF THE AUDITOR GENERAL
Report of the Auditor-General to the Northern Cape Provincial Legislature on Vote No.4: Department of Education
Report on the audit of the financial statements Qualified opinion 1. I have audited the financial statements of the Department of Education set out on
pages 144 - 249, which comprise the appropriation statement, the statement of financial position as at 31 March 2019, the statement of financial performance, statement of changes in net assets and cash flow statement for the year then ended, as well as the notes to the financial statements, including a summary of significant accounting policies.
2. In my opinion, except for the effects of the matter described in the basis for qualified opinion section of this auditor’s report, the financial statements present fairly, in all material respects, the financial position of the Department of Education as at 31 March 2019, and its financial performance and cash flows for the year then ended in accordance with Modified Cash Standard (MCS) prescribed by National Treasury and the requirements of the Public Finance Management Act of South Africa, 1999 (Act No. 1 of 1999) (PFMA) and the Division of Revenue Act of South Africa, 2018 (Act No. 1 of 2018) (DoRA).
Basis for qualified opinion Immovable tangible capital assets 3. The department did not have adequate systems in place to account for immovable
tangible capital assets in accordance with Chapter 11, Capital Assets as disclosed in note 30 to the financial statements, which resulted in work in progress being overstated by R88 031 938 and immovable tangible capital assets and contracts terminated being understated by R86 139 198 and R1 892 740, respectively.
Context for the opinion 4. I conducted my audit in accordance with the International Standards on Auditing
(ISAs). My responsibilities under those standards are further described in the auditor-general’s responsibilities for the audit of the financial statements section of this auditor’s report.

134
Annual Report for 2018/19 Financial Year Vote 04: Department of Education
Province of the Northern Cape
134
5. I am independent of the department in accordance with sections 290 and 291 of the International Ethics Standards Board for Accountants’ Code of ethics for professional accountants (IESBA code), parts 1 and 3 of the International Ethics Standards Board for Accountants’ International Code of Ethics for Professional Accountants (including International Independence Standards) and the ethical requirements that are relevant to my audit in South Africa. I have fulfilled my other ethical responsibilities in accordance with these requirements and the IESBA codes.
6. I believe that the audit evidence I have obtained is sufficient and appropriate to provide a basis for my qualified opinion.
Emphasis of matters 7. I draw attention to the matter below. My opinion is not modified in respect of this
matter.
Uncertainty relating to the future outcome of exceptional litigation 8. With reference to note 18.1 to the financial statements, the department is a defendant
and the claimant in several lawsuits. The ultimate outcome of the matters cannot be determined at the time of the report, due to uncertainty of litigation.
Other matters 9. I draw attention to the matters below. My opinion is not modified in respect of these
matters.
Unaudited supplementary schedules 10. The supplementary information set out on pages 237 to 249 does not form part of the
financial statements and is presented as additional information. I have not audited these schedules and, accordingly, I do not express an opinion on them.
Service delivery 11. The audit revealed poor project management and monitoring of school infrastructure
projects. The department entered into a construction contract of New Jan Kempdorp Secondary School at a contract amount of R44 353 756. The project was anticipated to be completed on 17 June 2015 but was delayed as final completion has not been achieved to date. During the assessment of the project the school had severe structural cracks on the walls. Cracks could result in imminent collapse of a building. It was found that the root cause of defects is as the result of either poor workmanship by the contractor and/or poor designs by the consultants.
Annual Report for 2018/19 Financial Year Vote 04: Department of Education
Province of the Northern Cape
135
Responsibilities of the accounting officer for the financial statements 12. The accounting officer is responsible for the preparation and fair presentation of the
financial statements in accordance with MCS prescribed by National Treasury and the requirements of the PFMA and DoRA, and for such internal control as the accounting officer determines is necessary to enable the preparation of financial statements that are free from material misstatement, whether due to fraud or error.
13. In preparing the financial statements, the accounting officer is responsible for assessing the Department of Education’s ability to continue as a going concern, disclosing, as applicable, matters relating to going concern and using the going concern basis of accounting unless the appropriate governance structure either intends to liquidate the department or to cease operations, or has no realistic alternative but to do so.
Auditor-general’s responsibilities for the audit of the financial statements 14. My objectives are to obtain reasonable assurance about whether the financial
statements as a whole are free from material misstatement, whether due to fraud or error, and to issue an auditor’s report that includes my opinion. Reasonable assurance is a high level of assurance, but is not a guarantee that an audit conducted in accordance with the ISAs will always detect a material misstatement when it exists. Misstatements can arise from fraud or error and are considered material if, individually or in aggregate, they could reasonably be expected to influence the economic decisions of users taken on the basis of these financial statements.
15. A further description of my responsibilities for the audit of the financial statements is included in the annexure to this auditor’s report.
Report on the audit of the annual performance report Introduction and scope 16. In accordance with the Public Audit Act of South Africa, 2004 (Act No. 25 of 2004)
(PAA) and the general notice issued in terms thereof, I have a responsibility to report material findings on the reported performance information against predetermined objectives for selected programmes presented in the annual performance report. I performed procedures to identify findings but not to gather evidence to express assurance.
17. My procedures address the reported performance information, which must be based on the approved performance planning documents of the department. I have not evaluated the completeness and appropriateness of the performance indicators

135
Annual Report for 2018/19 Financial Year Vote 04: Department of Education
Province of the Northern Cape
134
5. I am independent of the department in accordance with sections 290 and 291 of the International Ethics Standards Board for Accountants’ Code of ethics for professional accountants (IESBA code), parts 1 and 3 of the International Ethics Standards Board for Accountants’ International Code of Ethics for Professional Accountants (including International Independence Standards) and the ethical requirements that are relevant to my audit in South Africa. I have fulfilled my other ethical responsibilities in accordance with these requirements and the IESBA codes.
6. I believe that the audit evidence I have obtained is sufficient and appropriate to provide a basis for my qualified opinion.
Emphasis of matters 7. I draw attention to the matter below. My opinion is not modified in respect of this
matter.
Uncertainty relating to the future outcome of exceptional litigation 8. With reference to note 18.1 to the financial statements, the department is a defendant
and the claimant in several lawsuits. The ultimate outcome of the matters cannot be determined at the time of the report, due to uncertainty of litigation.
Other matters 9. I draw attention to the matters below. My opinion is not modified in respect of these
matters.
Unaudited supplementary schedules 10. The supplementary information set out on pages 237 to 249 does not form part of the
financial statements and is presented as additional information. I have not audited these schedules and, accordingly, I do not express an opinion on them.
Service delivery 11. The audit revealed poor project management and monitoring of school infrastructure
projects. The department entered into a construction contract of New Jan Kempdorp Secondary School at a contract amount of R44 353 756. The project was anticipated to be completed on 17 June 2015 but was delayed as final completion has not been achieved to date. During the assessment of the project the school had severe structural cracks on the walls. Cracks could result in imminent collapse of a building. It was found that the root cause of defects is as the result of either poor workmanship by the contractor and/or poor designs by the consultants.
Annual Report for 2018/19 Financial Year Vote 04: Department of Education
Province of the Northern Cape
135
Responsibilities of the accounting officer for the financial statements 12. The accounting officer is responsible for the preparation and fair presentation of the
financial statements in accordance with MCS prescribed by National Treasury and the requirements of the PFMA and DoRA, and for such internal control as the accounting officer determines is necessary to enable the preparation of financial statements that are free from material misstatement, whether due to fraud or error.
13. In preparing the financial statements, the accounting officer is responsible for assessing the Department of Education’s ability to continue as a going concern, disclosing, as applicable, matters relating to going concern and using the going concern basis of accounting unless the appropriate governance structure either intends to liquidate the department or to cease operations, or has no realistic alternative but to do so.
Auditor-general’s responsibilities for the audit of the financial statements 14. My objectives are to obtain reasonable assurance about whether the financial
statements as a whole are free from material misstatement, whether due to fraud or error, and to issue an auditor’s report that includes my opinion. Reasonable assurance is a high level of assurance, but is not a guarantee that an audit conducted in accordance with the ISAs will always detect a material misstatement when it exists. Misstatements can arise from fraud or error and are considered material if, individually or in aggregate, they could reasonably be expected to influence the economic decisions of users taken on the basis of these financial statements.
15. A further description of my responsibilities for the audit of the financial statements is included in the annexure to this auditor’s report.
Report on the audit of the annual performance report Introduction and scope 16. In accordance with the Public Audit Act of South Africa, 2004 (Act No. 25 of 2004)
(PAA) and the general notice issued in terms thereof, I have a responsibility to report material findings on the reported performance information against predetermined objectives for selected programmes presented in the annual performance report. I performed procedures to identify findings but not to gather evidence to express assurance.
17. My procedures address the reported performance information, which must be based on the approved performance planning documents of the department. I have not evaluated the completeness and appropriateness of the performance indicators

136
Annual Report for 2018/19 Financial Year Vote 04: Department of Education
Province of the Northern Cape
136
included in the planning documents. My procedures also did not extend to any disclosures or assertions relating to planned performance strategies and information in respect of future periods that may be included as part of the reported performance information. Accordingly, my findings do not extend to these matters.
18. I evaluated the usefulness and reliability of the reported performance information in accordance with the criteria developed from the performance management and reporting framework, as defined in the general notice, for the following selected programmes presented in the annual performance report of the department for the year ended 31 March 2019:
Programmes Pages in the annual performance report
Programme 2 – Public Ordinary School Education 42-52
Programme 5 – Early Childhood Development 60-63
Programme 6 – Infrastructure Development 64-74
Programme 7 – Examination and Education-related
services 75-80
19. I performed procedures to determine whether the reported performance information was properly presented and whether performance was consistent with the approved performance planning documents. I performed further procedures to determine whether the indicators and related targets were measurable and relevant, and assessed the reliability of the reported performance information to determine whether it was valid, accurate and complete.
20. The material findings in respect of the reliability of the selected programmes are as follows:
Programme 2 – Public Ordinary School Education PPM205: Learner absenteeism rate 21. The achievement for target 4% reported in the annual performance report was 4.3%.
However, the supporting evidence provided did not agree to the reported achievement and indicated an achievement of 5.6%.
Annual Report for 2018/19 Financial Year Vote 04: Department of Education
Province of the Northern Cape
137
PPM206: Teacher absenteeism rate 22. The achievement for target 6% reported in the annual performance report was 4.8%.
However, the supporting evidence provided did not agree to the reported achievement and indicated an achievement of 6.9%.
23. I did not raise any material findings on the usefulness and reliability of the reported performance information for these programmes:
Programme 5: Early Childhood Development
Programme 6: Infrastructure Development
Programme 7: Examination and Education-Related Services
Other matters 24. I draw attention to the matters below.
Achievement of planned targets 25. Refer to the annual performance report on pages x to x; x to x for information on the
achievement of planned targets for the year and explanations provided for the under/overachievement of a significant number of targets. This information should be considered in the context of the material findings on the reliability of the reported performance information in paragraphs 16 - 23 of this report.
Adjustment of material misstatements 26. I identified material misstatements in the annual performance report submitted for
auditing. These material misstatements were on the reported performance information of Public Ordinary School Education, Early Childhood Development, Infrastructure development and Examination and Education-related services. As management subsequently corrected only some of the misstatements, I raised material findings on reliability of the reported performance information. Those that were not corrected are reported above.
Report on the audit of compliance with legislation Introduction and scope 27. In accordance with the PAA and the general notice issued in terms thereof, I have a
responsibility to report material findings on the compliance of the department with specific matters in key legislation. I performed procedures to identify findings but not to gather evidence to express assurance.

137
Annual Report for 2018/19 Financial Year Vote 04: Department of Education
Province of the Northern Cape
136
included in the planning documents. My procedures also did not extend to any disclosures or assertions relating to planned performance strategies and information in respect of future periods that may be included as part of the reported performance information. Accordingly, my findings do not extend to these matters.
18. I evaluated the usefulness and reliability of the reported performance information in accordance with the criteria developed from the performance management and reporting framework, as defined in the general notice, for the following selected programmes presented in the annual performance report of the department for the year ended 31 March 2019:
Programmes Pages in the annual performance report
Programme 2 – Public Ordinary School Education 42-52
Programme 5 – Early Childhood Development 60-63
Programme 6 – Infrastructure Development 64-74
Programme 7 – Examination and Education-related
services 75-80
19. I performed procedures to determine whether the reported performance information was properly presented and whether performance was consistent with the approved performance planning documents. I performed further procedures to determine whether the indicators and related targets were measurable and relevant, and assessed the reliability of the reported performance information to determine whether it was valid, accurate and complete.
20. The material findings in respect of the reliability of the selected programmes are as follows:
Programme 2 – Public Ordinary School Education PPM205: Learner absenteeism rate 21. The achievement for target 4% reported in the annual performance report was 4.3%.
However, the supporting evidence provided did not agree to the reported achievement and indicated an achievement of 5.6%.
Annual Report for 2018/19 Financial Year Vote 04: Department of Education
Province of the Northern Cape
137
PPM206: Teacher absenteeism rate 22. The achievement for target 6% reported in the annual performance report was 4.8%.
However, the supporting evidence provided did not agree to the reported achievement and indicated an achievement of 6.9%.
23. I did not raise any material findings on the usefulness and reliability of the reported performance information for these programmes:
Programme 5: Early Childhood Development
Programme 6: Infrastructure Development
Programme 7: Examination and Education-Related Services
Other matters 24. I draw attention to the matters below.
Achievement of planned targets 25. Refer to the annual performance report on pages x to x; x to x for information on the
achievement of planned targets for the year and explanations provided for the under/overachievement of a significant number of targets. This information should be considered in the context of the material findings on the reliability of the reported performance information in paragraphs 16 - 23 of this report.
Adjustment of material misstatements 26. I identified material misstatements in the annual performance report submitted for
auditing. These material misstatements were on the reported performance information of Public Ordinary School Education, Early Childhood Development, Infrastructure development and Examination and Education-related services. As management subsequently corrected only some of the misstatements, I raised material findings on reliability of the reported performance information. Those that were not corrected are reported above.
Report on the audit of compliance with legislation Introduction and scope 27. In accordance with the PAA and the general notice issued in terms thereof, I have a
responsibility to report material findings on the compliance of the department with specific matters in key legislation. I performed procedures to identify findings but not to gather evidence to express assurance.

138
Annual Report for 2018/19 Financial Year Vote 04: Department of Education
Province of the Northern Cape
138
28. The material findings on compliance with specific matters in key legislations are as follows:
Annual financial statements
29. The financial statements submitted for auditing were not prepared in accordance with the prescribed financial reporting framework as required by section 40(1)(a) and of the PFMA. Material misstatements identified by the auditors in the submitted financial statements were not adequately corrected, which resulted in the financial statements receiving a qualified opinion.
Expenditure management
30. Effective and appropriate steps were not taken to prevent unauthorised expenditure amounting to R18 818 000 as disclosed in note 8 to the annual financial statements, as required by section 38(1)(c)(ii) of the PFMA and treasury regulation 9.1.1.
31. Effective and appropriate steps were not taken to prevent irregular expenditure, as required by section 38(1)(c)(ii) of the PFMA and treasury regulation 9.1.1. The value, as disclosed in note 23 to the financial statements, is not complete as management was still in the process of quantifying the full extent of the irregular expenditure. The majority of the irregular expenditure disclosed in the financial statements was caused by non-compliance with supply chain management regulations.
32. Payments were not made within 30 days or an agreed period after receipt of an invoice, as required by treasury regulation 8.2.3.
Strategic planning and performance management
33. Specific information systems were not implemented to enable the monitoring of progress made towards achieving targets, core objectives and service delivery as required by public service regulation 25(1)(e)(i) and (iii).
Procurement and contract management
34. Some of the goods and services of a transaction value above R500 000 were procured without inviting competitive bids and deviations were approved by the accounting officer but it was practical to invite competitive bids. Similar non-compliance was also reported in the prior year.
35. Bid documentation for procurement of commodities designated for local content and production, did not stipulated the minimum threshold for local production and content as required by the 2017 preferential procurement regulation 8(2). Similar non-compliance was also reported in the prior year.
Annual Report for 2018/19 Financial Year Vote 04: Department of Education
Province of the Northern Cape
139
36. Some of the contracts were extended or modified without the approval of a properly delegated official as required by section 44 of the PFMA and treasury regulations 8.1 and 8.2.
Consequence management
37. I was unable to obtain sufficient appropriate audit evidence that disciplinary steps were taken against officials who had incurred unauthorised, irregular and fruitless & wasteful expenditure as required by section 38(1)(h)(iii) of the PFMA. This was due to proper and complete records that were not maintained as evidence to support the investigations into unauthorised, irregular and fruitless & wasteful expenditure.
38. I was unable to obtain sufficient appropriate audit evidence that investigations were conducted into all allegations of financial misconduct committed by officials, as required by treasury regulation 4.1.1.
Other information
39. The accounting officer is responsible for the other information. The other information comprises the information included in the annual report. The other information does not include the financial statements, the auditor’s report and those selected programmes presented in the annual performance report that have been specifically reported in this auditor’s report.
40. My opinion on the financial statements and findings on the reported performance information and compliance with legislation do not cover the other information and I do not express an audit opinion or any form of assurance conclusion thereon.
41. In connection with my audit, my responsibility is to read the other information and, in doing so, consider whether the other information is materially inconsistent with the financial statements and the selected programmes presented in the annual performance report, or my knowledge obtained in the audit, or otherwise appears to be materially misstated.
42. I did not receive the other information prior to the date of this auditor’s report. When I do receive and read this information, if I conclude that there is a material misstatement therein, I am required to communicate the matter to those charged with governance and request that the other information be corrected. If the other information is not corrected, I may have to retract this auditor’s report and re-issue an amended report as appropriate. However, if it is corrected this will not be necessary.

139
Annual Report for 2018/19 Financial Year Vote 04: Department of Education
Province of the Northern Cape
138
28. The material findings on compliance with specific matters in key legislations are as follows:
Annual financial statements
29. The financial statements submitted for auditing were not prepared in accordance with the prescribed financial reporting framework as required by section 40(1)(a) and of the PFMA. Material misstatements identified by the auditors in the submitted financial statements were not adequately corrected, which resulted in the financial statements receiving a qualified opinion.
Expenditure management
30. Effective and appropriate steps were not taken to prevent unauthorised expenditure amounting to R18 818 000 as disclosed in note 8 to the annual financial statements, as required by section 38(1)(c)(ii) of the PFMA and treasury regulation 9.1.1.
31. Effective and appropriate steps were not taken to prevent irregular expenditure, as required by section 38(1)(c)(ii) of the PFMA and treasury regulation 9.1.1. The value, as disclosed in note 23 to the financial statements, is not complete as management was still in the process of quantifying the full extent of the irregular expenditure. The majority of the irregular expenditure disclosed in the financial statements was caused by non-compliance with supply chain management regulations.
32. Payments were not made within 30 days or an agreed period after receipt of an invoice, as required by treasury regulation 8.2.3.
Strategic planning and performance management
33. Specific information systems were not implemented to enable the monitoring of progress made towards achieving targets, core objectives and service delivery as required by public service regulation 25(1)(e)(i) and (iii).
Procurement and contract management
34. Some of the goods and services of a transaction value above R500 000 were procured without inviting competitive bids and deviations were approved by the accounting officer but it was practical to invite competitive bids. Similar non-compliance was also reported in the prior year.
35. Bid documentation for procurement of commodities designated for local content and production, did not stipulated the minimum threshold for local production and content as required by the 2017 preferential procurement regulation 8(2). Similar non-compliance was also reported in the prior year.
Annual Report for 2018/19 Financial Year Vote 04: Department of Education
Province of the Northern Cape
139
36. Some of the contracts were extended or modified without the approval of a properly delegated official as required by section 44 of the PFMA and treasury regulations 8.1 and 8.2.
Consequence management
37. I was unable to obtain sufficient appropriate audit evidence that disciplinary steps were taken against officials who had incurred unauthorised, irregular and fruitless & wasteful expenditure as required by section 38(1)(h)(iii) of the PFMA. This was due to proper and complete records that were not maintained as evidence to support the investigations into unauthorised, irregular and fruitless & wasteful expenditure.
38. I was unable to obtain sufficient appropriate audit evidence that investigations were conducted into all allegations of financial misconduct committed by officials, as required by treasury regulation 4.1.1.
Other information
39. The accounting officer is responsible for the other information. The other information comprises the information included in the annual report. The other information does not include the financial statements, the auditor’s report and those selected programmes presented in the annual performance report that have been specifically reported in this auditor’s report.
40. My opinion on the financial statements and findings on the reported performance information and compliance with legislation do not cover the other information and I do not express an audit opinion or any form of assurance conclusion thereon.
41. In connection with my audit, my responsibility is to read the other information and, in doing so, consider whether the other information is materially inconsistent with the financial statements and the selected programmes presented in the annual performance report, or my knowledge obtained in the audit, or otherwise appears to be materially misstated.
42. I did not receive the other information prior to the date of this auditor’s report. When I do receive and read this information, if I conclude that there is a material misstatement therein, I am required to communicate the matter to those charged with governance and request that the other information be corrected. If the other information is not corrected, I may have to retract this auditor’s report and re-issue an amended report as appropriate. However, if it is corrected this will not be necessary.

140
Annual Report for 2018/19 Financial Year Vote 04: Department of Education
Province of the Northern Cape
140
Internal control deficiencies
43. I considered internal control relevant to my audit of the financial statements, reported performance information and compliance with applicable legislation; however, my objective was not to express any form of assurance on it. The matters reported below are limited to the significant internal control deficiencies that resulted in the basis for the qualified opinion, the findings on the annual performance report and the findings on compliance with legislation included in this report.
44. The department lacks basic disciplines and monitoring controls to ensure the correct recording and management of assets. Physical verification of assets at all facilities and updating of the asset register was not done, as is evident by material misstatements relating to immovable tangible capital assets in the financial statements.
45. The accounting officer did not ensure that the department complies with applicable laws and regulations, including supply chain management that were identified in the current financial year. Management did not implement the action plan to ensure that prior year issues relating to human resource management and performance information, the prevention of irregular and unauthorised expenditure do not reoccur.
46. This is evident by material misstatement identified on financial statements, findings on performance information and non-compliance with relevant laws and regulations that were identified during the audit process.
47. The leadership of the department did not exercise oversight responsibility to ensure that proper internal control procedures were developed and implemented that will enable the department to produce an accurate and complete report on predetermined objectives
Other reports
48. I draw attention to the following engagements conducted by various parties that had, or could have, an impact on the matters reported in the department’s financial statements, reported performance information, compliance with applicable legislation and other related matters. These reports did not form part of my opinion on the financial statements or my findings on the reported performance information or compliance with legislation.
Annual Report for 2018/19 Financial Year Vote 04: Department of Education
Province of the Northern Cape
141
49. The Directorate for Priority Crime Investigation (Hawks) are investigating allegations of irregularities in the supply chain management processes applied by the department. These proceedings were in progress at the date of this report.
Kimberley 31 July 2019

141
Annual Report for 2018/19 Financial Year Vote 04: Department of Education
Province of the Northern Cape
140
Internal control deficiencies
43. I considered internal control relevant to my audit of the financial statements, reported performance information and compliance with applicable legislation; however, my objective was not to express any form of assurance on it. The matters reported below are limited to the significant internal control deficiencies that resulted in the basis for the qualified opinion, the findings on the annual performance report and the findings on compliance with legislation included in this report.
44. The department lacks basic disciplines and monitoring controls to ensure the correct recording and management of assets. Physical verification of assets at all facilities and updating of the asset register was not done, as is evident by material misstatements relating to immovable tangible capital assets in the financial statements.
45. The accounting officer did not ensure that the department complies with applicable laws and regulations, including supply chain management that were identified in the current financial year. Management did not implement the action plan to ensure that prior year issues relating to human resource management and performance information, the prevention of irregular and unauthorised expenditure do not reoccur.
46. This is evident by material misstatement identified on financial statements, findings on performance information and non-compliance with relevant laws and regulations that were identified during the audit process.
47. The leadership of the department did not exercise oversight responsibility to ensure that proper internal control procedures were developed and implemented that will enable the department to produce an accurate and complete report on predetermined objectives
Other reports
48. I draw attention to the following engagements conducted by various parties that had, or could have, an impact on the matters reported in the department’s financial statements, reported performance information, compliance with applicable legislation and other related matters. These reports did not form part of my opinion on the financial statements or my findings on the reported performance information or compliance with legislation.
Annual Report for 2018/19 Financial Year Vote 04: Department of Education
Province of the Northern Cape
141
49. The Directorate for Priority Crime Investigation (Hawks) are investigating allegations of irregularities in the supply chain management processes applied by the department. These proceedings were in progress at the date of this report.
Kimberley 31 July 2019

142
Annual Report for 2018/19 Financial Year Vote 04: Department of Education
Province of the Northern Cape
142
Annexure – Auditor-General’s responsibility for the audit
1. As part of an audit in accordance with the ISAs, I exercise professional judgement and maintain professional scepticism throughout my audit of the financial statements, and the procedures performed on reported performance information for selected programmes and on the department’s compliance with respect to the selected subject matters.
Financial statements
2. In addition to my responsibility for the audit of the financial statements as described in this auditor’s report, I also:
identify and assess the risks of material misstatement of the financial statements whether due to fraud or error, design and perform audit procedures responsive to those risks, and obtain audit evidence that is sufficient and appropriate to provide a basis for my opinion. The risk of not detecting a material misstatement resulting from fraud is higher than for one resulting from error, as fraud may involve collusion, forgery, intentional omissions, misrepresentations, or the override of internal control
obtain an understanding of internal control relevant to the audit in order to design audit procedures that are appropriate in the circumstances, but not for the purpose of expressing an opinion on the effectiveness of the department’s internal control
evaluate the appropriateness of accounting policies used and the reasonableness of accounting estimates and related disclosures made by the accounting officer
conclude on the appropriateness of the accounting officer’s use of the going concern basis of accounting in the preparation of the financial statements. I also conclude, based on the audit evidence obtained, whether a material uncertainty exists related to events or conditions that may cast significant doubt on the Department of Education ability to continue as a going concern. If I conclude that a material uncertainty exists, I am required to draw attention in my auditor’s report to the related disclosures in the financial statements about the material uncertainty or, if such disclosures are inadequate, to modify the opinion on the financial statements. My conclusions are based on the information available to me at the date of this auditor’s report. However, future events or conditions may cause a department to cease continuing as a going concern
evaluate the overall presentation, structure and content of the financial statements, including the disclosures, and whether the financial statements represent the underlying transactions and events in a manner that achieves fair presentation
Annual Report for 2018/19 Financial Year Vote 04: Department of Education
Province of the Northern Cape
143
Communication with those charged with governance
3. I communicate with the accounting officer regarding, among other matters, the planned scope and timing of the audit and significant audit findings, including any significant deficiencies in internal control that I identify during my audit.
4. I also confirm to the accounting officer that I have complied with relevant ethical requirements regarding independence, and communicate all relationships and other matters that may reasonably be thought to have a bearing on my independence and, where applicable, related safeguards.

143
Annual Report for 2018/19 Financial Year Vote 04: Department of Education
Province of the Northern Cape
142
Annexure – Auditor-General’s responsibility for the audit
1. As part of an audit in accordance with the ISAs, I exercise professional judgement and maintain professional scepticism throughout my audit of the financial statements, and the procedures performed on reported performance information for selected programmes and on the department’s compliance with respect to the selected subject matters.
Financial statements
2. In addition to my responsibility for the audit of the financial statements as described in this auditor’s report, I also:
identify and assess the risks of material misstatement of the financial statements whether due to fraud or error, design and perform audit procedures responsive to those risks, and obtain audit evidence that is sufficient and appropriate to provide a basis for my opinion. The risk of not detecting a material misstatement resulting from fraud is higher than for one resulting from error, as fraud may involve collusion, forgery, intentional omissions, misrepresentations, or the override of internal control
obtain an understanding of internal control relevant to the audit in order to design audit procedures that are appropriate in the circumstances, but not for the purpose of expressing an opinion on the effectiveness of the department’s internal control
evaluate the appropriateness of accounting policies used and the reasonableness of accounting estimates and related disclosures made by the accounting officer
conclude on the appropriateness of the accounting officer’s use of the going concern basis of accounting in the preparation of the financial statements. I also conclude, based on the audit evidence obtained, whether a material uncertainty exists related to events or conditions that may cast significant doubt on the Department of Education ability to continue as a going concern. If I conclude that a material uncertainty exists, I am required to draw attention in my auditor’s report to the related disclosures in the financial statements about the material uncertainty or, if such disclosures are inadequate, to modify the opinion on the financial statements. My conclusions are based on the information available to me at the date of this auditor’s report. However, future events or conditions may cause a department to cease continuing as a going concern
evaluate the overall presentation, structure and content of the financial statements, including the disclosures, and whether the financial statements represent the underlying transactions and events in a manner that achieves fair presentation
Annual Report for 2018/19 Financial Year Vote 04: Department of Education
Province of the Northern Cape
143
Communication with those charged with governance
3. I communicate with the accounting officer regarding, among other matters, the planned scope and timing of the audit and significant audit findings, including any significant deficiencies in internal control that I identify during my audit.
4. I also confirm to the accounting officer that I have complied with relevant ethical requirements regarding independence, and communicate all relationships and other matters that may reasonably be thought to have a bearing on my independence and, where applicable, related safeguards.

144
Annual Report for 2018/19 Financial Year Vote 04: Department of Education
Province of the Northern Cape
- 144 -
2. ANNUAL FINANCIAL STATEMENTS
ANNUAL FINANCIAL STATEMENTS OF THE NORTHERN CAPE DEPARTMENT OF EDUCATION
For the year ended 31 March 2019
DEPARTMENT OF EDUCATION VOTE 4
APPROPRIATION STATEMENT
for the year ended 31 March 2019
145
Table of Contents
Appropriation Statement 146 Notes to the Appropriation Statement 189 Statement of Financial Performance 192 Statement of Financial Position 193 Statement of Changes in Net Assets 194 Cash Flow Statement 195 Notes to the Annual Financial Statements (including Accounting policies) 196 Annexures 237

145
Annual Report for 2018/19 Financial Year Vote 04: Department of Education
Province of the Northern Cape
- 144 -
2. ANNUAL FINANCIAL STATEMENTS
ANNUAL FINANCIAL STATEMENTS OF THE NORTHERN CAPE DEPARTMENT OF EDUCATION
For the year ended 31 March 2019
DEPARTMENT OF EDUCATION VOTE 4
APPROPRIATION STATEMENT
for the year ended 31 March 2019
145
Table of Contents
Appropriation Statement 146 Notes to the Appropriation Statement 189 Statement of Financial Performance 192 Statement of Financial Position 193 Statement of Changes in Net Assets 194 Cash Flow Statement 195 Notes to the Annual Financial Statements (including Accounting policies) 196 Annexures 237

146
DEP
AR
TMEN
T O
F ED
UC
ATI
ON
VO
TE 4
APP
RO
PRIA
TIO
N S
TATE
MEN
T fo
r the
yea
r end
ed 3
1 M
arch
201
9
- 1
46 -
App
ropr
iatio
n pe
r pro
gram
me
2018
/19
2017
/18
Ad
just
ed
Appr
opria
tion
Shift
ing
of
Fund
s Vi
rem
ent
Fina
l Ap
prop
riatio
n Ac
tual
Ex
pend
iture
Va
rianc
e Ex
pend
iture
as
% o
f fin
al
appr
opria
tion
Fina
l Ap
prop
riatio
n Ac
tual
Ex
pend
iture
R
'000
R
'000
R
'000
R
'000
R
'000
R
'000
%
R
'000
R
'000
Pr
ogra
mm
e
1. A
dmin
istr
atio
n 65
2 67
2 -
7 76
8 66
0 44
0 66
3 74
2 (3
302
) 10
0.5%
62
7 95
6 61
8 06
0 2.
Pub
lic O
rdin
ary
Scho
ol
Educ
atio
n 4
788
638
- (1
981
) 4
786
657
4 79
7 56
3 (1
0 90
6)
100.
2%
4 26
6 60
1 4
384
763
3. In
depe
nden
t Sch
ool
Subs
idy
9 60
0 -
(1)
9 59
9 9
599
- 10
0.0%
9
164
9 16
4
4. P
ublic
Spe
cial
Sch
ool
Educ
atio
n 15
8 99
8 -
743
159
741
160
586
(845
) 10
0.5%
14
0 93
1 14
1 80
3
5. E
arly
Chi
ldho
od
Dev
elop
men
t 10
3 64
2 -
(5 1
81)
98 4
61
98 4
61
- 10
0.0%
94
273
94
273
6. In
fras
truc
ture
Dev
elop
men
t 58
0 64
2 -
(12
214)
56
8 42
8 56
7 89
8 53
0 99
.9%
61
2 26
7 60
9 59
5 7.
Exa
min
atio
n A
nd E
duca
tion
Rel
ated
Ser
vice
s 14
3 36
0 -
10 8
66
154
226
157
833
(3 6
07)
102.
3%
144
927
148
647
TOTA
L 6
437
552
- -
6 43
7 55
2 6
455
682
(18
130)
10
0.3%
5
896
119
6 00
6 30
5
DEP
AR
TMEN
T O
F ED
UC
ATI
ON
VO
TE 4
APP
RO
PRIA
TIO
N S
TATE
MEN
T fo
r the
yea
r end
ed 3
1 M
arch
201
9
- 1
47 -
20
18/1
9 20
17/1
8
Fina
l Ap
prop
riatio
n Ac
tual
Ex
pend
iture
Fi
nal
Appr
opria
tion
Actu
al
Expe
nditu
re
TOTA
L (b
roug
ht fo
rwar
d)
6 43
7 55
2 6
455
682
5 89
6 11
9 6
006
305
Rec
onci
liatio
n w
ith s
tate
men
t of f
inan
cial
per
form
ance
AD
D
D
epar
tmen
tal r
ecei
pts
-
-
NR
F R
ecei
pts
-
-
Aid
ass
ista
nce
-
-
A
ctua
l am
ount
s pe
r sta
tem
ent o
f fin
anci
al p
erfo
rman
ce (t
otal
reve
nue)
6
437
552
5
896
119
AD
D
Aid
ass
ista
nce
-
-
P
rior y
ear u
naut
horis
ed e
xpen
ditu
re a
ppro
ved
with
out f
undi
ng
-
-
A
ctua
l am
ount
s pe
r sta
tem
ent o
f fin
anci
al p
erfo
rman
ce (t
otal
exp
endi
ture
)
6 45
5 68
2
6 00
6 30
5

147
DEP
AR
TMEN
T O
F ED
UC
ATI
ON
VO
TE 4
APP
RO
PRIA
TIO
N S
TATE
MEN
T fo
r the
yea
r end
ed 3
1 M
arch
201
9
- 1
47 -
20
18/1
9 20
17/1
8
Fina
l Ap
prop
riatio
n Ac
tual
Ex
pend
iture
Fi
nal
Appr
opria
tion
Actu
al
Expe
nditu
re
TOTA
L (b
roug
ht fo
rwar
d)
6 43
7 55
2 6
455
682
5 89
6 11
9 6
006
305
Rec
onci
liatio
n w
ith s
tate
men
t of f
inan
cial
per
form
ance
AD
D
D
epar
tmen
tal r
ecei
pts
-
-
NR
F R
ecei
pts
-
-
Aid
ass
ista
nce
-
-
A
ctua
l am
ount
s pe
r sta
tem
ent o
f fin
anci
al p
erfo
rman
ce (t
otal
reve
nue)
6
437
552
5
896
119
AD
D
Aid
ass
ista
nce
-
-
P
rior y
ear u
naut
horis
ed e
xpen
ditu
re a
ppro
ved
with
out f
undi
ng
-
-
A
ctua
l am
ount
s pe
r sta
tem
ent o
f fin
anci
al p
erfo
rman
ce (t
otal
exp
endi
ture
)
6 45
5 68
2
6 00
6 30
5

148
DEP
AR
TMEN
T O
F ED
UC
ATI
ON
VO
TE 4
APP
RO
PRIA
TIO
N S
TATE
MEN
T fo
r the
yea
r end
ed 3
1 M
arch
201
9
- 1
48 -
App
ropr
iatio
n pe
r eco
nom
ic c
lass
ifica
tion
2018
/19
2017
/18
Ad
just
ed
Appr
opria
tio n
Shift
ing
of
Fund
s Vi
rem
ent
Fina
l Ap
prop
riatio n
Actu
al
Expe
nditu
re
Varia
nce
Expe
nditu
re
as %
of f
inal
ap
prop
riatio
n
Fina
l Ap
prop
riatio n
Actu
al
expe
nditu
re
R
'000
R
'000
R
'000
R
'000
R
'000
R
'000
%
R
'000
R
'000
Ec
onom
ic c
lass
ifica
tion
C
urre
nt p
aym
ents
5
585
812
(49
397)
(5
004
) 5
531
411
5 54
2 81
9 (1
1 40
8)
5 58
5 81
2 4
868
567
5 06
8 83
3 C
ompe
nsat
ion
of e
mpl
oyee
s 4
936
520
- -
4 93
6 52
0 4
947
963
(11
443)
4
936
520
4 51
0 49
9 4
608
762
Sal
arie
s an
d w
ages
4
311
603
11 6
48
(30
807)
4
292
444
4 29
3 73
8 (1
294
) 4
311
603
3 93
3 73
5 3
996
057
Soc
ial c
ontri
butio
ns
624
917
(11
648)
30
807
64
4 07
6 65
4 22
5 (1
0 14
9)
624
917
576
764
612
705
Goo
ds a
nd s
ervi
ces
649
292
(49
612)
(5
004
) 59
4 67
6 59
4 64
1 35
64
9 29
2 35
8 03
2 45
9 95
2 A
dmin
istra
tive
fees
45
9 12
5 -
584
584
- 45
9 68
5 86
5 A
dver
tisin
g 87
5 (2
06)
- 66
9 66
9 -
875
826
826
Min
or a
sset
s 1
368
(1 0
30)
- 33
8 33
8 -
1 36
8 53
1 53
1 A
udit
cost
s: E
xter
nal
11 1
30
1 20
1 -
12 3
31
12 3
31
- 11
130
10
747
10
747
B
ursa
ries:
Em
ploy
ees
1 00
3 (3
27)
- 67
6 67
6 -
1 00
3 85
8 85
8 C
ater
ing:
Dep
artm
enta
l ac
tiviti
es
11 6
37
(210
) (1
233
) 10
194
10
194
-
11 6
37
6 65
5 6
655
Com
mun
icat
ion
12 1
41
(7 5
28)
(46)
4
567
4 56
7 -
12 1
41
5 96
9 5
969
Com
pute
r ser
vice
s 10
980
(3
571
) -
7 40
9 7
409
- 10
980
4
221
4 22
1 C
onsu
ltant
s: B
usin
ess
and
advi
sory
ser
vice
s 82
934
(5
0 29
8)
10 9
12
43 5
48
43 0
18
530
82 9
34
6 82
0 16
008
Lega
l ser
vice
s 1
500
3 23
8 -
4 73
8 4
738
- 10
0.0%
3
566
3 56
6 C
ontra
ctor
s 24
8 2
562
- 2
810
2 81
0 -
100.
0%
11 6
82
11 6
82
Age
ncy
and
supp
ort /
ou
tsou
rced
ser
vice
s 31
410
14
026
19
648
65
084
65
142
(5
8)
100.
1%
45 3
99
50 3
65
Ent
erta
inm
ent
158
(157
) -
1 1
- 10
0.0%
5
5 Fl
eet s
ervi
ces
5
364
(2 3
08)
- 3
056
3 05
6 -
100.
0%
2 51
4 2
514
Inve
ntor
y: F
uel,
oil a
nd g
as
17
(17)
-
- -
- -
- -
Inve
ntor
y: L
earn
er a
nd
teac
her s
uppo
rt m
ater
ial
39 2
87
(18
574)
(1
935
) 18
778
18
778
-
100.
0%
43 9
87
43 6
93
DEP
AR
TMEN
T O
F ED
UC
ATI
ON
VO
TE 4
APP
RO
PRIA
TIO
N S
TATE
MEN
T fo
r the
yea
r end
ed 3
1 M
arch
201
9
- 1
49 -
App
ropr
iatio
n pe
r eco
nom
ic c
lass
ifica
tion
2018
/19
2017
/18
Ad
just
ed
Appr
opria
tio n
Shift
ing
of
Fund
s Vi
rem
ent
Fina
l Ap
prop
riatio n
Actu
al
Expe
nditu
re
Varia
nce
Expe
nditu
re
as %
of f
inal
ap
prop
riatio
n
Fina
l Ap
prop
riatio n
Actu
al
expe
nditu
re
R
'000
R
'000
R
'000
R
'000
R
'000
R
'000
%
R
'000
R
'000
In
vent
ory:
Oth
er s
uppl
ies
46 2
40
(6 0
02)
5 12
7 45
365
45
365
-
100.
0%
58 9
30
65 3
43
Con
sum
able
sup
plie
s 3
524
(855
) 67
2
736
2 73
6 -
100.
0%
3 95
7 3
957
Con
sum
able
: Sta
tione
ry,
prin
ting
and
offic
e su
pplie
s 13
479
1
971
140
15 5
90
15 5
01
89
99.4
%
13 3
75
13 3
75
Ope
ratin
g le
ases
17
701
(3
153
) -
14 5
48
14 5
48
- 10
0.0%
11
187
17
683
P
rope
rty p
aym
ents
14
4 21
7 6
205
(791
) 14
9 63
1 14
9 63
1 -
100.
0%
58 8
95
133
866
Tran
spor
t pro
vide
d:
Dep
artm
enta
l act
ivity
14
8 86
7 15
076
(3
5 82
6)
128
117
128
117
- 10
0.0%
6
790
6 79
0
Trav
el a
nd s
ubsi
sten
ce
49 5
72
(681
) 1
121
50 0
12
50 0
12
- 10
0.0%
44
077
44
077
Tr
aini
ng a
nd d
evel
opm
ent
9 68
3 (1
896
) (3
757
) 4
030
4 03
0 -
100.
0%
7 59
1 7
591
Ope
ratin
g pa
ymen
ts
3 84
8 1
492
1 56
9 6
909
7 37
8 (4
69)
106.
8%
6 62
6 6
626
Ven
ues
and
faci
litie
s 1
290
(114
) (1
6)
1 16
0 1
217
(57)
10
4.9%
1
501
1 50
1 R
enta
l and
hiri
ng
360
1 41
9 16
1
795
1 79
5 -
100.
0%
638
638
Inte
rest
and
rent
on
land
-
215
- 21
5 21
5 -
100.
0%
36
119
Inte
rest
-
215
- 21
5 21
5 -
100.
0%
36
119
Tran
sfer
s an
d su
bsid
ies
49
3 85
1 10
622
1
241
505
714
512
497
(6 7
83)
101.
3%
466
254
475
715
Pro
vinc
es a
nd m
unic
ipal
ities
-
- -
- -
- -
- -
Dep
artm
enta
l age
ncie
s an
d ac
coun
ts
6 69
1 -
- 6
691
6 69
1 -
100.
0%
6 37
3 6
373
Dep
artm
enta
l age
ncie
s an
d ac
coun
ts
6 69
1 -
- 6
691
6 69
1 -
100.
0%
6 37
3 6
373
Non
-pro
fit in
stitu
tions
44
8 79
2 (6
847
) 64
9 44
2 59
4 44
4 87
8 (2
284
) 10
0.5%
41
3 86
5 41
7 65
9 H
ouse
hold
s 38
368
17
469
59
2 56
429
60
928
(4
499
) 10
8.0%
46
016
51
683
S
ocia
l ben
efits
-
26 9
66
592
27 5
58
30 1
99
(2 6
41)
109.
6%
18 5
43
23 6
12
Oth
er tr
ansf
ers
to h
ouse
hold
s 38
368
(9
497
) -
28 8
71
30 7
29
(1 8
58)
106.
4%
27 4
73
28 0
71

149
DEP
AR
TMEN
T O
F ED
UC
ATI
ON
VO
TE 4
APP
RO
PRIA
TIO
N S
TATE
MEN
T fo
r the
yea
r end
ed 3
1 M
arch
201
9
- 1
49 -
App
ropr
iatio
n pe
r eco
nom
ic c
lass
ifica
tion
2018
/19
2017
/18
Ad
just
ed
Appr
opria
tio n
Shift
ing
of
Fund
s Vi
rem
ent
Fina
l Ap
prop
riatio n
Actu
al
Expe
nditu
re
Varia
nce
Expe
nditu
re
as %
of f
inal
ap
prop
riatio
n
Fina
l Ap
prop
riatio n
Actu
al
expe
nditu
re
R
'000
R
'000
R
'000
R
'000
R
'000
R
'000
%
R
'000
R
'000
In
vent
ory:
Oth
er s
uppl
ies
46 2
40
(6 0
02)
5 12
7 45
365
45
365
-
100.
0%
58 9
30
65 3
43
Con
sum
able
sup
plie
s 3
524
(855
) 67
2
736
2 73
6 -
100.
0%
3 95
7 3
957
Con
sum
able
: Sta
tione
ry,
prin
ting
and
offic
e su
pplie
s 13
479
1
971
140
15 5
90
15 5
01
89
99.4
%
13 3
75
13 3
75
Ope
ratin
g le
ases
17
701
(3
153
) -
14 5
48
14 5
48
- 10
0.0%
11
187
17
683
P
rope
rty p
aym
ents
14
4 21
7 6
205
(791
) 14
9 63
1 14
9 63
1 -
100.
0%
58 8
95
133
866
Tran
spor
t pro
vide
d:
Dep
artm
enta
l act
ivity
14
8 86
7 15
076
(3
5 82
6)
128
117
128
117
- 10
0.0%
6
790
6 79
0
Trav
el a
nd s
ubsi
sten
ce
49 5
72
(681
) 1
121
50 0
12
50 0
12
- 10
0.0%
44
077
44
077
Tr
aini
ng a
nd d
evel
opm
ent
9 68
3 (1
896
) (3
757
) 4
030
4 03
0 -
100.
0%
7 59
1 7
591
Ope
ratin
g pa
ymen
ts
3 84
8 1
492
1 56
9 6
909
7 37
8 (4
69)
106.
8%
6 62
6 6
626
Ven
ues
and
faci
litie
s 1
290
(114
) (1
6)
1 16
0 1
217
(57)
10
4.9%
1
501
1 50
1 R
enta
l and
hiri
ng
360
1 41
9 16
1
795
1 79
5 -
100.
0%
638
638
Inte
rest
and
rent
on
land
-
215
- 21
5 21
5 -
100.
0%
36
119
Inte
rest
-
215
- 21
5 21
5 -
100.
0%
36
119
Tran
sfer
s an
d su
bsid
ies
49
3 85
1 10
622
1
241
505
714
512
497
(6 7
83)
101.
3%
466
254
475
715
Pro
vinc
es a
nd m
unic
ipal
ities
-
- -
- -
- -
- -
Dep
artm
enta
l age
ncie
s an
d ac
coun
ts
6 69
1 -
- 6
691
6 69
1 -
100.
0%
6 37
3 6
373
Dep
artm
enta
l age
ncie
s an
d ac
coun
ts
6 69
1 -
- 6
691
6 69
1 -
100.
0%
6 37
3 6
373
Non
-pro
fit in
stitu
tions
44
8 79
2 (6
847
) 64
9 44
2 59
4 44
4 87
8 (2
284
) 10
0.5%
41
3 86
5 41
7 65
9 H
ouse
hold
s 38
368
17
469
59
2 56
429
60
928
(4
499
) 10
8.0%
46
016
51
683
S
ocia
l ben
efits
-
26 9
66
592
27 5
58
30 1
99
(2 6
41)
109.
6%
18 5
43
23 6
12
Oth
er tr
ansf
ers
to h
ouse
hold
s 38
368
(9
497
) -
28 8
71
30 7
29
(1 8
58)
106.
4%
27 4
73
28 0
71

150
DEP
AR
TMEN
T O
F ED
UC
ATI
ON
VO
TE 4
APP
RO
PRIA
TIO
N S
TATE
MEN
T fo
r the
yea
r end
ed 3
1 M
arch
201
9
- 1
50 -
App
ropr
iatio
n pe
r eco
nom
ic c
lass
ifica
tion
2018
/19
2017
/18
Ad
just
ed
Appr
opria
tio n
Shift
ing
of
Fund
s Vi
rem
ent
Fina
l Ap
prop
riatio n
Actu
al
Expe
nditu
re
Varia
nce
Expe
nditu
re
as %
of f
inal
ap
prop
riatio
n
Fina
l Ap
prop
riatio n
Actu
al
expe
nditu
re
R
'000
R
'000
R
'000
R
'000
R
'000
R
'000
%
R
'000
R
'000
Pa
ymen
ts fo
r cap
ital a
sset
s 35
7 88
9 38
775
3
763
400
427
400
366
61
100.
0%
561
298
461
757
Bui
ldin
gs a
nd o
ther
fixe
d st
ruct
ures
31
0 02
5 18
451
-
328
476
328
476
- 10
0.0%
49
8 97
4 41
7 12
0
Bui
ldin
gs
310
025
18 4
51
- 32
8 47
6 32
8 47
6 -
100.
0%
498
974
417
120
Mac
hine
ry a
nd e
quip
men
t 47
864
20
324
3
763
71 9
51
71 8
90
61
99.9
%
46 2
54
35 2
26
Tran
spor
t equ
ipm
ent
17 4
91
54
3 17
0 20
715
20
654
61
99
.7%
18
676
16
827
O
ther
mac
hine
ry a
nd
equi
pmen
t 30
373
20
270
59
3 51
236
51
236
-
100.
0%
27 5
78
18 3
99
Sof
twar
e an
d ot
her I
ntan
gibl
e as
sets
-
- -
- -
- -
16 0
70
9 41
1
Paym
ents
for f
inan
cial
ass
ets
- -
- -
- -
- -
- To
tal
6 43
7 55
2 -
- 6
437
552
6 45
5 68
2 (1
8 13
0)
100.
3%
5 89
6 11
9 6
006
305
DEP
AR
TMEN
T O
F ED
UC
ATI
ON
VO
TE 4
APP
RO
PRIA
TIO
N S
TATE
MEN
T fo
r the
yea
r end
ed 3
1 M
arch
201
9
- 1
51 -
Prog
ram
me
1: A
DM
INIS
TRA
TIO
N
2018
/19
2017
/18
Ad
just
ed
Appr
opria
ti on
Shift
ing
of
Fund
s Vi
rem
ent
Fina
l Ap
prop
riatio
n Ac
tual
Ex
pend
iture
Va
rianc
e Ex
pend
iture
as
% o
f fin
al
appr
opria
tion
Fina
l Ap
prop
riatio
n Ac
tual
ex
pend
iture
R
'000
R
'000
R
'000
R
'000
R
'000
R
'000
%
R
'000
R
'000
Sub
prog
ram
me
1.
Offi
ce O
f The
ME
C
10 6
30
1 57
2 -
12 2
02
12 2
02
- 10
0.0%
11
513
11
513
2.
Cor
pora
te S
ervi
ces
359
255
(8 1
30)
(6 7
89)
344
336
346
798
(2 4
62)
100.
7%
326
152
322
943
3.
Edu
catio
n M
anag
emen
t 24
5 50
8 11
883
14
830
27
2 22
1 27
2 87
1 (6
50)
100.
2%
248
542
248
542
4.
Hum
an R
esou
rce
Dev
elop
men
t 23
989
(1
717
) (2
73)
21 9
99
22 1
89
(190
) 10
0.9%
22
449
22
384
5.
EM
IS
13 2
90
(3 6
08)
- 9
682
9 68
2 -
100.
0%
19 3
00
12 6
78
Tota
l for
sub
pro
gram
mes
65
2 67
2 -
7 76
8 66
0 44
0 66
3 74
2 (3
302
) 10
0.5%
62
7 95
6 61
8 06
0
Econ
omic
cla
ssifi
catio
n
Cur
rent
pay
men
ts
630
778
(787
) 3
353
633
344
633
344
- 10
0.0%
58
6 66
8 58
6 66
8 C
ompe
nsat
ion
of e
mpl
oyee
s 48
7 67
4 (7
83)
(12
725)
47
4 16
6 47
4 16
6 -
100.
0%
458
063
458
063
Sal
arie
s an
d w
ages
41
9 68
6 (2
045
) (7
423
) 41
0 21
8 41
0 21
8 -
100.
0%
396
608
396
608
Soc
ial c
ontri
butio
ns
67 9
88
1 26
2 (5
302
) 63
948
63
948
-
100.
0%
61 4
55
61 4
55
Goo
ds a
nd s
ervi
ces
143
104
(211
) 16
078
15
8 97
1 15
8 97
1 -
100.
0%
128
569
128
569
Adm
inis
trativ
e fe
es
453
(161
) -
292
292
- 10
0.0%
43
5 43
5 A
dver
tisin
g 70
5 (1
48)
- 55
7 55
7 -
100.
0%
550
550
Min
or a
sset
s 98
4 (6
86)
- 29
8 29
8 -
100.
0%
205
205
Aud
it co
sts:
Ext
erna
l 11
130
1
183
- 12
313
12
313
-
100.
0%
10 7
47
10 7
47
Bur
sarie
s: E
mpl
oyee
s 1
000
(324
) -
676
676
- 10
0.0%
56
7 56
7 C
ater
ing:
Dep
artm
enta
l ac
tiviti
es
3 74
5 1
116
- 4
861
4 86
1 -
100.
0%
4 39
3 4
393
Com
mun
icat
ion
11 8
20
(7 4
36)
- 4
384
4 38
4 -
100.
0%
5 88
0 5
880
Com
pute
r ser
vice
s 10
680
(3
420
) -
7 26
0 7
260
- 10
0.0%
4
073
4 07
3 Le
gal s
ervi
ces
1 50
0 3
238
- 4
738
4 73
8 -
100.
0%
3 56
6 3
566

151
DEP
AR
TMEN
T O
F ED
UC
ATI
ON
VO
TE 4
APP
RO
PRIA
TIO
N S
TATE
MEN
T fo
r the
yea
r end
ed 3
1 M
arch
201
9
- 1
51 -
Prog
ram
me
1: A
DM
INIS
TRA
TIO
N
2018
/19
2017
/18
Ad
just
ed
Appr
opria
ti on
Shift
ing
of
Fund
s Vi
rem
ent
Fina
l Ap
prop
riatio
n Ac
tual
Ex
pend
iture
Va
rianc
e Ex
pend
iture
as
% o
f fin
al
appr
opria
tion
Fina
l Ap
prop
riatio
n Ac
tual
ex
pend
iture
R
'000
R
'000
R
'000
R
'000
R
'000
R
'000
%
R
'000
R
'000
Sub
prog
ram
me
1.
Offi
ce O
f The
ME
C
10 6
30
1 57
2 -
12 2
02
12 2
02
- 10
0.0%
11
513
11
513
2.
Cor
pora
te S
ervi
ces
359
255
(8 1
30)
(6 7
89)
344
336
346
798
(2 4
62)
100.
7%
326
152
322
943
3.
Edu
catio
n M
anag
emen
t 24
5 50
8 11
883
14
830
27
2 22
1 27
2 87
1 (6
50)
100.
2%
248
542
248
542
4.
Hum
an R
esou
rce
Dev
elop
men
t 23
989
(1
717
) (2
73)
21 9
99
22 1
89
(190
) 10
0.9%
22
449
22
384
5.
EM
IS
13 2
90
(3 6
08)
- 9
682
9 68
2 -
100.
0%
19 3
00
12 6
78
Tota
l for
sub
pro
gram
mes
65
2 67
2 -
7 76
8 66
0 44
0 66
3 74
2 (3
302
) 10
0.5%
62
7 95
6 61
8 06
0
Econ
omic
cla
ssifi
catio
n
Cur
rent
pay
men
ts
630
778
(787
) 3
353
633
344
633
344
- 10
0.0%
58
6 66
8 58
6 66
8 C
ompe
nsat
ion
of e
mpl
oyee
s 48
7 67
4 (7
83)
(12
725)
47
4 16
6 47
4 16
6 -
100.
0%
458
063
458
063
Sal
arie
s an
d w
ages
41
9 68
6 (2
045
) (7
423
) 41
0 21
8 41
0 21
8 -
100.
0%
396
608
396
608
Soc
ial c
ontri
butio
ns
67 9
88
1 26
2 (5
302
) 63
948
63
948
-
100.
0%
61 4
55
61 4
55
Goo
ds a
nd s
ervi
ces
143
104
(211
) 16
078
15
8 97
1 15
8 97
1 -
100.
0%
128
569
128
569
Adm
inis
trativ
e fe
es
453
(161
) -
292
292
- 10
0.0%
43
5 43
5 A
dver
tisin
g 70
5 (1
48)
- 55
7 55
7 -
100.
0%
550
550
Min
or a
sset
s 98
4 (6
86)
- 29
8 29
8 -
100.
0%
205
205
Aud
it co
sts:
Ext
erna
l 11
130
1
183
- 12
313
12
313
-
100.
0%
10 7
47
10 7
47
Bur
sarie
s: E
mpl
oyee
s 1
000
(324
) -
676
676
- 10
0.0%
56
7 56
7 C
ater
ing:
Dep
artm
enta
l ac
tiviti
es
3 74
5 1
116
- 4
861
4 86
1 -
100.
0%
4 39
3 4
393
Com
mun
icat
ion
11 8
20
(7 4
36)
- 4
384
4 38
4 -
100.
0%
5 88
0 5
880
Com
pute
r ser
vice
s 10
680
(3
420
) -
7 26
0 7
260
- 10
0.0%
4
073
4 07
3 Le
gal s
ervi
ces
1 50
0 3
238
- 4
738
4 73
8 -
100.
0%
3 56
6 3
566

152
DEP
AR
TMEN
T O
F ED
UC
ATI
ON
VO
TE 4
APP
RO
PRIA
TIO
N S
TATE
MEN
T fo
r the
yea
r end
ed 3
1 M
arch
201
9
- 1
52 -
Con
tract
ors
174
178
- 35
2 35
2 -
100.
0%
12
12
Age
ncy
and
supp
ort /
ou
tsou
rced
ser
vice
s 23
916
3
524
6 72
5 34
165
34
165
-
100.
0%
22 7
82
22 7
82
Ent
erta
inm
ent
158
(157
) -
1 1
- 10
0.0%
5
5 Fl
eet s
ervi
ces
5 34
4 (2
514
) -
2 83
0 2
830
- 10
0.0%
1
814
1 81
4 In
vent
ory:
Oth
er s
uppl
ies
700
- 6
362
7 06
2 7
062
- 10
0.0%
7
000
7 00
0 C
onsu
mab
le s
uppl
ies
1 64
7 (3
15)
- 1
332
1 33
2 -
100.
0%
1 36
3 1
363
Con
sum
able
: Sta
tione
ry,
prin
ting
and
offic
e su
pplie
s 5
572
(435
) -
5 13
7 5
137
- 10
0.0%
4
514
4 51
4
Ope
ratin
g le
ases
19
7 5
437
- 5
634
5 63
4 -
100.
0%
5 11
3 5
113
Pro
perty
pay
men
ts
22 5
49
3 40
0 -
25 9
49
25 9
49
- 10
0.0%
15
194
15
194
Tr
ansp
ort p
rovi
ded:
D
epar
tmen
tal a
ctiv
ity
- 3
642
- 3
642
3 64
2 -
100.
0%
2 96
2 2
962
Trav
el a
nd s
ubsi
sten
ce
32 6
22
(3 0
44)
2 19
4 31
772
31
772
-
100.
0%
28 2
23
28 2
23
Trai
ning
and
dev
elop
men
t 4
150
(1 4
44)
- 2
706
2 70
6 -
100.
0%
4 91
4 4
914
Ope
ratin
g pa
ymen
ts
2 88
6 (1
305
) 77
5 2
356
2 35
6 -
100.
0%
3 44
6 3
446
Ven
ues
and
faci
litie
s 81
2 (1
80)
6 63
8 63
8 -
100.
0%
811
811
Ren
tal a
nd h
iring
36
0 (3
60)
16
16
16
- 10
0.0%
-
- In
tere
st a
nd re
nt o
n la
nd
- 20
7 -
207
207
- 10
0.0%
36
36
In
tere
st
- 20
7 -
207
207
- 10
0.0%
36
36
Tr
ansf
ers
and
subs
idie
s
628
787
- 1
415
4 71
7 (3
302
) 33
3.4%
65
7 1
657
Pro
vinc
es a
nd m
unic
ipal
ities
-
- -
- -
- -
- -
Dep
artm
enta
l age
ncie
s an
d ac
coun
ts
- -
- -
- -
- -
-
Non
-pro
fit in
stitu
tions
42
8 (4
28)
- -
- -
- -
- H
ouse
hold
s 20
0 1
215
- 1
415
4 71
7 (3
302
) 33
3.4%
65
7 1
657
Soc
ial b
enef
its
- 1
203
- 1
203
3 67
8 (2
475
) 30
5.7%
45
9 1
459
Oth
er tr
ansf
ers
to
hous
ehol
ds
200
12
- 21
2 1
039
(827
) 49
0.1%
19
8 19
8
Paym
ents
for c
apita
l ass
ets
21 2
66
- 4
415
25 6
81
25 6
81
- 10
0.0%
40
631
29
735
DEP
AR
TMEN
T O
F ED
UC
ATI
ON
VO
TE 4
APP
RO
PRIA
TIO
N S
TATE
MEN
T fo
r the
yea
r end
ed 3
1 M
arch
201
9
- 1
53 -
Bui
ldin
gs a
nd o
ther
fixe
d st
ruct
ures
-
- -
- -
- -
- -
Mac
hine
ry a
nd e
quip
men
t 21
266
-
4 41
5 25
681
25
681
-
100.
0%
24 5
61
20 3
24
Tran
spor
t equ
ipm
ent
16 4
18
- 3
267
19 6
85
19 6
85
- 10
0.0%
17
730
15
546
O
ther
mac
hine
ry a
nd
equi
pmen
t 4
848
- 1
148
5 99
6 5
996
- 10
0.0%
6
831
4 77
8
Sof
twar
e an
d ot
her i
ntan
gibl
e as
sets
-
- -
- -
- -
16 0
70
9 41
1
Paym
ent f
or fi
nanc
ial a
sset
s -
- -
- -
- -
- -
Tota
l 65
2 67
2 -
7 76
8 66
0 44
0 66
3 74
2 (3
302
) 10
0.5%
62
7 95
6 61
8 06
0

153
DEP
AR
TMEN
T O
F ED
UC
ATI
ON
VO
TE 4
APP
RO
PRIA
TIO
N S
TATE
MEN
T fo
r the
yea
r end
ed 3
1 M
arch
201
9
- 1
53 -
Bui
ldin
gs a
nd o
ther
fixe
d st
ruct
ures
-
- -
- -
- -
- -
Mac
hine
ry a
nd e
quip
men
t 21
266
-
4 41
5 25
681
25
681
-
100.
0%
24 5
61
20 3
24
Tran
spor
t equ
ipm
ent
16 4
18
- 3
267
19 6
85
19 6
85
- 10
0.0%
17
730
15
546
O
ther
mac
hine
ry a
nd
equi
pmen
t 4
848
- 1
148
5 99
6 5
996
- 10
0.0%
6
831
4 77
8
Sof
twar
e an
d ot
her i
ntan
gibl
e as
sets
-
- -
- -
- -
16 0
70
9 41
1
Paym
ent f
or fi
nanc
ial a
sset
s -
- -
- -
- -
- -
Tota
l 65
2 67
2 -
7 76
8 66
0 44
0 66
3 74
2 (3
302
) 10
0.5%
62
7 95
6 61
8 06
0

154
DEP
AR
TMEN
T O
F ED
UC
ATI
ON
VO
TE 4
APP
RO
PRIA
TIO
N S
TATE
MEN
T fo
r the
yea
r end
ed 3
1 M
arch
201
9
- 1
54 -
1.1
OFF
ICE
OF
THE
MEC
20
18/1
9 20
17/1
8
Adju
sted
Ap
prop
riati on
Shift
ing
of
Fund
s Vi
rem
ent
Fina
l Ap
prop
riatio
n Ac
tual
Ex
pend
iture
Va
rianc
e Ex
pend
iture
as
% o
f fin
al
appr
opria
tion
Fina
l Ap
prop
riatio
n Ac
tual
ex
pend
iture
Econ
omic
cla
ssifi
catio
n R
'000
R
'000
R
'000
R
'000
R
'000
R
'000
%
R
'000
R
'000
C
urre
nt p
aym
ents
10
430
1
529
- 11
959
11
959
-
100.
0%
11 2
75
11 2
75
Com
pens
atio
n of
em
ploy
ees
7 63
8 43
6 -
8 07
4 8
074
- 10
0.0%
7
663
7 66
3 G
oods
and
ser
vice
s 2
792
1 09
3 -
3 88
5 3
885
- 10
0.0%
3
612
3 61
2
Tr
ansf
ers
and
subs
idie
s
200
(19)
-
181
181
- 10
0.0%
19
8 19
8 H
ouse
hold
s 20
0 (1
9)
- 18
1 18
1 -
100.
0%
198
198
Paym
ents
for c
apita
l ass
ets
- 62
-
62
62
- 10
0.0%
40
40
M
achi
nery
and
equ
ipm
ent
- 62
-
62
62
- 10
0.0%
40
40
Pa
ymen
ts fo
r fin
anci
al a
sset
s -
- -
- -
- -
- -
Tota
l 10
630
1
572
- 12
202
12
202
-
100.
0%
11 5
13
11 5
13
1.
2 C
OR
POR
ATE
SER
VIC
ES
2018
/19
2017
/18
Ad
just
ed
Appr
opria
ti on
Shift
ing
of
Fund
s Vi
rem
ent
Fina
l Ap
prop
riatio
n Ac
tual
Ex
pend
iture
Va
rianc
e Ex
pend
iture
as
% o
f fin
al
appr
opria
tion
Fina
l Ap
prop
riatio
n Ac
tual
ex
pend
iture
Econ
omic
cla
ssifi
catio
n R
'000
R
'000
R
'000
R
'000
R
'000
R
'000
%
R
'000
R
'000
C
urre
nt p
aym
ents
33
8 84
9 (8
517
) (1
1 20
4)
319
128
319
128
- 10
0.0%
29
3 13
7 29
3 13
7 C
ompe
nsat
ion
of e
mpl
oyee
s 25
4 43
3 (1
045
) (1
1 20
4)
242
184
242
184
- 10
0.0%
23
3 46
6 23
3 46
6 G
oods
and
ser
vice
s 84
416
(7
679
) -
76 7
37
76 7
37
- 10
0.0%
59
635
59
635
In
tere
st a
nd re
nt o
n la
nd
- 20
7 -
207
207
- 10
0.0%
36
36
Tr
ansf
ers
and
subs
idie
s
- 23
-
23
2 48
5 (2
462
) 10
804
.3%
2
984

155
DEP
AR
TMEN
T O
F ED
UC
ATI
ON
VO
TE 4
APP
RO
PRIA
TIO
N S
TATE
MEN
T fo
r the
yea
r end
ed 3
1 M
arch
201
9
- 1
55 -
1.2
CO
RPO
RA
TE S
ERVI
CES
20
18/1
9 20
17/1
8
Adju
sted
Ap
prop
riati on
Shift
ing
of
Fund
s Vi
rem
ent
Fina
l Ap
prop
riatio
n Ac
tual
Ex
pend
iture
Va
rianc
e Ex
pend
iture
as
% o
f fin
al
appr
opria
tion
Fina
l Ap
prop
riatio
n Ac
tual
ex
pend
iture
Econ
omic
cla
ssifi
catio
n R
'000
R
'000
R
'000
R
'000
R
'000
R
'000
%
R
'000
R
'000
D
epar
tmen
tal a
genc
ies
and
acco
unts
-
- -
- -
- -
- -
Hou
seho
lds
- 23
-
23
2 48
5 (2
462
) 10
804
.3%
2
984
Paym
ents
for c
apita
l ass
ets
20 4
06
364
4 41
5 25
185
25
185
-
100.
0%
33 0
13
28 8
22
Mac
hine
ry a
nd e
quip
men
t 20
406
36
4 4
415
25 1
85
25 1
85
- 10
0.0%
23
583
19
411
S
oftw
are
and
othe
r int
angi
ble
asse
ts
- -
- -
- -
- 9
430
9 41
1
Paym
ents
for f
inan
cial
ass
ets
- -
- -
- -
- -
- To
tal
359
255
(8 1
30)
(6 7
89)
344
336
346
798
(2 4
62)
100.
7%
326
152
322
943
1.
3 E
DU
CA
TIO
N M
AN
AG
EMEN
T 20
18/1
9 20
17/1
8
Adju
sted
Ap
prop
riati on
Shift
ing
of
Fund
s Vi
rem
ent
Fina
l Ap
prop
riatio
n Ac
tual
Ex
pend
iture
Va
rianc
e Ex
pend
iture
as
% o
f fin
al
appr
opria
tion
Fina
l Ap
prop
riatio
n Ac
tual
ex
pend
iture
Econ
omic
cla
ssifi
catio
n R
'000
R
'000
R
'000
R
'000
R
'000
R
'000
%
R
'000
R
'000
C
urre
nt p
aym
ents
24
4 32
1 11
492
14
830
27
0 64
3 27
0 64
3 -
100.
0%
247
443
247
443
Com
pens
atio
n of
em
ploy
ees
204
480
(783
) (1
248
) 20
2 44
9 20
2 44
9 -
100.
0%
197
190
197
190
Goo
ds a
nd s
ervi
ces
39 8
41
12 2
75
16 0
78
68 1
94
68 1
94
- 10
0.0%
50
253
50
253
Tr
ansf
ers
and
subs
idie
s
428
783
- 1
211
1 86
1 (6
50)
153.
7%
457
457
Non
-pro
fit in
stitu
tions
42
8 (4
28)
-
-
- -
H
ouse
hold
s -
1 21
1 -
1 21
1 1
861
(650
) 15
3.7%
45
7 45
7

156
DEP
AR
TMEN
T O
F ED
UC
ATI
ON
VO
TE 4
APP
RO
PRIA
TIO
N S
TATE
MEN
T fo
r the
yea
r end
ed 3
1 M
arch
201
9
- 1
56 -
1.3
ED
UC
ATI
ON
MA
NA
GEM
ENT
2018
/19
2017
/18
Ad
just
ed
Appr
opria
ti on
Shift
ing
of
Fund
s Vi
rem
ent
Fina
l Ap
prop
riatio
n Ac
tual
Ex
pend
iture
Va
rianc
e Ex
pend
iture
as
% o
f fin
al
appr
opria
tion
Fina
l Ap
prop
riatio
n Ac
tual
ex
pend
iture
Econ
omic
cla
ssifi
catio
n R
'000
R
'000
R
'000
R
'000
R
'000
R
'000
%
R
'000
R
'000
Pa
ymen
ts fo
r cap
ital a
sset
s 75
9 (3
92)
- 36
7 36
7 -
100.
0%
642
642
Mac
hine
ry a
nd e
quip
men
t 75
9 (3
92)
- 36
7 36
7 -
100.
0%
642
642
Tota
l 24
5 50
8 11
883
14
830
27
2 22
1 27
2 87
1 (6
50)
100.
2%
248
542
248
542
1.
4 H
UM
AN
RES
OU
RC
E D
EVEL
OPM
ENT
2018
/19
2017
/18
Ad
just
ed
Appr
opria
ti on
Shift
ing
of
Fund
s Vi
rem
ent
Fina
l Ap
prop
riatio
n Ac
tual
Ex
pend
iture
Va
rianc
e Ex
pend
iture
as
% o
f fin
al
appr
opria
tion
Fina
l Ap
prop
riatio
n Ac
tual
ex
pend
iture
Econ
omic
cla
ssifi
catio
n R
'000
R
'000
R
'000
R
'000
R
'000
R
'000
%
R
'000
R
'000
C
urre
nt p
aym
ents
23
919
(1
714
) (2
73)
21 9
32
21 9
32
- 10
0.0%
22
205
22
205
C
ompe
nsat
ion
of e
mpl
oyee
s 15
942
-
(273
) 15
669
15
669
-
100.
0%
14 6
29
14 6
29
Goo
ds a
nd s
ervi
ces
7 97
7 (1
714
) -
6 26
3 6
263
- 10
0.0%
7
576
7 57
6
Tr
ansf
ers
and
subs
idie
s
- -
- -
190
(190
) -
- -
Hou
seho
lds
- -
- -
190
(190
) -
- -
Paym
ents
for c
apita
l ass
ets
70
(3)
- 67
67
-
100.
0%
244
179
Mac
hine
ry a
nd e
quip
men
t 70
(3
) -
67
67
- 10
0.0%
24
4 17
9 To
tal
23 9
89
(1 7
17)
(273
) 21
999
22
189
(1
90)
100.
9%
22 4
49
22 3
84
DEP
AR
TMEN
T O
F ED
UC
ATI
ON
VO
TE 4
APP
RO
PRIA
TIO
N S
TATE
MEN
T fo
r the
yea
r end
ed 3
1 M
arch
201
9
- 1
57 -
1.5
EMIS
20
18/1
9 20
17/1
8
Adju
sted
Ap
prop
riati on
Shift
ing
of
Fund
s Vi
rem
ent
Fina
l Ap
prop
riatio
n Ac
tual
Ex
pend
iture
Va
rianc
e Ex
pend
iture
as
% o
f fin
al
appr
opria
tion
Fina
l Ap
prop
riatio
n Ac
tual
ex
pend
iture
Econ
omic
cla
ssifi
catio
n R
'000
R
'000
R
'000
R
'000
R
'000
R
'000
%
R
'000
R
'000
C
urre
nt p
aym
ents
13
259
(3
577
) -
9 68
2 9
682
- 10
0.0%
12
608
12
608
C
ompe
nsat
ion
of e
mpl
oyee
s 5
181
609
- 5
790
5 79
0 -
100.
0%
5 11
5 5
115
Goo
ds a
nd s
ervi
ces
8 07
8 (4
186
) -
3 89
2 3
892
- 10
0.0%
7
493
7 49
3
Tr
ansf
ers
and
subs
idie
s
- -
- -
- -
- -
18
Hou
seho
lds
- -
- -
- -
- -
18
Paym
ents
for c
apita
l ass
ets
31
(31)
-
- -
- -
6 69
2 52
M
achi
nery
and
equ
ipm
ent
31
(31)
-
- -
- -
52
52
Sof
twar
e an
d ot
her i
ntan
gibl
e as
sets
-
- -
- -
- -
6 64
0 -
Tota
l 13
290
(3
608
) -
9 68
2 9
682
- 10
0.0%
19
300
12
678

157
DEP
AR
TMEN
T O
F ED
UC
ATI
ON
VO
TE 4
APP
RO
PRIA
TIO
N S
TATE
MEN
T fo
r the
yea
r end
ed 3
1 M
arch
201
9
- 1
57 -
1.5
EMIS
20
18/1
9 20
17/1
8
Adju
sted
Ap
prop
riati on
Shift
ing
of
Fund
s Vi
rem
ent
Fina
l Ap
prop
riatio
n Ac
tual
Ex
pend
iture
Va
rianc
e Ex
pend
iture
as
% o
f fin
al
appr
opria
tion
Fina
l Ap
prop
riatio
n Ac
tual
ex
pend
iture
Econ
omic
cla
ssifi
catio
n R
'000
R
'000
R
'000
R
'000
R
'000
R
'000
%
R
'000
R
'000
C
urre
nt p
aym
ents
13
259
(3
577
) -
9 68
2 9
682
- 10
0.0%
12
608
12
608
C
ompe
nsat
ion
of e
mpl
oyee
s 5
181
609
- 5
790
5 79
0 -
100.
0%
5 11
5 5
115
Goo
ds a
nd s
ervi
ces
8 07
8 (4
186
) -
3 89
2 3
892
- 10
0.0%
7
493
7 49
3
Tr
ansf
ers
and
subs
idie
s
- -
- -
- -
- -
18
Hou
seho
lds
- -
- -
- -
- -
18
Paym
ents
for c
apita
l ass
ets
31
(31)
-
- -
- -
6 69
2 52
M
achi
nery
and
equ
ipm
ent
31
(31)
-
- -
- -
52
52
Sof
twar
e an
d ot
her i
ntan
gibl
e as
sets
-
- -
- -
- -
6 64
0 -
Tota
l 13
290
(3
608
) -
9 68
2 9
682
- 10
0.0%
19
300
12
678

158
DEP
AR
TMEN
T O
F ED
UC
ATI
ON
VO
TE 4
APP
RO
PRIA
TIO
N S
TATE
MEN
T fo
r the
yea
r end
ed 3
1 M
arch
201
9
- 1
58 -
Prog
ram
me
2: P
UB
LIC
OR
DIN
AR
Y SC
HO
OL
EDU
CA
TIO
N
2018
/19
2017
/18
Ad
just
ed
Appr
opria
ti on
Shift
ing
of
Fund
s Vi
rem
ent
Fina
l Ap
prop
riatio
n Ac
tual
Ex
pend
iture
Va
rianc
e Ex
pend
iture
as
% o
f fin
al
appr
opria
tion
Fina
l Ap
prop
riatio
n Ac
tual
ex
pend
iture
R
'000
R
'000
R
'000
R
'000
R
'000
R
'000
%
R
'000
R
'000
Sub
prog
ram
me
1.
Pub
lic P
rimar
y Le
vel
2 85
7 28
9 38
802
(6
99)
2 89
5 39
2 2
906
010
(10
618)
10
0.4%
2
544
476
2 66
2 75
4
2.
Pub
lic S
econ
dary
Lev
el
1 68
1 95
0 (3
9 63
1)
- 1
642
319
1 64
2 31
9 -
100.
0%
1 48
8 47
6 1
488
555
3.
Hum
an R
esou
rce
Dev
elop
men
t 35
660
(1
861
) (1
262
) 32
537
32
825
(2
88)
100.
9%
28 9
47
28 8
05
4.
Sch
ool S
port,
Cul
ture
And
M
edia
Ser
vice
s 18
964
2
690
(20)
21
634
21
634
-
100.
0%
20 2
59
20 2
53
5.
Nat
iona
l Sch
ool N
utrit
ion
Pro
gram
me
gran
t 17
0 21
1 -
- 17
0 21
1 17
0 21
1 -
100.
0%
160
807
160
801
6.
Mat
hs, S
cien
ce a
nd
Tech
nolo
gy g
rant
24
564
-
- 24
564
24
564
-
100.
0%
23 6
36
23 5
95
Tota
l for
sub
pro
gram
mes
4
788
638
- (1
981
) 4
786
657
4 79
7 56
3 (1
0 90
6)
100.
2%
4 26
6 60
1 4
384
763
Econ
omic
cla
ssifi
catio
n
Cur
rent
pay
men
ts
4 36
7 36
8 (9
989
) (1
898
) 4
355
481
4 36
6 38
7 (1
0 90
6)
100.
3%
3 85
6 70
3 3
972
791
Com
pens
atio
n of
em
ploy
ees
4 11
9 51
0 2
462
39 0
52
4 16
1 02
4 4
171
930
(10
906)
10
0.3%
3
744
254
3 86
0 08
0 S
alar
ies
and
wag
es
3 60
2 61
0 11
202
1
263
3 61
5 07
5 3
615
363
(288
) 10
0.0%
3
262
279
3 34
0 97
7 S
ocia
l con
tribu
tions
51
6 90
0 (8
740
) 37
789
54
5 94
9 55
6 56
7 (1
0 61
8)
101.
9%
481
975
519
103
Goo
ds a
nd s
ervi
ces
247
858
(12
457)
(4
0 95
0)
194
451
194
451
- 10
0.0%
11
2 44
9 11
2 62
9 A
dmin
istra
tive
fees
-
206
- 20
6 20
6 -
100.
0%
162
342
Adv
ertis
ing
42
28
- 70
70
-
100.
0%
174
174
Min
or a
sset
s 30
(4
) -
26
26
- 10
0.0%
-
- A
udit
cost
s: E
xter
nal
- 18
-
18
18
- 10
0.0%
-
- B
ursa
ries:
Em
ploy
ees
- -
- -
- -
- 29
1 29
1
DEP
AR
TMEN
T O
F ED
UC
ATI
ON
VO
TE 4
APP
RO
PRIA
TIO
N S
TATE
MEN
T fo
r the
yea
r end
ed 3
1 M
arch
201
9
- 1
59 -
Prog
ram
me
2: P
UB
LIC
OR
DIN
AR
Y SC
HO
OL
EDU
CA
TIO
N
2018
/19
2017
/18
Ad
just
ed
Appr
opria
ti on
Shift
ing
of
Fund
s Vi
rem
ent
Fina
l Ap
prop
riatio
n Ac
tual
Ex
pend
iture
Va
rianc
e Ex
pend
iture
as
% o
f fin
al
appr
opria
tion
Fina
l Ap
prop
riatio
n Ac
tual
ex
pend
iture
R
'000
R
'000
R
'000
R
'000
R
'000
R
'000
%
R
'000
R
'000
C
ater
ing:
Dep
artm
enta
l ac
tiviti
es
1 97
5 50
(1
20)
1 90
5 1
905
- 10
0.0%
95
8 95
8
Com
mun
icat
ion
58
129
(46)
14
1 14
1 -
100.
0%
7 7
Com
pute
r ser
vice
s -
148
- 14
8 14
8 -
100.
0%
- -
Con
tract
ors
- 4
- 4
4 -
100.
0%
4 4
Age
ncy
and
supp
ort /
ou
tsou
rced
ser
vice
s 93
8 7
971
- 8
909
8 90
9 -
100.
0%
8 68
5 8
685
Flee
t ser
vice
s -
171
- 17
1 17
1 -
100.
0%
642
642
Inve
ntor
y: L
earn
er a
nd
teac
her s
uppo
rt m
ater
ial
37 3
25
(18
518)
(1
935
) 16
872
16
872
-
100.
0%
43 5
73
43 5
73
Inve
ntor
y: O
ther
sup
plie
s 43
438
(1
8 26
8)
(809
) 24
361
24
361
-
100.
0%
41 3
39
41 3
39
Con
sum
able
sup
plie
s 14
9 34
3 -
492
492
- 10
0.0%
75
7 75
7 C
onsu
mab
le: S
tatio
nery
, pr
intin
g an
d of
fice
supp
lies
359
372
- 73
1 73
1 -
100.
0%
381
381
Ope
ratin
g le
ases
1
304
450
- 1
754
1 75
4 -
100.
0%
- -
Pro
perty
pay
men
ts
6 58
3 (4
118
) (7
91)
1 67
4 1
674
- 10
0.0%
12
12
Tr
ansp
ort p
rovi
ded:
D
epar
tmen
tal a
ctiv
ity
148
058
11 9
32
(35
826)
12
4 16
4 12
4 16
4 -
100.
0%
3 07
3 3
073
Trav
el a
nd s
ubsi
sten
ce
7 00
3 4
308
(877
) 10
434
10
434
-
100.
0%
8 55
2 8
552
Trai
ning
and
dev
elop
men
t 33
15
0 -
183
183
- 10
0.0%
86
3 86
3 O
pera
ting
paym
ents
53
2 2
096
(532
) 2
096
2 09
6 -
100.
0%
2 54
0 2
540
Ven
ues
and
faci
litie
s 31
75
(1
4)
92
92
- 10
0.0%
43
6 43
6 In
tere
st a
nd re
nt o
n la
nd
- 6
- 6
6 -
100.
0%
- 82
In
tere
st
- 6
- 6
6 -
100.
0%
- 82
Tr
ansf
ers
and
subs
idie
s
420
623
9 82
4 1
430
448
430
448
- 10
0.0%
40
6 90
2 41
1 28
1 N
on-p
rofit
inst
itutio
ns
388
755
(5 3
23)
- 38
3 43
2 38
3 43
2 -
100.
0%
368
709
370
542

159
DEP
AR
TMEN
T O
F ED
UC
ATI
ON
VO
TE 4
APP
RO
PRIA
TIO
N S
TATE
MEN
T fo
r the
yea
r end
ed 3
1 M
arch
201
9
- 1
59 -
Prog
ram
me
2: P
UB
LIC
OR
DIN
AR
Y SC
HO
OL
EDU
CA
TIO
N
2018
/19
2017
/18
Ad
just
ed
Appr
opria
ti on
Shift
ing
of
Fund
s Vi
rem
ent
Fina
l Ap
prop
riatio
n Ac
tual
Ex
pend
iture
Va
rianc
e Ex
pend
iture
as
% o
f fin
al
appr
opria
tion
Fina
l Ap
prop
riatio
n Ac
tual
ex
pend
iture
R
'000
R
'000
R
'000
R
'000
R
'000
R
'000
%
R
'000
R
'000
C
ater
ing:
Dep
artm
enta
l ac
tiviti
es
1 97
5 50
(1
20)
1 90
5 1
905
- 10
0.0%
95
8 95
8
Com
mun
icat
ion
58
129
(46)
14
1 14
1 -
100.
0%
7 7
Com
pute
r ser
vice
s -
148
- 14
8 14
8 -
100.
0%
- -
Con
tract
ors
- 4
- 4
4 -
100.
0%
4 4
Age
ncy
and
supp
ort /
ou
tsou
rced
ser
vice
s 93
8 7
971
- 8
909
8 90
9 -
100.
0%
8 68
5 8
685
Flee
t ser
vice
s -
171
- 17
1 17
1 -
100.
0%
642
642
Inve
ntor
y: L
earn
er a
nd
teac
her s
uppo
rt m
ater
ial
37 3
25
(18
518)
(1
935
) 16
872
16
872
-
100.
0%
43 5
73
43 5
73
Inve
ntor
y: O
ther
sup
plie
s 43
438
(1
8 26
8)
(809
) 24
361
24
361
-
100.
0%
41 3
39
41 3
39
Con
sum
able
sup
plie
s 14
9 34
3 -
492
492
- 10
0.0%
75
7 75
7 C
onsu
mab
le: S
tatio
nery
, pr
intin
g an
d of
fice
supp
lies
359
372
- 73
1 73
1 -
100.
0%
381
381
Ope
ratin
g le
ases
1
304
450
- 1
754
1 75
4 -
100.
0%
- -
Pro
perty
pay
men
ts
6 58
3 (4
118
) (7
91)
1 67
4 1
674
- 10
0.0%
12
12
Tr
ansp
ort p
rovi
ded:
D
epar
tmen
tal a
ctiv
ity
148
058
11 9
32
(35
826)
12
4 16
4 12
4 16
4 -
100.
0%
3 07
3 3
073
Trav
el a
nd s
ubsi
sten
ce
7 00
3 4
308
(877
) 10
434
10
434
-
100.
0%
8 55
2 8
552
Trai
ning
and
dev
elop
men
t 33
15
0 -
183
183
- 10
0.0%
86
3 86
3 O
pera
ting
paym
ents
53
2 2
096
(532
) 2
096
2 09
6 -
100.
0%
2 54
0 2
540
Ven
ues
and
faci
litie
s 31
75
(1
4)
92
92
- 10
0.0%
43
6 43
6 In
tere
st a
nd re
nt o
n la
nd
- 6
- 6
6 -
100.
0%
- 82
In
tere
st
- 6
- 6
6 -
100.
0%
- 82
Tr
ansf
ers
and
subs
idie
s
420
623
9 82
4 1
430
448
430
448
- 10
0.0%
40
6 90
2 41
1 28
1 N
on-p
rofit
inst
itutio
ns
388
755
(5 3
23)
- 38
3 43
2 38
3 43
2 -
100.
0%
368
709
370
542

160
DEP
AR
TMEN
T O
F ED
UC
ATI
ON
VO
TE 4
APP
RO
PRIA
TIO
N S
TATE
MEN
T fo
r the
yea
r end
ed 3
1 M
arch
201
9
- 1
60 -
Prog
ram
me
2: P
UB
LIC
OR
DIN
AR
Y SC
HO
OL
EDU
CA
TIO
N
2018
/19
2017
/18
Ad
just
ed
Appr
opria
ti on
Shift
ing
of
Fund
s Vi
rem
ent
Fina
l Ap
prop
riatio
n Ac
tual
Ex
pend
iture
Va
rianc
e Ex
pend
iture
as
% o
f fin
al
appr
opria
tion
Fina
l Ap
prop
riatio
n Ac
tual
ex
pend
iture
R
'000
R
'000
R
'000
R
'000
R
'000
R
'000
%
R
'000
R
'000
H
ouse
hold
s 31
868
15
147
1
47 0
16
47 0
16
- 10
0.0%
38
193
40
739
S
ocia
l ben
efits
-
24 5
55
1 24
556
24
556
-
100.
0%
18 0
84
20 5
46
Oth
er tr
ansf
ers
to
hous
ehol
ds
31 8
68
(9 4
08)
- 22
460
22
460
-
100.
0%
20 1
09
20 1
93
Paym
ents
for c
apita
l ass
ets
647
165
(84)
72
8 72
8 -
100.
0%
2 99
6 69
1 M
achi
nery
and
equ
ipm
ent
647
165
(84)
72
8 72
8 -
100.
0%
2 99
6 69
1 Tr
ansp
ort e
quip
men
t 51
0 21
-
531
531
- 10
0.0%
55
8 55
8 O
ther
mac
hine
ry a
nd
equi
pmen
t 13
7 14
4 (8
4)
197
197
- 10
0.0%
2
438
133
Paym
ents
for f
inan
cial
ass
ets
- -
- -
- -
- -
- To
tal
4 78
8 63
8 -
(1 9
81)
4 78
6 65
7 4
797
563
(10
906)
10
0.2%
4
266
601
4 38
4 76
3
DEP
AR
TMEN
T O
F ED
UC
ATI
ON
VO
TE 4
APP
RO
PRIA
TIO
N S
TATE
MEN
T fo
r the
yea
r end
ed 3
1 M
arch
201
9
- 1
61 -
2.1
PUB
LIC
PR
IMA
RY
LEVE
L 20
18/1
9 20
17/1
8
Adju
sted
Ap
prop
riati on
Shift
ing
of
Fund
s Vi
rem
ent
Fina
l Ap
prop
riatio n
Actu
al
Expe
nditu
re
Varia
nce
Expe
nditu
re
as %
of f
inal
ap
prop
riatio
n
Fina
l Ap
prop
riatio
n Ac
tual
ex
pend
iture
Econ
omic
cla
ssifi
catio
n R
'000
R
'000
R
'000
R
'000
R
'000
R
'000
%
R
'000
R
'000
C
urre
nt p
aym
ents
2
690
018
22 4
97
(700
) 2
711
815
2 72
2 43
3 (1
0 61
8)
100.
4%
2 37
5 83
8 2
491
674
Com
pens
atio
n of
em
ploy
ees
2 55
4 38
0 53
438
37
711
2
645
529
2 65
6 14
7 (1
0 61
8)
100.
4%
2 33
4 24
5 2
450
078
Goo
ds a
nd s
ervi
ces
135
638
(30
946)
(3
8 41
1)
66 2
81
66 2
81
- 10
0.0%
41
593
41
593
In
tere
st a
nd re
nt o
n la
nd
- 5
- 5
5 -
100.
0%
- 3
Tran
sfer
s an
d su
bsid
ies
16
7 27
1 16
303
1
183
575
183
575
- 10
0.0%
16
8 63
8 17
1 08
0 N
on-p
rofit
inst
itutio
ns
156
929
961
15
7 89
0 15
7 89
0 -
100.
0%
148
995
148
995
Hou
seho
lds
10 3
42
15 3
42
1 25
685
25
685
-
100.
0%
19 6
43
22 0
85
Paym
ents
for c
apita
l ass
ets
- 2
- 2
2 -
100.
0%
- -
Mac
hine
ry a
nd e
quip
men
t -
2 -
2 2
- 10
0.0%
-
-
Pa
ymen
ts fo
r fin
anci
al a
sset
s -
- -
- -
- -
- -
Tota
l 2
857
289
38 8
02
(699
) 2
895
392
2 90
6 01
0 (1
0 61
8)
100.
4%
2 54
4 47
6 2
662
754
2.
2 PU
BLI
C S
ECO
ND
AR
Y LE
VEL
2018
/19
2017
/18
Ad
just
ed
Appr
opria
ti on
Shift
ing
of
Fund
s Vi
rem
ent
Fina
l Ap
prop
riatio
n Ac
tual
Ex
pend
iture
Va
rianc
e Ex
pend
iture
as
% o
f fin
al
appr
opria
tion
Fina
l Ap
prop
riatio
n Ac
tual
ex
pend
iture
Econ
omic
cla
ssifi
catio
n R
'000
R
'000
R
'000
R
'000
R
'000
R
'000
%
R
'000
R
'000
C
urre
nt p
aym
ents
1
584
274
(33
681)
-
1 55
0 59
3 1
550
593
- 10
0.0%
1
404
399
1 40
4 47
8 C
ompe
nsat
ion
of e
mpl
oyee
s 1
507
850
(49
461)
-
1 45
8 38
9 1
458
389
- 10
0.0%
1
364
657
1 36
4 65
7 G
oods
and
ser
vice
s 76
424
15
779
-
92 2
03
92 2
03
- 10
0.0%
39
742
39
742
In
tere
st a
nd re
nt o
n la
nd
- 1
- 1
1 -
100.
0%
- 79

161
DEP
AR
TMEN
T O
F ED
UC
ATI
ON
VO
TE 4
APP
RO
PRIA
TIO
N S
TATE
MEN
T fo
r the
yea
r end
ed 3
1 M
arch
201
9
- 1
61 -
2.1
PUB
LIC
PR
IMA
RY
LEVE
L 20
18/1
9 20
17/1
8
Adju
sted
Ap
prop
riati on
Shift
ing
of
Fund
s Vi
rem
ent
Fina
l Ap
prop
riatio n
Actu
al
Expe
nditu
re
Varia
nce
Expe
nditu
re
as %
of f
inal
ap
prop
riatio
n
Fina
l Ap
prop
riatio
n Ac
tual
ex
pend
iture
Econ
omic
cla
ssifi
catio
n R
'000
R
'000
R
'000
R
'000
R
'000
R
'000
%
R
'000
R
'000
C
urre
nt p
aym
ents
2
690
018
22 4
97
(700
) 2
711
815
2 72
2 43
3 (1
0 61
8)
100.
4%
2 37
5 83
8 2
491
674
Com
pens
atio
n of
em
ploy
ees
2 55
4 38
0 53
438
37
711
2
645
529
2 65
6 14
7 (1
0 61
8)
100.
4%
2 33
4 24
5 2
450
078
Goo
ds a
nd s
ervi
ces
135
638
(30
946)
(3
8 41
1)
66 2
81
66 2
81
- 10
0.0%
41
593
41
593
In
tere
st a
nd re
nt o
n la
nd
- 5
- 5
5 -
100.
0%
- 3
Tran
sfer
s an
d su
bsid
ies
16
7 27
1 16
303
1
183
575
183
575
- 10
0.0%
16
8 63
8 17
1 08
0 N
on-p
rofit
inst
itutio
ns
156
929
961
15
7 89
0 15
7 89
0 -
100.
0%
148
995
148
995
Hou
seho
lds
10 3
42
15 3
42
1 25
685
25
685
-
100.
0%
19 6
43
22 0
85
Paym
ents
for c
apita
l ass
ets
- 2
- 2
2 -
100.
0%
- -
Mac
hine
ry a
nd e
quip
men
t -
2 -
2 2
- 10
0.0%
-
-
Pa
ymen
ts fo
r fin
anci
al a
sset
s -
- -
- -
- -
- -
Tota
l 2
857
289
38 8
02
(699
) 2
895
392
2 90
6 01
0 (1
0 61
8)
100.
4%
2 54
4 47
6 2
662
754
2.
2 PU
BLI
C S
ECO
ND
AR
Y LE
VEL
2018
/19
2017
/18
Ad
just
ed
Appr
opria
ti on
Shift
ing
of
Fund
s Vi
rem
ent
Fina
l Ap
prop
riatio
n Ac
tual
Ex
pend
iture
Va
rianc
e Ex
pend
iture
as
% o
f fin
al
appr
opria
tion
Fina
l Ap
prop
riatio
n Ac
tual
ex
pend
iture
Econ
omic
cla
ssifi
catio
n R
'000
R
'000
R
'000
R
'000
R
'000
R
'000
%
R
'000
R
'000
C
urre
nt p
aym
ents
1
584
274
(33
681)
-
1 55
0 59
3 1
550
593
- 10
0.0%
1
404
399
1 40
4 47
8 C
ompe
nsat
ion
of e
mpl
oyee
s 1
507
850
(49
461)
-
1 45
8 38
9 1
458
389
- 10
0.0%
1
364
657
1 36
4 65
7 G
oods
and
ser
vice
s 76
424
15
779
-
92 2
03
92 2
03
- 10
0.0%
39
742
39
742
In
tere
st a
nd re
nt o
n la
nd
- 1
- 1
1 -
100.
0%
- 79

162
DEP
AR
TMEN
T O
F ED
UC
ATI
ON
VO
TE 4
APP
RO
PRIA
TIO
N S
TATE
MEN
T fo
r the
yea
r end
ed 3
1 M
arch
201
9
- 1
62 -
2.2
PUB
LIC
SEC
ON
DA
RY
LEVE
L 20
18/1
9 20
17/1
8
Adju
sted
Ap
prop
riati on
Shift
ing
of
Fund
s Vi
rem
ent
Fina
l Ap
prop
riatio
n Ac
tual
Ex
pend
iture
Va
rianc
e Ex
pend
iture
as
% o
f fin
al
appr
opria
tion
Fina
l Ap
prop
riatio
n Ac
tual
ex
pend
iture
Econ
omic
cla
ssifi
catio
n R
'000
R
'000
R
'000
R
'000
R
'000
R
'000
%
R
'000
R
'000
Tr
ansf
ers
and
subs
idie
s
97 6
76
(5 9
50)
- 91
726
91
726
-
100.
0%
84 0
77
84 0
77
Non
-pro
fit in
stitu
tions
76
150
(5
467
)
70 6
83
70 6
83
- 10
0.0%
65
527
65
527
H
ouse
hold
s 21
526
(4
83)
- 21
043
21
043
-
100.
0%
18 5
50
18 5
50
Tota
l 1
681
950
(39
631)
-
1 64
2 31
9 1
642
319
- 10
0.0%
1
488
476
1 48
8 55
5
2.3
HU
MA
N R
ESO
UR
CE
DEV
ELO
PMEN
T 20
18/1
9 20
17/1
8
Adju
sted
Ap
prop
riati on
Shift
ing
of
Fund
s Vi
rem
ent
Fina
l Ap
prop
riatio
n Ac
tual
Ex
pend
iture
Va
rianc
e Ex
pend
iture
as
% o
f fin
al
appr
opria
tion
Fina
l Ap
prop
riatio
n Ac
tual
ex
pend
iture
Econ
omic
cla
ssifi
catio
n R
'000
R
'000
R
'000
R
'000
R
'000
R
'000
%
R
'000
R
'000
C
urre
nt p
aym
ents
35
545
(2
149
) (1
198
) 32
198
32
486
(2
88)
100.
9%
28 7
43
28 7
43
Com
pens
atio
n of
em
ploy
ees
30 3
15
(2 1
49)
- 28
166
28
454
(2
88)
101.
0%
25 8
84
25 8
84
Goo
ds a
nd s
ervi
ces
5 23
0 -
(1 1
98)
4 03
2 4
032
- 10
0.0%
2
859
2 85
9
Tr
ansf
ers
and
subs
idie
s
- 28
8 -
288
288
- 10
0.0%
-
46
Hou
seho
lds
- 28
8 -
288
288
- 10
0.0%
-
46
Paym
ents
for c
apita
l ass
ets
115
- (6
4)
51
51
- 10
0.0%
20
4 16
M
achi
nery
and
equ
ipm
ent
115
- (6
4)
51
51
- 10
0.0%
20
4 16
To
tal
35 6
60
(1 8
61)
(1 2
62)
32 5
37
32 8
25
(288
) 10
0.9%
28
947
28
805
DEP
AR
TMEN
T O
F ED
UC
ATI
ON
VO
TE 4
APP
RO
PRIA
TIO
N S
TATE
MEN
T fo
r the
yea
r end
ed 3
1 M
arch
201
9
- 1
63 -
2.
4 SC
HO
OL
SPO
RT,
CU
LTU
RE
AN
D M
EDIA
SER
VIC
ES
2018
/19
2017
/18
Ad
just
ed
Appr
opria
ti on
Shift
ing
of
Fund
s Vi
rem
ent
Fina
l Ap
prop
riatio
n Ac
tual
Ex
pend
iture
Va
rianc
e Ex
pend
iture
as
% o
f fin
al
appr
opria
tion
Fina
l Ap
prop
riatio
n Ac
tual
ex
pend
iture
Econ
omic
cla
ssifi
catio
n R
'000
R
'000
R
'000
R
'000
R
'000
R
'000
%
R
'000
R
'000
C
urre
nt p
aym
ents
18
942
2
692
- 21
634
21
634
-
100.
0%
20 2
33
20 2
33
Com
pens
atio
n of
em
ploy
ees
18 2
76
(183
) -
18 0
93
18 0
93
- 10
0.0%
15
764
15
764
G
oods
and
ser
vice
s 66
6 2
875
- 3
541
3 54
1 -
100.
0%
4 46
9 4
469
Tran
sfer
s an
d su
bsid
ies
-
- -
- -
- -
- 20
H
ouse
hold
s -
- -
- -
- -
- 20
Pa
ymen
ts fo
r cap
ital a
sset
s 22
(2
) (2
0)
- -
- -
26
- M
achi
nery
and
equ
ipm
ent
22
(2)
(20)
-
- -
- 26
-
Tota
l 18
964
2
690
(20)
21
634
21
634
-
100.
0%
20 2
59
20 2
53
2.
5 N
ATI
ON
AL
SCH
OO
L N
UTR
ITIO
N P
RO
GR
AM
ME
GR
AN
T 20
18/1
9 20
17/1
8
Adju
sted
Ap
prop
riati on
Shift
ing
of
Fund
s Vi
rem
ent
Fina
l Ap
prop
riatio
n Ac
tual
Ex
pend
iture
Va
rianc
e Ex
pend
iture
as
% o
f fin
al
appr
opria
tion
Fina
l Ap
prop
riatio
n Ac
tual
ex
pend
iture
Econ
omic
cla
ssifi
catio
n R
'000
R
'000
R
'000
R
'000
R
'000
R
'000
%
R
'000
R
'000
C
urre
nt p
aym
ents
14
025
72
8 -
14 7
53
14 7
53
- 10
0.0%
7
400
7 65
2 C
ompe
nsat
ion
of e
mpl
oyee
s 8
689
817
1 34
1 10
847
10
847
-
100.
0%
3 70
4 3
697
Goo
ds a
nd s
ervi
ces
5 33
6 (8
9)
(1 3
41)
3 90
6 3
906
- 10
0.0%
3
696
3 95
5
Tr
ansf
ers
and
subs
idie
s
155
676
(817
) -
154
859
154
859
- 10
0.0%
15
0 64
1 15
2 47
4 N
on-p
rofit
inst
itutio
ns
155
676
(817
)
154
859
154
859
- 10
0.0%
15
0 64
1 15
2 47
4 H
ouse
hold
s -
- -
- -
- -
- -

163
DEP
AR
TMEN
T O
F ED
UC
ATI
ON
VO
TE 4
APP
RO
PRIA
TIO
N S
TATE
MEN
T fo
r the
yea
r end
ed 3
1 M
arch
201
9
- 1
63 -
2.
4 SC
HO
OL
SPO
RT,
CU
LTU
RE
AN
D M
EDIA
SER
VIC
ES
2018
/19
2017
/18
Ad
just
ed
Appr
opria
ti on
Shift
ing
of
Fund
s Vi
rem
ent
Fina
l Ap
prop
riatio
n Ac
tual
Ex
pend
iture
Va
rianc
e Ex
pend
iture
as
% o
f fin
al
appr
opria
tion
Fina
l Ap
prop
riatio
n Ac
tual
ex
pend
iture
Econ
omic
cla
ssifi
catio
n R
'000
R
'000
R
'000
R
'000
R
'000
R
'000
%
R
'000
R
'000
C
urre
nt p
aym
ents
18
942
2
692
- 21
634
21
634
-
100.
0%
20 2
33
20 2
33
Com
pens
atio
n of
em
ploy
ees
18 2
76
(183
) -
18 0
93
18 0
93
- 10
0.0%
15
764
15
764
G
oods
and
ser
vice
s 66
6 2
875
- 3
541
3 54
1 -
100.
0%
4 46
9 4
469
Tran
sfer
s an
d su
bsid
ies
-
- -
- -
- -
- 20
H
ouse
hold
s -
- -
- -
- -
- 20
Pa
ymen
ts fo
r cap
ital a
sset
s 22
(2
) (2
0)
- -
- -
26
- M
achi
nery
and
equ
ipm
ent
22
(2)
(20)
-
- -
- 26
-
Tota
l 18
964
2
690
(20)
21
634
21
634
-
100.
0%
20 2
59
20 2
53
2.
5 N
ATI
ON
AL
SCH
OO
L N
UTR
ITIO
N P
RO
GR
AM
ME
GR
AN
T 20
18/1
9 20
17/1
8
Adju
sted
Ap
prop
riati on
Shift
ing
of
Fund
s Vi
rem
ent
Fina
l Ap
prop
riatio
n Ac
tual
Ex
pend
iture
Va
rianc
e Ex
pend
iture
as
% o
f fin
al
appr
opria
tion
Fina
l Ap
prop
riatio
n Ac
tual
ex
pend
iture
Econ
omic
cla
ssifi
catio
n R
'000
R
'000
R
'000
R
'000
R
'000
R
'000
%
R
'000
R
'000
C
urre
nt p
aym
ents
14
025
72
8 -
14 7
53
14 7
53
- 10
0.0%
7
400
7 65
2 C
ompe
nsat
ion
of e
mpl
oyee
s 8
689
817
1 34
1 10
847
10
847
-
100.
0%
3 70
4 3
697
Goo
ds a
nd s
ervi
ces
5 33
6 (8
9)
(1 3
41)
3 90
6 3
906
- 10
0.0%
3
696
3 95
5
Tr
ansf
ers
and
subs
idie
s
155
676
(817
) -
154
859
154
859
- 10
0.0%
15
0 64
1 15
2 47
4 N
on-p
rofit
inst
itutio
ns
155
676
(817
)
154
859
154
859
- 10
0.0%
15
0 64
1 15
2 47
4 H
ouse
hold
s -
- -
- -
- -
- -

164
DEP
AR
TMEN
T O
F ED
UC
ATI
ON
VO
TE 4
APP
RO
PRIA
TIO
N S
TATE
MEN
T fo
r the
yea
r end
ed 3
1 M
arch
201
9
- 1
64 -
2.5
NA
TIO
NA
L SC
HO
OL
NU
TRIT
ION
PR
OG
RA
MM
E G
RA
NT
2018
/19
2017
/18
Ad
just
ed
Appr
opria
ti on
Shift
ing
of
Fund
s Vi
rem
ent
Fina
l Ap
prop
riatio
n Ac
tual
Ex
pend
iture
Va
rianc
e Ex
pend
iture
as
% o
f fin
al
appr
opria
tion
Fina
l Ap
prop
riatio
n Ac
tual
ex
pend
iture
Econ
omic
cla
ssifi
catio
n R
'000
R
'000
R
'000
R
'000
R
'000
R
'000
%
R
'000
R
'000
Pa
ymen
ts fo
r cap
ital a
sset
s 51
0 89
-
599
599
- 10
0.0%
2
766
675
Mac
hine
ry a
nd e
quip
men
t 51
0 89
-
599
599
- 10
0.0%
2
766
675
Tota
l 17
0 21
1 -
- 17
0 21
1 17
0 21
1 -
100.
0%
160
807
160
801
2.
6 M
ATH
S, S
CIE
NC
E A
ND
TEC
HN
OLO
GY
GR
AN
T 20
18/1
9 20
17/1
8
Adju
sted
Ap
prop
riati on
Shift
ing
of
Fund
s Vi
rem
ent
Fina
l Ap
prop
riatio
n Ac
tual
Ex
pend
iture
Va
rianc
e Ex
pend
iture
as
% o
f fin
al
appr
opria
tion
Fina
l Ap
prop
riatio
n Ac
tual
ex
pend
iture
Econ
omic
cla
ssifi
catio
n R
'000
R
'000
R
'000
R
'000
R
'000
R
'000
%
R
'000
R
'000
C
urre
nt p
aym
ents
24
564
(7
6)
- 24
488
24
488
-
100.
0%
20 0
90
20 0
11
Com
pens
atio
n of
em
ploy
ees
- -
- -
- -
- -
- G
oods
and
ser
vice
s 24
564
(7
6)
- 24
488
24
488
-
100.
0%
20 0
90
20 0
11
Tran
sfer
s an
d su
bsid
ies
-
- -
- -
- -
3 54
6 3
584
Non
-pro
fit in
stitu
tions
-
- -
- -
- -
3 54
6 3
546
Hou
seho
lds
- -
- -
- -
- -
38
Paym
ents
for c
apita
l ass
ets
- 76
-
76
76
- 10
0.0%
-
- M
achi
nery
and
equ
ipm
ent
- 76
-
76
76
- 10
0.0%
-
- To
tal
24 5
64
- -
24 5
64
24 5
64
- 10
0.0%
23
636
23
595
DEP
AR
TMEN
T O
F ED
UC
ATI
ON
VO
TE 4
APP
RO
PRIA
TIO
N S
TATE
MEN
T fo
r the
yea
r end
ed 3
1 M
arch
201
9
- 1
65 -
Prog
ram
me
3: I
ND
EPEN
DEN
T SC
HO
OL
SUB
SID
Y 20
18/1
9 20
17/1
8
Adju
sted
Ap
prop
riati on
Shift
ing
of
Fund
s Vi
rem
ent
Fina
l Ap
prop
riatio
n Ac
tual
Ex
pend
iture
Va
rianc
e Ex
pend
iture
as
% o
f fin
al
appr
opria
tion
Fina
l Ap
prop
riatio
n Ac
tual
ex
pend
iture
R
'000
R
'000
R
'000
R
'000
R
'000
R
'000
%
R
'000
R
'000
Sub
prog
ram
me
1.
Inde
pend
ent p
rimar
y le
vel
1 63
9 -
- 1
639
1 63
9 -
100.
0%
1 40
2 1
402
2.
Inde
pend
ent s
econ
dary
leve
l 7
961
- (1
) 7
960
7 96
0 -
100.
0%
7 76
2 7
762
Tota
l for
sub
pro
gram
mes
9
600
- (1
) 9
599
9 59
9 -
100.
0%
9 16
4 9
164
Econ
omic
cla
ssifi
catio
n
Cur
rent
pay
men
ts
- -
- -
- -
- -
- C
ompe
nsat
ion
of e
mpl
oyee
s -
- -
- -
- -
- -
Goo
ds a
nd s
ervi
ces
- -
- -
- -
- -
-
Tr
ansf
ers
and
subs
idie
s
9 60
0 -
(1)
9 59
9 9
599
- 10
0.0%
9
164
9 16
4 N
on-p
rofit
inst
itutio
ns
9 60
0 -
(1)
9 59
9 9
599
- 10
0.0%
9
164
9 16
4
Pa
ymen
ts fo
r cap
ital a
sset
s -
- -
- -
- -
- -
Mac
hine
ry a
nd e
quip
men
t -
- -
- -
- -
- -
Tota
l 9
600
- (1
) 9
599
9 59
9 -
100.
0%
9 16
4 9
164

165
DEP
AR
TMEN
T O
F ED
UC
ATI
ON
VO
TE 4
APP
RO
PRIA
TIO
N S
TATE
MEN
T fo
r the
yea
r end
ed 3
1 M
arch
201
9
- 1
65 -
Prog
ram
me
3: I
ND
EPEN
DEN
T SC
HO
OL
SUB
SID
Y 20
18/1
9 20
17/1
8
Adju
sted
Ap
prop
riati on
Shift
ing
of
Fund
s Vi
rem
ent
Fina
l Ap
prop
riatio
n Ac
tual
Ex
pend
iture
Va
rianc
e Ex
pend
iture
as
% o
f fin
al
appr
opria
tion
Fina
l Ap
prop
riatio
n Ac
tual
ex
pend
iture
R
'000
R
'000
R
'000
R
'000
R
'000
R
'000
%
R
'000
R
'000
Sub
prog
ram
me
1.
Inde
pend
ent p
rimar
y le
vel
1 63
9 -
- 1
639
1 63
9 -
100.
0%
1 40
2 1
402
2.
Inde
pend
ent s
econ
dary
leve
l 7
961
- (1
) 7
960
7 96
0 -
100.
0%
7 76
2 7
762
Tota
l for
sub
pro
gram
mes
9
600
- (1
) 9
599
9 59
9 -
100.
0%
9 16
4 9
164
Econ
omic
cla
ssifi
catio
n
Cur
rent
pay
men
ts
- -
- -
- -
- -
- C
ompe
nsat
ion
of e
mpl
oyee
s -
- -
- -
- -
- -
Goo
ds a
nd s
ervi
ces
- -
- -
- -
- -
-
Tr
ansf
ers
and
subs
idie
s
9 60
0 -
(1)
9 59
9 9
599
- 10
0.0%
9
164
9 16
4 N
on-p
rofit
inst
itutio
ns
9 60
0 -
(1)
9 59
9 9
599
- 10
0.0%
9
164
9 16
4
Pa
ymen
ts fo
r cap
ital a
sset
s -
- -
- -
- -
- -
Mac
hine
ry a
nd e
quip
men
t -
- -
- -
- -
- -
Tota
l 9
600
- (1
) 9
599
9 59
9 -
100.
0%
9 16
4 9
164

166
DEP
AR
TMEN
T O
F ED
UC
ATI
ON
VO
TE 4
APP
RO
PRIA
TIO
N S
TATE
MEN
T fo
r the
yea
r end
ed 3
1 M
arch
201
9
- 1
66 -
3.1
IND
EPEN
DEN
T PR
IMA
RY
LEVE
L 20
18/1
9 20
17/1
8
Adju
sted
Ap
prop
riati on
Shift
ing
of
Fund
s Vi
rem
ent
Fina
l Ap
prop
riatio
n Ac
tual
Ex
pend
iture
Va
rianc
e Ex
pend
iture
as
% o
f fin
al
appr
opria
tion
Fina
l Ap
prop
riatio
n Ac
tual
ex
pend
iture
Econ
omic
cla
ssifi
catio
n R
'000
R
'000
R
'000
R
'000
R
'000
R
'000
%
R
'000
R
'000
Tr
ansf
ers
and
subs
idie
s
1 63
9 -
- 1
639
1 63
9 -
100.
0%
1 40
2 1
402
Non
-pro
fit in
stitu
tions
1
639
- -
1 63
9 1
639
- 10
0.0%
1
402
1 40
2 To
tal
1 63
9 -
- 1
639
1 63
9 -
100.
0%
1 40
2 1
402
3.
2 IN
DEP
END
ENT
SEC
ON
DA
RY
LEVE
L 20
18/1
9 20
17/1
8
Adju
sted
Ap
prop
riati on
Shift
ing
of
Fund
s Vi
rem
ent
Fina
l Ap
prop
riatio
n Ac
tual
Ex
pend
iture
Va
rianc
e Ex
pend
iture
as
% o
f fin
al
appr
opria
tion
Fina
l Ap
prop
riatio
n Ac
tual
ex
pend
iture
Econ
omic
cla
ssifi
catio
n R
'000
R
'000
R
'000
R
'000
R
'000
R
'000
%
R
'000
R
'000
Tr
ansf
ers
and
subs
idie
s
7 96
1 -
(1)
7 96
0 7
960
- 10
0.0%
7
762
7 76
2 N
on-p
rofit
inst
itutio
ns
7 96
1 -
(1)
7 96
0 7
960
- 10
0.0%
7
762
7 76
2 To
tal
7 96
1 -
(1)
7 96
0 7
960
- 10
0.0%
7
762
7 76
2
DEP
AR
TMEN
T O
F ED
UC
ATI
ON
VO
TE 4
APP
RO
PRIA
TIO
N S
TATE
MEN
T fo
r the
yea
r end
ed 3
1 M
arch
201
9
- 1
67 -
Prog
ram
me
4: P
UB
LIC
SPE
CIA
L SC
HO
OL
EDU
CA
TIO
N
2018
/19
2017
/18
Ad
just
ed
Appr
opria
ti on
Shift
ing
of
Fund
s Vi
rem
ent
Fina
l Ap
prop
riatio
n Ac
tual
Ex
pend
iture
Va
rianc
e Ex
pend
iture
as
% o
f fin
al
appr
opria
tion
Fina
l Ap
prop
riatio
n Ac
tual
ex
pend
iture
R
'000
R
'000
R
'000
R
'000
R
'000
R
'000
%
R
'000
R
'000
Sub
prog
ram
me
1.
Sch
ools
15
1 66
4 39
9 74
3 15
2 80
6 15
3 65
5 (8
49)
100.
6%
138
872
140
208
2.
Hum
an R
esou
rce
Dev
elop
men
t 49
7 (3
99)
- 98
98
-
100.
0%
38
38
3.
Sch
ool S
port,
Cul
ture
And
M
edia
Ser
vice
s -
- -
- -
- -
- -
4.
Lear
ners
with
Pro
foun
d D
isab
ilitie
s 6
837
- -
6 83
7 6
833
4 99
.9%
2
021
1 55
7
Tota
l for
sub
pro
gram
mes
15
8 99
8 -
743
159
741
160
586
(845
) 10
0.5%
14
0 93
1 14
1 80
3
Econ
omic
cla
ssifi
catio
n
Cur
rent
pay
men
ts
143
179
(849
) 79
5 14
3 12
5 14
4 03
1 (9
06)
100.
6%
126
146
125
682
Com
pens
atio
n of
em
ploy
ees
138
998
(1 4
37)
795
138
356
139
205
(849
) 10
0.6%
12
4 52
9 12
4 52
9 S
alar
ies
and
wag
es
116
269
1 62
3 79
5 11
8 68
7 11
9 53
6 (8
49)
100.
7%
106
532
106
532
Soc
ial c
ontri
butio
ns
22 7
29
(3 0
60)
- 19
669
19
669
-
100.
0%
17 9
97
17 9
97
Goo
ds a
nd s
ervi
ces
4 18
1 58
8 -
4 76
9 4
826
(57)
10
1.2%
1
617
1 15
3 A
dmin
istra
tive
fees
-
18
- 18
18
-
100.
0%
16
16
Min
or a
sset
s 20
8 (1
94)
- 14
14
-
100.
0%
50
50
Cat
erin
g: D
epar
tmen
tal
activ
ities
52
(4
9)
- 3
3 -
100.
0%
26
26
Com
mun
icat
ion
36
(3
6)
- -
- -
- -
- C
ontra
ctor
s -
- -
- -
- -
4 4
Flee
t ser
vice
s (in
clud
ing
gove
rnm
ent m
otor
tran
spor
t) -
8 -
8 8
- 10
0.0%
2
2
Inve
ntor
y: L
earn
er a
nd
teac
her s
uppo
rt m
ater
ial
1 54
1 (7
55)
- 78
6 78
6 -
100.
0%
464
-

167
DEP
AR
TMEN
T O
F ED
UC
ATI
ON
VO
TE 4
APP
RO
PRIA
TIO
N S
TATE
MEN
T fo
r the
yea
r end
ed 3
1 M
arch
201
9
- 1
67 -
Prog
ram
me
4: P
UB
LIC
SPE
CIA
L SC
HO
OL
EDU
CA
TIO
N
2018
/19
2017
/18
Ad
just
ed
Appr
opria
ti on
Shift
ing
of
Fund
s Vi
rem
ent
Fina
l Ap
prop
riatio
n Ac
tual
Ex
pend
iture
Va
rianc
e Ex
pend
iture
as
% o
f fin
al
appr
opria
tion
Fina
l Ap
prop
riatio
n Ac
tual
ex
pend
iture
R
'000
R
'000
R
'000
R
'000
R
'000
R
'000
%
R
'000
R
'000
Sub
prog
ram
me
1.
Sch
ools
15
1 66
4 39
9 74
3 15
2 80
6 15
3 65
5 (8
49)
100.
6%
138
872
140
208
2.
Hum
an R
esou
rce
Dev
elop
men
t 49
7 (3
99)
- 98
98
-
100.
0%
38
38
3.
Sch
ool S
port,
Cul
ture
And
M
edia
Ser
vice
s -
- -
- -
- -
- -
4.
Lear
ners
with
Pro
foun
d D
isab
ilitie
s 6
837
- -
6 83
7 6
833
4 99
.9%
2
021
1 55
7
Tota
l for
sub
pro
gram
mes
15
8 99
8 -
743
159
741
160
586
(845
) 10
0.5%
14
0 93
1 14
1 80
3
Econ
omic
cla
ssifi
catio
n
Cur
rent
pay
men
ts
143
179
(849
) 79
5 14
3 12
5 14
4 03
1 (9
06)
100.
6%
126
146
125
682
Com
pens
atio
n of
em
ploy
ees
138
998
(1 4
37)
795
138
356
139
205
(849
) 10
0.6%
12
4 52
9 12
4 52
9 S
alar
ies
and
wag
es
116
269
1 62
3 79
5 11
8 68
7 11
9 53
6 (8
49)
100.
7%
106
532
106
532
Soc
ial c
ontri
butio
ns
22 7
29
(3 0
60)
- 19
669
19
669
-
100.
0%
17 9
97
17 9
97
Goo
ds a
nd s
ervi
ces
4 18
1 58
8 -
4 76
9 4
826
(57)
10
1.2%
1
617
1 15
3 A
dmin
istra
tive
fees
-
18
- 18
18
-
100.
0%
16
16
Min
or a
sset
s 20
8 (1
94)
- 14
14
-
100.
0%
50
50
Cat
erin
g: D
epar
tmen
tal
activ
ities
52
(4
9)
- 3
3 -
100.
0%
26
26
Com
mun
icat
ion
36
(3
6)
- -
- -
- -
- C
ontra
ctor
s -
- -
- -
- -
4 4
Flee
t ser
vice
s (in
clud
ing
gove
rnm
ent m
otor
tran
spor
t) -
8 -
8 8
- 10
0.0%
2
2
Inve
ntor
y: L
earn
er a
nd
teac
her s
uppo
rt m
ater
ial
1 54
1 (7
55)
- 78
6 78
6 -
100.
0%
464
-

168
DEP
AR
TMEN
T O
F ED
UC
ATI
ON
VO
TE 4
APP
RO
PRIA
TIO
N S
TATE
MEN
T fo
r the
yea
r end
ed 3
1 M
arch
201
9
- 1
68 -
Prog
ram
me
4: P
UB
LIC
SPE
CIA
L SC
HO
OL
EDU
CA
TIO
N
2018
/19
2017
/18
Ad
just
ed
Appr
opria
ti on
Shift
ing
of
Fund
s Vi
rem
ent
Fina
l Ap
prop
riatio
n Ac
tual
Ex
pend
iture
Va
rianc
e Ex
pend
iture
as
% o
f fin
al
appr
opria
tion
Fina
l Ap
prop
riatio
n Ac
tual
ex
pend
iture
R
'000
R
'000
R
'000
R
'000
R
'000
R
'000
%
R
'000
R
'000
In
vent
ory:
Oth
er s
uppl
ies
- 2
432
- 2
432
2 43
2 -
100.
0%
162
162
Con
sum
able
sup
plie
s 20
0 (6
3)
- 13
7 13
7 -
100.
0%
33
33
Con
sum
able
: Sta
tione
ry,
prin
ting
and
offic
e su
pplie
s 32
19
9 -
231
231
- 10
0.0%
21
8 21
8
Tran
spor
t pro
vide
d:
Dep
artm
enta
l act
ivity
-
257
- 25
7 25
7 -
100.
0%
- -
Trav
el a
nd s
ubsi
sten
ce
1 58
3 (8
71)
- 71
2 71
2 -
100.
0%
585
585
Trai
ning
and
dev
elop
men
t 52
3 (4
06)
- 11
7 11
7 -
100.
0%
38
38
Ope
ratin
g pa
ymen
ts
- -
- -
- -
- 16
16
V
enue
s an
d fa
cilit
ies
6 48
-
54
111
(57)
20
5.6%
3
3
Tr
ansf
ers
and
subs
idie
s
15 3
00
849
123
16 2
72
16 2
72
- 10
0.0%
14
479
15
815
N
on-p
rofit
inst
itutio
ns
11 0
00
- 12
3 11
123
11
123
-
100.
0%
10 3
13
10 6
80
Hou
seho
lds
4 30
0 84
9 -
5 14
9 5
149
- 10
0.0%
4
166
5 13
5 S
ocia
l ben
efits
-
950
- 95
0 95
0 -
100.
0%
- 96
9 O
ther
tran
sfer
s to
ho
useh
olds
4
300
(101
) -
4 19
9 4
199
- 10
0.0%
4
166
4 16
6
Paym
ents
for c
apita
l ass
ets
519
- (1
75)
344
283
61
82.3
%
306
306
Mac
hine
ry a
nd e
quip
men
t 51
9 -
(175
) 34
4 28
3 61
82
.3%
30
6 30
6 Tr
ansp
ort e
quip
men
t 26
4 (8
3)
- 18
1 12
0 61
66
.3%
30
30
O
ther
mac
hine
ry a
nd
equi
pmen
t 25
5 83
(1
75)
163
163
- 10
0.0%
27
6 27
6
Paym
ents
for f
inan
cial
ass
ets
- -
- -
- -
- -
- To
tal
158
998
- 74
3 15
9 74
1 16
0 58
6 (8
45)
100.
5%
140
931
141
803
DEP
AR
TMEN
T O
F ED
UC
ATI
ON
VO
TE 4
APP
RO
PRIA
TIO
N S
TATE
MEN
T fo
r the
yea
r end
ed 3
1 M
arch
201
9
- 1
69 -
4.
1 S
CH
OO
LS
2018
/19
2017
/18
Ad
just
ed
Appr
opria
ti on
Shift
ing
of
Fund
s Vi
rem
ent
Fina
l Ap
prop
riatio
n Ac
tual
Ex
pend
iture
Va
rianc
e Ex
pend
iture
as
% o
f fin
al
appr
opria
tion
Fina
l Ap
prop
riatio
n Ac
tual
ex
pend
iture
Econ
omic
cla
ssifi
catio
n R
'000
R
'000
R
'000
R
'000
R
'000
R
'000
%
R
'000
R
'000
C
urre
nt p
aym
ents
13
6 18
9 (4
50)
795
136
534
137
383
(849
) 10
0.6%
12
4 33
4 12
4 33
4 C
ompe
nsat
ion
of e
mpl
oyee
s 13
4 76
9 (5
37)
795
135
027
135
876
(849
) 10
0.6%
12
3 80
5 12
3 80
5 G
oods
and
ser
vice
s 1
420
87
- 1
507
1 50
7 -
100.
0%
529
529
Tran
sfer
s an
d su
bsid
ies
15
300
84
9 12
3 16
272
16
272
-
100.
0%
14 4
79
15 8
15
Non
-pro
fit in
stitu
tions
11
000
123
11 1
23
11 1
23
- 10
0.0%
10
313
10
680
H
ouse
hold
s 4
300
849
- 5
149
5 14
9 -
100.
0%
4 16
6 5
135
Paym
ents
for c
apita
l ass
ets
175
- (1
75)
- -
- -
59
59
Mac
hine
ry a
nd e
quip
men
t 17
5 -
(175
) -
- -
- 59
59
To
tal
151
664
399
743
152
806
153
655
(849
) 10
0.6%
13
8 87
2 14
0 20
8
4.2
HU
MA
N R
ESO
UR
CE
DEV
ELO
PMEN
T 20
18/1
9 20
17/1
8
Adju
sted
Ap
prop
riati on
Shift
ing
of
Fund
s Vi
rem
ent
Fina
l Ap
prop
riatio
n Ac
tual
Ex
pend
iture
Va
rianc
e Ex
pend
iture
as
% o
f fin
al
appr
opria
tion
Fina
l Ap
prop
riatio
n Ac
tual
ex
pend
iture
Econ
omic
cla
ssifi
catio
n R
'000
R
'000
R
'000
R
'000
R
'000
R
'000
%
R
'000
R
'000
C
urre
nt p
aym
ents
49
7 (3
99)
- 98
98
-
100.
0%
38
38
Com
pens
atio
n of
em
ploy
ees
- -
- -
- -
- -
- G
oods
and
ser
vice
s 49
7 (3
99)
- 98
98
-
100.
0%
38
38
Tota
l 49
7 (3
99)
- 98
98
-
100.
0%
38
38

169
DEP
AR
TMEN
T O
F ED
UC
ATI
ON
VO
TE 4
APP
RO
PRIA
TIO
N S
TATE
MEN
T fo
r the
yea
r end
ed 3
1 M
arch
201
9
- 1
69 -
4.
1 S
CH
OO
LS
2018
/19
2017
/18
Ad
just
ed
Appr
opria
ti on
Shift
ing
of
Fund
s Vi
rem
ent
Fina
l Ap
prop
riatio
n Ac
tual
Ex
pend
iture
Va
rianc
e Ex
pend
iture
as
% o
f fin
al
appr
opria
tion
Fina
l Ap
prop
riatio
n Ac
tual
ex
pend
iture
Econ
omic
cla
ssifi
catio
n R
'000
R
'000
R
'000
R
'000
R
'000
R
'000
%
R
'000
R
'000
C
urre
nt p
aym
ents
13
6 18
9 (4
50)
795
136
534
137
383
(849
) 10
0.6%
12
4 33
4 12
4 33
4 C
ompe
nsat
ion
of e
mpl
oyee
s 13
4 76
9 (5
37)
795
135
027
135
876
(849
) 10
0.6%
12
3 80
5 12
3 80
5 G
oods
and
ser
vice
s 1
420
87
- 1
507
1 50
7 -
100.
0%
529
529
Tran
sfer
s an
d su
bsid
ies
15
300
84
9 12
3 16
272
16
272
-
100.
0%
14 4
79
15 8
15
Non
-pro
fit in
stitu
tions
11
000
123
11 1
23
11 1
23
- 10
0.0%
10
313
10
680
H
ouse
hold
s 4
300
849
- 5
149
5 14
9 -
100.
0%
4 16
6 5
135
Paym
ents
for c
apita
l ass
ets
175
- (1
75)
- -
- -
59
59
Mac
hine
ry a
nd e
quip
men
t 17
5 -
(175
) -
- -
- 59
59
To
tal
151
664
399
743
152
806
153
655
(849
) 10
0.6%
13
8 87
2 14
0 20
8
4.2
HU
MA
N R
ESO
UR
CE
DEV
ELO
PMEN
T 20
18/1
9 20
17/1
8
Adju
sted
Ap
prop
riati on
Shift
ing
of
Fund
s Vi
rem
ent
Fina
l Ap
prop
riatio
n Ac
tual
Ex
pend
iture
Va
rianc
e Ex
pend
iture
as
% o
f fin
al
appr
opria
tion
Fina
l Ap
prop
riatio
n Ac
tual
ex
pend
iture
Econ
omic
cla
ssifi
catio
n R
'000
R
'000
R
'000
R
'000
R
'000
R
'000
%
R
'000
R
'000
C
urre
nt p
aym
ents
49
7 (3
99)
- 98
98
-
100.
0%
38
38
Com
pens
atio
n of
em
ploy
ees
- -
- -
- -
- -
- G
oods
and
ser
vice
s 49
7 (3
99)
- 98
98
-
100.
0%
38
38
Tota
l 49
7 (3
99)
- 98
98
-
100.
0%
38
38

170
DEP
AR
TMEN
T O
F ED
UC
ATI
ON
VO
TE 4
APP
RO
PRIA
TIO
N S
TATE
MEN
T fo
r the
yea
r end
ed 3
1 M
arch
201
9
- 1
70 -
4.3
SC
HO
OL,
SPO
RT,
CU
LTU
RE
AN
D M
EDIA
SER
VIC
ES
2018
/19
2017
/18
Ad
just
ed
Appr
opria
ti on
Shift
ing
of
Fund
s Vi
rem
ent
Fina
l Ap
prop
riatio
n Ac
tual
Ex
pend
iture
Va
rianc
e Ex
pend
iture
as
% o
f fin
al
appr
opria
tion
Fina
l Ap
prop
riatio
n Ac
tual
ex
pend
iture
Econ
omic
cla
ssifi
catio
n R
'000
R
'000
R
'000
R
'000
R
'000
R
'000
%
R
'000
R
'000
C
urre
nt p
aym
ents
-
- -
- -
- -
- -
Goo
ds a
nd s
ervi
ces
- -
- -
- -
- -
-
Tr
ansf
ers
and
subs
idie
s
- -
- -
- -
- -
- H
ouse
hold
s -
- -
- -
- -
- -
Tota
l -
- -
- -
- -
- -
4.
4 L
EAR
NER
S W
ITH
PR
OFO
UN
D D
ISA
BIL
ITIE
S 20
18/1
9 20
17/1
8
Adju
sted
Ap
prop
riati on
Shift
ing
of
Fund
s Vi
rem
ent
Fina
l Ap
prop
riatio
n Ac
tual
Ex
pend
iture
Va
rianc
e Ex
pend
iture
as
% o
f fin
al
appr
opria
tion
Fina
l Ap
prop
riatio
n Ac
tual
ex
pend
iture
Econ
omic
cla
ssifi
catio
n R
'000
R
'000
R
'000
R
'000
R
'000
R
'000
%
R
'000
R
'000
C
urre
nt p
aym
ents
6
493
- -
6 49
3 6
550
(57)
10
0.9%
1
774
1 31
0 C
ompe
nsat
ion
of e
mpl
oyee
s 4
229
(900
) -
3 32
9 3
329
- 10
0.0%
72
4 72
4 G
oods
and
ser
vice
s 2
264
900
- 3
164
3 22
1 (5
7)
101.
8%
1 05
0 58
6
Pa
ymen
ts fo
r cap
ital a
sset
s 34
4 -
- 34
4 28
3 61
82
.3%
24
7 24
7 M
achi
nery
and
equ
ipm
ent
344
- -
344
283
61
82.3
%
247
247
Tota
l 6
837
- -
6 83
7 6
833
4 99
.9%
2
021
1 55
7
DEP
AR
TMEN
T O
F ED
UC
ATI
ON
VO
TE 4
APP
RO
PRIA
TIO
N S
TATE
MEN
T fo
r the
yea
r end
ed 3
1 M
arch
201
9
- 1
71 -
Prog
ram
me
5: E
AR
LY C
HIL
DH
OO
D D
EVEL
OPM
ENT
2018
/19
2017
/18
Ad
just
ed
Appr
opria
ti on
Shift
ing
of
Fund
s Vi
rem
ent
Fina
l Ap
prop
riatio
n Ac
tual
Ex
pend
iture
Va
rianc
e Ex
pend
iture
as
% o
f fin
al
appr
opria
tion
Fina
l Ap
prop
riatio
n Ac
tual
ex
pend
iture
R
'000
R
'000
R
'000
R
'000
R
'000
R
'000
%
R
'000
R
'000
Sub
prog
ram
me
1.
Gra
de R
In P
ublic
Sch
ools
95
319
-
(4 0
46)
91 2
73
91 2
73
- 10
0.0%
86
786
86
616
2.
Gra
de R
In E
arly
Chi
ldho
od
Dev
elop
men
t Cen
tres
5 33
2 -
1 63
3 6
965
6 96
5 -
100.
0%
6 07
6 6
076
3.
Pre
-Gra
de R
Tra
inin
g 2
791
- (2
575
) 21
6 21
6 -
100.
0%
1 33
5 1
505
4.
Hum
an R
esou
rce
Dev
elop
men
t 20
0 -
(193
) 7
7 -
100.
0%
76
76
Tota
l for
sub
pro
gram
mes
10
3 64
2 -
(5 1
81)
98 4
61
98 4
61
- 10
0.0%
94
273
94
273
Econ
omic
cla
ssifi
catio
n
Cur
rent
pay
men
ts
88 8
66
- (6
163
) 82
703
82
703
-
100.
0%
80 1
06
80 2
76
Com
pens
atio
n of
em
ploy
ees
79 8
46
- (6
13)
79 2
33
79 2
33
- 10
0.0%
75
548
75
548
S
alar
ies
and
wag
es
76 3
16
(50)
(2
98)
75 9
68
75 9
68
- 10
0.0%
72
206
72
206
S
ocia
l con
tribu
tions
3
530
50
(315
) 3
265
3 26
5 -
100.
0%
3 34
2 3
342
Goo
ds a
nd s
ervi
ces
9 02
0 -
(5 5
50)
3 47
0 3
470
- 10
0.0%
4
558
4 72
8 A
dmin
istra
tive
fees
-
7 -
7 7
- 10
0.0%
10
10
A
dver
tisin
g -
- -
- -
- -
9 9
Cat
erin
g: D
epar
tmen
tal
activ
ities
1
282
(51)
(1
113
) 11
8 11
8 -
100.
0%
165
165
Con
tract
ors
- -
- -
- -
- 2
2 A
genc
y an
d su
ppor
t /
outs
ourc
ed s
ervi
ces
- 29
-
29
29
- 10
0.0%
55
2 55
2
Inve
ntor
y: L
earn
er a
nd
teac
her s
uppo
rt m
ater
ial
220
590
- 81
0 81
0 -
100.
0%
(62)
10
8

171
DEP
AR
TMEN
T O
F ED
UC
ATI
ON
VO
TE 4
APP
RO
PRIA
TIO
N S
TATE
MEN
T fo
r the
yea
r end
ed 3
1 M
arch
201
9
- 1
71 -
Prog
ram
me
5: E
AR
LY C
HIL
DH
OO
D D
EVEL
OPM
ENT
2018
/19
2017
/18
Ad
just
ed
Appr
opria
ti on
Shift
ing
of
Fund
s Vi
rem
ent
Fina
l Ap
prop
riatio
n Ac
tual
Ex
pend
iture
Va
rianc
e Ex
pend
iture
as
% o
f fin
al
appr
opria
tion
Fina
l Ap
prop
riatio
n Ac
tual
ex
pend
iture
R
'000
R
'000
R
'000
R
'000
R
'000
R
'000
%
R
'000
R
'000
Sub
prog
ram
me
1.
Gra
de R
In P
ublic
Sch
ools
95
319
-
(4 0
46)
91 2
73
91 2
73
- 10
0.0%
86
786
86
616
2.
Gra
de R
In E
arly
Chi
ldho
od
Dev
elop
men
t Cen
tres
5 33
2 -
1 63
3 6
965
6 96
5 -
100.
0%
6 07
6 6
076
3.
Pre
-Gra
de R
Tra
inin
g 2
791
- (2
575
) 21
6 21
6 -
100.
0%
1 33
5 1
505
4.
Hum
an R
esou
rce
Dev
elop
men
t 20
0 -
(193
) 7
7 -
100.
0%
76
76
Tota
l for
sub
pro
gram
mes
10
3 64
2 -
(5 1
81)
98 4
61
98 4
61
- 10
0.0%
94
273
94
273
Econ
omic
cla
ssifi
catio
n
Cur
rent
pay
men
ts
88 8
66
- (6
163
) 82
703
82
703
-
100.
0%
80 1
06
80 2
76
Com
pens
atio
n of
em
ploy
ees
79 8
46
- (6
13)
79 2
33
79 2
33
- 10
0.0%
75
548
75
548
S
alar
ies
and
wag
es
76 3
16
(50)
(2
98)
75 9
68
75 9
68
- 10
0.0%
72
206
72
206
S
ocia
l con
tribu
tions
3
530
50
(315
) 3
265
3 26
5 -
100.
0%
3 34
2 3
342
Goo
ds a
nd s
ervi
ces
9 02
0 -
(5 5
50)
3 47
0 3
470
- 10
0.0%
4
558
4 72
8 A
dmin
istra
tive
fees
-
7 -
7 7
- 10
0.0%
10
10
A
dver
tisin
g -
- -
- -
- -
9 9
Cat
erin
g: D
epar
tmen
tal
activ
ities
1
282
(51)
(1
113
) 11
8 11
8 -
100.
0%
165
165
Con
tract
ors
- -
- -
- -
- 2
2 A
genc
y an
d su
ppor
t /
outs
ourc
ed s
ervi
ces
- 29
-
29
29
- 10
0.0%
55
2 55
2
Inve
ntor
y: L
earn
er a
nd
teac
her s
uppo
rt m
ater
ial
220
590
- 81
0 81
0 -
100.
0%
(62)
10
8

172
DEP
AR
TMEN
T O
F ED
UC
ATI
ON
VO
TE 4
APP
RO
PRIA
TIO
N S
TATE
MEN
T fo
r the
yea
r end
ed 3
1 M
arch
201
9
- 1
72 -
Prog
ram
me
5: E
AR
LY C
HIL
DH
OO
D D
EVEL
OPM
ENT
2018
/19
2017
/18
Ad
just
ed
Appr
opria
ti on
Shift
ing
of
Fund
s Vi
rem
ent
Fina
l Ap
prop
riatio
n Ac
tual
Ex
pend
iture
Va
rianc
e Ex
pend
iture
as
% o
f fin
al
appr
opria
tion
Fina
l Ap
prop
riatio
n Ac
tual
ex
pend
iture
R
'000
R
'000
R
'000
R
'000
R
'000
R
'000
%
R
'000
R
'000
In
vent
ory:
Oth
er s
uppl
ies
2 08
5 22
0 (4
26)
1 87
9 1
879
- 10
0.0%
1
368
1 36
8 C
onsu
mab
le s
uppl
ies
50
- (5
0)
- -
- -
- -
Con
sum
able
: Sta
tione
ry,
prin
ting
and
offic
e su
pplie
s 78
81
-
159
159
- 10
0.0%
21
6 21
6
Tran
spor
t pro
vide
d:
Dep
artm
enta
l act
ivity
-
54
- 54
54
-
100.
0%
275
275
Trav
el a
nd s
ubsi
sten
ce
1 53
3 (9
44)
(196
) 39
3 39
3 -
100.
0%
949
949
Trai
ning
and
dev
elop
men
t 3
764
(7)
(3 7
57)
- -
- -
953
953
Ope
ratin
g pa
ymen
ts
- 21
-
21
21
- 10
0.0%
11
0 11
0 V
enue
s an
d fa
cilit
ies
8 -
(8)
- -
- -
11
11
Tran
sfer
s an
d su
bsid
ies
14
640
-
1 11
8 15
758
15
758
-
100.
0%
13 9
97
13 9
97
Non
-pro
fit in
stitu
tions
14
640
-
527
15 1
67
15 1
67
- 10
0.0%
13
997
13
997
H
ouse
hold
s -
- 59
1 59
1 59
1 -
100.
0%
- -
Soc
ial b
enef
its
- -
591
591
591
- 10
0.0%
-
-
Pa
ymen
ts fo
r cap
ital a
sset
s 13
6 -
(136
) -
- -
- 17
0 -
Mac
hine
ry a
nd e
quip
men
t 13
6 -
(136
) -
- -
- 17
0 -
Oth
er m
achi
nery
and
eq
uipm
ent
136
- (1
36)
- -
- -
170
-
Tota
l 10
3 64
2 -
(5 1
81)
98 4
61
98 4
61
- 10
0.0%
94
273
94
273
DEP
AR
TMEN
T O
F ED
UC
ATI
ON
VO
TE 4
APP
RO
PRIA
TIO
N S
TATE
MEN
T fo
r the
yea
r end
ed 3
1 M
arch
201
9
- 1
73 -
5.1
GR
AD
E R
IN P
UB
LIC
SC
HO
OLS
20
18/1
9 20
17/1
8
Adju
sted
Ap
prop
riati on
Shift
ing
of
Fund
s Vi
rem
ent
Fina
l Ap
prop
riatio
n Ac
tual
Ex
pend
iture
Va
rianc
e Ex
pend
iture
as
% o
f fin
al
appr
opria
tion
Fina
l Ap
prop
riatio
n Ac
tual
ex
pend
iture
Econ
omic
cla
ssifi
catio
n R
'000
R
'000
R
'000
R
'000
R
'000
R
'000
%
R
'000
R
'000
C
urre
nt p
aym
ents
80
543
-
(5 0
28)
75 5
15
75 5
15
- 10
0.0%
72
619
72
619
C
ompe
nsat
ion
of e
mpl
oyee
s 74
734
-
(587
) 74
147
74
147
-
100.
0%
70 4
97
70 4
97
Goo
ds a
nd s
ervi
ces
5 80
9 -
(4 4
41)
1 36
8 1
368
- 10
0.0%
2
122
2 12
2
Tr
ansf
ers
and
subs
idie
s
14 6
40
- 1
118
15 7
58
15 7
58
- 10
0.0%
13
997
13
997
N
on-p
rofit
inst
itutio
ns
14 6
40
52
7 15
167
15
167
-
100.
0%
13 9
97
13 9
97
Hou
seho
lds
- -
591
591
591
- 10
0.0%
-
-
Pa
ymen
ts fo
r cap
ital a
sset
s 13
6 -
(136
) -
- -
- 17
0 -
Mac
hine
ry a
nd e
quip
men
t 13
6 -
(136
) -
- -
- 17
0 -
Tota
l 95
319
-
(4 0
46)
91 2
73
91 2
73
- 10
0.0%
86
786
86
616
5.2
GR
AD
E R
IN E
AR
LY C
HIL
DH
OO
D D
EVEL
OPM
ENT
CEN
TRES
2018
/19
2017
/18
Ad
just
ed
Appr
opria
ti on
Shift
ing
of
Fund
s /V
irem
ent
Fina
l Ap
prop
riatio
n Ac
tual
Ex
pend
iture
Va
rianc
e Ex
pend
iture
as
% o
f fin
al
appr
opria
tion
Fina
l Ap
prop
riatio
n Ac
tual
ex
pend
iture
Econ
omic
cla
ssifi
catio
n R
'000
R
'000
R
'000
R
'000
R
'000
R
'000
%
R
'000
R
'000
C
urre
nt p
aym
ents
5
332
- 1
633
6 96
5 6
965
- 10
0.0%
6
076
6 07
6 C
ompe
nsat
ion
of e
mpl
oyee
s 5
112
- (2
6)
5 08
6 5
086
- 10
0.0%
5
051
5 05
1 G
oods
and
ser
vice
s 22
0 -
1 65
9 1
879
1 87
9 -
100.
0%
1 02
5 1
025
Tota
l 5
332
- 1
633
6 96
5 6
965
- 10
0.0%
6
076
6 07
6

173
DEP
AR
TMEN
T O
F ED
UC
ATI
ON
VO
TE 4
APP
RO
PRIA
TIO
N S
TATE
MEN
T fo
r the
yea
r end
ed 3
1 M
arch
201
9
- 1
73 -
5.1
GR
AD
E R
IN P
UB
LIC
SC
HO
OLS
20
18/1
9 20
17/1
8
Adju
sted
Ap
prop
riati on
Shift
ing
of
Fund
s Vi
rem
ent
Fina
l Ap
prop
riatio
n Ac
tual
Ex
pend
iture
Va
rianc
e Ex
pend
iture
as
% o
f fin
al
appr
opria
tion
Fina
l Ap
prop
riatio
n Ac
tual
ex
pend
iture
Econ
omic
cla
ssifi
catio
n R
'000
R
'000
R
'000
R
'000
R
'000
R
'000
%
R
'000
R
'000
C
urre
nt p
aym
ents
80
543
-
(5 0
28)
75 5
15
75 5
15
- 10
0.0%
72
619
72
619
C
ompe
nsat
ion
of e
mpl
oyee
s 74
734
-
(587
) 74
147
74
147
-
100.
0%
70 4
97
70 4
97
Goo
ds a
nd s
ervi
ces
5 80
9 -
(4 4
41)
1 36
8 1
368
- 10
0.0%
2
122
2 12
2
Tr
ansf
ers
and
subs
idie
s
14 6
40
- 1
118
15 7
58
15 7
58
- 10
0.0%
13
997
13
997
N
on-p
rofit
inst
itutio
ns
14 6
40
52
7 15
167
15
167
-
100.
0%
13 9
97
13 9
97
Hou
seho
lds
- -
591
591
591
- 10
0.0%
-
-
Pa
ymen
ts fo
r cap
ital a
sset
s 13
6 -
(136
) -
- -
- 17
0 -
Mac
hine
ry a
nd e
quip
men
t 13
6 -
(136
) -
- -
- 17
0 -
Tota
l 95
319
-
(4 0
46)
91 2
73
91 2
73
- 10
0.0%
86
786
86
616
5.2
GR
AD
E R
IN E
AR
LY C
HIL
DH
OO
D D
EVEL
OPM
ENT
CEN
TRES
2018
/19
2017
/18
Ad
just
ed
Appr
opria
ti on
Shift
ing
of
Fund
s /V
irem
ent
Fina
l Ap
prop
riatio
n Ac
tual
Ex
pend
iture
Va
rianc
e Ex
pend
iture
as
% o
f fin
al
appr
opria
tion
Fina
l Ap
prop
riatio
n Ac
tual
ex
pend
iture
Econ
omic
cla
ssifi
catio
n R
'000
R
'000
R
'000
R
'000
R
'000
R
'000
%
R
'000
R
'000
C
urre
nt p
aym
ents
5
332
- 1
633
6 96
5 6
965
- 10
0.0%
6
076
6 07
6 C
ompe
nsat
ion
of e
mpl
oyee
s 5
112
- (2
6)
5 08
6 5
086
- 10
0.0%
5
051
5 05
1 G
oods
and
ser
vice
s 22
0 -
1 65
9 1
879
1 87
9 -
100.
0%
1 02
5 1
025
Tota
l 5
332
- 1
633
6 96
5 6
965
- 10
0.0%
6
076
6 07
6

174
DEP
AR
TMEN
T O
F ED
UC
ATI
ON
VO
TE 4
APP
RO
PRIA
TIO
N S
TATE
MEN
T fo
r the
yea
r end
ed 3
1 M
arch
201
9
- 1
74 -
5.3
PR
E-G
RA
DE
R T
RA
ININ
G
2018
/19
2017
/18
Ad
just
ed
Appr
opria
ti on
Shift
ing
of
Fund
s Vi
rem
ent
Fina
l Ap
prop
riatio
n Ac
tual
Ex
pend
iture
Va
rianc
e Ex
pend
iture
as
% o
f fin
al
appr
opria
tion
Fina
l Ap
prop
riatio
n Ac
tual
ex
pend
iture
Econ
omic
cla
ssifi
catio
n R
'000
R
'000
R
'000
R
'000
R
'000
R
'000
%
R
'000
R
'000
C
urre
nt p
aym
ents
2
791
- (2
575
) 21
6 21
6 -
100.
0%
1 33
5 1
505
Com
pens
atio
n of
em
ploy
ees
- -
- -
- -
- -
- G
oods
and
ser
vice
s 2
791
- (2
575
) 21
6 21
6 -
100.
0%
1 33
5 1
505
Tota
l 2
791
- (2
575
) 21
6 21
6 -
100.
0%
1 33
5 1
505
5.
4 H
UM
AN
RES
OU
RC
E D
EVEL
OPM
ENT
2018
/19
2017
/18
Ad
just
ed
Appr
opria
ti on
Shift
ing
of
Fund
s Vi
rem
ent
Fina
l Ap
prop
riatio
n Ac
tual
Ex
pend
iture
Va
rianc
e Ex
pend
iture
as
% o
f fin
al
appr
opria
tion
Fina
l Ap
prop
riatio
n Ac
tual
ex
pend
iture
Econ
omic
cla
ssifi
catio
n R
'000
R
'000
R
'000
R
'000
R
'000
R
'000
%
R
'000
R
'000
C
urre
nt p
aym
ents
20
0 -
(193
) 7
7 -
100.
0%
76
76
Com
pens
atio
n of
em
ploy
ees
- -
- -
- -
- -
- G
oods
and
ser
vice
s 20
0 -
(193
) 7
7 -
100.
0%
76
76
Tota
l 20
0 -
(193
) 7
7 -
100.
0%
76
76
DEP
AR
TMEN
T O
F ED
UC
ATI
ON
VO
TE 4
APP
RO
PRIA
TIO
N S
TATE
MEN
T fo
r the
yea
r end
ed 3
1 M
arch
201
9
- 1
75 -
Prog
ram
me
6: I
NFR
AST
RU
CTU
RE
DEV
ELO
PMEN
T 20
18/1
9 20
17/1
8
Adju
sted
Ap
prop
riati on
Shift
ing
of
Fund
s Vi
rem
ent
Fina
l Ap
prop
riatio
n Ac
tual
Ex
pend
iture
Va
rianc
e Ex
pend
iture
as
% o
f fin
al
appr
opria
tion
Fina
l Ap
prop
riatio
n Ac
tual
ex
pend
iture
R
'000
R
'000
R
'000
R
'000
R
'000
R
'000
%
R
'000
R
'000
Sub
prog
ram
me
1.
Adm
inis
tratio
n 91
010
(4
4 65
9)
(12
214)
34
137
33
607
53
0 98
.4%
68
424
44
996
2.
Pub
lic O
rdin
ary
Sch
ools
48
0 66
6 38
447
-
519
113
519
113
- 10
0.0%
50
3 94
4 54
4 17
0
3.
Spe
cial
Sch
ools
5
791
4 21
8 -
10 0
09
10 0
09
- 10
0.0%
22
447
5
387
4.
Ear
ly C
hild
hood
Dev
elop
men
t 3
175
1 99
4 -
5 16
9 5
169
- 10
0.0%
17
452
15
042
Tota
l for
sub
pro
gram
mes
58
0 64
2 -
(12
214)
56
8 42
8 56
7 89
8 53
0 99
.9%
61
2 26
7 60
9 59
5
Econ
omic
cla
ssifi
catio
n
Cur
rent
pay
men
ts
245
809
(38
552)
(1
2 21
4)
195
043
194
513
530
99.7
%
101
450
180
412
Com
pens
atio
n of
em
ploy
ees
44 1
02
(101
) (2
3 12
6)
20 8
75
20 8
75
- 10
0.0%
37
432
19
537
S
alar
ies
and
wag
es
40 8
55
- (2
2 04
0)
18 8
15
18 8
15
- 10
0.0%
34
266
17
621
S
ocia
l con
tribu
tions
3
247
(101
) (1
086
) 2
060
2 06
0 -
100.
0%
3 16
6 1
916
Goo
ds a
nd s
ervi
ces
201
707
(38
453)
10
912
17
4 16
6 17
3 63
6 53
0 99
.7%
64
018
16
0 87
4 A
dmin
istra
tive
fees
-
7 -
7 7
- 10
0.0%
1
1 A
dver
tisin
g 6
5 -
11
11
- 10
0.0%
56
56
M
inor
ass
ets
- -
- -
- -
- 24
3 24
3 B
ursa
ries:
Em
ploy
ees
3 (3
) -
- -
- -
Cat
erin
g: D
epar
tmen
tal
activ
ities
32
(3
2)
- -
- -
- 10
10
Com
mun
icat
ion
33
(33)
-
- -
- -
- -
Con
sulta
nts:
Bus
ines
s an
d ad
viso
ry s
ervi
ces
82 9
34
(50
298)
10
912
43
548
43
018
53
0 98
.8%
6
820
16 0
08
Con
tract
ors
20
2 16
8 -
2 18
8 2
188
- 10
0.0%
11
639
11
639
Fl
eet s
ervi
ces
- 16
-
16
16
- 10
0.0%
33
33

175
DEP
AR
TMEN
T O
F ED
UC
ATI
ON
VO
TE 4
APP
RO
PRIA
TIO
N S
TATE
MEN
T fo
r the
yea
r end
ed 3
1 M
arch
201
9
- 1
75 -
Prog
ram
me
6: I
NFR
AST
RU
CTU
RE
DEV
ELO
PMEN
T 20
18/1
9 20
17/1
8
Adju
sted
Ap
prop
riati on
Shift
ing
of
Fund
s Vi
rem
ent
Fina
l Ap
prop
riatio
n Ac
tual
Ex
pend
iture
Va
rianc
e Ex
pend
iture
as
% o
f fin
al
appr
opria
tion
Fina
l Ap
prop
riatio
n Ac
tual
ex
pend
iture
R
'000
R
'000
R
'000
R
'000
R
'000
R
'000
%
R
'000
R
'000
Sub
prog
ram
me
1.
Adm
inis
tratio
n 91
010
(4
4 65
9)
(12
214)
34
137
33
607
53
0 98
.4%
68
424
44
996
2.
Pub
lic O
rdin
ary
Sch
ools
48
0 66
6 38
447
-
519
113
519
113
- 10
0.0%
50
3 94
4 54
4 17
0
3.
Spe
cial
Sch
ools
5
791
4 21
8 -
10 0
09
10 0
09
- 10
0.0%
22
447
5
387
4.
Ear
ly C
hild
hood
Dev
elop
men
t 3
175
1 99
4 -
5 16
9 5
169
- 10
0.0%
17
452
15
042
Tota
l for
sub
pro
gram
mes
58
0 64
2 -
(12
214)
56
8 42
8 56
7 89
8 53
0 99
.9%
61
2 26
7 60
9 59
5
Econ
omic
cla
ssifi
catio
n
Cur
rent
pay
men
ts
245
809
(38
552)
(1
2 21
4)
195
043
194
513
530
99.7
%
101
450
180
412
Com
pens
atio
n of
em
ploy
ees
44 1
02
(101
) (2
3 12
6)
20 8
75
20 8
75
- 10
0.0%
37
432
19
537
S
alar
ies
and
wag
es
40 8
55
- (2
2 04
0)
18 8
15
18 8
15
- 10
0.0%
34
266
17
621
S
ocia
l con
tribu
tions
3
247
(101
) (1
086
) 2
060
2 06
0 -
100.
0%
3 16
6 1
916
Goo
ds a
nd s
ervi
ces
201
707
(38
453)
10
912
17
4 16
6 17
3 63
6 53
0 99
.7%
64
018
16
0 87
4 A
dmin
istra
tive
fees
-
7 -
7 7
- 10
0.0%
1
1 A
dver
tisin
g 6
5 -
11
11
- 10
0.0%
56
56
M
inor
ass
ets
- -
- -
- -
- 24
3 24
3 B
ursa
ries:
Em
ploy
ees
3 (3
) -
- -
- -
Cat
erin
g: D
epar
tmen
tal
activ
ities
32
(3
2)
- -
- -
- 10
10
Com
mun
icat
ion
33
(33)
-
- -
- -
- -
Con
sulta
nts:
Bus
ines
s an
d ad
viso
ry s
ervi
ces
82 9
34
(50
298)
10
912
43
548
43
018
53
0 98
.8%
6
820
16 0
08
Con
tract
ors
20
2 16
8 -
2 18
8 2
188
- 10
0.0%
11
639
11
639
Fl
eet s
ervi
ces
- 16
-
16
16
- 10
0.0%
33
33

176
DEP
AR
TMEN
T O
F ED
UC
ATI
ON
VO
TE 4
APP
RO
PRIA
TIO
N S
TATE
MEN
T fo
r the
yea
r end
ed 3
1 M
arch
201
9
- 1
76 -
Prog
ram
me
6: I
NFR
AST
RU
CTU
RE
DEV
ELO
PMEN
T 20
18/1
9 20
17/1
8
Adju
sted
Ap
prop
riati on
Shift
ing
of
Fund
s Vi
rem
ent
Fina
l Ap
prop
riatio
n Ac
tual
Ex
pend
iture
Va
rianc
e Ex
pend
iture
as
% o
f fin
al
appr
opria
tion
Fina
l Ap
prop
riatio
n Ac
tual
ex
pend
iture
R
'000
R
'000
R
'000
R
'000
R
'000
R
'000
%
R
'000
R
'000
In
vent
ory:
Oth
er s
uppl
ies
17
9 61
4 -
9 63
1 9
631
- 10
0.0%
9
061
15 2
62
Con
sum
able
sup
plie
s 18
4 (1
80)
- 4
4 -
100.
0%
351
351
Con
sum
able
: Sta
tione
ry,
prin
ting
and
offic
e su
pplie
s 48
5 (2
78)
- 20
7 20
7 -
100.
0%
574
574
Ope
ratin
g le
ases
7
200
(40)
-
7 16
0 7
160
- 10
0.0%
88
2 7
378
Pro
perty
pay
men
ts
108
999
(457
) -
108
542
108
542
- 10
0.0%
33
069
10
8 04
0 Tr
ansp
ort p
rovi
ded:
D
epar
tmen
tal a
ctiv
ity
51
(51)
-
- -
- -
4 4
Trav
el a
nd s
ubsi
sten
ce
1 06
0 (1
2)
- 1
048
1 04
8 -
100.
0%
621
621
Trai
ning
and
dev
elop
men
t 31
3 (2
92)
- 21
21
-
100.
0%
8 8
Ope
ratin
g pa
ymen
ts
370
(366
) -
4 4
- 10
0.0%
8
8 R
enta
l and
hiri
ng
- 1
779
- 1
779
1 77
9 -
100.
0%
638
638
Inte
rest
and
rent
on
land
-
2 -
2 2
- 10
0.0%
-
1 In
tere
st
- 2
- 2
2 -
100.
0%
- 1
Tran
sfer
s an
d su
bsid
ies
-
101
- 10
1 10
1 -
100.
0%
- 22
0 H
ouse
hold
s -
101
- 10
1 10
1 -
100.
0%
- 22
0 S
ocia
l ben
efits
-
101
- 10
1 10
1 -
100.
0%
- -
Oth
er tr
ansf
ers
to
hous
ehol
ds
- -
- -
- -
- -
220
Paym
ents
for c
apita
l ass
ets
334
833
38 4
51
- 37
3 28
4 37
3 28
4 -
100.
0%
510
817
428
963
Bui
ldin
gs a
nd o
ther
fixe
d st
ruct
ures
31
0 02
5 18
451
-
328
476
328
476
- 10
0.0%
49
8 97
4 41
7 12
0
Bui
ldin
gs
310
025
18 4
51
- 32
8 47
6 32
8 47
6 -
100.
0%
- -
Oth
er fi
xed
stru
ctur
es
- -
- -
- -
- 49
8 97
4 41
7 12
0
DEP
AR
TMEN
T O
F ED
UC
ATI
ON
VO
TE 4
APP
RO
PRIA
TIO
N S
TATE
MEN
T fo
r the
yea
r end
ed 3
1 M
arch
201
9
- 1
77 -
Prog
ram
me
6: I
NFR
AST
RU
CTU
RE
DEV
ELO
PMEN
T 20
18/1
9 20
17/1
8
Adju
sted
Ap
prop
riati on
Shift
ing
of
Fund
s Vi
rem
ent
Fina
l Ap
prop
riatio
n Ac
tual
Ex
pend
iture
Va
rianc
e Ex
pend
iture
as
% o
f fin
al
appr
opria
tion
Fina
l Ap
prop
riatio
n Ac
tual
ex
pend
iture
R
'000
R
'000
R
'000
R
'000
R
'000
R
'000
%
R
'000
R
'000
M
achi
nery
and
equ
ipm
ent
24 8
08
20 0
00
- 44
808
44
808
-
100.
0%
11 8
43
11 8
43
Tran
spor
t equ
ipm
ent
- 11
6 -
116
116
- 10
0.0%
34
4 34
4 O
ther
mac
hine
ry a
nd
equi
pmen
t 24
808
19
884
-
44 6
92
44 6
92
- 10
0.0%
11
499
11
499
Paym
ent f
or fi
nanc
ial a
sset
s -
- -
- -
- -
- -
Tota
l 58
0 64
2 -
(12
214)
56
8 42
8 56
7 89
8 53
0 99
.9%
61
2 26
7 60
9 59
5

177
DEP
AR
TMEN
T O
F ED
UC
ATI
ON
VO
TE 4
APP
RO
PRIA
TIO
N S
TATE
MEN
T fo
r the
yea
r end
ed 3
1 M
arch
201
9
- 1
77 -
Prog
ram
me
6: I
NFR
AST
RU
CTU
RE
DEV
ELO
PMEN
T 20
18/1
9 20
17/1
8
Adju
sted
Ap
prop
riati on
Shift
ing
of
Fund
s Vi
rem
ent
Fina
l Ap
prop
riatio
n Ac
tual
Ex
pend
iture
Va
rianc
e Ex
pend
iture
as
% o
f fin
al
appr
opria
tion
Fina
l Ap
prop
riatio
n Ac
tual
ex
pend
iture
R
'000
R
'000
R
'000
R
'000
R
'000
R
'000
%
R
'000
R
'000
M
achi
nery
and
equ
ipm
ent
24 8
08
20 0
00
- 44
808
44
808
-
100.
0%
11 8
43
11 8
43
Tran
spor
t equ
ipm
ent
- 11
6 -
116
116
- 10
0.0%
34
4 34
4 O
ther
mac
hine
ry a
nd
equi
pmen
t 24
808
19
884
-
44 6
92
44 6
92
- 10
0.0%
11
499
11
499
Paym
ent f
or fi
nanc
ial a
sset
s -
- -
- -
- -
- -
Tota
l 58
0 64
2 -
(12
214)
56
8 42
8 56
7 89
8 53
0 99
.9%
61
2 26
7 60
9 59
5

178
DEP
AR
TMEN
T O
F ED
UC
ATI
ON
VO
TE 4
APP
RO
PRIA
TIO
N S
TATE
MEN
T fo
r the
yea
r end
ed 3
1 M
arch
201
9
- 1
78 -
6.1
AD
MIN
ISTR
ATI
ON
20
18/1
9 20
17/1
8
Adju
sted
Ap
prop
riati on
Shift
ing
of
Fund
s Vi
rem
ent
Fina
l Ap
prop
riatio
n Ac
tual
Ex
pend
iture
Va
rianc
e Ex
pend
iture
as
% o
f fin
al
appr
opria
tion
Fina
l Ap
prop
riatio
n Ac
tual
ex
pend
iture
Econ
omic
cla
ssifi
catio
n R
'000
R
'000
R
'000
R
'000
R
'000
R
'000
%
R
'000
R
'000
C
urre
nt p
aym
ents
86
810
(4
1 16
0)
(12
214)
33
436
32
906
53
0 98
.4%
49
914
40
944
C
ompe
nsat
ion
of e
mpl
oyee
s 44
102
(1
01)
(23
126)
20
875
20
875
-
100.
0%
37 4
32
19 5
37
Goo
ds a
nd s
ervi
ces
42 7
08
(41
061)
10
912
12
559
12
029
53
0 95
.8%
12
482
21
406
In
tere
st a
nd re
nt o
n la
nd
- 2
- 2
2 -
100.
0%
- 1
Tran
sfer
s an
d su
bsid
ies
- 10
1 -
101
101
- 10
0.0%
-
220
Hou
seho
lds
- 10
1 -
101
101
- 10
0.0%
-
220
Paym
ents
for c
apita
l ass
ets
4 20
0 (3
600
) -
600
600
- 10
0.0%
18
510
3
832
Bui
ldin
gs a
nd o
ther
fixe
d st
ruct
ures
4
200
(3 8
47)
- 35
3 35
3 -
100.
0%
14 6
78
-
Mac
hine
ry a
nd e
quip
men
t -
247
- 24
7 24
7 -
100.
0%
3 83
2 3
832
Tota
l 91
010
(4
4 65
9)
(12
214)
34
137
33
607
53
0 98
.4%
68
424
44
996
6.2
PU
BLI
C O
RD
INA
RY
SCH
OO
LS
2018
/19
2017
/18
Ad
just
ed
Appr
opria
ti on
Shift
ing
of
Fund
s Vi
rem
ent
Fina
l Ap
prop
riatio
n Ac
tual
Ex
pend
iture
Va
rianc
e Ex
pend
iture
as
% o
f fin
al
appr
opria
tion
Fina
l Ap
prop
riatio
n Ac
tual
ex
pend
iture
Econ
omic
cla
ssifi
catio
n R
'000
R
'000
R
'000
R
'000
R
'000
R
'000
%
R
'000
R
'000
C
urre
nt p
aym
ents
15
8 99
9 (7
957
) -
151
042
151
042
- 10
0.0%
47
006
12
7 56
7 G
oods
and
ser
vice
s 15
8 99
9 (7
957
) -
151
042
151
042
- 10
0.0%
47
006
12
7 56
7
Tr
ansf
ers
and
subs
idie
s -
- -
- -
- -
- -
Hou
seho
lds
- -
- -
- -
- -
-

179
DEP
AR
TMEN
T O
F ED
UC
ATI
ON
VO
TE 4
APP
RO
PRIA
TIO
N S
TATE
MEN
T fo
r the
yea
r end
ed 3
1 M
arch
201
9
- 1
79 -
6.2
PU
BLI
C O
RD
INA
RY
SCH
OO
LS
2018
/19
2017
/18
Ad
just
ed
Appr
opria
ti on
Shift
ing
of
Fund
s Vi
rem
ent
Fina
l Ap
prop
riatio
n Ac
tual
Ex
pend
iture
Va
rianc
e Ex
pend
iture
as
% o
f fin
al
appr
opria
tion
Fina
l Ap
prop
riatio
n Ac
tual
ex
pend
iture
Econ
omic
cla
ssifi
catio
n R
'000
R
'000
R
'000
R
'000
R
'000
R
'000
%
R
'000
R
'000
Pa
ymen
ts fo
r cap
ital a
sset
s 32
1 66
7 46
404
-
368
071
368
071
- 10
0.0%
45
6 93
8 41
6 60
3 B
uild
ings
and
oth
er fi
xed
stru
ctur
es
296
859
26 6
51
- 32
3 51
0 32
3 51
0 -
100.
0%
448
927
408
592
Mac
hine
ry a
nd e
quip
men
t 24
808
19
753
-
44 5
61
44 5
61
- 10
0.0%
8
011
8 01
1
480
666
38 4
47
- 51
9 11
3 51
9 11
3 -
100.
0%
503
944
544
170
6.
3 S
PEC
IAL
SCH
OO
LS
2018
/19
2017
/18
Ad
just
ed
Appr
opria
ti on
Shift
ing
of
Fund
s Vi
rem
ent
Fina
l Ap
prop
riatio
n Ac
tual
Ex
pend
iture
Va
rianc
e Ex
pend
iture
as
% o
f fin
al
appr
opria
tion
Fina
l Ap
prop
riatio
n Ac
tual
ex
pend
iture
Econ
omic
cla
ssifi
catio
n R
'000
R
'000
R
'000
R
'000
R
'000
R
'000
%
R
'000
R
'000
C
urre
nt p
aym
ents
-
7 73
0 -
7 73
0 7
730
- 10
0.0%
4
530
5 70
0 G
oods
and
ser
vice
s -
7 73
0 -
7 73
0 7
730
- 10
0.0%
4
530
5 70
0
Pa
ymen
ts fo
r cap
ital a
sset
s 5
791
(3 5
12)
- 2
279
2 27
9 -
100.
0%
17 9
17
(313
) B
uild
ings
and
oth
er fi
xed
stru
ctur
es
5 79
1 (3
512
) -
2 27
9 2
279
- 10
0.0%
17
917
(3
13)
Tota
l 5
791
4 21
8 -
10 0
09
10 0
09
- 10
0.0%
22
447
5
387
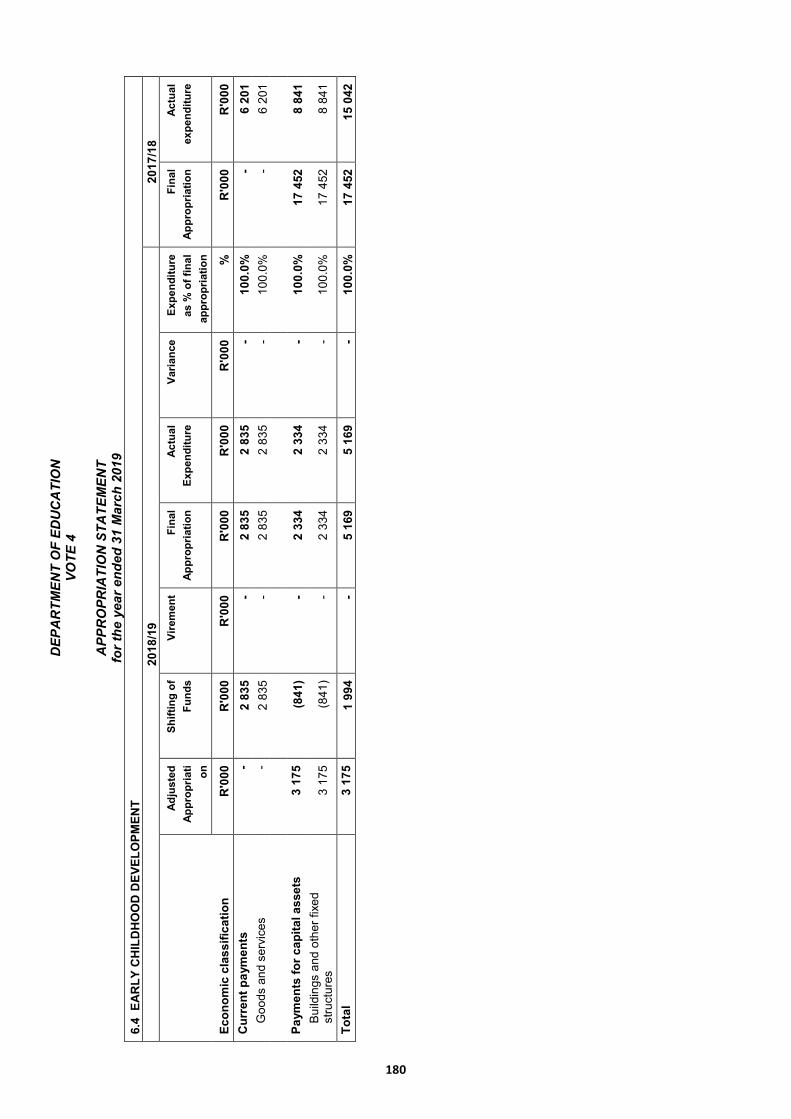
180
DEP
AR
TMEN
T O
F ED
UC
ATI
ON
VO
TE 4
APP
RO
PRIA
TIO
N S
TATE
MEN
T fo
r the
yea
r end
ed 3
1 M
arch
201
9
- 1
80 -
6.4
EA
RLY
CH
ILD
HO
OD
DEV
ELO
PMEN
T 20
18/1
9 20
17/1
8
Adju
sted
Ap
prop
riati on
Shift
ing
of
Fund
s Vi
rem
ent
Fina
l Ap
prop
riatio
n Ac
tual
Ex
pend
iture
Va
rianc
e Ex
pend
iture
as
% o
f fin
al
appr
opria
tion
Fina
l Ap
prop
riatio
n Ac
tual
ex
pend
iture
Econ
omic
cla
ssifi
catio
n R
'000
R
'000
R
'000
R
'000
R
'000
R
'000
%
R
'000
R
'000
C
urre
nt p
aym
ents
-
2 83
5 -
2 83
5 2
835
- 10
0.0%
-
6 20
1 G
oods
and
ser
vice
s -
2 83
5 -
2 83
5 2
835
- 10
0.0%
-
6 20
1
Pa
ymen
ts fo
r cap
ital a
sset
s 3
175
(841
) -
2 33
4 2
334
- 10
0.0%
17
452
8
841
Bui
ldin
gs a
nd o
ther
fixe
d st
ruct
ures
3
175
(841
) -
2 33
4 2
334
- 10
0.0%
17
452
8
841
Tota
l 3
175
1 99
4 -
5 16
9 5
169
- 10
0.0%
17
452
15
042
DEP
AR
TMEN
T O
F ED
UC
ATI
ON
VO
TE 4
APP
RO
PRIA
TIO
N S
TATE
MEN
T fo
r the
yea
r end
ed 3
1 M
arch
201
9
- 1
81 -
Prog
ram
me
7: E
XAM
INA
TIO
N A
ND
ED
UC
ATI
ON
REL
ATE
D S
ERVI
CES
20
18/1
9 20
17/1
8
Adju
sted
Ap
prop
riati on
Shift
ing
of
Fund
s Vi
rem
ent
Fina
l Ap
prop
riatio
n Ac
tual
Ex
pend
iture
Va
rianc
e Ex
pend
iture
as
% o
f fin
al
appr
opria
tion
Fina
l Ap
prop
riatio
n Ac
tual
ex
pend
iture
R
'000
R
'000
R
'000
R
'000
R
'000
R
'000
%
R
'000
R
'000
Sub
prog
ram
me
1.
Pay
men
t Set
a 6
691
- -
6 69
1 6
691
- 10
0.0%
6
373
6 37
3
2.
Pro
fess
iona
l Ser
vice
s
27 0
07
(933
) (3
383
) 22
691
22
857
(1
66)
100.
7%
22 6
82
22 7
80
3.
Spe
cial
Pro
ject
s 21
764
93
3 12
923
35
620
38
761
(3
141
) 10
8.8%
26
827
34
677
4.
Ext
erna
l Exa
min
atio
ns
73 9
85
- 1
326
75 3
11
75 7
64
(453
) 10
0.6%
79
398
75
263
5.
HIV
and
AID
S (L
ife S
kills
E
duca
tion)
Gra
nt
5 35
6 -
- 5
356
5 35
6 -
100.
0%
5 54
7 5
536
6.
Soc
ial S
ecto
r Exp
ande
d P
ublic
Wor
ks P
rogr
amm
e In
cent
ive
Gra
nt fo
r Pro
vinc
es
6 33
5 -
- 6
335
6 24
6 89
98
.6%
2
017
1 98
7
7.
Exp
ande
d Pu
blic
Wor
ks
Pro
gram
me
Ince
ntiv
e G
rant
fo
r Pro
vinc
es
2 22
2 -
- 2
222
2 15
8 64
97
.1%
2
083
2 03
1
Tota
l for
sub
pro
gram
mes
14
3 36
0 -
10 8
66
154
226
157
833
(3 6
07)
102.
3%
144
927
148
647
Econ
omic
cla
ssifi
catio
n
Cur
rent
pay
men
ts
109
812
780
11 1
23
121
715
121
841
(126
) 10
0.1%
11
7 49
4 12
3 00
4 C
ompe
nsat
ion
of e
mpl
oyee
s 66
390
(1
41)
(3 3
83)
62 8
66
62 5
54
312
99.5
%
70 6
73
71 0
05
Sal
arie
s an
d w
ages
55
867
91
8 (3
104
) 53
681
53
838
(1
57)
100.
3%
61 8
44
62 1
13
Soc
ial c
ontri
butio
ns
10 5
23
(1 0
59)
(279
) 9
185
8 71
6 46
9 94
.9%
8
829
8 89
2 G
oods
and
ser
vice
s 43
422
92
1 14
506
58
849
59
287
(4
38)
100.
7%
46 8
21
51 9
99
Adm
inis
trativ
e fe
es
6 48
-
54
54
- 10
0.0%
61
61
A
dver
tisin
g 12
2 (9
1)
- 31
31
-
100.
0%
37
37

181
DEP
AR
TMEN
T O
F ED
UC
ATI
ON
VO
TE 4
APP
RO
PRIA
TIO
N S
TATE
MEN
T fo
r the
yea
r end
ed 3
1 M
arch
201
9
- 1
81 -
Prog
ram
me
7: E
XAM
INA
TIO
N A
ND
ED
UC
ATI
ON
REL
ATE
D S
ERVI
CES
20
18/1
9 20
17/1
8
Adju
sted
Ap
prop
riati on
Shift
ing
of
Fund
s Vi
rem
ent
Fina
l Ap
prop
riatio
n Ac
tual
Ex
pend
iture
Va
rianc
e Ex
pend
iture
as
% o
f fin
al
appr
opria
tion
Fina
l Ap
prop
riatio
n Ac
tual
ex
pend
iture
R
'000
R
'000
R
'000
R
'000
R
'000
R
'000
%
R
'000
R
'000
Sub
prog
ram
me
1.
Pay
men
t Set
a 6
691
- -
6 69
1 6
691
- 10
0.0%
6
373
6 37
3
2.
Pro
fess
iona
l Ser
vice
s
27 0
07
(933
) (3
383
) 22
691
22
857
(1
66)
100.
7%
22 6
82
22 7
80
3.
Spe
cial
Pro
ject
s 21
764
93
3 12
923
35
620
38
761
(3
141
) 10
8.8%
26
827
34
677
4.
Ext
erna
l Exa
min
atio
ns
73 9
85
- 1
326
75 3
11
75 7
64
(453
) 10
0.6%
79
398
75
263
5.
HIV
and
AID
S (L
ife S
kills
E
duca
tion)
Gra
nt
5 35
6 -
- 5
356
5 35
6 -
100.
0%
5 54
7 5
536
6.
Soc
ial S
ecto
r Exp
ande
d P
ublic
Wor
ks P
rogr
amm
e In
cent
ive
Gra
nt fo
r Pro
vinc
es
6 33
5 -
- 6
335
6 24
6 89
98
.6%
2
017
1 98
7
7.
Exp
ande
d Pu
blic
Wor
ks
Pro
gram
me
Ince
ntiv
e G
rant
fo
r Pro
vinc
es
2 22
2 -
- 2
222
2 15
8 64
97
.1%
2
083
2 03
1
Tota
l for
sub
pro
gram
mes
14
3 36
0 -
10 8
66
154
226
157
833
(3 6
07)
102.
3%
144
927
148
647
Econ
omic
cla
ssifi
catio
n
Cur
rent
pay
men
ts
109
812
780
11 1
23
121
715
121
841
(126
) 10
0.1%
11
7 49
4 12
3 00
4 C
ompe
nsat
ion
of e
mpl
oyee
s 66
390
(1
41)
(3 3
83)
62 8
66
62 5
54
312
99.5
%
70 6
73
71 0
05
Sal
arie
s an
d w
ages
55
867
91
8 (3
104
) 53
681
53
838
(1
57)
100.
3%
61 8
44
62 1
13
Soc
ial c
ontri
butio
ns
10 5
23
(1 0
59)
(279
) 9
185
8 71
6 46
9 94
.9%
8
829
8 89
2 G
oods
and
ser
vice
s 43
422
92
1 14
506
58
849
59
287
(4
38)
100.
7%
46 8
21
51 9
99
Adm
inis
trativ
e fe
es
6 48
-
54
54
- 10
0.0%
61
61
A
dver
tisin
g 12
2 (9
1)
- 31
31
-
100.
0%
37
37

182
DEP
AR
TMEN
T O
F ED
UC
ATI
ON
VO
TE 4
APP
RO
PRIA
TIO
N S
TATE
MEN
T fo
r the
yea
r end
ed 3
1 M
arch
201
9
- 1
82 -
Prog
ram
me
7: E
XAM
INA
TIO
N A
ND
ED
UC
ATI
ON
REL
ATE
D S
ERVI
CES
20
18/1
9 20
17/1
8
Adju
sted
Ap
prop
riati on
Shift
ing
of
Fund
s Vi
rem
ent
Fina
l Ap
prop
riatio
n Ac
tual
Ex
pend
iture
Va
rianc
e Ex
pend
iture
as
% o
f fin
al
appr
opria
tion
Fina
l Ap
prop
riatio
n Ac
tual
ex
pend
iture
R
'000
R
'000
R
'000
R
'000
R
'000
R
'000
%
R
'000
R
'000
M
inor
ass
ets
146
(146
) -
- -
- -
33
33
Cat
erin
g: D
epar
tmen
tal
activ
ities
4
551
(1 2
44)
- 3
307
3 30
7 -
100.
0%
1 10
3 1
103
Com
mun
icat
ion
194
(152
) -
42
42
- 10
0.0%
82
82
C
ompu
ter s
ervi
ces
300
(299
) -
1 1
- 10
0.0%
14
8 14
8 C
ontra
ctor
s 54
21
2 -
266
266
- 10
0.0%
21
21
A
genc
y an
d su
ppor
t /
outs
ourc
ed s
ervi
ces
6 55
6 2
502
12 9
23
21 9
81
22 0
39
(58)
10
0.3%
13
380
18
346
Flee
t ser
vice
s 20
11
-
31
31
- 10
0.0%
23
23
In
vent
ory:
Fue
l, oi
l and
gas
17
(1
7)
- -
- -
- -
- In
vent
ory:
Lea
rner
and
te
ache
r sup
port
mat
eria
l 20
1 10
9 -
310
310
- 10
0.0%
12
12
Inve
ntor
y: O
ther
sup
plie
s -
- -
- -
- -
- 21
2 C
onsu
mab
le s
uppl
ies
1 29
4 (6
40)
117
771
771
- 10
0.0%
1
453
1 45
3 C
onsu
mab
le: S
tatio
nery
, pr
intin
g an
d of
fice
supp
lies
6 95
3 2
032
140
9 12
5 9
036
89
99.0
%
7 47
2 7
472
Ope
ratin
g le
ases
9
000
(9 0
00)
- -
- -
- 5
192
5 19
2 P
rope
rty p
aym
ents
6
086
7 38
0 -
13 4
66
13 4
66
- 10
0.0%
10
620
10
620
Tr
ansp
ort p
rovi
ded:
D
epar
tmen
tal a
ctiv
ity
758
(758
) -
- -
- -
476
476
Trav
el a
nd s
ubsi
sten
ce
5 77
1 (1
18)
- 5
653
5 65
3 -
100.
0%
5 14
7 5
147
Trai
ning
and
dev
elop
men
t 90
0 10
3 -
1 00
3 1
003
- 10
0.0%
81
5 81
5 O
pera
ting
paym
ents
60
1
046
1 32
6 2
432
2 90
1 (4
69)
119.
3%
506
506
Ven
ues
and
faci
litie
s 43
3 (5
7)
- 37
6 37
6 -
100.
0%
240
240
Inte
rest
and
rent
on
land
-
- -
- -
- -
- -
Inte
rest
-
- -
- -
- -
- -

183
DEP
AR
TMEN
T O
F ED
UC
ATI
ON
VO
TE 4
APP
RO
PRIA
TIO
N S
TATE
MEN
T fo
r the
yea
r end
ed 3
1 M
arch
201
9
- 1
83 -
Prog
ram
me
7: E
XAM
INA
TIO
N A
ND
ED
UC
ATI
ON
REL
ATE
D S
ERVI
CES
20
18/1
9 20
17/1
8
Adju
sted
Ap
prop
riati on
Shift
ing
of
Fund
s Vi
rem
ent
Fina
l Ap
prop
riatio
n Ac
tual
Ex
pend
iture
Va
rianc
e Ex
pend
iture
as
% o
f fin
al
appr
opria
tion
Fina
l Ap
prop
riatio
n Ac
tual
ex
pend
iture
R
'000
R
'000
R
'000
R
'000
R
'000
R
'000
%
R
'000
R
'000
Tr
ansf
ers
and
subs
idie
s
33 0
60
(939
) -
32 1
21
35 6
02
(3 4
81)
110.
8%
21 0
55
23 5
81
Dep
artm
enta
l age
ncie
s an
d ac
coun
ts
6 69
1 -
- 6
691
6 69
1 -
100.
0%
6 37
3 6
373
Dep
artm
enta
l age
ncie
s 6
691
- -
6 69
1 6
691
- 10
0.0%
6
373
6 37
3 N
on-p
rofit
inst
itutio
ns
24 3
69
(1 0
96)
- 23
273
25
557
(2
284
) 10
9.8%
11
682
13
276
H
ouse
hold
s 2
000
157
- 2
157
3 35
4 (1
197
) 15
5.5%
3
000
3 93
2 S
ocia
l ben
efits
-
157
- 15
7 32
3 (1
66)
205.
7%
- 63
8 O
ther
tran
sfer
s to
ho
useh
olds
2
000
- -
2 00
0 3
031
(1 0
31)
151.
6%
3 00
0 3
294
Paym
ents
for c
apita
l ass
ets
488
159
(257
) 39
0 39
0 -
100.
0%
6 37
8 2
062
Mac
hine
ry a
nd e
quip
men
t 48
8 15
9 (2
57)
390
390
- 10
0.0%
6
378
2 06
2 Tr
ansp
ort e
quip
men
t 29
9 -
(97)
20
2 20
2 -
100.
0%
14
349
Oth
er m
achi
nery
and
eq
uipm
ent
189
159
(160
) 18
8 18
8 -
100.
0%
6 36
4 1
713
Inta
ngib
le a
sset
s -
- -
- -
- -
- -
Paym
ent f
or fi
nanc
ial a
sset
s -
- -
- -
- -
- -
Tota
l 14
3 36
0 -
10 8
66
154
226
157
833
(3 6
07)
102.
3%
144
927
148
647

184
DEP
AR
TMEN
T O
F ED
UC
ATI
ON
VO
TE 4
APP
RO
PRIA
TIO
N S
TATE
MEN
T fo
r the
yea
r end
ed 3
1 M
arch
201
9
- 1
84 -
7.1
PA
YMEN
T SE
TA
2018
/19
2017
/18
Ad
just
ed
Appr
opria
ti on
Shift
ing
of
Fund
s Vi
rem
ent
Fina
l Ap
prop
riatio
n Ac
tual
Ex
pend
iture
Va
rianc
e Ex
pend
iture
as
% o
f fin
al
appr
opria
tion
Fina
l Ap
prop
riatio
n Ac
tual
ex
pend
iture
Econ
omic
cla
ssifi
catio
n R
'000
R
'000
R
'000
R
'000
R
'000
R
'000
%
R
'000
R
'000
Tr
ansf
ers
and
subs
idie
s
6 69
1 -
- 6
691
6 69
1 -
100.
0%
6 37
3 6
373
Dep
artm
enta
l age
ncie
s an
d ac
coun
ts
6 69
1 -
- 6
691
6 69
1 -
100.
0%
6 37
3 6
373
Tota
l 6
691
- -
6 69
1 6
691
- 10
0.0%
6
373
6 37
3
7.2
PR
OFE
SSIO
NA
L SE
RVI
CES
20
18/1
9 20
17/1
8
Adju
sted
Ap
prop
riati on
Shift
ing
of
Fund
s Vi
rem
ent
Fina
l Ap
prop
riatio
n Ac
tual
Ex
pend
iture
Va
rianc
e Ex
pend
iture
as
% o
f fin
al
appr
opria
tion
Fina
l Ap
prop
riatio
n Ac
tual
ex
pend
iture
Econ
omic
cla
ssifi
catio
n R
'000
R
'000
R
'000
R
'000
R
'000
R
'000
%
R
'000
R
'000
C
urre
nt p
aym
ents
27
007
(9
51)
(3 3
83)
22 6
73
22 6
73
- 10
0.0%
22
601
22
601
C
ompe
nsat
ion
of e
mpl
oyee
s 25
628
(5
9)
(3 3
83)
22 1
86
22 1
86
- 10
0.0%
22
241
22
241
G
oods
and
ser
vice
s 1
379
(892
) -
487
487
- 10
0.0%
36
0 36
0 In
tere
st a
nd re
nt o
n la
nd
- -
- -
- -
- -
-
Tr
ansf
ers
and
subs
idie
s
- -
- -
166
(166
) -
- 12
7 H
ouse
hold
s -
- -
- 16
6 (1
66)
- -
127
Paym
ents
for c
apita
l ass
ets
- 18
-
18
18
- 10
0.0%
81
52
M
achi
nery
and
equ
ipm
ent
- 18
-
18
18
- 10
0.0%
81
52
To
tal
27 0
07
(933
) (3
383
) 22
691
22
857
(1
66)
100.
7%
22 6
82
22 7
80

185
DEP
AR
TMEN
T O
F ED
UC
ATI
ON
VO
TE 4
APP
RO
PRIA
TIO
N S
TATE
MEN
T fo
r the
yea
r end
ed 3
1 M
arch
201
9
- 1
85 -
7.3
SPE
CIA
L PR
OJE
CTS
20
18/1
9 20
17/1
8
Adju
sted
Ap
prop
riati on
Shift
ing
of
Fund
s Vi
rem
ent
Fina
l Ap
prop
riatio
n Ac
tual
Ex
pend
iture
Va
rianc
e Ex
pend
iture
as
% o
f fin
al
appr
opria
tion
Fina
l Ap
prop
riatio
n Ac
tual
ex
pend
iture
Econ
omic
cla
ssifi
catio
n R
'000
R
'000
R
'000
R
'000
R
'000
R
'000
%
R
'000
R
'000
C
urre
nt p
aym
ents
-
933
12 9
23
13 8
56
13 9
78
(122
) 10
0.9%
14
162
19
340
C
ompe
nsat
ion
of e
mpl
oyee
s -
59
- 59
59
-
100.
0%
6 54
8 6
548
Goo
ds a
nd s
ervi
ces
- 87
4 12
923
13
797
13
919
(1
22)
100.
9%
7 61
4 12
792
Tr
ansf
ers
and
subs
idie
s
21 7
64
- -
21 7
64
24 7
83
(3 0
19)
113.
9%
12 6
65
15 3
37
Non
-pro
fit in
stitu
tions
19
764
19
764
22
048
(2
284
) 11
1.6%
9
665
12 0
43
Hou
seho
lds
2 00
0 -
- 2
000
2 73
5 (7
35)
136.
8%
3 00
0 3
294
Paym
ents
for c
apita
l ass
ets
- -
- -
- -
- -
- M
achi
nery
and
equ
ipm
ent
- -
- -
- -
- -
- S
oftw
are
and
oth
er In
tang
ible
as
sets
-
- -
- -
- -
- -
Tota
l 21
764
93
3 12
923
35
620
38
761
(3
141
) 10
8.8%
26
827
34
677
7.4
EXT
ERN
AL
EXA
MIN
ATI
ON
S 20
18/1
9 20
17/1
8
Adju
sted
Ap
prop
riati on
Shift
ing
of
Fund
s Vi
rem
ent
Fina
l Ap
prop
riatio
n Ac
tual
Ex
pend
iture
Va
rianc
e Ex
pend
iture
as
% o
f fin
al
appr
opria
tion
Fina
l Ap
prop
riatio
n Ac
tual
ex
pend
iture
Econ
omic
cla
ssifi
catio
n R
'000
R
'000
R
'000
R
'000
R
'000
R
'000
%
R
'000
R
'000
C
urre
nt p
aym
ents
73
985
(2
98)
1 32
6 75
013
75
170
(1
57)
100.
2%
73 1
38
73 1
38
Com
pens
atio
n of
em
ploy
ees
39 3
30
(157
) -
39 1
73
38 8
61
312
99.2
%
40 6
11
40 6
11
Goo
ds a
nd s
ervi
ces
34 6
55
(141
) 1
326
35 8
40
36 3
09
(469
) 10
1.3%
32
527
32
527
Tr
ansf
ers
and
subs
idie
s
- 15
7 -
157
453
(296
) 28
8.5%
-
487

186
DEP
AR
TMEN
T O
F ED
UC
ATI
ON
VO
TE 4
APP
RO
PRIA
TIO
N S
TATE
MEN
T fo
r the
yea
r end
ed 3
1 M
arch
201
9
- 1
86 -
7.4
EXT
ERN
AL
EXA
MIN
ATI
ON
S 20
18/1
9 20
17/1
8
Adju
sted
Ap
prop
riati on
Shift
ing
of
Fund
s Vi
rem
ent
Fina
l Ap
prop
riatio
n Ac
tual
Ex
pend
iture
Va
rianc
e Ex
pend
iture
as
% o
f fin
al
appr
opria
tion
Fina
l Ap
prop
riatio
n Ac
tual
ex
pend
iture
Econ
omic
cla
ssifi
catio
n R
'000
R
'000
R
'000
R
'000
R
'000
R
'000
%
R
'000
R
'000
H
ouse
hold
s -
157
- 15
7 45
3 (2
96)
288.
5%
- 48
7
Pa
ymen
ts fo
r cap
ital a
sset
s -
141
- 14
1 14
1 -
100.
0%
6 26
0 1
638
Mac
hine
ry a
nd e
quip
men
t -
141
- 14
1 14
1 -
100.
0%
6 26
0 1
638
Tota
l 73
985
-
1 32
6 75
311
75
764
(4
53)
100.
6%
79 3
98
75 2
63
7.
5 H
IV A
ND
AID
S (L
IFE
SKIL
LS E
DU
CA
TIO
N) G
RA
NT
2018
/19
2017
/18
Ad
just
ed
Appr
opria
ti on
Shift
ing
of
Fund
s Vi
rem
ent
Fina
l Ap
prop
riatio
n Ac
tual
Ex
pend
iture
Va
rianc
e Ex
pend
iture
as
% o
f fin
al
appr
opria
tion
Fina
l Ap
prop
riatio
n Ac
tual
ex
pend
iture
Econ
omic
cla
ssifi
catio
n R
'000
R
'000
R
'000
R
'000
R
'000
R
'000
%
R
'000
R
'000
C
urre
nt p
aym
ents
5
037
- 11
7 5
154
5 15
4 -
100.
0%
5 51
0 5
140
Com
pens
atio
n of
em
ploy
ees
1 43
2 (2
5)
- 1
407
1 40
7 -
100.
0%
1 27
3 1
605
Goo
ds a
nd s
ervi
ces
3 60
5 25
11
7 3
747
3 74
7 -
100.
0%
4 23
7 3
535
Tran
sfer
s an
d su
bsid
ies
-
- -
- -
- -
- 24
N
on-p
rofit
inst
itutio
ns
- -
- -
- -
- -
- H
ouse
hold
s -
- -
- -
- -
- 24
Pa
ymen
ts fo
r cap
ital a
sset
s 31
9 -
(117
) 20
2 20
2 -
100.
0%
37
372
Mac
hine
ry a
nd e
quip
men
t 31
9 -
(117
) 20
2 20
2 -
100.
0%
37
372
Tota
l 5
356
- -
5 35
6 5
356
- 10
0.0%
5
547
5 53
6

187
DEP
AR
TMEN
T O
F ED
UC
ATI
ON
VO
TE 4
APP
RO
PRIA
TIO
N S
TATE
MEN
T fo
r the
yea
r end
ed 3
1 M
arch
201
9
- 1
87 -
7.6
SO
CIA
L SE
CTO
R E
XPA
ND
ED P
UB
LIC
WO
RK
S PR
OG
RA
MM
E IN
CEN
TIVE
GR
AN
T FO
R P
RO
VIN
CES
20
18/1
9 20
17/1
8
Adju
sted
Ap
prop
riati on
Shift
ing
of
Fund
s Vi
rem
ent
Fina
l Ap
prop
riatio
n Ac
tual
Ex
pend
iture
Va
rianc
e Ex
pend
iture
as
% o
f fin
al
appr
opria
tion
Fina
l Ap
prop
riatio
n Ac
tual
ex
pend
iture
Econ
omic
cla
ssifi
catio
n R
'000
R
'000
R
'000
R
'000
R
'000
R
'000
%
R
'000
R
'000
C
urre
nt p
aym
ents
1
561
1 09
6 14
0 2
797
2 70
8 89
96
.8%
-
754
Com
pens
atio
n of
em
ploy
ees
- -
- -
- -
- -
- G
oods
and
ser
vice
s 1
561
1 09
6 14
0 2
797
2 70
8 89
96
.8%
-
754
Tran
sfer
s an
d su
bsid
ies
4
605
(1 0
96)
- 3
509
3 50
9 -
100.
0%
2 01
7 1
233
Non
-pro
fit in
stitu
tions
4
605
(1 0
96)
3
509
3 50
9 -
100.
0%
2 01
7 1
233
Hou
seho
lds
- -
- -
- -
- -
-
Pa
ymen
ts fo
r cap
ital a
sset
s 16
9 -
(140
) 29
29
-
100.
0%
- -
Mac
hine
ry a
nd e
quip
men
t 16
9 -
(140
) 29
29
-
100.
0%
- -
Tota
l 6
335
- -
6 33
5 6
246
89
98.6
%
2 01
7 1
987
7.
7 E
XPA
ND
ED P
UB
LIC
WO
RK
S PR
OG
RA
MM
E IN
CEN
TIVE
GR
AN
T FO
R P
RO
VIN
CES
20
18/1
9 20
17/1
8
Adju
sted
Ap
prop
riati on
Shift
ing
of
Fund
s Vi
rem
ent
Fina
l Ap
prop
riatio
n Ac
tual
Ex
pend
iture
Va
rianc
e Ex
pend
iture
as
% o
f fin
al
appr
opria
tion
Fina
l Ap
prop
riatio
n Ac
tual
ex
pend
iture
Econ
omic
cla
ssifi
catio
n R
'000
R
'000
R
'000
R
'000
R
'000
R
'000
%
R
'000
R
'000
C
urre
nt p
aym
ents
2
222
- -
2 22
2 2
158
64
97.1
%
2 08
3 2
031
Com
pens
atio
n of
em
ploy
ees
- 41
-
41
41
- 10
0.0%
-
- G
oods
and
ser
vice
s 2
222
(41)
-
2 18
1 2
117
64
97.1
%
2 08
3 2
031
Tran
sfer
s an
d su
bsid
ies
-
- -
- -
- -
- -
Non
-pro
fit in
stitu
tions
-
- -
- -
- -
- -

188
DEP
AR
TMEN
T O
F ED
UC
ATI
ON
VO
TE 4
APP
RO
PRIA
TIO
N S
TATE
MEN
T fo
r the
yea
r end
ed 3
1 M
arch
201
9
- 1
88 -
7.7
EXP
AN
DED
PU
BLI
C W
OR
KS
PRO
GR
AM
ME
INC
ENTI
VE G
RA
NT
FOR
PR
OVI
NC
ES
2018
/19
2017
/18
Ad
just
ed
Appr
opria
ti on
Shift
ing
of
Fund
s Vi
rem
ent
Fina
l Ap
prop
riatio
n Ac
tual
Ex
pend
iture
Va
rianc
e Ex
pend
iture
as
% o
f fin
al
appr
opria
tion
Fina
l Ap
prop
riatio
n Ac
tual
ex
pend
iture
Econ
omic
cla
ssifi
catio
n R
'000
R
'000
R
'000
R
'000
R
'000
R
'000
%
R
'000
R
'000
H
ouse
hold
s -
- -
- -
- -
- -
Paym
ents
for c
apita
l ass
ets
- -
- -
- -
- -
- M
achi
nery
and
equ
ipm
ent
- -
- -
- -
- -
- To
tal
2 22
2 -
- 2
222
2 15
8 64
97
.1%
2
083
2 03
1
DEPARTMENT OF EDUCATION VOTE 4
NOTES TO THE APPROPRIATION STATEMENT for the year ended 31 March 2019
- 189 -
1. Detail of transfers and subsidies as per Appropriation Act (after Virement): Detail of these transactions can be viewed in the note on Transfers and subsidies, disclosure notes and Annexure 1 (A-C) to the Annual Financial Statements.
2. Detail of specifically and exclusively appropriated amounts voted (after Virement): Detail of these transactions can be viewed in note 1 (Annual Appropriation) to the Annual Financial Statements.
3. Detail on payments for financial assets Detail of these transactions per programme can be viewed in the note on Payments for financial assets to the Annual Financial Statements.
4. Explanations of material variances from Amounts Voted (after Virement): 4.1 Per programme Final
Appropriation Actual
Expenditure Variance Variance as a
% of Final Appropriation
R’000 R’000 R’000 ADMINISTRATION Current payments 633 344 633 344 - 0% Transfers and Subsidies 1 415 4 717 (3 302) -233% Payments for Capital assets 557 557 - 0%
Transfers and Subsidies overspent due to the payment of leave gratuities.
PUBLIC ORDINARY SCHOOLS EDUCATION Current payments 4 355 481 4 366 387 (10 906) 0% Transfers and Subsidies 430 448 430 448 - 0% Payments for Capital assets 728 728 - 0%
Current Payments overspent due to Compensation of Employees (COE) as a result of the filling of additional educator posts due to an increase in learner numbers.
PUBLIC SPECIAL SCHOOLS EDUCATION Current payments 143 125 144 031 (906) -1% Transfers and Subsidies 16 272 16 272 - 0% Payments for Capital assets 344 283 61 18%
Current Payments overspend mainly due to Compensation of Employees (COE). The under expenditure on payments for capital assets can be ascribed to the Learner with Severe Profound Intellectual Disabilities (LSPID) Grant, which can be attributed to finance lease payments not processed at year end.
INFRASTRUCTURE DEVELOPMENT Current payments 195 043 194 513 530 0% Transfers and Subsidies 101 101 - 0% Payments for Capital assets 373 284 373 284 - 0%

189
DEPARTMENT OF EDUCATION VOTE 4
NOTES TO THE APPROPRIATION STATEMENT for the year ended 31 March 2019
- 189 -
1. Detail of transfers and subsidies as per Appropriation Act (after Virement): Detail of these transactions can be viewed in the note on Transfers and subsidies, disclosure notes and Annexure 1 (A-C) to the Annual Financial Statements.
2. Detail of specifically and exclusively appropriated amounts voted (after Virement): Detail of these transactions can be viewed in note 1 (Annual Appropriation) to the Annual Financial Statements.
3. Detail on payments for financial assets Detail of these transactions per programme can be viewed in the note on Payments for financial assets to the Annual Financial Statements.
4. Explanations of material variances from Amounts Voted (after Virement): 4.1 Per programme Final
Appropriation Actual
Expenditure Variance Variance as a
% of Final Appropriation
R’000 R’000 R’000 ADMINISTRATION Current payments 633 344 633 344 - 0% Transfers and Subsidies 1 415 4 717 (3 302) -233% Payments for Capital assets 557 557 - 0%
Transfers and Subsidies overspent due to the payment of leave gratuities.
PUBLIC ORDINARY SCHOOLS EDUCATION Current payments 4 355 481 4 366 387 (10 906) 0% Transfers and Subsidies 430 448 430 448 - 0% Payments for Capital assets 728 728 - 0%
Current Payments overspent due to Compensation of Employees (COE) as a result of the filling of additional educator posts due to an increase in learner numbers.
PUBLIC SPECIAL SCHOOLS EDUCATION Current payments 143 125 144 031 (906) -1% Transfers and Subsidies 16 272 16 272 - 0% Payments for Capital assets 344 283 61 18%
Current Payments overspend mainly due to Compensation of Employees (COE). The under expenditure on payments for capital assets can be ascribed to the Learner with Severe Profound Intellectual Disabilities (LSPID) Grant, which can be attributed to finance lease payments not processed at year end.
INFRASTRUCTURE DEVELOPMENT Current payments 195 043 194 513 530 0% Transfers and Subsidies 101 101 - 0% Payments for Capital assets 373 284 373 284 - 0%

190
DEPARTMENT OF EDUCATION VOTE 4
NOTES TO THE APPROPRIATION STATEMENT for the year ended 31 March 2019
- 190 -
Current Payments underspend due to Goods and Services on the Infrastructure Grant. This is as a result of late receipt of payment documents from Professional Service Providers (PSP's) at year end. EXAMINATION AND EDUCATION RELATED SERVICES Current payments 121 715 121 841 (126) 0% Transfers and Subsidies 32 121 35 602 (3 481) -11% Payments for Capital assets 390 390 - 0% Current Payments overspend due to goods and services, mainly due to the clean audit projects. The over expenditure on Transfers and Subsidies can be ascribed to Quintile 4 and 5 School Nutrition Special Project and leave gratuity.
4.2 Per economic classification Final
Appropriation Actual
Expenditure Variance Variance as a
% of Final Appropriation
R’000 R’000 R’000 R’000 Current payments Compensation of employees 4 936 520 4 947 963 (11 443) 0% Goods and services 594 676 594 641 35 0% Interest and rent on land 215 215 - 0% Transfers and subsidies Provinces and municipalities - - - Departmental agencies and accounts 6 691 6 691 - 0%
Higher education institutions - - - Public corporations and private enterprises - - -
Foreign governments and international organisations - - -
Non-profit institutions 442 594 444 878 (2 284) -1% Households 56 429 60 928 (4 499) -8%
Payments for capital assets Buildings and other fixed structures 328 476 328 476 - 0.0% Machinery and equipment 71 951 71 890 61 0.1% Heritage assets - - - Specialised military assets - - - Biological assets - - - Land and subsoil assets - - - Intangible assets - - - Payments for financial assets - - - -
Over expenditure on Compensation of Employees (COE) is as a result of an increase in leaner numbers. The over expenditure on Non-profit institutions is due to school transfers as a result in increase in leaner numbers. The overspending on households relates to payments of leave gratuity. The under expenditure on machinery relates to the Learner with Severe Profound Intellectual Disabilities (LSPID) Grant which relates to finance lease payments on fleet.
DEPARTMENT OF EDUCATION VOTE 4
NOTES TO THE APPROPRIATION STATEMENT for the year ended 31 March 2019
- 191 -
4.3 Per conditional grant Final
Appropriation Actual
Expenditure Variance Variance as a
% of Final Appropriation
R’000 R’000 R’000 R’000 Education Infrastructure Grant 568 766 568 236 530 0% HIV&AIDS (Life Skills Edu) Grant 5 356 5 356 - 0% National School Nutrition Programme Grant 170 211 170 211 - 0%
Expanded Public Works Programme Incentive Grant for Provinces 2 222 2 158 64 3%
Social Sector Expanded Public Works Programme Incentive Grant for Provinces 6 335 6 246 89 1%
Learners with Severe to Profound Intellectual Disabilities Grant 6 837 6 832 5 0%
Maths, Science & Technology Grant 24 564 24 564 - 0%
Most Grants spent almost 100% of their allocations with the exception of EPWP and Social Sector EPWP, reasons for the under expenditure can be ascribed to late receipt of payment documents.

191
DEPARTMENT OF EDUCATION VOTE 4
NOTES TO THE APPROPRIATION STATEMENT for the year ended 31 March 2019
- 191 -
4.3 Per conditional grant Final
Appropriation Actual
Expenditure Variance Variance as a
% of Final Appropriation
R’000 R’000 R’000 R’000 Education Infrastructure Grant 568 766 568 236 530 0% HIV&AIDS (Life Skills Edu) Grant 5 356 5 356 - 0% National School Nutrition Programme Grant 170 211 170 211 - 0%
Expanded Public Works Programme Incentive Grant for Provinces 2 222 2 158 64 3%
Social Sector Expanded Public Works Programme Incentive Grant for Provinces 6 335 6 246 89 1%
Learners with Severe to Profound Intellectual Disabilities Grant 6 837 6 832 5 0%
Maths, Science & Technology Grant 24 564 24 564 - 0%
Most Grants spent almost 100% of their allocations with the exception of EPWP and Social Sector EPWP, reasons for the under expenditure can be ascribed to late receipt of payment documents.

192
DEPARTMENT OF EDUCATION VOTE 4
STATEMENT OF FINANCIAL PERFORMANCE for the year ended 31 March 2019
- 192 -
Note 2018/19 2017/18 R'000 R'000 REVENUE Annual appropriation 1 6 437 552 5 896 119 Departmental revenue 2 - - TOTAL REVENUE 6 437 552 5 896 119 EXPENDITURE Current expenditure Compensation of employees 3 4 947 963 4 608 762 Goods and services 4 594 641 459 952 Interest and rent on land 5 215 119 Total current expenditure 5 542 819 5 068 833 Transfers and subsidies Transfers and subsidies 6 512 497 475 715 Total transfers and subsidies 512 497 475 715 Expenditure for capital assets Tangible assets 7 400 366 452 346 Intangible assets 7 - 9 411 Total expenditure for capital assets 400 366 461 757 Payments for financial assets - - TOTAL EXPENDITURE 6 455 682 6 006 305 SURPLUS/(DEFICIT) FOR THE YEAR (18 130) (110 186) Reconciliation of Net Surplus/(Deficit) for the year Voted funds (18 130) (110 186)
Annual appropriation (18 818) (113 696) Conditional grants 688 3 510
Departmental revenue and NRF Receipts 13 - - SURPLUS/(DEFICIT) FOR THE YEAR (18 130) (110 186)
DEPARTMENT OF EDUCATION VOTE
STATEMENT OF FINANCIAL POSITION
as at 31 March 2019
- 193 -
Note 2018/19 2017/18 R'000 R'000 ASSETS Current assets 300 124 270 058
Unauthorised expenditure 8 265 200 246 382 Cash and cash equivalents 9 5 5 Prepayments and advances 10 2 341 846 Receivables 11 32 578 22 825
Non-current assets 100 425
Receivables 11 100 425 TOTAL ASSETS 300 224 270 483 LIABILITIES Current liabilities 299 650 270 008
Voted funds to be surrendered to the Revenue Fund
12 20 945 32 496
Departmental revenue and NRF Receipts to be surrendered to the Revenue Fund
13 1 411 2 693
Bank overdraft 14 271 912 232 598 Payables 15 5 382 2 221
TOTAL LIABILITIES 299 650 270 008 NET ASSETS 574 475 Note 2018/19 2017/18 R'000 R'000 Represented by:
Recoverable revenue 574 475 TOTAL 574 475

193
DEPARTMENT OF EDUCATION VOTE 4
STATEMENT OF FINANCIAL PERFORMANCE for the year ended 31 March 2019
- 192 -
Note 2018/19 2017/18 R'000 R'000 REVENUE Annual appropriation 1 6 437 552 5 896 119 Departmental revenue 2 - - TOTAL REVENUE 6 437 552 5 896 119 EXPENDITURE Current expenditure Compensation of employees 3 4 947 963 4 608 762 Goods and services 4 594 641 459 952 Interest and rent on land 5 215 119 Total current expenditure 5 542 819 5 068 833 Transfers and subsidies Transfers and subsidies 6 512 497 475 715 Total transfers and subsidies 512 497 475 715 Expenditure for capital assets Tangible assets 7 400 366 452 346 Intangible assets 7 - 9 411 Total expenditure for capital assets 400 366 461 757 Payments for financial assets - - TOTAL EXPENDITURE 6 455 682 6 006 305 SURPLUS/(DEFICIT) FOR THE YEAR (18 130) (110 186) Reconciliation of Net Surplus/(Deficit) for the year Voted funds (18 130) (110 186)
Annual appropriation (18 818) (113 696) Conditional grants 688 3 510
Departmental revenue and NRF Receipts 13 - - SURPLUS/(DEFICIT) FOR THE YEAR (18 130) (110 186)
DEPARTMENT OF EDUCATION VOTE
STATEMENT OF FINANCIAL POSITION
as at 31 March 2019
- 193 -
Note 2018/19 2017/18 R'000 R'000 ASSETS Current assets 300 124 270 058
Unauthorised expenditure 8 265 200 246 382 Cash and cash equivalents 9 5 5 Prepayments and advances 10 2 341 846 Receivables 11 32 578 22 825
Non-current assets 100 425
Receivables 11 100 425 TOTAL ASSETS 300 224 270 483 LIABILITIES Current liabilities 299 650 270 008
Voted funds to be surrendered to the Revenue Fund
12 20 945 32 496
Departmental revenue and NRF Receipts to be surrendered to the Revenue Fund
13 1 411 2 693
Bank overdraft 14 271 912 232 598 Payables 15 5 382 2 221
TOTAL LIABILITIES 299 650 270 008 NET ASSETS 574 475 Note 2018/19 2017/18 R'000 R'000 Represented by:
Recoverable revenue 574 475 TOTAL 574 475

194
DEPARTMENT OF EDUCATION VOTE
STATEMENT OF CHANGES IN NET ASSETS
for the year ended 31 March 2019
- 194 -
Note 2018/19 2017/18 R'000 R'000 Recoverable revenue Opening balance 475 631 Transfers:
Irrecoverable amounts written off - - Debts revised 99 (156) Debts recovered (included in departmental receipts)
- -
Debts raised - - Closing balance 574 475
TOTAL 574 475
DEPARTMENT OF EDUCATION VOTE
CASH FLOW STATEMENT
for the year ended 31 March 2019
- 195 -
Note 2018/19 2017/18 R'000 R’000 CASH FLOWS FROM OPERATING ACTIVITIES Receipts 6 445 095 5 905 429
Annual appropriated funds received 1.1 6 437 552 5 895 790 Departmental revenue received 2 6 715 8 338 Interest received 2.3 828 1 301
Net (increase)/decrease in working capital (26 580) (122 133) Surrendered to Revenue Fund (21 064) (14 078) Current payments (5 523 786) (4 945 960) Interest paid 5 (215) (119) Transfers and subsidies paid (512 497) (475 715) Net cash flow available from operating activities 16 360 953 347 424 CASH FLOWS FROM INVESTING ACTIVITIES Payments for capital assets 7 (400 366) (461 757) Proceeds from sale of capital assets 2.4 - - Net cash flows from investing activities (400 366) (461 757) CASH FLOWS FROM FINANCING ACTIVITIES Increase/(decrease) in net assets 99 (156) Net cash flows from financing activities 99 (156) Net increase/(decrease) in cash and cash equivalents (39 314) (114 489)
Cash and cash equivalents at beginning of period (232 593) (118 104) Cash and cash equivalents at end of period 17 271 907 (232 593)

195
DEPARTMENT OF EDUCATION VOTE
STATEMENT OF CHANGES IN NET ASSETS
for the year ended 31 March 2019
- 194 -
Note 2018/19 2017/18 R'000 R'000 Recoverable revenue Opening balance 475 631 Transfers:
Irrecoverable amounts written off - - Debts revised 99 (156) Debts recovered (included in departmental receipts)
- -
Debts raised - - Closing balance 574 475
TOTAL 574 475
DEPARTMENT OF EDUCATION VOTE
CASH FLOW STATEMENT
for the year ended 31 March 2019
- 195 -
Note 2018/19 2017/18 R'000 R’000 CASH FLOWS FROM OPERATING ACTIVITIES Receipts 6 445 095 5 905 429
Annual appropriated funds received 1.1 6 437 552 5 895 790 Departmental revenue received 2 6 715 8 338 Interest received 2.3 828 1 301
Net (increase)/decrease in working capital (26 580) (122 133) Surrendered to Revenue Fund (21 064) (14 078) Current payments (5 523 786) (4 945 960) Interest paid 5 (215) (119) Transfers and subsidies paid (512 497) (475 715) Net cash flow available from operating activities 16 360 953 347 424 CASH FLOWS FROM INVESTING ACTIVITIES Payments for capital assets 7 (400 366) (461 757) Proceeds from sale of capital assets 2.4 - - Net cash flows from investing activities (400 366) (461 757) CASH FLOWS FROM FINANCING ACTIVITIES Increase/(decrease) in net assets 99 (156) Net cash flows from financing activities 99 (156) Net increase/(decrease) in cash and cash equivalents (39 314) (114 489)
Cash and cash equivalents at beginning of period (232 593) (118 104) Cash and cash equivalents at end of period 17 271 907 (232 593)

196
DEPARTMENT OF EDUCATION VOTE 4
ACCOUNTING POLICIES
for the year ended 31 March 2019
- 196 -
Summary of significant accounting policies The financial statements have been prepared in accordance with the following policies, which have been applied consistently in all material aspects, unless otherwise indicated. Management has concluded that the financial statements present fairly the department’s primary and secondary information. The historical cost convention has been used, except where otherwise indicated. Management has used assessments and estimates in preparing the annual financial statements. These are based on the best information available at the time of preparation. Where appropriate and meaningful, additional information has been disclosed to enhance the usefulness of the financial statements and to comply with the statutory requirements of the Public Finance Management Act (PFMA), Act 1 of 1999 (as amended by Act 29 of 1999), and the Treasury Regulations issued in terms of the PFMA and the annual Division of Revenue Act.
1 Basis of preparation The financial statements have been prepared in accordance with the Modified Cash Standard.
2 Going concern The financial statements have been prepared on a going concern basis.
3 Presentation currency Amounts have been presented in the currency of the South African Rand (R) which is also the functional currency of the department.
4 Rounding Unless otherwise stated financial figures have been rounded to the nearest one thousand Rand (R’000).
5 Foreign currency translation Cash flows arising from foreign currency transactions are translated into South African Rands using the spot exchange rates prevailing at the date of payment / receipt.
6 Comparative information
6.1 Prior period comparative information Prior period comparative information has been presented in the current year’s financial statements. Where necessary figures included in the prior period financial statements have been reclassified to ensure that the format in which the information is presented is consistent with the format of the current year’s financial statements.
6.2 Current year comparison with budget A comparison between the approved, final budget and actual amounts for each programme and economic classification is included in the appropriation statement.
DEPARTMENT OF EDUCATION VOTE 4
ACCOUNTING POLICIES
for the year ended 31 March 2019
- 197 -
7 Revenue
7.1 Appropriated funds Appropriated funds comprises of departmental allocations as well as direct charges against the revenue fund (i.e. statutory appropriation). Appropriated funds are recognised in the statement of financial performance on the date the appropriation becomes effective. Adjustments made in terms of the adjustments budget process are recognised in the statement of financial performance on the date the adjustments become effective. The net amount of any appropriated funds due to / from the relevant revenue fund at the reporting date is recognised as a payable / receivable in the statement of financial position.
7.2 Departmental revenue Departmental revenue is recognised in the statement of financial performance when received and is subsequently paid into the relevant revenue fund, unless stated otherwise. Any amount owing to the relevant revenue fund at the reporting date is recognised as a payable in the statement of financial position.
7.3 Accrued departmental revenue Accruals in respect of departmental revenue (excluding tax revenue) are recorded in the notes to the financial statements when: it is probable that the economic benefits or service potential associated with the
transaction will flow to the department; and the amount of revenue can be measured reliably. The accrued revenue is measured at the fair value of the consideration receivable. Accrued tax revenue (and related interest and / penalties) is measured at amounts receivable from collecting agents. Write-offs are made according to the department’s debt write-off policy
8 Expenditure
8.1 Compensation of employees
8.1.1 Salaries and wages Salaries and wages are recognised in the statement of financial performance on the date of payment.
8.1.2 Social contributions Social contributions made by the department in respect of current employees are recognised in the statement of financial performance on the date of payment. Social contributions made by the department in respect of ex-employees are classified as transfers to households in the statement of financial performance on the date of payment.
8.2 Other expenditure Other expenditure (such as goods and services, transfers and subsidies and payments for capital assets) is recognised in the statement of financial performance on the date of

197
DEPARTMENT OF EDUCATION VOTE 4
ACCOUNTING POLICIES
for the year ended 31 March 2019
- 196 -
Summary of significant accounting policies The financial statements have been prepared in accordance with the following policies, which have been applied consistently in all material aspects, unless otherwise indicated. Management has concluded that the financial statements present fairly the department’s primary and secondary information. The historical cost convention has been used, except where otherwise indicated. Management has used assessments and estimates in preparing the annual financial statements. These are based on the best information available at the time of preparation. Where appropriate and meaningful, additional information has been disclosed to enhance the usefulness of the financial statements and to comply with the statutory requirements of the Public Finance Management Act (PFMA), Act 1 of 1999 (as amended by Act 29 of 1999), and the Treasury Regulations issued in terms of the PFMA and the annual Division of Revenue Act.
1 Basis of preparation The financial statements have been prepared in accordance with the Modified Cash Standard.
2 Going concern The financial statements have been prepared on a going concern basis.
3 Presentation currency Amounts have been presented in the currency of the South African Rand (R) which is also the functional currency of the department.
4 Rounding Unless otherwise stated financial figures have been rounded to the nearest one thousand Rand (R’000).
5 Foreign currency translation Cash flows arising from foreign currency transactions are translated into South African Rands using the spot exchange rates prevailing at the date of payment / receipt.
6 Comparative information
6.1 Prior period comparative information Prior period comparative information has been presented in the current year’s financial statements. Where necessary figures included in the prior period financial statements have been reclassified to ensure that the format in which the information is presented is consistent with the format of the current year’s financial statements.
6.2 Current year comparison with budget A comparison between the approved, final budget and actual amounts for each programme and economic classification is included in the appropriation statement.
DEPARTMENT OF EDUCATION VOTE 4
ACCOUNTING POLICIES
for the year ended 31 March 2019
- 197 -
7 Revenue
7.1 Appropriated funds Appropriated funds comprises of departmental allocations as well as direct charges against the revenue fund (i.e. statutory appropriation). Appropriated funds are recognised in the statement of financial performance on the date the appropriation becomes effective. Adjustments made in terms of the adjustments budget process are recognised in the statement of financial performance on the date the adjustments become effective. The net amount of any appropriated funds due to / from the relevant revenue fund at the reporting date is recognised as a payable / receivable in the statement of financial position.
7.2 Departmental revenue Departmental revenue is recognised in the statement of financial performance when received and is subsequently paid into the relevant revenue fund, unless stated otherwise. Any amount owing to the relevant revenue fund at the reporting date is recognised as a payable in the statement of financial position.
7.3 Accrued departmental revenue Accruals in respect of departmental revenue (excluding tax revenue) are recorded in the notes to the financial statements when: it is probable that the economic benefits or service potential associated with the
transaction will flow to the department; and the amount of revenue can be measured reliably. The accrued revenue is measured at the fair value of the consideration receivable. Accrued tax revenue (and related interest and / penalties) is measured at amounts receivable from collecting agents. Write-offs are made according to the department’s debt write-off policy
8 Expenditure
8.1 Compensation of employees
8.1.1 Salaries and wages Salaries and wages are recognised in the statement of financial performance on the date of payment.
8.1.2 Social contributions Social contributions made by the department in respect of current employees are recognised in the statement of financial performance on the date of payment. Social contributions made by the department in respect of ex-employees are classified as transfers to households in the statement of financial performance on the date of payment.
8.2 Other expenditure Other expenditure (such as goods and services, transfers and subsidies and payments for capital assets) is recognised in the statement of financial performance on the date of

198
DEPARTMENT OF EDUCATION VOTE 4
ACCOUNTING POLICIES
for the year ended 31 March 2019
- 198 -
payment. The expense is classified as a capital expense if the total consideration paid is more than the capitalisation threshold.
8.3 Accruals and payables not recognised Accruals and payables not recognised are recorded in the notes to the financial statements at cost at the reporting date.
8.4 Leases
8.4.1 Operating leases Operating lease payments made during the reporting period are recognised as current expenditure in the statement of financial performance on the date of payment. The operating lease commitments are recorded in the notes to the financial statements.
8.4.2 Finance leases Finance lease payments made during the reporting period are recognised as capital expenditure in the statement of financial performance on the date of payment. The finance lease commitments are recorded in the notes to the financial statements and are not apportioned between the capital and interest portions. Finance lease assets acquired at the end of the lease term are recorded and measured at the lower of: cost, being the fair value of the asset; or the sum of the minimum lease payments made, including any payments made to acquire
ownership at the end of the lease term, excluding interest.
9 Aid Assistance
9.1 Aid assistance received Aid assistance received in cash is recognised in the statement of financial performance when received. In-kind aid assistance is recorded in the notes to the financial statements on the date of receipt and is measured at fair value. Aid assistance not spent for the intended purpose and any unutilised funds from aid assistance that are required to be refunded to the donor are recognised as a payable in the statement of financial position.
9.2 Aid assistance paid Aid assistance paid is recognised in the statement of financial performance on the date of payment. Aid assistance payments made prior to the receipt of funds are recognised as a receivable in the statement of financial position.
10 Cash and cash equivalents Cash and cash equivalents are stated at cost in the statement of financial position. Bank overdrafts are shown separately on the face of the statement of financial position as a current liability. For the purposes of the cash flow statement, cash and cash equivalents comprise cash on hand, deposits held, other short-term highly liquid investments and bank overdrafts.
DEPARTMENT OF EDUCATION VOTE 4
ACCOUNTING POLICIES
for the year ended 31 March 2019
- 199 -
11 Prepayments and advances Prepayments and advances are recognised in the statement of financial position when the department receives or disburses the cash. Prepayments and advances are initially and subsequently measured at cost.
12 Loans and receivables Loans and receivables are recognised in the statement of financial position at cost plus accrued interest, where interest is charged, less amounts already settled or written-off. Write-offs are made according to the department’s write-off policy.
13 Investments Investments are recognised in the statement of financial position at cost.
14 Financial assets
14.1 Financial assets (not covered elsewhere) A financial asset is recognised initially at its cost plus transaction costs that are directly attributable to the acquisition or issue of the financial asset. At the reporting date, a department shall measure its financial assets at cost, less amounts already settled or written-off, except for recognised loans and receivables, which are measured at cost plus accrued interest, where interest is charged, less amounts already settled or written-off.
14.2 Impairment of financial assets Where there is an indication of impairment of a financial asset, an estimation of the reduction in the recorded carrying value, to reflect the best estimate of the amount of the future economic benefits expected to be received from that asset, is recorded in the notes to the financial statements.
15 Payables Payables recognised in the statement of financial position are recognised at cost.
16 Capital Assets
16.1 Immovable capital assets Immovable assets reflected in the asset register of the department are recorded in the notes to the financial statements at cost or fair value where the cost cannot be determined reliably. Immovable assets acquired in a non-exchange transaction are recorded at fair value at the date of acquisition. Immovable assets are subsequently carried in the asset register at cost and are not currently subject to depreciation or impairment. Subsequent expenditure of a capital nature forms part of the cost of the existing asset when ready for use. Additional information on immovable assets not reflected in the assets register is provided in the notes to financial statements.

199
DEPARTMENT OF EDUCATION VOTE 4
ACCOUNTING POLICIES
for the year ended 31 March 2019
- 198 -
payment. The expense is classified as a capital expense if the total consideration paid is more than the capitalisation threshold.
8.3 Accruals and payables not recognised Accruals and payables not recognised are recorded in the notes to the financial statements at cost at the reporting date.
8.4 Leases
8.4.1 Operating leases Operating lease payments made during the reporting period are recognised as current expenditure in the statement of financial performance on the date of payment. The operating lease commitments are recorded in the notes to the financial statements.
8.4.2 Finance leases Finance lease payments made during the reporting period are recognised as capital expenditure in the statement of financial performance on the date of payment. The finance lease commitments are recorded in the notes to the financial statements and are not apportioned between the capital and interest portions. Finance lease assets acquired at the end of the lease term are recorded and measured at the lower of: cost, being the fair value of the asset; or the sum of the minimum lease payments made, including any payments made to acquire
ownership at the end of the lease term, excluding interest.
9 Aid Assistance
9.1 Aid assistance received Aid assistance received in cash is recognised in the statement of financial performance when received. In-kind aid assistance is recorded in the notes to the financial statements on the date of receipt and is measured at fair value. Aid assistance not spent for the intended purpose and any unutilised funds from aid assistance that are required to be refunded to the donor are recognised as a payable in the statement of financial position.
9.2 Aid assistance paid Aid assistance paid is recognised in the statement of financial performance on the date of payment. Aid assistance payments made prior to the receipt of funds are recognised as a receivable in the statement of financial position.
10 Cash and cash equivalents Cash and cash equivalents are stated at cost in the statement of financial position. Bank overdrafts are shown separately on the face of the statement of financial position as a current liability. For the purposes of the cash flow statement, cash and cash equivalents comprise cash on hand, deposits held, other short-term highly liquid investments and bank overdrafts.
DEPARTMENT OF EDUCATION VOTE 4
ACCOUNTING POLICIES
for the year ended 31 March 2019
- 199 -
11 Prepayments and advances Prepayments and advances are recognised in the statement of financial position when the department receives or disburses the cash. Prepayments and advances are initially and subsequently measured at cost.
12 Loans and receivables Loans and receivables are recognised in the statement of financial position at cost plus accrued interest, where interest is charged, less amounts already settled or written-off. Write-offs are made according to the department’s write-off policy.
13 Investments Investments are recognised in the statement of financial position at cost.
14 Financial assets
14.1 Financial assets (not covered elsewhere) A financial asset is recognised initially at its cost plus transaction costs that are directly attributable to the acquisition or issue of the financial asset. At the reporting date, a department shall measure its financial assets at cost, less amounts already settled or written-off, except for recognised loans and receivables, which are measured at cost plus accrued interest, where interest is charged, less amounts already settled or written-off.
14.2 Impairment of financial assets Where there is an indication of impairment of a financial asset, an estimation of the reduction in the recorded carrying value, to reflect the best estimate of the amount of the future economic benefits expected to be received from that asset, is recorded in the notes to the financial statements.
15 Payables Payables recognised in the statement of financial position are recognised at cost.
16 Capital Assets
16.1 Immovable capital assets Immovable assets reflected in the asset register of the department are recorded in the notes to the financial statements at cost or fair value where the cost cannot be determined reliably. Immovable assets acquired in a non-exchange transaction are recorded at fair value at the date of acquisition. Immovable assets are subsequently carried in the asset register at cost and are not currently subject to depreciation or impairment. Subsequent expenditure of a capital nature forms part of the cost of the existing asset when ready for use. Additional information on immovable assets not reflected in the assets register is provided in the notes to financial statements.

200
DEPARTMENT OF EDUCATION VOTE 4
ACCOUNTING POLICIES
for the year ended 31 March 2019
- 200 -
16.2 Movable capital assets Movable capital assets are initially recorded in the notes to the financial statements at cost. Movable capital assets acquired through a non-exchange transaction is measured at fair value as at the date of acquisition. Where the cost of movable capital assets cannot be determined reliably, the movable capital assets are measured at fair value and where fair value cannot be determined; the movable assets are measured at R1. All assets acquired prior to 1 April 2002 (or a later date as approved by the OAG) may be recorded at R1. Movable capital assets are subsequently carried at cost and are not subject to depreciation or impairment. Biological assets are subsequently carried at fair value. Subsequent expenditure that is of a capital nature forms part of the cost of the existing asset when ready for use.
16.3 Intangible assets Intangible assets are initially recorded in the notes to the financial statements at cost. Intangible assets acquired through a non-exchange transaction are measured at fair value as at the date of acquisition. Internally generated intangible assets are recorded in the notes to the financial statements when the department commences the development phase of the project. Where the cost of intangible assets cannot be determined reliably, the intangible capital assets are measured at fair value and where fair value cannot be determined; the intangible assets are measured at R1. All assets acquired prior to 1 April 2002 (or a later date as approved by the OAG) may be recorded at R1. Intangible assets are subsequently carried at cost and are not subject to depreciation or impairment. Subsequent expenditure of a capital nature forms part of the cost of the existing asset when ready for use.
16.4 Project Costs: Work-in-progress Expenditure of a capital nature is initially recognised in the statement of financial performance at cost when paid. Amounts paid towards capital projects are separated from the amounts recognised and accumulated in work-in-progress until the underlying asset is ready for use. Once ready for use, the total accumulated payments are recorded in an asset register. Subsequent payments to complete the project are added to the capital asset in the asset register. Where the department is not the custodian of the completed project asset, the asset is transferred to the custodian subsequent to completion.
DEPARTMENT OF EDUCATION VOTE 4
ACCOUNTING POLICIES
for the year ended 31 March 2019
- 201 -
17 Provisions and Contingents
17.1 Provisions Provisions are recorded in the notes to the financial statements when there is a present legal or constructive obligation to forfeit economic benefits as a result of events in the past and it is probable that an outflow of resources embodying economic benefits or service potential will be required to settle the obligation and a reliable estimate of the obligation can be made. The provision is measured as the best estimate of the funds required to settle the present obligation at the reporting date.
17.2 Contingent liabilities Contingent liabilities are recorded in the notes to the financial statements when there is a possible obligation that arises from past events, and whose existence will be confirmed only by the occurrence or non-occurrence of one or more uncertain future events not within the control of the department or when there is a present obligation that is not recognised because it is not probable that an outflow of resources will be required to settle the obligation or the amount of the obligation cannot be measured reliably.
17.3 Contingent assets Contingent assets are recorded in the notes to the financial statements when a possible asset arises from past events, and whose existence will be confirmed by the occurrence or non-occurrence of one or more uncertain future events not within the control of the department.
17.4 Commitments Commitments (other than for transfers and subsidies) are recorded at cost in the notes to the financial statements when there is a contractual arrangement or an approval by management in a manner that raises a valid expectation that the department will discharge its responsibilities thereby incurring future expenditure that will result in the outflow of cash.
18 Unauthorised expenditure Unauthorised expenditure is recognised in the statement of financial position until such time as the expenditure is either: approved by Parliament or the Provincial Legislature with funding and the related funds
are received; or approved by Parliament or the Provincial Legislature without funding and is written off
against the appropriation in the statement of financial performance; or transferred to receivables for recovery. Unauthorised expenditure is measured at the amount of the confirmed unauthorised expenditure.
19 Fruitless and wasteful expenditure Fruitless and wasteful expenditure is recorded in the notes to the financial statements when confirmed. The amount recorded is equal to the total value of the fruitless and or wasteful expenditure incurred.

201
DEPARTMENT OF EDUCATION VOTE 4
ACCOUNTING POLICIES
for the year ended 31 March 2019
- 200 -
16.2 Movable capital assets Movable capital assets are initially recorded in the notes to the financial statements at cost. Movable capital assets acquired through a non-exchange transaction is measured at fair value as at the date of acquisition. Where the cost of movable capital assets cannot be determined reliably, the movable capital assets are measured at fair value and where fair value cannot be determined; the movable assets are measured at R1. All assets acquired prior to 1 April 2002 (or a later date as approved by the OAG) may be recorded at R1. Movable capital assets are subsequently carried at cost and are not subject to depreciation or impairment. Biological assets are subsequently carried at fair value. Subsequent expenditure that is of a capital nature forms part of the cost of the existing asset when ready for use.
16.3 Intangible assets Intangible assets are initially recorded in the notes to the financial statements at cost. Intangible assets acquired through a non-exchange transaction are measured at fair value as at the date of acquisition. Internally generated intangible assets are recorded in the notes to the financial statements when the department commences the development phase of the project. Where the cost of intangible assets cannot be determined reliably, the intangible capital assets are measured at fair value and where fair value cannot be determined; the intangible assets are measured at R1. All assets acquired prior to 1 April 2002 (or a later date as approved by the OAG) may be recorded at R1. Intangible assets are subsequently carried at cost and are not subject to depreciation or impairment. Subsequent expenditure of a capital nature forms part of the cost of the existing asset when ready for use.
16.4 Project Costs: Work-in-progress Expenditure of a capital nature is initially recognised in the statement of financial performance at cost when paid. Amounts paid towards capital projects are separated from the amounts recognised and accumulated in work-in-progress until the underlying asset is ready for use. Once ready for use, the total accumulated payments are recorded in an asset register. Subsequent payments to complete the project are added to the capital asset in the asset register. Where the department is not the custodian of the completed project asset, the asset is transferred to the custodian subsequent to completion.
DEPARTMENT OF EDUCATION VOTE 4
ACCOUNTING POLICIES
for the year ended 31 March 2019
- 201 -
17 Provisions and Contingents
17.1 Provisions Provisions are recorded in the notes to the financial statements when there is a present legal or constructive obligation to forfeit economic benefits as a result of events in the past and it is probable that an outflow of resources embodying economic benefits or service potential will be required to settle the obligation and a reliable estimate of the obligation can be made. The provision is measured as the best estimate of the funds required to settle the present obligation at the reporting date.
17.2 Contingent liabilities Contingent liabilities are recorded in the notes to the financial statements when there is a possible obligation that arises from past events, and whose existence will be confirmed only by the occurrence or non-occurrence of one or more uncertain future events not within the control of the department or when there is a present obligation that is not recognised because it is not probable that an outflow of resources will be required to settle the obligation or the amount of the obligation cannot be measured reliably.
17.3 Contingent assets Contingent assets are recorded in the notes to the financial statements when a possible asset arises from past events, and whose existence will be confirmed by the occurrence or non-occurrence of one or more uncertain future events not within the control of the department.
17.4 Commitments Commitments (other than for transfers and subsidies) are recorded at cost in the notes to the financial statements when there is a contractual arrangement or an approval by management in a manner that raises a valid expectation that the department will discharge its responsibilities thereby incurring future expenditure that will result in the outflow of cash.
18 Unauthorised expenditure Unauthorised expenditure is recognised in the statement of financial position until such time as the expenditure is either: approved by Parliament or the Provincial Legislature with funding and the related funds
are received; or approved by Parliament or the Provincial Legislature without funding and is written off
against the appropriation in the statement of financial performance; or transferred to receivables for recovery. Unauthorised expenditure is measured at the amount of the confirmed unauthorised expenditure.
19 Fruitless and wasteful expenditure Fruitless and wasteful expenditure is recorded in the notes to the financial statements when confirmed. The amount recorded is equal to the total value of the fruitless and or wasteful expenditure incurred.

202
DEPARTMENT OF EDUCATION VOTE 4
ACCOUNTING POLICIES
for the year ended 31 March 2019
- 202 -
Fruitless and wasteful expenditure is removed from the notes to the financial statements when it is resolved or transferred to receivables for recovery. Fruitless and wasteful expenditure receivables are measured at the amount that is expected to be recoverable and are de-recognised when settled or subsequently written-off as irrecoverable.
20 Irregular expenditure Irregular expenditure is recorded in the notes to the financial statements when confirmed. The amount recorded is equal to the value of the irregular expenditure incurred unless it is impracticable to determine, in which case reasons therefor are provided in the note. Irregular expenditure is removed from the note when it is either condoned by the relevant authority, transferred to receivables for recovery or not condoned and is not recoverable. Irregular expenditure receivables are measured at the amount that is expected to be recoverable and are de-recognised when settled or subsequently written-off as irrecoverable.
21 Changes in accounting policies, accounting estimates and errors Changes in accounting policies that are effected by management have been applied retrospectively in accordance with MCS requirements, except to the extent that it is impracticable to determine the period-specific effects or the cumulative effect of the change in policy. In such instances the department shall restate the opening balances of assets, liabilities and net assets for the earliest period for which retrospective restatement is practicable. Changes in accounting estimates are applied prospectively in accordance with MCS requirements. Correction of errors is applied retrospectively in the period in which the error has occurred in accordance with MCS requirements, except to the extent that it is impracticable to determine the period-specific effects or the cumulative effect of the error. In such cases the department shall restate the opening balances of assets, liabilities and net assets for the earliest period for which retrospective restatement is practicable.
22 Events after the reporting date Events after the reporting date that are classified as adjusting events have been accounted for in the financial statements. The events after the reporting date that are classified as non-adjusting events after the reporting date have been disclosed in the notes to the financial statements.
23 Principal-Agent arrangements The department is party to a principal-agent arrangement for construction of non-residential buildings and structures (schools) with the Independent Development Trust Entity. In terms of the arrangement the department is the principal and is responsible for funding and monitoring performance. All related revenues, expenditures, assets and liabilities have been recognised or recorded in terms of the relevant policies listed herein. Additional disclosures have been provided in the notes to the financial statements where appropriate.
DEPARTMENT OF EDUCATION VOTE 4
ACCOUNTING POLICIES
for the year ended 31 March 2019
- 203 -
24 Departures from the MCS requirements Management has concluded that the financial statements present fairly the department’s primary and secondary information; that the department complied with the Standard.
25 Capitalisation reserve The capitalisation reserve comprises of financial assets and/or liabilities originating in a prior reporting period but which are recognised in the statement of financial position for the first time in the current reporting period. Amounts are recognised in the capitalisation reserves when identified in the current period and are transferred to the National/Provincial Revenue Fund when the underlying asset is disposed and the related funds are received.
26 Recoverable revenue Amounts are recognised as recoverable revenue when a payment made in a previous financial year becomes recoverable from a debtor in the current financial year. Amounts are either transferred to the National/Provincial Revenue Fund when recovered or are transferred to the statement of financial performance when written-off.
27 Related party transactions A related party transaction is a transfer of resources, services or obligations between the reporting entity and a related party. Related party transactions within the Minister/MEC’s portfolio are recorded in the notes to the financial statements when the transaction is not at arm’s length. Key management personnel are those persons having the authority and responsibility for planning, directing and controlling the activities of the department. The number of individuals and their full compensation is recorded in the notes to the financial statements.
28 Inventories
At the date of acquisition, inventories are recognised at cost in the statement of financial performance. Where inventories are acquired as part of a non-exchange transaction, the inventories are measured at fair value as at the date of acquisition. Inventories are subsequently measured at the lower of cost and net realisable value or where intended for distribution (or consumed in the production of goods for distribution) at no or a nominal charge, the lower of cost and current replacement value. The cost of inventories is assigned by using the weighted average cost basis.
29 Public-Private Partnerships Public Private Partnerships are accounted for based on the nature and or the substance of the partnership. The transaction is accounted for in accordance with the relevant accounting policies. A summary of the significant terms of the PPP agreement, the parties to the agreement, and the date of commencement thereof together with the description and nature of the concession fees received, the unitary fees paid, rights and obligations of the department are recorded in the notes to the financial statements.

203
DEPARTMENT OF EDUCATION VOTE 4
ACCOUNTING POLICIES
for the year ended 31 March 2019
- 202 -
Fruitless and wasteful expenditure is removed from the notes to the financial statements when it is resolved or transferred to receivables for recovery. Fruitless and wasteful expenditure receivables are measured at the amount that is expected to be recoverable and are de-recognised when settled or subsequently written-off as irrecoverable.
20 Irregular expenditure Irregular expenditure is recorded in the notes to the financial statements when confirmed. The amount recorded is equal to the value of the irregular expenditure incurred unless it is impracticable to determine, in which case reasons therefor are provided in the note. Irregular expenditure is removed from the note when it is either condoned by the relevant authority, transferred to receivables for recovery or not condoned and is not recoverable. Irregular expenditure receivables are measured at the amount that is expected to be recoverable and are de-recognised when settled or subsequently written-off as irrecoverable.
21 Changes in accounting policies, accounting estimates and errors Changes in accounting policies that are effected by management have been applied retrospectively in accordance with MCS requirements, except to the extent that it is impracticable to determine the period-specific effects or the cumulative effect of the change in policy. In such instances the department shall restate the opening balances of assets, liabilities and net assets for the earliest period for which retrospective restatement is practicable. Changes in accounting estimates are applied prospectively in accordance with MCS requirements. Correction of errors is applied retrospectively in the period in which the error has occurred in accordance with MCS requirements, except to the extent that it is impracticable to determine the period-specific effects or the cumulative effect of the error. In such cases the department shall restate the opening balances of assets, liabilities and net assets for the earliest period for which retrospective restatement is practicable.
22 Events after the reporting date Events after the reporting date that are classified as adjusting events have been accounted for in the financial statements. The events after the reporting date that are classified as non-adjusting events after the reporting date have been disclosed in the notes to the financial statements.
23 Principal-Agent arrangements The department is party to a principal-agent arrangement for construction of non-residential buildings and structures (schools) with the Independent Development Trust Entity. In terms of the arrangement the department is the principal and is responsible for funding and monitoring performance. All related revenues, expenditures, assets and liabilities have been recognised or recorded in terms of the relevant policies listed herein. Additional disclosures have been provided in the notes to the financial statements where appropriate.
DEPARTMENT OF EDUCATION VOTE 4
ACCOUNTING POLICIES
for the year ended 31 March 2019
- 203 -
24 Departures from the MCS requirements Management has concluded that the financial statements present fairly the department’s primary and secondary information; that the department complied with the Standard.
25 Capitalisation reserve The capitalisation reserve comprises of financial assets and/or liabilities originating in a prior reporting period but which are recognised in the statement of financial position for the first time in the current reporting period. Amounts are recognised in the capitalisation reserves when identified in the current period and are transferred to the National/Provincial Revenue Fund when the underlying asset is disposed and the related funds are received.
26 Recoverable revenue Amounts are recognised as recoverable revenue when a payment made in a previous financial year becomes recoverable from a debtor in the current financial year. Amounts are either transferred to the National/Provincial Revenue Fund when recovered or are transferred to the statement of financial performance when written-off.
27 Related party transactions A related party transaction is a transfer of resources, services or obligations between the reporting entity and a related party. Related party transactions within the Minister/MEC’s portfolio are recorded in the notes to the financial statements when the transaction is not at arm’s length. Key management personnel are those persons having the authority and responsibility for planning, directing and controlling the activities of the department. The number of individuals and their full compensation is recorded in the notes to the financial statements.
28 Inventories
At the date of acquisition, inventories are recognised at cost in the statement of financial performance. Where inventories are acquired as part of a non-exchange transaction, the inventories are measured at fair value as at the date of acquisition. Inventories are subsequently measured at the lower of cost and net realisable value or where intended for distribution (or consumed in the production of goods for distribution) at no or a nominal charge, the lower of cost and current replacement value. The cost of inventories is assigned by using the weighted average cost basis.
29 Public-Private Partnerships Public Private Partnerships are accounted for based on the nature and or the substance of the partnership. The transaction is accounted for in accordance with the relevant accounting policies. A summary of the significant terms of the PPP agreement, the parties to the agreement, and the date of commencement thereof together with the description and nature of the concession fees received, the unitary fees paid, rights and obligations of the department are recorded in the notes to the financial statements.

204
DEPARTMENT OF EDUCATION VOTE 4
ACCOUNTING POLICIES
for the year ended 31 March 2019
- 204 -
30 Employee benefits The value of each major class of employee benefit obligation (accruals, payables not recognised and provisions) is disclosed in the Employee benefits note.
DEPARTMENT OF EDUCATION VOTE 4
NOTES TO THE ANNUAL FINANCIAL STATEMENTS
for the year ended 31 March 2019
- 205 -
1. Annual Appropriation 1.1 Annual Appropriation
Included are funds appropriated in terms of the Appropriation Act (and the Adjustments Appropriation Act) for National Departments (Voted funds) and Provincial Departments:
1.2 Conditional grants*
Note 2018/19 2017/18 R’000 R’000 Total grants received 32 784 291 808 049
* It should be noted that the Conditional Grants are included in the amounts as per Final Appropriation in Note 1.1
2018/19 2017/18 Final
Appropriation
Actual Funds
Received
Funds not requested/
not received
Final Appropriati
on
Appropriation
received
R’000 R’000 R’000 R’000 R’000 Administration 660 440 660 440 - 627 956 627 956 Public Ordinary School Education 4 786 657 4 786 657 - 4 266 601 4 266 272
Independent School Subsidy 9 599 9 599 - 9 164 9 164
Public Special School Education 159 741 159 741 - 140 931 140 931
Early Childhood Development 98 461 98 461 - 94 273 94 273
Infrastructure Development 568 428 568 428 - 612 267 612 267
Examination and Education Related Services
154 226 154 226 -
144 927 144 927
Total 6 437 552 6 437 552 - 5 896 119 5 895 790

205
DEPARTMENT OF EDUCATION VOTE 4
ACCOUNTING POLICIES
for the year ended 31 March 2019
- 204 -
30 Employee benefits The value of each major class of employee benefit obligation (accruals, payables not recognised and provisions) is disclosed in the Employee benefits note.
DEPARTMENT OF EDUCATION VOTE 4
NOTES TO THE ANNUAL FINANCIAL STATEMENTS
for the year ended 31 March 2019
- 205 -
1. Annual Appropriation 1.1 Annual Appropriation
Included are funds appropriated in terms of the Appropriation Act (and the Adjustments Appropriation Act) for National Departments (Voted funds) and Provincial Departments:
1.2 Conditional grants*
Note 2018/19 2017/18 R’000 R’000 Total grants received 32 784 291 808 049
* It should be noted that the Conditional Grants are included in the amounts as per Final Appropriation in Note 1.1
2018/19 2017/18 Final
Appropriation
Actual Funds
Received
Funds not requested/
not received
Final Appropriati
on
Appropriation
received
R’000 R’000 R’000 R’000 R’000 Administration 660 440 660 440 - 627 956 627 956 Public Ordinary School Education 4 786 657 4 786 657 - 4 266 601 4 266 272
Independent School Subsidy 9 599 9 599 - 9 164 9 164
Public Special School Education 159 741 159 741 - 140 931 140 931
Early Childhood Development 98 461 98 461 - 94 273 94 273
Infrastructure Development 568 428 568 428 - 612 267 612 267
Examination and Education Related Services
154 226 154 226 -
144 927 144 927
Total 6 437 552 6 437 552 - 5 896 119 5 895 790

206
DEPARTMENT OF EDUCATION VOTE 4
NOTES TO THE ANNUAL FINANCIAL STATEMENTS
for the year ended 31 March 2019
- 206 -
2. Departmental revenue Note 2018/19 2017/18 R’000 R’000 Tax revenue Sales of goods and services other than capital assets
2.1 6 013 5 708
Fines, penalties and forfeits 2.2 38 2 Interest, dividends and rent on land 2.3 828 1 301 Transactions in financial assets and liabilities 2.4 664 2 628 Total revenue collected 7 543 9 639 Less: Own revenue included in appropriation 13 7 543 9 639 Departmental revenue collected - -
2.1 Sales of goods and services other than capital assets
Note 2018/19 2017/18 2 R’000 R’000 Sales of goods and services produced by the department
6 013 5 708
Sales by market establishment 464 518 Administrative fees 5 549 5 190
Total 6 013 5 708
2.2 Fines, penalties and forfeits Note 2018/19 2017/18 2 R’000 R’000 Fines 38 2 Penalties - - Total 38 2
2.3 Interest, dividends and rent on land
Note 2018/19 2017/18 2 R’000 R’000 Interest 828 1 301 Total 828 1 301
2.4 Transactions in financial assets and liabilities
Note 2018/19 2017/18 2 R’000 R’000 Other Receipts including Recoverable Revenue 664 2 628 Total 664 2 628
DEPARTMENT OF EDUCATION VOTE 4
NOTES TO THE ANNUAL FINANCIAL STATEMENTS
for the year ended 31 March 2019
- 207 -
3. Compensation of employees 3.1 Salaries and Wages
Note 2018/19 2017/18 R’000 R’000 Basic salary 3 622 724 3 387 548 Performance award 6 136 4 084 Service Based 8 588 8 217 Compensative/circumstantial 152 393 118 771 Other non-pensionable allowances 503 855 477 436 Total 4 293 696 3 996 056
3.2 Social contributions
Note 2018/19 2017/18 R’000 R’000 Employer contributions Pension 446 773 417 987 Medical 205 570 192 913 UIF 639 550 Bargaining council 392 373 Official unions and associations 893 883 Total 654 267 612 706
Total compensation of employees 4 947 963 4 608 762 Average number of employees 12 832 13 025
4. Goods and services Note 2018/19 2017/18 R’000 R’000 Administrative fees 584 866 Advertising 670 827 Minor assets 4.1 337 530 Bursaries (employees) 676 858 Catering 10 196 6 655 Communication 4 566 5 080 Computer services 4.2 7 409 5 109 Consultants: Business and advisory services 43 019 16 008 Legal services 4 738 3 566 Contractors 2 809 11 681 Agency and support / outsourced services 65 142 50 366 Entertainment 1 5 Audit cost – external 4.3 12 331 10 747 Fleet services 3 057 2 512

207
DEPARTMENT OF EDUCATION VOTE 4
NOTES TO THE ANNUAL FINANCIAL STATEMENTS
for the year ended 31 March 2019
- 206 -
2. Departmental revenue Note 2018/19 2017/18 R’000 R’000 Tax revenue Sales of goods and services other than capital assets
2.1 6 013 5 708
Fines, penalties and forfeits 2.2 38 2 Interest, dividends and rent on land 2.3 828 1 301 Transactions in financial assets and liabilities 2.4 664 2 628 Total revenue collected 7 543 9 639 Less: Own revenue included in appropriation 13 7 543 9 639 Departmental revenue collected - -
2.1 Sales of goods and services other than capital assets
Note 2018/19 2017/18 2 R’000 R’000 Sales of goods and services produced by the department
6 013 5 708
Sales by market establishment 464 518 Administrative fees 5 549 5 190
Total 6 013 5 708
2.2 Fines, penalties and forfeits Note 2018/19 2017/18 2 R’000 R’000 Fines 38 2 Penalties - - Total 38 2
2.3 Interest, dividends and rent on land
Note 2018/19 2017/18 2 R’000 R’000 Interest 828 1 301 Total 828 1 301
2.4 Transactions in financial assets and liabilities
Note 2018/19 2017/18 2 R’000 R’000 Other Receipts including Recoverable Revenue 664 2 628 Total 664 2 628
DEPARTMENT OF EDUCATION VOTE 4
NOTES TO THE ANNUAL FINANCIAL STATEMENTS
for the year ended 31 March 2019
- 207 -
3. Compensation of employees 3.1 Salaries and Wages
Note 2018/19 2017/18 R’000 R’000 Basic salary 3 622 724 3 387 548 Performance award 6 136 4 084 Service Based 8 588 8 217 Compensative/circumstantial 152 393 118 771 Other non-pensionable allowances 503 855 477 436 Total 4 293 696 3 996 056
3.2 Social contributions
Note 2018/19 2017/18 R’000 R’000 Employer contributions Pension 446 773 417 987 Medical 205 570 192 913 UIF 639 550 Bargaining council 392 373 Official unions and associations 893 883 Total 654 267 612 706
Total compensation of employees 4 947 963 4 608 762 Average number of employees 12 832 13 025
4. Goods and services Note 2018/19 2017/18 R’000 R’000 Administrative fees 584 866 Advertising 670 827 Minor assets 4.1 337 530 Bursaries (employees) 676 858 Catering 10 196 6 655 Communication 4 566 5 080 Computer services 4.2 7 409 5 109 Consultants: Business and advisory services 43 019 16 008 Legal services 4 738 3 566 Contractors 2 809 11 681 Agency and support / outsourced services 65 142 50 366 Entertainment 1 5 Audit cost – external 4.3 12 331 10 747 Fleet services 3 057 2 512

208
DEPARTMENT OF EDUCATION VOTE 4
NOTES TO THE ANNUAL FINANCIAL STATEMENTS
for the year ended 31 March 2019
- 208 -
Inventory 4.4 64 145 109 037 Consumables 4.5 18 235 17 332 Operating leases 14 549 17 683 Property payments 4.6 149 630 133 869 Rental and hiring 1 795 638 Transport provided as part of the departmental activities
128 116 6 790
Travel and subsistence 4.7 50 012 44 077 Venues and facilities 1 216 1 500 Training and development 4 031 7 592 Other operating expenditure 4.8 7 377 6 624 Total 594 641 459 952
4.1 Minor assets
Note 2018/19 2017/18 4 R’000 R’000 Tangible assets
Machinery and equipment 337 530 Intangible assets
Software - - Total 337 530
4.2 Computer services
Note 2018/19 2017/18 4 R’000 R’000 SITA computer services 6 298 3 572 External computer service providers 1 111 1 537 Total 7 409 5 109
4.3 Audit cost – External
Note 2018/19 2017/18 4 R’000 R’000 Regularity audits 12 331 10 747 Total 12 331 10 747
4.4 Inventory
Note 2018/19 2017/18 4 R’000 R’000
Learning, teaching and support material 16 214 43 694 Other supplies 4.4.1 47 931 65 343 Total 64 145 109 037
DEPARTMENT OF EDUCATION VOTE 4
NOTES TO THE ANNUAL FINANCIAL STATEMENTS
for the year ended 31 March 2019
- 209 -
4.4.1 Other supplies Note 2018/19 2017/18
4.4 R’000 R’000 Assets for distribution 45 193 64 726
Machinery and equipment 1 696 28 455 School furniture 9 759 16 271 Sports and recreation 2 145 - Other assets for distribution 31 593 20 000
Other 2 738 617 Total 47 931 65 343
4.5 Consumables
Note 2018/19 2017/18 4 R’000 R’000
Consumable supplies 2 736 3 961 Uniform and clothing 80 895 Household supplies 962 1 139 Building material and supplies 94 380 IT consumables 206 282 Other consumables 1 394 1 265
Stationery, printing and office supplies 15 499 13 371 Total 18 235 17 332
4.6 Property payments
Note 2018/19 2017/18 4 R’000 R’000 Municipal services 7 148 6 037 Property maintenance and repairs 107 481 83 019 Other 35 001 44 813 Total 149 630 133 869
4.7 Travel and subsistence
Note 2018/19 2017/18 4 R’000 R’000 Local 48 568 42 617 Foreign 1 444 1 460 Total 50 012 44 077

209
DEPARTMENT OF EDUCATION VOTE 4
NOTES TO THE ANNUAL FINANCIAL STATEMENTS
for the year ended 31 March 2019
- 208 -
Inventory 4.4 64 145 109 037 Consumables 4.5 18 235 17 332 Operating leases 14 549 17 683 Property payments 4.6 149 630 133 869 Rental and hiring 1 795 638 Transport provided as part of the departmental activities
128 116 6 790
Travel and subsistence 4.7 50 012 44 077 Venues and facilities 1 216 1 500 Training and development 4 031 7 592 Other operating expenditure 4.8 7 377 6 624 Total 594 641 459 952
4.1 Minor assets
Note 2018/19 2017/18 4 R’000 R’000 Tangible assets
Machinery and equipment 337 530 Intangible assets
Software - - Total 337 530
4.2 Computer services
Note 2018/19 2017/18 4 R’000 R’000 SITA computer services 6 298 3 572 External computer service providers 1 111 1 537 Total 7 409 5 109
4.3 Audit cost – External
Note 2018/19 2017/18 4 R’000 R’000 Regularity audits 12 331 10 747 Total 12 331 10 747
4.4 Inventory
Note 2018/19 2017/18 4 R’000 R’000
Learning, teaching and support material 16 214 43 694 Other supplies 4.4.1 47 931 65 343 Total 64 145 109 037
DEPARTMENT OF EDUCATION VOTE 4
NOTES TO THE ANNUAL FINANCIAL STATEMENTS
for the year ended 31 March 2019
- 209 -
4.4.1 Other supplies Note 2018/19 2017/18
4.4 R’000 R’000 Assets for distribution 45 193 64 726
Machinery and equipment 1 696 28 455 School furniture 9 759 16 271 Sports and recreation 2 145 - Other assets for distribution 31 593 20 000
Other 2 738 617 Total 47 931 65 343
4.5 Consumables
Note 2018/19 2017/18 4 R’000 R’000
Consumable supplies 2 736 3 961 Uniform and clothing 80 895 Household supplies 962 1 139 Building material and supplies 94 380 IT consumables 206 282 Other consumables 1 394 1 265
Stationery, printing and office supplies 15 499 13 371 Total 18 235 17 332
4.6 Property payments
Note 2018/19 2017/18 4 R’000 R’000 Municipal services 7 148 6 037 Property maintenance and repairs 107 481 83 019 Other 35 001 44 813 Total 149 630 133 869
4.7 Travel and subsistence
Note 2018/19 2017/18 4 R’000 R’000 Local 48 568 42 617 Foreign 1 444 1 460 Total 50 012 44 077

210
DEPARTMENT OF EDUCATION VOTE 4
NOTES TO THE ANNUAL FINANCIAL STATEMENTS
for the year ended 31 March 2019
- 210 -
4.8 Other operating expenditure Note 2018/19 2017/18 4 R’000 R’000 Professional bodies, membership and subscription fees
31 -
Resettlement costs 1 266 1 376 Other 6 080 5 248 Total 7 377 6 624
5. Interest and rent on land Note 2018/19 2017/18 R’000 R’000
Interest paid 215 119 Total 215 119
6. Transfers and subsidies 2018/19 2017/18 R’000 R’000 Note Departmental agencies and accounts Annex 1A 6 691 6 373 Non-profit institutions Annex 1B 444 878 417 660 Households Annex 1C 60 928 51 682 Total 512 497 475 715
7. Expenditure for capital assets Note 2018/19 2017/18 R’000 R’000 Tangible assets 400 366 452 346
Buildings and other fixed structures 30 328 476 417 119 Machinery and equipment 28 71 890 35 227
Intangible assets 9 411
Software 29 - 9 411
Total 400 366 461 757
7.1 Analysis of funds utilised to acquire capital assets – 2018/19
DEPARTMENT OF EDUCATION VOTE 4
NOTES TO THE ANNUAL FINANCIAL STATEMENTS
for the year ended 31 March 2019
- 211 -
Voted funds Aid assistance
Total
R’000 R’000 R’000 Tangible assets 400 366 - 400 366
Buildings and other fixed structures 328 476 - 328 476 Machinery and equipment 71 890 - 71 890
Intangible assets - - - Software - - -
Total 400 366 - 400 366
7.2 Analysis of funds utilised to acquire capital assets – 2017/18
Voted funds Aid assistance
Total
R’000 R’000 R’000 Tangible assets 452 346 - 452 346
Buildings and other fixed structures 417 119 - 417 119 Machinery and equipment 35 227 - 35 227
Intangible assets 9 411 - 9 411
Software 9 411 - 9 411 Total 461 757 - 461 757
7.3 Finance lease expenditure included in Expenditure for capital assets
Note 2018/19 2017/18 R’000 R’000 Tangible assets
Machinery and equipment 25 698 20 896 Total 25 698 20 896
8. Unauthorised expenditure 8.1 Reconciliation of unauthorised expenditure
Note 2018/19 2017/18 R’000 R’000 Opening balance 246 382 123 628 Unauthorised expenditure – discovered in current year (as restated)
18 818 122 754
Closing balance 265 200 246 382 Analysis of closing balance

211
DEPARTMENT OF EDUCATION VOTE 4
NOTES TO THE ANNUAL FINANCIAL STATEMENTS
for the year ended 31 March 2019
- 210 -
4.8 Other operating expenditure Note 2018/19 2017/18 4 R’000 R’000 Professional bodies, membership and subscription fees
31 -
Resettlement costs 1 266 1 376 Other 6 080 5 248 Total 7 377 6 624
5. Interest and rent on land Note 2018/19 2017/18 R’000 R’000
Interest paid 215 119 Total 215 119
6. Transfers and subsidies 2018/19 2017/18 R’000 R’000 Note Departmental agencies and accounts Annex 1A 6 691 6 373 Non-profit institutions Annex 1B 444 878 417 660 Households Annex 1C 60 928 51 682 Total 512 497 475 715
7. Expenditure for capital assets Note 2018/19 2017/18 R’000 R’000 Tangible assets 400 366 452 346
Buildings and other fixed structures 30 328 476 417 119 Machinery and equipment 28 71 890 35 227
Intangible assets 9 411
Software 29 - 9 411
Total 400 366 461 757
7.1 Analysis of funds utilised to acquire capital assets – 2018/19
DEPARTMENT OF EDUCATION VOTE 4
NOTES TO THE ANNUAL FINANCIAL STATEMENTS
for the year ended 31 March 2019
- 211 -
Voted funds Aid assistance
Total
R’000 R’000 R’000 Tangible assets 400 366 - 400 366
Buildings and other fixed structures 328 476 - 328 476 Machinery and equipment 71 890 - 71 890
Intangible assets - - - Software - - -
Total 400 366 - 400 366
7.2 Analysis of funds utilised to acquire capital assets – 2017/18
Voted funds Aid assistance
Total
R’000 R’000 R’000 Tangible assets 452 346 - 452 346
Buildings and other fixed structures 417 119 - 417 119 Machinery and equipment 35 227 - 35 227
Intangible assets 9 411 - 9 411
Software 9 411 - 9 411 Total 461 757 - 461 757
7.3 Finance lease expenditure included in Expenditure for capital assets
Note 2018/19 2017/18 R’000 R’000 Tangible assets
Machinery and equipment 25 698 20 896 Total 25 698 20 896
8. Unauthorised expenditure 8.1 Reconciliation of unauthorised expenditure
Note 2018/19 2017/18 R’000 R’000 Opening balance 246 382 123 628 Unauthorised expenditure – discovered in current year (as restated)
18 818 122 754
Closing balance 265 200 246 382 Analysis of closing balance

212
DEPARTMENT OF EDUCATION VOTE 4
NOTES TO THE ANNUAL FINANCIAL STATEMENTS
for the year ended 31 March 2019
- 212 -
Unauthorised expenditure awaiting authorisation 265 200 246 382 Unauthorised expenditure approved without funding and not derecognised
-
Total 265 200 246 382
8.2 Analysis of unauthorised expenditure awaiting authorisation per economic classification
2018/19 2017/18 R’000 R’000 Capital - - Current 265 200 246 382 Transfers and subsidies - -
Total 265 200 246 382
8.3 Analysis of unauthorised expenditure awaiting authorisation per type
2018/19 2017/18 R’000 R’000 Unauthorised expenditure relating to overspending of the vote or a main division within a vote
265 200
246 382
Total 265 200 246 382
8.4 Details of unauthorised expenditure – current year Incident Disciplinary steps taken/criminal
proceedings 2018/19 R’000
Over-expenditure on the main vote None 18 818
Total 18 818
9. Cash and cash equivalents
Note 2018/19 2017/18 R’000 R’000 Cash on hand 5 5 Total 5 5
10. Prepayments and advances Note 2018/19 2017/18 R’000 R’000 Travel and subsistence 2 341 846 Total 2 341 846
DEPARTMENT OF EDUCATION VOTE 4
NOTES TO THE ANNUAL FINANCIAL STATEMENTS
for the year ended 31 March 2019
- 213 -
11. Receivables 2018/19 2017/18
Current Non-current
Total Current Non-current
Total
Note
R’000 R’000 R’000 R’000 R’000 R’000
Claims recoverable
11.1
7 558 - 7 558 778 - 778
Recoverable expenditure
11.2 23 152 - 23 152 20 556 4 20 560
Other debtors
11.3 1 868 100 1 968 1 491 421 1 912
Total 32 578 100 32 678 22 825 425 23 250
11.1 Claims recoverable Note 2018/19 2017/18
11 and Annex 3
R’000 R’000
National departments 6 642 83 Provincial departments 916 695 Total 7 558 778
11.2 Recoverable expenditure (disallowance accounts)
Note 2018/19 2017/18 11 R’000 R’000
Sal: Disallowance Acc 19 873 18 170 Sal: Tax Debt 3 105 2 002 GEHS Refund Control 171 333 Salary Medical Aid 3 8 Salary Pension Fund - 47 Total 23 152 20 560

213
DEPARTMENT OF EDUCATION VOTE 4
NOTES TO THE ANNUAL FINANCIAL STATEMENTS
for the year ended 31 March 2019
- 212 -
Unauthorised expenditure awaiting authorisation 265 200 246 382 Unauthorised expenditure approved without funding and not derecognised
-
Total 265 200 246 382
8.2 Analysis of unauthorised expenditure awaiting authorisation per economic classification
2018/19 2017/18 R’000 R’000 Capital - - Current 265 200 246 382 Transfers and subsidies - -
Total 265 200 246 382
8.3 Analysis of unauthorised expenditure awaiting authorisation per type
2018/19 2017/18 R’000 R’000 Unauthorised expenditure relating to overspending of the vote or a main division within a vote
265 200
246 382
Total 265 200 246 382
8.4 Details of unauthorised expenditure – current year Incident Disciplinary steps taken/criminal
proceedings 2018/19 R’000
Over-expenditure on the main vote None 18 818
Total 18 818
9. Cash and cash equivalents
Note 2018/19 2017/18 R’000 R’000 Cash on hand 5 5 Total 5 5
10. Prepayments and advances Note 2018/19 2017/18 R’000 R’000 Travel and subsistence 2 341 846 Total 2 341 846
DEPARTMENT OF EDUCATION VOTE 4
NOTES TO THE ANNUAL FINANCIAL STATEMENTS
for the year ended 31 March 2019
- 213 -
11. Receivables 2018/19 2017/18
Current Non-current
Total Current Non-current
Total
Note
R’000 R’000 R’000 R’000 R’000 R’000
Claims recoverable
11.1
7 558 - 7 558 778 - 778
Recoverable expenditure
11.2 23 152 - 23 152 20 556 4 20 560
Other debtors
11.3 1 868 100 1 968 1 491 421 1 912
Total 32 578 100 32 678 22 825 425 23 250
11.1 Claims recoverable Note 2018/19 2017/18
11 and Annex 3
R’000 R’000
National departments 6 642 83 Provincial departments 916 695 Total 7 558 778
11.2 Recoverable expenditure (disallowance accounts)
Note 2018/19 2017/18 11 R’000 R’000
Sal: Disallowance Acc 19 873 18 170 Sal: Tax Debt 3 105 2 002 GEHS Refund Control 171 333 Salary Medical Aid 3 8 Salary Pension Fund - 47 Total 23 152 20 560

214
DEPARTMENT OF EDUCATION VOTE 4
NOTES TO THE ANNUAL FINANCIAL STATEMENTS
for the year ended 31 March 2019
- 214 -
11.3 Other debtors
Note 2018/19 2017/18 11 R’000 R’000
Debt Account 1 968 1 912 Total 1 968 1 912
11.4 Impairment of receivables Note 2018/19 2017/18 R’000 R’000 Estimate of impairment of receivables 13 893 11 354 Total 13 893 11 354
Impairment is in terms of the departmental debt management policy
12. Voted funds to be surrendered to the Revenue Fund Note 2018/19 2017/18 R’000 R’000 Opening balance 32 496 24 912 Transfer from statement of financial performance (as restated)
(18 130) (110 186)
Add: Unauthorised expenditure for current year 8 18 818 122 754 Voted funds not requested/not received 1.1 - (329) Paid during the year (12 239) (4 655) Closing balance 20 945 32 496
13. Departmental revenue and NRF Receipts to be surrendered to the Revenue Fund Note 2018/19 2017/18 R’000 R’000 Opening balance 2 693 2 477 Transfer from Statement of Financial Performance - - Own revenue included in appropriation 7 543 9 639 Paid during the year (8 825) (9 423) Closing balance 1 411 2 693
14. Bank Overdraft Note 2018/19 2017/18 R’000 R’000 Consolidated Paymaster General Account 271 912 232 598 Total 271 912 232 598
DEPARTMENT OF EDUCATION VOTE 4
NOTES TO THE ANNUAL FINANCIAL STATEMENTS
for the year ended 31 March 2019
- 215 -
15. Payables – current Note 2018/19 2017/18 R’000 R’000
Advances received 15.1 1 846 565 Clearing accounts 15.2 3 536 1 656 Total 5 382 2 221
15.1 Advances received
Note 2018/19 2017/18 15 R’000 R’000 Other institutions 1 846 565 Total 1 846 565
15.2 Clearing accounts
Note 2018/19 2017/18 15 R’000 R’000 Description Salary ACB Recall 2 171 1 477 Salary Garnishee Order 889 33 Salary Bargaining Council 3 - Salary Pension Fund 58 - Salary Income Tax 249 49 Salary UIF 6 2 Salary GEHS 159 85 Salary Official Unions 1 Salary Tax Debt - 10 Total 3 536 1 656

215
DEPARTMENT OF EDUCATION VOTE 4
NOTES TO THE ANNUAL FINANCIAL STATEMENTS
for the year ended 31 March 2019
- 214 -
11.3 Other debtors
Note 2018/19 2017/18 11 R’000 R’000
Debt Account 1 968 1 912 Total 1 968 1 912
11.4 Impairment of receivables Note 2018/19 2017/18 R’000 R’000 Estimate of impairment of receivables 13 893 11 354 Total 13 893 11 354
Impairment is in terms of the departmental debt management policy
12. Voted funds to be surrendered to the Revenue Fund Note 2018/19 2017/18 R’000 R’000 Opening balance 32 496 24 912 Transfer from statement of financial performance (as restated)
(18 130) (110 186)
Add: Unauthorised expenditure for current year 8 18 818 122 754 Voted funds not requested/not received 1.1 - (329) Paid during the year (12 239) (4 655) Closing balance 20 945 32 496
13. Departmental revenue and NRF Receipts to be surrendered to the Revenue Fund Note 2018/19 2017/18 R’000 R’000 Opening balance 2 693 2 477 Transfer from Statement of Financial Performance - - Own revenue included in appropriation 7 543 9 639 Paid during the year (8 825) (9 423) Closing balance 1 411 2 693
14. Bank Overdraft Note 2018/19 2017/18 R’000 R’000 Consolidated Paymaster General Account 271 912 232 598 Total 271 912 232 598
DEPARTMENT OF EDUCATION VOTE 4
NOTES TO THE ANNUAL FINANCIAL STATEMENTS
for the year ended 31 March 2019
- 215 -
15. Payables – current Note 2018/19 2017/18 R’000 R’000
Advances received 15.1 1 846 565 Clearing accounts 15.2 3 536 1 656 Total 5 382 2 221
15.1 Advances received
Note 2018/19 2017/18 15 R’000 R’000 Other institutions 1 846 565 Total 1 846 565
15.2 Clearing accounts
Note 2018/19 2017/18 15 R’000 R’000 Description Salary ACB Recall 2 171 1 477 Salary Garnishee Order 889 33 Salary Bargaining Council 3 - Salary Pension Fund 58 - Salary Income Tax 249 49 Salary UIF 6 2 Salary GEHS 159 85 Salary Official Unions 1 Salary Tax Debt - 10 Total 3 536 1 656

216
DEPARTMENT OF EDUCATION VOTE 4
NOTES TO THE ANNUAL FINANCIAL STATEMENTS
for the year ended 31 March 2019
- 216 -
16. Net cash flow available from operating activities Note 2018/19 2017/18 R’000 R’000 Net surplus/(deficit) as per Statement of Financial Performance
(18 130) (110 186)
Add back non cash/cash movements not deemed operating activities
379 083 457 610
(Increase)/decrease in receivables – current (9 428) 2 495 (Increase)/decrease in prepayments and advances (1 495) 81 Increase/(decrease) in payables – current 3 161 (1 955) Proceeds from sale of capital assets - - Expenditure on capital assets 400 366 461 757 Surrenders to Revenue Fund (21 064) (14 078) Voted funds not requested/not received - (329) Own revenue included in appropriation 7 543 9 639 Net cash flow generated by operating activities 360 953 347 424
17. Reconciliation of cash and cash equivalents for cash flow purposes Note 2018/19 2017/18 R’000 R’000 Consolidated Paymaster General account (271 192) (232 598) Cash on hand 5 5 Total (271 907) (232 593)
18. Contingent liabilities and contingent assets 18.1 Contingent liabilities
Note 2018/19 2017/18 R’000 R’000 Liable to Nature Housing loan guarantees Employees Annex 2A 353 359 Claims against the department Annex 2B 74 950 119 438 Intergovernmental payables (unconfirmed balances)
Annex 4 780 804
Total 76 083 120 601
It is not practical to estimate the financial effect, amount or timing of any outflow from the time a claim is instituted against the state until such time that the matter has been finalised in court or settled.
18.2 Contingent assets
Note 2018/19 2017/18
DEPARTMENT OF EDUCATION VOTE 4
NOTES TO THE ANNUAL FINANCIAL STATEMENTS
for the year ended 31 March 2019
- 217 -
R’000 R’000 Nature of contingent asset Trek-in-Panneelkloppers - 80 Carospan t/a Nashua 1 875 - Telkom - 817 Employee benefit leave credits 254 468 MJ Matebese 38 32 JT Moitsemang - 42 RG Bogacwi - 42 PC Sibeko - 42 L Kwes - 42 CC Martin - 42 AA Pieters 8 - Total 2 175 1 607
Contingent assets disclosed above include credits to be applied in the departments favour and claims for damages on departmental vehicles. It is not practical to estimate the financial effect, amount or timing of any outflow from the time a claim is instituted in favour of the state until such time that the matter has been finalised in court or settled
19. Commitments Note 2018/19 2017/18 R’000 R’000 Current expenditure Approved and contracted 393 293 347 247 Approved but not yet contracted - - 393 293 347 247 Capital expenditure Approved and contracted 781 718 515 951 Approved but not yet contracted 55 702 69 464 837 420 585 415 Total Commitments 1 230 713 932 662
Inclusive in the total commitments is long term commitments relating to infrastructure projects and Learner Transport SLA commitments

217
DEPARTMENT OF EDUCATION VOTE 4
NOTES TO THE ANNUAL FINANCIAL STATEMENTS
for the year ended 31 March 2019
- 216 -
16. Net cash flow available from operating activities Note 2018/19 2017/18 R’000 R’000 Net surplus/(deficit) as per Statement of Financial Performance
(18 130) (110 186)
Add back non cash/cash movements not deemed operating activities
379 083 457 610
(Increase)/decrease in receivables – current (9 428) 2 495 (Increase)/decrease in prepayments and advances (1 495) 81 Increase/(decrease) in payables – current 3 161 (1 955) Proceeds from sale of capital assets - - Expenditure on capital assets 400 366 461 757 Surrenders to Revenue Fund (21 064) (14 078) Voted funds not requested/not received - (329) Own revenue included in appropriation 7 543 9 639 Net cash flow generated by operating activities 360 953 347 424
17. Reconciliation of cash and cash equivalents for cash flow purposes Note 2018/19 2017/18 R’000 R’000 Consolidated Paymaster General account (271 192) (232 598) Cash on hand 5 5 Total (271 907) (232 593)
18. Contingent liabilities and contingent assets 18.1 Contingent liabilities
Note 2018/19 2017/18 R’000 R’000 Liable to Nature Housing loan guarantees Employees Annex 2A 353 359 Claims against the department Annex 2B 74 950 119 438 Intergovernmental payables (unconfirmed balances)
Annex 4 780 804
Total 76 083 120 601
It is not practical to estimate the financial effect, amount or timing of any outflow from the time a claim is instituted against the state until such time that the matter has been finalised in court or settled.
18.2 Contingent assets
Note 2018/19 2017/18
DEPARTMENT OF EDUCATION VOTE 4
NOTES TO THE ANNUAL FINANCIAL STATEMENTS
for the year ended 31 March 2019
- 217 -
R’000 R’000 Nature of contingent asset Trek-in-Panneelkloppers - 80 Carospan t/a Nashua 1 875 - Telkom - 817 Employee benefit leave credits 254 468 MJ Matebese 38 32 JT Moitsemang - 42 RG Bogacwi - 42 PC Sibeko - 42 L Kwes - 42 CC Martin - 42 AA Pieters 8 - Total 2 175 1 607
Contingent assets disclosed above include credits to be applied in the departments favour and claims for damages on departmental vehicles. It is not practical to estimate the financial effect, amount or timing of any outflow from the time a claim is instituted in favour of the state until such time that the matter has been finalised in court or settled
19. Commitments Note 2018/19 2017/18 R’000 R’000 Current expenditure Approved and contracted 393 293 347 247 Approved but not yet contracted - - 393 293 347 247 Capital expenditure Approved and contracted 781 718 515 951 Approved but not yet contracted 55 702 69 464 837 420 585 415 Total Commitments 1 230 713 932 662
Inclusive in the total commitments is long term commitments relating to infrastructure projects and Learner Transport SLA commitments

218
DEPARTMENT OF EDUCATION VOTE 4
NOTES TO THE ANNUAL FINANCIAL STATEMENTS
for the year ended 31 March 2019
- 218 -
20. Accruals and payables not recognised 20.1 Accruals
2018/19 2017/18 R’000 R’000 Listed by economic classification
30 Days 30+ Days Total Total Goods and services 26 271 4 073 30 344 14 297 Interest and rent on land 2 - 2 Transfers and subsidies 2 916 92 3 008 - Capital assets 54 453 1 54 454 19 567 Other 4 551 15 4 566 Total 88 193 4 181 92 374 33 864 Note 2018/19 2017/18 R’000 R’000 Listed by programme level Administration 25 784 8 251 Public ordinary school education 13 118 2 224 Public special school education 780 79 Early childhood development 78 32 Infrastructure development 48 901 17 330 Examination and education related services 3 713 5 948 Total 92 374 33 864
20.2 Payables not recognised 2018/19 2017/18 R’000 R’000 Listed by economic classification
30 Days 30+ Days Total Total Goods and services 17 699 24 486 42 185 35 387 Interest and rent on land - - - 42 Transfers and subsidies 1 682 38 1 720 6 689 Capital assets 729 3 953 4 682 10 466 Other 76 75 151 4 509 Total 20 186 28 552 48 738 57 093
DEPARTMENT OF EDUCATION VOTE 4
NOTES TO THE ANNUAL FINANCIAL STATEMENTS
for the year ended 31 March 2019
- 219 -
Note 2018/19 2017/18 R’000 R’000 Listed by programme level Administration 19 013 20 079 Public ordinary school education 21 541 23 855 Public special school education 42 47 Early childhood development 107 2 321 Infrastructure development 1 811 4 505 Examination and education related services 6 224 6 286 Total 48 738 57 093
Note 2018/19 2017/18 Included in the above totals are the following: R’000 R’000 Confirmed balances with other departments Annex 4 33 310 Total 33 310
21. Employee benefits Note 2018/19 2017/18
R’000 R’000 Leave entitlement 28 430 27 264 Service bonus 145 175 133 735 Capped leave commitments 310 023 318 766 Other 58 873 45 367 Total 542 501 525 132
At this stage the department is not able to reliably measure the long term portion of the long service awards.
Negative leave balances for 71 officials amounting to R253 635.18 are not included in the leave entitlement amount disclosed for the current financial year.

219
DEPARTMENT OF EDUCATION VOTE 4
NOTES TO THE ANNUAL FINANCIAL STATEMENTS
for the year ended 31 March 2019
- 218 -
20. Accruals and payables not recognised 20.1 Accruals
2018/19 2017/18 R’000 R’000 Listed by economic classification
30 Days 30+ Days Total Total Goods and services 26 271 4 073 30 344 14 297 Interest and rent on land 2 - 2 Transfers and subsidies 2 916 92 3 008 - Capital assets 54 453 1 54 454 19 567 Other 4 551 15 4 566 Total 88 193 4 181 92 374 33 864 Note 2018/19 2017/18 R’000 R’000 Listed by programme level Administration 25 784 8 251 Public ordinary school education 13 118 2 224 Public special school education 780 79 Early childhood development 78 32 Infrastructure development 48 901 17 330 Examination and education related services 3 713 5 948 Total 92 374 33 864
20.2 Payables not recognised 2018/19 2017/18 R’000 R’000 Listed by economic classification
30 Days 30+ Days Total Total Goods and services 17 699 24 486 42 185 35 387 Interest and rent on land - - - 42 Transfers and subsidies 1 682 38 1 720 6 689 Capital assets 729 3 953 4 682 10 466 Other 76 75 151 4 509 Total 20 186 28 552 48 738 57 093
DEPARTMENT OF EDUCATION VOTE 4
NOTES TO THE ANNUAL FINANCIAL STATEMENTS
for the year ended 31 March 2019
- 219 -
Note 2018/19 2017/18 R’000 R’000 Listed by programme level Administration 19 013 20 079 Public ordinary school education 21 541 23 855 Public special school education 42 47 Early childhood development 107 2 321 Infrastructure development 1 811 4 505 Examination and education related services 6 224 6 286 Total 48 738 57 093
Note 2018/19 2017/18 Included in the above totals are the following: R’000 R’000 Confirmed balances with other departments Annex 4 33 310 Total 33 310
21. Employee benefits Note 2018/19 2017/18
R’000 R’000 Leave entitlement 28 430 27 264 Service bonus 145 175 133 735 Capped leave commitments 310 023 318 766 Other 58 873 45 367 Total 542 501 525 132
At this stage the department is not able to reliably measure the long term portion of the long service awards.
Negative leave balances for 71 officials amounting to R253 635.18 are not included in the leave entitlement amount disclosed for the current financial year.

220
DEPARTMENT OF EDUCATION VOTE 4
NOTES TO THE ANNUAL FINANCIAL STATEMENTS
for the year ended 31 March 2019
- 220 -
22. Lease commitments
22.1 Operating leases
2018/19
Specialised
military equipment
Land
Buildings and other
fixed structures
Machinery
and equipment
Total R’000 R’000 R’000 R’000 R’000 Not later than 1 year - - 3 643 7 3 650 Later than 1 year and not later than 5 years - - - - -
Later than five years - - - - - Total lease commitments - - 3 643 7 3 650
2017/18
Specialised
military equipment
Land
Buildings and other
fixed structures
Machinery
and equipment
Total R’000 R’000 R’000 R’000 R’000 Not later than 1 year - - 8 474 331 8 805 Later than 1 year and not later than 5 years - - 2 209 - 2 209
Later than five years - - - - - Total lease commitments - - 10 683 331 11 014
Material lease agreement included in this note relates to the building lease of Namakwa district office.
22.2 Finance leases
2018/19
Specialised
military equipment
Land
Buildings and other
fixed structures
Machinery
and equipment
Total R’000 R’000 R’000 R’000 R’000 Not later than 1 year - - - 15 701 15 701 Later than 1 year and not later than 5 years - - - 15 021 15 021
Later than five years - - - - - Total lease commitments - - - 30 722 30 722
DEPARTMENT OF EDUCATION VOTE 4
NOTES TO THE ANNUAL FINANCIAL STATEMENTS
for the year ended 31 March 2019
- 221 -
2017/18
Specialised
military equipment
Land
Buildings and other
fixed structures
Machinery
and equipment
Total R’000 R’000 R’000 R’000 R’000 Not later than 1 year - - - 12 007 12 007 Later than 1 year and not later than 5 years - - - 16 072 16 072
Later than five years - - - - - Total lease commitments - - - 28 079 28 079
Lease amount included in this note relates to fleet trading account managed by the Northern Cape Fleet Trading Entity.
23. Irregular expenditure 23.1 Reconciliation of irregular expenditure
Note 2018/19 2017/18 R’000 R’000 Opening balance 1 659 144 2 560 133 Add: Irregular expenditure – relating to prior year 12 302 - Add: Irregular expenditure – relating to current year 313 891 229 006 Less: Amounts not condoned and not recoverable - (1 129 995) Closing balance 1 985 337 1 659 144
Analysis of awaiting condonation per age classification
Current year 313 891 229 006 Prior years 1 671 446 1 430 138 Total 1 985 337 1 659 144
Further instances of Irregular Expenditure that might have resulted from non-compliance with SCM processes are under investigation to determine the full extent of the amount.

221
DEPARTMENT OF EDUCATION VOTE 4
NOTES TO THE ANNUAL FINANCIAL STATEMENTS
for the year ended 31 March 2019
- 220 -
22. Lease commitments
22.1 Operating leases
2018/19
Specialised
military equipment
Land
Buildings and other
fixed structures
Machinery
and equipment
Total R’000 R’000 R’000 R’000 R’000 Not later than 1 year - - 3 643 7 3 650 Later than 1 year and not later than 5 years - - - - -
Later than five years - - - - - Total lease commitments - - 3 643 7 3 650
2017/18
Specialised
military equipment
Land
Buildings and other
fixed structures
Machinery
and equipment
Total R’000 R’000 R’000 R’000 R’000 Not later than 1 year - - 8 474 331 8 805 Later than 1 year and not later than 5 years - - 2 209 - 2 209
Later than five years - - - - - Total lease commitments - - 10 683 331 11 014
Material lease agreement included in this note relates to the building lease of Namakwa district office.
22.2 Finance leases
2018/19
Specialised
military equipment
Land
Buildings and other
fixed structures
Machinery
and equipment
Total R’000 R’000 R’000 R’000 R’000 Not later than 1 year - - - 15 701 15 701 Later than 1 year and not later than 5 years - - - 15 021 15 021
Later than five years - - - - - Total lease commitments - - - 30 722 30 722
DEPARTMENT OF EDUCATION VOTE 4
NOTES TO THE ANNUAL FINANCIAL STATEMENTS
for the year ended 31 March 2019
- 221 -
2017/18
Specialised
military equipment
Land
Buildings and other
fixed structures
Machinery
and equipment
Total R’000 R’000 R’000 R’000 R’000 Not later than 1 year - - - 12 007 12 007 Later than 1 year and not later than 5 years - - - 16 072 16 072
Later than five years - - - - - Total lease commitments - - - 28 079 28 079
Lease amount included in this note relates to fleet trading account managed by the Northern Cape Fleet Trading Entity.
23. Irregular expenditure 23.1 Reconciliation of irregular expenditure
Note 2018/19 2017/18 R’000 R’000 Opening balance 1 659 144 2 560 133 Add: Irregular expenditure – relating to prior year 12 302 - Add: Irregular expenditure – relating to current year 313 891 229 006 Less: Amounts not condoned and not recoverable - (1 129 995) Closing balance 1 985 337 1 659 144
Analysis of awaiting condonation per age classification
Current year 313 891 229 006 Prior years 1 671 446 1 430 138 Total 1 985 337 1 659 144
Further instances of Irregular Expenditure that might have resulted from non-compliance with SCM processes are under investigation to determine the full extent of the amount.

222
DEPARTMENT OF EDUCATION VOTE 4
NOTES TO THE ANNUAL FINANCIAL STATEMENTS
for the year ended 31 March 2019
- 222 -
23.2 Details of irregular expenditure – added current year (relating to current and prior years) Incident Disciplinary steps taken/criminal
proceedings 2018/19 R’000
UIFW 4.2 - 1 No deviation on bid process >R500 000 None 55 661 UIFW 4.2 - 10 IDT None 101 133 UIFW 4.2 - 12 Expired Leases None 1 157 UIFW 4.2 - 2 a Verbal Quotes < R10 000 None 44 UIFW 4.2 - 2 b Min 3 Quotes for R10 000 to R500 000 None 544 UIFW 4.2 - 2 d Bidding process for > R500 000 None 4 208 UIFW 4.2 - 4 Purchases without requisition/order None 554 UIFW 4.2 - 5 Exp exceed invoice/quote/order amounts None 8 746 UIFW 4.2 - 9 Public Works None 11 137 UIFW 4.2 - 14 Leaner Transport None 122 670 UIFW 4.2 - 15 Local content None 8 037 Irregular expenditure relating to prior year None 12 302 Total 326 193
23.3 Details of irregular expenditures under determination or investigation (not included in the
main note) Incident 2018/19
R’000 No deviation on bid process >R500 000 134 864 Total 134 864
24. Fruitless and wasteful expenditure 24.1 Reconciliation of fruitless and wasteful expenditure
Note 2018/19 2017/18 R’000 R’000 Opening balance 3 227 3 078 Fruitless and wasteful expenditure – relating to current year
243 149
Closing balance 3 470 3 227
DEPARTMENT OF EDUCATION VOTE 4
NOTES TO THE ANNUAL FINANCIAL STATEMENTS
for the year ended 31 March 2019
- 223 -
24.2 Analysis of awaiting resolution per economic classification 2018/19 2017/18 R’000 R’000 Current 3 470 3 227 Total 3 470 3 227
24.3 Analysis of Current year’s (relating to current and prior years) fruitless and wasteful
expenditure Incident Disciplinary steps taken/criminal
proceedings 2018/19 R’000
Where interests and/or penalties have been charged
None 215
Not honouring bookings None 28 Total 243
25. Related party transactions
All departments in the Northern Cape Province are related parties.
The Department occupies buildings for office space that is under the custodianship of the Department of Roads and Public Works @ Rnil rental. The Department of Roads and Public Works is also responsible for infrastructure procurement process for the Northern Cape Department of Education projects.
26. Key management personnel
No. of Individuals
2018/19 2017/18
R’000 R’000 Political office bearers (provide detail below) 1 1 978 1 920 Officials:
Level 15 to 16 2 3 883 3 590 Level 14 (incl. CFO if at a lower level) 9 11 685 10 972
Family members of key management personnel 18 9 229 8 389
Total 26 775 24 871

223
DEPARTMENT OF EDUCATION VOTE 4
NOTES TO THE ANNUAL FINANCIAL STATEMENTS
for the year ended 31 March 2019
- 222 -
23.2 Details of irregular expenditure – added current year (relating to current and prior years) Incident Disciplinary steps taken/criminal
proceedings 2018/19 R’000
UIFW 4.2 - 1 No deviation on bid process >R500 000 None 55 661 UIFW 4.2 - 10 IDT None 101 133 UIFW 4.2 - 12 Expired Leases None 1 157 UIFW 4.2 - 2 a Verbal Quotes < R10 000 None 44 UIFW 4.2 - 2 b Min 3 Quotes for R10 000 to R500 000 None 544 UIFW 4.2 - 2 d Bidding process for > R500 000 None 4 208 UIFW 4.2 - 4 Purchases without requisition/order None 554 UIFW 4.2 - 5 Exp exceed invoice/quote/order amounts None 8 746 UIFW 4.2 - 9 Public Works None 11 137 UIFW 4.2 - 14 Leaner Transport None 122 670 UIFW 4.2 - 15 Local content None 8 037 Irregular expenditure relating to prior year None 12 302 Total 326 193
23.3 Details of irregular expenditures under determination or investigation (not included in the
main note) Incident 2018/19
R’000 No deviation on bid process >R500 000 134 864 Total 134 864
24. Fruitless and wasteful expenditure 24.1 Reconciliation of fruitless and wasteful expenditure
Note 2018/19 2017/18 R’000 R’000 Opening balance 3 227 3 078 Fruitless and wasteful expenditure – relating to current year
243 149
Closing balance 3 470 3 227
DEPARTMENT OF EDUCATION VOTE 4
NOTES TO THE ANNUAL FINANCIAL STATEMENTS
for the year ended 31 March 2019
- 223 -
24.2 Analysis of awaiting resolution per economic classification 2018/19 2017/18 R’000 R’000 Current 3 470 3 227 Total 3 470 3 227
24.3 Analysis of Current year’s (relating to current and prior years) fruitless and wasteful
expenditure Incident Disciplinary steps taken/criminal
proceedings 2018/19 R’000
Where interests and/or penalties have been charged
None 215
Not honouring bookings None 28 Total 243
25. Related party transactions
All departments in the Northern Cape Province are related parties.
The Department occupies buildings for office space that is under the custodianship of the Department of Roads and Public Works @ Rnil rental. The Department of Roads and Public Works is also responsible for infrastructure procurement process for the Northern Cape Department of Education projects.
26. Key management personnel
No. of Individuals
2018/19 2017/18
R’000 R’000 Political office bearers (provide detail below) 1 1 978 1 920 Officials:
Level 15 to 16 2 3 883 3 590 Level 14 (incl. CFO if at a lower level) 9 11 685 10 972
Family members of key management personnel 18 9 229 8 389
Total 26 775 24 871

224
DEPARTMENT OF EDUCATION VOTE 4
NOTES TO THE ANNUAL FINANCIAL STATEMENTS
for the year ended 31 March 2019
- 224 -
27. Provisions
Note 2018/19 2017/18 R’000 R’000 1. VN Sikondwana (Litigation) 48 - 2. S Griqua obo MJ Griqua (Litigation) 125 - Total 173 -
Sikondwana: arbitration award made by the Department’s Labour Relations Council where the Department will make a payment of R47 699.25 in full and final settlement. The department to endeavour to settle on or before the 30th September 2019.
S Griqua: is a claim for damages against the Department for injuries suffered by a learner. As per court order payment is expected to take place on or before 31 May 2019.
27.1 Reconciliation of movement in provisions – 2018/19
Provision 1 Provision 2 Total
provisions R’000 R’000 R’000
Opening balance - - - Increase in provision 48 125 173 Settlement of provision - - - Unused amount reversed - - - Reimbursement expected from third party
- - -
Change in provision due to change in estimation of inputs
- - -
Closing balance 48 125 173
DEPARTMENT OF EDUCATION VOTE 4
NOTES TO THE ANNUAL FINANCIAL STATEMENTS
for the year ended 31 March 2019
- 225 -
28. Movable Tangible Capital Assets
MOVEMENT IN MOVABLE TANGIBLE CAPITAL ASSETS PER ASSET REGISTER FOR THE YEAR ENDED 31 MARCH 2019 Opening
balance Value
adjustments Additions Disposals Closing
Balance R’000 R’000 R’000 R’000 R’000 MACHINERY AND EQUIPMENT
123 461 - 26 567 (6 058) 143 970
Transport assets 11 468 - - - 11 468 Computer equipment 25 282 - 1 624 (5 502) 21 404 Furniture and office equipment 15 584 - 886 (339) 16 131 Other machinery and equipment 71 127 - 24 057 (217) 94 967 TOTAL MOVABLE TANGIBLE CAPITAL ASSETS
123 461 - 26 567 (6 058) 143 970
Movable Tangible Capital Assets under investigation Number Value R’000 Included in the above total of the movable tangible capital assets per the asset register are assets that are under investigation:
Machinery and equipment 133 1 457
The assets under investigation include those where there is uncertainty on the existence of the asset as they are not allocated to custodians.
28.1 Additions
ADDITIONS TO MOVABLE TANGIBLE CAPITAL ASSETS PER ASSET REGISTER FOR THE YEAR ENDED 31 MARCH 2019 Cash Non-cash (Capital
Work in Progress current
costs and finance lease
payments)
Received current, not paid
(Paid current year,
received prior year)
Total
R’000 R’000 R’000 R’000 R’000

225
DEPARTMENT OF EDUCATION VOTE 4
NOTES TO THE ANNUAL FINANCIAL STATEMENTS
for the year ended 31 March 2019
- 224 -
27. Provisions
Note 2018/19 2017/18 R’000 R’000 1. VN Sikondwana (Litigation) 48 - 2. S Griqua obo MJ Griqua (Litigation) 125 - Total 173 -
Sikondwana: arbitration award made by the Department’s Labour Relations Council where the Department will make a payment of R47 699.25 in full and final settlement. The department to endeavour to settle on or before the 30th September 2019.
S Griqua: is a claim for damages against the Department for injuries suffered by a learner. As per court order payment is expected to take place on or before 31 May 2019.
27.1 Reconciliation of movement in provisions – 2018/19
Provision 1 Provision 2 Total
provisions R’000 R’000 R’000
Opening balance - - - Increase in provision 48 125 173 Settlement of provision - - - Unused amount reversed - - - Reimbursement expected from third party
- - -
Change in provision due to change in estimation of inputs
- - -
Closing balance 48 125 173
DEPARTMENT OF EDUCATION VOTE 4
NOTES TO THE ANNUAL FINANCIAL STATEMENTS
for the year ended 31 March 2019
- 225 -
28. Movable Tangible Capital Assets
MOVEMENT IN MOVABLE TANGIBLE CAPITAL ASSETS PER ASSET REGISTER FOR THE YEAR ENDED 31 MARCH 2019 Opening
balance Value
adjustments Additions Disposals Closing
Balance R’000 R’000 R’000 R’000 R’000 MACHINERY AND EQUIPMENT
123 461 - 26 567 (6 058) 143 970
Transport assets 11 468 - - - 11 468 Computer equipment 25 282 - 1 624 (5 502) 21 404 Furniture and office equipment 15 584 - 886 (339) 16 131 Other machinery and equipment 71 127 - 24 057 (217) 94 967 TOTAL MOVABLE TANGIBLE CAPITAL ASSETS
123 461 - 26 567 (6 058) 143 970
Movable Tangible Capital Assets under investigation Number Value R’000 Included in the above total of the movable tangible capital assets per the asset register are assets that are under investigation:
Machinery and equipment 133 1 457
The assets under investigation include those where there is uncertainty on the existence of the asset as they are not allocated to custodians.
28.1 Additions
ADDITIONS TO MOVABLE TANGIBLE CAPITAL ASSETS PER ASSET REGISTER FOR THE YEAR ENDED 31 MARCH 2019 Cash Non-cash (Capital
Work in Progress current
costs and finance lease
payments)
Received current, not paid
(Paid current year,
received prior year)
Total
R’000 R’000 R’000 R’000 R’000

226
DEPARTMENT OF EDUCATION VOTE 4
NOTES TO THE ANNUAL FINANCIAL STATEMENTS
for the year ended 31 March 2019
- 226 -
MACHINERY AND EQUIPMENT
72 386 404 (46 634) 411 26 567
Transport assets 20 652 - (20 652) - - Computer equipment 1 181 260 - 183 1 624 Furniture and office equipment 672 123 - 91 886 Other machinery and equipment
49 881 21 (25 982) 137 24 057
TOTAL ADDITIONS TO MOVABLE TANGIBLE CAPITAL ASSETS
72 386 404 (46 634) 411 26 567
28.2 Disposals DISPOSALS OF MOVABLE TANGIBLE CAPITAL ASSETS PER ASSET REGISTER FOR THE YEAR ENDED 31 MARCH 2019
Sold for cash
Non-cash disposal
Total disposals
Cash Received
Actual R’000 R’000 R’000 R’000
MACHINERY AND EQUIPMENT - 6 058 6 058 - Transport assets - - - - Computer equipment - 5 502 5 502 - Furniture and office equipment - 339 339 - Other machinery and equipment - 217 217 - TOTAL DISPOSAL OF MOVABLE TANGIBLE CAPITAL ASSETS
- 6 058 6 058
-
DEPARTMENT OF EDUCATION VOTE 4
NOTES TO THE ANNUAL FINANCIAL STATEMENTS
for the year ended 31 March 2019
- 227 -
28.3 Movement for 2017/18
MOVEMENT IN TANGIBLE CAPITAL ASSETS PER ASSET REGISTER FOR THE YEAR ENDED 31 MARCH 2018 Opening
balance Prior
period error
Additions Disposals Closing Balance
R’000 R’000 R’000 R’000 R’000 MACHINERY AND EQUIPMENT
110 920 - 14 755 (2 214) 123 461
Transport assets 11 468 - - - 11 468 Computer equipment 24 670 - 2 177 (1 565) 25 282 Furniture and office equipment 14 157 - 1 830 (403) 15 584 Other machinery and equipment 60 625 - 10 748 (246) 71 127 TOTAL MOVABLE TANGIBLE CAPITAL ASSETS
110 920 - 14 755 (2 214) 123 461
28.4 Minor assets MOVEMENT IN MINOR ASSETS PER THE ASSET REGISTER FOR THE YEAR ENDED AS AT 31 MARCH 2019
Specialised military assets
Intangible assets
Heritage assets
Machinery and
equipment
Biological assets
Total
R’000 R’000 R’000 R’000 R’000 R’000 Opening balance
- - - 21 923 - 21 923
Value adjustments
- - - - - -
Additions - - - 676 - 676 Disposals - - - (1 813) - (1 813) TOTAL MINOR ASSETS
- - - 20 786 - 20 786
Minor Capital Assets under investigation Number Value R’000 Included in the above total of the minor capital assets per the asset register are assets that are under investigation:
Machinery and equipment 514 760

227
DEPARTMENT OF EDUCATION VOTE 4
NOTES TO THE ANNUAL FINANCIAL STATEMENTS
for the year ended 31 March 2019
- 226 -
MACHINERY AND EQUIPMENT
72 386 404 (46 634) 411 26 567
Transport assets 20 652 - (20 652) - - Computer equipment 1 181 260 - 183 1 624 Furniture and office equipment 672 123 - 91 886 Other machinery and equipment
49 881 21 (25 982) 137 24 057
TOTAL ADDITIONS TO MOVABLE TANGIBLE CAPITAL ASSETS
72 386 404 (46 634) 411 26 567
28.2 Disposals DISPOSALS OF MOVABLE TANGIBLE CAPITAL ASSETS PER ASSET REGISTER FOR THE YEAR ENDED 31 MARCH 2019
Sold for cash
Non-cash disposal
Total disposals
Cash Received
Actual R’000 R’000 R’000 R’000
MACHINERY AND EQUIPMENT - 6 058 6 058 - Transport assets - - - - Computer equipment - 5 502 5 502 - Furniture and office equipment - 339 339 - Other machinery and equipment - 217 217 - TOTAL DISPOSAL OF MOVABLE TANGIBLE CAPITAL ASSETS
- 6 058 6 058
-
DEPARTMENT OF EDUCATION VOTE 4
NOTES TO THE ANNUAL FINANCIAL STATEMENTS
for the year ended 31 March 2019
- 227 -
28.3 Movement for 2017/18
MOVEMENT IN TANGIBLE CAPITAL ASSETS PER ASSET REGISTER FOR THE YEAR ENDED 31 MARCH 2018 Opening
balance Prior
period error
Additions Disposals Closing Balance
R’000 R’000 R’000 R’000 R’000 MACHINERY AND EQUIPMENT
110 920 - 14 755 (2 214) 123 461
Transport assets 11 468 - - - 11 468 Computer equipment 24 670 - 2 177 (1 565) 25 282 Furniture and office equipment 14 157 - 1 830 (403) 15 584 Other machinery and equipment 60 625 - 10 748 (246) 71 127 TOTAL MOVABLE TANGIBLE CAPITAL ASSETS
110 920 - 14 755 (2 214) 123 461
28.4 Minor assets MOVEMENT IN MINOR ASSETS PER THE ASSET REGISTER FOR THE YEAR ENDED AS AT 31 MARCH 2019
Specialised military assets
Intangible assets
Heritage assets
Machinery and
equipment
Biological assets
Total
R’000 R’000 R’000 R’000 R’000 R’000 Opening balance
- - - 21 923 - 21 923
Value adjustments
- - - - - -
Additions - - - 676 - 676 Disposals - - - (1 813) - (1 813) TOTAL MINOR ASSETS
- - - 20 786 - 20 786
Minor Capital Assets under investigation Number Value R’000 Included in the above total of the minor capital assets per the asset register are assets that are under investigation:
Machinery and equipment 514 760

228
DEPARTMENT OF EDUCATION VOTE 4
NOTES TO THE ANNUAL FINANCIAL STATEMENTS
for the year ended 31 March 2019
- 228 -
The assets under investigation include those which there are uncertainty on the existence of the asset as they are not allocated to custodians
MOVEMENT IN MINOR ASSETS PER THE ASSET REGISTER FOR THE YEAR ENDED AS AT 31 MARCH 2018
Specialised military assets
Intangible assets
Heritage assets
Machinery and
equipment
Biological assets
Total
R’000 R’000 R’000 R’000 R’000 R’000 Opening balance
- - - 22 508 - 22 508
Prior period error
- - - - - -
Additions - - - 638 - 638 Disposals - - - (1 223) - 1 223 TOTAL MINOR ASSETS
- - - 21 923 - 21 923
28.5 Movable assets written off MOVABLE ASSETS WRITTEN OFF FOR THE YEAR ENDED AS AT 31 MARCH 2019
Specialised military assets
Intangible assets
Heritage assets
Machinery and
equipment
Biological assets
Total
R’000 R’000 R’000 R’000 R’000 R’000 Assets written off
- - - 7 871 - -
TOTAL MOVABLE ASSETS WRITTEN OFF
- - - 7 871 - -
DEPARTMENT OF EDUCATION VOTE 4
NOTES TO THE ANNUAL FINANCIAL STATEMENTS
for the year ended 31 March 2019
- 229 -
MOVABLE ASSETS WRITTEN OFF FOR THE YEAR ENDED AS AT 31 MARCH 2018
Specialised military assets
Intangible assets
Heritage assets
Machinery and
equipment
Biological assets
Total
R’000 R’000 R’000 R’000 R’000 R’000 Assets written off
- - - 3 437 - 3 437
TOTAL MOVABLE ASSETS WRITTEN OFF
- - - 3 437 - 3 437
29. Intangible Capital Assets MOVEMENT IN INTANGIBLE CAPITAL ASSETS PER ASSET REGISTER FOR THE YEAR ENDED 31 MARCH 2019 Opening
balance Value
adjustments Additions Disposals Closing
Balance R’000 R’000 R’000 R’000 R’000 SOFTWARE 27 179 - - (12) 27 167 TOTAL INTANGIBLE CAPITAL ASSETS
27 179 - - (12) 27 167
Intangible Capital Assets under investigation Number Value R’000 Included in the above total of the intangible capital assets per the asset register are assets that are under investigation:
Software 4 67
The assets under investigations include those which there is uncertainty on the existence of the asset as they are not allocated to custodians.

229
DEPARTMENT OF EDUCATION VOTE 4
NOTES TO THE ANNUAL FINANCIAL STATEMENTS
for the year ended 31 March 2019
- 228 -
The assets under investigation include those which there are uncertainty on the existence of the asset as they are not allocated to custodians
MOVEMENT IN MINOR ASSETS PER THE ASSET REGISTER FOR THE YEAR ENDED AS AT 31 MARCH 2018
Specialised military assets
Intangible assets
Heritage assets
Machinery and
equipment
Biological assets
Total
R’000 R’000 R’000 R’000 R’000 R’000 Opening balance
- - - 22 508 - 22 508
Prior period error
- - - - - -
Additions - - - 638 - 638 Disposals - - - (1 223) - 1 223 TOTAL MINOR ASSETS
- - - 21 923 - 21 923
28.5 Movable assets written off MOVABLE ASSETS WRITTEN OFF FOR THE YEAR ENDED AS AT 31 MARCH 2019
Specialised military assets
Intangible assets
Heritage assets
Machinery and
equipment
Biological assets
Total
R’000 R’000 R’000 R’000 R’000 R’000 Assets written off
- - - 7 871 - -
TOTAL MOVABLE ASSETS WRITTEN OFF
- - - 7 871 - -
DEPARTMENT OF EDUCATION VOTE 4
NOTES TO THE ANNUAL FINANCIAL STATEMENTS
for the year ended 31 March 2019
- 229 -
MOVABLE ASSETS WRITTEN OFF FOR THE YEAR ENDED AS AT 31 MARCH 2018
Specialised military assets
Intangible assets
Heritage assets
Machinery and
equipment
Biological assets
Total
R’000 R’000 R’000 R’000 R’000 R’000 Assets written off
- - - 3 437 - 3 437
TOTAL MOVABLE ASSETS WRITTEN OFF
- - - 3 437 - 3 437
29. Intangible Capital Assets MOVEMENT IN INTANGIBLE CAPITAL ASSETS PER ASSET REGISTER FOR THE YEAR ENDED 31 MARCH 2019 Opening
balance Value
adjustments Additions Disposals Closing
Balance R’000 R’000 R’000 R’000 R’000 SOFTWARE 27 179 - - (12) 27 167 TOTAL INTANGIBLE CAPITAL ASSETS
27 179 - - (12) 27 167
Intangible Capital Assets under investigation Number Value R’000 Included in the above total of the intangible capital assets per the asset register are assets that are under investigation:
Software 4 67
The assets under investigations include those which there is uncertainty on the existence of the asset as they are not allocated to custodians.

230
DEPARTMENT OF EDUCATION VOTE 4
NOTES TO THE ANNUAL FINANCIAL STATEMENTS
for the year ended 31 March 2019
- 230 -
29.1 Additions
ADDITIONS TO INTANGIBLE CAPITAL ASSETS PER ASSET REGISTER FOR THE YEAR ENDED 31 MARCH 2019 Cash Non-Cash (Develop-
ment work in
progress – current costs)
Received current
year, not paid (Paid
current year,
received prior year)
Total
R’000 R’000 R’000 R’000 R’000 SOFTWARE - - - - - TOTAL ADDITIONS TO INTANGIBLE CAPITAL ASSETS
- - - - -
29.2 Disposals
DISPOSALS OF INTANGIBLE CAPITAL ASSETS PER ASSET REGISTER FOR THE YEAR ENDED 31 MARCH 2019
Sold for cash
Non-cash disposal
Total disposals
Cash Received
Actual R’000 R’000 R’000 R’000
SOFTWARE - (12) (12) - TOTAL DISPOSALS OF INTANGIBLE CAPITAL ASSETS
- (12) (12) -
DEPARTMENT OF EDUCATION VOTE 4
NOTES TO THE ANNUAL FINANCIAL STATEMENTS
for the year ended 31 March 2019
- 231 -
29.3 Movement for 2017/18
MOVEMENT IN INTANGIBLE CAPITAL ASSETS PER ASSET REGISTER FOR THE YEAR ENDED 31 MARCH 2018 Opening
balance Prior period
error Additions Disposal
s Closing Balance
R’000 R’000 R’000 R’000 R’000 SOFTWARE 27 179 - - - 27 179 TOTAL INTANGIBLE CAPITAL ASSETS
27 179 - - - 27 179
30. Immovable Tangible Capital Assets MOVEMENT IN IMMOVABLE TANGIBLE CAPITAL ASSETS PER ASSET REGISTER FOR THE YEAR ENDED 31 MARCH 2019 Opening
balance Value
adjustments Additions Disposals Closing
Balance R’000 R’000 R’000 R’000 BUILDINGS AND OTHER FIXED STRUCTURES 894 436 - 42 723 - 937 159
Dwellings - - - - - Non-residential buildings 894 436 - 42 723 - 937 159 Other fixed structures - - - - - TOTAL IMMOVABLE TANGIBLE CAPITAL ASSETS
894 436 - 42 723 - 937 159

231
DEPARTMENT OF EDUCATION VOTE 4
NOTES TO THE ANNUAL FINANCIAL STATEMENTS
for the year ended 31 March 2019
- 230 -
29.1 Additions
ADDITIONS TO INTANGIBLE CAPITAL ASSETS PER ASSET REGISTER FOR THE YEAR ENDED 31 MARCH 2019 Cash Non-Cash (Develop-
ment work in
progress – current costs)
Received current
year, not paid (Paid
current year,
received prior year)
Total
R’000 R’000 R’000 R’000 R’000 SOFTWARE - - - - - TOTAL ADDITIONS TO INTANGIBLE CAPITAL ASSETS
- - - - -
29.2 Disposals
DISPOSALS OF INTANGIBLE CAPITAL ASSETS PER ASSET REGISTER FOR THE YEAR ENDED 31 MARCH 2019
Sold for cash
Non-cash disposal
Total disposals
Cash Received
Actual R’000 R’000 R’000 R’000
SOFTWARE - (12) (12) - TOTAL DISPOSALS OF INTANGIBLE CAPITAL ASSETS
- (12) (12) -
DEPARTMENT OF EDUCATION VOTE 4
NOTES TO THE ANNUAL FINANCIAL STATEMENTS
for the year ended 31 March 2019
- 231 -
29.3 Movement for 2017/18
MOVEMENT IN INTANGIBLE CAPITAL ASSETS PER ASSET REGISTER FOR THE YEAR ENDED 31 MARCH 2018 Opening
balance Prior period
error Additions Disposal
s Closing Balance
R’000 R’000 R’000 R’000 R’000 SOFTWARE 27 179 - - - 27 179 TOTAL INTANGIBLE CAPITAL ASSETS
27 179 - - - 27 179
30. Immovable Tangible Capital Assets MOVEMENT IN IMMOVABLE TANGIBLE CAPITAL ASSETS PER ASSET REGISTER FOR THE YEAR ENDED 31 MARCH 2019 Opening
balance Value
adjustments Additions Disposals Closing
Balance R’000 R’000 R’000 R’000 BUILDINGS AND OTHER FIXED STRUCTURES 894 436 - 42 723 - 937 159
Dwellings - - - - - Non-residential buildings 894 436 - 42 723 - 937 159 Other fixed structures - - - - - TOTAL IMMOVABLE TANGIBLE CAPITAL ASSETS
894 436 - 42 723 - 937 159

232
DEPARTMENT OF EDUCATION VOTE 4
NOTES TO THE ANNUAL FINANCIAL STATEMENTS
for the year ended 31 March 2019
- 232 -
30.1 Additions
ADDITIONS TO IMMOVABLE TANGIBLE CAPITAL ASSETS PER ASSET REGISTER FOR THE YEAR ENDED 31 MARCH 2019
Cash Non-cash
(Capital Work in
Progress current
costs and finance lease
payments)
Received current, not paid
(Paid current year,
received prior year)
Total
R’000 R’000 R’000 R’000 R’000 BUILDING AND OTHER FIXED STRUCTURES
328 475 42 723 (328 475) - 42 723
Dwellings - - - - - Non-residential buildings 328 475 42 723 (328 475) - 42 723 Other fixed structures - - - - - TOTAL ADDITIONS TO IMMOVABLE TANGIBLE CAPITAL ASSETS
328 475 42 723 (328 475) - 42 723
30.2 Movement for 2017/18 MOVEMENT IN IMMOVABLE TANGIBLE CAPITAL ASSETS PER ASSET REGISTER FOR THE YEAR ENDED 31 MARCH 2018 Opening
balance Prior
period error
Additions Disposals Closing Balance
R’000 R’000 R’000 R’000 R’000 BUILDINGS AND OTHER FIXED STRUCTURES
727 057 - 167 379 - 894 436
Dwellings - - - - - Non-residential buildings 727 057 - 167 379 - 894 436 Other fixed structures - - - - - TOTAL IMMOVABLE TANGIBLE CAPITAL ASSETS
727 057 - 167 379 - 894 436
DEPARTMENT OF EDUCATION VOTE 4
NOTES TO THE ANNUAL FINANCIAL STATEMENTS
for the year ended 31 March 2019
- 233 -
30.3 Capital Work-in-progress
CAPITAL WORK-IN-PROGRESS AS AT 31 MARCH 2019
Note
Opening balance 1 April 2018
Current Year WIP
Ready for use
(Assets to the AR) / Contracts terminated
Closing balance
31 March 2019
Annexure 6 R’000 R’000 R’000 R’000 Heritage assets - - - - Buildings and other fixed structures
509 677 328 475 (42 723) 795 429
Machinery and equipment - 20 936 - 20 936 Intangible assets - - - - TOTAL 509 677 349 411 (42 723) 816 365
Age analysis on ongoing projects
Number of projects 2018/19
Planned, Construction not
started
Planned, Construction
started Total R’000
0 to 1 Year - 14 49 019 1 to 3 Years - 54 618 417 3 to 5 Years - - - Longer than 5 Years - 2 127 992 Total - 70 795 428
The two (2) projects that are longer than 5 years in capital work in progress relates to the construction of full service schools has been extended due to project scope change. The planned completion for these projects was during 2020/21 financial year.
Accruals and payables not recognised relating to Capital WIP
Note 2018/19 2017/18
R’000 R’000 Amounts relating to progress certificates received but not paid at year end and therefore not included in capital work-in-progress
18 236 14 348
- Total 18 236 14 348

233
DEPARTMENT OF EDUCATION VOTE 4
NOTES TO THE ANNUAL FINANCIAL STATEMENTS
for the year ended 31 March 2019
- 232 -
30.1 Additions
ADDITIONS TO IMMOVABLE TANGIBLE CAPITAL ASSETS PER ASSET REGISTER FOR THE YEAR ENDED 31 MARCH 2019
Cash Non-cash
(Capital Work in
Progress current
costs and finance lease
payments)
Received current, not paid
(Paid current year,
received prior year)
Total
R’000 R’000 R’000 R’000 R’000 BUILDING AND OTHER FIXED STRUCTURES
328 475 42 723 (328 475) - 42 723
Dwellings - - - - - Non-residential buildings 328 475 42 723 (328 475) - 42 723 Other fixed structures - - - - - TOTAL ADDITIONS TO IMMOVABLE TANGIBLE CAPITAL ASSETS
328 475 42 723 (328 475) - 42 723
30.2 Movement for 2017/18 MOVEMENT IN IMMOVABLE TANGIBLE CAPITAL ASSETS PER ASSET REGISTER FOR THE YEAR ENDED 31 MARCH 2018 Opening
balance Prior
period error
Additions Disposals Closing Balance
R’000 R’000 R’000 R’000 R’000 BUILDINGS AND OTHER FIXED STRUCTURES
727 057 - 167 379 - 894 436
Dwellings - - - - - Non-residential buildings 727 057 - 167 379 - 894 436 Other fixed structures - - - - - TOTAL IMMOVABLE TANGIBLE CAPITAL ASSETS
727 057 - 167 379 - 894 436
DEPARTMENT OF EDUCATION VOTE 4
NOTES TO THE ANNUAL FINANCIAL STATEMENTS
for the year ended 31 March 2019
- 233 -
30.3 Capital Work-in-progress
CAPITAL WORK-IN-PROGRESS AS AT 31 MARCH 2019
Note
Opening balance 1 April 2018
Current Year WIP
Ready for use
(Assets to the AR) / Contracts terminated
Closing balance
31 March 2019
Annexure 6 R’000 R’000 R’000 R’000 Heritage assets - - - - Buildings and other fixed structures
509 677 328 475 (42 723) 795 429
Machinery and equipment - 20 936 - 20 936 Intangible assets - - - - TOTAL 509 677 349 411 (42 723) 816 365
Age analysis on ongoing projects
Number of projects 2018/19
Planned, Construction not
started
Planned, Construction
started Total R’000
0 to 1 Year - 14 49 019 1 to 3 Years - 54 618 417 3 to 5 Years - - - Longer than 5 Years - 2 127 992 Total - 70 795 428
The two (2) projects that are longer than 5 years in capital work in progress relates to the construction of full service schools has been extended due to project scope change. The planned completion for these projects was during 2020/21 financial year.
Accruals and payables not recognised relating to Capital WIP
Note 2018/19 2017/18
R’000 R’000 Amounts relating to progress certificates received but not paid at year end and therefore not included in capital work-in-progress
18 236 14 348
- Total 18 236 14 348

234
DEPARTMENT OF EDUCATION VOTE 4
NOTES TO THE ANNUAL FINANCIAL STATEMENTS
for the year ended 31 March 2019
- 234 -
CAPITAL WORK-IN-PROGRESS AS AT 31 MARCH 2018
Note
Opening balance
1 April 2017 Prior period
error Current
Year WIP
Ready for use (Assets to the AR) ) / Contracts terminated
Closing balance
31 March 2018
Annexure 6 R’000 R’000 R’000 R’000 R’000 Heritage assets
- - - - -
Buildings and other fixed structures
259 937 - 417 119 (167 379) 509 677
Machinery and equipment
6 174 - - (6 174) -
Intangible assets
- - - - -
TOTAL 266 111 - 417 119 173 553 509 677
Age analysis on ongoing projects
Number of projects 2017/18
Planned, Construction not started
Planned, Construction
started Total R’000
0 to 1 Year - 41 33 815 1 to 3 Years - 34 370 850 3 to 5 Years - 2 105 012 Longer than 5 Years - - - Total - 77 509 677
The two (2) projects that are longer than 5 years in capital work in progress relates to the construction of full service schools has been extended due to project scope change. The planned completion for these projects is during 2018/19 financial year.
DEPARTMENT OF EDUCATION VOTE 4
NOTES TO THE ANNUAL FINANCIAL STATEMENTS
for the year ended 31 March 2019
- 235 -
30.4 S42 Immovable assets
Assets to be transferred in terms of S42 of the PFMA – 2018/19
Number of assets
Value of assets
R’000 BUILDINGS AND OTHER FIXED STRUCTURES
306 514 298
Dwellings - - Non-residential buildings 306 514 298 Other fixed structures - - TOTAL 306 514 298
The amount of R514.298 million are final completed projects ready for transfer to Department of Public Works in terms of PFMA section 42.
Assets to be transferred in terms of S42 of the PFMA – 2017/18
Number of assets
Value of assets
R’000 BUILDINGS AND OTHER FIXED STRUCTURES
321 303 362
Dwellings Non-residential buildings 321 303 362 Other fixed structures TOTAL 321 303 362
The amount of R303.362 million are final completed projects ready for transfer to Department of Public Works in terms of PFMA section 42.

235
DEPARTMENT OF EDUCATION VOTE 4
NOTES TO THE ANNUAL FINANCIAL STATEMENTS
for the year ended 31 March 2019
- 234 -
CAPITAL WORK-IN-PROGRESS AS AT 31 MARCH 2018
Note
Opening balance
1 April 2017 Prior period
error Current
Year WIP
Ready for use (Assets to the AR) ) / Contracts terminated
Closing balance
31 March 2018
Annexure 6 R’000 R’000 R’000 R’000 R’000 Heritage assets
- - - - -
Buildings and other fixed structures
259 937 - 417 119 (167 379) 509 677
Machinery and equipment
6 174 - - (6 174) -
Intangible assets
- - - - -
TOTAL 266 111 - 417 119 173 553 509 677
Age analysis on ongoing projects
Number of projects 2017/18
Planned, Construction not started
Planned, Construction
started Total R’000
0 to 1 Year - 41 33 815 1 to 3 Years - 34 370 850 3 to 5 Years - 2 105 012 Longer than 5 Years - - - Total - 77 509 677
The two (2) projects that are longer than 5 years in capital work in progress relates to the construction of full service schools has been extended due to project scope change. The planned completion for these projects is during 2018/19 financial year.
DEPARTMENT OF EDUCATION VOTE 4
NOTES TO THE ANNUAL FINANCIAL STATEMENTS
for the year ended 31 March 2019
- 235 -
30.4 S42 Immovable assets
Assets to be transferred in terms of S42 of the PFMA – 2018/19
Number of assets
Value of assets
R’000 BUILDINGS AND OTHER FIXED STRUCTURES
306 514 298
Dwellings - - Non-residential buildings 306 514 298 Other fixed structures - - TOTAL 306 514 298
The amount of R514.298 million are final completed projects ready for transfer to Department of Public Works in terms of PFMA section 42.
Assets to be transferred in terms of S42 of the PFMA – 2017/18
Number of assets
Value of assets
R’000 BUILDINGS AND OTHER FIXED STRUCTURES
321 303 362
Dwellings Non-residential buildings 321 303 362 Other fixed structures TOTAL 321 303 362
The amount of R303.362 million are final completed projects ready for transfer to Department of Public Works in terms of PFMA section 42.

236
DEPARTMENT OF EDUCATION VOTE 4
NOTES TO THE ANNUAL FINANCIAL STATEMENTS
for the year ended 31 March 2019
- 236 -
31. Principal-agent arrangements
31.1 Department acting as the principal Fee paid 2018/19 2017/18 R’000 R’000 Independent Development Trust Management Fees 16 310 22 226 Gamagara Development Forum 443 - John Taolo Gaetsewe Development Trust 3 136 689 Total 19 889 22 915
The department has entered into an agreement with Independent Development Trust (IDT), Gamagara Development Forum and John Taolo Gaetsewe Development Trust as an agent for procurement of infrastructure projects. The amount disclosed is management fee paid during the year.
DEP
AR
TMEN
T O
F ED
UC
ATI
ON
VO
TE
N
OTE
S TO
TH
E A
NN
UA
L FI
NA
NC
IAL
STA
TEM
ENTS
fo
r the
yea
r end
ed 3
1 M
arch
201
9
- 237
-
32.
STAT
EMEN
T O
F C
ON
DIT
ION
AL G
RAN
TS R
ECEI
VED
NA
ME
OF
DEP
AR
TMEN
T
GR
AN
T A
LLO
CA
TIO
N
SPEN
T 20
17/1
8 D
ivis
ion
of
Rev
enue
A
ct/
Prov
inci
al
Gra
nts
Rol
l O
vers
DO
RA
A
djus
t-m
ents
Oth
er
Adj
ust-
men
ts
Tota
l A
vaila
ble
Am
ount
re
ceiv
ed
by
depa
rt-
men
t
Am
ount
s
pent
by
depa
rt-
men
t
Und
er /
(Ove
rspe
ndi
ng)
% o
f av
aila
ble
fund
s sp
ent b
y de
part
-men
t
Div
isio
n of
R
even
ue
Act
Am
ount
s
pent
by
depa
rtm
ent
R’0
00
R’0
00
R'0
00
R'0
00
R’0
00
R'0
00
R'0
00
R'0
00
%
R’0
00
R’0
00
Dep
t. B
asic
Edu
catio
n N
at
Sch
ool N
utrit
ion
Pro
gram
me
Gra
nt
170
211
- -
- 17
0 21
1 17
0 21
1 17
0 21
1 -
100%
16
0 80
7 16
0 80
1
Dep
t. B
asic
E
duca
tion
HIV
/AID
S L
ife s
kills
Gra
nt
5 35
6 -
- -
5 35
6 5
356
5 35
6 -
100%
5
547
5 53
6
Dep
t. B
asic
Edu
catio
n E
duca
tion
Infra
stru
ctur
e G
rant
56
8 76
6 -
- -
568
766
568
766
568
236
530
100%
61
2 26
7 60
9 36
1
Nat
Pub
lic W
orks
E
PWP
–
Soc
ial
Sec
tor
Edu
catio
n 6
335
- -
- 6
335
6 33
5 6
246
89
99%
2
017
1 98
7
Nat
Pub
lic W
orks
E
PWP
– In
tegr
ated
Gra
nt
2 22
2 -
- -
2 22
2 2
222
2 15
8 64
97
%
2 08
3 2
031
Dep
t. B
asic
E
duca
tion
Mat
hs,
Sci
ence
an
d Te
chno
logy
24
564
-
- -
24 5
64
24 5
64
24 5
64
- 10
0%
23 6
36
23 5
95
Dep
t. B
asic
Edu
catio
n Le
arne
rs w
ith S
ever
e to
P
rofo
und
Inte
llect
ual
Dis
abili
ties
6 83
7 -
- -
6 83
7 6
837
6 83
2 5
100%
2
021
1 55
7
78
4 29
1 -
- -
784
291
784
291
783
603
688
784
291
808
378
804
868

237
DEPARTMENT OF EDUCATION VOTE 4
NOTES TO THE ANNUAL FINANCIAL STATEMENTS
for the year ended 31 March 2019
- 236 -
31. Principal-agent arrangements
31.1 Department acting as the principal Fee paid 2018/19 2017/18 R’000 R’000 Independent Development Trust Management Fees 16 310 22 226 Gamagara Development Forum 443 - John Taolo Gaetsewe Development Trust 3 136 689 Total 19 889 22 915
The department has entered into an agreement with Independent Development Trust (IDT), Gamagara Development Forum and John Taolo Gaetsewe Development Trust as an agent for procurement of infrastructure projects. The amount disclosed is management fee paid during the year.
DEP
AR
TMEN
T O
F ED
UC
ATI
ON
VO
TE
N
OTE
S TO
TH
E A
NN
UA
L FI
NA
NC
IAL
STA
TEM
ENTS
fo
r the
yea
r end
ed 3
1 M
arch
201
9
- 237
-
32.
STAT
EMEN
T O
F C
ON
DIT
ION
AL G
RAN
TS R
ECEI
VED
NA
ME
OF
DEP
AR
TMEN
T
GR
AN
T A
LLO
CA
TIO
N
SPEN
T 20
17/1
8 D
ivis
ion
of
Rev
enue
A
ct/
Prov
inci
al
Gra
nts
Rol
l O
vers
DO
RA
A
djus
t-m
ents
Oth
er
Adj
ust-
men
ts
Tota
l A
vaila
ble
Am
ount
re
ceiv
ed
by
depa
rt-
men
t
Am
ount
s
pent
by
depa
rt-
men
t
Und
er /
(Ove
rspe
ndi
ng)
% o
f av
aila
ble
fund
s sp
ent b
y de
part
-men
t
Div
isio
n of
R
even
ue
Act
Am
ount
s
pent
by
depa
rtm
ent
R’0
00
R’0
00
R'0
00
R'0
00
R’0
00
R'0
00
R'0
00
R'0
00
%
R’0
00
R’0
00
Dep
t. B
asic
Edu
catio
n N
at
Sch
ool N
utrit
ion
Pro
gram
me
Gra
nt
170
211
- -
- 17
0 21
1 17
0 21
1 17
0 21
1 -
100%
16
0 80
7 16
0 80
1
Dep
t. B
asic
E
duca
tion
HIV
/AID
S L
ife s
kills
Gra
nt
5 35
6 -
- -
5 35
6 5
356
5 35
6 -
100%
5
547
5 53
6
Dep
t. B
asic
Edu
catio
n E
duca
tion
Infra
stru
ctur
e G
rant
56
8 76
6 -
- -
568
766
568
766
568
236
530
100%
61
2 26
7 60
9 36
1
Nat
Pub
lic W
orks
E
PWP
–
Soc
ial
Sec
tor
Edu
catio
n 6
335
- -
- 6
335
6 33
5 6
246
89
99%
2
017
1 98
7
Nat
Pub
lic W
orks
E
PWP
– In
tegr
ated
Gra
nt
2 22
2 -
- -
2 22
2 2
222
2 15
8 64
97
%
2 08
3 2
031
Dep
t. B
asic
E
duca
tion
Mat
hs,
Sci
ence
an
d Te
chno
logy
24
564
-
- -
24 5
64
24 5
64
24 5
64
- 10
0%
23 6
36
23 5
95
Dep
t. B
asic
Edu
catio
n Le
arne
rs w
ith S
ever
e to
P
rofo
und
Inte
llect
ual
Dis
abili
ties
6 83
7 -
- -
6 83
7 6
837
6 83
2 5
100%
2
021
1 55
7
78
4 29
1 -
- -
784
291
784
291
783
603
688
784
291
808
378
804
868

238
DEP
AR
TMEN
T O
F ED
UC
ATI
ON
VO
TE 4
AN
NEX
UR
ES T
O T
HE
AN
NU
AL
FIN
AN
CIA
L ST
ATE
MEN
TS
for t
he y
ear e
nded
31
Mar
ch 2
019
- 238
-
ANN
EXU
RE
1A
STAT
EMEN
T O
F TR
ANSF
ERS
TO D
EPAR
TMEN
TAL
AGEN
CIE
S AN
D A
CC
OU
NTS
D
EPA
RTM
ENTA
L A
GEN
CY/
A
CC
OU
NT
TRAN
SFER
ALL
OC
ATIO
N
TR
ANSF
ER
2017
/18
Adj
uste
d A
ppro
pria
tion
Rol
l O
vers
A
djus
tmen
ts
Tota
l A
vaila
ble
Act
ual
Tran
sfer
% o
f A
vaila
ble
fund
s Tr
ansf
erre
d Fi
nal
App
ropr
iatio
n R
'000
R
'000
R
'000
R
'000
R
'000
%
R
'000
SE
TA
6 69
1 -
- 6
691
6 69
1 10
0%
6 37
3
TO
TAL
6 69
1 -
- 6
691
6 69
1
6 37
3

239
DEP
AR
TMEN
T O
F ED
UC
ATI
ON
VO
TE 4
AN
NEX
UR
ES T
O T
HE
AN
NU
AL
FIN
AN
CIA
L ST
ATE
MEN
TS
for t
he y
ear e
nded
31
Mar
ch 2
019
- 239
-
ANN
EXU
RE
1B
STAT
EMEN
T O
F TR
ANSF
ERS
TO N
ON
-PR
OFI
T IN
STIT
UTI
ON
S
NO
N-P
RO
FIT
INST
ITU
TIO
NS
TRAN
SFER
ALL
OC
ATIO
N
EXPE
ND
ITU
RE
2017
/18
Adj
uste
d A
ppro
-pr
iatio
n A
ct
Rol
l ove
rs
Adj
ust-
men
ts
Tota
l A
vaila
ble
Act
ual
Tran
sfer
% o
f A
vaila
ble
fund
s tr
ansf
erre
d
Fina
l A
ppro
pria
tion
R'0
00
R'0
00
R'0
00
R'0
00
R'0
00
%
R'0
00
Tran
sfer
s
Publ
ic O
rdin
ary
Scho
ols
233
079
- -
233
079
228
573
98%
21
6 90
0 Sc
hool
Nut
ritio
n(G
rant
) 15
5 67
6 -
- 15
5 67
6 15
4 85
9 99
%
154
182
Spec
ial S
choo
ls
11 0
00
- -
11 0
00
11 1
23
101%
9
654
Inde
pend
ent S
choo
ls
9 60
0 -
- 9
600
9 59
9 10
0%
9 16
9 Ea
rly C
hild
hood
Dev
elop
men
t 14
640
-
- 14
640
15
167
10
4%
13 9
97
Scho
ol N
utrit
ion
(Vot
ed)
19 7
64
- -
19 7
64
22 0
48
112%
9
665
CG
Soc
ial S
ecto
r EPW
P 4
605
- -
4 60
5 3
509
76%
2
017
Scho
ol s
uppo
rt (o
th e
duc
inst
it)
428
- -
428
- 0%
-
Cur
ricul
um M
anag
emen
t and
Dev
-
- -
- -
75
3 Ed
ucat
iona
l Tra
inin
g an
d D
ev
- -
- -
-
6 TO
TAL
448
792
- -
448
792
444
878
41
6 34
3

240
DEP
AR
TMEN
T O
F ED
UC
ATI
ON
VO
TE 4
AN
NEX
UR
ES T
O T
HE
AN
NU
AL
FIN
AN
CIA
L ST
ATE
MEN
TS
for t
he y
ear e
nded
31
Mar
ch 2
019
- 240
-
ANN
EXU
RE
1C
STAT
EMEN
T O
F TR
ANSF
ERS
TO H
OU
SEH
OLD
S H
OU
SEH
OLD
S
TRAN
SFER
ALL
OC
ATIO
N
EXPE
ND
ITU
RE
2017
/18
Adj
uste
d A
ppro
-pr
iatio
n A
ct
Rol
l O
vers
A
djus
t-m
ents
To
tal
Ava
ilabl
e A
ctua
l Tr
ansf
er
% o
f A
vaila
ble
fund
s Tr
ansf
erre
d
Fina
l A
ppro
pria
tion
R'0
00
R'0
00
R'0
00
R'0
00
R'0
00
%
R'0
00
Tran
sfer
s
Bur
sarie
s
33 8
68
- -
33 8
68
29 0
52
86%
43
339
Le
ave
Gra
tuity
-
- -
- 30
154
- D
onat
ions
and
Gift
s
4 50
0 -
- 4
500
485
11%
20
0 C
laim
s ag
ains
t the
sta
te
- -
- -
1 19
1
- In
jury
on
duty
-
- -
- 46
-
TO
TAL
38 3
68
- -
38 3
68
60 9
28
43
539
DEP
AR
TMEN
T O
F ED
UC
ATI
ON
VO
TE 4
AN
NEX
UR
ES T
O T
HE
AN
NU
AL
FIN
AN
CIA
L ST
ATE
MEN
TS
for t
he y
ear e
nded
31
Mar
ch 2
019
- 241
-
ANN
EXU
RE
1D
STAT
EMEN
T O
F G
IFTS
, DO
NAT
ION
S AN
D S
PON
SOR
SHIP
S R
ECEI
VED
N
AME
OF
OR
GA
NIS
ATIO
N
NAT
UR
E O
F G
IFT,
DO
NA
TIO
N O
R S
PON
SOR
SHIP
2018
/19
2017
/18
R’0
00
R’0
00
Rec
eive
d in
cas
h
Glo
bele
q D
evel
opm
ent F
und
- De
Aar S
olar
R
eadi
ng C
oach
pro
gram
, EC
D p
ract
ition
er tr
aini
ng &
Sch
olar
ship
s 1
719
504
Glo
bele
q D
evel
opm
ent F
und
- D
roog
font
ein
Sola
r R
eadi
ng C
oach
pro
gram
, EC
D p
ract
ition
er tr
aini
ng &
Sch
olar
ship
s 1
889
118
Roo
ipoo
rt D
evel
opm
ent (
Pty
) Ltd
Li
tera
cy p
roje
ct
900
1 35
0 Sh
ishe
n Iro
n O
re M
ine
Com
pany
EC
D p
ract
ition
ers
639
-
TO
TAL
5
147
1 97
2

241
DEP
AR
TMEN
T O
F ED
UC
ATI
ON
VO
TE 4
AN
NEX
UR
ES T
O T
HE
AN
NU
AL
FIN
AN
CIA
L ST
ATE
MEN
TS
for t
he y
ear e
nded
31
Mar
ch 2
019
- 241
-
ANN
EXU
RE
1D
STAT
EMEN
T O
F G
IFTS
, DO
NAT
ION
S AN
D S
PON
SOR
SHIP
S R
ECEI
VED
N
AME
OF
OR
GA
NIS
ATIO
N
NAT
UR
E O
F G
IFT,
DO
NA
TIO
N O
R S
PON
SOR
SHIP
2018
/19
2017
/18
R’0
00
R’0
00
Rec
eive
d in
cas
h
Glo
bele
q D
evel
opm
ent F
und
- De
Aar S
olar
R
eadi
ng C
oach
pro
gram
, EC
D p
ract
ition
er tr
aini
ng &
Sch
olar
ship
s 1
719
504
Glo
bele
q D
evel
opm
ent F
und
- D
roog
font
ein
Sola
r R
eadi
ng C
oach
pro
gram
, EC
D p
ract
ition
er tr
aini
ng &
Sch
olar
ship
s 1
889
118
Roo
ipoo
rt D
evel
opm
ent (
Pty
) Ltd
Li
tera
cy p
roje
ct
900
1 35
0 Sh
ishe
n Iro
n O
re M
ine
Com
pany
EC
D p
ract
ition
ers
639
-
TO
TAL
5
147
1 97
2

242
DEP
AR
TMEN
T O
F ED
UC
ATI
ON
VO
TE 4
AN
NEX
UR
ES T
O T
HE
AN
NU
AL
FIN
AN
CIA
L ST
ATE
MEN
TS
for t
he y
ear e
nded
31
Mar
ch 2
019
- 242
-
ANN
EXU
RE
2A
STAT
EMEN
T O
F FI
NAN
CIA
L G
UAR
ANTE
ES IS
SUED
AS
AT 3
1 M
ARC
H 2
019
– LO
CAL
G
uara
ntor
in
stitu
tion
Gua
rant
ee in
re
spec
t of
Orig
inal
gu
aran
teed
ca
pita
l am
ount
Ope
ning
ba
lanc
e 1
Apr
il 20
18
Gua
rant
ees
draw
do
wns
du
ring
the
year
Gua
rant
ees
repa
ymen
ts/
canc
elle
d/
redu
ced
durin
g th
e ye
ar
Rev
alua
tion
due
to
fore
ign
curr
ency
m
ovem
ents
Clo
sing
ba
lanc
e 31
Mar
ch
2019
Rev
alua
tions
du
e to
in
flatio
n ra
te
mov
emen
ts
Acc
rued
gu
aran
teed
in
tere
st fo
r ye
ar e
nded
31
Mar
ch
2019
R
’000
R
’000
R
’000
R
’000
R
’000
R
’000
R
’000
R
’000
FI
RST
RAN
D
BAN
K
Hou
sing
86
70
16
-
- 86
NED
BAN
K LI
MIT
ED
Hou
sing
21
43
-
22
- 21
OLD
MU
T (N
EDB/
P)
Hou
sing
23
23
-
- -
23
STAN
DA
RD
BA
NK
H
ousi
ng
182
182
- -
- 18
2
GR
EEN
STAR
T H
ousi
ng
36
36
36
PE
OPL
ES B
AN
K
Hou
sing
5
5 -
- -
5
TOTA
L 35
3 35
9 16
22
-
353
DEP
AR
TMEN
T O
F ED
UC
ATI
ON
VO
TE 4
AN
NEX
UR
ES T
O T
HE
AN
NU
AL
FIN
AN
CIA
L ST
ATE
MEN
TS
for t
he y
ear e
nded
31
Mar
ch 2
019
- 243
-
ANN
EXU
RE
2B
STAT
EMEN
T O
F C
ON
TIN
GEN
T LI
ABIL
ITIE
S A
S AT
31
MAR
CH
201
9 N
atur
e of
Lia
bilit
y
Ope
ning
B
alan
ce
Liab
ilitie
s in
curr
ed
durin
g th
e ye
ar
Liab
ilitie
s pa
id/c
ance
lled
/redu
ced
durin
g th
e ye
ar
Liab
ilitie
s re
cove
rabl
e (P
rovi
de
deta
ils
here
unde
r)
Clo
sing
B
alan
ce
1 A
pril
2018
31
Mar
ch
2019
R
’000
R
’000
R
’000
R
’000
R
’000
C
laim
s ag
ains
t the
dep
artm
ent
1.
AYT
ON
OBO
T C
UR
TLE
Y
1 01
1 1
323
- -
2 33
4 2.
EU
GEN
E B
ARN
ARD
1
651
2 16
3 -
- 3
814
3. M
R &
MR
S S
IAS
29
4 46
-
- 34
0 4.
S L
UBI
SI
471
42
- -
513
5. M
J E
KST
EEN
2
592
246
- -
2 83
8 6.
WIL
LEM
LIN
KS O
BO M
ICH
AEL
LIN
KS
2
350
- -
- 2
350
7. R
OU
LEN
E AF
RIK
A
35 4
59
6 07
5 -
- 41
534
8.
WIN
STO
N M
OAK
HU
ANE
1
255
113
- -
1 36
8 9.
VN
SIK
ON
DW
ANA
19
1 -
191
- -
10. K
WIN
ANA
& A
SSO
CIA
TES
57
2 74
8 -
- 1
320
11. C
ON
RAD
CH
AR
LES
STA
RR
27
2
- -
29
12. S
ESA
DAN
IELS
KUIL
11
-
11
- -
13. K
EOLE
BOG
ILE
CO
NS
OR
TIU
M P
TY L
TD
664
70
- -
734
14. S
GR
IQU
A O
BO M
J G
RIQ
UA
6
705
- 6
705
- -
15. R
N M
C G
ALTY
1
403
218
- -
1 62
1 16
. CEC
ELIA
ZU
LU
269
28
- -
297
17. A
MAN
DA
LOO
TS
732
76
- -
808
18. M
ASE
GEL
A &
MO
RE
MI O
BO K
EITU
MET
SE
624
- -
- 62
4 19
. LEN
GA
22
3 -
- -
223
20. M
OTH
EO, I
T 1
923
- -
- 1
923
21. F
M C
RO
NJE
19
6 31
-
- 22
7

243
DEP
AR
TMEN
T O
F ED
UC
ATI
ON
VO
TE 4
AN
NEX
UR
ES T
O T
HE
AN
NU
AL
FIN
AN
CIA
L ST
ATE
MEN
TS
for t
he y
ear e
nded
31
Mar
ch 2
019
- 243
-
ANN
EXU
RE
2B
STAT
EMEN
T O
F C
ON
TIN
GEN
T LI
ABIL
ITIE
S A
S AT
31
MAR
CH
201
9 N
atur
e of
Lia
bilit
y
Ope
ning
B
alan
ce
Liab
ilitie
s in
curr
ed
durin
g th
e ye
ar
Liab
ilitie
s pa
id/c
ance
lled
/redu
ced
durin
g th
e ye
ar
Liab
ilitie
s re
cove
rabl
e (P
rovi
de
deta
ils
here
unde
r)
Clo
sing
B
alan
ce
1 A
pril
2018
31
Mar
ch
2019
R
’000
R
’000
R
’000
R
’000
R
’000
C
laim
s ag
ains
t the
dep
artm
ent
1.
AYT
ON
OBO
T C
UR
TLE
Y
1 01
1 1
323
- -
2 33
4 2.
EU
GEN
E B
ARN
ARD
1
651
2 16
3 -
- 3
814
3. M
R &
MR
S S
IAS
29
4 46
-
- 34
0 4.
S L
UBI
SI
471
42
- -
513
5. M
J E
KST
EEN
2
592
246
- -
2 83
8 6.
WIL
LEM
LIN
KS O
BO M
ICH
AEL
LIN
KS
2
350
- -
- 2
350
7. R
OU
LEN
E AF
RIK
A
35 4
59
6 07
5 -
- 41
534
8.
WIN
STO
N M
OAK
HU
ANE
1
255
113
- -
1 36
8 9.
VN
SIK
ON
DW
ANA
19
1 -
191
- -
10. K
WIN
ANA
& A
SSO
CIA
TES
57
2 74
8 -
- 1
320
11. C
ON
RAD
CH
AR
LES
STA
RR
27
2
- -
29
12. S
ESA
DAN
IELS
KUIL
11
-
11
- -
13. K
EOLE
BOG
ILE
CO
NS
OR
TIU
M P
TY L
TD
664
70
- -
734
14. S
GR
IQU
A O
BO M
J G
RIQ
UA
6
705
- 6
705
- -
15. R
N M
C G
ALTY
1
403
218
- -
1 62
1 16
. CEC
ELIA
ZU
LU
269
28
- -
297
17. A
MAN
DA
LOO
TS
732
76
- -
808
18. M
ASE
GEL
A &
MO
RE
MI O
BO K
EITU
MET
SE
624
- -
- 62
4 19
. LEN
GA
22
3 -
- -
223
20. M
OTH
EO, I
T 1
923
- -
- 1
923
21. F
M C
RO
NJE
19
6 31
-
- 22
7

244
DEP
AR
TMEN
T O
F ED
UC
ATI
ON
VO
TE 4
AN
NEX
UR
ES T
O T
HE
AN
NU
AL
FIN
AN
CIA
L ST
ATE
MEN
TS
for t
he y
ear e
nded
31
Mar
ch 2
019
- 244
-
Nat
ure
of L
iabi
lity
Ope
ning
B
alan
ce
Liab
ilitie
s in
curr
ed
durin
g th
e ye
ar
Liab
ilitie
s pa
id/c
ance
lled
/redu
ced
durin
g th
e ye
ar
Liab
ilitie
s re
cove
rabl
e (P
rovi
de
deta
ils
here
unde
r)
Clo
sing
B
alan
ce
1 A
pril
2018
31
Mar
ch
2019
R
’000
R
’000
R
’000
R
’000
R
’000
22
. IS
STE
YN
250
- -
- 25
0 23
. L D
ICH
ABA
47
5
- -
52
24. L
H C
HR
ISTO
PHER
15
4 16
-
- 17
0 25
. BR
IGET
TE R
IET
1 50
0 23
2 -
- 1
732
26. J
ESS
ICA
DU
CKE
T 20
0 27
8 47
8 -
- 27
. IKA
NEN
G
134
- -
- 13
4 28
. C W
OO
D
164
- -
- 16
4 29
. LO
SPER
TAX
I'S
- 38
2 -
- 38
2 30
. RIV
ER C
ITY
INN
-
2 2
- -
31. M
ECW
I OBO
TH
ABIS
O
- 4
050
- -
4 05
0 32
. LO
TTER
ING
-
216
216
- -
33. D
E VO
S
- 21
6 21
6 -
- 34
. GA
LLAN
T -
216
216
- -
35. A
SHLE
Y JA
SPER
-
50
- -
50
36. P
ATR
ICK
TEBO
GO
SE
LEKE
-
3 83
5
3
835
37. N
C F
LEET
(DEP
T O
F R
OAD
S A
ND
PU
BLIC
WO
RKS
) 24
5 -
-
245
38. P
EM
BER
LEY
INVE
STM
ENTS
(PTY
) LTD
98
9 -
- -
989
39. N
ASH
UA
57
132
-
57 1
32
- -
TOTA
L 11
9 43
8 20
679
65
167
-
74 9
50
DEP
AR
TMEN
T O
F ED
UC
ATI
ON
VO
TE 4
AN
NEX
UR
ES T
O T
HE
AN
NU
AL
FIN
AN
CIA
L ST
ATE
MEN
TS
for t
he y
ear e
nded
31
Mar
ch 2
019
- 245
-
ANN
EXU
RE
3 C
LAIM
S R
ECO
VER
ABLE
G
over
nmen
t Ent
ity
Con
firm
ed b
alan
ce
outs
tand
ing
Unc
onfir
med
bal
ance
ou
tsta
ndin
g To
tal
Cas
h in
tran
sit a
t yea
r end
20
18/1
9
31/0
3/20
19
31/0
3/20
18
31/0
3/20
19
31/0
3/20
18
31/0
3/20
19
31/0
3/20
18
Rec
eipt
da
te u
p to
si
x (6
) w
orki
ng
days
afte
r ye
ar e
nd
Am
ount
R
’000
R
’000
R
’000
R
’000
R
’000
R
’000
R’0
00
Dep
artm
ent
Dep
artm
ent o
f Co-
oper
ativ
e G
over
nanc
e -G
P
3 3
- -
3 3
Dep
artm
ent o
f Edu
catio
n - L
P
- 24
60
-
60
24
Dep
artm
ent o
f Edu
catio
n - F
S -
- -
96
- 96
D
epar
tmen
t of E
duca
tion
- NW
40
9 40
9 18
0 14
0 58
9 54
9
D
epar
tmen
t of E
duca
tion
- EC
-
- 75
10
75
10
D
epar
tmen
t of E
duca
tion
- WC
-
- 60
-
60
-
D
epar
tmen
t of H
ighe
r Edu
catio
n -
- 6
642
47
6 64
2 47
D
epar
tmen
t of H
ealth
- N
C
- 13
-
- -
13
Nat
iona
l Dep
artm
ent o
f Hom
e Af
fairs
-
36
- -
- 36
Prov
inci
al T
reas
ury
- NC
-
- 87
-
87
-
Pr
ovin
cial
Tre
asur
y - F
S
- -
43
- 43
-
TOTA
L 41
2 48
5 7
147
293
7 55
9 77
8

245
DEP
AR
TMEN
T O
F ED
UC
ATI
ON
VO
TE 4
AN
NEX
UR
ES T
O T
HE
AN
NU
AL
FIN
AN
CIA
L ST
ATE
MEN
TS
for t
he y
ear e
nded
31
Mar
ch 2
019
- 245
-
ANN
EXU
RE
3 C
LAIM
S R
ECO
VER
ABLE
G
over
nmen
t Ent
ity
Con
firm
ed b
alan
ce
outs
tand
ing
Unc
onfir
med
bal
ance
ou
tsta
ndin
g To
tal
Cas
h in
tran
sit a
t yea
r end
20
18/1
9
31/0
3/20
19
31/0
3/20
18
31/0
3/20
19
31/0
3/20
18
31/0
3/20
19
31/0
3/20
18
Rec
eipt
da
te u
p to
si
x (6
) w
orki
ng
days
afte
r ye
ar e
nd
Am
ount
R
’000
R
’000
R
’000
R
’000
R
’000
R
’000
R’0
00
Dep
artm
ent
Dep
artm
ent o
f Co-
oper
ativ
e G
over
nanc
e -G
P
3 3
- -
3 3
Dep
artm
ent o
f Edu
catio
n - L
P
- 24
60
-
60
24
Dep
artm
ent o
f Edu
catio
n - F
S -
- -
96
- 96
D
epar
tmen
t of E
duca
tion
- NW
40
9 40
9 18
0 14
0 58
9 54
9
D
epar
tmen
t of E
duca
tion
- EC
-
- 75
10
75
10
D
epar
tmen
t of E
duca
tion
- WC
-
- 60
-
60
-
D
epar
tmen
t of H
ighe
r Edu
catio
n -
- 6
642
47
6 64
2 47
D
epar
tmen
t of H
ealth
- N
C
- 13
-
- -
13
Nat
iona
l Dep
artm
ent o
f Hom
e Af
fairs
-
36
- -
- 36
Prov
inci
al T
reas
ury
- NC
-
- 87
-
87
-
Pr
ovin
cial
Tre
asur
y - F
S
- -
43
- 43
-
TOTA
L 41
2 48
5 7
147
293
7 55
9 77
8

246
DEP
AR
TMEN
T O
F ED
UC
ATI
ON
VO
TE
A
NN
EXU
RES
TO
TH
E A
NN
UA
L FI
NA
NC
IAL
STA
TEM
ENTS
fo
r the
yea
r end
ed 3
1 M
arch
201
9
- 2
46 -
ANN
EXU
RE
4 IN
TER
-GO
VER
NM
ENT
PAYA
BLE
S G
OVE
RN
MEN
T EN
TITY
Con
firm
ed b
alan
ce
outs
tand
ing
Unc
onfir
med
bal
ance
ou
tsta
ndin
g TO
TAL
Cas
h in
tran
sit a
t yea
r end
20
18/1
9
31/0
3/20
19
31/0
3/20
18
31/0
3/20
19
31/0
3/20
18
31/0
3/20
19
31/0
3/20
18
Paym
ent
date
up
to
six
(6)
wor
king
da
ys b
efor
e ye
ar e
nd
Am
ount
R
’000
R
’000
R
’000
R
’000
R
’000
R
’000
R’0
00
DEP
AR
TMEN
TS
Sout
h Af
rican
Pol
ice
Ser
vice
s -
- -
31
- 31
-
- D
epar
tmen
t of E
duca
tion
- NW
-
- 46
46
46
46
-
- O
ffice
of t
he P
rem
ier -
NC
-
- 73
4 72
6 73
4 72
6 -
- D
epar
tmen
t of J
ustic
e an
d C
onst
itutio
nal D
evel
opm
ent
- 31
0 -
1 -
311
- -
Dep
t. of
Tra
nspo
rt, S
afet
y &
Liai
son
– N
C
33
- -
- 33
-
- -
TOTA
L 33
31
0 78
0 80
4 81
3 1
114
- -

247
DEP
AR
TMEN
T O
F ED
UC
ATI
ON
VO
TE
A
NN
EXU
RES
TO
TH
E A
NN
UA
L FI
NA
NC
IAL
STA
TEM
ENTS
fo
r the
yea
r end
ed 3
1 M
arch
201
9
- 2
47 -
AN
NEX
UR
E 5
INVE
NTO
RIE
S
Inve
ntor
ies
N
ote
Qua
ntity
20
18/1
9 Q
uant
ity
2017
/18
R’0
00
R
’000
O
peni
ng b
alan
ce
12
095
1
343
16
282
1
782
Add/
(Les
s): A
djus
tmen
ts to
prio
r yea
r bal
ance
-
-
Add:
Add
ition
s/P
urch
ases
– C
ash
133
268
61
397
72
545
69
794
Ad
d: A
dditi
ons
- Non
-cas
h
-
-
(Les
s): D
ispo
sals
-
-
(Les
s): I
ssue
s
(2
50
997)
(70
457)
(1
70 8
19)
(73
215)
Add/
(Les
s): R
ecei
ved
curr
ent,
not p
aid
(Pai
d cu
rren
t yea
r, re
ceiv
ed p
rior y
ear)
1
05 6
34
7 7
17
94 0
87
2 98
2 Ad
d/(L
ess)
: Adj
ustm
ents
-
-
Clo
sing
bal
ance
- -
12 0
95
1 34
3
Incl
uded
in th
e in
vent
ory
is s
choo
l fur
nitu
re a
nd e
quip
men
t pro
cure
d an
d di
strib
uted
dire
ctly
to s
choo
ls i.
e. E
CD
out
door
equ
ipm
ent,
scho
ol fu
rnitu
re, t
able
s an
d ch
airs
. Th
e qu
antit
y di
sclo
sed
abov
e co
nsis
t of t
extb
ooks
pro
cure
d an
d is
sued
.

248
DEPARTMENT OF EDUCATION VOTE
ANNEXURES TO THE ANNUAL FINANCIAL STATEMENTS
for the year ended 31 March 2019
- 248 -
ANNEXURE 6 MOVEMENT IN CAPITAL WORK IN PROGRESS
MOVEMENT IN CAPITAL WORK IN PROGRESS FOR THE YEAR ENDED 31 MARCH 2019
Opening balance
Current Year
Capital WIP
Ready for use (Asset register) / Contract
terminated Closing balance
R’000 R’000 R’000 R’000 MACHINERY AND EQUIPMENT - 20 936 - 20 936 Other machinery and equipment - 20 936 - 20 936 BUILDINGS AND OTHER FIXED STRUCTURES 509 677 328 475 (42 723) 795 429 Dwellings - - - - Non-residential buildings 509 677 328 475 (42 723) 795 429 Other fixed structures - - - - TOTAL 509 677 349 411 (42 723) 816 365
MOVEMENT IN CAPITAL WORK IN PROGRESS FOR THE YEAR ENDED 31 MARCH 2018
Opening balance
Prior period error
Current Year
Capital WIP
Ready for use (Asset register) / Contract
terminated Closing balance
R’000 R’000 R’000 R’000 R’000 MACHINERY AND EQUIPMENT 6 174 - - (6 174) - Other machinery and equipment 6 174 - - (6 174) - BUILDINGS AND OTHER FIXED STRUCTURES 259 937 - 417 119 (167 379) 509 677
Dwellings - - - - - Non-residential buildings 259 937 - 417 119 (167 379) 509 677 Other fixed structures - - - - - TOTAL 266 111 - 417 119 (173 553) 509 677
DEPARTMENT OF EDUCATION VOTE 4
ANNUAL FINANCIAL STATEMENTS for the year ended 31 March 2019
- 249 -
ANNEXURE 7 INTER-ENTITY ADVANCES RECEIVED (note 21 AND note 22)
ENTITY
Confirmed balance outstanding
Unconfirmed balance outstanding TOTAL
31/03/2019 31/03/2018 31/03/2019 31/03/2018 31/03/2019 31/03/2018 R’000 R’000 R’000 R’000 R’000 R’000
OTHER ENTITIES Current Globeleq De-Aar Solar - Practitioners 49 34 - - 49 34
Globeleq De-Aar Solar - Literacy 377 105 - - 377 105
Globeleq De-Aar Solar - Scholarships 139 - - - 139 -
Globeleq Droog Solar - Practitioners 184 56 - - 184 56
Globeleq Droog Solar - Literacy 388 115 - - 388 115
Globeleq Droog Solar - Scholarships 65 - - - 65 -
Literacy Rooipoort 330 190 - - 330 190 SAASTA 64 64 - - 64 64 SIOC 250 - - - 250 - TOTAL 1 846 564 - - 1 846 564 Current 1 846 564 - - 1 846 564 Non-current - - - - - -

249
DEPARTMENT OF EDUCATION VOTE
ANNEXURES TO THE ANNUAL FINANCIAL STATEMENTS
for the year ended 31 March 2019
- 248 -
ANNEXURE 6 MOVEMENT IN CAPITAL WORK IN PROGRESS
MOVEMENT IN CAPITAL WORK IN PROGRESS FOR THE YEAR ENDED 31 MARCH 2019
Opening balance
Current Year
Capital WIP
Ready for use (Asset register) / Contract
terminated Closing balance
R’000 R’000 R’000 R’000 MACHINERY AND EQUIPMENT - 20 936 - 20 936 Other machinery and equipment - 20 936 - 20 936 BUILDINGS AND OTHER FIXED STRUCTURES 509 677 328 475 (42 723) 795 429 Dwellings - - - - Non-residential buildings 509 677 328 475 (42 723) 795 429 Other fixed structures - - - - TOTAL 509 677 349 411 (42 723) 816 365
MOVEMENT IN CAPITAL WORK IN PROGRESS FOR THE YEAR ENDED 31 MARCH 2018
Opening balance
Prior period error
Current Year
Capital WIP
Ready for use (Asset register) / Contract
terminated Closing balance
R’000 R’000 R’000 R’000 R’000 MACHINERY AND EQUIPMENT 6 174 - - (6 174) - Other machinery and equipment 6 174 - - (6 174) - BUILDINGS AND OTHER FIXED STRUCTURES 259 937 - 417 119 (167 379) 509 677
Dwellings - - - - - Non-residential buildings 259 937 - 417 119 (167 379) 509 677 Other fixed structures - - - - - TOTAL 266 111 - 417 119 (173 553) 509 677
DEPARTMENT OF EDUCATION VOTE 4
ANNUAL FINANCIAL STATEMENTS for the year ended 31 March 2019
- 249 -
ANNEXURE 7 INTER-ENTITY ADVANCES RECEIVED (note 21 AND note 22)
ENTITY
Confirmed balance outstanding
Unconfirmed balance outstanding TOTAL
31/03/2019 31/03/2018 31/03/2019 31/03/2018 31/03/2019 31/03/2018 R’000 R’000 R’000 R’000 R’000 R’000
OTHER ENTITIES Current Globeleq De-Aar Solar - Practitioners 49 34 - - 49 34
Globeleq De-Aar Solar - Literacy 377 105 - - 377 105
Globeleq De-Aar Solar - Scholarships 139 - - - 139 -
Globeleq Droog Solar - Practitioners 184 56 - - 184 56
Globeleq Droog Solar - Literacy 388 115 - - 388 115
Globeleq Droog Solar - Scholarships 65 - - - 65 -
Literacy Rooipoort 330 190 - - 330 190 SAASTA 64 64 - - 64 64 SIOC 250 - - - 250 - TOTAL 1 846 564 - - 1 846 564 Current 1 846 564 - - 1 846 564 Non-current - - - - - -

2018
/19
Ann
ual R
epor
t
2018
/19
Ann
ual R
epor
t2018
/19
Ann
ual R
epor
t201
8/19
A
nnua
l Rep
ort
Printed by SwiftPrint, Kimberley. Tel: 053 8392900