2019-02-21 - axa - fy18 earnings presentation · 1 billion wechat users in china 140 million...
TRANSCRIPT

FY18 EarningsFebruary 21, 2019

IMPORTANT LEGAL INFORMATION AND CAUTIONARY STATEMENTS CONCERNING FORWARD-LOOKING STATEMENTS AND THE USE OF NON-GAAP FINANCIAL MEASURES
Certain statements contained herein may be forward-looking statements including, but not limited to, statements that are predictions of or indicate future events, trends, plans, expectations or
objectives. Undue reliance should not be placed on such statements because, by their nature, they are subject to known and unknown risks and uncertainties and can beaffected by other factors that
could cause AXA’s actual results to differ materially from those expressed or implied in such forward-looking statements. Please refer to Part 4 - “Risk factors and Risk Management” of AXA’s
Registration Document for the year ended December 31, 2017, for a description of certain important factors, risks and uncertainties that may affect AXA’s business and/or results of operations. AXA
undertakes no obligation to publicly update or revise any of these forward-looking statements, whether to reflect new information, future events or circumstances or otherwise, except as required by
applicable laws and regulations.
In addition, this presentation refers to certain non-GAAP financial measures, or alternative performance measures (APMs), used by Management in analyzing AXA’s operating trends, financial
performance and financial position and providing investors with additional information that Management believes to be useful and relevant regarding AXA’s results. These non-GAAP financial
measures generally have no standardized meaning and therefore may not be comparable to similarly labelled measures used by other companies. As a result, none of these non-GAAP financial
measures should be considered in isolation from, or as a substitute for, theGroup’s consolidated financial statements and related notes prepared in accordance with IFRS. A reconciliation fromAPMs
Adjusted Earnings and Underlying Earnings to the most directly reconcilable line it em, subtotal or total in the financial statements of the corresponding period is provided on pages 28 to 29 of AXA’s
2018 Activity Report, which is available on AXA’s website (www.axa.com).APMs Adjusted Return on Equity and Underlying Earnings per share are reconciled to the financial statements in the table set
forth on page 37 of AXA’s 2018 Activity Report, and Debt Gearing is reconciled to thefinancial statements in the table set forth on page 36 of AXA’s 2018 Activity Report. The abovementioned and other
non-GAAP financial measures used in this presentation,are defined in the glossary set forth in AXA’s 2018 Activity Report (pp. 78-85).
The results of our US segment are presented herein on the basis of IFRS and are not, and should not be relied upon as representing, the US GAAP results of AXA Equitable Holdings, Inc. (including
AllianceBernstein), which, as a US public company, reports in US GAAP in accordance with the rules of the US Securities and Exchange Commission (“SEC”). For further information on AEH’s financial
results and other public reports please consultthe SECwebsite at www.sec.gov.
A2 Full Year 2018 Earnings | February 21, 2019
Table of contents
A3 Full Year 2018 Earnings | February 21, 2019
1. Introduction & highlights A.04 Thomas Buberl, Group CEO
2. FY18 Business performance A.13Gérald Harlin, Deputy CEO & Group CFO
3. FY18 Financial performance A.22Gérald Harlin, Deputy CEO & Group CFO
4. Concluding remarks A.38Thomas Buberl, Group CEO

FY18 EarningsFebruary 21, 2019
1Introduction & highlights
Thomas Buberl, Group CEO

Key highlights – FY2018
A5 Full Year 2018 Earnings | February 21, 2019
Excellent year of operational performance
XL integration progressing well
High natural catastrophes at AXA XL in Q4
Strong dividend growth
Back to agenda
▶
▶
▶
▶
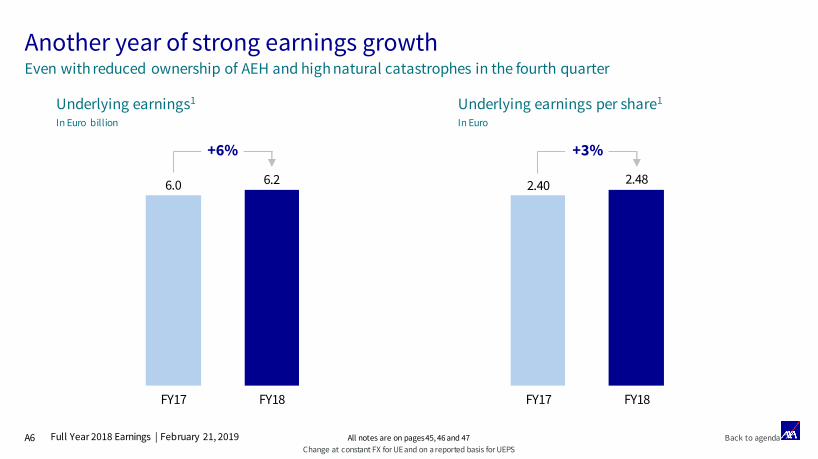
Another year of strong earnings growth
Underlying earnings1
In Euro billion
A6 Full Year 2018 Earnings | February 21, 2019
FY17 FY18
6.0 6.2
+6%
Underlying earnings per share1
In Euro
2.40 2.48
FY17 FY18
+3%
Back to agenda
Change at constant FX for UE and on a reported basis for UEPS
All notes are on pages 45, 46 and 47
Even with reduced ownership of AEH and high natural catastrophes in the fourth quarter

Attractive dividend growth
A7 Full Year 2018 Earnings | February 21, 2019
Dividend per shareIn Euro
1.261.34
FY17 FY18
+6%
Payout ratio2
2.59 2.61
FY17 FY18
+1%
49% 52%
Change at constant FX for AE and on a reported basis for AEPS and DPS
Adjusted earnings per shareIn Euro
Adjusted earnings1
+3%
Back to agendaAll notes are on pages 45, 46 and 47
A8 Full Year 2018 Earnings | February 21, 2019
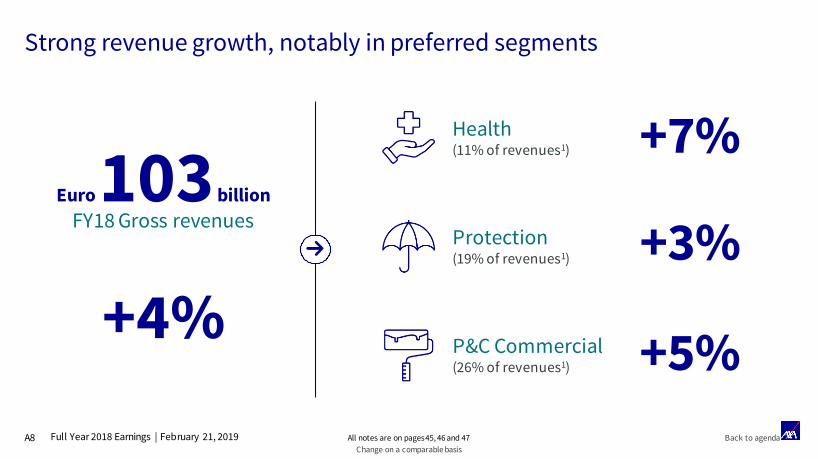
Strong revenue growth, notably in preferred segments
+5%
+3%
P&C Commercial(26% of revenues1)
Health(11% of revenues1)
Protection(19% of revenues1)
+7%Euro 103billion
FY18 Gross revenues
+4%
Change on a comparable basis
Back to agendaAll notes are on pages 45, 46 and 47
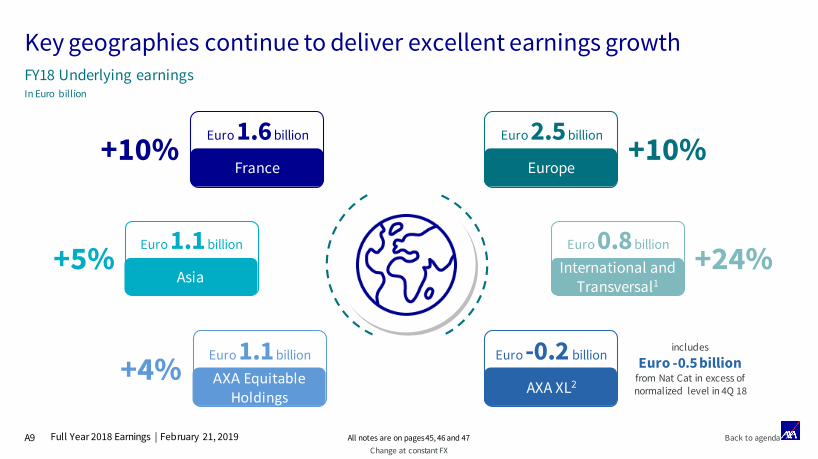
Key geographies continue to deliver excellent earnings growth
A9 Full Year 2018 Earnings | February 21, 2019
FY18 Underlying earningsIn Euro billion
Change at constant FX
+10%France
Euro 1.6billion
+5%Asia
Euro 1.1billion
+10%Europe
Euro 2.5billion
+24%International and Transversal1
Euro 0.8billion
+4% AXA Equitable Holdings
Euro 1.1billion
AXA XL2
Euro -0.2 billion
Back to agendaAll notes are on pages 45, 46 and 47
includes
Euro -0.5 billionfrom Nat Cat in excess of normalized level in 4Q 18

AXA XL – Fast progress on integration and good business momentum
A10 Full Year 2018 Earnings | February 21, 2019
Supportive business momentumEarnings enhancement levers underway
▶ 10% revenues growth in 2018, with rate increase leading the market
▶ Renewals rates outlook positive
▶ On going portfolio optimization
▶ AXA XL upgraded to AA-/stable
▶ Superior client recognition
Euro 1.4 billion
AXA XL underlying earnings by 2020 assuming normalized Nat Cat (4% of GEP)
J.D. Power 2016, 2017 & 20181
Reaffirmed
✓ Integrated reinsurance program in placefor 2019, aligned with AXA Group risk appetite
✓ Commercial approach in place for AXA XL and local entities in each country to deliver revenue synergies
✓ Initial expense synergies achieved and progressing well towards the target
✓ Asset allocation alignedto enhance investment income
Back to agendaAll notes are on pages 45, 46 and 47

Scaling up on Payer to Partner innovations
A11 Full Year 2018 Earnings | February 21, 2019
Medical teleconsultation and services In-App travel insurance products and services
▶ Fully digital healthcare solution now live in France and available in other countries for French expatriates
▶ Increase in usage driven by change in French regulation (reimbursements by social security are now possible)
– Teleconsultation
– Virtual clinic accessible on any mobile device
– Comprehensive care
– Prevention
– Value added services
(Pharmacy delivery)
– In-app purchases linked to travel plans and visa applications
– One-click access to assistance and safety information
– In-app claims settlement and payment in WeChat Pay wallet
+40% consultationsin Jan 2019
430 Physicians using the platform
99% Repeat usage rate
Back to agenda
A Kamet venture incubated in 2016
1 billion WeChat users in China
140million outbound Chinese travelers (+16% vs 2017)
AXA Tian Ping
Launched in 2019
A12 Full Year 2018 Earnings | February 21, 2019
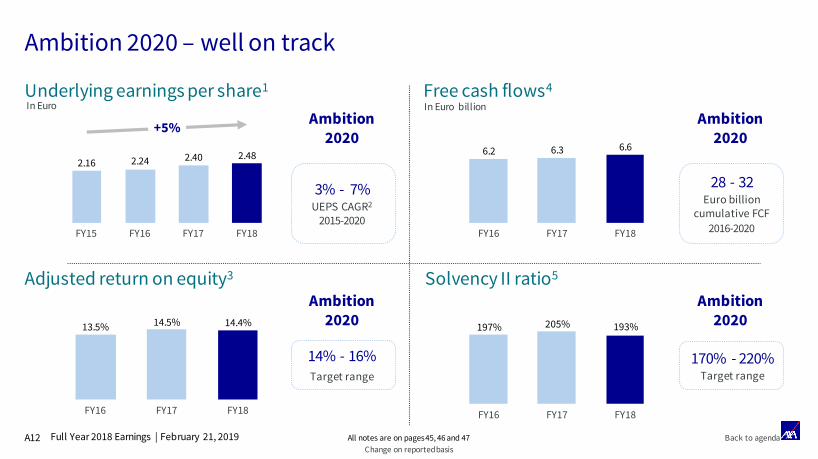
Ambition 2020 – well on track
Underlying earnings per share1
Adjusted return on equity3 Solvency II ratio5
13.5% 14.5% 14.4%
FY16 FY17 FY18
197% 205%
FY16 FY17
193%
FY18
170% - 220%Target range
Ambition 2020
Ambition 2020
3% - 7% UEPS CAGR2
2015-2020
Ambition 2020
Ambition 2020
28 - 32Euro billion
cumulative FCF
2016-2020
6.2 6.3 6.6
FY16 FY17 FY18
14% - 16%Target range
In Euro In Euro billion
2.16 2.24 2.40 2.48
FY15 FY16 FY17 FY18
+5%
Free cash flows4
Change on reported basis
Back to agendaAll notes are on pages 45, 46 and 47

FY18 EarningsFebruary 21, 2019
FY18 Business performanceGérald Harlin, Deputy CEO & Group CFO
2

A14 Full Year 2018 Earnings | February 21, 2019
Underlying earnings
Underlying earnings by geography
6,002 6,182
FY17 FY18
+6%
Underlying earnings
In Euro million
Change at constant FX
Geographical scope details are on page 44
FY17 FY18 Change
France 1,429 1,573 +10%
Europe 2,326 2,532 +10%
Asia 1,089 1,101 +5%
AXA XL 70 -233 -
United States 1,135 1,125 +4%
International 337 400 +28%
Transversal 323 384 +20%
Central Holdings -706 -701 +1%
Underlying earnings 6,002 6,182 +6%
Back to agenda
A15 Full Year 2018 Earnings | February 21, 2019
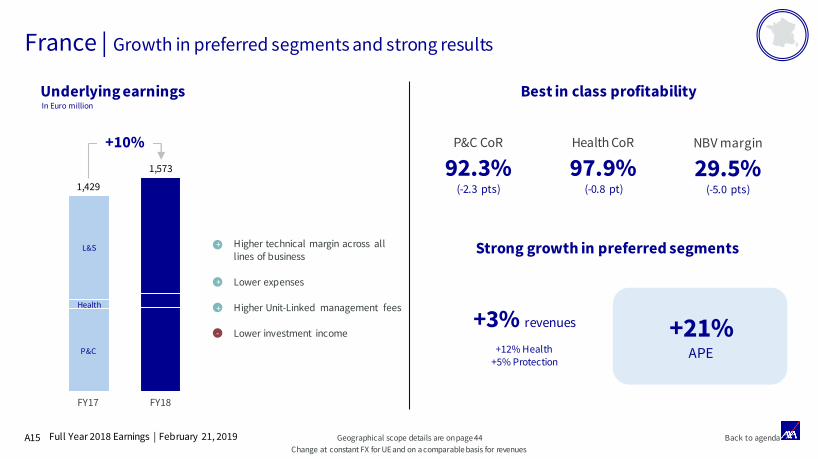
France | Growth in preferred segments and strong results
L&S
FY18FY17
Health
P&C
1,429
1,573
+10%
Best in class profitability
Strong growth in preferred segments
NBV margin
29.5%(-5.0 pts)
Health CoR
97.9%(-0.8 pt)
P&C CoR
92.3% (-2.3 pts)
+3% revenues
+12% Health+5% Protection
In Euro million
Underlying earnings
Change at constant FX for UE and on a comparable basis for revenues
Higher technical margin across all lines of business
Lower expenses
Higher Unit-Linked management fees
Lower investment income
+
+
+
-
Geographical scope details are on page 44
+21%APE
Back to agenda

A16 Full Year 2018 Earnings | February 21, 2019
Europe | Growth and profitability from disciplined execution
Highly profitable business
NBV margin
49.6%(-3.6 pts)
Health CoR
94.8%(-1.3 pts)
P&C CoR
94.5% (-0.1 pt)
Change at constant FX for UE and on a comparable basis for revenues
Higher technical margin notably in Switzerland (Life), UK & Ireland (Health), Germany and Spain (P&C)
Lower corporate tax rates in Switzerland and Belgium
Lower investment margin
+
-
+
FY18
Switzerland
Spain
2,532
FY17
Belgium
Italy
UK &
Ireland
Germany
2,326
+10%
In Euro million
Underlying earnings
Strong growth in preferred segments
Geographical scope details are on page 44
+3% +3% P&C Commercial lines
+3% Health
+2% ProtectionTotal revenues
Back to agenda
A17 Full Year 2018 Earnings | February 21, 2019
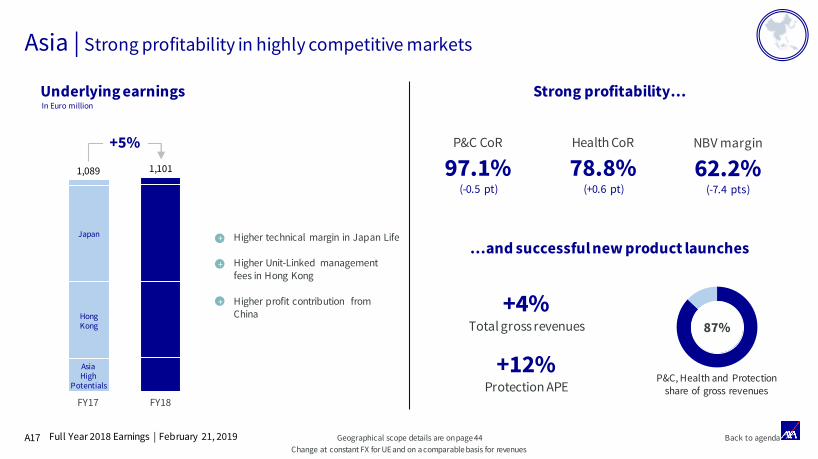
Asia | Strong profitability in highly competitive markets
Strong profitability…
…and successful new product launches
NBV margin
62.2%(-7.4 pts)
Health CoR
78.8%(+0.6 pt)
P&C CoR
97.1% (-0.5 pt)
Change at constant FX for UE and on a comparable basis for revenues
In Euro million
Underlying earnings
AsiaHigh
Potentials
1,101
FY17
HongKong
Japan
FY18
1,089
+5%
+4%Total gross revenues
+12%Protection APE
P&C, Health and Protectionshare of gross revenues
87%
Geographical scope details are on page 44
Higher technical margin in Japan Life
Higher Unit-Linked management fees in Hong Kong
Higher profit contribution from China
+
+
+
Back to agenda

A18 Full Year 2018 Earnings | February 21, 2019
AXA XL | Two major Nat Cats in 4Q 2018, favorable business momentum
Change at constant FX for UE and on a comparable basis for revenues
Geographical scope details and notes are on page 44, 45, 46, and 47 Back to agenda
Strong business growth…
…and favorable pricing momentum
In Euro billion
Underlying earnings
Revenues
+10%
+3% Specialty
+13% P&C Insurance
+16% P&C Reinsurance
+4%Price increase at XL in 2018
January 2019 renewals
Insurance +4%Reinsurance +1.5%
FY18ACSA + Art
-0.5
4Q 18 XL with normalised
Nat Cat1
4Q 18 XLreported
4Q 18 Nat Cat in excess of normalised
level1
0.1
-0.4
FY18AXA XL
0.2
-0.2
Includes Hurricane Michael (Euro -0.3 billion)2
and California Wildfires (Euro -0.3 billion)2
(Includes two large transactions)

A19 Full Year 2018 Earnings | February 21, 2019
United States | Strong operating performance under IFRS
Change at constant FX for UE and on a comparable basis for revenues
FY18
AB
US Life
FY17
1,135 1,125
+4%
+0.9 bpAB management fee bps
Growth in life and savings…
…as well as in asset management
NBV
+4%Euro 0.3 billion
APE
+6%Euro 1.5 billion
Higher Unit-Linked and mutual fund fees (Euro +0.1 billion)
Higher investment margin(Euro +0.1 billion)
Model and assumption changes, partly offset by lower tax one-offs (Euro +0.1 billion)
IPO and Nov 2018 sell-down: reduced average ownership (to 81%) and higher debt expenses(Euro -0.3 billion)
+
+
+
In Euro million
Underlying earnings
-
AB revenues
+5% Euro 2.7 billion
Back to agendaGeographical scope details are on page 44
The results of ou r US segme nt a re present ed here in o n the basis of IF RS an d a re not , and sho uld not b e rel ied u pon as r eprese nting, t he U S GA AP results of AXA E qu itable Hold ings, Inc. (includ ing AllianceBer nstein), w hic h, as a US pu bliccompany, reports in US GAAP in accordance with the rules of the US Securities and Exchange Commission (“SEC”). For further information on AEH’s financial results and other public reports please consult the SEC website at www.sec.gov.
A20 Full Year 2018 Earnings | February 21, 2019
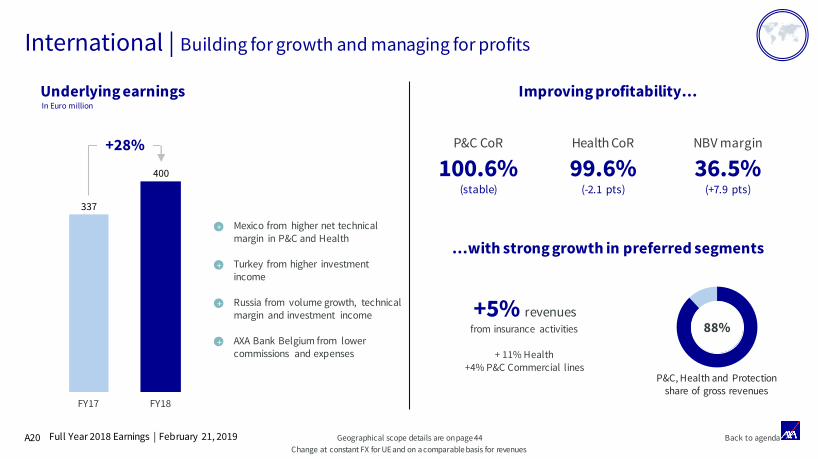
International | Building for growth and managing for profits
+
337
400
FY17 FY18
+28%
Mexico from higher net technical margin in P&C and Health
Turkey from higher investment income
Russia from volume growth, technical margin and investment income
AXA Bank Belgium from lower commissions and expenses
NBV margin
36.5%(+7.9 pts)
Health CoR
99.6%(-2.1 pts)
P&C CoR
100.6% (stable)
…with strong growth in preferred segments
+5% revenuesfrom insurance activities
+ 11% Health+4% P&C Commercial lines
Improving profitability…
P&C, Health and Protectionshare of gross revenues
88%
Change at constant FX for UE and on a comparable basis for revenues
In Euro million
Underlying earnings
+
+
Back to agenda
+
Geographical scope details are on page 44
A21 Full Year 2018 Earnings | February 21, 2019
+
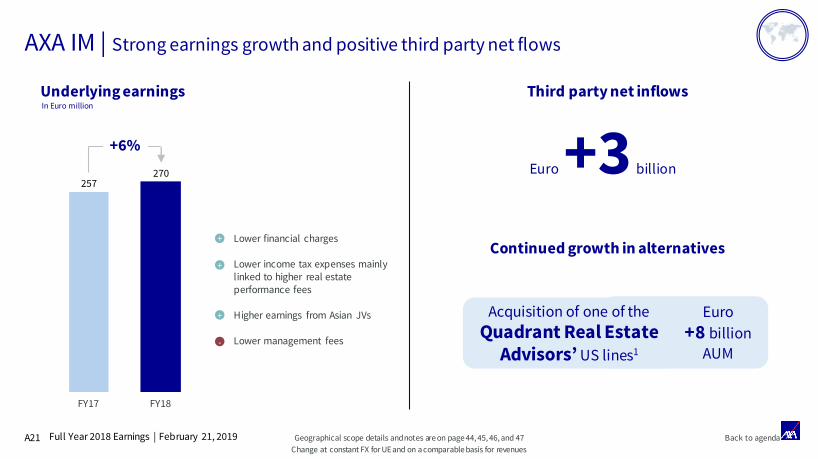
AXA IM | Strong earnings growth and positive third party net flows
+
257270
FY17 FY18
+6%
Lower financial charges
Lower income tax expenses mainly linked to higher real estate performance fees
Higher earnings from Asian JVs
Lower management fees
Continued growth in alternatives
Third party net inflowsIn Euro million
Underlying earnings
+
-
Euro +3 billion
Acquisition of one of the
Quadrant Real Estate Advisors’ US lines1
Euro
+8 billion
AUM
Change at constant FX for UE and on a comparable basis for revenues
Back to agendaGeographical scope details and notes are on page 44, 45, 46, and 47

FY18 EarningsFebruary 21, 2019
FY18 Financial performanceGérald Harlin, Deputy CEO & Group CFO
3

A23 Full Year 2018 Earnings | February 21, 2019
Group earnings
Balance sheet
A24 Full Year 2018 Earnings | February 21, 2019
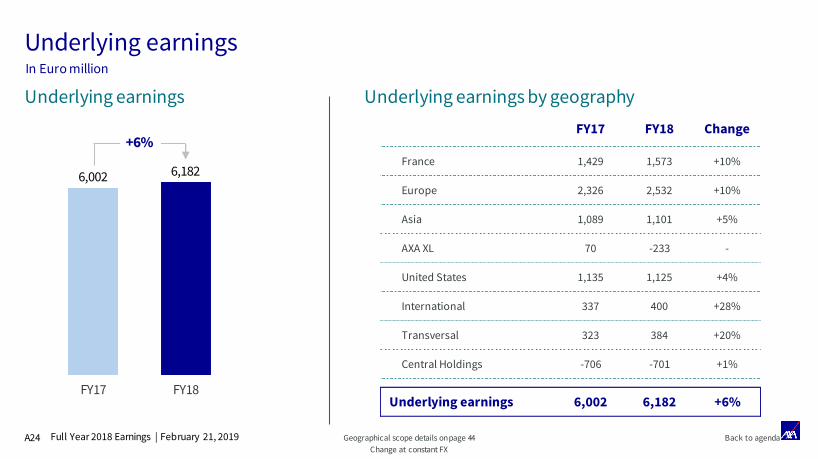
Underlying earningsIn Euro million
Change at constant FX
Geographical scope details on page 44
Underlying earnings by geography
6,002 6,182
FY17 FY18
+6%
Underlying earnings
FY17 FY18 Change
France 1,429 1,573 +10%
Europe 2,326 2,532 +10%
Asia 1,089 1,101 +5%
AXA XL 70 -233 -
United States 1,135 1,125 +4%
International 337 400 +28%
Transversal 323 384 +20%
Central Holdings -706 -701 +1%
Underlying earnings 6,002 6,182 +6%
Back to agenda

A25 Full Year 2018 Earnings | February 21, 2019
Adjusted earnings
Adjusted earnings Details of adjusted earnings
In Euro million
6,457 6,489
FY17 FY18
+3%
Change at constant FX
FY17 FY18
Underlying earnings 6,002 6,182
Net realized capital gains/losses 455 307
o/w realized capital gains 674 841
o/w net impairments -127 -440
o/w hedging of equity portfolio -92 -94
Adjusted earnings 6,457 6,489
Back to agenda

A26 Full Year 2018 Earnings | February 21, 2019
Net income
Net income Details of net income
In Euro million
6,209
2,140
FY17 FY18
All notes are on pages 45, 46 and 47
FY17 FY18
Adjusted earnings 6,457 6,489
Change in fair value and Forex -134 -463
o/w gains/losses on economic hedges1 -357 -137
o/w change in fair value of assets accounted for as fair value option 222 -326
Exceptional and discontinued operations 124 -451
Integration and restructuring costs -148 -332
Intangibles, amortization and other -90 -3,102
Net income 6,209 2,140
Back to agenda
Includes:
– Impairment of AEH goodwill (Euro -3.0 billion)
– Impairment of intangible assets linked to the transformation of our Swiss Group Life business (Euro -428 million)
– Increased exceptional and restructuring costs linked to the US IPO and related transactions (Euro -154 million) and XL acquisition (Euro -76 million)

Improvement in profitability ratios across the board
A27 Full Year 2018 Earnings | February 21, 2019
Current year combined ratio
Prior year reservedevelopments
All-yearcombined ratio+
+
-
2.5% 4.2%
FY17 FY18
97.0%
FY17 FY18 FY17
97.6%
FY18
96.3%
99.1%
-1.2% -2.1%
Natural Catastrophes 1 Prior Year developments
P&C combined ratio – details
Health combined ratio
94.4% (-0.4 pt)
Protection combined ratio
95.6%(-1.3 pts)
Higher natural catastrophes
Higher favorable prior year developments
Change at constant FX
P&C combined ratio
97.0% (+0.8 pt)
Increased guidance
1.5% – 2.5%Prior year reserve releases
full AXA Group scope
Back to agendaAll notes are on pages 45, 46 and 47
AY CoR Excluding XL: 94.9% (-1.2 pts vs. FY17)

Strong reserving ratios supporting increased PYD guidance
A28 Full Year 2018 Earnings | February 21, 2019
P&C reserving ratio1
(Net technical reserve/Net earned premiums)
213%
209%
FY17 FY18
IFRS P&C reserves in excess of S-II BELIn Euro billion
+5.7
+7.1
FY17 FY18
Back to agendaAll notes are on pages 45, 46 and 47
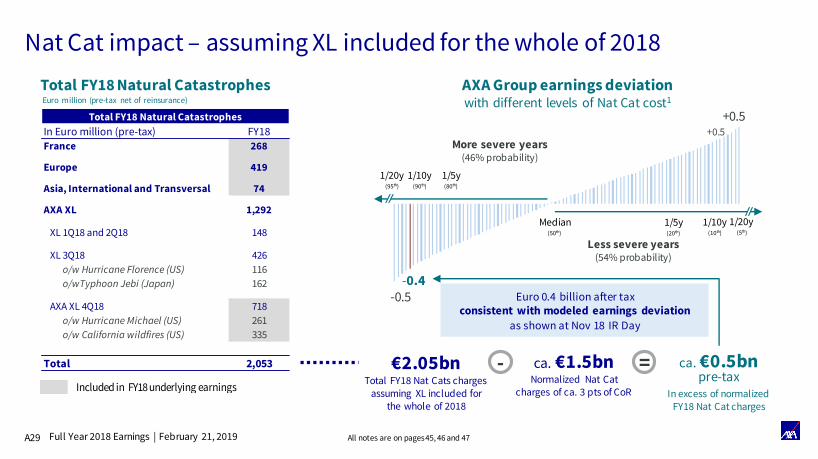
Nat Cat impact – assuming XL included for the whole of 2018
-0.5-0.4
+0.5
+0.5
1/20y(95th)
1/10y(90th)
1/5y(80th)
AXA Group earnings deviation with different levels of Nat Cat cost1
1/20y(5th)
1/10y(10th)
Less severe years(54% probability)
1/5y(20th)
More severe years(46% probability)
Median(50th)
Included in FY18 underlying earnings
ca. €0.5bn pre-tax
In excess of normalized FY18 Nat Cat charges
=€2.05bnTotal FY18 Nat Cats charges
assuming XL included for the whole of 2018
- ca. €1.5bnNormalized Nat Cat
charges of ca. 3 pts of CoR
Euro 0.4 billion after tax consistent with modeled earnings deviation
as shown at Nov 18 IR Day
Total FY18 Natural CatastrophesEuro million (pre-tax net of reinsurance)
Full Year 2018 Earnings | February 21, 2019A29 All notes are on pages 45, 46 and 47
In Euro million (pre-tax) FY18
France 268
Europe 419
Asia, International and Transversal 74
AXA XL 1,292
XL 1Q18 and 2Q18 148
XL 3Q18 426
o/w Hurricane Florence (US) 116
o/wTyphoon Jebi (Japan) 162
AXA XL 4Q18 718
o/w Hurricane Michael (US) 261
o/w California wildfires (US) 335
Total 2,053
Total FY18 Natural Catastrophes

Back to agenda
Integrated reinsurance program for 2019, aligned with risk appetite
Simplified Group Cat reinsurance structure for AXA Group
Bespoke Alternative
Capital
EU Windstorm
NA Hurricane
NA Earthquake
Per other perils1
2.65bn xs 750m
1.0bn xs 750m
1.0bn xs 750m
1.75bn xs 1.45bn
Group Aggregate
All Retention and basis risk
(with €50m deductible)
In Euro
Insurance segment(occurrence protection)
All segments
Alternative Capital &
Cat Bonds
xs 350m
Reinsurance segment(illustrative)
Retention
A30 Full Year 2018 Earnings | February 21, 2019 All notes are on pages 45, 46 and 47

A31 Full Year 2018 Earnings | February 21, 2019
Group earnings
Balance sheet

A32 Full Year 2018 Earnings | February 21, 2019
High quality investment portfolio and resilient yield
Euro
615billion3
FY18 Total General Account invested assets81% in Fixed Income with long duration (7.9 years)
38%Govies & related
34% Corporate bonds
Yields on assets
3.3% 3.1% 3.1%
FY18FY17FY16
3.4% 3.3% 3.2%
FY16 FY17 FY18
L&S4 P&C4
19%Other1
9%Other fixed income2
FY18 New fixed income investments
Euro
70billion
ABS (~7%)
BIG credit (7%)
~57%Investment grade credit (average rating A)~28%
Governmentbonds & related
(average rating AA)
FY18 reinvestment yield
2.1%
3.5%
0.8%
2.1% 2.5%
TotalSwitzerlandEurozone US Japan
Back to agendaAll notes are on pages 45, 46 and 47
A33 Full Year 2018 Earnings | February 21, 2019
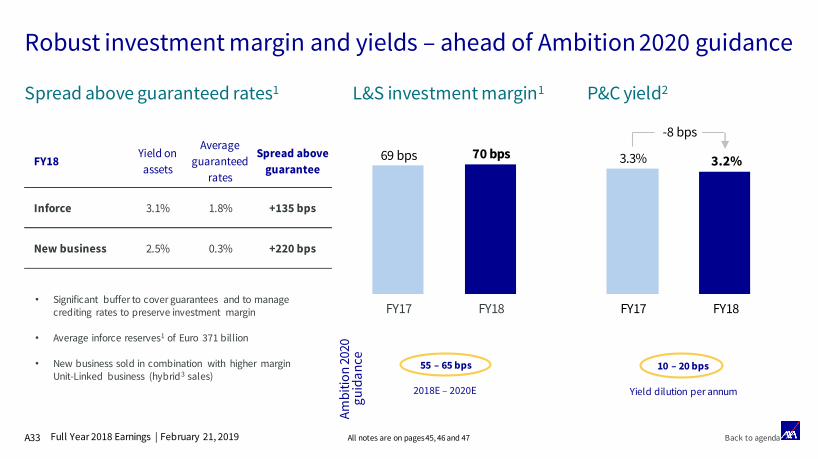
Robust investment margin and yields – ahead of Ambition 2020 guidance
Spread above guaranteed rates1
• Significant buffer to cover guarantees and to manage crediting rates to preserve investment margin
• Average inforce reserves1 of Euro 371 billion
• New business sold in combination with higher margin Unit-Linked business (hybrid3 sales)
L&S investment margin1
69 bps 70 bps
FY17 FY18
P&C yield2
3.3% 3.2%
FY17 FY18
-8 bps
10 – 20 bps
Yield dilution per annum
55 – 65 bps
2018E – 2020E
Am
bit
ion
202
0g
uid
an
ce
FY18Yield on
assets
Average
guaranteed
rates
Spread above
guarantee
Inforce 3.1% 1.8% +135 bps
New business 2.5% 0.3% +220 bps
Back to agendaAll notes are on pages 45, 46 and 47

A34 Full Year 2018 Earnings | February 21, 2019
Shareholders’ equity
69.6
62.4
FY17 FY18
Adjusted ROE
14.5% 14.4%
-
+
+
-
-
In Euro billion
-
+
FY18 vs. FY17
Net income for the period +2.1
Forex and other +0.7
Change in pension benefits +0.6
Subordinated debt (incl. interest charges) -0.9
Impact from AEH IPO and secondary offering* -2.8
Dividends -3.0
Change in net unrealized capital gains -3.9
Back to agenda*This line reflects the impact of the IPO and the secondary offering of our US operations on shareholders’ equity at Group sharewith the removal of 41% of the book value of AXA Equitable Holdings, Inc (AEH) and the addition of the corresponding proceeds.

Strong Solvency II ratio and debt levels within our guidance
A35 Full Year 2018 Earnings | February 21, 2019
Debt gearing2
205%
FY18FY17
193%
Solvency II ratio1
190%
200%
FY18guidance
25%
32%
FY17 FY18
ca. 32%
FY18guidance
170% - 220%Target range
25% - 28%Target range
by 2020
Back to agendaAll notes are on pages 45, 46 and 47

A36 Full Year 2018 Earnings | February 21, 2019
Solvency II ratio
Solvency II ratio1
In Euro billion
Key sensitivities
Solvency II ratio roll-forward
Dividend Subordinated debt, XL acquisition, forex & other
FY17 US IPOOperatingreturn
Market impact excl. forex
FY18
205%
+24 pts
-33 pts
-12 pts -4 pts
+13 pts
193%
Equity markets +25%
Ratio as of December 31, 2018
Interest rate +50bps
Equity markets -25%
Interest rate -50bps
Corporate spreads +50bps
+7 pts
-11 pts
-3 pts
+2 pts
-7 pts
193%
200%
182%
190%
195%
186%
Available capital
Required capital
57.8 58.1
28.2 30.2
FY18FY17
205% 193%
Back to agendaAll notes are on pages 45, 46 and 47

A37 Full Year 2018 Earnings | February 21, 2019
Strong cash flow generation and remittance
Operating free cash flows Cash remitted from entities
6.36.6
4.9
FY17 FY18
88%
In Euro billion
116%
Back to agenda
5.0
2.6
7.6
or76%Remittance ratio
in line with our guidance of 75% - 85%
(excluding Euro 2.6 billion cash linked to the pre-US IPO restructuring operations)

FY18 EarningsFebruary 21, 2019
4Concluding remarks
Thomas Buberl, Group CEO

2018 – A pivotal year in AXA’s transformation journey
A39 Full Year 2018 Earnings | February 21, 2019
Europe
International
France
AEH
Asia
AXA XL
Simplified organization bearing fruit
Key geographies continue to deliver excellent operational performance
Significant transformational leap AXA Equitable Holdings <-> XL Group
Back to agenda

A40 Full Year 2018 Earnings | February 21, 2019
▶ Deleveraging
▶ XL integration
▶ Further sell-downs of AEH
▶ Delivery of Ambition 2020
▶ Accelerate in Asia
▶ Scaling up Payer to Partner innovations
We have clear priorities to create shareholder value
Back to agenda

FY18 EarningsFebruary 21, 2019
Q&A

AXA Investor Relations | Keep in touch
A42 Full Year 2018 Earnings | February 21, 2019
Call us
March 19-20 Morgan Stanley European Financials Conference London
April 2 HSBC West Coast Financials Conference San Francisco
May 2 First Quarter 2019 Activity Indicators Conference Call
May 29 Deutsche Bank Global Financial Services Conference New York
June 7 Goldman Sachs Europeans Financial Services Conference Paris
August 1 Half Year 2019 Earnings Release London
Meet our management
Investor Relations
Andrew Wallace-Barnett
Head of Investor Relations
François BoissinVice President
Aayush Poddar
Vice President
+33 1 40 75 48 42
+33 1 40 75 46 85
+33 1 40 75 39 82
+33 1 40 75 59 17
Corporate AccessLois MarcopoulosHead of Corporate Access
+33 1 40 75 58 95
Follow us www.axa.com

FY18 EarningsFebruary 21, 2019
Thank You

A44 Full Year 2018 Earnings | February 21, 2019
Scope
Note: Following the acquisition of XL Group in 2018, the segment reporting has been revised and retroactively restated in this presentation.
▪ France: includes insurance activities, banking activities and holdings in France.
▪ Europe: includes Belgium (insurance activities and holding), Italy (insurance activities and holding), G ermany (insurance activities excluding AXAArt, including banking activities and holdings), Spain (insurance activities), Switzerland (insurance activities), UK & Ireland (insurance activities and
holdings).
▪ Asia: includes insurance activities in Japan, Hong Kong, Asia - Direct (AXA Global Direct Japan and AXA Global Direct South Kor ea) and Asia HighPotentials of which (i) Thailand P&C, Indonesia L&S (excluding the bancassurance entity) are fully consolidated and (ii) China, Thailand L&S, the
Philippines and Indonesian L&S bancassurance businesses are consolidated under the equity method and contribute only to the underl yingearnings, adjusted earnings and net income, and Asia Holding.
▪ AXA XL: includes insurance activities and holdings of X L Group as acquired on Sept ember 12, 2018 (“XL Group”), AXA Cor porate Solutions Assurance
(insurance activities) and AXA Art (insurance activities).
▪ United States: AXA Equitable Holdings, Inc includes Life & Savings insurance activities and holdings in the US, as well as AB.
▪ Inte rnational: includes (i ) AXA Medit erranean Holdings, Mexico (insurance activities), Singapore (insurance activities), Colombia (insuranceactivities), Turkey (insurance activities and holding), Poland (insurance activities), the Gulf Region (insurance activities and holding), Morocco
(insurance activities and holding), AXA Bank Belgium (banking activities), Malaysia P&C (insurance activities), Lux embourg (insurance activities andholding), Brazil (insurance activities and holding), the Czech Republic Life & Savings (insurance activities), Slovakia Life & Savings (insurance
activities) and Gr eece (insurance activities) which are fully consolidated; (ii) Russia (Reso) (insurance activities), India (insurance activities), Nig eria(insurance activities and holding) and Lebanon (insurance activities and holding) which are consolidated under the equity method and contribute
only to the underlying earnings, adjusted earnings and net income.
▪ Transversal & Central Holdings: includes AXA Investment Managers, AXA Assistance, AXA Liabilities Managers, AXA Global Re, AXA Life Europe,AXA S.A. and other Central Holdings.
Back to agenda

Notes (1/3)Page A61. Underlying earnings and Underlying earnings per share are APMs. For further information, please refer to the reconciliation of Underlying earnings to the financial statements and to its
definition in the Glossary, which are provided in AXA’s 2018 Activity Report (respectively, on pages 28 to 29 and 78 to 85).
Page A71. Adjusted earnings is an APM. For further information, please refer to the reconciliation of Adjusted earnings to the financial statements and to its definition in the Glossary, which are
provided in AXA’s 2018 Activity Report (respectively, on pages 28 to 29 and 78 to 85).2. Payout ratio: Guidance of 50%-60% of adjusted earnings net of charges on undated subordinated debt, preferred shares and equity components of bonds mandatorily exchangeable into
shares of AXA Equitable Holdings, Inc.
Page A81. Segment weights calculated using 4Q 2018 revenues for XL Group on an annualized basis.
Page A91. Includes AXA IM, AXA Assistance, AXA LM, AXA Global Re and AXA Life Europe, and excludes AXA SA and other Central Holdings.2. Includes 4Q18 for XL and FY18 for ACSA and AXA Art.
Page A101. J.D. Power 2016, 2017 & 2018 Large Commercial Insurance Study - Highest in Customer Satisfaction, Large Insurers.
Page A121. Underlying earnings per share is an APM. For further information, please refer to the reconciliation of Underlying earnings to the financial statements and to its definition in the Glossary,
which are provided in AXA’s 2018 Activity Report (respectively, on page 37 and 78 to 85).2. Compound annual growth rate.3. Adjusted RoE is an APM. For further information, please refer to the reconciliation of Adjusted RoE to the financial statements and to its definition in the Glossary, which are provided in
AXA’s 2018 Activity Report (respectively, on page 37 and 78 to 85).4. Free cash Flows and other non-GAAP financial measures are defined in the Glossaryset forth on pages 78 to 85 of AXA’s 2018 Activity Report.5. The Solvency II ratio is estimated primarily using AXA’s internal model calibrated based on an adverse 1/200 years shock and assuming equivalence for AXA Equitable Holdings, Inc. in the
US. For further information on AXA’s internal model and Solvency II disclosures, please refer to AXA Group’s SFCR for FY17, available on AXA’s website (www.axa.com). As in previousdisclosures all AXA US entities are taken into account assuming US equivalence. The contribution to the AXA Group Solvency II ratio from the entities that were part of the XL Group (“XLentities”) as at December 31, 2018 was calculated in accordance with the equivalence regime, based on the Bermudian Standard Formula SCR, plus a 5%add-on required by the AXA’s leadsupervisor (ACPR), as a transitional measure. In compliance with the decision from ACPR, XL entities will be fully consolidated for Solvency II purposes (as per the consolidation-basedmethod set forth in the Solvency II Directive) and their contribution to the Group’s Solvency capital requirement will b e calculated using the Solvency II standard formula from March 31,2019. Subject to prior approval of the ACPR, the Group intends as soon as FY 2020 to extend its Internal Model to XL entities.
A45 Full Year 2018 Earnings | February 21, 2019 Back to agenda

Notes (2/3)Page A181. The normalized level of Nat Cat charges for AXA XL is ca. 4% of Gross earned premiums.2. Pre-tax and net of reinsurance charges: Euro 261 million for Hurricane Michael and Euro 335 million for California Wildfires
Page A211. The acquisition of one of Quadrant’s US lines has been announced on November 7, 2018. Completion of the transaction is subject to customary closing conditions, including the receipt of
regulatory approvals.
Page A261. Interest rate and foreign exchange economic hedges not eligible forhedge accounting under IAS 39.
Page A271. From FY18 natural catastrophe losses include natural catastrophe losses regardless of event size. Prior to FY18, natural catastrophes only took into account events beyond various
thresholds by lines and entities and amounted to 0.7 point of combined ratio in FY17. This was equivalent to 2.5 points of FY17 combined ratio taking into account all natural catastrophelosses.
Page A281. Reserving ratio for AXA excluding XL Group.
Page A291. Natural catastrophe cost defined as Aggregate Exceedance Probability (AEP) all natural perils worldwide, net of tax (20% notional tax rate) and reinsurance. Deviation is compared to a
normalized level, which are costs associated to natural catastrophes expected in an average year (ca. 3 points of combined ratio).
Page A301. Other perils include Turkey earthquake, Mexico earthquake and windstorm, EU & NA floods as well as a series of other secondary perils. Protection bought varies by peril type.
Page A321. Others includes Real estate (Euro 37 billion), Listed equities (Euro 18 billion), Cash (Euro 33 billion), Alternative investments (Euro 24 billion) mainly in Private Equity (Euro 11 billion) and
Hedge Funds (Euro 7 billion), and Policy Loans (Euro 5 billion).2. Other Fixed income investments include Asset backed securities (Euro 13 billion), residential loans (Euro 13 billion), commercial and agricultural loans (Euro 23 billion), and Agency pools
(Euro 5 billion).3. FY18 invested assets referenced on page 31 of the financial supplement are Euro 782 billion, which includes Unit-Linked assets and assets related to Banking activities.4. Including Life-like Health in L&S and P&C-like Health in P&C. P&C segment also includes Q4 investment income and one-fourth of the average Q4 assets from XL Group.
A46 Full Year 2018 Earnings | February 21, 2019 Back to agenda

Notes (3/3)Page A331. Group investment margin on total Life & Savings and Life-like Health business.2. P&C gross asset yield including Health previously reported in the P&C segment and also includes Q4 investment income and one-fourth of the average Q4 assets from XL Group.3. Hybrid products are savings products allowing clients to invest in both Unit-Linked and General Account assets.
Page A351. The Solvency II ratio is estimated primarily using AXA’s internal model calibrated based on an adverse 1/200 years shock and assuming equivalence for AXA Equitable Holdings, Inc. in the
US. For further information on AXA’s internal model and Solvency II disclosures, please refer to AXA Group’s SFCR for FY17, available on AXA’s website (www.axa.com). As in previousdisclosures all AXA US entities are taken into account assuming US equivalence. The contribution to the AXA Group Solvency II ratio from the entities that were part of the XL Group (“XLentities”) as at December 31, 2018 was calculated in accordance with the equivalence regime, based on the Bermudian Standard Formula SCR, plus a 5%add-on required by the AXA’s leadsupervisor (ACPR), as a transitional measure. In compliance with the decision from ACPR, XL entities will be fully consolidated for Solvency II purposes (as per the consolidation-basedmethod set forth in the Solvency II Directive) and their contribution to the Group’s Solvency capital requirement will b e calculated using the Solvency II standard formula from March 31,2019. Subject to prior approval of the ACPR, the Group intends as soon as FY 2020 to extend its Internal Model to XL entities.
2. Debt Gearing is an APM. For further information, please refer to the reconciliation of Debt gearing to the financial statements and to its definition in the Glossary, which are provided inAXA’s 2018 Activity Report (respectively, on page 36 and 78 to 85).
Page A361. The Solvency II ratio is estimated primarily using AXA’s internal model calibrated based on an adverse 1/200 years shock and assuming equivalence for AXA Equitable Holdings, Inc. in the
US. For further information on AXA’s internal model and Solvency II disclosures, please refer to AXA Group’s SFCR for FY17, available on AXA’s website (www.axa.com). As in previousdisclosures all AXA US entities are taken into account assuming US equivalence. The contribution to the AXA Group Solvency II ratio from the entities that were part of the XL Group (“XLentities”) as at December 31, 2018 was calculated in accordance with the equivalence regime, based on the Bermudian Standard Formula SCR, plus a 5%add-on required by the AXA’s leadsupervisor (ACPR), as a transitional measure. In compliance with the decision from ACPR, XL entities will be fully consolidated for Solvency II purposes (as per the consolidation-basedmethod set forth in the Solvency II Directive) and their contribution to the Group’s Solvency capital requirement will b e calculated using the Solvency II standard formula from March 31,2019. Subject to prior approval of the ACPR, the Group intends as soon as FY 2020 to extend its Internal Model to XL entities.
A47 Full Year 2018 Earnings | February 21, 2019 Back to agenda