contents · 2019-04-28 · h.e. mr. turki almalik ** **** deputy chief executive officer chief...
TRANSCRIPT

Mission Statement 2
Financial Highlights 3
Board Of Directors 5
Message from the Chairman 7
Chief Executive Officer’s Message 9
Economic Review 11
Financial Review 37
Risk Management 41
Basel III Disclosure 53
Consolidated Financial Statements 69
Stand-alone Statement of Financial Position 112
Principal Investing 113
Corporate Directory 115
Contact Us 116
CONTENTS

2
GIC’s mission is to foster the economic growth, the economic diversity, and the capital markets development of the GCC.
MISSION STATEMENT

3
(US$ million)For the year 2016 2017 2018
Gross Operating and Other Income 133 236 177Operating Expenses 54 55 52Net Profit 57 121 107
At year endTotal Assets 4,592 4,228 3,498Interest Bearing Securities and Funds 1,584 1,168 689Equities and Managed Funds 619 536 396Projects and Equity Participations 1,565 1,873 1,862Deposits 570 571 298Shareholders› Equity 2,520 2,647 2,598
Selected Ratios (%)ProfitabilityReturn on Paid-up Capital 2.7 5.8 5.1Return on Adjusted Shareholders› Equity 2.1 4.6 3.9
CapitalBIS Ratios - Total 45.6 40.5 40.9 - Tier 1 45.6 40.5 40.9Shareholders› Equity as a % of Total Assets 54.9 62.6 74.3
Asset QualityMarketable Securities as a % of Total Assets 42.5 36.0 27.0GCC Country Risk as a % of Total Assets 75.9 79.8 80.7
LiquidityLiquid Assets Ratio 62.3 52.4 34.8
ProductivityOperating Income as Multiple of Operating Expenses 2.5 4.3 3.4
FINANCIAL HIGHLIGHTS

BOARD OF DIRECTORS

Gulf Investment Corporation G.S.C. and SubsidiariesAnnual Report and Accounts 2018
5
* Member of the Executive Committee
** Member of the Audit Committee
*** Member of the Risk Management Committee
**** Member of the Remuneration and Human Resources Committee
Kingdom of Bahrain
United Arab Emirates
H.E. Mr. Mazen Ibrahim Abdulkarim * ****Businessman
H.E. Mr. Faisal Ali Almansouri * ***Chairman of the Executive CommitteeDirector of Macro-Fiscal Policy, Ministry of Finance
H.E. Mr. Khaled S. Al-Khattaf * ***Chairman of the Risk Management CommitteeCEO of Lafana Investment Company
Kingdom of Saudi Arabia
H.E. Mr. Hesham Khonji ** ***Chairman of Audit Committee
Head of Treasury and Capital MarketsBahrain Mumtalakat Holding Company B.S.C.
H.E. Mr. Majed Ali Omran Al Shamsi ** ****
Advisor at the Ministry of Finance
Sultanate of OmanH.E. Mr. Darwish Ismail Ali Al-Bulushi ** *** Minister Responsible for Financial Affairs,Ministry of Finance
H.E. Mr. Abdulsalam Mohammed Al Murshidi * ****Chairman of Remuneration andHuman Resources CommitteeExecutive President, State General Reserve Fund
H.E. Mr. Turki Almalik ** ****
Deputy Chief Executive OfficerChief Operations Officer,Sanabil Investments Company
H.E. Mr. Bader Al-Ajeel * ***Chairman of the BoardExecutive Director - General Reserve SectorKuwait Investment Authority
H.E. Mr. Faisal M.H. Boukhadour ** ****Advisor in the Diwan of H.H.,the Prime Minister
State of Kuwait
State of Qatar
H.E. Shaikh Fahad Faisal Al-Thani * ****Minister of State
H.E. Dr. Hussain Ali Al-Abdula Al-Abdulla ** ***Minister of State & Board MemberQatar Investment Authority

CHAIRMAN’S STATEMENT

Gulf Investment Corporation G.S.C. and SubsidiariesAnnual Report and Accounts 2018
7
On behalf of the Board of Directors, it is my privilege to present the Annual Report on the Corporation’s activities and its financial results for the year ended 31 December 2018.
The Corporation continued its success despite many economic and geopolitical challenges, reflecting the Corporation’s 35 years of experience and adaptability to its changing business environment.
The business environment surrounding the Corporation was characterized by continuous developments affecting the economies of the region, the most important of which were the fluctuation of oil prices and its inherent GCC budget deficits, the trend towards high interest rates and tensions resulting from trade protectionism, along with ongoing economic reform policies and geopolitical developments surrounding the region. The Corporation, despite these challenges, thanks to its well diversified and geographically diversified investment mix, reported an operating profit of $125 million before provisions, and net profit of $107 million.
These results have been achieved through the Corporation’s diverse activities in both Principal Investment and Global Market portfolio. In this context, it should be noted that the Corporation adheres to strict standards in terms of capital adequacy ratios, asset quality, liquidity ratios, cash flows and prudent risk management, all of which has been reflected in the achievement of good financial indicators as detailed in this year’s Annual Report.
In parallel with the improvement in the financial performance indicators, and in order to develop performance to meet the changing operational environment, the Corporation continued to implement the new investment policy, aiming at reducing the financial obligations to avoid increasing borrowing costs in light of higher interest rates. Also, it continues to focus more on principal investment and maintain global investments to diversify risks and maximize returns.
As part of this trend, the Corporation has taken various measures to reduce leverage, down to 26%, which has reduced financing cost by 33% to $33 million compared to $49 million in 2017, despite the increase in average interest rates. During the year, the Corporation paid $400 million worth of outstanding bonds, and managed to rationalize operating expenses, which declined by 5% from $55 million in 2017 to $52 million in 2018.
During the year, the Corporation refinanced a range of different projects as well as exiting others. The portfolio includes investments in various sectors such as infrastructure, energy, services, metals and petrochemicals.
GIC has established its leading regional position through its strong financial position and the excellence of its human capital, evidenced by the reaffirmation of Moody’s credit rating of the Corporation in 2018 at A2 with a stable outlook, which demonstrates the ability to maintain the quality of the Corporation’s key financial indicators despite the economic and political challenges and uncertainties, which reflect the strong financial position of the Corporation, and encourage us for more achievements in the future.
Finally, on behalf of the Board of Directors, I would like to extend my sincere thanks to their Royal Highnesses, Kings and Amirs, rulers of the GCC countries for their continued support. Special thanks to the State of Kuwait for hosting GIC’s headquarters and for providing all the necessary forms of support. I would also like to express my appreciation to their Excellencies, the Ministers of Finance of the GCC States for their support.
I would also like to express my appreciation to the Board of Directors for their continuous guidance and support and thanks to all the members of executive management and GIC’s staff for their commitment and effort during the year in achieving the Corporation’s goals.
Bader Al-Ajeel
Chairman

CEO’S STATEMENT

Gulf Investment Corporation G.S.C. and SubsidiariesAnnual Report and Accounts 2018
9
Gulf Investment Corporation achieved good results during 2018, as it reported operating profits of $125 million, and provided $18 million of provisions for the decline in the fair value of certain investments. As a result, the Corporation reported net profits of $107 million.
These commendable results have been achieved despite regional and international challenges that surround the business environment, such as imposing higher fees on basic goods and services or those related to rationalization of subsidies, which have affected the profit margins of many economic sectors. The geopolitical tensions in the region along with sustaining fiscal deficits across many of the regions’ budgets have further contributed to downgrading the credit ratings of some GCC economies. Moreover, the effects of trade wars among the world’s largest economies have exacerbated economic tensions, while global markets continued to be affected by higher interest rates which is reflected on performance of capital markets in general and the bond market performance in particular.
The Corporation’s Principle Investment and Global Markets portfolios performed well during the year. The Principle Investment portfolio achieved total income net of provisions of $151 million in 2018, compared to $93 million in 2017. Likewise, the Global Markets portfolio achieved total income after provisions of $36 million in 2018.
In 2018, Moody’s reaffirmed GIC’s long-term rating at A2 and short-term rating at P1, with a Stable outlook in recognition of the Corporation’s financial strength and its positive cash flows.
In 2018, the Corporation started the implementation of its new strategy which was approved by the Board in 2017. The new investment strategy aims to reallocate its investments for obtaining highest possible returns for acceptable risk levels while measuring the performance against market benchmarks, in addition to reducing the Corporation’s financial obligations. Accordingly, the Corporation reduced leverage to 26%, ahead of the 33% target level, by the end of 2018. This reduction came after settlement of $400 million worth of maturing bonds.
On the other hand, the Corporation exited from three non-core direct investments with a profit of $22 million, while it continued to complete projects under construction such as the Bahrain Liquefied Natural Gas (LNG) project, Moon Iron & Steel Company in Oman, and Sudair Pharmaceutical Company in Saudi Arabia.
The Corporation has been successful in refinancing three water and energy projects, including Al-Ezzel Power Company with $243 million and Al-Dur Power and Water Company with $1.3 billion, a step that was accomplished in exceptional circumstances.
In conclusion, I would like to extend my sincere gratitude and thanks to the GCC governments, GIC’s shareholders and its board of directors as well as its subcommittees for their continued support and valuable guidance. I would also like to express my appreciation for the efforts, commitment, and dedication of GIC staff. The Corporation’s performance and success in 2018 is a source of pride to all of us and represents a motivation to continue to succeed and contribute more effectively to supporting the economic development of the GCC and helps bring value addition to our shareholders.
Ibrahim Al-QadhiCEO

ECONOMIC REVIEW

Gulf Investment Corporation G.S.C. and SubsidiariesAnnual Report and Accounts 2018
11
1. INTRODUCTIONEconomic growth in the GCC rebounded from a contraction of 0.4% in 2017 to 2.7% in 2018. Several factors were behind this recovery, first and foremost is the virtual recovery in crude oil prices, which ticked higher to an average of $71.13 a barrel in 2018 from an average of $54.42 in 2017. Equally important, is the increase in the non-hydrocarbon growth, to 2.83% in 2018 from 2.58% in 2017. Moreover, the growing positive sentiment continued to support financial markets across the region despite some geopolitical tensions. In addition, stronger fiscal and current account balances enabled the GCC governments to withstand negative impacts of low oil revenues in the past few years.
In the meantime, global growth moderated in 2018, as industrial activity softened while trade and investment growth slowed, on the back of increase in bilateral tariffs. Signs of slower growth was evident in China, the euro area, and Japan in contrast to continued solid growth in the US particularly in the second half of the year. The recovery in EMDEs slowed down during the year, owing to softening external demand, tighter external financing conditions, and heightened policy uncertainty. Higher interest rates and an appreciating US dollar resulted in an outflow of capital from many emerging market economies (EMs) in the third quarter of the year, and as a result, many EMDE central banks raised interest rates to reduce currency pressures.
The economic review below is in four sections. The first section deals with global economy, as it illustrates major developments in GDP growth, inflation, macro policies, capital flows and trade. The second section reviews oil market dynamics. The third section reviews GCC economies, while the last section tracks developments in GCC equity markets.
1.1. Global Growth
Global GDP growth settled at 3.7% in 2018, easing from 3.8% in 2017. Signs of slower growth was evident in China, the euro area, and Japan in contrast to continued solid growth in the US in the second half of the year. Global trade and investment growth proved softer than anticipated and slowed to well below 2017 averages on the back of increase in bilateral tariffs. Softening trade and investment growth together with tighter global financial conditions and higher oil prices contributed to the underlying easing of the global expansion. Nevertheless, labor market conditions improved with the OECD-wide unemployment rate at its lowest level since 1980s. During the year, higher interest rates and an appreciating US dollar resulted in an outflow of capital from many emerging market economies (EMs) and weakening their currencies. In addition, many OECD economies started to withdraw their monetary and fiscal stimulus gradually throughout the year1.
Table 1: Real GDP and Trade Growth, Regional Comparison
Real GDP growth Average 2011-2018 2016 2017 2018
World 3.4 3.1 3.6 3.7
OECD 2.1 1.8 2.5 2.4
United States 2.3 1.5 2.2 2.9
Euro area 1.2 1.8 2.5 1.9
Japan 1.3 1.0 1.7 0.9
Non-OECD 4.6 4.1 4.6 4.7
China 7.1 6.7 6.9 6.6
India 7.0 7.1 6.7 7.5
Brazil 0.1 -3.4 1.0 1.2
World Real Trade Growth 3.6 2.6 5.2 3.9
Source: OECD Economic Outlook, Volume 2018 Issue 2, November 2018, GIC Research.
Regional growth estimates for both real GDP and trade growth in 2018 according to the OECD economic outlook, which puts global GDP growth at 3.7% and trade volume growth at 3.9%.
1. IMF. “WEO Update”. January 2019.

12
Economic Review
Figure 1: Real Global GDP and Trade Growth, y-o-y (% Change)
0
0.5
1
1.5
2
2.5
3
3.5
4
4.5
5
5.5
Average 2011-2018 2016 2017 2018
Trade Growth World OECD Non OECD
Source: OECD Economic Outlook, Volume 2018 Issue 2, November 2018, GIC Research.
The global growth pattern in 2018 reflected a persistent decline in the growth rate of advanced economies from above trend levels together with a temporary decline in the growth rate of EMs. Economic data, particularly in the second half of the year signaled subdued momentum as Industrial production of capital goods eased outside the US. Nonetheless, these developments occurred against a backdrop of weakening financial market sentiment, trade policy uncertainty, and concerns about China’s outlook.
Aggregate GDP of advanced economies decelerated slightly to 2.3% on average in 2018, from 2.4% in 2017 but remained above its 2000-2009 long-term average of 1.8%. In contrast, GDP growth of emerging markets and developing economies (EMDEs) though eased marginally to 4.6%, from 4.7% in 2017, it fell below its long-term average of 6.1%.
Figure 2: Regional Comparison of GDP Growth in 2018, (%)
0
1
2
3
4
5
6
7
Average 2000-2009 2017 2018
Advanced Economies EMDEs
Source: IMF, January 2019 and IMF WEO, October 2018, GIC Research.
The US growth picked up in 2018 to 2.9%, from 2.2% in 2017, mostly reflecting stronger than expected domestic demand supported by solid consumption growth. This consumption growth was driven by employment growth together with the modest wage increases while the rise in oil prices and the recent tax reform boosted investment and imports. Although, trade growth recovered from the past appreciation of the dollar, productivity growth remained sluggish while the trade deficit widened as import demand remained strong due to strong investment growth2.
2. World Bank. “Global Economic Prospects”. January 2019.
Gulf Investment Corporation G.S.C. and SubsidiariesAnnual Report and Accounts 2018
13
In the Euro Area, growth slowed notably to 1.8%, from 2.4% in 2017, as exports softened reflecting the earlier appreciation of the euro and slowing external demand. Private consumption slowed as inflation pick-up reduced households’ purchasing power, though it remained resilient owing to strong employment growth. Final domestic demand continued to support growth yet its volume growth eased to 1.8% in 2018, from 2.3% in 2017. Capital spending remained solid, supported by favorable financing conditions and robust confidence. The recovery in residential investment moderated in 2018, despite continuing support from rising income3.
In the UK, GDP growth ticked down to 1.4% y-o-y, in 2018, from 1.7% in 2017, reflecting weakening domestic demand as the growth of both private consumption and investment continued to slow amid uncertainties and a decline in households’ real income. This was largely due to the sharp depreciation of sterling, which raised consumer price inflation. In addition, exports of goods and services fell sharply since the beginning of the year and business investment was constrained, while trade flows rebounded in the second half of the year4.
In Japan, growth slowed to 0.9% in 2018 from 1.9% in 2017, reflecting contractions in the first and third quarters due to bad weather and natural disasters. Although domestic demand weakened, private consumption and business investment continued to drive growth, supported by wage growth, tax incentives, labor shortages, and by the record high level of corporate profits. Exports declined in the second half of 2018 in the context of weaker world trade growth5.
Aggregate growth in EMDEs eased slightly to 4.6% in 2018, from 4.7% in 2017 amid weakening capital flows, a substantial strengthening of the US dollar, heightened trade tensions, and moderating global and manufacturing trade. The weakness in activity was most pronounced in EMDEs that suffered substantial financial market pressures and high exposure to portfolio and bank inflows. Domestic demand across EMDEs moderated, reflecting tighter domestic borrowing conditions, softer confidence, and policy tightening in some large economies to discourage domestic price and capital outflow pressures. A rebound in EMDE gross capital formation that began in 2015 slowed during the year, and investor sentiment has deteriorated. On the external front, import growth softened, partly due to sharp currency depreciations in some large economies, while export growth also moderated, reflecting weaker external demand and moderating global investment6.
The pace of recovery in commodity exporters weakened significantly as investor confidence generally worsened and commodity prices declined. The rebound in domestic demand slowed as asset prices and currencies were under pressure amid weaker global trade while the recovery in investment stalled. Private consumption growth cooled partly reflecting the diminishing impact of higher inflation and tighter lending conditions. Growth in Brazil was lackluster in 2018, rising slightly to 1.3% from 1.1% in 2017, reflecting a mid-year strike and heightened policy uncertainty. In Russia, growth was resilient, at 1.7%, up from 1.5% in 2017, supported by private consumption and exports. However, momentum slowed reflecting policy uncertainty, recent oil price declines, and renewed pressures on currency and asset prices. In contrast, activity firmed further in several oil-exporting economies where oil production rebounded in 2018. Recoveries also continued to varying degrees, in some large energy exporters where significant adjustments were introduced in response to the 2014-16 oil prices plunge such as Azerbaijan and Colombia7.
Growth in commodity importers decelerated, reflecting moderating export growth, and deteriorated conditions in some large economies with elevated vulnerabilities and heightened policy uncertainty. The moderation in activity is most evident among countries with increasing capacity constraint, high current account deficits, or sizable public debt. Moreover, slowing euro area growth diminished the positive trade and financial spillovers that had previously supported activity in commodity importers. However, moderate inflation and low interest rates supported a pickup in growth in some commodity importers with activity continued to be generally more solid in Asia8.
In China, GDP growth ticked down to a still robust 6.6% in 2018, from 6.9% in 2017, supported by resilient consumption. A rebound in private fixed investment helped offset a decline in public infrastructure spending. However, industrial production and export growth decelerated, reflecting easing global manufacturing activity. While exports and the depreciation of the renminbi mitigated the impact of tariff hikes, imports continued to outpace export growth, contributing to a shrinking current account surplus. India’s economy picked up as GDP grew at 7.3%, from 6.7% in 2017, as private consumption remained strong, and exports rebounded supported by a weaker rupee and tax incentives while investment grew steadily, driven by the gradual increase in capacity utilization, large infrastructure programs and structural reforms9.
3. OECD. “Economic Outlook”. November 2018.4. IMF. ”2018 UK Article IV Consultation”. November 14, 2018. 5. BOJ. “Summary of Opinions at the Monetary Policy Meeting”. December 19-20, 2018.6. The World Bank. “Global Economic Prospects”. January 2019.7. World Bank. “Global Economic Prospects”. January 2019.8. World Bank. “Global Economic Prospects”. January 2019.9. World Bank. “Global Economic Prospects”. January 2019.

14
Economic Review
1.2. Inflation
The rise in oil prices along with import tariffs pushed up headline inflation, as oil prices were 30% higher in 2018 than in 2017. Median headline inflation rates recovered in advanced economies to 2%, up from 1.7%. Consumer price inflation remained contained in the second half of the year in advanced economies but inched up in the US, largely due to strong growth and the imposed tariffs. The US personal consumption expenditures deflator rose to 2.1%, up from 1.8% in 2017. Headline inflation increased in the euro area and Japan to 1.8% and 1.0% respectively, from 1.5% and 0.5% in 2017, largely due to a temporary acceleration in energy prices. Core inflation rose in the US to 1.9% and in Japan to 0.2% but remained steady in the Euro Area at 1% in both 2017 and 2018. In the UK, inflation continued to be above the 2% inflation target due to past currency depreciation and higher commodity prices10.
Among emerging market economies, inflationary pressures eased in 2018 and for some countries, this easing was partially offset by the pass-through of currency depreciations to domestic prices. Headline inflation in EMDEs edged up to 4.9%, from 4.3% in 2017. It rose slightly to 6.1% and 3% in both Latin America and Emerging Asia respectively, but increased markedly to 10.8% and 8.3% in both MENAP and Emerging Europe regions respectively. In China, consumer price inflation ticked up steadily throughout the year to hit the 2% target. In India, consumer price inflation remained within the target band though it edged up to 4.5%, due to the rupee depreciation and increases in wages and housing allowances for public employees. In Russia, the ruble depreciation in April and August pushed up inflation although it remained below the 4% target. In Brazil, inflation and core inflation remained below target and interest rates remained low11.
Figure 3: Consumer Prices across Regions (Annual % change)
0
2
4
6
8
10
12
14
16
2000-09 2010 2011 2012 2013 2014 2015 2016 2017 2018
Advanced Economies EM Europe EM NAP
EM AsiaLatin America & Caribbean
Source: IMF, GIC Research.
1.3. Financial Markets Conditions
As inflation moved closer to central bank targets and monetary policy became less accommodative, borrowing costs in advanced economies rose during most of 2018. Financial conditions tightened, with rising long term interest rates, particularly in the US, ending the year at 2.7% and up around 30bps from the start of 2018. The associated shift in risk sentiment contributed to sizeable currency depreciations against the US dollar in many EMEs, especially ones with large and rising external imbalances. Investor concerns about softening growth prospects and a search for higher-yielding safe assets led to a further compression of the US yield curve, despite higher inflation and ballooning US government deficits driven by fiscal stimulus measures12.
10. OECD Economic Outlook, Volume 2018, Issue 2, November 2018.11. IMF, WEO Update, January 2019 & October 2018.12. World Bank. “Global Economic Prospects”. January 2019.
Gulf Investment Corporation G.S.C. and SubsidiariesAnnual Report and Accounts 2018
15
Various EMDEs central banks have responded to currency and capital outflow pressures with interest rate hikes, leading to tighter domestic borrowing conditions, slower credit and domestic demand growth. While financial market stress was pronounced in Turkey and Argentina, many other EMDEs also suffered from deteriorating market sentiment. Countries with current account deficits financed by volatile capital flows, as well as countries with high short-term external debt and elevated domestic debt, were most severely impacted, pointing to heightened investor focus on external vulnerabilities13.
1.3.1. Monetary Policy and Central Banks’ Balance Sheets
The growth slowdown in 2018 reflected a move towards less accommodative macroeconomic policies, along with the continued headwinds from trade tensions, tighter financial conditions, and higher oil prices. In the median OCED economy, the fiscal stance eased by 0.4% of GDP in 2018. In the US, the fiscal policy relaxed substantially in early 2018, to ease the depressing impact of the tax reform on revenues. The increase in federal spending in 2018 contributed to growing budget deficits and pushed up government debt levels. US Monetary policy tightened gradually in 2018 as price inflation approached the Federal Reserve’s 2% target. In the euro area, the ECB ended its net asset purchases, but maintained its negative interest rate policy to attain inflation objective. The euro area fiscal stance was mildly expansionary in 2018 as the recovery continued. Monetary policy in the UK remained accommodative to contain depressed demand while fiscal policy consolidation continued. The Bank of Japan continued to provide stimulus by keeping long-term rates near zero and adding to its balance sheet until CPI inflation exceeds the 2% target.
By December 2018, total assets of major central banks reached $19.7 trillion, including the $5.4 trillion owned by people’s bank of China. It also include the BOJ’s $4.9 trillion, the ECB $5.3 trillion, and the Federal Reserve’s $4.0 trillion. By the third quarter of 2018, the Fed’s total assets as percent of local currency nominal GDP fell to 20.4%, while the ECB’s total assets accounted for 39.7% of the euro area GDP. They remained far behind Japan however, with the BOJ $4.9 trillion total assets are equivalent to about 100.2% of the country’s GDP14.
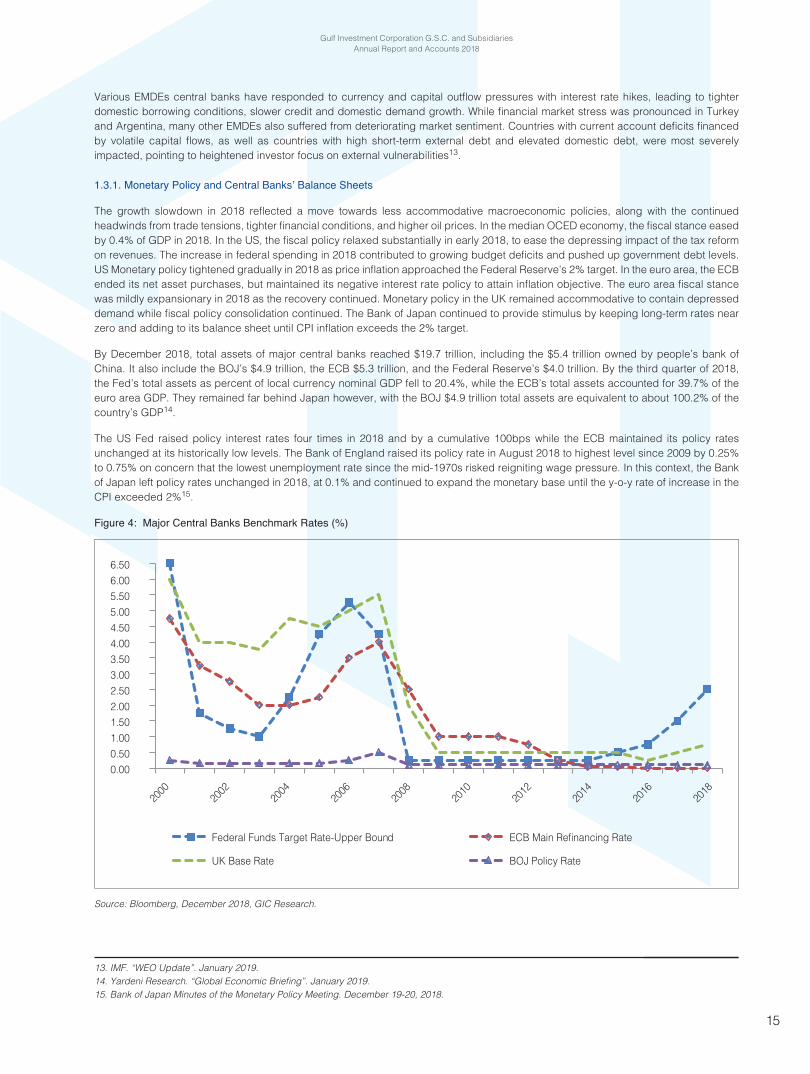
The US Fed raised policy interest rates four times in 2018 and by a cumulative 100bps while the ECB maintained its policy rates unchanged at its historically low levels. The Bank of England raised its policy rate in August 2018 to highest level since 2009 by 0.25% to 0.75% on concern that the lowest unemployment rate since the mid-1970s risked reigniting wage pressure. In this context, the Bank of Japan left policy rates unchanged in 2018, at 0.1% and continued to expand the monetary base until the y-o-y rate of increase in the CPI exceeded 2%15.
Figure 4: Major Central Banks Benchmark Rates (%)
0.000.501.001.502.002.503.003.504.004.505.005.506.006.50
Federal Funds Target Rate-Upper Bound
2000
2002
2004
2006
2008
2010
2012
2014
2016
2018
ECB Main Refinancing Rate
UK Base Rate BOJ Policy Rate
Source: Bloomberg, December 2018, GIC Research.
13. IMF. “WEO Update”. January 2019.14. Yardeni Research. “Global Economic Briefing”. January 2019. 15. Bank of Japan Minutes of the Monetary Policy Meeting. December 19-20, 2018.

16
Economic Review
Table 2 exhibits the level of short-term interest rates during the period Q2:12 till Q4:18. By December 2018, policy rates ranged between 0% in the Euro area, 0.10% in Japan, 0.75% in the UK, 1.75% in Canada, and 2.5% in the US. Monetary policy stances varied across emerging market economies during the year, reflecting these economies’ diverse cyclical positions. In India, higher oil prices, along with the rupee depreciation, raised the reverse repo rate by 50bps to 6.25%. In China, the central bank increased its reverse repo rate only by 5bps to 2.55% in March 2018, refraining from lifting rates aggressively as inflation pressure remained benign and the yuan depreciation was not a big concern16.
Table 2: Short-Term Policy Rates (%)
Date USA Canada Euro Area UK Japan China India
2012 Q2 0.25 1.00 1.00 0.50 0.10 3.30 7.00
2012 Q3 0.25 1.00 0.75 0.50 0.10 3.35 7.00
2012 Q4 0.25 1.00 0.75 0.50 0.10 3.35 7.00
2013 Q1 0.25 1.00 0.75 0.50 0.10 3.35 6.50
2013 Q2 0.25 1.00 0.50 0.50 0.10 3.35 6.25
2013 Q3 0.25 1.00 0.50 0.50 0.10 3.90 6.50
2013 Q4 0.25 1.00 0.25 0.50 0.10 4.10 6.75
2014 Q1 0.25 1.00 0.25 0.50 0.10 4.10 7.00
2014 Q2 0.25 1.00 0.15 0.50 0.10 4.10 7.00
2014 Q3 0.25 1.00 0.05 0.50 0.10 4.10 7.00
2014 Q4 0.25 1.00 0.05 0.50 0.10 4.10 7.00
2015 Q1 0.25 0.75 0.05 0.50 0.10 3.55 6.50
2015 Q2 0.25 0.75 0.05 0.50 0.10 2.50 6.25
2015 Q3 0.25 0.50 0.05 0.50 0.10 2.35 5.75
2015 Q4 0.50 0.50 0.05 0.50 0.10 2.25 5.75
2016Q1 0.50 0.50 0.00 0.50 0.10 2.25 5.75
2016 Q2 0.50 0.50 0.00 0.50 0.10 2.25 6.00
2016 Q3 0.50 0.50 0.00 0.25 0.10 2.25 6.00
2016 Q4 0.75 0.50 0.00 0.25 0.10 2.25 5.75
2017 Q1 1.00 0.50 0.00 0.25 0.10 2.45 5.75
2017 Q2 1.25 0.50 0.00 0.25 0.10 2.45 6.00
2017 Q3 1.25 1.00 0.00 0.25 0.10 2.45 5.75
2017 Q4 1.50 1.00 0.00 0.50 0.10 2.50 5.75
2018 Q1 1.75 1.25 0.00 0.50 0.10 2.55 5.75
2018 Q2 2.00 1.25 0.00 0.50 0.10 2.55 6.00
2018 Q3 2.25 1.50 0.00 0.75 0.10 2.55 6.25
2018 Q4 2.50 1.75 0.00 0.75 0.10 2.55 6.25
Note: Bank of China’s 7-day Reverse Repurchase rate & Reserve Bank of India Reverse Repo Rate.Source: Bloomberg, December 2018, GIC Research.
1.4. Exchange Rates and Capital Flows
1.4.1. Exchange Rates Movements
With investors generally lowering exposure to riskier assets, emerging market economies experienced net capital outflows in the third quarter of 2018. By the end of the year, the US dollar remained broadly unchanged in real effective terms relative to September, the euro has weakened by about 2% amid slower growth and concerns about Italy, while the pound has depreciated about 2% as Brexit-related uncertainty increased. In contrast, the Japanese yen has appreciated by about 3%, on higher risk aversion. Several EM currencies, Including the Turkish lira, the Argentine peso, the Brazilian real, the South African rand, the Indian rupee, and the Indonesian rupiah, recovered from their 2018 valuation lows last August-September17.
16. Bloomberg. 17. IMF. “WEO Update”. January 2019.

Gulf Investment Corporation G.S.C. and SubsidiariesAnnual Report and Accounts 2018
17
Divergent monetary policy among major economies also contributed to a significant appreciation of the US dollar in 2018. This, together with increased investor risk aversion and renewed attention to external vulnerabilities, contributed to significant capital outflows in many EMDEs. Since the US dollar started strengthening in April 2018, EMDEs currencies fell by an average of about 10%, the most significant episode of sustained depreciation since early 2016. Cumulative portfolio outflows from EMDEs also surpassed those seen after the 2013 Taper Tantrum, reflecting a broad-based sell-off in both equity and bond funds18.
1.4.2. Total Portfolio Flows to Emerging Markets
Non-resident total portfolio inflows to emerging markets were $195.2 billion in 2018, nearly $173 billion lower with respect to 2017 ($368.4 billion) but higher than 2016 ($148.3 billion) and 2015 ($80.4 billion), as shown in table 3. The breakdown between portfolio equity and debt flows was $28.1 billion and $167.1 billion respectively, lower than their 2017 level ($74.4 billion and $294 billion). Softening capital flows coincided with a growth slowdown across EMs in 2018 as well as development in China, the most important country in terms of participation in capital flows. China experienced significant volatility during 2018 as the first half of the year showed China equity and debt flows at $33.3 billion and $75.7 billion respectively, whereas the second half saw a reduction to $26 billion and $15.7 billion19.
Table 3: Non-Resident Portfolio Flows to Emerging Markets ($bn)
Portfolio Debt Flows Emerging Asia Latin America Emerging Europe ME & Africa Total
2015 26.10 19.87 5.59 6.96 58.52
2016 37.66 2.83 20.60 27.85 88.93
2017 144.71 53.65 50.73 44.88 293.98
2018 94.12 44.00 13.43 15.53 167.08
Total 302.59 120.37 90.35 95.21 608.52
Portfolio Equity Flows
2015 6.66 12.78 3.24 -0.85 21.83
2016 45.81 23.31 -1.76 -7.99 59.37
2017 51.05 17.90 7.82 -2.37 74.40
2018 37.12 -4.02 -0.87 -4.08 28.14
Total 140.63 49.97 8.42 -15.29 183.73
Total Portfolio Flows (Equity and Debt)
2015 32.75 32.66 8.83 6.11 80.35
2016 83.46 26.15 18.84 19.86 148.30
2017 195.76 71.55 58.55 42.51 368.38
2018 131.24 39.98 12.56 11.44 195.22
Total 443.22 170.34 98.77 79.92 792.24
Source: IIF, January 2019, GIC Research.
The month of December saw only $0.2 billion in debt inflows, after a strong reading of $22 billion in November. The weaker level of debt flows was mainly explained by outflows from EM Europe and Africa & Middle East & Africa ($-0.3 billion for each region), and disappointing inflows to EM Asia ($0.7 billion) and Latin America ($0.1 billion). For the case of equity flows, December ended at $2.9 billion. This was explained by outflows from Latin America ($-0.6 billion) and ME & Africa ($-0.9 billion) whereas emerging Asia and emerging Europe saw inflows of $3.9 billion and $0.3 billion respectively20.
18. World Bank. “Global Economic Prospects”. January 2019.19. IIF. ”Capital Flows Tracker”. January 2019.20. IIF. “Capital Flows Tracker”. January 2019.

18
Economic Review
1.5. Global Trade
In contrast to the deceleration in portfolio and bank flows, foreign direct investment (FDI) into EMDEs is estimated to have stabilized in 2018, while remittance flows continued to increase. Outward FDI from China remained robust, boosted by the Belt and Road Initiative. Following strong momentum in 2017, growth in global trade slowed markedly during the first half of 2018 but partially recovered in the second half. It eased to 3.9% in 2018, down from 5.2% in 2017 as shown in table 4. The deceleration was more pronounced in exports orders and global manufacturing activity. In particular, global capital goods production, which is highly trade-intensive, slowed notably in Europe and developing Asia. The softening of global goods trade comes against the backdrop of ongoing trade tensions involving mainly the US and China. New tariffs introduced since the beginning of 2018 have affected about 12% of US goods imports, 6.5% of China goods imports, and about 2.5% of global goods trade21.
Table 4: World Trade Growth and regional Contributions
Percentage changes from previous period
A. Trade growth 2014 2015 2016 2017 2018Total OECD 4.4 4.8 2.4 4.6 3.3Total non-OECD 3.2 0.1 2.1 6.2 4.8China 6.1 0.1 4.1 8.9 6.7Brazil -1.5 -4.6 -4.1 5.6 2.7India 2.6 -6.0 1.8 8.8 10.2Russia -3.2 -9.9 0.6 9.5 5.4Other oil producers 4.2 1.1 -1.0 -1.8 0.6World 4.0 3.0 2.5 5.2 3.9
B. Contributions to world trade growth %
Total OECD 2.7 3.0 1.7 2.9 2.1Total non-OECD 1.2 0.0 0.8 2.3 1.8China 0.6 0.0 0.4 0.9 0.7Brazil 0.0 -0.1 0.0 0.1 0.0India 0.1 -0.1 0.0 0.2 0.2Russia -0.1 -0.2 0.0 0.2 0.1Other oil producers 0.3 0.1 -0.1 -0.1 0.0World 4.0 3.0 2.5 5.2 3.9
Source: OECD Economic Outlook, Volume 2018 Issue 2, November 2018, GIC Research.
Table 5 shows that world trade volume (goods and services) grew at 4% in 2018, down from 5.3% in 2017. Volume of exports in advanced economies grew by 3.4% in 2018, down from 4.4% in 2017, below its long-term average of 4.4%. In EMDEs, volume of exports grew by 4.7% in 2018, down from 6.9% in 2017. In addition, volume of imports grew at 3.7% in advanced economies, down from 4.2% in 2018 and it grew by 6.0% in EMDEs, down from 7%22.
Table 5: World Trade Volume (% change)
Average 2010-19 2017 2018
EXP IMP EXP IMP EXP IMP
Advanced Economies 4.4 4.4 4.4 4.2 3.4 3.7
EM & Developing Economies 5.5 5.8 6.9 7.0 4.7 6.0
World Trade Volume 4.8 5.3 4.0
Source: WB, Global Economic Prospects, January 2019 & IMF, WEO Update, January 2019, GIC Research.
21. World Bank. “Global Economic Prospects”. January 2019.22. IMF, world economic outlook, October 2018.

Gulf Investment Corporation G.S.C. and SubsidiariesAnnual Report and Accounts 2018
19
2. OIL DYNAMICS The year started with relatively stable oil prices due to the agreement between OPEC and non-OPEC major oil producers to extend production cuts to the end of 2018. However, price fluctuations remained evident throughout the year with Brent reaching a minimum of $49.73 a barrel in December, and WTI reaching its lowest level at $42.33 a barrel in the same month.
Crude oil prices reached their maximum levels in October with BRENT at $86.09 a barrel and WTI at $76.41 a barrel. Since then, oil price started to drop from their highest levels due to concerns that supply glut may persists while slow global economic growth could lessen demand for oil.
Nonetheless, crude oil prices recovered by the end of 2018 as Brent closed at $53.17 a barrel while WTI settled at $45.41 a barrel23.
In addition, Brent averaged $71.13 a barrel during the year versus $54.42 a barrel in 2017, while it averaged $70.79 a barrel in the first half of the year and $71.46 a barrel in the second half, compared to $52.20 a barrel in the first half of 2017 and $56.60 a barrel in the second half of 2017.
This is slightly higher than WTI, which averaged $64.85 a barrel for 2018 versus $50.92 a barrel in 2017, and $65.44 a barrel in the first half of 2018 and $64.27 a barrel in the second half of 2018 compared to $50.06 a barrel in the first half of 2017 and $51.77 a barrel in the second half on 2017.
Figure 5: Brent Average Monthly Prices in 2017 and 2018 ($/b)
-10
-5
0
5
10
15
20
25
30
35
0
10
20
30
40
50
60
70
80
90
Jan Feb March April May June July Aug Sep Oct Nov Dec
Difference (RHS) BRENT 2017 BRENT 2018
Source: Bloomberg, GIC Research.
23. Bloomberg and GIC Research.

20
Economic Review
Figure 6: WTI Average Monthly Prices in 2017 and 2018 ($/b)
-15
-10
-5
0
5
10
15
20
25
30
0
10
20
30
40
50
60
70
80
Jan Feb March April May June July Aug Sep Oct Nov Dec
Difference (RHS) WTI 2017 WTI 2018
Source: Bloomberg, GIC Research.
When compared to the first half of the year, BRENT gained around 1% in the second half of 2018 while WTI prices lost around 1.78%. This in turn increased the average volatility coefficients to levels that have not reached since the second half of 2016. The average volatility for BRENT increased from 24.50% in 2017 to 29.54% in 2018 while it increased for WTI from 25.36% in 2017 to 31.55% in 2018.
Table 6: Brent and WTI Mean & Volatility ($/b, %)
BRENT WTI
Mean Volatility (%) Mean Volatility (%)
H1 2011 111.14 31.95 98.37 33.83
H2 2011 111.82 27.63 90.53 36.06
H1 2012 113.80 23.0% 98.14 26.75
H2 2012 110.26 22.56 90.19 25.82
H1 2013 107.84 18.04 94.23 18.46
H2 2013 109.82 17.56 101.73 18.49
H1 2014 108.90 13.12 100.91 15.44
H2 2014 89.08 25.00 85.36 30.83
H1 2015 58.11 43.79 53.23 47.07
H2 2015 46.82 43.05 44.34 46.02
H1 2016 40.25 53.08 39.49 48.25
H2 2016 47.92 36.63 47.01 39.82
H1 2017 52.19 24.99 50.06 26.96
H2 2017 56.60 23.97 51.77 23.68
H1 2018 70.78 24.91 65.44 26.48
H2 2018 71.46 34.14 64.27 36.69
Source: Bloomberg, GIC Research.

Gulf Investment Corporation G.S.C. and SubsidiariesAnnual Report and Accounts 2018
21
Figure 7: BRENT and WTI Mean and Volatility ($/b, %)
0
10
20
30
40
50
60
0
20
40
60
80
100
120
H12011
H22011
H12012
H22012
H12013
H22013
H12014
H22014
H12015
H22015
H12016
H22016
H12017
H22017
H12018
H22018
BRENT Mean WTI Mean BRENT Volatility (RHS) WTI Volatility (RHS)
Source: Bloomberg, GIC Research.
2.1. Oil Fundamentals and Prices
Geopolitical tensions, gloomy global economic growth outlook, and trade tensions are among major factors that affected oil prices during 2018. Excess oil supplies and the consequent inventories buildups placed a cap on oil prices during the year, preventing relatively solid recoveries in the price of oil, which hovered around $71 a barrel, compared to $54 a barrel in 2017. According to EIA estimates, global inventories ticked higher by 0.4 mb/d on average in 2018 and by 1.0 mb/d in the fourth quarter of 2018, adding additional downward pressure on oil prices24.
Total oil production witnessed a modest increase in 2018 compared to 2017 due to higher production that came from OECD members and the US. Meanwhile, OPEC production fell slightly by an average 5.27% to reach 37.24 mb/d in 2018, down from 39.4 mb/d in 2017. The overall oil production increased from 99.10 mb/d in the first quarter to 101.94 mb/d in the fourth quarter of 2018.
Table 7: International Petroleum and Other Liquids Production (mb/d, 2018)
Q1 Q2 Q3 Q4 2018
OECD 29.14 29.27 30.25 30.88 29.89
US 16.77 17.39 18.40 18.91 17.87
Canada 5.32 5.10 5.18 5.25 5.21
Non-OECD 69.96 70.28 70.75 71.06 70.52
OPEC 37.40 36.97 37.22 37.37 37.24
Crude Oil Portion 32.06 31.71 31.93 31.99 31.92
Other Liquids 5.33 5.26 5.30 5.38 5.32
Eurasia 14.41 14.43 14.64 14.88 14.59
China 4.75 4.80 4.74 4.80 4.77
Other Non-OECD 13.40 14.08 14.15 14.01 13.91
Total World 99.10 99.55 101.00 101.94 100.41
Source: EIA. “Short-Term Energy Outlook”. January 2019.
24. EIA. “Short-Term Energy Outlook”. January 2019.

22
Economic Review
Figure 8: International Petroleum and Other Liquids Production: 2017 vs. 2018 (mb/d)
0 20 40 60 80 100
Total World
Non-OECD
OPEC
OECD
US
Eurasia
Other Non-OECD
Canada
China2018 2017
Source: EIA. “Short-Term Energy Outlook”. January 2019, GIC Research.
Meanwhile, global consumption for the year grew on average by 1.61 mb/d to 100 mb/d in 2018 compared to 98.39 mb/d in 2017. Oil demand increased modestly from 99.18 mb/d in the first quarter to 100.94 mb/d in the last quarter of 2018. Initially, the increase in consumption was due to rising demand from non-OECD members, China, and the US. However, oil demand eased in Japan and across other non-OECD members.
Table 8: International Petroleum and Other Liquids Consumption (mb/d, 2018)
Q1 Q2 Q3 Q4 2018
OECD 47.58 46.94 47.86 48.12 47.63
US 20.24 20.33 20.63 20.64 20.46
Canada 2.32 2.34 2.54 2.46 2.42
Europe 14.05 14.19 14.63 14.31 14.30
Japan 4.27 3.43 3.53 3.88 3.78
Non-OECD 51.60 52.55 52.52 52.83 52.38
Eurasia 4.78 4.83 5.11 4.98 4.93
China 13.80 14.00 13.73 13.95 13.87
Other Asia 13.58 13.82 13.42 13.82 13.66
Other Non-OECD 18.69 19.16 19.60 19.32 19.17
Total World 99.18 99.49 100.37 100.94 100.00
Source: EIA. “Short-Term Energy Outlook”. January 2019.

Gulf Investment Corporation G.S.C. and SubsidiariesAnnual Report and Accounts 2018
23
Figure 9: International Petroleum and Other Liquids Consumption: 2017 vs. 2018 (mb/d)
0 20 40 60 80 100
Total World
Non-OECD
OECD
US
Other Non-OECD
Europe
China
Other Asia
Eurasia
Japan
Canada2018 2017
Source: EIA. “Short-Term Energy Outlook”. January 2019, GIC Research.
Figure 10: World Liquid Fuels Production and Consumption Balance (mb/d)
-1
-0.5
0
0.5
1
1.5
2
2.5
3
84
86
88
90
92
94
96
98
100
102
104
Implied Stock Change and Balance (RHS) World Production World Consumption
Q1:14
Q2:14
Q3:14
Q4:14
Q1:15
Q2:15
Q3:15
Q4:15
Q1:16
Q2:16
Q3:16
Q4:16
Q1:17
Q2:17
Q3:17
Q4:17
Q1:18
Q2:18
Q3:18
Q4:18
Source: EIA, Short Term Energy Outlook. Several issues and GIC Research.
2.2. US Crude Oil Production
US crude oil production exceeded 10 mb/d for the first time in 48 years in November 2018, as oil production is witnessing solid growth since 2016, driven mainly by higher shale oil production. In the meantime, the US is set to be the top oil producer in 2018 as crude oil production reaching 11.7 mb/d by yearend.

24
Economic Review
Figure 11: US Crude Oil Production: Share of Shale Oil to Total Oil Production (m b/d)
54%
56%
58%
60%
62%
64%
66%
68%
70%
0
2
4
6
8
10
12
14
Shale Other oil Share of Shale oil production to Total (RHS, %)
Dec-20
15
Feb-20
16
Apr-201
6
Jun-2
016
Aug-20
16
Oct-20
16
Dec-20
16
Feb-20
17
Apr-201
7
Jun-2
017
Aug-20
17
Oct-20
17
Dec-20
17
Feb-20
18
Apr-201
8
Jun-2
018
Aug-20
18
Oct-20
18
Dec-20
18
Source: EIA, Weekly US Field Production of Crude Oil, GIC Research.
3. GCC Economies ReviewGCC’s real GDP has recovered in 2018 to 2.7% from a contraction of 0.4% in 2017. Moreover, all six countries have realized positive growth rates with the UAE and Oman outperforming the region with growth rates of 2.9% and 2.8% respectively. The Saudi economy has achieved a yearly growth of 2.4%, followed by Qatar at a rate of 1.9%, Bahrain at 1.4% and Kuwait at 1.2%.
Table 9: Real GDP Growth (% Change)
2015 2016 2017 2018
Bahrain 2.9 3.5 3.8 1.4
Kuwait 0.7 2.8 -2.8 1.2
Oman 5.0 4.5 -0.5 2.8
Qatar 3.7 2.1 1.6 1.9
Saudi Arabia 4.1 1.7 -0.9 2.4
United Arab Emirates 5.1 3.0 0.8 2.9
GCC 3.8 2.4 -0.4 2.7 f
f: IIF Forecast.
Source: IIF. Respective Country’s Database.
Meanwhile, the average contribution of hydrocarbons to real GDP in the GCC slightly dropped from 37.3% in 2017 to 36.9% in 2018. Kuwait was the most dependent member on hydrocarbons, as it accounted for more than 47.5% of its real GDP. Bahrain was the least hydrocarbons-dependent with 18.2%.

Gulf Investment Corporation G.S.C. and SubsidiariesAnnual Report and Accounts 2018
25
Figure 12: Hydrocarbon’s Contribution to Real GDP in GCC (%)
0
10
20
30
40
50
60
Bahrain Kuwait Oman Qatar KSA UAE
2015 2016 2017 2018
Source: IIF. Respective Country’s Database, GIC Research.
Non-hydrocarbon real GDP for GCC economies registered a fair growth in 2018. Qatar registered the highest real non-hydrocarbon growth of 4.8%, followed by the UAE at 3%, Kuwait at 2.6%, Bahrain and Oman at 2.5% and 2.3%, respectively. Although Saudi Arabia underperformed the region, non-hydrocarbon real GDP growth increased from 0.9% in 2017 to 1.8% in 2018.
Table 10: Non-Hydrocarbon Real GDP Growth (% Change)
2015 2016 2017 2018
Bahrain 3.6 4.3 4.9 2.5
Kuwait 0.4 1.6 2.2 2.6
Oman 5.4 5.2 1.2 2.3
Qatar 8.5 5.3 3.8 4.8
Saudi Arabia 3.2 0.2 0.9 1.8
United Arab Emirates 5.0 3.2 2.5 3.0
Source: IIF. Respective Country’s Database.
Furthermore, the size of fiscal deficit as a share of GDP shrank from 5.6% in 2017 to 0.9% in 2018. Kuwait continued to outperform its peers maintaining the highest positive fiscal balance accounting for 9% of GDP. The UAE and Qatar have finally achieved positive fiscal balances by the end of the year after a period of continuous deficits. Although Bahrain, Oman and Saudi Arabia have concluded the year with negative balances, the sizes of the deficits have significantly shrunk compared to previous years.
Table 11: GCC Overall Fiscal Balance (% GDP)
2015 2016 2017 2018
Bahrain -18.4 -17.5 -13.6 -8.6
Kuwait -0.3 1.2 4.4 9.0
Oman -17.5 -20.9 -13.8 -6.6
Qatar -1.0 -9.2 -5.8 0.5
Saudi Arabia -15.8 -17.2 -9.3 -4.6
United Arab Emirates -3.4 -2.0 -1.6 1.9
GCC -8.9 -10.5 -5.6 -0.9f
f: IIF Forecast.Source: IIF. Respective Country’s Database.

26
Economic Review
On a positive note, the average fiscal breakeven price continued to fall shaving another $2 in 2018 to stand at $71. Although the fiscal breakeven prices for Kuwait and Qatar increased slightly, they still manage to hold the lowest breakeven prices in the region accounting for $53 in Kuwait and $60 in Qatar. Bahrain continued to endure the highest breakeven price of $96 in 2018; however, it was lower than previous years.
Table 12: GCC Fiscal Breakeven Prices ($/b)
Country 2015 2016 2017 2018
Bahrain 118 107 103 96
Kuwait 49 47 51 53
Oman 96 89 84 82
Qatar 50 53 57 60
Saudi Arabia 95 96 78 74
United Arab Emirates 65 60 65 62
GCC 79 75 73 71
Source: IIF. “Research Note: Hydrocarbon Exporters Breakeven Oil Prices Have Declined”. February 1, 2018.
3.1. Inflation
Inflation rates varied among the GCC members ranging around an average of 2.5%, fairly higher than 0.4% of the previous year. The UAE exhibited the highest increase in consumer prices accounting for 3.6% up from 2% the year before. Saudi Arabia and Bahrain logged 2.5% increase in prices followed by Kuwait and Oman with 0.9% and Qatar with 0.6%.
Table 13: Average Consumer Prices (y-o-y % Change)
2015 2016 2017 2018
Bahrain 1.8 2.8 1.4 2.5
Kuwait 3.3 2.9 1.6 0.9
Oman 0.1 1.1 1.6 0.9
Qatar 1.9 2.7 0.4 0.6
Saudi Arabia 1.2 2.0 -0.8 2.5
United Arab Emirates 4.1 1.6 2.0 3.6
GCC 2.2 2.1 0.4 2.5f
f: IIF Forecast.Source: IIF. Respective Country’s Database.
3.2. GCC Trade
GCC’s total exports increased significantly in 2018 surpassing the levels of the previous year. However, looking at breakdown of exports, the growth in hydrocarbon exports far exceeded the growth in non-hydrocarbons. The annual increase in hydrocarbon exports ranged around an average of 33% with the minimum level being at 24%, while the growth in non-hydrocarbon exports averaged around 7%. Noteworthy, The UAE was the only country in the region to have nonhydrocarbon exports exceeding the hydrocarbons, with a ratio of 3:1.
Furthermore, changes in the level of total imports varied among member countries. For example, the imports of Kuwait and Bahrain have edged up by 16% and 13% in 2018 respectively. On the other hand, Saudi imports have no significant change compared to 2017.

Gulf Investment Corporation G.S.C. and SubsidiariesAnnual Report and Accounts 2018
27
Table 14: GCC’s Trade ($ bn)
2015 2016 2017 2018
Hydrocarbon Exports
Bahrain 7.74 6.08 8.41 10.46
Kuwait 48.48 41.46 49.29 67.47Oman 21.16 15.94 19.13 25.75Qatar 62.69 46.53 55.10 69.04KSA 153.25 136.59 170.67 236.42UAE 63.72 54.59 61.67 84.26Non-Hydrocarbon Exports
Bahrain 8.80 6.70 6.96 7.03
Kuwait 5.99 5.05 5.85 6.26Oman 14.48 11.57 13.71 15.80Qatar 14.61 10.78 12.39 12.64KSA 50.63 47.02 51.19 58.71UAE 236.76 240.44 246.84 246.45Total Imports
Bahrain 15.71 13.59 16.08 18.09
Kuwait 23.95 24.64 18.55 21.44Oman 26.53 21.26 24.09 26.02Qatar 28.50 31.93 30.77 32.04KSA 159.27 127.84 123.40 123.14UAE 223.91 226.58 229.24 236.33
Source: IIF. Respective Country’s Database.
4. Equity Markets Review
4.1. GCC Equity Markets Overview
GCC equity markets had a positive run during the course of 2018 and the S&P GCC composite index added a net 12.8% for the year, marking the best yearly returns in 5 years. This gain was partly driven by the decision to include Saudi Arabia into the FTSE and MSCI EM indices and the proposal by MSCI to retain Kuwait on the watch-list for potential inclusion to the MSCI EM index at its next annual review in 2019. In addition, the Qatar bourse witnessed a strong rebound that placed it among the best-performing equity markets in the world.

28
Economic Review
Figure 13: Rebased performance of GCC indices, 2018
60
70
80
90
100
110
120
130
Jan-18 Feb-18 Mar-18 Apr-18 May-18 Jun-18 Jul-18 Aug-18 Sep-18 Oct-18 Nov-18 Dec-18
Saudi - Tadawul Index Kuwait - KWSE Index
Dubai - DFM Index Abu Dhabi - ADSM Index
Qatar - DSM Index Oman - MSM Index
Bahrain - BSE Index
Source: Bloomberg, GIC Research.
The first half of the year was marked by mostly positive sentiment amidst buoyant oil prices, the continuation of an expansionary spending stance by most regional governments, and an overall improvement in corporate earnings, which was supported by stronger fund flows targeting the index inclusion story, among other factors. However, the momentum faltered in the second half of the year, dragged by the correction in oil prices and regional geo-political issues that caused an outflow of liquidity from the markets, particularly from the larger bourses in Saudi Arabia and the UAE.
We also witnessed an extended decoupling of the earlier correlation between oil prices and equity markets in the second half of the year, as the GCC composite remained largely unaffected by the sharp correction in oil prices. The outflow of foreign institutional funds towards the end of the year, and the influence of retail investors on market direction, increased the volatility of market returns.
Figure 14: Performance of S&P GCC Composite Index (2009-2018)
18.9% 17.0%
-4.5%
7.1%
30.1%
0.6%
-14.6%
8.5%
3.3%
12.8%
-20%
-15%
-10%
-5%
0%
5%
10%
15%
20%
25%
30%
35%
FY 2009 FY 2010 FY 2011 FY 2012 FY 2013 FY 2014 FY 2015 FY 2016 FY 2017 FY 2018
Source: Bloomberg, GIC Research.

Gulf Investment Corporation G.S.C. and SubsidiariesAnnual Report and Accounts 2018
29
The year started on an optimistic tone for most GCC markets, as they managed to overcome some of the weakness in sentiment that was seen in markets at the end of 2017. The rally in oil prices and expectations for inclusion of the Saudi and Kuwait markets to the FTSE EM index were the key drivers for the markets. Though the FTSE decision to include Saudi Arabia in its EM index came towards the end of the first quarter, the formal announcement was preceded by a rally that stretched through most of March, as key large-cap stocks that fulfilled the criteria for index inclusion attracted interest in the run-up.
The sentiment surrounding the index inclusion story continued into the second quarter as well, after rising expectations for the inclusion of the Saudi and Kuwait markets to the MSCI EM index. At the June meeting, it was decided that Saudi Arabia would be added to the MSCI EM index in 2019, while Kuwait was placed on the watch-list for potential inclusion pending a review in June 2019. Sustained gains in oil prices that lifted both Brent and WTI crude to three-and-a-half year highs, and an improvement in the outlook for both oil and non-oil GDP growth for the regional economies helped to support sentiment in the markets.
At the beginning of the third quarter, the GCC equity markets managed to continue the positive momentum of the previous two quarters. However, returns during the latter part of the quarter was marred by regional geo-political issues that raised the level of volatility and caused an outflow of liquidity from the markets, particularly from the larger bourses in Saudi Arabia and the UAE. The sentiment in the Dubai bourse remained lackluster during most of the three quarters, with investors sidestepping the mainstream Real Estate sector, and most other sectors feeling the heat from the poor sentiment.
The fourth quarter of the year saw a marginal improvement in the sentiment across most markets, though volatility in the markets failed to abate. Though oil prices continued on their downward trajectory, the Saudi, Qatar, Abu Dhabi and Kuwait markets managed to generate positive returns during the quarter and remained ahead of the other peers. The Dubai, Oman and Bahrain markets lagged the others at the end of the year.
Figure 15: Trading activity on individual GCC indices for 2017 and 2018 ($ bn)
286.9
232.8
13.3
13.3
10.1
15.1
1.5
0.7
291.2
220.6
18.8
23.1
12.4
13.9
1.9
0.6
0 50 100 150 200 250 300 350
GCC Total
Saudi - Tadawul Index
Kuwait - KSWE Index
UAE - DFM Index
UAE - ADSM Index
Qatar - DSM Index
Oman - MSM 30 Index
Bahrain - BSE Index FY 2017
FY 2018
Source: Bloomberg, GIC Research.
Trading activity in the GCC also witnessed a marginal decline during 2018, as cumulative traded values on the seven benchmark indices declined by around 1% to $286.9 billion in 2018, compared to $291.2 billion in 2017. The biggest improvement in activity was recorded in Bahrain with 30%, while trading activity on the Qatar bourse increased by 9%, and that on the Saudi market by 6%. In value terms, Saudi Arabia continued to be the key driver of the increase in trading, as it accounted for 81% of the GCC total in 2018, with the share increasing from 75% of the total in 2017.
The decline in activity on the Dubai bourse was very pronounced, as the traded value declined by nearly 42% to $13.3 billion in 2018, from $23.1 billion in 2017, largely due to outflow of foreign institutional investments from the market amid weak sentiment for the key real estate sector.

30
Economic Review
4.2. GCC Markets Volatility
The GCC market indices witnessed an elevation in volatility, both in relation to the previous year, as well as in comparison to global and regional markets. This can largely be attributed to the changes in investor sentiment during the year following the correction in oil prices as well as geopolitical developments that caused an outflow of foreign funds from the region.
Table 15: Volatility of indices across the GCC markets, 2018
Year Opening Year Closing Year High Year Low Index Volatility
S&P GCC composite 155.26 175.13 181.90 154.96 10.0%Qatar - DSM index 2452.49 3079.09 10604.28 8252.66 16.0%Saudi - Tadawul index 7226.32 7826.73 8490.75 7171.74 14.5%Kuwait - KSWE index 5244.31 5652.34 5882.85 4839.04 14.2%UAE - DFM index 3370.07 2529.75 3542.44 2460.34 12.6%UAE - ADSM index 4398.44 4915.07 5079.75 4424.99 11.7%Oman - MSM 30 index 5099.28 4323.74 5119.18 4312.94 6.7%Bahrain - BSE index 1331.71 1337.26 1380.22 1257.88 6.2%
Source: Bloomberg, GIC Research.
4.3. GCC Market Capitalization
The total market capitalization of the S&P GCC Composite Index increased by 7.8% to $855.2 billion at the end of 2018, compared to $793.3 billion at the end of 2016. Of the individual country bourses, Qatar recorded the biggest improvement as the market capitalization of the benchmark DSM index rose 40.6% to $137.5 billion, lifted by the stellar gains on the index recorded during the year. The market capitalization of the biggest bourse in the GCC, the Saudi Tadawul went up by 9.9% to $495.3 billion. The UAE’s Dubai bourse recorded a contraction of 11% in its market capitalization to $70.2 billion at the end of the year, while the respective figures for the MSM in Oman and the BSE in Bahrain ceded 6.7% and 1.3% respectively.
Figure 16: GCC Market Capitalization for 2017 and 2018 ($ bn)
855.2
495.3
137.5
134.8
95.3
70.2
20.4
13.4
793.3
450.5
97.8
124.0
95.1
78.9
20.7
14.3
0 100 200 300 400 500 600 700 800 900
S&P GCC Index
Saudi - Tadawul Index
Qatar - DSM Index
UAE - ADSM Index
Kuwait - KSWE Index
UAE - DFM Index
Bahrain - BSE Index
Oman - MSM 30 Index FY 2017FY 2018
Source: Bloomberg, GIC Research.

Gulf Investment Corporation G.S.C. and SubsidiariesAnnual Report and Accounts 2018
31
4.4. Country Performances
Figure 17: Index returns, 2018
27.0%
17.8%
12.1%
7.8% 6.8%
-10.8%
-20.5% -25%
-15%
-5%
5%
15%
25%
35%
Qatar Abu Dhabi Saudi Arabia Kuwait Bahrain Oman Dubai
Source: Bloomberg, GIC Research.
After ending 2017 as the worst performing index in the region, Qatar Exchange rebounded in 2018 and was the best performing market in the GCC for the year, as the geo-political uncertainties from 2017 appear to have been largely priced in by investors. The banks and financial services sector was the best performing, driven by large-cap banks, while the industrials sector also posted robust returns. The telecommunications and insurance sectors were the only sectors to post net negative returns for the year.
At the end of a volatile year, the Saudi Tadawul emerged the third best-performing index in the GCC, and marked the third consecutive year of positive gains for the Saudi benchmark as well as the biggest y-o-y return on the index in the last five years. A strong rally in the first half of the year following the MSCI announcement, was marred in the second half as geopolitical uncertainties and weakness in oil prices prompted an outflow of foreign funds from the bourse. At the end of the year, the media and banks sectors emerged the best-performing with net gains in excess of 30% each. While the materials sector, which includes the large-cap petrochemicals names managed a modest gain of 3.9% for the year, the consumer sectors did not fare well due to demographic and demand challenges. The real estate and utilities sectors were the least-performing sectors for the year.
Boursa Kuwait recorded gains for the third consecutive year, led by higher buying in large-cap stocks, following the implementation of a new market structure in April. This was bolstered towards the end of Q2 by its addition to the MSCI watch list for potential upgrade to EM status, pending finalization in June 2019. The banks and oil and gas sectors on Boursa Kuwait, were the best-performing, while the consumer goods and real estate sectors were the least-performing.
The twin UAE bourses were a study in contrasts, as the Dubai market witnessed sustained pressure from local and foreign investors pushing the DFM index to the position of one of the worst-performing indices globally, even as the Abu Dhabi bourse clocked robust gains. The Dubai market was affected by weakness in the key real estate sector and none of the sector indices recorded net gains for the year. Foreign investors were net sellers as the market sentiment remained weak through the course of the year. Though weakness persisted in the real estate sector in Abu Dhabi as well, the banks sector managed to record robust gains.
Alongside Dubai’s DFM index, Oman’s MSM 30 index was the only other index to record a net loss in returns for the year. The industries sector notched the poorest returns for the year. The banks and services sectors fared only marginally better as all three sector indices registered net negative returns for the year.
Bahrain’s BSE index closed the year with positive albeit modest gains relative to its GCC peers, extending its winning streak to two years in a row amid a significant improvement in volumes. The services sector was the best-performing and only sector to record positive returns for the year, while all the other sectors registered negative returns for the year.

32
Economic Review
Table 16: Index Returns for 2018
31 December 2017 31 December 2018 % Change
S&P GCC Composite Index 155.26 175.13 12.8%
Qatar - DSM Index 8,523.38 10,299.01 27.0%
UAE - ADSM Index 4,398.44 4,915.07 17.8%
Saudi - Tadawul Index 7,226.32 7,826.73 12.1%
Kuwait - KSWE Price Index 5,244.31 5,652.34 7.8%
Bahrain - BSE Index 1,331.71 1,337.26 6.8%
Oman - MSM 30 Index 5,099.28 4,323.74 -10.8%
UAE - DFM Index 3,370.07 2,529.75 -20.5%
Source: Bloomberg, GIC Research.
4.5. Relative Performance of S&P GCC Composite Index to Global Benchmarks
During the year, the S&P GCC Composite Index out-performed all of the major international benchmarks, including the MSCI EM, MSCI World, and MSCI Frontier Markets indices by a large margin. All the other indices used for the comparison here, with the exception of the S&P Pan Arab index, registered net losses for the year.
Figure 18: Rebased Performance of S&P GCC Composite Index to Global Benchmarks, 2018
80
85
90
95
100
105
110
115
120
Jan-18 Feb-18 Mar-18 Apr-18 May-18 Jun-18 Jul-18 Aug-18 Sep-18 Oct-18 Nov-18 Dec-18
S&P GCC Index
S&P Pan-Arab Index
MSCI World Index
MSCI EM Index
S&P Frontier Markets Index
Source: Bloomberg, GIC Research.
4.6. Relative Performance of S&P GCC Composite Index to Oil Prices
In the second half of 2018, we witnessed an extended decoupling of the earlier strong correlation between oil prices and equity markets in the GCC. The GCC composite index retained its composure, driven by the index inclusion story and strong fund flows, despite the sharp correction in oil prices.

Gulf Investment Corporation G.S.C. and SubsidiariesAnnual Report and Accounts 2018
33
Figure 19: Rebased Performance of S&P GCC Composite Index to Global Benchmarks, 2018
150
155
160
165
170
175
180
185
190
45
50
55
60
65
70
75
80
85
90
Jan-18 Feb-18 Mar-18 Apr-18 May-18 Jun-18 Jul-18 Aug-18 Sep-18 Oct-18 Nov-18 Dec-18
Brent Crude (USD/bbl, LHS)
S&P GCC index (RHS)
Source: Bloomberg, GIC Research.
4.7. Treasuries
2018 has been a tough year for US treasuries, considered as the worst year since 201325. US bond yields remained flat during the year, yet finally reversing the negative returns to a 0.32% y-o-y return on December 21. US yields started the year at 2.41% and closed the year at 2.68%, low by all historical standards. Meanwhile, the European economies witnessed subtle movements in their 10-year government bond yields during 2018. For instance, Greece registered the highest yields in the euro zone, opening the year at 4.02%, yet closing at 4.4%. Spain did not change substantially as the yields started the year at 1.57% and reached 1.42% by year-end, maintaining the lowest yields throughout the year.
Figure 20: Euro Area and US 10-year Government Bond Yields during 2018
0
0.5
1
1.5
2
2.5
3
3.5
4
4.5
5
12/31/2017 3/31/2018 6/30/2018 9/30/2018 12/31/2018
US Portugal Greece Spain Italy
Source: Bloomberg, February 2019 and GIC Research.
25. Bloomberg. “Tough Year for Treasuries Ends With $131 Billion Auction”. December 23, 2018.

34
Economic Review
Table 17: Volatility of Spreads, 2018
US Portugal Greece Spain Italy
Opening Value 2.405 1.943 4.115 1.567 2.016
Closing Value 2.684 1.722 4.398 1.416 2.742
Average 2.908 1.847 4.195 1.434 2.601
Standard Deviation 0.158 0.123 0.246 0.121 0.589
Minimum Value 2.405 1.609 3.657 1.164 1.717
Maximum Value 3.237 2.193 4.799 1.735 3.686
Source: Bloomberg, February 2019.
Table 18: Government Bond Yields during 2018 (%)
US Portugal Greece Spain Italy
Q1 2.7389 1.609 4.317 1.164 1.786
Q2 2.8601 1.787 3.96 1.321 2.68
Q3 3.0612 1.878 4.184 1.5 3.147
Q4 2.6842 1.722 4.398 1.416 2.742
Source: Bloomberg, February 2019.
4.8. Credit Default Swaps (CDS)
CDS did not display major changes during the year in the Euro area with some rapid increases between April and May, and then returned to earlier levels. With the exception of Italy, which exhibited a substantial spike, starting the year at 118.37bps and closing the year at 207bps. The GCC’s region CDS demonstrated almost no change, except the case of Bahrain, the highest in the region in terms of CDS, closing the year at 291bps, slightly higher than 2017 year-end level.
Table 19: CDS Performance, 2018
Portugal Ireland Greece Spain Italy US Bahrain Abu Dhabi Dubai
Opening 95.00 25.29 397.70 56.54 118.37 23.76 276.56 61.66 122.43
Closing 89.11 42.07 481.17 80.09 207.56 21.83 291.54 67.13 129.22
Average 89.171 30.301 373.968 62.018 184.680 21.088 314.940 62.527 118.146
Minimum Value 14.963 6.866 45.756 16.644 70.082 1.444 59.125 4.727 9.807
Maximum Value 62.110 20.985 295.345 35.755 84.900 18.110 227.470 50.125 95.880
Source: Bloomberg, February 2019.
4.9. GCC Monetary Policy
Private sector credit growth in the GCC trended upwards during 2018. Saudi private sector credit growth moved up from (-0.8%) in 2017, to 2.9% in 2018. In Bahrain, however, private sector credit growth increased from 2.5% to 9.6%, and in the UAE from 0.7% to 3.6%. Meanwhile, Kuwait witnessed minor changes as private sector credit growth fell slightly from 2.8% in 2017 to 2.6% in 2018. Oman’s private sector credit growth increased marginally from 23.6% in 2017 to 24.8% in 2018.

Gulf Investment Corporation G.S.C. and SubsidiariesAnnual Report and Accounts 2018
35
Table 20: Private Sector Credit Growth (% change)
2014 2015 2016 2017 2018
Bahrain -5.90 7.60 1.50 2.50 9.60
Kuwait 5.20 7.90 2.50 2.80 2.60
Oman 18.00 20.20 22.10 23.60 24.80
Qatar 20.30 19.70 6.50 6.40 8.60
KSA 11.60 9.20 2.40 -0.80 2.90
UAE 11.50 8.40 5.80 0.70 3.60
Source: IIF, February 2019.
As rate hikes took place in the GCC in 2015, it continued through 2018. In Bahrain, rates ticked higher from 1.75% in 2017 to reach 2.75% in 2018. In Kuwait, policy rates increased from 2.75% in 2017 to 3.0% in 2018. Meanwhile, interest rates increased in Oman from 1.95% in 2017 to reach 2.9% 2018. In the UAE, ticked higher from 2.25% in 2017 to 3.0% in 2018. Noteworthy, the policy rate in the Saudi economy increased from 1.5% in 2017 to 2.25% in 2018.
Table 21: Policy Rate (EOP)
2014 2015 2016 2017 2018
Bahrain 0.50 0.75 1.00 1.75 2.75
Kuwait 2.00 2.25 2.50 2.75 3.00
Oman 1.00 1.00 1.19 1.95 2.90
Qatar 1.00 1.31 1.90 2.20 2.25
KSA 0.25 0.50 0.75 1.50 2.50
UAE 1.00 1.25 1.50 2.25 3.00
Source: IIF.
In addition, money supply growth rate varied across the GCC in recent years. For instance, while the growth rate of monetary aggregate (M3) has slightly dropped in Kuwait to reach 3.5%. In Saudi Arabia, M3 increased from 1.5% to 2.5% in 2018. Meanwhile, M2 decreased sharply in Qatar from 21.3% in 2017 to 9% in 2018. Oman witnessed slightly sharper drops in M2 from 4.2% to 1%, while it remained stable in the UAE.
Table 22: GCC Money Supply (% Change)
2014 2015 2016 2017 2018
Bahrain 3.70 2.20 1.10 4.20 1.30
Kuwait 3.20 1.70 3.50 3.80 3.70
Oman* 15.30 10.00 1.80 4.20 1.00
Qatar* 10.60 3.40 -4.60 21.30 9.00
KSA 0.25 0.50 0.75 1.50 2.50
UAE* 7.90 5.50 3.30 4.10 4.00
*M2 not M3.Source: IIF, February 2019.

FINANCIAL REVIEW

Gulf Investment Corporation G.S.C. and SubsidiariesAnnual Report and Accounts 2018
37
Net Income Analysis
Gulf Investment Corporation (GIC) posted consolidated net profit of US$ 107 million for the year 2018 compared to US$121 million in 2017. This is after impairment provisions of US$18 million (2017: US$60 million) which mainly relates to investment in associates and provision for Expected credit loss on receivables and guarantees. Net change in share of other comprehensive loss of associates totaling to US$41 million (2017: gain of US$25 million and other comprehensive loss on available for sale assets of US$19 million) taking the consolidated total comprehensive income to US$66 million (2017: US$127 million).
Decline in profit was due to the muted performance from Global market portfolios which includes GCC Bond portfolio, Global Equities, private equity funds and hedge funds which was marginally offset by better results of investments in associates and reduction in impairment loss.
The Group has not restated comparative information for the year ended 31 December 2017 as permitted by the transitional provisions of IFRS 9 standard. Therefore, the information presented for the year ended 31 December 2017 does not reflect the requirements of IFRS 9 and is not comparable to the information presented for the year ended 31 December 2018. The profit for the year ended 31 December 2017 would have been US$ 102 million if the Corporation had adopted IFRS 9 effective from 1 January 2017, except adjustments for expected credit loss on financial assets.
Interest Income
Interest income is generated from the portfolio of debt securities and the money market book.
Gross interest income for the year US$44 million is 21% lesser than previous year. 73% of the interest income is contributed by securities. The gross interest income from securities decreased due to the decline in average volume compared to last year. The reduction in securities balance was in line with the new investment policy.
Net Gains from Investments
Net gains from investments represent the realized gain on sale of financial assets at fair value through statement of income, investment in associate, investment in subsidiaries, in addition to fair value change on financial assets at fair value through statement of income.
The Corporation adopted IFRS 9 effective 1 January 2018 and reclassified financial assets available for sale (AFS) to financial assets at fair value though income statement (FVTPL). GIC recorded a net loss of US$4 million during 2018 (2017: gain of US$82 million) comprise of realized gains on financial assets at fair value through income statement of US$25 million (2017: realized gain on financial assets available for sale of US$ 60 million and realized gain from financial assets at fair value through statement of income of US$ 7 million) and Unrealized loss of US$33 million (2017: gain of US$ 15 million) from financial assets at fair value through statement of income. During the year 2018, GIC also recorded a gain on sale of a subsidiary company amounting to US$ 4 million.
Dividend Income
Dividend income of US$10 million (2017: US$12 million) comprises of receipts from equity participations, private equity funds, equities and managed funds. Dividends from principal investment portfolio amounted to US$4 million compared to US$5 million in 2017. The balance contribution is from quoted GCC equities portfolio US$ 5 million and private equity funds US$1 million.
Share of Results of Associates
Share of results of associates accounted during the year amounted to profit of US$143million compared to prior year profit of US$131 million. The major factor in the improved share of results in comparison to previous year was due to the better results of associates operating in Chemical and Metal industries and supported by continuing good performance of power & water and aircraft leasing companies.
Net Fees, Commission and Other Income
Income for the year amounted to US$17 million (2017: US$3 million) includes the change in fair value of contingent consideration on acquisition of an associate of US$6 million (2017: US$2 million) and receipt of US$ 7 million from fully written off investment.
Financial Review
38
Other Operating Income
Other operating income represents the income from consolidated subsidiaries amounting to US$ nil compared to US$1 million in previous year (note 17).
Interest Expense
Interest expense decreased by 33 % compared to prior year to reach US$33 million for the year, which can be mainly attributed to the decrease in the overall funding volume compared to last year which includes the maturity of US$ 400 million, whereas the interest rates slightly increased from last year.
Operating Expenses
Efficiency in operations and higher productivity was achieved with strict control over operating expenses which resulted in a decline of 5% compared to last year to reach US$52 million.
Impairment losses
Net charge for the year in impairment losses totaled US$18 million, compared to US$60 million recorded in 2017. Impairment losses for the year 2018 mainly relates to investment in associates of US$12 million (2017; Nil) and provision for Expected credit loss on other assets of US$3 million and guarantees of US$2 million. Impairment losses for 2017 mainly related to exposures in an unquoted GCC company and investment in a subsidiary company. Due to the change in classification of financial assets from AFS to FVTPL, no impairment losses for the year 2018 compared to a charge of US$ 31 million in 2017.
A detailed breakdown is provided in Note 18 to the Financial Statements.
Balance Sheet Analysis
GIC is implementing new investment policy with reduced leverage and rebalanced portfolios to achieve higher returns at reduced level of risk. Initiatives were implemented both, on the assets and liabilities sides reducing the asset base to US$3,498 million. Equity at US$2,598 million decreased by US$49 million compared to last year.
The Corporation’s strategic focus continues to be on the GCC states. Note 20 to the Financial Statements sets out the geographic distribution of the Corporation’s credit risk exposure.
The following sections provide details on the key components of the balance sheet:
Financial Assets at Fair Value through Statement of Income
As explained in the beginning, GIC reclassified all financial assets AFS of US$1,702 million to FVTPL as at 1 January 2018 resulting in the huge increase in the FVTPL balance. As at 31 December 2018, financial assets at fair value through statement of income amounted to US$1,411 million declined 33 % from the prior year combined balance of AFS & FVTPL mainly due to the reduction in GCC debt portfolio and hedge funds portfolio. Debt and other interest bearing securities, constituting 49% of the FVTPL decreased by US$ 479 million from the combined balance of AFS & FVTPL debt instruments of last year.
The debt portfolio is mainly made up of plain floating rate notes, fixed rate securities and structured products. This portfolio is monitored against stringent internal guidelines, ensuring that high quality is maintained. Major portion of the portfolio is comprised of investment grade issuers and high quality GCC sovereign credits. A credit risk analysis of the investment securities portfolio is provided in the risk management section of this report.
FVTPL also include investments in Equities and managed funds of US$396 million, Equity participation amounting to US$238 million and International & GCC private equity fund exposures of US$88 million. Investment in Equities and managed funds decreased by US$140 million by reducing exposure in hedge and other alternative funds by US$83 million and GCC and global quoted equity investments by US$57 million. Decrease in Equity participations is mainly due to decrease in the market value of quoted projects of US$12 million and unquoted investment of US$4 million along with sale of some quoted equity investments amounting to US$ 28 million.
Gulf Investment Corporation G.S.C. and SubsidiariesAnnual Report and Accounts 2018
39
The private equity funds are principally invested in equity investments of a structured finance nature with a wide range of externally managed private equity funds. These funds invest in leveraged and un-leveraged acquisitions, privatizations, recapitalizations, rapidly growing companies, expansion financings, turnaround situations, and other special equity situations.
Financial Assets Available for Sale
Due to the reclassification from AFS to FVTPL balance, no Balance in AFS as at 31 December 2018.
Investment in Associates
An associate is a company over which the Group exerts significant influence. The Corporation’s investments in associates are accounted for using the equity method of accounting. Under the equity method, investment in associate is initially recognized at cost and adjusted thereafter for the post-acquisition change in the Corporation’s share of net assets of the investee company.
Principal investments in viable business ventures in the GCC region is the core activity of GIC. The focus has been on niche sectors like Metal, Chemical, Power & Utilities, Financial services and Building materials, where a sustainable competitive advantage has been built.
Investment in associates at US$1,624 million increased by US$34 million which is mainly due to the share of results, investment in new associate companies, additional contributions to the existing companies, dividend received and share of net change in revaluation reserves.
Other Assets
Including property and fixed assets, total other assets amounted to US$270 million at 31 December 2018. Of this US$53 million related to property and other fixed assets and US$47 million relating to Margin money paid on derivative instruments. The remaining amount comprised of accrued income receivable, trade & accounts receivables, positive fair value of derivative instruments, prepaid expenses and other miscellaneous assets net of expected credit loss on applicable assets. Details are set out in Note 7 to the Financial Statements.
Liquidity and Funding
Total borrowings at US$690 million comprise of deposits from banks and other financial institutions of US$298 million and term finance US$392 million. Term finance decreased by US$404 million compared to previous year end mainly due to the maturity of US$ 400 million and US$4 million of foreign exchange movement.
A more detailed discussion on liquidity and funding, the various risks associated with our business activities, and capital strength is included in the Risk Management section that follows.
Other Liabilities
At US$210 million other liabilities comprise of trade payables of subsidiaries, accrued interest, accrued expenses, margin money for derivative products and negative fair value of derivative instruments.
Equity
Equity at US$2,598 million decreased by US$49 million mainly due to the other comprehensive loss of US$41 million, opening balance adjustment of associates & subsidiary US$10 million and dividend paid during the year of US$ 105 million offset by net profit US$107 million.

RISK MANAGEMENT
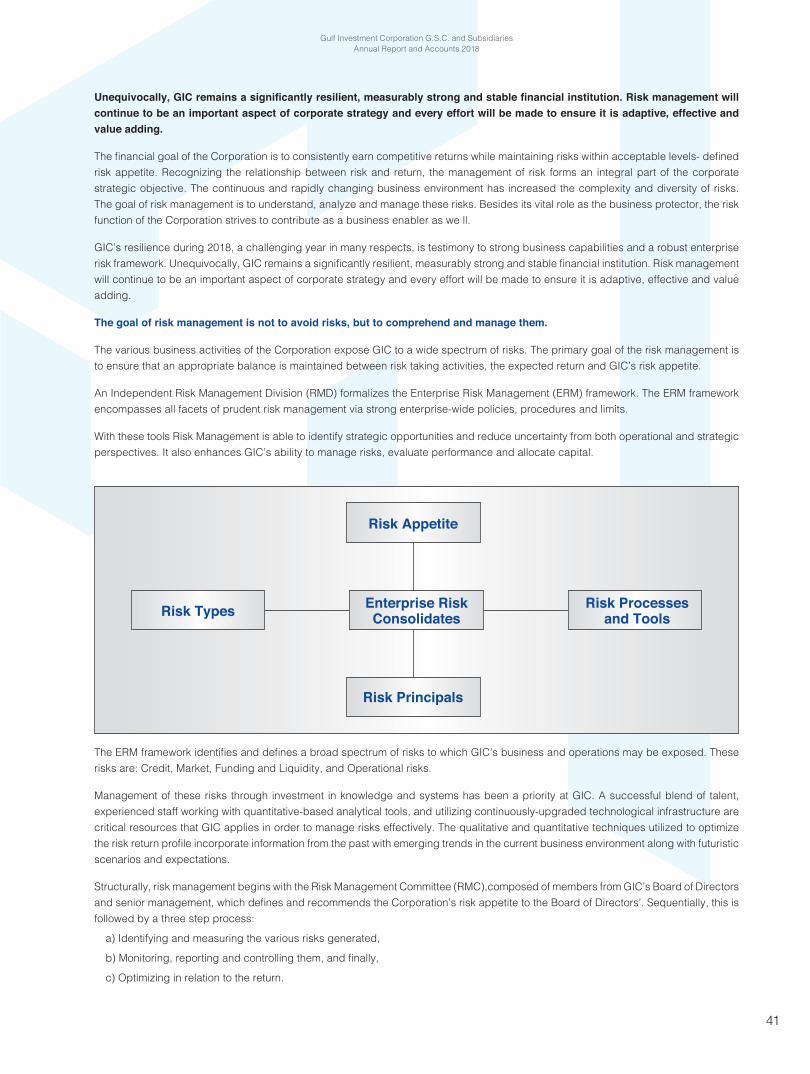
Gulf Investment Corporation G.S.C. and SubsidiariesAnnual Report and Accounts 2018
41
Unequivocally, GIC remains a significantly resilient, measurably strong and stable financial institution. Risk management will continue to be an important aspect of corporate strategy and every effort will be made to ensure it is adaptive, effective and value adding.
The financial goal of the Corporation is to consistently earn competitive returns while maintaining risks within acceptable levels- defined risk appetite. Recognizing the relationship between risk and return, the management of risk forms an integral part of the corporate strategic objective. The continuous and rapidly changing business environment has increased the complexity and diversity of risks. The goal of risk management is to understand, analyze and manage these risks. Besides its vital role as the business protector, the risk function of the Corporation strives to contribute as a business enabler as we ll.
GIC’s resilience during 2018, a challenging year in many respects, is testimony to strong business capabilities and a robust enterprise risk framework. Unequivocally, GIC remains a significantly resilient, measurably strong and stable financial institution. Risk management will continue to be an important aspect of corporate strategy and every effort will be made to ensure it is adaptive, effective and value adding.
The goal of risk management is not to avoid risks, but to comprehend and manage them.
The various business activities of the Corporation expose GIC to a wide spectrum of risks. The primary goal of the risk management is to ensure that an appropriate balance is maintained between risk taking activities, the expected return and GIC’s risk appetite.
An Independent Risk Management Division (RMD) formalizes the Enterprise Risk Management (ERM) framework. The ERM framework encompasses all facets of prudent risk management via strong enterprise-wide policies, procedures and limits.
With these tools Risk Management is able to identify strategic opportunities and reduce uncertainty from both operational and strategic perspectives. It also enhances GIC’s ability to manage risks, evaluate performance and allocate capital.
Risk Types
Risk Principals
Risk Appetite
Risk Processesand Tools
Enterprise Risk Consolidates
The ERM framework identifies and defines a broad spectrum of risks to which GIC’s business and operations may be exposed. These risks are: Credit, Market, Funding and Liquidity, and Operational risks.
Management of these risks through investment in knowledge and systems has been a priority at GIC. A successful blend of talent, experienced staff working with quantitative-based analytical tools, and utilizing continuously-upgraded technological infrastructure are critical resources that GIC applies in order to manage risks effectively. The qualitative and quantitative techniques utilized to optimize the risk return profile incorporate information from the past with emerging trends in the current business environment along with futuristic scenarios and expectations.
Structurally, risk management begins with the Risk Management Committee (RMC),composed of members from GIC’s Board of Directors and senior management, which defines and recommends the Corporation’s risk appetite to the Board of Directors’. Sequentially, this is followed by a three step process:
a) Identifying and measuring the various risks generated,
b) Monitoring, reporting and controlling them, and finally,
c) Optimizing in relation to the return.

Risk Management
42
The Risk Management team of GIC acts as a critical link between management and risk taking divisions by first assisting management to define I quantify risk appetite. The team then effectively communicates these risk appetite parameters to concerned risk takers in the Corporation in order to ensure that the risk taking activity is within the management’s acceptable levels.
Within the Corporation, responsibility for the management of risk is not restricted to a single division. The philosophy has been to encourage a culture of prudent risk management across all business and support areas.
From an “Internal Control” perspective, the process of risk management is facilitated by a set of independent functions in addition to RMD. These units reporting directly to senior management include Finance, Internal Audit, Legal and Compliance. This multi faceted approach enables the effective management of risks by identifying and monitoring them from a variety of perspectives.
The process of managing the risk categories identified above is discussed in more detail in the following sections.
CREDIT RISK
Credit risk refers to the risk of an economic loss that might arise from the failure of counterparty to fulfill its contractual obligations.
The world credit markets during 2018 witnessed increased volatilities on the backdrop of monetary policy tightening across developed markets and emerging markets alike, US policy of trade protectionism and global trade readjustment and impact on export driven economies across the globe and uncertainties surrounding Brexit and future of UK - European Union partnership. As we move into 2019, volatility in the market is expected to remain high as markets digest a higher rate environment and slower monetary policy tightening, weakening global economy, potential escalations in trade wars and geopolitical risks. GIC with its active portfolio management registered an impressive performance on the credit portfolios. GIC remained relatively unscathed during the year, registering nil credit losses, thanks to prudent proactive measures, stringent control frameworks and continuous monitoring. While the Corporation’s credit portfolio, mainly made up of debt securities, constitutes a material portion of the overall asset base, strong internal risk guidelines and proactive portfolio management ensure that high quality is maintained at all times. Notwithstanding the Corporation’s rigorous and prudent policies for provisioning, no material write-downs were required during 2018. This is a reflection of the good quality of the portfolio. Gains of approximately US$ 1.7 million were realized during the year in review within GIC’s credit portfolios.
GIC continued to focus on regional credit markets where the team has a better understanding of inherent risks. This has resulted in an enhanced risk return profile.
The Corporation continued to be flexible and ready to adapt rapidly to unforeseen events supported by the efficient utilization of conventional risk management tools, including mathematical and statistical models.
The primary tool used in the management of credit risk is a set of well-defined credit policies and procedures. In addition to communicating management’s risk appetite in the form of country, product, Industry and obligor limits, these policies also detail the process of measurement, monitoring and reporting. The stringent credit approval framework mandates a rigorous and thorough evaluation of creditworthiness of each obligor, after which limits are approved by management. Additionally, Limits for product and industry are also defined to ensure broad diversification of credit risk. Credit policies and procedures are designed to identify, at an early stage, exposures which require more detailed monitoring and review.
The credit risk management process applies pertinent statistical methods as well, to estimate expected and unexpected loss amounts for the various business activities. The system, based on the Creditmetrics methodology, enables accurate credit risk measurement on an individual exposure as well as a portfolio basis. Expected and Unexpected loss estimates are computed based on Probabilities of Default (PD) and Loss Given Default (LGD) data published by leading rating agencies.
The Debt Capital Markets (DCM) portfolio constitutes approximately 20% of the balance sheet is monitored against a Credit Value at Risk (Credit VaR) limit, approved by the board. The US$ 275 million VaR limit (99.96% confidence, 1 year), which supplements the existing notional limits for this portfolio, is based on the Creditmetrics methodology and is measured using Monte Carlo Simulation techniques.
The table below provides the Credit VaR figures for the DCM Portfolios. On 31st December 2018 the market value of this portfolio was US$ 688.4 million. As of 1st January 2018, it was US$ 1,181.3 million. The average and year end Credit VaR were down as compared to previous year end. The decrease in Credit VaR was in line with the overall reduction under DCM Portfolios.

Gulf Investment Corporation G.S.C. and SubsidiariesAnnual Report and Accounts 2018
43
Table 1: 2018 Credit Value at Risk - 99.96% confidence level, 1 year holding period
US$ 000’s Average Minimum Maximum 31 Dec 2018
Debt Portfolios 98,756 67,700 137,809 67,700
Although, business units are responsible for maintaining exposures within limits, actual exposures are continuously monitored by Independent control functions including Risk Management, Finance, Compliance and Internal Audit. Technology is a key element in the monitoring process. To illustrate, cutting edge systems that are capable of approaching “real time” monitoring and control of risk taking activities, are effectively utilized.
An activity-wise break down of the principal sources of credit risk is illustrated in the pie chart below. The proportions reflect Credit Risk Weighted Exposure, computed based on BIS capital Adequacy Guidelines. Additional details, including credit exposures by rating, sector, geography and maturity are provided in the comprehensive Basel Ill Disclosure section.
Chart 1: Sources of Credit Risk (Weighted Credit Risk Exposure)
89% Projects, Private Equity & Other funds
3% Sovereign & PSE
3% Banks
2% Corporates
2% Other Assets
1% Securitization and Structured Investment Vehicles
Noteworthy, most of the realignment in the credit risk pie at the end of 2018 compared to the previous year end, pertained to Projects, Private Equity & other funds. Credit risk weighted exposure for Projects, Private Equity & other funds increased from 81% of total in 2017 to 89% at the 2018 year-end and for Banks decreased from 5% in 2017 to 3% at the 2018 year end and for Sovereigns & PSE decreased from 7% of total in 2017 to 3% at the 2018 year-end. The two key components of total credit risk exposure were Projects, Private Equity & other funds, and debt securities of banks, sovereign & PSE and Corporates.
The projects activity mainly focuses on the GCC countries, a region whose thriving dynamics we comprehend well and where we have a better understanding of the inherent risk. Investments are made after rigorous qualitative and quantitative analysis, and where the desired risk-return Objectives are met. As highlighted in the graph below, a healthy diversification across industry sectors is maintained within this portfolio. Private Equity and other Equity Funds represent investments made with third party fund managers typically in the United States and Europe who are selected after careful assessment of their records and extensive due diligence.
Chart 2: Principal Investing (Projects) by Industry
66% Metals & mining
9% Chemicals
6% Independent PowerProducers & Energy Traders
5% Telecommunication Services
4% Trading Companies & Distributors
3% Transportaion
2% Food Products
1% Building Products,Construction & Engineering
1% Insurance & Capital markets
1% Containers & Packaging
1% Electrical Equipment
1% Education &Health Care Service

Risk Management
44
Off-balance Sheet Financial Instruments
In the normal course of its business, the Corporation utilizes derivatives and foreign exchange instruments to meet its financial needs, to generate trading revenues and to manage its exposure to market risk.
In the case of derivatives and foreign exchange transactions, procedures Similar to on balance sheet products are used for measuring and monitoring credit risk. Credit risk weighted exposure to off balance sheet products amounted to nearly 0.2% of total credit risk weighted exposure.
At the year-end 2018, there were no outstanding derivatives held for trading. Off balance sheet transactions also include credit related contingent items designed to meet the financial requirement of the Corporation. A detailed credit risk analysis of credit- related contingent items, derivatives and foreign exchange products is set in Notes 20, 21 & 22 to the Consolidated Financial Statements.
In an uncertain and volatile global credit market, the Corporation will continue to adhere to strong internal risk controls.
While the mechanism of risk monitoring and control has been fostered further, the risk management function is now more engaged with the business units, having been brought forward within the investment process. In addition to incorporating additional credit information, including Credit Default Swap (CDS) prices, equity prices and market Implied ratings within the credit analyses framework, the monitoring and reporting frequency has also been increased.
MARKET RISK
Market risk is the possibility of loss from changes in value of financial instruments, resulting from an adverse change in market factors.
Within the Corporation, market risk is made up of three key risk constituents - interest rate risk, equity risk and foreign exchange risk. A breakdown, based on risk constituents, is provided below for the combined mark-to-market and Investment activities, within the Global Markets Group alone (strategic equity positions within the Principal Investment business are not included). The percentages shown on the pie chart reflect average VaR amounts, considered independently, and ignore the effects of diversification across risk classes.
Chart 3: Market Risk Constituents- Overall
46% Interest rate
52% Equity
2% FX
Market risk is measured, monitored and managed, both on a notional basis, and using a Market Value- at-Risk (Market VaR) concept. A blend of quantitative statistical methods combined with expert judgments and experienced talent is used to effectively manage market risk. A system of limits and guidelines restrain the risk taking activity with regard to individual transactions, net positions, volumes, maturities, concentrations, maximum allowable losses and other parameters. It ensures that risks are within the acceptable levels in terms of notional amounts. The VaR based system provides a more dynamic measure of market risk, capturing in a timely manner the impact of changes in the business environment on the value of the portfolio of financial instruments.
Market VaR is calculated and reported to senior management on a daily basis at various levels of consolidation including portfolio, business unit and Corporation.
The following table provides Total Value-at-Risk statistics for Global Markets Group by risk factor (please note: Total Global Markets Group VaR excludes Strategic Equity Investments within Principal Investing). These VaR measures are based on a 95% confidence level, 25 day holding period and use historical data sets.

Gulf Investment Corporation G.S.C. and SubsidiariesAnnual Report and Accounts 2018
45
Table 2: Market Value at Risk for Global Markets Group alone - 25 day holding period, 95% confidence level
2018
US$ 000’s Average Minimum Maximum 31-Dec-18
Interest rate 8,600 6,790 10,791 7,021
Equity 9,734 7,182 12,143 9,670
Foreign Exchange 281 152 407 300
Total* 11,749 10,496 13,746 10,669
2017
US$ 000’s Average Minimum Maximum 31-Dec-17
Interest rate 18,587 10,951 24,982 10,791
Equity 9,446 6,755 12,927 7,297
Foreign Exchange 214 141 706 399
Total* 19,430 12,564 25,120 12,288
* Total VaR incorporates benefits of diversification
On an average basis, VaR pertaining to market risk is approximately lower as compared to the previous year. As at 31st December 2018, total market risk VaR reached US$ 10.7 million. Total market risk VaR remained within limits as approved by the Risk Management Committee and the Board of Directors. The Corporation will closely monitor the operating environment and seek to take on appropriate market risk at opportune times.
Chart 4: Profile of daily VaR- 25 day holding period, 95% confidence level, VaR (US$ OOO’s):
0
5000
10000
15000
J F M A M J J A S O N D
Total VaR
It should be noted that certain portfolios and positions are not included in the Market VaR analysis, where VaR is not the most suitable measure of risk. These include the principal project investments in the GCC and the portfolio of International private equity funds. The market risk relating to these investments are measured in terms of a 10% sensitivity measure an estimated decline in asset values. The fair values of the underlying positions may be sensitive to changes in a number of factors, Including but not limited to: the financial performance of the companies, projected timing and amount of future cash flows, discount rates, trends within sectors and underlying business models. The table below provides the sensitivity measure for 2018 and 2017. The principal investment and private equity portfolio are categorized as Financial assets at fair value through statement of income, investments in subsidiaries and associates.

Risk Management
46
Table 3: Sensitivity Measure: for assets not included in market VaR (US$ 000’s)
Asset Categories 10% sensitivity measure 10% sensitivity measure
31-Dec-18 31-Dec-17
Principal Investments Underlying asset value 190,135 192,210
Private Equity Funds Underlying asset value 8,847 10,385
Likewise, scenario analysis is an essential component of the market risk management framework. The assumption of normality on which the statistical models are based may become invalid due to the occurrence of certain events. Future scenarios that result in a breakdown of the historical behavior and relationships between risk constituents are projected, and potential loss amounts are determined. Most of these scenarios are derived from historical macroeconomic trends adjusted for fermenting and unfolding developments and expectations about futuristic events.
Liquidity Risk Management
Liquidity risk is the failure to meet all present and future financial obligations in a timely manner and without undue effort, whether it is a decrease in liabilities or increase in assets. This risk may be further compounded by the inability of the Corporation to raise funds at an acceptable cost to meet its obligations in due time.
There are two sources of liquidity risk that GIC takes into account, which are:
a) Cash flow Illiquidity, arising from the inability to honor financial commitments or to procure funds at reasonable rates and required maturities; and
b) Asset illiquidity, relating to the lack of market depth during times when assets are to be liquidated on a forced basis.
The Corporation believes that capital plays a special role in liquidity planning in as much as liquidity problems could arise in the short run if the market believes that capital has been so impaired that in the long run the Corporation may not be able to pay-off its liabilities.
GIC’s management of liquidity considers an overall balance sheet approach that brings together all sources and uses of liquidity. More specifically, liquidity requirements cover various needs that are addressed by the Corporation’s senior management. Among these needs are:
a) Meeting day-to-day cash outflows;
b) Providing for seasonal fluctuation of sources of funds;
c) Providing for cyclical fluctuations in economic conditions that may impact availability of funds;
d) Minimizing the adverse impact of potential future changes in market conditions affecting GIC’s ability to fund itself; and
e) Surviving the consequences of loss of confidence that might induce fund providers to withdraw funding to GIC.
Liquidity Limits
As part of the funding and liquidity plan, liquidity limits, liquidity ratios, market triggers, and assumptions for periodic stress tests are established and approved. The size of the limit depends on the size of the balance sheet, depth of the market, the stability of the liabilities, and liquidity of the assets. Generally, limits are established such that in stressed scenarios, GIC could be self-funded.
The liquidity limits that are regularly monitored include the following:
a) Maximum dally cash outflow limit for major currencies;
b) Maximum cumulative cash outflow which should include likely outflows as a result of draw-down of commitments, etc.; and
c) Net liquid asset ratio - this ratio is calculated by taking a conservative view of marketability of liquid assets, with a discount to cover price volatility and any drop in price in the event of a forced sale. The ratio is the proportion of such liquid assets to volatile liabilities.
Gulf Investment Corporation G.S.C. and SubsidiariesAnnual Report and Accounts 2018
47
The net liquid asset ratio as of 31st December 2018 was 984%. This figure was determined taking into account the following basic criteria:
a) A 3-month remaining maturity is used to establish the time threshold by which balance sheet items are determined to be liquid or illiquid, stable or volatile;
b) Appropriate “haircuts” are applied on liquid assets to reflect potential market discounts; and
c) A “business as usual” posture is maintained in ascertaining the level of assets to be liquidated or pledged to avoid sending a wrong signal to the market.
The Corporation’s Investment portfolio is managed so that the holdings of un-pledged, marketable securities that are comprised of strategic reserves are equivalent to approximately 50% of the projected maximum 30 day cumulative cash outflow. By the end of December 2018, investments in marketable securities tallied at approximately US$ 1 billion, and are primarily made up of investment grade securities.
The quantities of pledged securities are reviewed periodically in order to ensure that the quantity of pledged securities does not exceed the amounts actually required to secure funding or for other purposes. Additionally, to the greatest extent possible, the selection of securities to be pledged is made in a manner whereby the longest term and/or least marketable securities are utilized.
Market Access for Liquidity
Effective liquidity management Includes assessing market access and determining various funding options. That said, GIC deems it critical to maintain market confidence to attain the flexibility necessary to capitalize on opportunities for business expansion, and to protect the Corporation’s capital base.
Proactive and prudent liquidity management requires a stable and diversified funding structure. To this end, GIC always maintains a well-balanced portfolio of liabilities in order to generate a stable flow of financing and to provide protection against sudden market disruptions. To the extent practical and consistent with other GIC objectives, the Corporation emphasizes both minimal reliance on short-term borrowed funds as well as the use of Intermediate and long-term borrowings in place of short-term funding.
A diversity of funding sources, currencies, and maturities are used in order to gain a broad access to the investor base. The proactive steps GIC undertook during the previous years, particularly in terms of raising medium term financing, enabled the Corporation to secure a sound asset-liability maturity profile. As of 31 December 2018, the Corporation’s term financing stood at US$ 384 million.
Further, the Corporation was successful in enhancing the diversity of its depositor base, a reflection of increased market confidence. At year-end 2018 the Corporation’s deposit base stood at about US$298 million, 100% of which is due to GCC depositors. GCC deposits have proven to be a stable source of funds over the years.
The table below provides the breakdown of the Corporation’s funding source for the comparative years 2017 to 2018.
US$ Millions 2018 (US$) 2018 (%) 2017 (US$) 2017 (%)
GCC Deposits 298 9 571 14
International Deposits 0 0 0 0
Repo Financing 0 0 0 0
Term Financing 384 11 791 19
Shareholder’s funds and others 2684 80 2746 67
Total 3367 100 4107 100
Contingency Funding Plan
Within GIC, liquidity is managed through a well-defined process to ensure that all funding requirements are met properly. This process includes establishment of an appropriate contingency funding plan (CFP).
GIC’s CFP prepares the Corporation for the unlikely event of a liquidity crisis caused by material changes in the financial market conditions, including credit rating downgrades. CFP procedures are articulated clearly in the Corporation’s Liquidity Policy Document.

Risk Management
48
These procedures include:
a) A suite of measures to be undertaken in the absence of liquidity crisis to enhance GIC’s available liquidity in the event of a crisis;
b) Careful identification of specific triggers that would prompt activation of CFP; and;
c) Specification of exact guidelines for adequate management of liquidity crisis.
Throughout the challenging year, our liquidity position remained adequate to carry on with our strategy.
Interest Rate Gapping Risk
GIC actively manages its interest rate exposure to enhance net interest income and limit potential losses arising from the mismatches between placements, Investments and borrowings. It is one of the primary responsibilities of the Treasury management group. The Interest Rate Gap is measured in Eurodollar futures contract equivalents. It is widely accepted that the rate calculated from short dated (up to two years) Eurodollar futures contract is effectively the forward interest rate of the underlying. Any funding, placements or borrowing that has a maturity or re-pricing of over two (2) years are either matched or hedged.
Since GIC also runs gapping positions in other major currencies apart from the USD, the gaps on these currency positions are translated to USD equivalents in order to estimate the equivalent number of Eurodollar futures contract.
The Eurodollar futures contract, given its liquidity, is a reasonable proxy to gauge interest rate risk on the short-term funding gap. The rationale behind this type of measurement is, if necessary, positive (negative) gaps within a given time bucket could be covered by selling (buying) Eurodollar futures contracts equivalent to the notional amount of the gaps. Potential contracts from individual time buckets are accumulated for each currency and then subsequently aggregated for all major currencies. The maximum number of notional contract is currently set at 3,500.
Treasury is responsible for monitoring and ensuring that potential short-term interest rate risk exposure remains within the authorized limits. However, proper escalation procedures are in place to address temporary and permanent excesses.
The Eurodollar futures contract position value as at December 31, 2018 was 1,473 contracts, with an estimated VaR of US$ 700,000. This is lower than the levels of the previous year (31st December 2017: 2,080 contracts). This is excluding the impact of the fixed rate EMTN Issuance.
Maturity profile of assets and liabilities
A detailed breakdown of the maturity profile by individual asset and liability category is provided in Note 20.1 to financial statements. At December 31st 2018, roughly 34% of total assets within 3-months, based on internal assessment of the Corporation’s right and ability to liquidate these instruments. Comparatively, on the same basis, approximately 14% of total liabilities were in the same bucket. The sizable portfolio of high quality marketable securities contributed to the relatively high ratio of liquid assets. The Corporation’ s GCC retention record shows that short maturity deposits from GCC governments, central banks and other regional financial Institutions have been regularly renewed over the past several years. With the success achieved in raising medium term finance, the Corporation was able to optimize the asset liability maturity gap, especially within the medium and long term buckets.
CREDIT RATING
GIC’s strong financial indicators were acknowledged in the rating reports, by all the credit rating agencies. As of end 2018, GIC’s long term deposits were rated A2 by Moody’s and BBB- by Fitch.
All ratings carry a stable outlook. GIC continues to be rated AAA by Rating Agency Malaysia (RAM).
Moody’s Fitch RAM
Long-term Deposits A2 BBB- AAA
Short-term Deposits P1 F2 P1
Gulf Investment Corporation G.S.C. and SubsidiariesAnnual Report and Accounts 2018
49
CAPITAL STRENGTH
Capital represents the shareholder’s investment and is a key strategic resource which supports the Corporation’s risk taking business activities. In line with the Corporation’s financial Objective, management strives to deploy this resource in an efficient and disciplined manner to earn competitive returns. Capital also reflects financial strength and security to the Corporation’s creditors and depositors. Capital management is fundamental to GIC’s risk management philosophy, and takes into account economic and regulatory requirements.
The Corporation’s capital base stood at US$ 2,598 million at 2018 year end. GIC continues to be one of the best capitalized financial Institutions in the region.
OPERATIONAL RISK
Operational Risk is the risk of loss resulting from inadequate or failed processes, people, or systems, either internally or externally, and unexpected significant and unusual one-time events.
• Other risks to which GIC is exposed to include Regulatory, Strategic, and Reputational;
• Regulatory risk is controlled through a framework of Compliance policies and procedures;
• Strategic risk is managed through the close monitoring of reviews, targets and goals, by senior management; and
• Reputational risk is controlled through clear and transparent guidelines and the GIC Code of Conduct.
KEY AIMS:
The management of Operational Risk has the following key objectives:
• to identify, assess, control and mitigate operational risk and the effective reporting of risk and emerging risk issues; and
• to embed operational risk awareness in all our activities, including the practices and controls used to manage other types of risks.
OVERVIEW:
GIC’s Operational Risk Framework is composed of four key components: -
a) Risk and Control Self-Assessment framework;
b) Loss Event framework;
c) Corrective Action Plans framework; and
d) Operational Risk Reporting framework.
By providing a basis for the institutional understanding of Operational Risk, the framework supports a culture in which employees are aware of the risk inherent in the daily operations, and are encouraged to proactively identify existing, emerging and/or other potential problems.
a) Risk and Control Self-Assessment (RCSA) Framework.
The RCSA procedures establish a consistent framework for describing the key business activities, risks and controls. The controls are then assessed on a regular frequency. It is a process which transparently assesses the business’s risks and analyzes the strength or weakness of controls that are put in place to in order to manage the identified risks.
The assessment of fraud detection controls have also been integrated within the RCSA process.

Risk Management
50
b) Loss Event Framework
Operational loss events are reported in a central database. Comprehensive Information about these events is collected, and includes information regarding the amount, occurrence, discovery date, business area and product involved, and detailed root cause analysis.
In keeping with our broad definition of Operational Risk, we began to include data on events with non-monetary impacts and near- miss events in our collection and analysis activities.
c) Corrective Action Plans (CAPs) Framework
The CAPs framework is a key component of management practice to identify, document and resolve control issues or any high risk exposures. This includes issues identified through our integrated RCSA and monitoring program, internal audits, Compliance reviews, or Operational Risk loss event reporting.
It will enable management to demonstrate to audit (internal and external) and regulators, that management is aware and is actively addressing issues as well as monitoring the timely resolution of these issues.
The Risk Management Committee will be kept abreast of all material Operational Risk issues that have been identified.
d) Operational Risk Reporting Framework
The Reporting framework is used to ensure that all Operational Risk types and events are categorized and reported consistently following the Basel II ratings methodology. This will help to:
• establish a common language regarding Operational Risk, throughout the Corporation; and
• facilitate the correlation of similar events and to identify causes (rather than symptoms) of risk within departments.
OPERATION RISK WEIGHTED EXPOSURE:
The Operational Risk Weighted Exposure sets out the risk measurement framework, i. e. the quantitative criteria for calculating the capital charge f or operational risk that follows the Standardized Approach developed by the Basel Committee on Banking Supervision.
The Corporation’s business activities are categorized within the identified business lines to be used i.e. Principal Investment, Debt Capital Market, Equities Investments, Alternative Investments, Treasury, and Head Quarters.
INSURANCE:
As part of the Enterprise Risk Management solution, the Corporation uses a comprehensive suite of insurance policies to mitigate the impact of operational risks and to ensure adequate coverage. These policies are closely aligned to the operational risk profile and are cost beneficial to GIC.
BUSINESS CONTINUITY AND DISASTER RECOVERY PLANNING:
The Business Continuity Plan Team, led by Operational Risk and Information Technology, are responsible for creating, managing and continuously improving GIC’s disaster recovery planning. Currently there are three active and fully tested disaster recovery sites:-
• Kuwait (Local)
• Luxembourg (Outer-Regional)
• Bahrain (Regional)
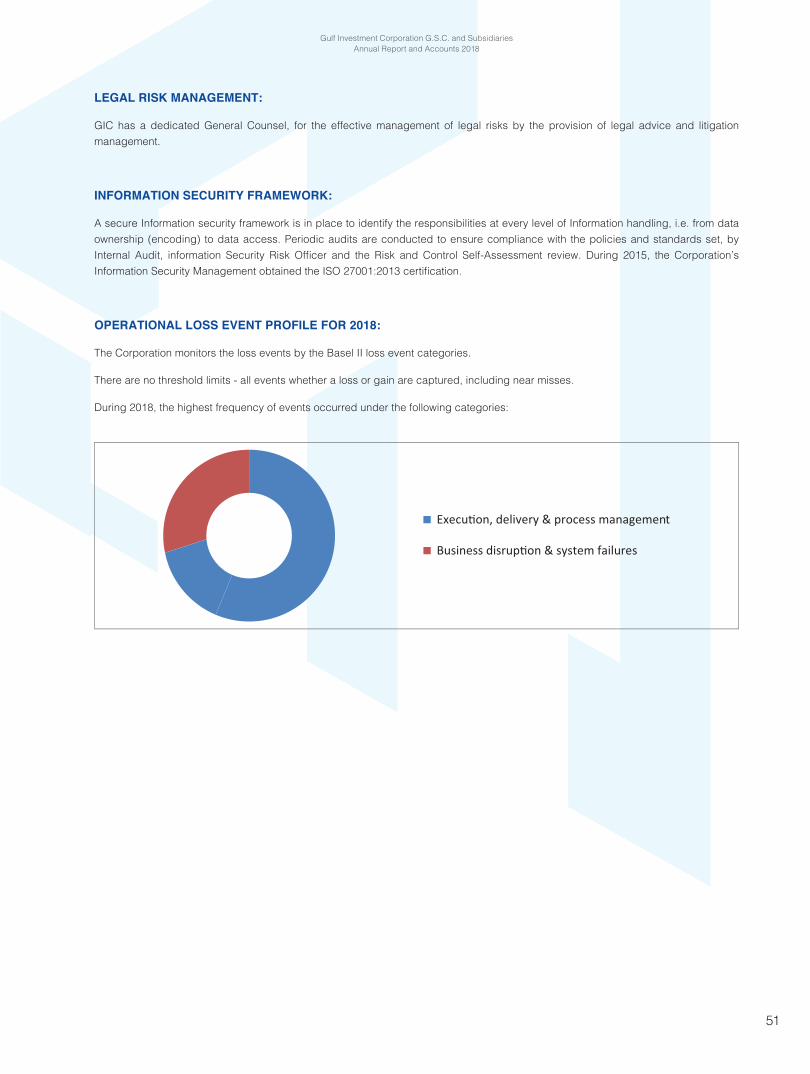
Gulf Investment Corporation G.S.C. and SubsidiariesAnnual Report and Accounts 2018
51
LEGAL RISK MANAGEMENT:
GIC has a dedicated General Counsel, for the effective management of legal risks by the provision of legal advice and litigation management.
INFORMATION SECURITY FRAMEWORK:
A secure Information security framework is in place to identify the responsibilities at every level of Information handling, i.e. from data ownership (encoding) to data access. Periodic audits are conducted to ensure compliance with the policies and standards set, by Internal Audit, information Security Risk Officer and the Risk and Control Self-Assessment review. During 2015, the Corporation’s Information Security Management obtained the ISO 27001:2013 certification.
OPERATIONAL LOSS EVENT PROFILE FOR 2018:
The Corporation monitors the loss events by the Basel II loss event categories.
There are no threshold limits - all events whether a loss or gain are captured, including near misses.
During 2018, the highest frequency of events occurred under the following categories:
Execu�on, delivery & process management
Business disrup�on & system failures

BASEL III DISCLOSURE
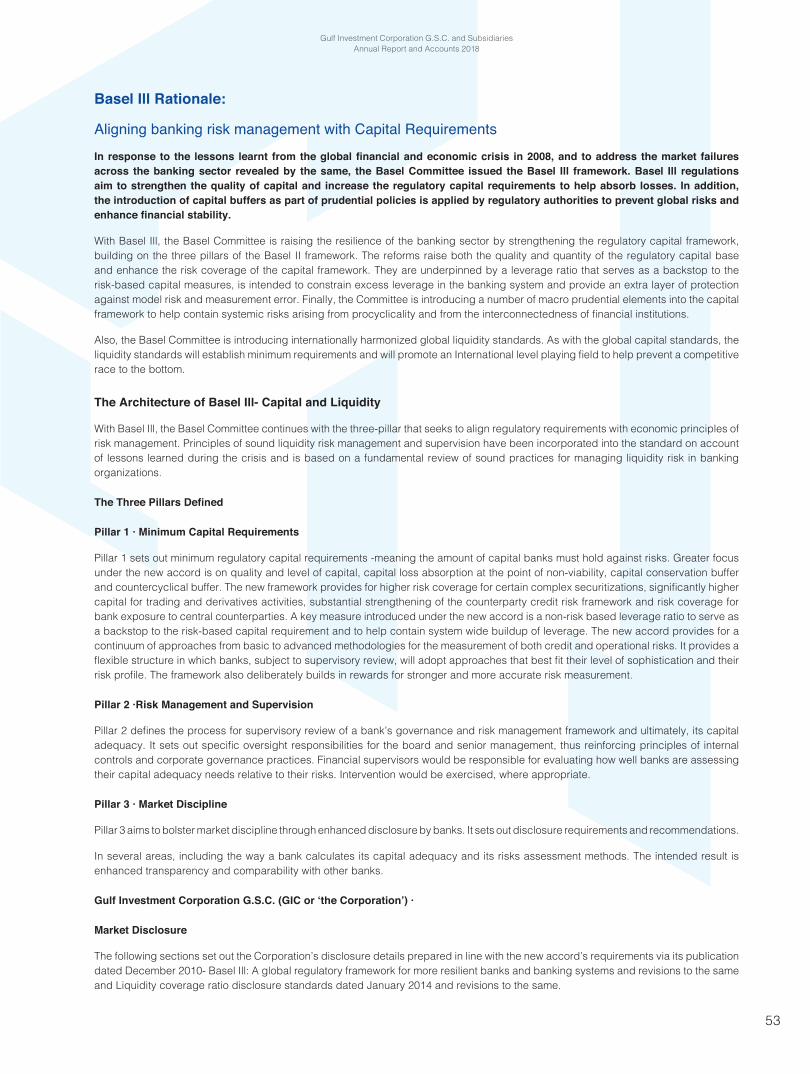
Gulf Investment Corporation G.S.C. and SubsidiariesAnnual Report and Accounts 2018
53
Basel Ill Rationale:
Aligning banking risk management with Capital RequirementsIn response to the lessons learnt from the global financial and economic crisis in 2008, and to address the market failures across the banking sector revealed by the same, the Basel Committee issued the Basel Ill framework. Basel Ill regulations aim to strengthen the quality of capital and increase the regulatory capital requirements to help absorb losses. In addition, the introduction of capital buffers as part of prudential policies is applied by regulatory authorities to prevent global risks and enhance financial stability.
With Basel Ill, the Basel Committee is raising the resilience of the banking sector by strengthening the regulatory capital framework, building on the three pillars of the Basel II framework. The reforms raise both the quality and quantity of the regulatory capital base and enhance the risk coverage of the capital framework. They are underpinned by a leverage ratio that serves as a backstop to the risk-based capital measures, is intended to constrain excess leverage in the banking system and provide an extra layer of protection against model risk and measurement error. Finally, the Committee is introducing a number of macro prudential elements into the capital framework to help contain systemic risks arising from procyclicality and from the interconnectedness of financial institutions.
Also, the Basel Committee is introducing internationally harmonized global liquidity standards. As with the global capital standards, the liquidity standards will establish minimum requirements and will promote an International level playing field to help prevent a competitive race to the bottom.
The Architecture of Basel Ill- Capital and Liquidity
With Basel Ill, the Basel Committee continues with the three-pillar that seeks to align regulatory requirements with economic principles of risk management. Principles of sound liquidity risk management and supervision have been incorporated into the standard on account of lessons learned during the crisis and is based on a fundamental review of sound practices for managing liquidity risk in banking organizations.
The Three Pillars Defined
Pillar 1 · Minimum Capital Requirements
Pillar 1 sets out minimum regulatory capital requirements -meaning the amount of capital banks must hold against risks. Greater focus under the new accord is on quality and level of capital, capital loss absorption at the point of non-viability, capital conservation buffer and countercyclical buffer. The new framework provides for higher risk coverage for certain complex securitizations, significantly higher capital for trading and derivatives activities, substantial strengthening of the counterparty credit risk framework and risk coverage for bank exposure to central counterparties. A key measure introduced under the new accord is a non-risk based leverage ratio to serve as a backstop to the risk-based capital requirement and to help contain system wide buildup of leverage. The new accord provides for a continuum of approaches from basic to advanced methodologies for the measurement of both credit and operational risks. It provides a flexible structure in which banks, subject to supervisory review, will adopt approaches that best fit their level of sophistication and their risk profile. The framework also deliberately builds in rewards for stronger and more accurate risk measurement.
Pillar 2 ·Risk Management and Supervision
Pillar 2 defines the process for supervisory review of a bank’s governance and risk management framework and ultimately, its capital adequacy. It sets out specific oversight responsibilities for the board and senior management, thus reinforcing principles of internal controls and corporate governance practices. Financial supervisors would be responsible for evaluating how well banks are assessing their capital adequacy needs relative to their risks. Intervention would be exercised, where appropriate.
Pillar 3 · Market Discipline
Pillar 3 aims to bolster market discipline through enhanced disclosure by banks. It sets out disclosure requirements and recommendations.
In several areas, including the way a bank calculates its capital adequacy and its risks assessment methods. The intended result is enhanced transparency and comparability with other banks.
Gulf Investment Corporation G.S.C. (GIC or ‘the Corporation’) ·
Market Disclosure
The following sections set out the Corporation’s disclosure details prepared in line with the new accord’s requirements via its publication dated December 2010- Basel Ill: A global regulatory framework for more resilient banks and banking systems and revisions to the same and Liquidity coverage ratio disclosure standards dated January 2014 and revisions to the same.

Basel III Disclosure
54
1. Capital Structure
GIC is an investment company incorporated in the State of Kuwait on November 15, 1983 as a Gulf Shareholding Company. It is equally owned by the governments of the six member states of the Gulf Cooperation Council (GCC), i.e., Bahrain, Kuwait, Oman, Qatar, Saudi Arabia, and the United Arab Emirates. The Corporation has no subsidiaries or significant Investments in banking, insurance, sec unties, and other financial entities.
Table 1 presents the Corporation’s regulatory capital resources for the years ending December 2018 and December 2017. Basel Ill permits recognition of general provision (albeit subject to a maximum of 1.25% of credit risk weighted assets) as part of Tier 2 capital. Meanwhile, the exposures to ‘securitization’ that fall below a cut-off risk grade are deducted 50% from Tier 1 and 50% from Tier 2 capital, respectively. For 2018, full deduction is made from Tier 1 capital due to negative fair value adjustment. Total eligible regulatory capital was US$ 2,530.4 million by year-end December 2018 compared to US$ 2,560.0 million recorded in December 2017. The Corporation has adopted a conservative policy for the treatment of net fair value reserve, wherein, if negative - the total amount is deducted from eligible capital, and if positive - only 45% of fair value reserve is included within eligible capital.
Table 1: Regulatory Capital Resources
In US$ millions 31 December 2018 31 December 2017
Paid-up capital 2,100.0 2,100.0
Disclosed reserves 537.6 525.5
Retained earnings 117.7 55.1
Less: Goodwill 67.5 67.4
Less: Deductions 1.0 1.2
Less: Adjustment for Fair value reserve 156.4 52.0
Total Tier 1 Capital 2,530.4 2,560.0
Total Tier 2 Capital - -
Total eligible regulatory capital 2,530.4 2,560.0
- -
In US$ millions 31 December 2018 31 December 2017
Common Equity Tier 1 (CET1) 2,530.4 2,560.0
Additional Tier 1 (AET 1) - -
Total Tier 1 Capital 2,530.4 2,560.0
Total Tier 2 Capital - -
Total eligible regulatory capital 2,530.4 2,560.0

Gulf Investment Corporation G.S.C. and SubsidiariesAnnual Report and Accounts 2018
55
2. Capital Adequacy Management
The Corporation’s primary guiding principle to its capital adequacy management is to maintain a strong capital base that could support current as well as future growth in business activities, and at the same time, with the objective of maintaining satisfactory capital ratios and high credit ratings.
GIC’s process of assessing the capital requirements commences with the compilation of the annual business plan by individual business units which are then consolidated into the annual budget plan of the Corporation. The annual budget plan provides the estimated overall growth in assets, its impact on capital and targeted profitability for the forthcoming fiscal year. Utilizing the financial projections generated from the budget plan, capital is allocated to the various business units in such a way that the allocations remain consistent with the risk profile of the business activity. These capital allocations as well as corresponding Return On Risk Adjusted Capital (RORAC) are reviewed on an ongoing basis during the budget year in order to optimally deploy capital to achieve targeted returns. Whilst the Corporation acknowledges the benefits of higher leverage to Return on Equity (ROE), it also believes in the advantage and benefit of keeping a strong capital position. As such, GIC maintains a prudent balance among the major components of its capital. Current internal policy aims to maintain a floor of 16% total capital adequacy ratio.
The annual dividend payout, meanwhile, is prudently determined and proposed by the Board of Directors, endeavoring to meet shareholder expectations while ensuring adequate retention of capital to support organic growth. Finally, the Corporation targets a credit risk rating of single ‘A’ or better. This would allow easy access to capital from the market at competitive pricing in the event additional funding needs to be appropriated. GIC is among a select few financial institutions in the region to maintain high ratings by both major International agencies (Moody’s & Fitch). Details of the Corporation’s ratings are provided on page 48 of this annual report.
Table 2: Capital Adequacy Ratios
In US$ millions Risk-weighted assets Capital requirement
Credit Risk 4,707.7 376.6
Market Risk 1,066.3 85.3
Operational Risk 408.8 32.7
Total 6,182.8 494.6
Capital Adequacy Ratios
Total CAR 40.9% -
Common Equity Tier 1 (CET1) 40.9% -
Tier 1 Ratio 40.9% -
Leverage Ratio (Non risk based) 20.3% -
Table 2 details the risk-weighted assets together with their corresponding regulatory capital requirements as at 31 December 2018. Total capital adequacy ratio and Tier 1 capital ratio are likewise calculated. The numbers were generated by applying the Standardized’ approach for credit and operational risks, while the ‘Internal Model’ approach was utilized to yield market risk positions. Total risk-weighted exposures of US$ 6,182.8 million, as at 31 December 2018, requires regulatory capital of US$ 494.6 million to meet the minimum Basel Ill CAR of 8%. Should the minimum CAR threshold be raised to GIC’s internal target of 16%, the required regulatory capital increases to about US$ 989.2 million. The reported eligible regulatory capital of US$ 2,530.4 million still provides sufficient cushion to support business expansions.

Basel III Disclosure
56
Table 3: Risk Exposure Break-down
In US$ millions 31 December 2018
Credit Risk (RWA)Claims on sovereigns 71.7Claims on Public Sector Entities 68.0Claims on Banks 138.5Claims on Corporates 78.0Securitization and Structured Investment Vehicle 7.1Venture Capital and Private Equity 119.7Investments in Commercial Entities 3,969.8Investments in Other Funds and Quoted Equities 139.5Other Assets 115.4Total 4,707.7
Market Risk (VaR)Interest rate risk position 1.0Foreign exchange risk position 0.0Equity risk position 20.4(Total VaR +Stress VaR) x 3 64.2Specific risk position 21.1Total capital requirement 85.3Total RWA (capital requirement x 12.5) 1,066.3
Operational Risk (RWA):Operational risk capital charge 32.7Total RWA (capital charge x 12.5) 408.8
3. Risk Management Structure
To address the continuously changing and complex business environment, the Corporation adapts an agile and effective risk management process. Management realizes that not all risks needs to be eliminated; however, they need to be systematically identified and measured in order to be properly managed. To this end, the Corporation established an effective Enterprise Risk Management framework to enable a process of achieving an appropriate balance between risk and reward, by optimizing profits and ensuring that GIC is protected from unwarranted exposures that are likely to threaten the viability of the Corporation.
The Corporation’s risk management process is an integral part of the organization’s culture, and is embedded into the organization’s practices as well as in all those involved in the risk management process.
The Risk Management Committee (RMC) is established by the Board of Directors. The RMC focuses on the effectiveness and appropriateness of the Internal risk management strategy, risk management framework and risk controls (collectively the Enterprise Risk Management).
The RMC comprises members of the Board of Directors and senior management. Its key aims, with the Risk Management Division (RMD), are to:
a) Review and assess the Enterprise Risk Management governance structure;
b) Review the Risk Management framework (encompassing risk assessment guidelines and policies regarding Credit, Market, Liquidity, Interest Rate, and Operational risk management);
c) Oversee policies and guidelines for determining the macro Enterprise Risk Limit levels, and review the utilization of these limits;
d) Review the adequacy of GICs’ capital allocations including economic and regulatory, incorporating the risk adjusted return on capital;
e) Review and assess the integrity and adequacy of the Risk Management Division of the Corporation; and
f) Receive and review reports on selected risk topics as management deems appropriate from time to time.

Gulf Investment Corporation G.S.C. and SubsidiariesAnnual Report and Accounts 2018
57
The RMC, senior management, risk officers, and line managers contribute to effective Enterprise-wide Risk Management. The RMC defines its expectations, and through its oversight determines its accomplishment. The Board of Directors has ultimate responsibility for risk management as they set the tone and other components of an enterprise risk management.
Risk officers have the responsibility for monitoring progress and for assisting line managers in reporting relevant risk Information and the line managers are directly responsible for all business risk generated in their respective domains. The effective relationship between these parties significantly contributes to the improvement in the Corporation’s overall risk management practices as this leads to the timely identification of risk and facilitation of appropriate response.
The RMD structure has a distinct identity and independence from business units. The RMD ensures that risk exposures remain within tolerable levels relative to the Corporation’s capital and financial position. The RMD reports directly to the Chief Executive Officer, and is manned by dedicated risk specialists in all disciplines to address the pertinent business risks exposure of the Corporation. Its main responsibilities are to:
a) Evaluate and analyze the enterprise wide risk profile by developing risk monitoring techniques;
b) Set up and develop criteria for defining the Corporation’s risk threshold in terms of various risks;
c) Develop and establish tools for the measurement of the Corporation’s various risk types; and
d) Recommend appropriate strategies/actions for mitigating risk and ensuring a sound risk asset structure for the Corporation.
The abridged organizational structure of GIC’s risk management structure is shown below:
Operational RiskMarket and Liquidity RiskCredit Risk
Risk Management Division
CEO
Risk Management Committee
GIC Management Committees
Enterprise Risk Management Framework
The following management committees have the responsibility and authority for the day-to-day risk management activities of the Corporation, and where by such authorities are being exercised within the objectives and policies approved by the RMC:
a) Management Committee covers mainly general management issues including performance review vis-a- vis budget, and assessment of status quo against strategic business plan;
b) Global Markets Group Investment Committee translates Investment strategy directions into asset allocation guidelines, recommends investment proposals, and reviews investment portfolios. The committee also functions as a surrogate Asset Liability Committee;
c) Principle Investing Investment Committee evaluates proposals for Investments and divestiture of assets and ensures compliance to Investment criteria as well as investment procedures at each phase of the Investment process;
d) Human Resource Committee which reviews strategic HR issues;
e) Systems Steering Committee provides the forum to review the IT architecture and its condition to meet current and future business requirements; and
f) Provisioning Committee ensures that all provisioning activity (making or writing back provisions), covering all of GIC’s on and off balance sheet items.
The objectives and policies for measurement and reporting of the major risk areas, i.e., Credit, Market, Liquidity and Operational, are detailed in the Risk Management section. The same section includes the approach adopted by the Corporation towards management and mitigation of these risks.

Basel III Disclosure
58
4. Credit Risk Exposure
The Corporation follows both qualitative and quantitative approaches to credit risk management. These approaches are clearly articulated in the Corporation’s Credit Policy document which aims to promote a strong credit risk management architecture that includes credit procedures and processes. The policy defines the areas and scope of Investment activities undertaken by the Corporation and its main goal is not simply to avoid losses, but to ensure achievement of targeted financial results with a high degree of reliability. The Corporation’s credit risk management focuses on the dynamic and interactive relationship between three credit process phases: portfolio strategy and planning, Investment origination and maintenance, and performance assessment and reporting. Each of these phases is discussed briefly below.
Portfolio Strategy and Planning
The overall desired financial results, the portfolio strategy of each business unit, and the credit standards required to achieve the targets are defined during the planning phase. The business strategies are developed in such a way that they integrate risk and that they meet the defined hurdles in terms of RORAC. Portfolio management establishes composition targets, monitors the results of these diverse business strategies on a continual basis, and allows the Corporation to manage concentrations that can result from seemingly unrelated activities. Specifically, portfolio management involves setting concentration limits by standard dimensions so that no one category of assets or dimension of risk can materially harm the overall performance of the Corporation. The Board has set specific limits for individual borrowers and groups of borrowers and for geographical and industry segments. These limits consider the individual credit of the various counterparties as well as the overall portfolio risk.
The Investment Committees
The Committees monitor and approve investment proposals and review portfolio concentrations in terms of economic sectors and asset class. These limits are reviewed annually to ensure that there are no undue concentrations in one sector or asset class, and that the limits are within those set out by the Corporation. For counter-party limits, such as limits for banks and financial institutions, credit line approval follows a strict process of credit review, with proper authority levels delegated to senior credit officers. Foreign exchange trading and interest rate gap limits, together with ancillary limits (e.g., daylight, overnight, stop loss, etc.) are recommended by Treasury for the review of risk management, and eventual approval by the RMC. The RMD quantifies the Corporation’s credit risk appetite in line with the overall strategy. The RMD employs a process of allocating capital on a portfolio level for the total credit exposure assumed by each business unit. The business units’ actual capital consumption is assessed against the budget, and variances are appropriately reported to senior management.
Investment Origination and Maintenance
The business units solicit, evaluate, and manage credit exposure according to the strategies and portfolio parameters established during the portfolio strategy and planning phase. Investments are generated within well-defined criteria, product structure, and are approved on the basis of risk and return assessment. The processes involved under credit maintenance include documentation review and disbursement, and review of the status of exposures. Within this phase, origination and underwriting for distribution to investors takes place. The business units remain the sponsor and main risk managers of their proposals. While the risk management team independently reviews Investment/product proposals prior to granting approvals to ensure that the proposals are within the tolerable risk appetite of the Corporation and are consistent with its policy, prior to disbursement of funds.
Performance Assessment and Reporting
The performance assessment and reporting phase allow both the senior management and business units to monitor results and improve performance continually. Both portfolio and process trends are monitored in order to make appropriate and timely adjustments to business strategies, portfolio parameters, credit policies and investment origination and maintenance practices. This phase of the credit process draws on information within the Corporation and external benchmarks to help evaluate performance. The goal of performance assessment is to achieve a balanced portfolio of assets, well diversified, and generating returns consistent with targets. Credit performance is assessed through analysis of:
a) Portfolio concentrations by obligor, industry, risk rating, maturity, asset class, as well as other dimensions;
b) Generated Return on Capital Employed (ROCE);
c) Additional economic value created by individual projects;
d) Exceptions to risk acceptance criteria; and
e) Other policy exceptions.

Gulf Investment Corporation G.S.C. and SubsidiariesAnnual Report and Accounts 2018
59
Inherent in the Corporation’s business activity is the presence of’ portfolio risk’, which arises whenever there is high positive correlation between individual credit portfolios. To address this particular risk, the Corporation employs the ‘Credit Manager’ system promoted by the Risk Metrics Inc. (part of MSCI). The system is a quantitative based program where overall portfolio ‘Credit Value at Risk (CreditVaR) is measured and controlled. This model calculates CreditVaR based on credit ratings of the names, default probabilities, loss given default, current market prices of the credits, while considering the impact of correlation of the various credits in the portfolio. In order to institute a common language for understanding and dimensioning credit risk across GIC’s range of investments in projects, RMD is in the process of developing an Internal Credit Risk Rating (ICRR) model that would assist management in determining level of capital allocation and other strategic schemes applicable to the Investment credit rating. Naturally, the model will also be used to benchmark the required return given a particular level of risk. Additionally, the rating results will subsequently be used as valuable inputs into the ‘Credit Manager’ system mentioned above.
Credit Risk as per Basel III Standardized Approach
Under the credit risk ‘Standardized’ approach, credit exposures are categorized to standard portfolios that are subject to a distinctive risk-weighting scale based on standard characteristics of the nature of borrower as well as the external credit assessments of International rating agencies where available. GIC uses the credit ratings assigned by Moody’s and Fitch for this purpose. When more than one counter-party rating is available, Basel Ill’s multiple assessment guidelines are invoked. In order to provide a common platform into which different notations used by the aforementioned rating agencies can be mapped, a scale of uniform Credit Quality Grades (COG) represented by the numerals 1 to 5 or 6 are used to represent the relevant risk weights of each standard portfolio. Separate scales are prepared for risk-weighting both long and short-term issues.
Table 4: CQG Mapping
Corporates Credit Quality Grades Moody’s Fitch
1
Aaa AAA
Aa1 AA+
Aa2 AA
Aa3 AA-
2
A1 A+
A2 A
A3 A-
3
Baa1 BBB+
Baa2 BBB
Baa3 BBB-
4
Ba1 BB+
Ba2 BB
Ba3 BB-
5
81 B+
82 B
83 8-
6
Caa1 CCC+
Caa2 CCC
Caa3 CCC-
Ca cc
c c
D
Table 4: serves as a sample of mapping notations of rating agencies into COGs for claims on Corporates. At 31 December 2018, rated credit exposures accounted for about 8% of total credit exposures. Note that the numbers are after applying the equivalent risk- weights (credit conversion) as provided under the Basel Ill accord. Meanwhile, gross credit exposure to rated assets was recorded at approximately 16% of total gross credit exposure. Assets that are rated single A or better comprised 79% of rated gross credit exposure.

Basel III Disclosure
60
Tables 5 and 6 present the breakdown of credit exposures pre and post-credit conversion.
Table 5: Credit Exposure (post-credit conversion)
31 December 2018
In US$ millions Rated Unrated TotalClaims on Sovereigns 71.7 - 71.7Claims on Public Sector Entities 68.0 - 68.0Claims on Banks 138.5 - 138.5Claims on Corporate 78.0 - 78.0Securitization and SIVs 7.1 - 7.1Venture Capital and Private Equity - 119.7 119.7Investments in Commercial Entities - 3,969.8 3,969.8Other Funds and Quoted Equities - 139.5 139.5Other Assets - 115.4 115.4Total 363.3 4,344.4 4,707.7In Percent 7.7% 92.3% 100.0%
Table 6: Gross Credit Exposure (pre-credit conversion)
31 December 2018In US$ millions Rated Unrated TotalClaims on Sovereigns 240.3 19.7 260.0Claims on Public Sector Entities 61.5 38.6 100.1Claims on Banks 393.5 - 393.5Claims on Corporate 123.7 1.2 124.9Securitization and SIVs 12.3 - 12.3Venture Capital and Private Equity - 119.7 119.7Investments in Commercial Entities - 3,969.8 3,969.8Other Funds and Quoted Equities - 139.5 139.5Other Assets - 115.5 115.5Total 831.3 4,404.0 5,235.3In Percent 15.9% 84.1% 100.0%
Table 7: Gross Credit Exposure before Credit Risk Mitigation (CRM)
31 December 2018
In US$ millions Funded Unfunded Total
Claims on Sovereigns 260.0 - 260.0Claims on Public Sector Entities 100.1 - 100.1Claims on Banks 367.8 25.7 393.5Claims on Corporate 124.9 - 124.9Securitization and SIVs 12.3 - 12.3Venture Capital and Private Equity 88.5 31.2 119.7Investments in Commercial Entities 3,751.3 218.5 3,969.8Other Funds and Quoted Equities 139.5 - 139.5Other Assets 115.5 - 115.5Total 4,959.9 275.4 5,235.3In Percent 94.7% 5.3% 100.0%
In terms of facility type (Table 7), US$ 4,959.9 million or approximately 95% is funded. The balance is ascribed to guarantees issued and commitments made by the Corporation, as well as credit exposures on outstanding forward and swap transactions with banks.

Gulf Investment Corporation G.S.C. and SubsidiariesAnnual Report and Accounts 2018
61
Table 8: Gross Credit Exposure by Geographic Distribution
31 December 2018
In US$ millions GCC Europe Americas Others Total
Claims on Sovereigns 134.3 - 125.7 - 260.0
Claims on Public Sector Entities 96.4 - 0.9 2.8 100.1
Claims on Banks 330.0 0.4 1.2 61.9 393.5
Claims on Corporate 107.3 - 0.5 17.1 124.9
Securitization and SIVs - 8.8 3.5 - 12.3
Venture Capital and Private Equity 12.0 12.0 83.8 11.9 119.7
Investments in Commercial Entities 3,949.8 - 20.0 - 3,969.8
Other Funds and Quoted Equities 72.3 - 67.2 - 139.5
Other Assets 86.1 2.7 - 26.7 115.5
Total 4,788.2 23.9 302.8 120.4 5,235.3
In Percent 91.5% 0.5% 5.8% 2.3% 100.0%
The geographical distribution (Table 8) is based on either the primary purpose of the exposure or the place of incorporation of the debt security Issuer, or incorporation of the fund manager. A Sizable portion of credit exposure is in the GCC region tallying at US$4,788.2 million or 91.5% of the total. Following suit are exposures to Americas at 5.8%. These exposures are due in great part to Investments in global securities and funds with varying investment themes.
Table 9: Gross Credit Exposure by Industry Sector
31 December 2018
In US$ millions Banks & FinancialInstitutions
Trading &Manufacturing
Energy&Utilities
GovernmentAgencies Others Total
Claims on Sovereigns - - 260.0 - 260.0
Claims on Public Sector Entities - - 73.6 26.5 - 100.1
Claims on Banks 393.5 - - - - 393.5
Claims on Corporate - 3.4 65.7 - 55.8 124.9
Securitization and SIV 12.3 - - - - 12.3
Venture Capital and Private Equity 119.7 - - - - 119.7
Investments in Commercial Entities 68.6 2,611.3 925.7 - 364.2 3,969.8
Other Funds and Quoted Equities 139.5 - - - - 139.5
Other Assets 30.5 57.8 8.3 1.1 17.8 115.5
Total 764.1 2,672.5 1,073.3 287.6 437.8 5,235.3
In Percent 14.6% 51.0% 20.5% 5.5% 8.4% 100.0%
The table on industry distribution (Table 9) of the gross credit exposure reveals a concentration on Trading & Manufacturing sector and Energy & Utilities, amounting to 71.5% of total exposure which, is in line with GIC’s commitment to support the industrial growth within the GCC region.

Basel III Disclosure
62
The residual maturity of gross credit exposure broken down by standard credit risk exposure is shown in Table 10. Approximately 89% of gross credit exposure falls within the longest time bucket of over five years.
Table 10: Credit Exposure by Residual Contractual Maturity
31 December 2018
In US$ millions Within3 months
3 months to 1 year 1 to 5 years Over 5 years Total
Claims on Sovereigns - - 157.9 102.1 260.0
Claims on Public Sector Entities - - 30.1 70.0 100.1
Claims on Banks 202.5 61.3 3.3 126.4 393.5
Claims on Corporate - 2.5 61.9 60.5 124.9
Securitization and SIVs - - - 12.3 12.3
Venture Capital and Private Equity - - - 119.7 119.7
Investments in Commercial Entities - - - 3,969.8 3,969.8
Other Funds and Quoted Equities - - - 139.5 139.5
Other Assets 15.8 11.6 37.2 50.9 115.5
Total 218.3 75.4 290.4 4,651.2 5,235.3
In Percent 4.2% 1.4% 5.6% 88.8% 100.0%
Recognition of Impairment of Assets
The Corporation assesses at each balance sheet date whether there is any objective evidence that a financial asset is impaired. Investments are treated as impaired when there has been a significant or prolonged decline in the fair value below its cost or where other Objective evidence of impairment exists. The determination of what is ‘significant’ or ‘prolonged’ requires considerable judgment. In addition, the Corporation evaluates other factors, including normal volatility in share price for quoted equities and the future cash flows and the discount factors for projects and unquoted equities. The Corporation reviews its problem loans and advances, and investment in debt instruments at each reporting date to assess whether a provision for impairment should be recorded in the statement of income. In particular, considerable judgment by management is required in the estimation of the amount and timing of future cash flows when determining the level of provisions required. Such estimates are necessarily based on assumptions about several factors involving varying degrees of judgment and uncertainty, and actual results may differ resulting in future changes to such provisions. Noteworthy, the Corporation has taken a strategic decision to wind down its lending activities. An insignificant amount of impaired assets stemming from project loan provided to a manufacturing company based in the GCC has been fully provided for.
5. Securitization Activities
The Corporation’s securitization exposure comes by way of its investments in structured products, which can be generally classified under synthetic securitization. Capital cover treatment of securitization exposures follows the ‘Ratings Based’ approach as recommended in the Basel Ill capital adequacy guide lines. As such, the external credit assessments provided by Moody’s is considered when determining credit risk weights for securitization exposures.

Gulf Investment Corporation G.S.C. and SubsidiariesAnnual Report and Accounts 2018
63
Table 11 provides the credit rating breakdown of the Corporation’s investment in securitization and structured investment vehicles (SIVs): Exposures that are rated COG 5 and lower are deducted directly from regulatory capital.
Table 11: Credit Exposure on Securitization and SIVs
31 December 2018
In US$ millions Gross Exposure Post-credit Conversion
COG 1 8.8 1.8
COG 2 1.1 0.5
COG 3 - -
COG 4 1.4 4.8
COG 5 -
(deduction from capital)COG 6 1.0
Unrated -
Total 12.3 7.1
6. Market Risk
This section focuses regulatory capital adequacy computations based on the VaR measurement for the Trading’ book. More details on VaR and Market Risk monitoring are provided in the Risk Management section of the annual report. The regulatory capital adequacy ratios are computed under Basel Ill. GIC follows the Internal Models Approach (IMA) to quantify the capital charge associated with market risk within the trading portfolio.
The Corporation uses the ‘Risk Manager’ system, developed by MSCI Risk Metrics, and utilizes a parametric computational method based on the variance- covariance concept. In line with the capital accord, the parameters used in determining the VaR are a 10 day holding period and 99% confidence level. The computation utilizes an equally weighted historical data set going back one year. The computation ignores the correlation benefit amongst the three risk types (Interest rate, equity and foreign exchange), with Total Market Risk VaR being equal to the arithmetic sum of the three components. The capital charge relating to market risk is determined for all portfolios categorized as trading (the trading book), which includes the following (Ref Notes 4 of 2018 consolidated financial statements):
(US$ million) 2018 2017
Quoted debt instruments 7 49
Hedge and Other unquoted alternative funds 257 340
264 389
Policies relating to recognition, classification, fair value measurement and gain/loss computation are detailed in Note 2 of consolidated financial statements. GIC believes that it is prudent to provide an explicit capital cushion for price risks to which it is exposed. Such risk of loss arising from the adverse changes in market variables is predominantly within the trading book. Within the Corporation, capital charge for market risk comprises three main categories: interest rate risk and equity risk (within the trading book) and foreign exchange risk for the entire Corporation.
The Value-at-Risk concept is a sound basis for the quantification of market risk , and the variance-co-variance methodology adequately suits the Corporation’ s asset types. Most of the exposures within the trading book entail very little optionality and are mostly linear in nature. The VaR based system provides a dynamic measure of market risk capturing, in a timely manner , the impact of changes in environment on the value of the portfolio of financial instruments. The VaR model is a statistical tool, based on simplifying assumptions, and as such has certain limitations (examples: occurrence of ‘fat tails’, non-normal distributions and event risks; the past not being a good approximation of future, etc.). To a large extent, these limitations are addressed by the back testing exercise and related multiplication factor used. For all the portfolios within the trading book, the same variance - co-variance methodology is used to compute VaR, which is computed on a daily basis as per the parameters described above.
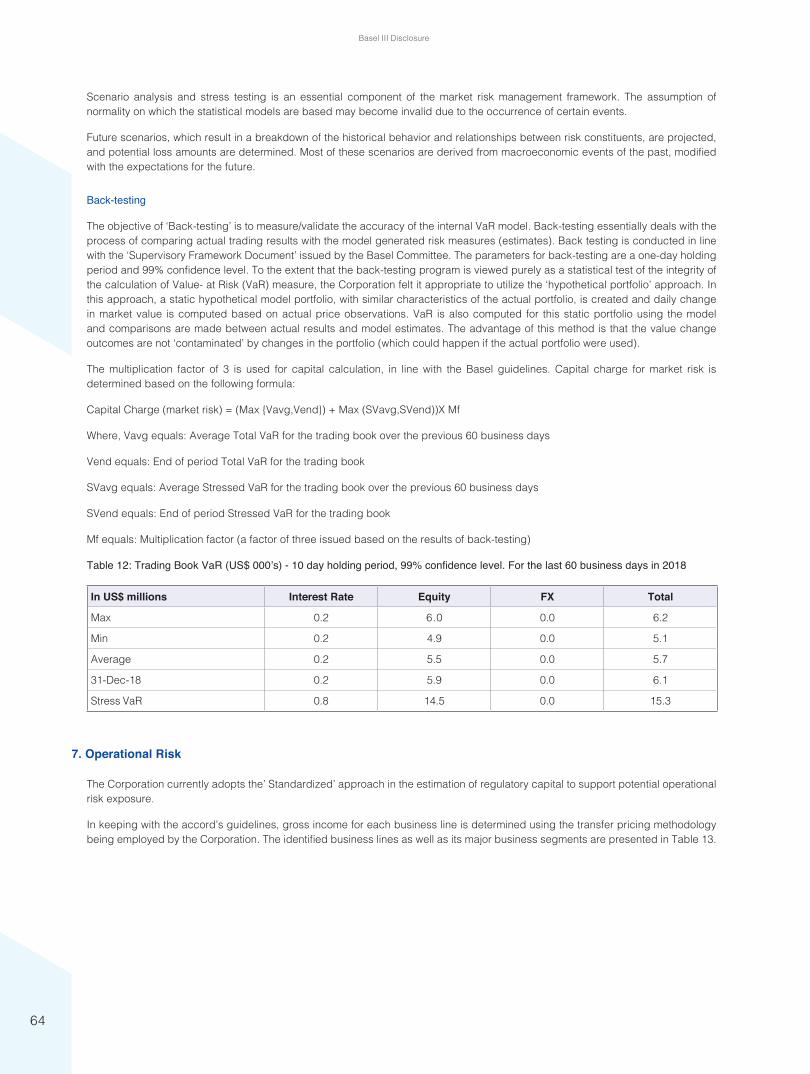
Basel III Disclosure
64
Scenario analysis and stress testing is an essential component of the market risk management framework. The assumption of normality on which the statistical models are based may become invalid due to the occurrence of certain events.
Future scenarios, which result in a breakdown of the historical behavior and relationships between risk constituents, are projected, and potential loss amounts are determined. Most of these scenarios are derived from macroeconomic events of the past, modified with the expectations for the future.
Back-testing
The objective of ‘Back-testing’ is to measure/validate the accuracy of the internal VaR model. Back-testing essentially deals with the process of comparing actual trading results with the model generated risk measures (estimates). Back testing is conducted in line with the ‘Supervisory Framework Document’ issued by the Basel Committee. The parameters for back-testing are a one-day holding period and 99% confidence level. To the extent that the back-testing program is viewed purely as a statistical test of the integrity of the calculation of Value- at Risk (VaR) measure, the Corporation felt it appropriate to utilize the ‘hypothetical portfolio’ approach. In this approach, a static hypothetical model portfolio, with similar characteristics of the actual portfolio, is created and daily change in market value is computed based on actual price observations. VaR is also computed for this static portfolio using the model and comparisons are made between actual results and model estimates. The advantage of this method is that the value change outcomes are not ‘contaminated’ by changes in the portfolio (which could happen if the actual portfolio were used).
The multiplication factor of 3 is used for capital calculation, in line with the Basel guidelines. Capital charge for market risk is determined based on the following formula:
Capital Charge (market risk) = (Max {Vavg,Vend}) + Max (SVavg,SVend))X Mf
Where, Vavg equals: Average Total VaR for the trading book over the previous 60 business days
Vend equals: End of period Total VaR for the trading book
SVavg equals: Average Stressed VaR for the trading book over the previous 60 business days
SVend equals: End of period Stressed VaR for the trading book
Mf equals: Multiplication factor (a factor of three issued based on the results of back-testing)
Table 12: Trading Book VaR (US$ 000’s) - 10 day holding period, 99% confidence level. For the last 60 business days in 2018
In US$ millions Interest Rate Equity FX Total
Max 0.2 6.0 0.0 6.2
Min 0.2 4.9 0.0 5.1
Average 0.2 5.5 0.0 5.7
31-Dec-18 0.2 5.9 0.0 6.1
Stress VaR 0.8 14.5 0.0 15.3
7. Operational Risk
The Corporation currently adopts the’ Standardized’ approach in the estimation of regulatory capital to support potential operational risk exposure.
In keeping with the accord’s guidelines, gross income for each business line is determined using the transfer pricing methodology being employed by the Corporation. The identified business lines as well as its major business segments are presented in Table 13.

Gulf Investment Corporation G.S.C. and SubsidiariesAnnual Report and Accounts 2018
65
Table 13: Business Lines for Operational Risk
Business lines Major business segments Activity Groups
Principal Investments Investment and Equity ParticipationVenture Capital, Greenfield Investments,
Mergers and acquisitions, Privatizations, Equity Participation, IPOs, Secondary Private Placements
Debt Capital Markets Investments of debt securities
International Corporate Securities, Sovereign Debts, GCC Issues/Bonds, Convertible Bonds, Islamic Bonds, ABSs,FRNs, SIVs, Structured
Finance, Credit Funds, Emerging Market debts, High Yield Debt, Trading Bonds & Derivatives
Equity Investments Portfolio of Investments in equity funds and proprietary funds Gulf Equities, Equity Portfolios
Alternative Investments Portfolio of Investments in an array of different asset classes and managed funds
Hedge Funds, Real Estate, Managed Funds, MBSs, Private Equity, Global Equity
Treasury
Sales
Fixed Income, Equity, Foreign Exchanges, Commodities, Credit, Funding, Own Position Securities, Lending and Repos, Derivatives
Market Making
Proprietary Positions
Advisory Services
Head- quarters
Income classified for Head-quarters as perinternal FTP (Fund Transfer Pricing) method, and other income that cannot be classified in
any other business line
Income from Free Capital, Rental Income, OtherIncome, etc.
Capital risk charge for each business line is computed and reported on a quarterly basis. The capital requirement for each business line and the corresponding capital charge are in Table 14.
Table 14: Operational Risk Capital Charge
31 December 2018
In US$ millions 3 year Average GrossIncome Beta Factor Capital Charge
Principal Investment 106.1 18% 19.1
Debt Capital Market 36.5 18% 6.6
Equities Investments 10.9 18% 2.0
Alternative Investments 19.1 18% 3.4
Treasury 0.1 18% 0.0
Head-quarters 9.0 18% 1.6
Total 181.7 32.7
Risk-weighted exposure 408.8
The highest beta factor of 18% is applied on all business lines as suggested in the capital accord.
The Corporation realizes that the accord offers a continuum of approaches from the simplest basic indicator approach to the more advanced measurement approaches. In its endeavor to adopt a more risk- sensitive approach to operational risk capital management, the Corporation plans to implement a more disciplined ‘bottom-up’ method whereby the approach is anchored on Objective loss data. To implement such an approach, a four -stage progression will be followed:

Basel III Disclosure
66
(1) Risk and Control Self-Assessment Framework;
(2) Loss Event Framework;
(3) Corrective Action Plans Framework; and
(4) Operational Risk Reporting Framework.
8. Equity Risk in the Banking Book
Equity investments in the banking book are classified at the time of acquisition into those acquired for realizing capital gain and to those purchased for strategic investments. The decision where to classify investments has arrived at after considering significant factors that include business and strategic advantages to the Corporation, and the amount of planned investments. All investment decisions require the approval of the Investment Committees, or the Executive Committee, depending on the amount of exposure. Investments acquired with a view to generating income and profits from capital appreciation are reviewed periodic ally and disposed of at opportune Instances. Meanwhile, the strategic investment portfolios are reviewed based on the industry, market and economic developments, and the Corporation decides whether to liquidate or further consolidate its holdings in these investments. In accordance with International Financial Reporting Standards, equity positions in the banking book are classified as available for sale securities. These investments are fair valued periodically and revaluation gains/losses are accounted as cumulative changes in fair value in equity. Accounting treatment of equity investments can be found under ‘Significant accounting judgments and estimates’ in the notes to the consolidated financial statements.
Publicly traded Investments represent quoted equities traded in the local and international stock exchanges. Privately held investments represent investments in unquoted entities and projects. The total value of equity Investments in the banking book at the end of December 2018 is US$ 238.0 million, net of provision (refer to Table 15 below). The total un-realized loss recorded in equity is US$ 156.4 million.
Table 15: Equity Holdings in Banking Book
31 December 2018
In US$ millions Publicly Traded Privately Held Total
Fair Value of Equity Investments 130.5 107.5 238.0
Unrealized gain/(loss) recorded in equity - (156.4 ) (156.4 )
Unrealized gain/( loss) in Tier 2 Capital - (156.4 ) (156.4 )
9. Interest Rate Risk in the Banking Book
Treasury manages short term interest rate gapping by means of monitoring over all interest rate exposure in the next 24 months as measured in Eurodollar futures contract equivalents. Treasury is not allowed to mismatch positions over two years unless appropriate management approval has been obtained. Any funding, placements or borrowing that has a maturity or re-pricing profile of more than two years are either matched or hedged. The rate calculated from short dated (up to two years) Eurodollar futures contract is effectively the forward interest rate of the underlying, i.e. Eurodollar deposits. Total USD placements and borrowings transacted by Treasury are profiled in time buckets from one week and then monthly thereafter until 24 months. The same procedure is applied to other currencies; the gaps on these currency positions are translated to USD equivalents in order to ascertain the equivalent number of Eurodollar futures contracts for the individual major currencies.
A maximum limit of 3,500 Eurodollar contracts is currently set, with the maximum VaR at US$ 3.08 million. The calculation of VaR equivalent is derived from the 30 day average price volatility of 3 month Eurodollar futures. The current yield is adjusted by the average volatility before it is applied on the position value. The resulting number is then scaled up to a 95% level of confidence.
The Eurodollar futures contract position value as at December 31, 2018 was 1,473 contracts, with an estimated VaR of US$ 0.7 million. This is lower than the levels of the previous year (31st December 2017: 2,080 contracts). This is excluding the impact of the fixed rate EMTN issuance.

Gulf Investment Corporation G.S.C. and SubsidiariesAnnual Report and Accounts 2018
67
10. Funding Liquidity Assessment
The Basel committee as a foundation of its liquidity framework in 2008 published Principles for Sound Liquidity Risk Management and Supervision (“Sound Principles”). The Sound Principles provide detailed guidance on the risk management and supervision of funding liquidity risk and should help promote better risk management in this critical area, but only if there is full Implementation by banks and supervisors. A key reform in developing a more resilient banking sector was the Introduction of Liquidity Coverage Ratio (LCR) and Net Stable Funding Ratio (NSFR).
Liquidity Coverage Ratio (LCR)
The objective of the LCR is to promote the short-term resilience of the liquidity risk profile of banks. It does this by ensuring that banks have an adequate stock of unencumbered high-quality liquid assets (HQLA) that can be converted easily and immediately in private markets into cash to meet their liquidity needs for a 30 calendar day liquidity stress scenario.
Against a prescribed minimum of 90%, GIC’s LCR as of 31 December 2018 was 210%.
Table 16: Liquidity Coverage Ratio
In US$ millions 31 December 2018
Value of stock of High quality liquid assets (HQLA) 559.1
Total Net Cash outflow over the next 30 calendar days 266.5
Liquidity Coverage Ratio (LCR) 210%
Net Stable Funding Ratio (NSFR)
The objective of the NSFR is to limit quick balance sheet expansion by relying on relatively cheap and abundant short-term wholesale funding and maintenance of stable funding structure.
Table 17: Net stable Funding Ratio
In US$ millions 31 December 2018
Total Available Stable Funding (ASF) 2,997.6
Total Required Stable Funding (RSF) 1,744.3
Net Stable Funding Ratio (NSFR) 172%
CONSOLIDATEDFINANCIAL STATEMENTS31 DECEMBER 2018
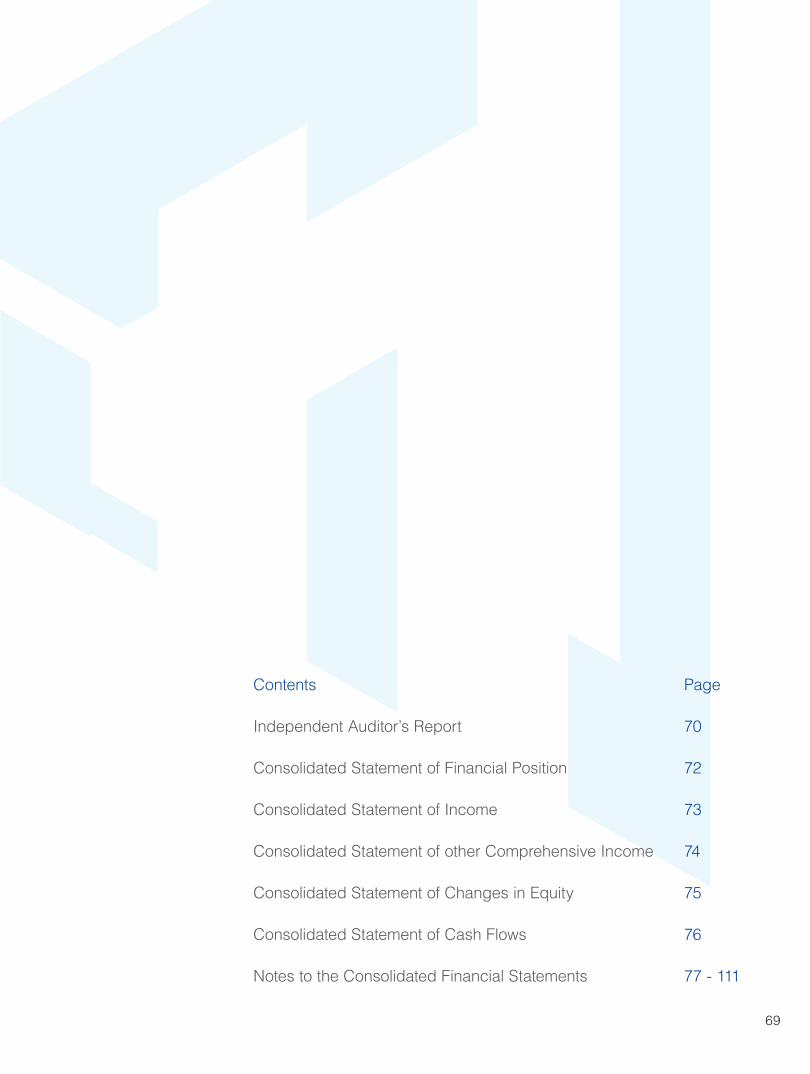
69
Contents Page
Independent Auditor’s Report 70
Consolidated Statement of Financial Position 72
Consolidated Statement of Income 73
Consolidated Statement of other Comprehensive Income 74
Consolidated Statement of Changes in Equity 75
Consolidated Statement of Cash Flows 76
Notes to the Consolidated Financial Statements 77 - 111

Independent Auditor’s Report
70
The ShareholdersGulf Investment Corporation G.S.C.State of Kuwait
Opinion
We have audited the consolidated financial statements of Gulf Investment Corporation G.S.C. (“the Corporation”) and its subsidiaries (together “the Group”), which comprise the consolidated statement of financial position as at 31 December 2018, the consolidated statements of income, other comprehensive income, changes in equity and cash flows for the year then ended, and notes, comprising significant accounting policies and other explanatory information.
In our opinion, the accompanying consolidated financial statements present fairly, in all material respects, the consolidated financial position of the Group as at 31 December 2018, and its consolidated financial performance and its consolidated cash flows for the year then ended in accordance with International Financial Reporting Standards (“IFRS”).
Basis for Opinion
We conducted our audit in accordance with International Standards on Auditing (“ISA”). Our responsibilities under those standards are further described in the Auditor’s Responsibilities for the Audit of the Consolidated Financial Statements section of our report. We are independent of the Group in accordance with International Ethics Standards Board for Accountants Code of Ethics for Professional Accountants (“the IESBA Code”) and we have fulfilled our other ethical responsibilities in accordance with the IESBA Code. We believe that the audit evidence we have obtained is sufficient and appropriate to provide a basis for our opinion.
Other Information
Management is responsible for the other information. The other information comprises the information included in the Group’s annual report, other than the consolidated financial statements and our auditor’s report thereon.
Our opinion on the consolidated financial statements does not cover the other information and we do not express any form of assurance conclusion thereon.
In connection with our audit of the consolidated financial statements, our responsibility is to read the other information and, in doing so, consider whether the other information is materially inconsistent with the consolidated financial statements or our knowledge obtained in the audit, or otherwise appears to be materially misstated.
If, based on the work we have performed on the other information obtained prior to the date of this auditor’s report, we conclude that there is a material misstatement of this other information, we are required to report that fact. We have nothing to report in this regard.
Responsibilities of Management and Those Charged with Governance for the Consolidated Financial Statements
Management is responsible for the preparation and fair presentation of the consolidated financial statements in accordance with IFRS, and for such internal control as management determines is necessary to enable the preparation of consolidated financial statements that are free from material misstatement, whether due to fraud or error.
In preparing the consolidated financial statements, management is responsible for assessing the Group’s ability to continue as a going concern, disclosing, as applicable, matters related to going concern and using the going concern basis of accounting unless management either intends to liquidate the Group or to cease operations, or has no realistic alternative but to do so.
Those charged with governance are responsible for overseeing the Group’s financial reporting process.
KPMG Safi Al-Mutawa & PartnersAl Hamra Tower, 25th FloorAbdulaziz Al Saqr Street,P.O. Box 24, Safat 13001, KuwaitTel : + 965 2228 7000Fax : + 965 2228 7444

Gulf Investment Corporation G.S.C. and SubsidiariesAnnual Report and Accounts 2018
71
Auditor’s Responsibilities for the Audit of the Consolidated Financial Statements
Our objectives are to obtain reasonable assurance about whether the consolidated financial statements as a whole are free from material misstatement, whether due to fraud or error, and to issue an auditor’s report that includes our opinion. Reasonable assurance is a high level of assurance, but is not a guarantee that an audit conducted in accordance with ISA will always detect a material misstatement when it exists. Misstatements can arise from fraud or error and are considered material if, individually or in the aggregate, they could reasonably be expected to influence the economic decisions of users taken on the basis of these consolidated financial statements.
As part of an audit in accordance with ISA, we exercise professional judgment and maintain professional skepticism throughout the audit. We also:
• Identify and assess the risks of material misstatement of the consolidated financial statements, whether due to fraud or error, design and perform audit procedures responsive to those risks, and obtain audit evidence that is sufficient and appropriate to provide a basis for our opinion. The risk of not detecting a material misstatement resulting from fraud is higher than for one resulting from error, as fraud may involve collusion, forgery, intentional omissions, misrepresentations, or the override of internal control.
• Obtain an understanding of internal control relevant to the audit in order to design audit procedures that are appropriate in the circumstances, but not for the purpose of expressing an opinion on the effectiveness of the Group’s internal control.
• Evaluate the appropriateness of accounting policies used and the reasonableness of accounting estimates and related disclosures made by management.
• Conclude on the appropriateness of management’s use of the going concern basis of accounting and, based on the audit evidence obtained, whether a material uncertainty exists related to events or conditions that may cast significant doubt on the Group’s ability to continue as a going concern. If we conclude that a material uncertainty exists, we are required to draw attention in our auditor’s report to the related disclosures in the consolidated financial statements or, if such disclosures are inadequate, to modify our opinion. Our conclusions are based on the audit evidence obtained up to the date of our auditor’s report. However, future events or conditions may cause the Group to cease to continue as a going concern.
• Evaluate the overall presentation, structure and content of the consolidated financial statements, including the disclosures, and whether the consolidated financial statements represent the underlying transactions and events in a manner that achieves fair presentation.
• Obtain sufficient appropriate audit evidence regarding the financial information of the entities or business activities within the Group to express an opinion on the consolidated financial statements. We are responsible for the direction, supervision and performance of the group audit. We remain solely responsible for our audit opinion.
We communicate with those charged with governance regarding, among other matters, the planned scope and timing of the audit and significant audit findings, including any significant deficiencies in internal control that we identify during our audit.
Report on Other Legal Requirements
We further report that we have obtained the information and explanations that we required for the purpose of our audit and the consolidated financial statements include the information required by the Corporation’s Agreement of Incorporation and Articles of Association. In our opinion, proper books of account have been kept by the Corporation and an inventory count was carried out in accordance with recognized procedures and the accounting information given in the Board of Directors’ report agrees with the books of accounts of the Corporation. We have not become aware of any violations of the provisions of the Corporation’s Agreement of Incorporation and Articles of Association during the year ended 31 December 2018 that might have had a material effect on the business of the Group or on its consolidated financial position.
Safi A. Al-MutawaLicense No 138 “A”of KPMG Safi Al-Mutawa & Partners Member firm of KPMG International
Kuwait: 10 April 2019
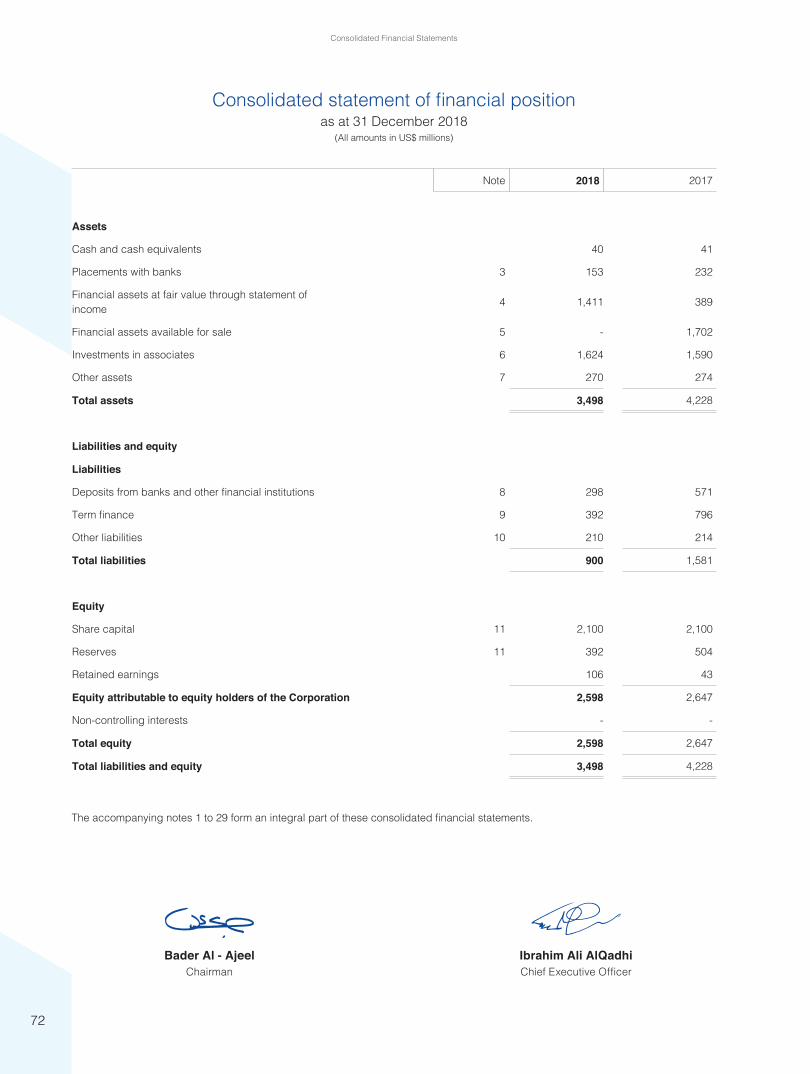
Consolidated Financial Statements
72
Consolidated statement of financial positionas at 31 December 2018
(All amounts in US$ millions)
Note 2018 2017
Assets
Cash and cash equivalents 40 41
Placements with banks 3 153 232
Financial assets at fair value through statement ofincome 4 1,411 389
Financial assets available for sale 5 - 1,702
Investments in associates 6 1,624 1,590
Other assets 7 270 274
Total assets 3,498 4,228
Liabilities and equity
Liabilities
Deposits from banks and other financial institutions 8 298 571
Term finance 9 392 796
Other liabilities 10 210 214
Total liabilities 900 1,581
Equity
Share capital 11 2,100 2,100
Reserves 11 392 504
Retained earnings 106 43
Equity attributable to equity holders of the Corporation 2,598 2,647
Non-controlling interests - -
Total equity 2,598 2,647
Total liabilities and equity 3,498 4,228
The accompanying notes 1 to 29 form an integral part of these consolidated financial statements.
Bader Al - AjeelChairman
Ibrahim Ali AlQadhi Chief Executive Officer
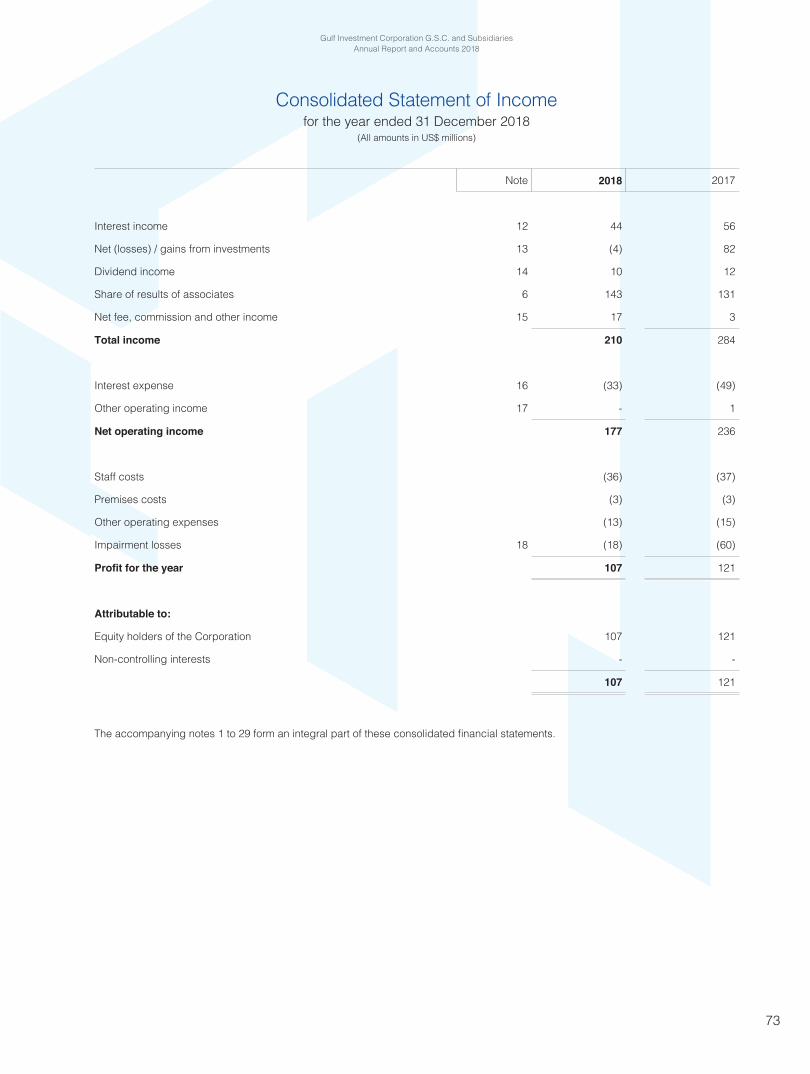
Gulf Investment Corporation G.S.C. and SubsidiariesAnnual Report and Accounts 2018
73
Consolidated Statement of Incomefor the year ended 31 December 2018
(All amounts in US$ millions)
Note 2018 2017
Interest income 12 44 56
Net (losses) / gains from investments 13 (4) 82
Dividend income 14 10 12
Share of results of associates 6 143 131
Net fee, commission and other income 15 17 3
Total income 210 284
Interest expense 16 (33) (49)
Other operating income 17 - 1
Net operating income 177 236
Staff costs (36) (37)
Premises costs (3) (3)
Other operating expenses (13) (15)
Impairment losses 18 (18) (60)
Profit for the year 107 121
Attributable to:
Equity holders of the Corporation 107 121
Non-controlling interests - -
107 121
The accompanying notes 1 to 29 form an integral part of these consolidated financial statements.

Consolidated Financial Statements
74
Consolidated Statement of other Comprehensive Incomefor the year ended 31 December 2018
(All amounts in US$ millions)
Note 2018 2017
Profit for the year 107 121
Other comprehensive income that may be reclassified to consolidated statement of income in subsequent periods:
Financial assets available for sale:- Net unrealised gain arising during the year - 10
- Transferred to consolidated statement of income on sale 13 - (60)
- Transferred to consolidated statement of income on impairment 18 - 31
Impairment losses of associates on revalued assets (27) -
Share of other comprehensive (loss) / income of associates (14) 25
Other comprehensive (loss) / income for the year (41) 6
Total comprehensive income for the year 66 127
Attributable to:
Equity holders of the Corporation 66 127
Non-controlling interests - -
66 127
The accompanying notes 1 to 29 form an integral part of these consolidated financial statements.

Gulf Investment Corporation G.S.C. and SubsidiariesAnnual Report and Accounts 2018
75
Consolidated Statement of Changes in Equityfor the year ended 31 December 2018
(All amounts in US$ millions)
Reserves
Share capital
Compulsory reserve
Voluntary reserve
Investment revaluation
reserve
Cashflow
hedge reserve
Foreign currency
translation reserve
(Accumulated losses)/ retained earnings Total
Non-controlling
interestsTotal
equity
Balance as at 1 January 2017 2,100 400 125 128 (110) (57) (66) 2,520 6 2,526
Profit for the year - - - - - - 121 121 - 121
Other comprehensive (loss) / income - - - (16) 12 10 - 6 - 6
Total comprehensive income - - - (16) 12 10 121 127 - 127
Transfer to reserves (note 11) - 12 - - - - (12) - - -
Net movement in minority interest - - - - - - - - (6) (6)
Balance as at 31 December 2017 2,100 412 125 112 (98) (47) 43 2,647 - 2,647
Balance as at 1 January 2018 2,100 412 125 112 (98) (47) 43 2,647 - 2,647
Adjustment on initial application of IFRS 9 (note 2.2 (ii)) - - - (82) - - 82 - - -
Adjustment on initial application of IFRS 9 in associates(note 2.2 (ii))
- - - - - - (2) (2) - (2)
Prior period adjustments(note 28) - - - - - - (8) (8) - (8)
Balance as at 1 January 2018 2,100 412 125 30 (98) (47) 115 2,637 - 2,637
Profit for the year - - - - - - 107 107 - 107
Other comprehensive (loss) / income - - - (30) 13 (24) - (41) - (41)
Total comprehensive income - - - (30) 13 (24) 107 66 - 66
Transfer to reserves (note 11) - 11 - - - - (11) - - -
Dividend (note 11) - - - - - - (105) (105) - (105)
Balance as at 31 December 2018 2,100 423 125 - (85) (71) 106 2,598 - 2,598
The accompanying notes 1 to 29 form an integral part of these consolidated financial statements.

Consolidated Financial Statements
76
Consolidated Statement of Cash Flowsfor the year ended 31 December 2018
(All amounts in US$ millions)
Note 2018 2017
Cash flows from operating activities:
Profit for the year 107 121
Non-cash and other adjustments to reconcile profit for the year to net cash flows:
Impairment losses 18 18 60
Realised gain on financial assets available for sale 13 - (60)
Realised gain on sale of a subsidiary 13 (4) -
Share of results of associates 6 (143) (131)
Amortisation of net discount / premium on debt securities - 7
(22) (3)
Changes in operating assets and liabilities:
Placements with banks 79 49
Financial assets at fair value through statement of income 680 65
Financial assets available for sale - 515
Deposits from banks and other financial institutions (273) 1
Movement in other assets and other liabilities (18) 1
Net cash flows generated from operating activities 446 628
Cash flows from investing activities:
Proceeds from sale of a subsidiary 6 -
Dividends from associates 59 31
Purchase of associates - (130)
Repayment of advances from associate 15 -
Additional contribution to associates (22) (86)
Net cash flows from / (used in) investing activities 58 (185)
Cash flows from financing activities:
Term finance repaid (400) (500)
Dividend paid 11 (105) -
Net cash flows used in financing activities (505) (500)
Net change in cash and cash equivalents (1) (57)
Cash and cash equivalents at 1 January 41 98
Cash and cash equivalents at 31 December 40 41
The accompanying notes 1 to 29 form an integral part of these consolidated financial statements.

Gulf Investment Corporation G.S.C. and SubsidiariesAnnual Report and Accounts 2018
77
1 Incorporation and activity
Gulf Investment Corporation G.S.C. (“the Corporation”) is an investment company incorporated in the State of Kuwait on 15 November 1983 as a Gulf shareholding company. It is equally owned by the governments of the six member states of the Gulf Co-operation Council (“GCC”) – Bahrain, Kuwait, Oman, Qatar, Saudi Arabia and the United Arab Emirates. The Corporation is engaged in various investing and financing activities.
The Corporation is domiciled in Kuwait and its registered office is at Jaber Al Mubarak Street, Al Sharq, State of Kuwait.
The consolidated financial statements of the Corporation and its subsidiaries (collectively “the Group”) for the year ended 31 December 2018 were approved by the Board of Directors on 7 March 2019. The Annual General Assembly of shareholders has the power to amend these consolidated financial statements after issuance.
The Corporation’s Agreement of Incorporation and Articles of Association gives it a special, supranational status. In particular, Article 8 of GIC’s Agreement of Incorporation provides that local laws in each GCC state complement the provisions of GIC’s Agreement of Incorporation and Articles of Association provided that such laws do not conflict with GIC’s Agreement of Incorporation or Articles of Association. To the extent there is such a conflict, GIC’s Agreement of Incorporation and Articles of Association prevail over local laws, including the Kuwait Companies Law.
2 Significant accounting policies
2.1 Statement of compliance
The consolidated financial statements of the Group have been prepared in accordance with the International Financial Reporting Standards (“IFRS”) promulgated by the International Accounting Standards Board (“IASB”), interpretations issued by the International Financial Reporting Committee of the IASB. In addition, the consolidated financial statements have been prepared in accordance with the Corporation’s Agreement of Incorporation and Articles of Association.
Changes to significant accounting policies are described in note 2.2.
2.2 Basis of preparation
The consolidated financial statements are prepared on a historical cost convention, except for the measurement at fair value of financial assets at fair value through profit and loss and derivative financial instruments.
The consolidated financial statements are presented in United States Dollars, rounded to the nearest million.
Changes in accounting policy and disclosures
The accounting policies used in the preparation of these consolidated financial statements are consistent with those used in previous year, except for the adoption of IFRS 15, Revenue from Contracts with Customers and IFRS 9, Financial Instruments, which are effective for annual reporting periods starting from 1 January 2018.
i. IFRS 15, Revenue from Contracts with CustomersIFRS 15 was issued in May 2014 and is effective for annual periods commencing on or after 1 January 2018. IFRS 15 outlines a single comprehensive model of accounting for revenue arising from contracts with customers and supersedes current revenue guidance, which is found currently across several standards and interpretations within IFRS.
IFRS 15 has established new five-step model that will apply to revenue arising from contracts with customers. Under IFRS 15, revenue is recognised at an amount that reflects the consideration to which an entity expects to be entitled in exchange for transferring goods or services to a customer.
The Group’s adoption of IFRS 15 had no significant impact on its consolidated financial statements.
ii. IFRS 9, Financial Instruments
The Group has adopted IFRS 9, Financial Instruments issued in July 2014 with a date of initial application of 1 January 2018. The requirements of IFRS 9 represent a significant change from IAS 39, Financial Instruments: Recognition and Measurement. The new standard brings fundamental changes to the accounting for financial assets and to certain aspects of the accounting for financial liabilities.
Differences in the carrying amount of financial assets resulting from the adoption of IFRS 9 are recognized in retained earnings and reserves as at 1 January 2018.
The key changes to the Group’s accounting policies resulting from the adoption of IFRS 9 are summarized below:
Notes to the Consolidated Financial Statementsfor the year ended 31 December 2018
(All amounts in US$ millions)

78
Consolidated Financial Statements
Notes to the Consolidated Financial Statementsfor the year ended 31 December 2018
(All amounts in US$ millions)
2 Significant accounting policies (continued)
2.2 Basis of preparation (continued)
Classification and measurement of financial assets and financial liabilities
IFRS 9 contains three principal classification categories for financial assets: measured at amortised cost, fair value through other comprehensive income (“FVOCI”) and fair value through profit or loss (“FVTPL”). The classification of financial assets under IFRS 9 is generally based on the business model in which a financial asset is managed and its contractual cash flow characteristics.
IFRS 9 eliminates the previous IAS 39 categories of held to maturity, loans and receivables and available for sale.
IFRS 9 largely retains the existing requirements in IAS 39 for the classification and measurement of financial liabilities.
The adoption of IFRS 9 did not had a significant effect on the Group’s accounting policies related to financial liabilities.
The following table illustrates the classification and measurement of financial assets under IFRS 9 and IAS 39:
Original classification under IAS 39
New classification underIFRS 9
Cash and cash equivalents Loans and receivables, carried at amortised cost
Financial assets carried at amortised cost
Placements with banks Loans and receivables, carried at amortised cost
Financial assets carried at amortised cost
Debt instruments Investments at fair value through statement of income
Investments at fair value through statement of income
Debt instruments Available for sale investments, carried at fair value
Investments at fair value through statement of income
Equities and managed funds (hedge and other unquoted alternative funds)
Investments at fair value through statement of income
Investments at fair value through statement of income
Equities and managed funds (quoted equity investments and funds)
Available for sale investments, carried at fair value
Investments at fair value through statement of income
Equity participations Available for sale investments, carried at fair value
Investments at fair value through statement of income
Private equity funds Available for sale investments, carried at fair value
Investments at fair value through statement of income
Other assets (margin money and project related receivables)
Loans and receivables, carried at amortised cost
Financial assets carried at amortised cost
The following table summarize the impact of IFRS 9 on the Group’s financial statements, as discussed above, as at 1 January 2018:
Balances previously reported
31 December 2017Impact on
adoption of IFRS 9Balances as at 1 January 2018
Financial assetsCash and cash equivalents 41 - 41Placement with banks 232 - 232Investments available for sale 1,702 (1,702) -Investments at fair value through statement of income 389 1,702 2,091Other assets 274 - 274Non-financial assetsInvestment in associates 1,590 (2) 1,588EquityInvestment revaluation reserve 112 (82) 30Retained earnings 43 80 123

Gulf Investment Corporation G.S.C. and SubsidiariesAnnual Report and Accounts 2018
79
Notes to the Consolidated Financial Statementsfor the year ended 31 December 2018
(All amounts in US$ millions)
2 Significant accounting policies (continued)
2.2 Basis of preparation (continued)
The impact of US$ 2 million under investment in associates reflects the adjustment on initial application of IFRS 9 by associates.
Adoption of IFRS 9 did not result in any change in classification or measurement of financial liabilities.
Impairment of financial assets
IFRS 9 replaces the ‘incurred loss’ model in IAS 39 with an ‘expected credit loss’ (ECL) model. The new impairment model applies to financial assets measured at amortised cost and debt investments at FVOCI, but not to investments in equity instruments. Under IFRS 9, credit losses are recognized earlier than under IAS 39.
Hedge accounting
The general hedge accounting requirements of IFRS 9 retain the three types of hedge accounting mechanisms in IAS 39. However, greater flexibility has been introduced to the types of transactions eligible for hedge accounting, specifically broadening the types of instruments that qualify as hedging instruments and the types of risk components of non-financial items that are eligible for hedge accounting. In addition, changes have been introduced to the effectiveness test and has been replaced with the principle of an ‘economic relationship’. Retrospective assessment of hedge effectiveness is no longer required.
The hedging requirements of IFRS 9 did not have a significant impact on Group’s consolidated financial statements.
Transition
The Group has not restated comparative information for the year ended 31 December 2017 as permitted by the transitional provisions of the standard. Therefore, the information presented for the year ended 31 December 2017 does not reflect the requirements of IFRS 9 and is not comparable to the information presented for the year ended 31 December 2018.
The profit for the year ended 31 December 2017 would have been US$ 102 million if the Corporation had adopted IFRS 9 effective from 1 January 2017, except adjustments for expected credit loss on financial assets.
For a detailed explanation of how the Group classifies and measures financial instruments and accounts for related gains and losses under IFRS 9, refer to note 2.5.
Other amendments to IFRS which are effective for annual accounting period starting from 1 January 2018 did not have any material impact on the accounting policies, consolidated financial position or performance of the Group.
2.3 Basis of consolidation
The consolidated financial statements comprise the financial statements of the Corporation and its subsidiaries including special purpose entities. Specifically, the Group controls an investee if, and only if, the Group has:
• Power over the investee (i.e. existing rights that give it the current ability to direct the relevant activities of the investee);
• Exposure, or rights, to variable returns from its involvement with the investee; and
• The ability to use its power over the investee to affect its returns.
When the Group has less than a majority of the voting or similar rights of an investee, the Group considers all relevant facts and circumstances in assessing whether it has power over an investee, including:
• The contractual arrangement with the other vote holders of the investee;
• Rights arising from other contractual arrangements; and
• The Group’s voting rights and potential voting rights.
The Group re-assesses whether or not it controls an investee, if facts and circumstances indicate that there are changes to one or more of the three elements of control.
Consolidation of a subsidiary begins when the Group obtains control over the subsidiary and ceases when the Group loses control of the subsidiary. Assets, liabilities, income and expenses of a subsidiary acquired or disposed off during the year are included in the consolidated financial statements from the date the Group gains control till the date the Group ceases to control the subsidiary.

80
Consolidated Financial Statements
Notes to the Consolidated Financial Statementsfor the year ended 31 December 2018
(All amounts in US$ millions)
2 Significant accounting policies (continued)
2.3 Basis of consolidation (continued)
Profit or loss and each component of other comprehensive income are attributed to the equity holders of the Corporation and to the non-controlling interests, even if this results in the non-controlling interests having a deficit balance. When necessary, adjustments are made to the financial statements of subsidiaries to bring their accounting policies into line with the Group’s accounting policies. All intra-group assets and liabilities, equity, income, expenses and cash flows relating to transactions between members of the Group are eliminated in full on consolidation.
A change in the ownership interest of a subsidiary, without a loss of control, is accounted for as an equity transaction. If the Group loses control over a subsidiary, it:
• Derecognises the assets (including goodwill) and liabilities of the subsidiary;
• Derecognises the carrying amount of any non-controlling interests;
• Derecognises the cumulative translation differences recorded in equity;
• Recognises the fair value of the consideration received;
• Recognises the fair value of any investment retained;
• Recognises any surplus or deficit in consolidated statement of income; and
• Reclassifies its share of components previously recognised in other comprehensive income to profit or loss or retained earnings, as appropriate, as would be required if the Group had directly disposed of the related assets or liabilities.
2.4 Business combination and goodwill
Business combinations are accounted for using the acquisition accounting method. The cost of an acquisition is measured as the aggregate of the consideration transferred, measured at acquisition date fair value and the amount of any non-controlling interest in the acquiree. For each business combination, the acquirer measures the non-controlling interest in the acquiree either at fair value or at the proportionate share of the acquiree’s identifiable net assets. Acquisition costs incurred are expensed and included in the consolidated statement of income.
When the Group acquires a business, it assesses the financial assets and liabilities assumed for appropriate classification and designation in accordance with the contractual terms, economic circumstances and pertinent conditions as at the acquisition date. This includes the separation of embedded derivatives in host contracts by the acquiree.
If the business combination is achieved in stages, the acquisition date fair value of the acquirer’s previously held equity interest in the acquiree is remeasured to fair value at the acquisition date through the consolidated statement of income.
Any contingent consideration to be transferred by the acquirer will be recognised at fair value at the acquisition date. Subsequent changes to the fair value of the contingent consideration which is deemed to be an asset or liability, will be recognised in accordance with IAS 39 either in consolidated statement of income or as a change to other comprehensive income. If the contingent consideration is classified as equity, it should not be remeasured until it is finally settled within equity.
Goodwill is initially measured at cost being the excess of the cost of the business combination over the Group’s share in the net fair value of the acquiree’s identifiable assets, liabilities and contingent liabilities. If the cost of acquisition is less than the fair value of the net assets of the subsidiary acquired, the difference is recognised directly in the consolidated statement of income.
After initial recognition, goodwill is measured at cost less any accumulated impairment losses. For the purpose of impairment testing, goodwill acquired in a business combination is, from the acquisition date, allocated to each of the Group’s cash-generating units that are expected to benefit from the synergies of the combination, irrespective of whether other assets or liabilities of the acquiree are assigned to those units.
Where goodwill forms part of a cash-generating unit (group of cash generating units) and part of the operations within that unit is disposed of, the goodwill associated with the operation disposed of is included in the carrying amount of the operation when determining the gain or loss on disposal of the operation. Goodwill disposed of in this circumstance is measured based on the relative values of the operation disposed of and the portion of the cash generation unit retained.

Gulf Investment Corporation G.S.C. and SubsidiariesAnnual Report and Accounts 2018
81
Notes to the Consolidated Financial Statementsfor the year ended 31 December 2018
(All amounts in US$ millions)
2 Significant accounting policies (continued)
2.5 Financial instruments
i. Classification of financial assets - Policy applicable from 1 January 2018
The Group classifies its financial assets upon initial recognition into the following categories:
• Financial assets carried at amortised cost;
• Financial assets carried at fair value through other comprehensive income (with and without recycling of gains or losses to profit or loss on de-recognition of debt and equity securities, respectively); and
• Financial assets carried at fair value through profit or loss.
Financial assets carried at amortised cost
A financial asset is measured at amortised cost if it meets both of the following conditions and is not designated as FVTPL:
• The asset is held within a “business model” whose objective is to hold assets to collect contractual cash flows; and
• The contractual terms of the financial asset give rise on specified dates to cash flows that are solely payments of principal and interest (“SPPI”) on the principal amount outstanding.
Business model assessment
The Group determines its business model at the level that best reflects how it manages groups of financial assets to achieve its business objectives and in order to generate contractual cash flows. That is, whether the Group’s objective is solely to collect the contractual cash flows from the assets or is to collect both the contractual cash flows and cash flows arising from the sale of assets. If neither of these is applicable (e.g. financial assets are held for trading purposes), then the financial assets are classified as part of ‘Sell’ business model and measured at FVTPL. The Group’s business model is not assessed on an instrument-by-instrument basis, but at a higher level of aggregated portfolios.
The business model assessment is based on reasonably expected scenarios without taking ‘worst case’ or ‘stress case’ scenarios into account. If cash flows after initial recognition are realised in a way that is different from the Group’s original expectations, the Group does not change the classification of the remaining financial assets held in that business model, but incorporates such information when assessing newly originated or newly purchased financial assets going forward.
The SPPI test
As a second step of its classification process, the Group assesses the contractual terms of financial asset to identify whether they meet the SPPI test.
Principal for the purpose of this test is defined as the fair value of the financial asset at initial recognition and may change over the life of the financial asset (for example, if there are repayments of principal or amortisation of the premium / discount).
The most significant elements of profit within a lending arrangement are typically the consideration for the time value of money and credit risk. To make the SPPI assessment, the Group applies judgement and considers relevant factors such as the currency in which the financial asset is denominated, and the period for which the interest rate is set.
In contrast, contractual terms that introduce a more than de minimis exposure to risks or volatility in the contractual cash flows that are unrelated to a basic lending arrangement do not give rise to contractual cash flows that are solely payments of principal and profit on the amount outstanding. In such cases, the financial asset is required to be measured at FVTPL.
Further, financial assets carried at amortised cost are subsequently measured at amortised cost using the effective interest rate method. The amortised cost is reduced by impairment losses. Income, foreign exchange gains and losses and impairment are recognised in the consolidated statement of income. Any gain or loss on derecognition is recognised in the consolidated statement of income.
Cash and cash equivalents, placements with banks and other assets are classified as financial assets carried at amortised cost.
Cash and cash equivalents comprise of cash and balances with banks and financial institutions, balances with central banks and placements with banks and other financial institutions maturing within seven days.

82
Consolidated Financial Statements
Notes to the Consolidated Financial Statementsfor the year ended 31 December 2018
(All amounts in US$ millions)
2 Significant accounting policies (continued)
2.5 Financial instruments (continued)
Financial assets carried at FVOCI
(a) Equity instruments
Upon initial recognition, the Group makes an irrevocable election to classify its equity investments as equity investments at FVOCI if they meet the definition of equity under IAS 32, Financial Instruments: Presentation and are not held for trading. Such classification is determined on an instrument-by-instrument basis. Equity investments at FVOCI are subsequently measured at fair value. Changes in fair values including foreign exchange component are recognized in consolidated statement of other comprehensive income (“OCI”) and presented in the investment revaluation reserve as part of equity. Cumulative gains and losses previously recognized in OCI are transferred to retained earnings on de-recognition and are not recognized in the consolidated statement of income.
The Group does not have equity instrument at FVOCI category as at the reporting date.
(b) Debt instruments
The Group applies the new category under IFRS 9 of debt instruments measured at FVOCI when both of the following conditions are met:
• The instrument is held within a business model, the objective of which is achieved by both collecting contractual cash flows and selling financial assets; and
• The contractual terms of the financial asset meet the SPPI test.
FVOCI debt instruments are subsequently measured at fair value with gains and losses arising due to changes in fair value are recognised in OCI. Financing income and foreign exchange gains and losses and impairment losses are recognised in consolidated statement of income. On derecognition, cumulative gains or losses previously recognised in OCI are reclassified to consolidated statement of income.
The Group does not have debt instrument at FVOCI category as at the reporting date.
All financial assets not classified as measured at amortised cost or FVOCI are measured at FVTPL. On initial recognition, the Group may irrevocably designate a financial asset that otherwise meets the requirements to be measured at amortised cost or at FVOCI as at FVTPL if doing so eliminates or significantly reduces an accounting mismatch that would otherwise arise.
Changes in fair values, interest income and dividends are recorded in consolidated statement of income according to the terms of the contract, or when the right to payment has been established.
Financial assets at FVTPL
Derecognition of financial assets
The Group derecognises a financial asset when the contractual rights to the cash flows from the financial asset expire, or it transfers the rights to receive the contractual cash flows in a transaction in which substantially all of the risks and rewards of ownership of the financial asset are transferred or in which the Group neither transfers nor retains substantially all of the risks and rewards of ownership and it does not retain control of the financial asset.
The Group enters into transactions whereby it transfers assets recognised in its consolidated statement of financial position, but retains either all or substantially all of the risks and rewards of the transferred assets. In these cases, the transferred assets are not derecognised.
Financial assets - Policy applicable before 1 January 2018
Recognition
Regular way purchases and sales of financial assets were recognised on trade date, the date on which the Group commits to purchase and sell the assets. Regular-way purchases or sales are purchases or sales of financial assets that require delivery of assets within the time frame generally established by regulation or convention in the market place.
Financial assets were recognised initially at fair value plus, in the case of financial assets other than fair value through statement of income, directly attributable transaction costs.
The Group’s financial assets included quoted and unquoted financial instruments, other assets and derivative financial instruments.

Gulf Investment Corporation G.S.C. and SubsidiariesAnnual Report and Accounts 2018
83
Notes to the Consolidated Financial Statementsfor the year ended 31 December 2018
(All amounts in US$ millions)
2 Significant accounting policies (continued)
2.5 Financial instruments (continued)
Classification and measurement
The classification of financial assets was determined by the Group at initial recognition depending upon the purpose for which the financial assets were acquired and their characteristics.
Financial assets at fair value through statement of income includes financial assets held for trading and financial assets designated upon initial recognition at fair value through statement of income.
Financial assets were classified as held for trading if they were acquired for the purpose of selling in the near term or principally held for the purpose of short-term profit taking. Derivatives were classified as held for trading unless they were designated as effective hedging instruments.
The Group designated an investment as at fair value through statement of income in the following cases:
• The designation eliminates or significantly reduces the inconsistent treatment that would otherwise arise from measuring the assets or liabilities or recognising gains or losses on them on a different basis; or
• When the assets and liabilities were part of a group of financial assets which were managed and their performance is evaluated on a fair value basis, in accordance with a documented risk management or investment strategy.
After initial recognition, financial assets at fair value through statement of income were remeasured at fair value with all changes in fair value recognised in the consolidated statement of income.
Financial assets held to maturity were financial assets with fixed or determinable payments and fixed maturity that the Group has the intention and ability to hold to maturity. Held to maturity investments were measured at amortised cost, less provision for impairment in value, if any. The losses arising from impairment of such investments were recognised in the consolidated statement of income.
Loans and receivables were non-derivative financial assets with fixed or determinable payments other than those financial assets acquired with the intention of short-term profit taking or financial assets quoted in an active market. Loans and receivables were stated at amortised cost using the effective interest method less any amounts written off and provision for impairment. The calculation takes into account any premium or discount on acquisition and includes transaction costs and fees that are an integral part of the effective interest rate.
Financial assets available for sale were those non-derivative financial assets that were designated as available-for-sale or were not classified in any of the preceding categories.
Classification and measurement (continued)
After initial measurement, financial assets available for sale were subsequently measured at fair value with gains or losses being recognised in consolidated statement of other comprehensive income in the investment revaluation reserve until the investment is derecognised or the investment is determined to be impaired, at which time the cumulative gain or loss is recognised in the consolidated statement of income. Investments whose fair value cannot be reliably measured are carried at cost less impairment losses, if any.
The Group evaluated whether its ability and intention to sell its financial assets available for sale in the near term was still appropriate. When the Group was unable to trade these financial assets due to inactive markets and / or the management’s intent significantly changes to do so in the foreseeable future, the Group may elect to reclassify these financial assets in rare circumstances.
Derivatives include interest rate swaps, futures, cross currency swaps, forward exchange contracts and options on interest rates and foreign currencies. Derivatives were recorded at fair value and carried as assets when their fair value was positive and as liability when their fair value was negative. Changes in fair value of derivatives held for trading were recognised in the consolidated statement of income.
ii) Impairment of financial assets - Policy applicable from 1 January 2018
The Group applies three-stage approach to measuring ECL. Assets migrate through the following three stages based on the change in credit quality since initial recognition.
Stage 1: 12 months ECL For exposures where there has not been a significant increase in credit risk since initial recognition, the portion of the lifetime ECL associated with the probability of default events occurring within next 12 months is recognised.

84
Consolidated Financial Statements
Notes to the Consolidated Financial Statementsfor the year ended 31 December 2018
(All amounts in US$ millions)
2 Significant accounting policies (continued)
2.5 Financial instruments (continued)
Stage 2: Lifetime ECL – not credit impaired For credit exposures where there has been a significant increase in credit risk since initial recognition but that are not credit impaired, a lifetime ECL is recognised.
Stage 3: Lifetime ECL – credit impaired Financial assets are assessed as credit impaired when one or more events that have a detrimental impact on the estimated future cash flows of that asset have occurred. As this uses the same criteria as under IAS 39, the Group’s methodology for specific provisions remains largely unchanged.
Lifetime ECL is recorded on financial assets that are credit-impaired. A financial asset is ‘credit-impaired’ when one or more events that have a detrimental impact on the estimated future cash flows of the financial asset have occurred.
At each reporting date, the Group assesses whether financial assets carried at amortised cost are credit impaired. A financial asset is credit impaired when one or more events that have a detrimental impact on the estimated future cash flows of the financial asset have occurred.
Evidence that a financial asset is credit impaired includes the following observable data:• significant financial difficulty of the borrower or issuer;• a breach of contract such as a default or past due event;• the restructuring of loans and advances by the Group on terms that the Group would not consider otherwise;• it is becoming probable that the borrower will enter bankruptcy or other financial reorganisation; or• the disappearance of an active market for a security because of financial difficulties.
The Group evaluates the probability of default considering the period of past due receivables. However, in certain cases, the Group may also consider a financial asset to be in default when internal or external information indicates that the Group is unlikely to receive the outstanding contractual amounts in full before taking into account any credit enhancements held by the Group. A financial asset is written off when there is no reasonable expectation of recovering the contractual cash flows.
When determining whether the credit risk of a financial asset has increased significantly since initial recognition and when estimating ECLs, the Group considers reasonable and supportable information that is relevant and available without undue cost or effort. This includes both quantitative and qualitative information and analysis, based on the Group’s historical experience and informed credit assessment and including forward-looking information.
ii) Impairment of financial assets - Policy applicable from 1 January 2018 (continued)
Presentation of allowance for ECL in the consolidated statement of financial position
ECL for financial assets measured at amortised cost are deducted from the gross carrying amount of the assets.
Impairment of financial assets - Policy applicable before 1 January 2018
The Group assessed at each reporting date whether there is any objective evidence that a financial asset or a group of financial assets was impaired. A financial asset or a group of financial assets was deemed to be impaired if, and only if, there was objective evidence of impairment as a result of one or more events that had occurred after the initial recognition of the asset (an incurred ‘loss event’) and that loss event had an impact on the estimated future cash flows of the financial asset or the group of financial assets that can be reliably estimated. Evidence of impairment may include indications that the debtors or a group of debtors is experiencing significant financial difficulty, default or delinquency in interest or principal payments, the probability that they will enter bankruptcy or other financial reorganisation and where observable data indicate that there was a measurable decrease in the estimated future cash flows, such as changes in arrears or economic conditions that correlate with defaults.
Financial assets carried at amortised cost
For financial assets carried at amortised cost, the Group first assesses individually whether objective evidence of impairment exists individually for financial assets that were individually significant, or collectively for financial assets that were not individually significant. If the Group determines that no objective evidence of impairment exists for an individually assessed financial asset, whether significant or not, it includes the asset in a group of financial assets with similar credit risk characteristics and collectively assesses them for impairment. Assets that were individually assessed for impairment and for which an impairment loss was, or continued to be, recognised were not included in a collective assessment of impairment.

Gulf Investment Corporation G.S.C. and SubsidiariesAnnual Report and Accounts 2018
85
Notes to the Consolidated Financial Statementsfor the year ended 31 December 2018
(All amounts in US$ millions)
2 Significant accounting policies (continued)
2.5 Financial instruments (continued)
If there was an objective evidence that an impairment loss had incurred, the amount of the loss was measured as the difference between the asset’s carrying amount and the present value of estimated future cash flows (excluding future expected credit losses that have not yet been incurred). The present value of the estimated future cash flows was discounted at the financial asset original effective interest rate. If a financial asset had a variable interest rate, the discount rate for measuring any impairment loss was the current effective interest rate.
The carrying amount of the asset was reduced through the use of an allowance account and the amount of the loss was recognised in the consolidated statement of income. If in a subsequent year, the amount of the estimated impairment loss increases or decreases because of an event occurring after the impairment was recognised, the previously recognised impairment loss was increased or reduced by adjusting the allowance account.
Financial assets available for sale
For financial assets available for sale, the Group assessed at each reporting date whether there was an objective evidence that an investment or a group of investments was impaired.
In the case of equity investments classified as available for sale, objective evidence would include a significant or prolonged decline in the fair value of the investment below its cost. ‘Significant’ is to be evaluated against the original cost of the investment and ‘prolonged’ against the period in which the fair value has been below its original cost. Where there is evidence of impairment, the cumulative loss (measured as the difference between the acquisition cost and the current fair value, less any impairment loss on that investment previously recognised in the consolidated statement of income) was removed from consolidated statement of other comprehensive income and recognised in the consolidated statement of income. Impairment losses on equity investments was not reversed through the consolidated statement of income. Any increase in fair value after impairment is recognised directly in consolidated statement of other comprehensive income.
In the case of debt instruments classified as available for sale, impairment was assessed based on the same criteria as financial assets carried at amortised cost. Subsequent increase in fair value of a debt instrument which was objectively related to an event occurring after the impairment loss was recognised, is credited to the consolidated statement of income.
iii) Financial liabilities
Financial liabilities are classified as measured at amortised cost or FVTPL. A financial liability is classified as at FVTPL if it is classified as held-for-trading, it is a derivative or it is designated as such on initial recognition. Financial liabilities at FVTPL are measured at fair value and net gains and losses, including any interest expense, are recognised in consolidated statement of income. Other financial liabilities are subsequently measured at amortised cost using the effective interest method. Interest expense and foreign exchange gains and losses are recognised in consolidated statement of income. Any gain or loss on derecognition is also recognised in consolidated statement of income.
The measurement of financial liabilities depends on their classification as follows:
Deposits from banks and financial institutions
Deposits from banks and financial institutions are stated at amortised cost using the effective interest rate method.
Term finance
Term finance is initially recognised at fair value of consideration received less directly attributable transaction costs. After initial recognition, interest bearing loans and borrowings are subsequently measured at amortised cost using the effective interest rate method.
Derecognition of financial liabilities
The Group derecognises a financial liability when its contractual obligations are discharged or cancelled, or expire. The Group also derecognises a financial liability when its terms are modified and the cash flows of the modified liability are substantially different, in which case a new financial liability based on the modified terms is recognised at fair value.
On derecognition of a financial liability, the difference between the carrying amount extinguished and the consideration paid (including any non-cash assets transferred or liabilities assumed) is recognised in consolidated statement of income.

86
Consolidated Financial Statements
Notes to the Consolidated Financial Statementsfor the year ended 31 December 2018
(All amounts in US$ millions)
2 Significant accounting policies (continued)
2.6 Offsetting
Financial assets and liabilities are offset and the net amount is reported in the consolidated statement of financial position if, and only if, there is a currently enforceable legal right to offset the recognised amounts and there is an intention to settle on a net basis, or to realise the assets and settle the liabilities simultaneously.
2.7 Fair value of financial instruments
Fair value is the price that would be received to sell an asset or paid to transfer a liability in an orderly transaction between market participants at the measurement date. The fair value measurement is based on the presumption that the transaction to sell the asset or transfer the liability takes place either:
• In the principal market for the asset or liability, or
• In the absence of a principal market, in the most advantageous market for the asset or liability.
The principal or the most advantageous market must be accessible to by the Group.
The fair value of an asset or a liability is measured using the assumptions that market participants would use when pricing the asset or liability, assuming that market participants act in their economic best interest.
For investments and derivatives traded in organised financial markets, fair value is determined by reference to quoted market bid prices at the close of business on the reporting date. The fair value of mutual fund investments, unit trusts or similar investment vehicles is based on the last reported net asset values from the fund managers.
For investments where there is no quoted market price, a reasonable estimate of the fair value is determined by using valuation techniques such as recent arm’s length transactions, reference to the current fair value of another instrument that is substantially the same, an earnings multiple, or is based on the expected cash flows of the investment discounted at current rates applicable for items with similar terms and risk characteristics. Fair value estimates take into account liquidity constraints and assessment for any impairment.
The Group uses valuation techniques that are appropriate in the circumstances and for which sufficient data are available to measure fair value, maximising the use of relevant observable inputs and minimising the use of unobservable inputs.
Investments with no reliable measure of their fair values and for which no fair value information could be obtained are carried at their initial cost less impairment in value.
The fair value of interest bearing financial instruments is estimated based on discounted cash flows using interest rates for items with similar terms and risks characteristics.
An analysis of fair value of financial instruments and further details as to how they are measured are set out in note 24.
2.8 Impairment of non-financial assets The Group assesses at each reporting date whether there is an indication that a non-financial asset may be impaired. If any such indication exists, or when annual impairment testing for an asset is required, the Group estimates the asset’s recoverable amount. An asset’s recoverable amount is the higher of an asset’s or cash-generating unit’s (CGU) fair value less costs to sell and its value in use and is determined for an individual asset, unless the asset does not generate cash inflows that are largely independent of those from other assets or groups of assets. Where the carrying amount of an asset or CGU exceeds its recoverable amount, the asset is considered impaired and is written down to its recoverable amount. In assessing value in use, the estimated future cash flows are discounted to their present value using a pre-tax discount rate that reflects current market assessments of the time value of money and the risks specific to the asset. In determining fair value less costs to sell, an appropriate valuation model is used. These calculations are corroborated by valuation multiples, quoted share prices for publicly traded entities or other available fair value indicators.
Impairment losses of continuing operations are recognised in the consolidated statement of income in those expense categories consistent with the function of the impaired asset.
An assessment is made at each reporting date as to whether there is any indication that previously recognised impairment losses may no longer exist or may have decreased. If such indication exists, the Group estimates the assets or CGUs recoverable amount. A previously recognised impairment loss is reversed only if there has been a change in the assumptions used to determine the asset’s recoverable amount since the last impairment loss was recognised. The reversal is limited so that the carrying amount of the assets does not exceed its recoverable amount, nor exceed the carrying amount that would have been determined, net of depreciation, had no impairment loss been recognised for the asset in prior years. Such reversal is recognised in the consolidated statement of income.

Gulf Investment Corporation G.S.C. and SubsidiariesAnnual Report and Accounts 2018
87
Notes to the Consolidated Financial Statementsfor the year ended 31 December 2018
(All amounts in US$ millions)
2 Significant accounting policies (continued)
2.9 Repurchase and resale arrangementsThe Group enters into purchases / sales of securities under agreements to resell / repurchase substantially identical securities at a specified date in the future at a fixed price.
Securities sold under repurchase agreements continue to be recognised in the consolidated statement of financial position and are measured in accordance with the relevant accounting policy for that investment. The proceeds from the sale of the investments are reported as part of liabilities as securities sold under repurchase agreements. The difference between the sales price and repurchase price is treated as interest expense and is accrued over the life of the agreement using the effective interest method.
Securities purchased under resale agreements are not recognised in the consolidated statement of financial position. The difference between the purchase price and resale price is treated as interest income and is accrued over the life of the agreement using the effective interest method.
2.10 Investment in associatesAn associate is an entity over which the Group exerts significant influence, usually evidenced by a holding of 20% to 50% of the voting power of the investee company. The Group’s investment in associates is accounted for using the equity method of accounting. Where an associate is acquired and held exclusively for resale, it is accounted for as a non-current asset held for sale under IFRS 5.
Under the equity method, investment in associate is initially recognised at cost and adjusted thereafter for the post-acquisition change in the Group’s share of net assets of the investee. Goodwill relating to an associate is included in the carrying amount of the investment and is not amortised or separately tested for impairment. The Group recognises in the consolidated statement of income its share of the results of the associate from the date that influence effectively commenced until the date that it effectively ceases. Where there has been a change recognised directly in the equity of the associate, the Group recognises its share of any changes and discloses this, when applicable, in the consolidated statement of other comprehensive income.
Distributions received from an associate reduce the carrying amount of the investment.
Unrealised gains on transactions with an associate are eliminated to the extent of the Group’s share in the associate. Unrealised losses are also eliminated unless the transaction provides evidence of impairment in the asset transferred.
The reporting dates of the associates and the Group are identical and in case of different reporting date of an associate, which are not more than three months, from that of the Group, adjustments are made for the effects of significant transactions or events that occur between that date and the date of the Group’s consolidated financial statements. The associate’s accounting policies conform to those used by the Group for like transactions and events in similar circumstances.
After application of the equity method, the Group determines whether it is necessary to recognise an additional impairment loss on the Group’s investment in its associates. The Group determines at each reporting date whether there is any objective evidence that the investment in the associate is impaired. If this is the case the Group calculates the amount of impairment as the difference between the recoverable amount of the associate and its carrying value and recognises the amount in the consolidated statement of income.
Associates of the Group are listed in note 27.
2.11 Other provisions
Other provisions are recognised in the consolidated statement of financial position when the Group has a present obligation (legal or constructive) as a result of a past event, from which it is both probable and measurable that an outflow of economic benefits will be required to settle the obligation.
2.12 Property, plant and equipment
Property, plant and equipment is carried at historical cost less accumulated depreciation and impairment losses. An impairment loss is recognised in the consolidated statement of income whenever the carrying amount of an asset exceeds its recoverable amount. The recoverable amount of assets is the greater of their fair value less estimated cost to sell and value in use. Depreciation is computed on a straight-line basis over the estimated useful life of each asset category.
2.13 Derivative financial instruments and hedge accounting
The Group holds derivative financial instruments to hedge its foreign currency and interest rate risk exposures.
Derivatives are initially measured at fair value. Subsequent to initial recognition, derivatives are measured at fair value, and changes therein are generally recognized in consolidated statement of income.

88
Consolidated Financial Statements
Notes to the Consolidated Financial Statementsfor the year ended 31 December 2018
(All amounts in US$ millions)
2 Significant accounting policies (continued)
2.13 Derivative financial instruments and hedge accounting (continued)
Positive and negative fair values are reported as assets and liabilities respectively and are offset when there is both an intention to settle net and a legal right to offset exists.
At inception of designated hedging relationships, the Group documents the risk management objective and strategy for undertaking the hedge. The Group also documents the economic relationship between the hedged item and the hedging instrument, including whether the changes in cash flows of the hedged item and hedging instrument are expected to offset each other.
In relation to fair value hedges which meet the conditions for hedge accounting, any gain or loss from re-measuring the hedging instrument is recognised immediately in the consolidated statement of income. The hedged items are also adjusted for fair value changes relating to the risk being hedged and the difference is recognised in the consolidated statement of income.
For hedges that do not qualify for hedge accounting, any gains or losses arising from changes in fair value of the hedging instrument are taken directly to the consolidated statement of income.
If the hedge no longer meets the criteria for hedge accounting or the hedging instrument is sold, expires, is terminated or is exercised, then hedge accounting is discontinued prospectively. When hedge accounting for cash flow hedges is discontinued, the amount that has been accumulated in the hedging reserve remains in equity until, for a hedge of a transaction resulting in the recognition of a non-financial item, it is included in the non-financial item’s cost on its initial recognition or, for other cash flow hedges, it is reclassified to consolidated statement of income in the same period or periods as the hedged expected future cash flows affect consolidated statement of income.
If the hedged future cash flows are no longer expected to occur, then the amounts that have been accumulated in the hedging reserve and the cost of hedging reserve are immediately reclassified to consolidated statement of income.
2.14 Recognition of income and expenses
Revenue is recognised to the extent that it is probable that the economic benefits will flow to the Group and the revenue can be reliably measured. Revenue is measured at the fair value of the consideration received. The following specific recognition criteria must also be met before revenue is recognised.
Interest income and expenseInterest income and expense are recognised in the consolidated statement of income for all interest bearing financial assets and liabilities using the effective interest rate method. The effective interest rate is the rate that exactly discounts estimated future cash payments or receipts through the expected life of the financial asset or liability or a shorter period, where appropriate to the net carrying amount of the financial asset or liability.
Fees and commission incomeFees earned for providing of services over a period of time are accrued over that period. Fee income for providing transaction services are recognised on completion of the underlying transaction. Performance fees are recognised when earned, being the time the risk of realisation of such fees no longer exists.
Net gains from investmentsInvestment income represents results arising from investment trading activities, including all gains and losses from changes in fair value for financial assets measured at FVTPL.
Dividend incomeDividend income is recognised when the right to receive payment is established.
2.15 End of service benefits
Provision is made for amounts payable to employees under the Kuwaiti Labour Law, employee contracts and applicable labour laws in the countries where the subsidiaries operate. This liability, represents the amount payable to each employee as a result of involuntary termination on the reporting date. The obligations are paid into a plan which is administrated by an independent trustee.
2.16 Foreign currencyThe consolidated financial statements are presented in US Dollars which is also the Corporation’s functional currency. Each entity in the Group determines its own functional currency and items included in the financial statements of each entity are measured using that functional currency.
Gulf Investment Corporation G.S.C. and SubsidiariesAnnual Report and Accounts 2018
89
Notes to the Consolidated Financial Statementsfor the year ended 31 December 2018
(All amounts in US$ millions)
2 Significant accounting policies (continued)
2.16 Foreign currency (continued)
Transactions in foreign currencies are translated to US Dollars at the rate of exchange prevailing at the date of the transaction. Monetary assets and liabilities denominated in foreign currencies are translated into US Dollars at market rates of exchange prevailing on the reporting date. Realised and unrealised foreign exchange gains and losses are included in the consolidated statement of income.
Non-monetary items that are measured in terms of historical costs in a foreign currency are translated using the exchange rates as at the dates of the initial transactions. Translation gains or losses on non-monetary items are included in equity as part of the fair value adjustment on financial assets available for sale, unless they form part of an effective hedging strategy.
Non-monetary items measured at fair value in a foreign currency are translated using the exchange rates at the date when the fair value was determined. Translation differences on non-monetary items at fair value through statement of income are recognised in the consolidated statement of income within the fair value net gain or loss. Any goodwill arising on the acquisition of a foreign operation and any fair value adjustments to the carrying amounts of assets and liabilities arising on the acquisition are treated as assets and liabilities of the foreign operations and translated at closing rate of exchange at the reporting date.
As at the reporting date, the assets and liabilities of foreign subsidiaries, and the carrying amount of foreign associates, are translated into the Group’s presentation currency at the rate of exchange ruling at the reporting date and their statements of income are translated at the weighted average exchange rates for the year. Exchange differences arising on translation are taken directly to foreign exchange translation adjustments within equity. On disposal of a foreign entity, the cumulative amount recognised in equity relating to the particular foreign operation is recognised in the consolidated statement of income.
2.17 Segment reporting
A segment is a distinguishable component of the Group that is engaged either in providing products or services (business segment), or in providing products or services within a particular economic environment (geographical segment), which is subject to risks and rewards that are different from those of other segments.
2.18 Standards issued but not yet effective
Standards issued but not yet effective up to the date of issuance of the Corporation’s financial statements are listed below. The Corporation intends to adopt those standards when they become effective.
IFRS 16, Leases The Group is required to adopt IFRS 16, Leases from 1 January 2019. IFRS 16 introduces a single, on-balance sheet lease accounting model for lessees. A lessee recognises a right-of-use asset representing its right to use the underlying asset and a lease liability representing its obligation to make lease payments. There are recognition exemptions for short-term leases and leases of low-value items. Lessor accounting remains similar to the current standard – i.e. lessors continue to classify leases as finance or operating leases.
IFRS 16 replaces existing leases guidance, including IAS 17 Leases, IFRIC 4 Determining whether an Arrangement contains a Lease, SIC-15 Operating Leases – Incentives and SIC-27 Evaluating the Substance of Transactions Involving the Legal Form of a Lease.
The Group plans to adopt the new standard on the required effective date but does not expect a significant impact of this standard on its consolidated financial statements.
2.19 Significant accounting judgements and estimates
The preparation of the Group’s consolidated financial statements require management to make judgements, estimates and assumptions that affect the reported amounts of revenues, expenses, assets and liabilities and the disclosure of contingent liabilities, at the reporting date. However, uncertainty about the assumptions and estimates could result in outcomes that require a material adjustment to the amount of the asset or liability affected in future periods.
JudgementsIn the process of applying the Group’s accounting policies, management has made the following judgements, which have the most significant effect in the amounts recognised in the consolidated financial statements.
Classification of financial assetsThe Group determines the classification of financial assets based on the assessment of the business model within which the assets are held and assessment of whether the contractual terms of the financial asset are solely payments of principal and interest.

90
Consolidated Financial Statements
Notes to the Consolidated Financial Statementsfor the year ended 31 December 2018
(All amounts in US$ millions)
2 Significant accounting policies (continued)
2.19 Significant accounting judgements and estimates (continued)
Fair value measurement When the fair values of financial assets and financial liabilities recorded in the consolidated statement of financial position cannot be measured based on quoted prices in active markets, their fair value is measured using valuation techniques including the discounted cash flow model.
The inputs to these models are taken from observable markets where possible, but where this is not feasible, a degree of judgement is required in establishing fair values. Judgements include considerations of inputs such as liquidity risk, credit risk and volatility. Any changes in these estimates as well as the use of different, but equally reasonable estimates may have an impact on their carrying amounts.
Considerable judgement by management is required in the estimation of the fair value of the assets acquired and liabilities assumed as a result of business combination including intangibles and contingent liabilities.
Estimation uncertaintyThe key assumptions concerning the future and other key sources of estimation uncertainty at the reporting date, that have a significant risk of causing a material adjustment to the carrying amounts of assets and liabilities within the next financial year are discussed below.
Impairment of investment in associatesThe Group calculates the amount of impairment as the difference between the recoverable amount and its carrying value if there is any objective evidence that the investment in associates are impaired. The estimation of recoverable amount requires the Group to make an estimate of the expected future cash flows and selection of appropriate inputs for valuation.
Measurement of ECLThe measurement of ECL under IFRS 9 across all categories of financial assets requires judgement, in particular, the estimation of the amount and timing of future cash flows and collateral values when determining impairment losses and the assessment of a significant increase in credit risk. These estimates are driven by a number of factors, changes in which can result in different levels of allowances. The key elements in the measurement of ECL include probability of default (“PD”), loss given default (“LGD”) and exposure at default (“EAD”).
PD is an estimate of the likelihood of default over a given time horizon. A default may only happen at a certain time over the assessed period, if the financial asset has not been previously derecognized and is still in the portfolio.
EAD is an estimate of the exposure at a future default date, taking into account expected changes in the exposure after the reporting date, including repayments of principal and profit, whether scheduled by contract or otherwise, expected drawdowns on committed facilities.
LGD is an estimate of the loss arising in the case where a default occurs at a given time.
• The Group’s ECL calculations are outputs of complex model with a number of underlying assumptions regarding the choice of variable inputs and their dependencies. Elements of the ECL model that are considered accounting judgements and estimates include:
• The Group’s internal credit rating model, which assigns PDs to the individual grades;
• The Group’s criterial for assessing if there has been a significant increase in credit risk so allowances for financial assets should be measured on a lifetime ECL basis and qualitative assessment;
• The segmentation of financial assets when their ECL is assessed on a collective basis;
• Development of ECL models, including various formulas and choice of inputs;
• Determination of associations between macroeconomic scenarios and, economic inputs, and the effect on PD, EAD and LGD; and
• Selection of forward-looking macroeconomic scenarios and their probability weightings, to derive the economic inputs into the ECL models.
Valuation of unquoted equity investments
Valuation of unquoted equity investments is normally based on one of the following:
• recent arm’s length market transactions;
• current fair value of another instrument that is substantially the same;
• the expected cash flows discounted at current rates applicable for items with similar terms and risk characteristics; or other valuation models.
The determination of the cash flows and discount factors for unquoted equity investments requires significant estimation.
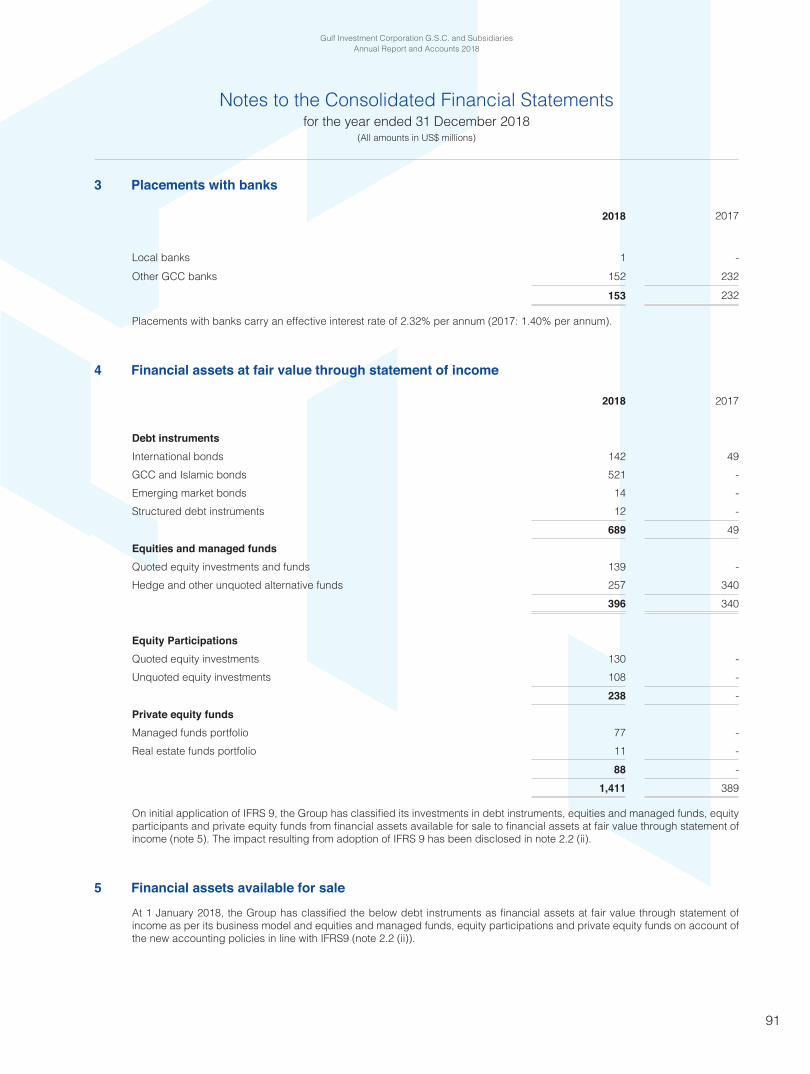
Gulf Investment Corporation G.S.C. and SubsidiariesAnnual Report and Accounts 2018
91
Notes to the Consolidated Financial Statementsfor the year ended 31 December 2018
(All amounts in US$ millions)
3 Placements with banks
2018 2017
Local banks 1 -Other GCC banks 152 232
153 232
Placements with banks carry an effective interest rate of 2.32% per annum (2017: 1.40% per annum).
4 Financial assets at fair value through statement of income
2018 2017
Debt instrumentsInternational bonds 142 49GCC and Islamic bonds 521 -Emerging market bonds 14 -Structured debt instruments 12 -
689 49Equities and managed fundsQuoted equity investments and funds 139 -Hedge and other unquoted alternative funds 257 340
396 340
Equity ParticipationsQuoted equity investments 130 -Unquoted equity investments 108 -
238 -Private equity fundsManaged funds portfolio 77 -Real estate funds portfolio 11 -
88 -1,411 389
On initial application of IFRS 9, the Group has classified its investments in debt instruments, equities and managed funds, equity participants and private equity funds from financial assets available for sale to financial assets at fair value through statement of income (note 5). The impact resulting from adoption of IFRS 9 has been disclosed in note 2.2 (ii).
5 Financial assets available for sale
At 1 January 2018, the Group has classified the below debt instruments as financial assets at fair value through statement of income as per its business model and equities and managed funds, equity participations and private equity funds on account of the new accounting policies in line with IFRS9 (note 2.2 (ii)).
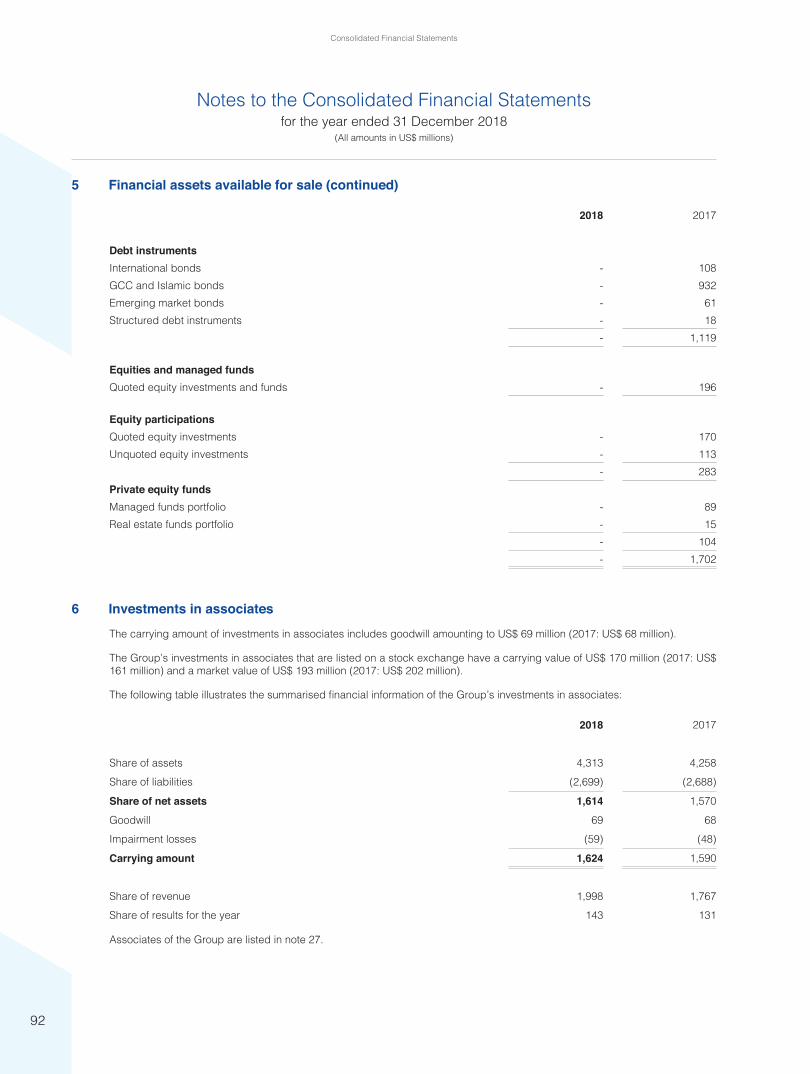
92
Consolidated Financial Statements
Notes to the Consolidated Financial Statementsfor the year ended 31 December 2018
(All amounts in US$ millions)
5 Financial assets available for sale (continued)
2018 2017
Debt instrumentsInternational bonds - 108GCC and Islamic bonds - 932 Emerging market bonds - 61Structured debt instruments - 18
- 1,119
Equities and managed fundsQuoted equity investments and funds - 196
Equity participationsQuoted equity investments - 170Unquoted equity investments - 113
- 283Private equity fundsManaged funds portfolio - 89Real estate funds portfolio - 15
- 104- 1,702
6 Investments in associates
The carrying amount of investments in associates includes goodwill amounting to US$ 69 million (2017: US$ 68 million).
The Group’s investments in associates that are listed on a stock exchange have a carrying value of US$ 170 million (2017: US$ 161 million) and a market value of US$ 193 million (2017: US$ 202 million).
The following table illustrates the summarised financial information of the Group’s investments in associates:
2018 2017
Share of assets 4,313 4,258Share of liabilities (2,699) (2,688)
Share of net assets 1,614 1,570
Goodwill 69 68Impairment losses (59) (48)
Carrying amount 1,624 1,590
Share of revenue 1,998 1,767Share of results for the year 143 131
Associates of the Group are listed in note 27.

Gulf Investment Corporation G.S.C. and SubsidiariesAnnual Report and Accounts 2018
93
Notes to the Consolidated Financial Statementsfor the year ended 31 December 2018
(All amounts in US$ millions)
6 Investments in associates (continued)
Summarised financial information of material associates of the Group is as follows:
2018Foulath
Holding B.S.C. (C)
The National Titanium
Dioxide Co., Ltd. (Cristal)
Tristar Holding Limited
Wataniya Telecom
Algerie S.P.A.
Aviation Lease and Finance
Company K.S.C.
Assets 2,462 3,540 794 1,183 4,016
Liabilities (1,104) (2,621) (431) (513) (2,978)
Non-controlling interests (277) (32) (5) - -
Net assets 1,081 887 358 670 1,038
Revenue 1,464 2,233 456 758 416
Results for the year 108 199 44 40 99
Other comprehensive income / (loss) for the year 1 (112) - (22) -
2017Foulath Holding
B.S.C. (C)
The National Titanium
Dioxide Co., Ltd. (Cristal)
Tristar Holding Limited
Wataniya Telecom
Algerie S.P.A.
Aviation Lease and Finance
Company K.S.C.
Assets 2,279 3,799 732 1,519 3,658
Liabilities (1,045) (2,964) (393) (696) (2,715)
Non-controlling interests (262) (35) (4) - -
Net assets 972 800 335 823 943
Revenue 1,046 2,142 338 940 397
Results for the year 21 85 42 136 116
Other comprehensive income / (loss) for the year 3 101 1 (32) -
The movement during the year is as follows:
2018Foulath
Holding B.S.C. (C)
The National Titanium
Dioxide Co., Ltd. (Cristal)
Tristar Holding Limited.
Wataniya Telecom
Algerie S.P.A.
Aviation Lease and Finance
Company K.S.C.
Opening balance 972 800 335 823 943Opening balance adjustment - - (14) - (4)Dividend - - (7) (171) -Results 108 199 44 40 99Other comprehensive income / (loss) 1 (112) - (22) -
Closing balance 1,081 887 358 670 1,038

94
Consolidated Financial Statements
Notes to the Consolidated Financial Statementsfor the year ended 31 December 2018
(All amounts in US$ millions)
6 Investments in associates (continued)
2017 Foulath Holding B.S.C. (C)
The National Titanium Dioxide Co., Ltd.(Cristal)
Tristar Holding Limited
Wataniya Telecom
Algerie S.P.A.
Aviation Lease and Finance
Company K.S.C.
Opening balance 840 596 - 748 859Incorporation - - 297 - -Shareholders advance 108 18 - - -Dividend - - (5) (29) (32)Results 21 85 42 136 116Other comprehensive income / (loss) 3 101 1 (32) -Closing balance 972 800 335 823 943
Summarised financial information of individually immaterial associates of the Group before any elimination is as follows:
2018 2017
Assets 5,125 5,217Liabilities (3,292) (3,351)Net assets 1,833 1,866Revenue 1,934 1883Results for the year 84 219Other comprehensive income for the year 53 32
7 Other assets2018 2017
Others, including trade receivable of subsidiaries 160 149Expected credit loss (note 18) (3) -
157 149Accrued interest, fees, commissions and dividends 10 13Positive fair value of derivative instruments 1 4Prepayments 2 2Property, plant and equipment 53 60Margin money paid on derivative instruments 47 46
270 274
8 Deposits from banks and other financial institutions2018 2017
Deposits from central banks 30 55Deposits from other financial institutions 217 457 Other deposits 51 59
298 571
At 31 December 2018, deposits from central banks and other institutions headquartered in the GCC states amounted to US$ 298 million (2017: US$ 571 million). Deposits from banks and other financial institutions carry an effective interest rate of 1.75 % per annum (2017: 1.46% per annum).

Gulf Investment Corporation G.S.C. and SubsidiariesAnnual Report and Accounts 2018
95
Notes to the Consolidated Financial Statementsfor the year ended 31 December 2018
(All amounts in US$ millions)
9 Term finance
Interest rate % 2018 2017
KWD medium term deposits maturing in 2018 3.00% per annum - 99
USD medium term deposits maturing in 2018 2.25% per annum - 300
USD medium term deposits maturing in 2021 6 months LIBOR plus 180 bps 100 100
AED bank loans (Subsidiary loans)
Floating rate rangingfrom 5.50% to 7.10% 7 7
Medium Term Note Issues (EMTN)
MYR medium term fixed rate note due in 2021 5.10% per annum (semi annual) 109 111
MYR medium term fixed rate note due in 2022 5.10% per annum (semi annual) 41 42
MYR medium term fixed rate note due in 2023 4.52% per annum (semi annual) 97 99
MYR medium term fixed rate note due in 2027 5.30% per annum (semi annual) 38 38
392 796
10 Other liabilities2018 2017
Accrued interest 12 27Negative fair value of derivative instruments 51 50Others, including trade payable of subsidiaries and accrued expenses 147 137
210 214
11 Equity
11.1 The authorised, issued and fully paid capital comprises of 2.1 million shares of US$ 1,000 each (2017: 2.1 million shares of US$ 1,000 each).
11.2 In accordance with the Corporation’s Articles of Association, 10% of the profit for the year attributable to the equity holders of the Corporation is required to be transferred to a non-distributable compulsory reserve until the reserve reaches a minimum of 50% of the share capital.
11.3 In accordance with the Corporation’s Articles of Association, 10% of the profit for the year attributable to the equity holders of the Corporation is required to be transferred to the voluntary reserve. The transfer to this reserve may be discontinued by a resolution adopted in the general assembly meeting of the shareholders. This reserve is available for distribution to shareholders. As mentioned in note 29, the Board of Directors have recommended not to transfer the 10% of the profit for the current year to the voluntary reserve.
11.4 The Annual General Assembly of the Corporation, held on 9 April 2018, approved the payment of cash dividend of US$ 50 per share amounting to US$ 105 million for the year ended 31 December 2017.

96
Consolidated Financial Statements
Notes to the Consolidated Financial Statementsfor the year ended 31 December 2018
(All amounts in US$ millions)
12 Interest income
2018 2017
Placements with banks 12 6Financial assets available for sale - 48Financial assets at fair value through statement of income 32 2
44 56
13 Net (losses) / gains from investments
2018 2017
Realized gain from financial assets available for sale - 60Realized gain from financial assets at fair value through statement of income 25 7Unrealized (loss) / gain from financial assets at fair value through statement of income (33) 15Realized gain on sale of a subsidiary 4 -
(4) 82
14 Dividend income
2018 2017
Private equity funds 1 2Quoted equity investments and funds 5 5Equity participations 4 5
10 12
15 Net fee, commission and other income
2018 2017
Change in fair value of contingent consideration 6 2Other income 11 1
17 3
16 Interest expense
2018 2017
Deposits from banks and other financial institutions (12) (9)Term finance (21) (40)
(33) (49)

Gulf Investment Corporation G.S.C. and SubsidiariesAnnual Report and Accounts 2018
97
Notes to the Consolidated Financial Statementsfor the year ended 31 December 2018
(All amounts in US$ millions)
17 Other operating income
Other operating income represents net income from subsidiaries engaged in manufacturing and service activities.
2018 2017
Sales 37 66Cost of sales (32) (51)Gross profit 5 15
Other loss - (2)Selling and distribution expenses (1) (6)Administrative expenses (4) (6)
- 1
18 Impairment losses
2018 2017
Financial assets available for sale Equity participations - (23) Equities and managed funds - (6)Private equity funds - (2)
- (31) Other assets (1) (29)Investment in associates (12) -Expected credit losses for guarantees (2) -Expected credit losses for other assets (note 7) (3) -
(18) (60)
19 Retirement and other terminal benefits
The Corporation has defined voluntary contribution and end of service indemnity plans which cover all its employees. Contribution to the voluntary plan is based on a percentage of pensionable salary and consists of contribution by employees and a matched contribution, up to a certain limit, by the Corporation. Contribution to the end of service indemnity plan is based on a percentage of pensionable salary and number of years of service by the employees. The amounts to be paid at the end of service benefits are determined by reference to the amounts of the contributions and investment earnings thereon.
The Corporation also pays contributions to government defined contribution pension plan for certain employees in accordance with the legal requirements in Kuwait as well as contribution in line with the labour law in the countries where its subsidiaries operate.
The total cost of retirement and other end of service benefits included in staff expenses for the year ended 31 December 2018 amounted to US$ 7 million (2017: US$ 7 million).
20 Risk management
This note represents information on the Group’s exposure to risks arising from the use of financial instruments. Risk is an inherent part of the Group’s business activities. It is managed through a process of ongoing identification, assessment, measurement and monitoring of the business activities, subject to risk limits and other controls. This process of risk management is critical to the Group’s continuing profitability and each individual within the Group is accountable for the risk exposures relating to his or her responsibilities.

98
Consolidated Financial Statements
Notes to the Consolidated Financial Statementsfor the year ended 31 December 2018
(All amounts in US$ millions)
20 Risk management (continued)
The Group is exposed to liquidity risk, market risk and credit risk. Market risk is subdivided into interest rate risk, foreign currency risk and equity price risk.
Risk management begins with the Risk Management Committee which is composed of members from the Corporation’s Board of Directors and senior management, which defines and recommends the Group’s risk appetite to the Board of Directors. The Board of Directors is ultimately responsible for the overall risk management approach and for approving the risk strategies and principles.
20.1 Liquidity risk
Liquidity risk is the risk that the Group will be unable to meet its liabilities when they fall due. To limit this risk, management has arranged diversified funding sources, manages assets with liquidity in mind, and monitors liquidity on a daily basis.
The liquidity profile of financial liabilities reflects the projected cash flows, based on contractual repayment obligations which include future interest payments over the life of these financial liabilities. The liquidity profile of undiscounted financial liabilities at 31 December was as follows:
31 December 2018Within 3 months
3 months to 1 year
1 to 5 years
Over 5 years Total
Deposits from banks and otherfinancial institutions 72 229 - - 301
Term finance 2 16 392 45 455
Gross settled derivativeinstruments:
- Contractual amount payable 645 - 284 49 978
- Contractual amount receivable (644) - (247) (37) (928)
Other liabilities 49 43 100 18 210
Total undiscounted financialliabilities 124 288 529 75 1,016
Commitments - 28 86 - 114
Contingent liabilities - 145 208 26 379
31 December 2017Within 3 months
3 months to 1 year
1 to 5 years
Over 5 years Total
Deposits from banks and otherfinancial institutions 131 445 - - 576
Term finance 404 15 313 147 879
Gross settled derivativeinstruments:
- Contractual amount payable 565 - 162 172 899
- Contractual amount receivable (564) - (153) (137) (854)
Other liabilities 62 41 73 38 214
Total undiscounted financialliabilities 598 501 395 220 1,714
Commitments - 33 99 - 132
Contingent liabilities 20 62 3 313 398
The asset and liability maturity profile shown in the table below is based on management’s assessment of the Group’s right and ability (and not necessarily the intent) to liquidate these instruments based on their underlying liquidity characteristics.

Gulf Investment Corporation G.S.C. and SubsidiariesAnnual Report and Accounts 2018
99
Notes to the Consolidated Financial Statementsfor the year ended 31 December 2018
(All amounts in US$ millions)
20 Risk management (continued)
20.1 Liquidity risk (continued)
Within 3 months
3 months to 1 year 1 to 5 years Over 5 years Total
At 31 December 2018
Assets
Cash and cash equivalents 40 - - - 40
Placements with banks 153 - - - 153
Financial assets at fair value through statement of income 946 14 282 169 1,411
Investment in associates - - - 1,624 1,624
Other assets 37 27 87 119 270
Total assets 1,176 41 369 1,912 3,498
Liabilities
Deposits from banks and other financial institutions 71 227 - - 298
Term finance 6 1 347 38 392
Other liabilities 49 42 102 17 210
Total liabilities 126 270 449 55 900
Net gap 1,050 (229) (80) 1,857
Within 3 months
3 months to 1 year 1 to 5 years Over 5 years Total
At 31 December 2017 AssetsCash and cash equivalents 41 - - - 41Placements with banks 232 - - - 232Financial assets at fair value through statement of income 57 332 - - 389Financial assets available for sale 1,467 19 13 203 1,702Investment in associates - - - 1,590 1,590Other assets 42 27 83 122 274Total assets 1,839 378 96 1,915 4,228
LiabilitiesDeposits from banks and other financial institutions 130 441 - - 571Term finance 399 - 260 137 796Other liabilities 62 41 73 38 214Total liabilities 591 482 333 175 1,581Net gap 1,248 (104) (237) 1,740

100
Consolidated Financial Statements
Notes to the Consolidated Financial Statementsfor the year ended 31 December 2018
(All amounts in US$ millions)
20 Risk management (continued)
20.2 Market risk
Market risk arises from fluctuations in interest rates, foreign exchange rates and equity prices. The nature of these risks is as follows:
Interest rate risk
Interest rate risk arises from the possibility that changes in interest rates will affect future profitability or the fair values of financial instruments. The Group is exposed to interest rate risk as a result of mismatches of interest rate repricing of assets and liabilities.
Foreign exchange risk
Foreign exchange risk is the risk that the value of a financial instrument will fluctuate due to changes in foreign exchange rates.
Equity price risk
Equity price risk arises from the change in fair values of equity investments.
Market risk pertaining to investments in Debt Capital Market, Equity and Alternative Investments and Treasury divisions are measured, monitored and managed both on a notional basis and using a Market Value at Risk (Market VaR) concept. The table below shows Total Value at Risk (Total VaR) by risk factor. These VaR measures are based on a 95% confidence level, 25 day holding period and use historical market data.
2018 Average Minimum Maximum 31 December 2018Interest rate 9 7 11 7Equity price 10 7 12 10Foreign exchange - - - -Total* 12 10 14 11
2017 Average Minimum Maximum 31 December 2017Interest rate 19 11 25 11Equity price 9 7 13 7Foreign exchange - - 1 -Total* 19 13 25 12
* Total VaR incorporates benefits of diversification.
The Principal Investment division monitors its quoted equity participation investments using a sensitivity analysis as indicated below. The effect on equity as a result of a change in the fair value of the quoted equity participation investments due to a reasonably possible change in equity indices, with all other variables held constant is as follows:
Market indices Change in equity price Effect on Income Effect on equity
2018 2017
Saudi Stock Exchange +/-10 16 20
Other GCC indices +/-10 - 1
The analysis is based on the assumption that the equity indexes if increased / decreased by 10% with other variables held constant and all the Principal Investment division’s quoted equity instruments moved according to the historical correlation with the index.
Please refer note 23 for distribution of assets and liabilities between the divisions.

Gulf Investment Corporation G.S.C. and SubsidiariesAnnual Report and Accounts 2018
101
Notes to the Consolidated Financial Statementsfor the year ended 31 December 2018
(All amounts in US$ millions)
20 Risk management (continued)
20.3 Credit risk
Credit risk is the risk that one party to a financial instrument will fail to discharge an obligation and cause the other party to incur a financial loss. The Corporation’s Board of Directors has set limits for individual borrower and groups of borrowers and for geographical and industry segments. The Group also monitors credit exposures, and continually assesses the creditworthiness of counterparties. In addition, the Group obtains security where appropriate, enters into master netting agreements and collateral arrangements with counterparties, and limits the duration of exposures.
As at 31 December 2018 and 2017 the Group has not obtained any collateral on any of the financial assets.
ECL on financial assets recognised in consolidated statement of income were as follows.
2018 2017
ECL on other assets 3 -ECL on guarantees 2 -
20.3.1 Maximum exposure to credit risk
The maximum credit exposure of the Group is as follows:
Maximum exposure2018 2017
Cash and cash equivalents 40 41Placements with banks 153 232Debt securities at fair value through statement of income 689 49Debt securities available for sale - 1,119Other assets 208 212Credit exposure on assets 1,090 1,653Credit commitments 379 398Total credit exposure 1,469 2,051
Credit risk in respect of derivative financial instruments is limited to those with positive fair values, which are included under other assets.
Concentrations arise when a number of counterparties are engaged in similar business activities, or activities in the same geographic region, or have similar economic features that would cause their ability to meet contractual obligations to be similarly affected by changes in economic, political or other conditions. Concentrations indicate the relative sensitivity of the Group’s performance to developments affecting a particular industry or geographic location. The maximum credit exposure to a single counterparty is US$ 126 million (2017: US$ 134 million).
The Group’s concentration of credit risk exposure by geographic region is as follows:
GCC Europe America Asia / Africa TotalAt 31 December 2018Cash and cash equivalents 11 28 1 - 40Placements with banks 153 - - - 153Debt securities at fair value through statement of income 498 19 143 29 689Other assets 155 5 - 48 208Credit exposure on assets 817 52 144 77 1,090Credit commitments 369 - - 10 379Total credit exposure 1,186 52 144 87 1,469
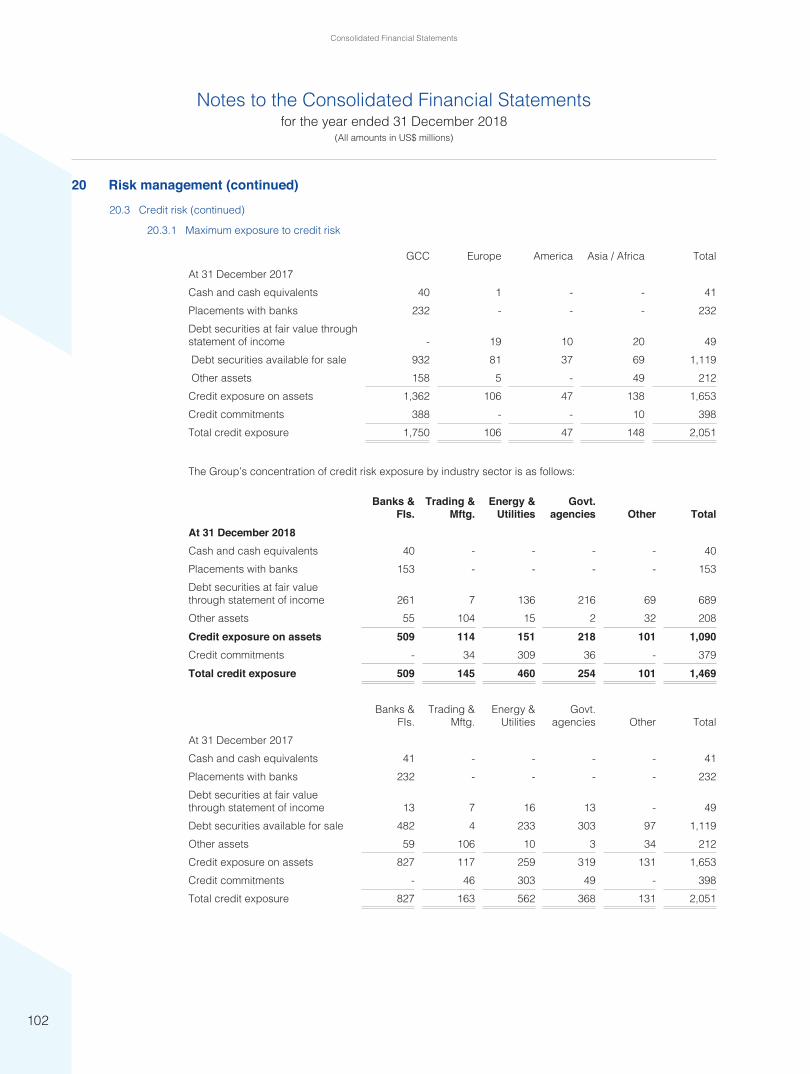
102
Consolidated Financial Statements
Notes to the Consolidated Financial Statementsfor the year ended 31 December 2018
(All amounts in US$ millions)
20 Risk management (continued)
20.3 Credit risk (continued)
20.3.1 Maximum exposure to credit risk
GCC Europe America Asia / Africa TotalAt 31 December 2017Cash and cash equivalents 40 1 - - 41Placements with banks 232 - - - 232Debt securities at fair value through statement of income - 19 10 20 49 Debt securities available for sale 932 81 37 69 1,119 Other assets 158 5 - 49 212Credit exposure on assets 1,362 106 47 138 1,653Credit commitments 388 - - 10 398Total credit exposure 1,750 106 47 148 2,051
The Group’s concentration of credit risk exposure by industry sector is as follows:
Banks & FIs.
Trading & Mftg.
Energy & Utilities
Govt. agencies Other Total
At 31 December 2018Cash and cash equivalents 40 - - - - 40Placements with banks 153 - - - - 153Debt securities at fair valuethrough statement of income 261 7 136 216 69 689Other assets 55 104 15 2 32 208Credit exposure on assets 509 114 151 218 101 1,090Credit commitments - 34 309 36 - 379Total credit exposure 509 145 460 254 101 1,469
Banks & FIs.
Trading & Mftg.
Energy & Utilities
Govt. agencies Other Total
At 31 December 2017 Cash and cash equivalents 41 - - - - 41Placements with banks 232 - - - - 232Debt securities at fair valuethrough statement of income 13 7 16 13 - 49Debt securities available for sale 482 4 233 303 97 1,119Other assets 59 106 10 3 34 212Credit exposure on assets 827 117 259 319 131 1,653Credit commitments - 46 303 49 - 398Total credit exposure 827 163 562 368 131 2,051

Gulf Investment Corporation G.S.C. and SubsidiariesAnnual Report and Accounts 2018
103
Notes to the Consolidated Financial Statementsfor the year ended 31 December 2018
(All amounts in US$ millions)
20 Risk management (continued)
20.3 Credit risk (continued)
20.3.2 Credit quality of financial assets
In managing its portfolio, the Group utilises external ratings and other measures and techniques which seek to take account of all aspects of perceived risk. Credit exposures classified as ‘Investment grade’ quality are those where the ultimate risk of financial loss from the obligor’s failure to discharge its obligation is assessed to be low. These include exposure to corporate entities with financial condition, risk indicators and capacity to repay which are considered to be good to excellent. All investment grade securities are rated by well-known rating agencies. Credit exposures classified as ‘Unrated’ quality comprise all other exposures whose payment performance is fully compliant with contractual conditions and which are not ‘impaired’, but are not assigned any published ratings.
The table below shows the credit quality by class of assets:
Neither past due nor impaired Total
At 31 December 2018 Investment grade Unrated
Cash and cash equivalents 40 - 40Placements with banks 153 - 153Debt securities at fair valuethrough statement of income 689 - 689Other assets 58 150 208Credit exposure on assets 940 150 1,090Credit commitments 379 - 379Total credit exposure 1,319 150 1,469
Neither past due nor impaired TotalAt 31 December 2017 Investment grade Unrated
Cash and cash equivalents 41 - 41Placements with banks 232 - 232Debt securities at fair value through income statement 49 - 49Debt securities available for sale 1,119 - 1,119Other assets 63 149 212Credit exposure on assets 1,504 149 1,653Credit commitments 398 - 398Total credit exposure 1,902 149 2,051
The table below shows the credit exposure of financial assets carried at amortised cost for the year ended 31 December 2018 based on year-end stage allocation. The amounts presented are gross of impairment allowances.
Stage 1 Stage 2 Stage 3 Total2018
Cash and cash equivalents 40 - - 40Placements with banks 153 - - 153Other assets 190 21 - 211Total 383 21 - 404

104
Consolidated Financial Statements
Notes to the Consolidated Financial Statementsfor the year ended 31 December 2018
(All amounts in US$ millions)
21 Commitments and contingent liabilities
In the usual course of meeting the requirements of the operations of Group companies, the Group has commitments to extend credit and provide financial guarantees and letters of credit to guarantee the performance of Group companies to third parties. The credit risk on these transactions is generally less than the contractual amount. The table below sets out the notional principal amounts of outstanding commitments.
Notional principal amount
2018 2017
Credit Risk AmountsTransaction-related contingent items:- Letter of guarantees 379 398
Certain letters of guarantees are issued by the Corporation on behalf of its related parties (note 25).
The above commitments and contingent liabilities have off balance-sheet credit risk because only origination fees and accruals for probable losses are recognised in the consolidated financial statements until the commitments are fulfilled or expired. Many of the contingent liabilities and commitments will expire without being advanced in whole or in part. Therefore, the amounts do not represent expected future cash flows.
The Group had the following non-credit commitments as at the reporting date:
2018 2017
Undrawn commitments for investments in private equity funds 62 64Undrawn commitments for investments in associates 47 63Other commitments 5 5
114 132
22 Derivatives
Derivatives instruments are utilised by the Group as part of its asset and liability management activity to hedge its own exposure to market, interest rate and currency risk.
In the case of derivative transactions, the notional principal typically does not change hands. It is simply a quantity, which is used to calculate payments. While notional principal is a volume measure used in the derivatives and foreign exchange markets, it is neither a measure of market nor credit risk. The Group’s measure of credit exposure is the cost of replacing contracts at current market rates should the counterparty default prior to the settlement date. Credit risk amounts represent the gross unrealised gains on transactions before taking account of any collateral held or any master netting agreements in place.
Interest rate swaps under which the Group pays a fixed rate and receives a floating rate are used in fair value hedges of fixed income financial assets at fair value through statement of income. As at the reporting date, the notional amount of interest rate swaps and interest rate futures used to hedge interest rate risk amounted to US$ 17 million (2017: US$ 22 million).
Cross currency swaps are used to hedge non US$ term finance issued in fixed rate coupon. As at the reporting date, the notional amount of cross currency swaps amounted to US$ 333 million (2017: US$ 333 million) and its net fair value was a swap loss of US$ 49 million (2017: US$ 43 million).

Gulf Investment Corporation G.S.C. and SubsidiariesAnnual Report and Accounts 2018
105
Notes to the Consolidated Financial Statementsfor the year ended 31 December 2018
(All amounts in US$ millions)
22 Derivatives (continued)
The table below summarises the aggregate notional amounts and net fair value of derivative financial instruments.
2018 2017
Positivefair value
Negative fair value
Notionalamount
Positivefair value
Negativefair value
Notionalamount
Derivatives held for hedging- Interest rate swaps - - 17 - (1) 22- Cross currency swaps 1 (50) 333 4 (47) 333- Forward foreign exchange contracts 1 (1) 978 - (2) 899
2 (51) 1,328 4 (50) 1,254
Maturity analysis
Within 1 year Year 1 to 5 Above 5 years TotalAt 31 December 2018Notional amountsInterest rate swaps 2 15 - 17Cross currency swaps - 284 49 333Forward foreign exchange contracts 645 284 49 978
647 583 98 1,328
Within 1 year Year 1 to 5 Above 5 years TotalAt 31 December 2017Notional amountsInterest rate swaps - 22 - 22Cross currency swaps - 161 172 333Forward foreign exchange contracts 565 162 172 899
565 345 344 1,254
23 Segmental information
The Group organises and manages its operations by business divisions, primarily divided into Principal Investments, Debt Capital Markets, Equity and Alternative Investments, Treasury, and Corporate and Other. Management treats the operations of these business divisions separately for the purposes of decision making, resource allocation and performance assessment. Business division performance is evaluated based on segmental return on investments.
The Principal Investment division is responsible for actively investing in projects and equity participations.
Debt Capital Market division provides a stable coupon/spread income and a reserve of additional liquidity. The investments consist of high quality marketable debt securities diversified across a wide range of geographic and industry sectors.
Equities and Alternative Investments division manages a diversified set of portfolios in an array of different asset classes and investment themes that comprise investments ranging from equities to structured finance, private equity, market neutral funds, hedge funds and other alternative assets.

106
Consolidated Financial Statements
Notes to the Consolidated Financial Statementsfor the year ended 31 December 2018
(All amounts in US$ millions)
23 Segmental information (continued)
The Treasury division manages the Group’s liquidity, short-term interest rate and foreign exchange activities using a variety of on and off-balance sheet treasury applications. The division trades in spot and forward foreign exchange and options, cash money markets, floating rate notes, interest rate swaps and other derivatives. Interest is charged / credited to business segments based on rates which approximate the marginal cost of funds on external borrowings while considering the equity as free capital.
The Corporate and Other division comprises items which are not directly attributable to specific business divisions. Other operations of the Group includes operations, risk management and finance
PrincipalInvestments
Debt Capital
Markets
Equity and Alternative
Investments TreasuryCorporate and Other Eliminations Total
31 December 2018Interest income 4 33 1 41 - (35) 44Interest expense (20) (9) (6) (33) - 35 (33)Share of results from associates 143 - - - - - 143Other operating income 24 (28) 24 - 3 - 23Net operating income 151 (4) 19 8 3 - 177
Other operating expenses (13) (2) (2) (3) (32) - (52)Impairment losses (16) - (2) - - - (18)Profit for the year 122 (6) 15 5 (29) - 107
Segment assets 2,051 696 515 3,202 8 (2,974) 3,498
Segment liabilities 2,029 685 489 686 (15) (2,974) 900Equity - - - - - - 2,598Total liabilities and equity 3,498Other informationInvestment in associates 1,624 - - - - - 1,624
PrincipalInvestments
Debt Capital
Markets
Equity and Alternative
Investments TreasuryCorporate
and Other Eliminations Total31 December 2017Interest income 2 53 1 48 - (48) 56Interest expense (28) (13) (8) (48) - 48 (49)Share of results from associates 131 - - - - - 131Other operating income 14 10 74 - - - 98Net operating income 119 50 67 - - - 236
Other operating expenses (13) (2) (3) (3) (34) - (55)Impairment losses (52) - (8) - - - (60)Profit for the year 54 48 56 (3) (34) - 121
Segment assets 2,058 1,179 672 3,866 10 (3,557) 4,228
Segment liabilities 1,949 1,056 679 1,375 79 (3,557) 1,581Equity - - - - - - 2,647Total liabilities and equity 4,228Other informationInvestment in associates 1,590 - - - - - 1,590

Gulf Investment Corporation G.S.C. and SubsidiariesAnnual Report and Accounts 2018
107
Notes to the Consolidated Financial Statementsfor the year ended 31 December 2018
(All amounts in US$ millions)
24 Fair value information
Fair value is defined as the price that would be received to sell an asset or paid to transfer a liability in orderly transactions between market participants at the measurement date. Fair values are determined from quoted prices in active markets for identical financial assets or financial liabilities where these are available. Where the market for a financial instrument is not active, fair value is established using a valuation technique. These valuation techniques involve a degree of estimation, the extent of which depends on the instrument’s complexity and the availability of market-based data. Investment securities classified as ‘Available for sale’ and ‘Fair value through statement of income’ are stated at fair value except for certain investments carried at cost. For other financial asset and liabilities carried at cost less impairment or amortized cost, the carrying value is not significantly different from their fair values as most of these assets and liabilities are of short term maturity or re-priced immediately based on market movement in interest rates.
Determination of fair value and fair value hierarchy:
The Group uses the following hierarchy for determining and disclosing the fair values of financial instruments:
Level 1: quoted prices in active market for the same instrument.
Level 2: quoted prices in active market for similar instruments or other valuation techniques for which all significant inputs are based on observable market data and
Level 3: valuation techniques for which any significant input is not based on observable market data including the NAV of private equity funds where the underlying investments are unquoted private companies / real estate assets.
The following table shows an analysis of financial instruments recorded at fair value by level of the fair value hierarchy:
Level 1 Level 2 Level 3 Total
2018
Assets measured at fair value
Financial assets at fair value through statement of income
Debt instruments 677 - 12 689
Hedge funds & other alternative funds - 257 - 257
Equities and managed funds 139 - - 139
Equity participations 130 - 108 238
Private equity funds - - 88 88
Other assets- derivative financial instruments
Cross currency swaps - - 1 1
Forward foreign exchange Contracts - - 1 1
946 257 210 1,413
Other liabilities - derivative financial instruments
Cross currency swaps - - 50 50
Forward foreign exchange Contracts - - 1 1
- - 51 51

108
Consolidated Financial Statements
Notes to the Consolidated Financial Statementsfor the year ended 31 December 2018
(All amounts in US$ millions)
24 Fair value information (continued)
Level 1 Level 2 Level 3 Total2017Assets measured at fair value
Financial assets at fair value through statement of income
Investment in quoted debt instruments 49 - - 49Hedge funds & other alternative funds - 340 - 340
Financial assets available for saleDebt instruments 1,101 - 18 1,119Equities and managed funds 196 - - 196Equity participations 170 - 113 283Private equity funds - - 104 104
Other assets - derivative financial instrumentsCross currency swaps - - 4 4
1,516 340 239 2,095
Other liabilities - derivative financial instrumentsInterest rate swaps - 1 - 1Cross currency swaps - - 47 47Forward foreign exchange Contracts - - 2 2
- 1 49 50
The following table shows a reconciliation of the beginning and closing balances of the financial instruments classified in Level 3 of the fair value hierarchy:
At 1 January 2018
Gain / (loss)recorded in the
consolidated statement of
incomeLoss recorded
in equity
Net purchases, sales, transfers and settlements
At 31 December
201831 December 2018Assets measured at fair valueFinancial assets at fair value through statement of incomeDebt instruments 18 - - (6) 12Equity participation 113 (3) - (2) 108Private equity funds 104 10 (5) (21) 88
Other assets - derivative financial instrumentsCross currency swaps 4 (3) - - 1Forward foreign exchange contracts - 1 - - 1
Other liabilities - derivative financial instrumentsCross currency swaps 47 3 - - 50Forward foreign exchange contracts 2 (1) - - 1

Gulf Investment Corporation G.S.C. and SubsidiariesAnnual Report and Accounts 2018
109
Notes to the Consolidated Financial Statementsfor the year ended 31 December 2018
(All amounts in US$ millions)
24 Fair value information (continued)
At 1 January 2017
Gain / (loss)recorded in the
consolidated statement of
income
Gain / (loss) recorded in
equity
Net purchases, sales, transfers and
settlements
At 31 December
201731 December 2017Assets measured at fair valueFinancial assets available for sale Debt instruments 28 - 2 (12) 18 Equity participation - - 12 101 113 Private equity funds 144 27 (21) (46) 104
Other assets - derivative financial instrumentsCross currency swaps - 4 - - 4
Other liabilities - derivative financial instrumentsCross currency swaps 72 (25) - - 47Forward foreign exchange contracts 1 1 - - 2
Measurement of Level 3 fair values
i. Debt instruments: The fair values are based on broker quotes, prices quoted on Bloomberg and Reuters and independent valuation.ii. Private equity funds: The fair values are based on fund statements sent by the fund managers. iii. Cross currency swaps and forward foreign exchange contracts: The fair values are calculated using foreign exchange rates
available in the market.iv. Equity participation: The fair values are calculated using various valuation techniques like discounted cash flows, price multiples etc.
25 Related party transactions
Related parties represent major shareholders, Directors and key management personnel of the Corporation, and entities controlled, jointly controlled or significantly influenced by such parties. Pricing policies and terms of these transactions are approved by the Corporation’s management.
Outstanding balances with associates during the year are as follows:
2018 2017
Guarantees 343 348Commitments 47 63Receivables from associates 19 13Payable to associates 6 -
Compensation of key management personnel
The remuneration of key management personnel during the year is as follows:2018 2017
Salaries and short-term employee benefits 11 9Post-employment and termination benefits 2 2
13 11

110
Consolidated Financial Statements
Notes to the Consolidated Financial Statementsfor the year ended 31 December 2018
(All amounts in US$ millions)
26 Capital management
The Corporation’s capital represents shareholders’ investment and is a key strategic resource which supports the Corporation’s risk taking business activities.
The objective of the Group is to deploy this resource in an efficient and profitable manner to earn competitive returns.
The Corporation manages its capital taking into account both regulatory and economic requirements. No changes were made in the objectives, policies or processes from the previous year. Consistent with others in the industry, the Group monitors capital on the basis of the gearing ratio. This ratio is calculated as net debt divided by total equity as follows:
2018 2017
Interest-bearing deposits, term finance and other borrowings 690 1,367Other liabilities 210 214Less: Cash and cash equivalents and placements with banks (193) (273)Net debt 707 1,308
Equity attributable to equity holders of the Corporation 2,598 2,647Gearing ratio (net debt / equity) 0.3 0.5
27 Principal subsidiaries and associates
The principal subsidiaries and associates of the Corporation are set out below:
Subsidiaries Country of incorporation
% of shareholding Financial statements reporting date
Principal business activity2018 2017
Bituminous Products Company Limited (Bitumat) Saudi Arabia 100 100 31 December 2018 Building material
manufacturing
GIC Technologies Company W.L.L Kuwait 80 80 31 December 2018 Technical advisory
Gulf Jyoti International L.L.C UAE 70 70 31 December 2018 Construction & Engineering
Associates Country of incorporation
% of shareholding Financial statements reporting date
Principal business activity2018 2017
Gulf Re Holdings Limited Channel Islands 50.0 50.0 31 December 2018 Re-insurance
Foulath Holding B.S.C (c) Bahrain 50.0 50.0 31 December 2018 Holding company
Al Ezzel Power Company B.S.C. (c) Bahrain 45.0 45.0 31 December 2018 Power & Water Utility
project
Sudair Pharmaceutical for Drugs Company Limited Saudi Arabia 35.0 35.0 31 December 2018 Pharmaceutical
Horizon Investment Ltd Cayman Islands 35.0 35.0 31 August 2018 Education

Gulf Investment Corporation G.S.C. and SubsidiariesAnnual Report and Accounts 2018
111
Notes to the Consolidated Financial Statementsfor the year ended 31 December 2018
(All amounts in US$ millions)
27 Principal subsidiaries and associates (continued)
Associates Country of incorporation
% of shareholding Financial statements reporting date
Principal business activity2018 2017
Shuqaiq International Power and Water Company Limited Saudi Arabia 33.3 33.3 31 December 2018 Power & Water Utility
project
SGA Marafiq Holdings W.L.L. Bahrain 33.3 33.3 31 December 2018 Power & Water Utility project
Technical Supplies & Services Co. Ltd. UAE 30.7 30.7 31 December 2018 Refrigeration & Cooling
Services
Osool Poultry Company S.A.O.C Oman 26.7 26.7 31 December 2018 Poultry & Dairy Products
Al Dur Holding Company Limited UAE 25.0 25.0 31 December 2018 Power & Water Utility
project
Jeddah Cable Company Ltd. Saudi Arabia 25.0 25.0 31 December 2018 Manufacturing Cables
Moon Iron and Steel Company SAOC Oman 25.0 25.0 31 December 2018 Iron and steel
Bahrain LNG W.L.L. Bahrain 24.0 24.0 31 December 2018 Oil and Gas
Interplast Company Limited (L.L.C.) UAE 23.5 23.5 31 December 2018 Plastic
Celtex Weaving Mills Co. Ltd. Bahrain 23.0 23.0 31 December 2018 Textiles
Rawabi Emirates (PJSC) UAE 22.5 22.5 31 December 2018 Dairy Products
Dubai Wellness Centre UAE 21.6 21.6 31 December 2018 Medical services
Wataniya Telecom Algerie S.P.A. Algeria 20.0 20.0 31 December 2018 Telecom service
provider
Gulf Stone Company SAOG Oman 20.0 20.0 31 December 2018 Building Materials
A’Saffa Foods SAOG Oman 20.0 20.0 31 December 2018 Poultry & Dairy Products
The National Titanium Dioxide Co., Ltd. (Cristal) Saudi Arabia 20.0 20.0 31 December 2018 Production of Titanium
Dioxide
Tristar Holdings Limited UAE 19.6 19.6 31 December 2018 Logistics
Aviation Leasing and Finance Company KSC. Kuwait 14.0 14.0 30 September 2018 Aviation Leasing
28 Prior period adjustment
Bituminous Products Company Limited (Bitumat), a fully owned subsidiary of the Corporation, has made an additional provision of US$ 7 million for zakat assessment received from General Authority of Zakat and Tax relating to previous years. The total outstanding zakat and tax contingent liability up to 31 December 2018 amounted to US$ 14 million, against which Bitumat has made provision of US$ 8 million.
29 Subsequent events
The Board of Directors meeting held on 7 March 2019, proposed cash dividend of US$ 50 per share amounting to US$ 105 million for the year ended 31 December 2018. The Board of Directors further recommended not to transfer the 10% of the profit for the year ended 31 December 2018 to the voluntary reserve.

112
Gulf Investment Corporation G.S.C.Stand-alone Statement of Financial Position
as at 31 December 2018(All amounts in US$ millions)
The following appendix represents the statement of financial position of Gulf Investment Corporation excluding the assets and liabilities of its subsidiaries do not form part of the consolidated financial statements of the Corporation
2018 2017
Assets
Cash and cash equivalents 31 28
Placements with banks 145 229
Financial assets at fair value through statement of income
1,411 389
Financial assets available for sale - 1,702
Investments in associates 1,618 1,584
Investment in subsidiaries 45 55
Other assets 116 119
Total assets 3,366 4,106
Liabilities and equity
Liabilities
Deposits from banks and other financial institutions 298 571
Term finance 384 790
Other liabilities 86 98
Total liabilities 768 1,459
Equity
Share capital 2,100 2,100
Reserves 392 504
Retained earnings 106 43
Total equity 2,598 2,647
Total liabilities and equity 3,366 4,106

113
Principal InvestingMajor Projects and Equity Participations
As of 31 December 2018
Name of the Project Location GIC Effective holding % GIC holding type
Subsidiaries and Associates of GIC
1 Bituminous Products Company Limited (Bitumat) Saudi Arabia 100.00% Direct
2 Foulath Holding B.S.C (c) Bahrain 50.00% Direct
3 Al Ezzel Power Company B.S.C. ( c ) Bahrain 45.00% Direct
4 Sudair Pharmaceutical Co. Saudi Arabia 35.00% Direct
5 Horizon (ED) Investment Ltd. Cayman Islands 35.00% Direct
6 Technical Supplies & Services Co. Ltd. UAE 30.67% Direct
7 Osool Poultry SAOC Oman 26.68% Direct
8 Jeddah Cable Company Ltd & Energya Group Saudi Arabia 25.00% Direct
9 Al Dur Power & Water Co. B.S.C. ( c ) Bahrain 25.00% Indirect
10 Moon Iron and Steel Company S.A.O.C Oman 25.00% Direct
11 Bahrain LNG (W.L.L.) Bahrain 24.00% Direct
12 Interplast Company Limited - (L.L.C.) UAE 23.50% Direct
13 Rawabi Emirates (PJSC) UAE 22.54% Direct
14 The Dubai Wellness Center Limited (L.L.C) UAE 21.63% Direct
15 A’Saffa Foods Co. SAOG Oman 20.01% Direct
16 The National Titanium Dioxide Co., Ltd. (CRISTAL) Saudi Arabia 20.00% Direct
17 Gulf Stone Company SAOG * Oman 20.00% Indirect
18 Wataniya Telecom Algerie S.P.A. Algeria 20.00% Indirect
19 Jubail Water & Power Co. Saudi Arabia 20.00% Indirect
20 Shuqaiq Water & Electricity Co. Saudi Arabia 20.00% Indirect
21 Tristar Holdings Limited UAE 19.61% Direct
22 Aviation Lease & Finance Co. K.S.CP. (ALAFCO) Kuwait 14.00% Direct
* The shares in this associate are owned by GIC›s subsidiary Bitumat

114
Principal InvestingMajor Projects and Equity Participations
As of 31 December 2018
Name of the Project Location GIC Effective holding % GIC holding type
Equity Participations
1 Moobility Telecom International Holding Ltd. British Virgin Islands 17.03% Direct
2 TMK Gulf International Pipe Industry L.L.C Oman 14.20% Direct
3 Ras Laffan Power Company Limited (Q.S.C.) Qatar 10.00% Direct
4 KGL Logistics Company K.S.C. (Closed) Kuwait 1.81% Direct
5 Securities and Investment Company B.S.C. Bahrain 8.60% Direct
6 National Industrialization Co. (TASNEE) Saudi Arabia 4.76% Direct
7 Perella Weinberg Partners USA 1.66% Indirect

115
Corporate Directory 2018
Senior Management Team
Mr. Ibrahim Ali AlQadhiChief Executive Officer Mr. Shafic AliGroup Head of Principal Investment Mr. Talal Al-Tawari Group Head of Global Markets Mr. Hani Al-ShakhsGroup Head of Support Global Markets Group
Mr. Talal Al-TawariActing Head of GCC Equities Div. Mr. Osama Al-Musallam Head of Treasury Div. Mr. Fahad Al-BaderHead of Managed Funds Div. Mr. Raffaele BertoniHead of Debt Capital Markets Div. Principal Investment Group
Mr. Fadi TwainyHead of Light Industry Projects Div. Mr. Meshary M. Al-JudaimiHead of Financial Services & Utilities Div. Mr. Faisal Al-RoomiHead of Manufacturing Projects Div. Mr. Mohammad Al-FaresHead of Diversified Projects Div. Mr. Meshari Al-BaderHead of Principal Investment Analytics Div.
Support Group
Mr. Hani Al-ShakhsActing Head of Operations Div. Mr. Mohammed Al-JallalHead of Human Resources Div. Mr. Amer Al-DakhailHead of Information Technology Div. Mr. Qais Al-ShattiHead of Public Relations Dept.
Corporate Office
Mr. Fahad Al-AbdulkaderHead of BOD Secretariat Div. Mr. Malek Al-AjeelAdvisor to CEO Mr. Pervaz AktharHead of Risk Management Div. Mr. Hazem El-RafieHead of Finance Div. Dr. Khaled BukhamseenHead of Internal Audit Div. Dr. Mohamed ElliwaHead of Legal & Compliance Div. Dr. Mohammad Al-OmarHead of Research Div.

116
Mailing Address
P.O. Box 3402, Safat 13035, Kuwait
Courier Address
Sharq, Jaber Al-Mubarak Street, Kuwait
Websitewww.gic.com.kw
S.W.I.F.T.
GCOR KWKW
Telephone
(+965) 2222 5000
Fascimile
(+965) 2222 5010
Contact Details