2019 affirmative action plan
TRANSCRIPT

North Carolina Department of Transportation
Affirmative Action Plan
2015-2019

Table of Contents SECTION I ................................................................................................................................. 1
INTRODUCTION ............................................................................................................ 2
PURPOSE OF EEO/AA PLAN ........................................................................................... 5
SECTION I, EXHIBIT 1: NCDOT EEO Policy Statement ..................................................... 6
NCDOT EEO POLICY STATEMENT ................................................................................... 7
Internal Dissemination ..................................................................................... 7
External Dissemination ..................................................................................... 7
DEFINITION OF TERMS .................................................................................................. 8
ACRONYMS ................................................................................................................ 10
SECTION I, EXHIBIT 2: EEO/ADA Organizational Chart ................................................. 11
SECTION I, EXHIBIT 3: OCR Organizational Chart .......................................................... 11
SECTION I, EXHIBIT 4: Map of NCDOT Highway Divisions ............................................. 13
SECTION II .............................................................................................................................. 14
RESPONSIBILITIES FOR AFFIRMATIVE ACTION ............................................................. 15
Secretary ....................................................................................................... 15
Affirmative Action Officer ............................................................................... 15
Director of Human Resources ........................................................................ 16
Managers and Supervisors .............................................................................. 16
FEDERAL & STATE LAWS, REGULATIONS & DIRECTIVES ................................................ 17
State .............................................................................................................. 17
Federal .......................................................................................................... 17
SECTION III ............................................................................................................................. 19
NORTH CAROLINA AT A GLANCE ................................................................................. 20
EEO-4 FEDERAL JOB CATEGORIES ................................................................................ 21

NCDOT JOB GROUP ANALYSIS ..................................................................................... 22
NCDOT’s WORKFORCE AGENCY-WIDE ANALYSIS ......................................................... 25
NCDOT PERSONNEL ACTIVITIES ................................................................................... 29
New Hires ...................................................................................................... 29
Promotions .................................................................................................... 31
Terminations .................................................................................................. 33
Demotions ..................................................................................................... 35
Disciplinary Actions ........................................................................................ 36
NCDOT NET CHANGES IN EMPLOYMENT ..................................................................... 38
SECTION III, EXHIBIT 1: NCDOT Job Titles by EEO Category ........................................... 40
SECTION III, EXHIBIT 2: Workforce Analyses of 14 Highway Divisions ........................... 47
SECTION IV ............................................................................................................................. 62
APPLICANT FLOW ....................................................................................................... 63
ADVERSE IMPACT ANALYSES ...................................................................................... 66
SECTION V .............................................................................................................................. 70
REPRESENTATION ANALYSIS, GOALS and TIMETABLES ................................................ 71
Methodology for Establishing Goals and Timetables ........................................ 72
Representation Analyses and Job Placement Goals ......................................... 73
SECTION V, EXHIBIT 1: Job Placement Goals –Full Calculations ................................... 114
SECTION VI ........................................................................................................................... 147
MONITORING PROCEDURES ..................................................................................... 148
Internal Monitoring ...................................................................................... 148
External Monitoring ..................................................................................... 150
GOOD FAITH EFFORTS .............................................................................................. 151
Affirmative Action Program Accomplishments .............................................. 151
Accountability .............................................................................................. 151
Recruitment, Selection and Hiring ................................................................. 151
Promotions .................................................................................................. 155

Training ....................................................................................................... 155
Upward Mobility Programs ........................................................................... 156
COMPLAINTS OF DISCRIMINATION ........................................................................... 159
Policy and Procedures .................................................................................. 159
Discrimination Complaint Tracking ............................................................... 160
Discrimination Complaints Analysis FFY 2013 ................................................ 160
PROGRAM ACTIVITIES TO ADDRESS CONCERNS ......................................................... 162
Recruitment, Hiring and Selection ................................................................. 162
Job Restructuring ......................................................................................... 162
Employee Training ........................................................................................ 163
Promotion Procedures .................................................................................. 163
Monitoring of Disciplinary Actions ................................................................ 163
EEO Committees .......................................................................................... 164

1

1
SECTION I
Introduction
Purpose of EEO/AA Plan NCDOT EEO Policy Statement
Definition of Terms Acronyms
Exhibit 1: NCDOT EEO Policy Statement Exhibit 2: EEO/ADA Organizational Chart
Exhibit 3: OCR Organizational Chart Exhibit 4: Map of NCDOT Highway Divisions

2
INTRODUCTION
The North Carolina Department of Transportation (NCDOT) is committed to equal employment opportunities in the workplace and supports the affirmative action program. This Affirmative Action Plan provides guidance and outlines the responsibilities of management regarding the implementation of this plan. The primary objective of the Affirmative Action Plan is to take results-oriented steps to assure equal employment opportunity. Affirmative Action guidelines apply to employment decisions, including but not limited to hiring, promotion, demotion, and retention.1 Pursuant to N.C.G.S. §136-44.1, “The Department of Transportation shall develop and maintain a statewide system of roads, highways, and other transportation systems commensurate with the needs of the State as a whole and it shall not sacrifice the general statewide interest to the purely local desires of any particular area. The Board of Transportation shall formulate general policies and plans for a statewide transportation system. The Board shall formulate policies governing the construction, improvement and maintenance of roads, highways, and other transportation systems of the State with due regard to farm-to-market roads and school bus routes.” In addition, pursuant to N.C.G.S. §136-5.1, “Transportation system is defined as all modes of transportation infrastructure owned and maintained by the North Carolina Department of Transportation, including roads, highways, rail, ferry, aviation, public transportation, and bicycle and pedestrian facilities.” NCDOT receives federal funds from the Federal Highway Administration (FHWA). All state departments of transportation that receive Federal financial assistance in connection with the Federal-Aid Highway Program are required to have an affirmative action plan and are to assure compliance with the equal employment opportunity requirements for Federally-assisted highway construction contracts.2 Prior to the U.S. Secretary of Transportation’s approving Federal aid for highway projects, a state department of transportation must assure the highway projects will be conducted in a nondiscriminatory manner. Any state department of transportation seeking Federal aid for highway projects will not have projects approved by FHWA until the state DOT executes assurances that employment in connection with all projects will be provided without regard to race, color, national origin, or gender.3 With an annual budget of nearly $4 billion, the North Carolina Department of Transportation is responsible for building and maintaining North Carolina’s transportation system. North Carolina has the second largest highway system in the United States with nearly 80,000 miles of roadway and a bridge inventory of 13,638. The Ferry System runs 22 vessels on seven regular routes across five bodies of water. These ferries transport about 850,000 vehicles and two million passengers a year, making it the second largest state-run ferry system in the United States. The Aviation Division is responsible for all aviation functions regarding state system planning, airport and aviation system development, and provides funding to communities for constructing and improving airports throughout the state. North
1 Uniform Guidelines on Employee Selection Procedures, 29 CFR paragraph 1607.2(B) and 1607.17 (1978)
2 23 CFR §230.303
3 Federal-Aid Highway Act of 1968, 23 U.S.C 140

3
Carolina has 72 publicly-owned airports and nearly 300 privately-owned airports. North Carolina's 99 public transportation systems serve more than 77 million passengers each year in urban and rural areas of the state. The Bike and Pedestrian Division is the oldest comprehensive state program of its kind in the United States. The Rail Division is a leader in reviving passenger train service, enhancing safety on the tracks and creating urban transportation centers. The Department’s operations are led by the Secretary of Transportation, a member of the Governor’s cabinet. A 19-member Board of Transportation is the Department’s governing body and is responsible for assisting in the transportation decision-making process and approving fund allocation. Board members are appointed by the Governor. NCDOT has established the following five (5) core values that represent the manner in which it conducts business:
Safety: We strive for safety throughout our transportation networks as well as in our work and daily lives.
Customer Service: We respond to our customers, both internal and external, in an open, professional and timely manner.
Integrity: We earn and maintain trust by responsibly managing the State’s assets, acting ethically, and holding ourselves accountable for our actions.
Diversity: We draw strength from our differences and work together in a spirit of teamwork and mutual respect.
Quality: We pursue excellence in delivering our projects, programs, services and initiatives. The Division of Highways is spread across 14 NCDOT divisions with approximately 7,000 employees. (See Exhibit 4 for a map of the Highway Divisions.) The demographics of the far eastern (coastal) and far western (mountains) parts of the State vary widely. The urban areas also differ widely in demographics from the more rural areas. To support the Department in fulfilling its responsibilities, this Affirmative Action Plan reinforces equal employment opportunity principles by ensuring all segments of the public have an equal opportunity to enter public service and work in an environment free of unlawful barriers to employment based on race, color, national origin, sex, religion, disability and age, except as provided by law. In accordance with 23 CFR Part 230, Subpart C, Appendix A, the head of each state agency is responsible for the overall administration of the Internal EEO Program, including the total integration of equal opportunity into all facets of personnel management. (See Exhibit 1 - NCDOT’s EEO Policy Statement.) The Affirmative Action Plan is a rolling 5 year plan detailing the positive steps the agency will take to ensure equal employment opportunity. The Affirmative Action Plan sets annual representation goals by job group for underrepresented minorities and females who comprise 2% of the available civilian workforce and/or 2% of NCDOT’s workforce. The employment data that were used to establish the representation goals for the 2015-2019 Affirmative Action Plan were based on the State Fiscal Year 2013 (7/1/2012 through 6/30/2013). Although the representation goals are set for 5 years, an update to the plan will be provided to FHWA annually using the most current data; therefore, the plan is subject to change annually with changes in minority and female representation, NCDOT’s workforce, and state

4
demographics. The update will include the Department’s accomplishments, deficiencies, workforce representation, and adverse impact analyses and any changes in the 5 year job placement goals. The Affirmative Action Plan uses the EEO Tabulation American Community Survey (ACS) 2006 through 2010 census data available through American Fact Finder to analyze representation in NCDOT’s workforce. The Census Bureau provides this tabulation for four Federal agencies - the Department of Justice, EEOC, the Department of Labor, and Office of Federal Contract Compliance Programs. The EEO Tabulation serves as the primary external benchmark for comparing the race, ethnicity, and gender composition of an organization’s internal workforce and the analogous external labor market within a specified geography and job category. The Affirmative Action Plan uses the “four-fifths rule” to determine whether adverse impact exists in employment decisions. The four-fifths rule states, “A selection rate of any race, sex, or ethnic group which is less than four-fifths (4/5 or 80%) of the rate for the group with the highest rate will generally be regarded by the Federal enforcement agencies as evidence of adverse impact, while a greater than four-fifths rate will generally not be regarded by Federal enforcement agencies as evidence of adverse impact.”4
4 Uniform Guidelines on Employee Selection Procedures, 29 CFR paragraph 1607.4(D)(1978)

5
PURPOSE OF EEO/AA PLAN
Achieving the Department's affirmative action goals requires the commitment and leadership of every manager and supervisor within the Department. To assist in the achievement of these
affirmative action goals, this Affirmative Action Plan establishes guidelines to follow in making
employment decisions within the Department.
The Department adheres to the State-mandated Merit Based Hiring policy to maintain a
selection system that will give equal employment opportunity to all applicants without regard
to race, religion, color, national origin, sex, age, disability, or political affiliation and will be
based solely on job-related criteria. (A copy of the Merit Based Hiring Policy is available from OSHR’s website under the “Policies” tab at: http://oshr.nc.gov/.) The recruitment and selection process
complies with all Federal and State laws, regulations, and policies.
Achieving parity goals is a critical aspect of the Department's EEO/AA program. All managers and
supervisors will take those actions necessary to ensure that the Department is an equal
opportunity employer with respect to recruitment, merit, retention, promotion, training, and all other terms and conditions of employment. All employment decisions will be made without
consideration of race, color, national origin, sex, religion, disability, age or marital status, except as provided by law. To monitor and report compliance with equal employment opportunity policies,
the Internal Equal Employment Opportunity Office will conduct monitoring efforts, including the
on-site evaluation process which includes the review o f organizational unit employment
statistics and practices and ongoing quarterly follow-up with those unit heads regarding
underrepresentation and disproportionate disciplinary actions.
When attempting to fill vacancies in categories with underrepresented women and minorities,
effective recruitment strategies are essential in locating qualified female and/or minority
applicants. Although NEOGOV is the primary source of recruitment of applicants, the appointing
authority in coordination with the Department's Human Resources Office should continue to
advertise vacancies in publications that would be logically read by potential female and/or
minority applicants. Recruitment activities and vacancy announcements posted at universities
and vocational schools are additional effective recruitment strategies hiring authorities should
consider to recruit female and minority applicants in categories where underrepresentation
exists.
The Department supports upward mobility and encourages managers to promote qualified
employees, when possible, into EEO job categories where there is underrepresentation of
minorities and/or females. Employment strategies, such as the cooperative education and
summer student/internship programs, as well as the Transportation Engineering Associates (TEA)
and Historically Black Colleges and Universities (HBCU) programs, are excellent ways to identify and
recruit employees to meet parity goals. In addition, hiring managers can provide career
development counseling to employees with outcomes documented in the training plan during the
completion of the Valuing Individual Performance (VIP) performance management process. The
expected result is a diverse pool of career applicants that can be considered for promotion.

6
SECTION I, EXHIBIT 1: NCDOT EEO Policy Statement

7
NCDOT EEO POLICY STATEMENT
Please see an electronic version of the signed EEO Policy Statement at: http://www.ncdot.gov/programs/eeo/.
Internal Dissemination The Department is committed to ensuring that each employee is aware of his/her rights concerning affirmative action and discrimination policies. Supervisors and managers at all levels are responsible for familiarizing themselves with these policies and communicating them to their subordinates. Listed below is the manner in which the Affirmative Action Plan and related policies will be disseminated within the Department.
The Department’s Affirmative Action Plan, EEO policy statement, and Grievance procedure will be posted in all Department facilities and on the Department’s intranet accessible to all employees.
The Department’s Affirmative Action Plan will be updated and re-distributed department-wide annually.
The Employee Handbook includes an equal employment opportunity statement, which is distributed to and signed by all new employees.
AAP training will be conducted with all DOT employees. External Dissemination
The state employment application form and recruitment documents will contain an equal employment opportunity statement.
The Department's Affirmative Action Plan and related policies will be made available to interested parties on the NCDOT website at www.ncdot.gov and on the employee web portal at https://inside.ncdot.gov.

8
DEFINITION OF TERMS
Affirmative Action- Specific actions in employment designed and taken to:
Ensure equal opportunity.
Eliminate barriers that prevent full participation in the workforce by members of racial/ethnic groups, women, and individuals with disabilities.
Eliminate disparity in the workforce of members of racial/ethnic groups or women in all job families.
Eliminate present effects of past discrimination. Equal Employment Opportunity/Affirmative Action Plan- Is a comprehensive guide developed to reflect the Department’s good faith efforts in ensuring equal opportunity for all. It also identifies areas of minority, women, and disabled persons underrepresentation, as well as evaluates and analyzes personnel actions such as new hires, promotions, training, and disciplinary actions in an effort to attain goals. Availability- Availability involves the percentage and number of racial/ethnic group members, women, and individuals with a disability who are available to work and have the requisite job skills in the statewide labor market. BEACON- BEACON is an acronym for Building Enterprise Access for North Carolina’s Core Operational Needs. It is the state-wide business infrastructure system that standardized key business processes, including human resources, payroll, data storage, and accounting. Career Status- Career status means a State employee or local government employee who is in a permanent position appointment and has been continuously employed by the State of North Carolina or local government in a position subject to the State Personnel Act for the immediate 12 preceding months. Disability- A person who has a physical or mental impairment that substantially limits one or more major life activities; or has a record of such impairment; and/or is regarded as having such impairment. Discrimination- Discrimination is the illegal or unequal treatment of a class of persons or of an individual based on his or her race, national origin, color, sex, religion, age or disability. Discrimination may involve a single act or it may involve a continuing policy or practice. Discrimination may be intentional or unintentional. Disparate Impact- Disparate impact is the result of an employment policy, practice, or procedure that, in practical application, has less favorable consequences for a protected class than for the dominant group. Disparate Treatment- Disparate treatment is employment practices, such as the use of tests or educational requirements, fair and neutral on their face, which are applied or administered in an unfair manner. Diversity- Diversity is a broad concept that values all people equally, regardless of their differences.

9
Equal Employment Opportunity- Equal employment opportunity involves access to all available employment opportunities, under equal terms and conditions, with equal benefits and services without actions, policies, or practices that differentiate among applicants or employees on the basis of race, color, national origin, sex, age, religion, or disabling physical or mental condition. Essential Functions- Essential functions involve fundamental job duties, tasks, or responsibilities which, if eliminated, would substantially alter the nature of the job. Ethnic/Racial Minorities- The term minority includes people of the following racial/ethnic groups:
Black (not of Hispanic origin): All persons having origins in any of the Black racial groups of Africa.
Asian or Pacific Islander: All persons having origins in any of the original peoples of the Far East, Southeast Asia, the Indian Subcontinent, or the Pacific Islands. This area includes, for example, China, India, Japan, Korea, the Philippine Islands, and Samoa.
Hispanic: All persons of Mexican, Puerto Rican, Cuban, Central or South American, or other Spanish culture or origin.
Native American: All persons having origins in any of the original peoples of North America and who maintain cultural identification through tribal affiliation or community recognition.
Goals- Goals are quantitative employment objectives with target dates employers voluntarily set to reduce or eliminate underrepresentation of protected classes in the workforce. Good Faith Efforts- Good faith efforts are additional results-oriented efforts, such as, active and aggressive recruiting efforts designed to achieve diversity in the workplace. NEOGOV- NEOGOV provides human capital management software-as-a-service applications for the public sector and higher education. It is the State’s applicant tracking system. Promotional Priority Consideration- Promotional priority consideration occurs when a current State employee who has achieved career status and an outside applicant have substantially equal qualifications. Substantial equal qualifications occurs when the employer cannot make a reasonable determination that the job-related qualifications held by one applicant are significantly better suited for the position than the job-related qualifications held by another applicant. Retaliation- Retaliation is an employer or employee act in response to an employee’s opposition to discrimination or participation in an investigation or proceeding involving charges of discrimination. Underrepresentation- Underrepresentation occurs when there are fewer females, minorities, and persons with a disability in a particular job group than would be expected by their availability in the relevant labor force.
Valuing Individual Performance (VIP) – VIP is the State’s standardized performance management process.

10
ACRONYMS
AA: Affirmative Action AAP: Affirmative Action Plan ADA: Americans with Disabilities Act ADAAA: Americans with Disabilities Act Amendments Act of 2008 AIAN: American Indian/Alaska Native ALJ: Administrative Law Judge AS/PI: Asian American/Pacific Islander BEACON: Building Enterprise Access for NC's Core Operation Needs BOWD: Business Opportunity and Workforce Development CFR: Code of Federal Regulations CSC: Customer Service Center DBE: Disadvantaged Business Enterprise EEO: Equal Employment Opportunity EEOC: Equal Employment Opportunity Commission EIT: Engineer-in-Training EPA: Exempt from the State Personnel Act FHWA: Federal Highway Administration FFY: Federal Fiscal Year FY: Fiscal Year GTP: Global TransPark HBCU: Historically Black Colleges and Universities HR: Human Resources MB/WB: Minority Business/Women Business NCDOT: North Carolina Department of Transportation NCGS: North Carolina General Statutes NCSPA: North Carolina State Ports Authority OCR: Office of Civil Rights OJT: On the Job Training OSHR: Office of State Human Resources PDA: Performance Dashboard Appraisal SAP: Systems Applications and Products (data processing) SFY: State Fiscal Year SPA: State Personnel Act TEA: Transportation Engineering Associate USC: United States Code VIP: Valuing Individual Performance

11
SECTION I, EXHIBIT 2: EEO/ADA Organizational Chart
Secretary of Transporta on ames H. Trogdon, III
Chief Deputy Secretary David Howard
O ce of Civil Rights Ac ng Director Benny Sloan
EEO
Vacant, AAP Specialist, 1 -5 -1
Wendy apish, AAP Specialist, 1 -5 -1
Ima Ma air, Employment Specialist, 1 -5 -1 2
Shirley Wing-Mikkelsen, EEO Inves gator, 1 -5 -1 1
Ti any E rd, EEO Inves gator , 1 -5 -1 2
N C D T s O C R s
EEO ADA
EEO/ADA Manager ohn Eley
1 -5 -1
ADA
Mark Whisenant, ADA Coordinator, 1 -5 -1 22
Gina Dean, ADA Specialist, 1 -5 -1 55
Veronica Wright, EEO/ADA Program Assistant 1 -5 -1

12
SECTION I, EXHIBIT 3: OCR Organizational Chart
Execu ve Assistant
Chief Deputy Secretary
Director of O ce of Civil Rights
BOWD
EEO/ADA
Contract Monitoring
N C D T s
O C R s
Contractor Cer ca on and liza on
External Civil Rights
Services
Secretary of Transporta on
On-the- ob Training
Educa on Ini a ves/
HBC Outreach

13
SECTION I, EXHIBIT 4: Map of NCDOT Highway Divisions
Please view an interactive map of the 14 Highway Divisions at: http://www.ncdot.gov/doh/

14
SECTION II
Responsibilities for the EEO/AA Program Federal & State Laws, Regulations & Directives

15
RESPONSIBILITIES FOR AFFIRMATIVE ACTION
Secretary
The Secretary of the North Carolina Department of Transportation has the overall responsibility for implementation of the North Carolina Department of Transportation’s EEO/ AAP. The Secretary is responsible for ensuring management supports and promotes EEO/AAP. The Secretary appoints a responsible management-level individual who will be identified by name and job title in the Department’s EEO/AAP as the Affirmative Action Officer. The Affirmative Action Officer shall have direct access to the Secretary. The Secretary’s responsibilities include, but are not limited to:
Designating an official to assume responsibility for the operation and implementation of the Department’s EEO/AAP.
Ensuring equal opportunity is available to all employees and applicants regarding all terms, conditions, and privileges of employment.
Ensuring the work environment supports and is consistent with the spirit and intent of the Department’s EEO/AAP.
Communicating the Department’s EEO/AAP to all employees, applicants, and the general public.
Providing the necessary resources to ensure the successful implementation and administration of the Department’s EEO/AAP.
Ensuring the development and implementation of policies, procedures, and programs necessary to achieve a workforce that reflects the State of North Carolina’s labor force availability.
Affirmative Action Officer
The EEO Manager is the designated Affirmative Action Officer for the Department. The Affirmative Action Officer reports directly to the Director of the Office of Civil Rights (OCR) who reports to the Chief Deputy Secretary and has access to the Secretary of Transportation regarding matters relating to EEO/AAP. The Affirmative Action Officer’s responsibilities include but are not limited to:
Applying Federal laws, state statues, policy regulations, and guidelines related to discrimination/retaliation in employment, affirmative action, and equal employment opportunity.
Ensuring development of a written EEO/AAP and annual update reports.
Reporting at least quarterly to the Secretary of NCDOT on the progress and deficiencies of each unit in relation to agency goals.
Preparing an annual report for the Secretary of NCDOT on the progress and deficiencies of each unit.
Ensuring dissemination of EEO/AAP internally and externally.
Coordinating assistance to managers and supervisors in collecting and analyzing employment data, identifying problem areas, setting goals and timetables, and developing programs to achieve goals. Programs should include specific remedies to eliminate any discriminatory practices discovered in the employment system.

16
Coordinating the processing of discrimination/retaliation complaints.
Ensuring the design, implementation, and monitoring of internal audit and reporting systems to measure program effectiveness and to determine where progress and deficiencies of each division are in relation to Department goals.
Director of Human Resources
The Director of Human Resources oversees:
The hiring processes to ensure compliance with Departmental policies and procedures in support of EEO/AA goals.
The orientation of new employees where they are provided and given the opportunity to read the EEO/AA policy during New Employee Orientation.
Managers and Supervisors
Managers’ and supervisors’ responsibilities include, but are not limited to:
Reviewing training, hiring, promotion, disciplinary action, and termination patterns to monitor achievement of goals and objectives and to identify problem areas.
Ensuring fair and unbiased interviewing and selection techniques.
Conducting outreach recruitment efforts for protected class candidates.
Ensuring protected group members are provided with equal opportunity for hiring, training, promotion, transfer, career counseling, and reasonable accommodation.
Preventing any harassment of employees who are placed through affirmative action rights.
Implementing the EEO/AAP.
Holding subordinate managers and supervisors responsible and accountable for implementing the AAP.
Developing timelines to implement affirmative action policies, programs and goals.

17
FEDERAL & STATE LAWS, REGULATIONS & DIRECTIVES
NCDOT is an equal employment opportunity employer and therefore is compliant with the following State and Federal laws and executive orders: State N.C.G.S. §126-16, State Personnel Act, requires state departments, agencies, universities, and local political subdivisions to give equal employment opportunity for employment and compensation without regard to race, sex, age 40+, color, national origin, religion, or disability, except where specific age, sex, or physical requirements constitute bona fide occupational qualifications. N.C.G.S. §126-17 covers state and local government employees subject to the State Personnel Act. State departments, agencies, universities, political subdivisions, or their employees may not retaliate against employees protecting alleged violations of N.C.G.S. §126-16. N.C.G.S. §143-422.2, Equal Employment Practice Act (Legislative Declaration), requires employers who regularly employ 15 or more employees to give all persons the right and opportunity to seek, obtain, and hold employment without discrimination or abridgement on account of race, religion, color, national origin, age, sex, or persons with disabilities. Executive Order 55, June 30, 2015 places responsibility on each Agency Head, Department Head, and University Chancellor for successfully implementing EEO policies and programs adopted by the State Human Resources Commission and approved by the Governor; and for ensuring that as a part of the performance plan of each supervisory and management employee, he or she has the responsibility to comply with EEO laws and policies and to assist in achieving EEO goals.
Federal Title VII of the Civil Rights Act of 1964, as amended, covers employers with 15 or more employees in Federal, State and local government and private employment. Neither the employer nor its representatives shall discriminate in selection, promotion, compensation, fringe benefits, training, or other conditions of employment based on race, sex, color, religion, and national origin. Employers or their representatives may not intimidate, discipline, discharge, or otherwise harass a person because he/she has filed a complaint, instituted proceedings, assisted in an investigation, or formally objected to discriminatory practices, regardless whether the charges or objections are valid or invalid. Executive Order 11246 covers employers holding Federal contracts or sub-contracts of $10,000 or more. Neither the employer nor its representatives may discriminate in selection, promotion, compensation, fringe benefits, training, or other conditions of employment because of race, color, sex, religion, or national origin. A written affirmative action plan for minorities and women is required of employers with Federal contracts of $50,000 or more. Age Discrimination in Employment Act of 1967 covers any employer with 20 or more employees who work 2 or more calendar weeks in a calendar year. Neither employer nor employer’s representatives

18
may fail, refuse to hire, or to discharge any individual or otherwise discriminate with respect to his compensation, terms, conditions, or privileges of employment because of such individual’s age. Equal Pay Act of 1963 prohibits discrimination on the basis of sex in the provision of salary or fringe benefits where work is equal or in work that requires equal skill, effort, and responsibility and is performed under the same working conditions. Genetic Information Act of 2008 prohibits discrimination on the basis of genetic information and bars employers from using individuals' genetic information when making hiring, firing, job placement, or promotion decisions. Americans with Disabilities Act Amendments Act of 2008 covers public and private employers with 15 or more employees. Equal employment opportunity must be provided to qualified individuals with disabilities in all employment-related activities. Employers are required to provide reasonable accommodations for a disability when needed in order for a qualified employee to perform the essential functions of the job. Employers must also provide a reasonable accommodation for an applicant when the accommodation is needed in order for the applicant to have equal opportunity in the application process.

19
SECTION III
North Carolina at a Glance EEO-4 Federal Job Categories
NCDOT Job Group Analysis NCDOT’s Workforce Agency-Wide Analysis
NCDOT Personnel Activities NCDOT Net Changes in Employment Agency-Wide Analysis
Exhibit 1: NCDOT Job Titles by EEO Category
Exhibit 2: Workforce Analyses of 14 Highway Divisions

20
NORTH CAROLINA AT A GLANCE
The US Census Bureau reports that as of 2010, North Carolina is estimated to have 9,848,060 residents. Of that total, 4,640,230 are estimated to be in the civilian workforce. Table 3.1 is a summary of North Carolina’s 2 1 Census of population and employment by ethnic group and gender.
Table 3.1: 2010 Census of Population and Employment by Ethnic Group and Gender
State of North CarolinaTotal
NumberPercent Male
Percent
Total
Population
Female
Percent
Total
Population
Total Population 4,640,230 100.00 2,409,220 51.92 2,231,010 48.08
White 3,165,610 68.22 1,664,645 35.87 1,500,965 32.35
Black 938,545 20.23 424,600 9.15 513,945 11.08
Hispanic 340,630 7.34 219,985 4.74 120,645 2.60
American Indian 42,115 0.91 20,820 0.45 21,295 0.46
Asian/Pacific Islander 97,590 2.10 52,235 1.13 45,355 0.98
Some other race 55,740 1.20 26,935 0.58 28,805 0.62

21
EEO-4 FEDERAL JOB CATEGORIES The EEOC established job categories for the purpose of analyzing an employer’s workforce. All NCDOT job titles fall within one of the eight Federal EEO-4 job group categories as defined below. (Definitions are from the U.S. EEOC website at: http://www.eeoc.gov/employers/eeo4survey/e4instruct.cfm.) Section 3, Exhibit I identifies each NCDOT job title by its EEO category.
1. Officials and Administrators: Occupations in which employees set broad policies, exercise overall responsibility for execution of these policies, or direct individual departments or special phases of the agency's operations, or provide specialized consultation on a regional, district or area basis.
2. Professionals: Occupations which require specialized and theoretical knowledge which is usually acquired through college training or through work experience and other training which provides comparable knowledge.
3. Technicians: Occupations which require a combination of basic scientific or technical knowledge and manual skill which can be obtained through specialized post-secondary school education or through equivalent on-the-job training.
4. Protective Service Workers: Occupations in which workers are entrusted with public safety, security and protection from destructive forces.
5. Paraprofessionals: Occupations in which workers perform some of the duties of a professional or technician in a supportive role, which usually require less formal training and/or experience normally required for professional or technical status. Such positions may fall within an identified pattern of staff development and promotion under a "New Careers" concept.
6. Administrative Support (Including Clerical and Sales): Occupations in which workers are responsible for internal and external communication, recording and retrieval of data and/or information and other paperwork required in an office.
7. Skilled Craft Workers: Occupations in which workers perform jobs which require special manual skill and a thorough and comprehensive knowledge of the process involved in the work which is acquired through on-the-job training and experience or through apprenticeship or other formal training programs.
8. Service-Maintenance: Occupations in which workers perform duties which result in or contribute to the comfort, convenience, hygiene or safety of the general public or which contribute to the upkeep and care of buildings, facilities or grounds of public property. Workers in this group may operate machinery. Includes: chauffeurs, laundry and dry cleaning operatives, truck drivers, bus drivers, garage laborers, custodial employees, gardeners and ground keepers, refuse collectors, construction laborers, park rangers (maintenance), farm workers (except managers), craft apprentices/trainees/helpers, and kindred workers.
22
NCDOT JOB GROUP ANALYSIS
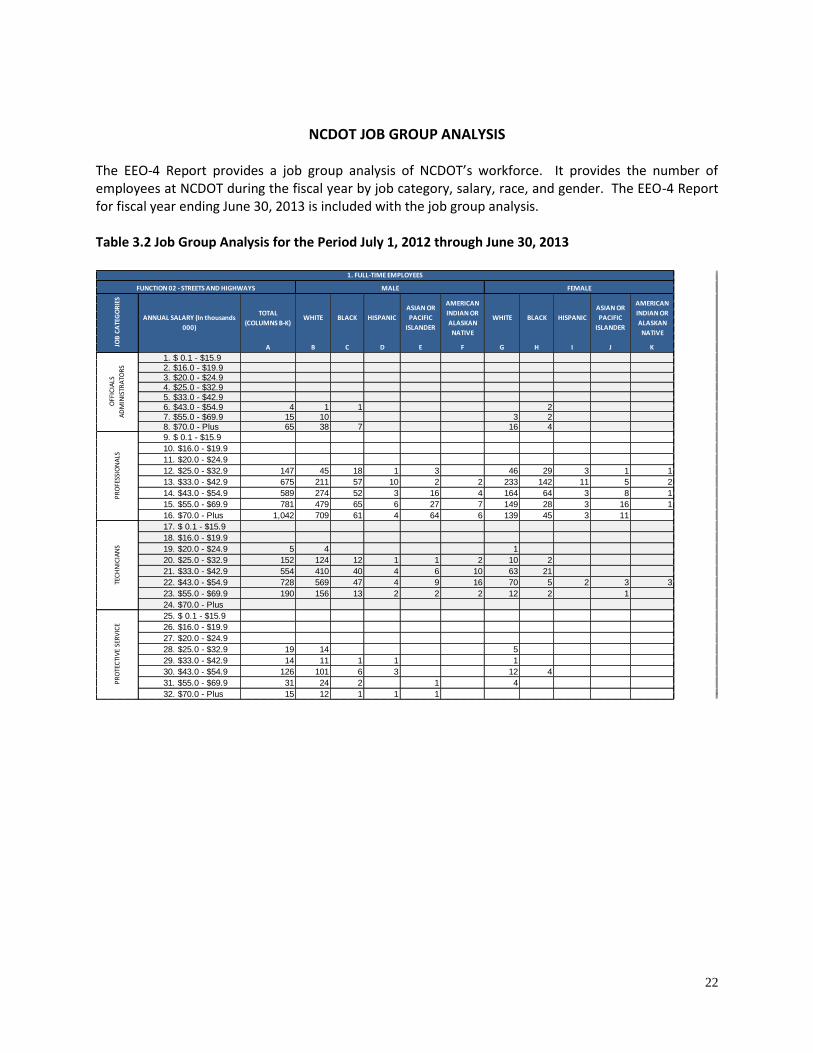
The EEO- Report provides a job group analysis of NCDOT’s workforce. It provides the number of employees at NCDOT during the fiscal year by job category, salary, race, and gender. The EEO-4 Report for fiscal year ending June 30, 2013 is included with the job group analysis. Table 3.2 Job Group Analysis for the Period July 1, 2012 through June 30, 2013
TOTAL
(COLUMNS B-K)WHITE BLACK HISPANIC
ASIAN OR
PACIFIC
ISLANDER
AMERICAN
INDIAN OR
ALASKAN
NATIVE
WHITE BLACK HISPANIC
ASIAN OR
PACIFIC
ISLANDER
AMERICAN
INDIAN OR
ALASKAN
NATIVE
A B C D E F G H I J K
1. $ 0.1 - $15.92. $16.0 - $19.93. $20.0 - $24.94. $25.0 - $32.95. $33.0 - $42.96. $43.0 - $54.9 4 1 1 27. $55.0 - $69.9 15 10 3 28. $70.0 - Plus 65 38 7 16 4
9. $ 0.1 - $15.9
10. $16.0 - $19.9
11. $20.0 - $24.9
12. $25.0 - $32.9 147 45 18 1 3 46 29 3 1 1
13. $33.0 - $42.9 675 211 57 10 2 2 233 142 11 5 2
14. $43.0 - $54.9 589 274 52 3 16 4 164 64 3 8 1
15. $55.0 - $69.9 781 479 65 6 27 7 149 28 3 16 1
16. $70.0 - Plus 1,042 709 61 4 64 6 139 45 3 11
17. $ 0.1 - $15.9
18. $16.0 - $19.9
19. $20.0 - $24.9 5 4 1
20. $25.0 - $32.9 152 124 12 1 1 2 10 2
21. $33.0 - $42.9 554 410 40 4 6 10 63 21
22. $43.0 - $54.9 728 569 47 4 9 16 70 5 2 3 3
23. $55.0 - $69.9 190 156 13 2 2 2 12 2 1
24. $70.0 - Plus
25. $ 0.1 - $15.9
26. $16.0 - $19.9
27. $20.0 - $24.9
28. $25.0 - $32.9 19 14 5
29. $33.0 - $42.9 14 11 1 1 1
30. $43.0 - $54.9 126 101 6 3 12 4
31. $55.0 - $69.9 31 24 2 1 4
32. $70.0 - Plus 15 12 1 1 1
1. FULL-TIME EMPLOYEES
FUNCTION 02 - STREETS AND HIGHWAYS MALE FEMALE
JOB
CA
TEG
OR
IES
ANNUAL SALARY (In thousands
000)
OFF
ICIA
LS
AD
MIN
ISTR
ATO
RS
PR
OFE
SSIO
NA
LSTE
CH
NIC
IAN
SP
RO
TEC
TIV
E SE
RV
ICE

23
TOTAL
(COLUMNS B-K)WHITE BLACK HISPANIC
ASIAN OR
PACIFIC
ISLANDER
AMERICAN
INDIAN OR
ALASKAN
NATIVE
WHITE BLACK HISPANIC
ASIAN OR
PACIFIC
ISLANDER
AMERICAN
INDIAN OR
ALASKAN
NATIVE
A B C D E F G H I J K
33. $ 0.1 - $15.9
34. $16.0 - $19.9
35. $20.0 - $24.9
36. $25.0 - $32.9
37. $33.0 - $42.9 1 1
38. $43.0 - $54.9
39. $55.0 - $69.9
40. $70.0 - Plus
41. $ 0.1 - $15.9
42. $16.0 - $19.9
43. $20.0 - $24.9 16 4 2 7 2 1
44. $25.0 - $32.9 689 72 39 2 1 3 407 143 7 5 10
45. $33.0 - $42.9 448 51 10 1 287 91 3 1 4
46. $43.0 - $54.9 16 2 11 3
47. $55.0 - $69.9
48. $70.0 - Plus
49. $ 0.1 - $15.9
50. $16.0 - $19.9
51. $20.0 - $24.9 126 86 28 2 8 2
52. $25.0 - $32.9 2,320 1,684 481 30 1 50 56 12 3 3
53. $33.0 - $42.9 2,114 1,656 320 15 3 79 31 7 3
54. $43.0 - $54.9 705 608 68 4 2 16 6 1
55. $55.0 - $69.9 175 145 17 2 1 10
56. $70.0 - Plus
57. $ 0.1 - $15.9
58. $16.0 - $19.9
59. $20.0 - $24.9 4 2 1 1
60. $25.0 - $32.9 25 11 7 1 6
61. $33.0 - $42.9 6 4 1 1
62. $43.0 - $54.9 1 1
63. $55.0 - $69.9
64. $70.0 - Plus
11,798 7,519 1,357 95 140 208 1,744 616 39 51 29
SER
VIC
E M
AIN
TEN
AN
CE
1. FULL-TIME EMPLOYEES
FUNCTION 02 - STREETS AND HIGHWAYS MALE FEMALE
JOB
CA
TEG
OR
IES
ANNUAL SALARY (In thousands
000)
PA
RA
-PR
OFE
SSIO
NA
LSA
DM
INIS
TRA
TIV
E SU
PP
OR
TSK
ILLE
D C
RA
FT
65. TOTAL FULL TIME (LINES 1 - 64)

24
Source: BEACON data from several data sources per EEOC specifications. Filters used by the Office of State Controller to prepare the EEO-4 Report result in differences between the EEO-4 Report and other BEACON Reports, such as B0031.
TOTAL
(COLUMNS B-K)WHITE BLACK HISPANIC
ASIAN OR
PACIFIC
ISLANDER
AMERICAN
INDIAN OR
ALASKAN
NATIVE
WHITE BLACK HISPANIC
ASIAN OR
PACIFIC
ISLANDER
AMERICAN
INDIAN OR
ALASKAN
NATIVE
A B C D E F G H I J K
66. Officials/Admin
67. Professionals 35 20 1 1 11 1 1
68. Technicians 95 78 7 2 7 1
69. Protective Service 19 17 1 1
70. Para-professional
71. Admin. Support 52 9 1 34 7 1
72. Skilled Craft 455 351 80 4 9 10 1
73. Service/Maintenance 76 57 11 1 6 174. Total Other
Than Full Time
(Lines 66 - 73)
732 532 99 9 10 69 11 2
75. Officials/Admin 2 1 1
76. Professionals 252 130 33 5 9 1 47 20 4 3
77. Technicians 89 69 6 2 1 11
78. Protective Service 39 30 2 1 5 1
79. Para-professional
80. Admin. Support 103 19 7 1 58 16 1 1
81. Skilled Craft 692 542 106 8 12 18 6
82. Service/Maintenance 72 53 10 1 883. Total New Hires
(Lines 75 - 82)1,249 844 163 19 10 14 147 43 5 4
2. OTHER THAN FULL-TIME EMPLOYEES (Including temporary employees)
FUNCTION 02 - STREETS AND HIGHWAYS MALE FEMALE
JOB
CA
TEG
OR
IES
ANNUAL SALARY (In thousands
000)
3. NEW HIRES DURING FISCAL YEAR - Permanent full time only JULY 1 - JUNE 30

25
NCDOT’s WORKFORCE AGENCY-WIDE ANALYSIS
Table . (NCDOT’s Agency-Wide Workforce) is a brief overview of NCDOT’s workforce for the State FY ending June 30, 2013. The database of employees and resultant employee count used in this plan were obtained from the BEACON reporting system that included permanent, exempt, probationary, and time-limited employees at the time. For the State’s fiscal year beginning July 1, 2012 and ending June 30, 2013, NCDOT had 11,763 full-time employees in its workforce. Males totaled 9,155 (77.83%), females totaled 2,429 (20.65%), and minorities totaled 2,494 (21.20%). Table . reflects the composition of NCDOT’s employees in each of the EEO job categories by race, sex, and workforce percentage. Section 3, Exhibits 3.1 through 3.14, provide a Workforce Analysis of NCDOT’s 1 Highway Divisions. T b 3.3: NCDOT’s A y-Wide Workforce as of June 2013
Source: BEACON Report B0178-F (Note: Total Male column and Overall Results category were manually entered as the report does not automatically generate this data.)
Officials & Administrators Males have the highest total of employees in the Officials & Administrators job group, totaling 58 employees (65.9%). There are 26 female (29.5%) and 20 minority (22.7%) employees in this job group.
Professionals Males have the highest total of employees in the Professionals job group, totaling 2,097 employees (64.8%). There are 1,095 female (33.8%) and 783 minority (24.3%) employees in this job group. Technicians Males have the highest total of employees in the Technicians job group, totaling 1,434 employees (87.4%). There are 194 female (11.8%) and 210 minority (12.8%) employees.
White
Male
White
Female
Black
Male
Black
Fem
Hisp
Male
Hisp
Fem
Asian
Male
Asian
Female
AIAN
Male
AIAN
Fem
Ethn
Unk
Total
Mnrt
Total
Male
Total
FemTotal
Number and % 47 17 8 9 2 1 4 20 58 26 88
Employed at DOT 53.4 19.3 9.1 10.2 2.3 1.1 4.5 22.7 65.9 29.5 100.0
Number and % 1,690 719 252 307 24 23 112 41 19 5 46 783 2097 1,095 3,238
Employed at DOT 52.2 22.2 7.8 9.5 0.7 0.7 3.5 1.3 0.6 0.2 1.4 24.3 64.8 33.8 100.0
Number and % 1,263 155 112 30 11 2 18 4 30 3 12 210 1434 194 1,640
Employed at DOT 77.0 9.5 6.8 1.8 0.7 0.1 1.1 0.2 1.8 0.2 0.7 12.8 87.4 11.8 100.0
Number and % 145 21 9 4 5 2 10 20 161 25 196
Employed at DOT 74.0 10.7 4.6 2.0 2.6 1.0 5.1 10.2 82.1 12.8 100.0
Number and % 1 1 1
Employed at DOT 100.0 100.0 100.0
Number and % 125 688 50 236 1 11 1 6 4 14 49 323 181 955 1,185
Employed at DOT 10.5 58.1 4.2 19.9 0.1 0.9 0.1 0.5 0.3 1.2 4.1 27.3 15.3 80.6 100.0
Number and % 4,100 98 884 19 51 3 6 155 7 54 1125 5196 127 5,377
Employed at DOT 76.3 1.8 16.4 0.4 0.9 0.1 0.1 2.9 0.1 1.0 20.9 96.6 2.4 100.0
Number and % 18 3 9 4 4 13 27 7 38
Employed at DOT 47.4 7.9 23.7 10.5 10.5 34.2 71.1 18.4 100.0
Number and % 7389 1701 1324 609 94 39 140 51 208 29 179 2494 9155 2429 11763
Employed at DOT 62.8 14.5 11.3 5.2 0.8 0.3 1.2 0.4 1.8 0.2 1.5 21.2 77.8 20.6 100.0
Skilled Craft
Service and Maintenance
Overall Results
Officials and Administrators
Professional
Technician
Protective Services
Paraprofessional
Administrative Support

26
Protective Services Males have the highest total of employees in the Protective Services job group, totaling 161 employees (82.1%). There are 25 female (12.8%) and 20 minority (10.2%) employees. Para-Professionals One white male is employed in this job group. Administrative Support Females have the highest total of employees in the Administrative Support job group, totaling 955 employees (80.6%). There are 181 males (15.3%) in this category and 323 minorities (27.3%). Skilled Craft Males have the highest total of employees in the Skilled Craft job group, totaling 5,196 employees (96.6%). There are 127 female (2.4%) and 1,125 minority (20.9%) employees. Service and Maintenance The Service and Maintenance job group has 27 male (71.1%), 7 female (18.4%), and 13 minority (34.2%) employees. A comparative employment analysis between the civilian labor force data provided by the US Census Bureau for 2010 and NCDOT’s workforce for the fiscal year ending une 2 1 indicates that minorities are underrepresented in NCDOT’s workforce in the Technician, Protective Services, Administrative Support (slightly), Skilled Craft, and Service and Maintenance categories. Females are underrepresented in all categories except Administrative Support. (See Table 3.4 below) The 2010 US Census civilian labor force data provides a benchmark of the civilians that are considered to be employable by the US Census Bureau by position. This data is then compared to NCDOT’s employment percentages to determine if minorities and females are underrepresented in NCDOT’s workforce by EEO-4 job categories.

27
Table 3.4 Comparative Analysis of NCDOT and NC State-Wide Expected Labor Force as of June 2013
Source: BEACON Report B0178-F (Note: Total Male column was manually entered as the report does not automatically generate this data.)
White
Male
White
Female
Black
Male
Black
Fem
Hisp
Male
Hisp
Fem
Asian
Male
Asian
Female
AIAN
Male
AIAN
Fem
Ethn
Unk
Total
Mnrt
Total
Male
Total
FemTotal
Number and % 47 17 8 9 2 1 4 20 58 26 88
Employed at DOT 53.4 19.3 9.1 10.2 2.3 1.1 4.5 22.7 65.9 29.5 100.0
Number and % Expected 46 26 5 6 2 1 1 1 0 0 15 54 34
Based on NC Labor Force 52.50 30.00 5.40 6.30 2.00 1.10 1.30 0.80 0.40 0.30 17.6 61.36 38.5
Over/Under Occ Rep 1 -9 3 3 0 -1 0 -1 0 0 5 4 -8
Number and % 1,690 719 252 307 24 23 112 41 19 5 46 786 2097 1,095 3,238
Employed at DOT 52.2 22.2 7.8 9.5 0.7 0.7 3.5 1.3 0.6 0.2 1.4 24.3 64.8 33.8 100.0
Number and % Expected 1,117 1,376 165 359 42 62 52 42 6 16 745 1382 1,855
Based on NC Labor Force 34.50 42.50 5.10 11.10 1.30 1.90 1.60 1.30 0.20 0.50 23.0 42.68 57.3
Over/Under Occ Rep 573 -657 87 -52 -18 -39 60 -1 13 -11 41 715 -760
Number and % 1,263 155 112 30 11 2 18 4 30 3 12 210 1434 194 1,640
Employed at DOT 77.0 9.5 6.8 1.8 0.7 0.1 1.1 0.2 1.8 0.2 0.7 12.8 87.4 11.8 100.0
Number and % Expected 423 776 95 251 11 28 16 20 3 13 438 548 1,087
Based on NC Labor Force 25.80 47.30 5.80 15.30 0.70 1.70 1.00 1.20 0.20 0.80 26.7 33.41 66.3
Over/Under Occ Rep 840 -621 17 -221 0 -26 2 -16 27 -10 -228 886 -893
Number and % 145 21 9 4 5 2 10 20 161 25 196
Employed at DOT 74.0 10.7 4.6 2.0 2.6 1.0 5.1 10.2 82.1 12.8 100.0
Number and % Expected 112 25 32 19 4 2 1 0 1 0 59 150 46
Based on NC Labor Force 57.20 12.70 16.20 9.80 2.00 0.80 0.40 0.10 0.60 0.20 30.1 76.53 23.6
Over/Under Occ Rep 33 -4 -23 -15 1 -2 1 0 -1 0 -39 11 -21
Number and % 1 1 1
Employed at DOT 100.0 100.0 100.0
Number and % Expected 0 0 0 0 0 0 0 0 0 0 0 0 0
Based on NC Labor Force 39.70 36.10 7.70 11.40 3.60 1.10 0.20 0.20 0.00 0.00 24.2 0.00 48.8
Over/Under Occ Rep 1 0 0 0 0 0 0 0 0 0 0 1 0
Number and % 125 688 50 236 1 11 1 6 4 14 49 323 181 955 1,185
Employed at DOT 10.5 58.1 4.2 19.9 0.1 0.9 0.1 0.5 0.3 1.2 4.1 27.3 15.3 80.6 100.0
Number and % Expected 200 643 81 191 14 31 6 12 2 6 342 303 883
Based on NC Labor Force 16.90 54.30 6.80 16.10 1.20 2.60 0.50 1.00 0.20 0.50 28.9 25.57 74.5
Over/Under Occ Rep -75 45 -31 45 -13 -20 -5 -6 2 8 -19 -122 72
Number and % 4,100 98 884 19 51 3 6 155 7 54 1,126 5196 127 5,377
Employed at DOT 76.3 1.8 16.4 0.4 0.9 0.1 0.1 2.9 0.1 1.0 20.9 96.6 2.4 100.0
Number and % Expected 2,834 446 855 263 699 140 48 27 59 11 2,102 4495 887
Based on NC Labor Force 52.70 8.30 15.90 4.90 13.00 2.60 0.90 0.50 1.10 0.20 39.1 83.60 16.5
Over/Under Occ Rep 1,266 -348 29 -244 -648 -137 -42 -27 96 -4 -976 701 -760
Number and % 18 3 9 4 4 13 27 7 38
Employed at DOT 47.4 7.9 23.7 10.5 10.5 34.2 71.1 18.4 100.0
Number and % Expected 8 13 4 7 2 2 0 0 0 0 17 14 24
Based on NC Labor Force 20.50 35.40 10.70 19.10 5.40 5.30 1.00 1.30 0.30 0.90 44.0 36.84 62.0
Over/Under Occ Rep 10 -10 5 -3 -2 -2 0 0 0 0 -4 13 -17
Skilled Craft
Service and Maintenance
Officials and Administrators
Professional
Technician
Protective Services
Paraprofessional
Administrative Support

28
Table 3.4a represents North Carolina’s state-wide expected labor force availability based on 2010 census data. Table 3.4a NC State-Wide Expected Labor Force Availability Based on 2010 Census Data
Source: BEACON Report B0184-F
T b 3.4b NCDOT’s T A y -Wide Workforce Representation as of June 2013
Source: BEACON Report B0178-F
A closer look at the classes representing 2% or more of North Carolina’s civilian workforce indicates that: White males represent 36.3% of North Carolina’s civilian labor force and 62.8% of NCDOT’s workforce. They are overrepresented in all the categories except Administrative Support where they are underrepresented. Black males represent 9.3% of North Carolina’s civilian labor force and 11.3% of NCDOT’s workforce. They are overrepresented in the Officials and Administrators, Professional, Technician, Skilled Craft, and Service and Maintenance categories and underrepresented in the Protective Services and Administrative Support categories. Hispanic males represent 4.8% of North Carolina’s civilian labor force and . % of NCDOT’s workforce. They are overrepresented in the Officials and Administrators and Protective Services categories (slightly) and underrepresented in the Professional, Administrative Support, Skilled Craft and Service and Maintenance categories. White females represent 32.7% of North Carolina’s civilian labor force and 14.5% of NCDOT’s workforce. They are overrepresented in the Administrative Support category and underrepresented in all other categories. Black females represent 11.2% of North Carolina’s civilian labor force and 5.2% of NCDOT’s workforce. They are overrepresented in the Officials and Administrators and Administrative Support categories and underrepresented in all other categories. Hispanic females represent 2.6% of North Carolina’s civilian labor force and . % of NCDOT’s workforce. They are underrepresented in all categories.
White
Male
White
Female
Black
Male
Black
Female
Hisp
Male
Hisp
Female
Asian
Male
Asian
Female
AIAN
Male
AIAN
Female
Ethn
Unk
TOT
MNRT
TOT
FEM
36.3 32.7 9.3 11.2 4.8 2.6 1.1 1.0 0.5 0.5 31.0 48.0
White
Male
White
Female
Black
Male
Black
Female
Hisp
Male
Hisp
Female
Asian
Male
Asian
Female
AIAN
Male
AIAN
Female
Ethn
Unk
Total
Mnrt
Total
Fem
62.8 14.5 11.3 5.2 0.8 0.3 1.2 0.4 1.8 0.2 1.5 21.2 20.6

29
NCDOT PERSONNEL ACTIVITIES New Hires NCDOT had a total of 380 new hires during the State FY ending June 30, 2013. Of that total, 65 were minorities, representing 17.1%. Minorities make up 21.2% of NDCOT’s workforce and 31.0% of North Carolina’s civilian labor force, so they are underrepresented as compared to their new hire percentage of 17.1%. There were 69 female new hires, representing 1 .2%. Females make up 2 . % of NCDOT’s workforce and 48.0% of North Carolina’s civilian labor force, so they too are underrepresented as compared to their new hire percentage of 18.2%. A closer look at the classes representing 2% or more of North Carolina’s civilian workforce indicates that: White males represent 36.3% of North Carolina’s civilian labor force and 62.8% of NCDOT’s workforce. They represented 167 (43.9%) of all the new hires, so they were overrepresented as compared to their North Carolina civilian labor force percentage and underrepresented compared to their NCDOT workforce percentage. Black males represent 9.3% of North Carolina’s civilian labor force and 11.3% of NCDOT’s workforce. They represented 27 (7.1%) of all the new hires, so they were underrepresented as compared to both their North Carolina civilian labor force percentage and to their NCDOT workforce percentage. Hispanic males represent 4.8% of North Carolina’s civilian labor force and . % of NCDOT’s workforce. They represented 3 (0.8%) of all the new hires, so they were underrepresented as compared to their North Carolina civilian labor force percentage and equally represented compared to their NCDOT workforce percentage. White females represent 32.7% of North Carolina’s civilian labor force and 14.5% of NCDOT’s workforce. They represented 43 (11.3%) of all the new hires, so they were underrepresented as compared to both their North Carolina civilian labor force percentage and to their NCDOT workforce percentage. Black females represent 11.2% of North Carolina’s civilian labor force and 5.2% of NCDOT’s workforce. They represented 20 (5.3%) of all the new hires, so they were underrepresented as compared to their North Carolina civilian labor force percentage and slightly overrepresented compared to their NCDOT workforce percentage. Hispanic females represent 2.6% of North Carolina’s civilian labor force and . % of NCDOT’s workforce. They represented 2 (0.5%) of all new hires, so they were underrepresented as compared to their North Carolina civilian labor force percentage and slightly overrepresented compared to their NCDOT workforce percentage.

30
Table 3.5: New Hires Agency-Wide Analysis for Period July 2012 through June 2013
Source: BEACON Report B0031
White
Male
White
Female
Black
Male
Black
Female
Hisp
Male
Hisp
Female
Asian
Male
Asian
Female
AIAN
Male
AIAN
Female
Ethn
UnkTOT
TOT
MNRT
TOT
MALE
TOT
FEM
Employees 47 17 8 9 2 1 4 88 20 58 26
% Represented 53.41 19.32 9.09 10.23 2.27 1.14 4.55 100.00 22.73 65.91 29.55
New Hires 1 1 3 5 1 1 1
% Represented 20.00 20.00 60.00 100.00 20.00 20.00 20.00
Employees 1,690 719 252 307 24 23 112 41 19 5 46 3,238 783 2,097 1,095
% Represented 52.19 22.21 7.78 9.48 0.74 0.71 3.46 1.27 0.59 0.15 1.42 100.00 24.18 64.76 33.82
New Hires 29 14 8 8 2 5 3 35 104 26 42 27
% Represented 27.88 13.46 7.69 7.69 1.92 4.81 2.88 33.65 100.00 25.00 40.38 25.96
Employees 1,263 155 112 30 11 2 18 4 30 3 12 1,640 210 1,434 194
% Represented 77.01 9.45 6.83 1.83 0.67 0.12 1.10 0.24 1.83 0.18 0.73 100.00 12.80 87.44 11.83
New Hires 29 3 1 4 37 1 30 3
% Represented 78.38 8.11 2.70 10.81 100.00 2.70 81.08 8.11
Employees 145 21 9 4 5 2 10 196 20 161 25
% Represented 73.98 10.71 4.59 2.04 2.55 1.02 5.10 100.00 10.20 82.14 12.76
New Hires 11 2 1 1 1 3 19 3 13 3
% Represented 57.89 10.53 5.26 5.26 5.26 15.79 100.00 15.79 68.42 15.79
Employees 1 1 1
% Represented 100.00 100.00 100.00
New Hires
% Represented
Employees 125 688 50 236 1 11 1 6 4 14 49 1,185 323 181 955
% Represented 10.55 58.06 4.22 19.92 0.08 0.93 0.08 0.51 0.34 1.18 4.14 100.00 27.26 15.27 80.59
New Hires 9 23 4 9 1 46 92 14 13 33
% Represented 9.78 25.00 4.35 9.78 1.09 50.00 100.00 15.22 14.13 35.87
Employees 4,100 98 884 19 51 3 6 155 7 54 5,377 1,125 5,196 127
% Represented 76.25 1.82 16.44 0.35 0.95 0.06 0.11 2.88 0.13 1.00 100.00 20.92 96.63 2.36
New Hires 89 13 2 2 3 13 122 20 107 2
% Represented 72.95 10.66 1.64 1.64 2.46 10.66 100.00 16.39 87.70 1.64
Employees 18 3 9 4 4 38 13 27 7
% Represented 47.37 7.89 23.68 10.53 10.53 100.00 34.21 71.05 18.42
New Hires 1 1 0
% Represented 100.00 100.00 0.00
Employees 7,389 1,701 1,324 609 94 39 140 51 208 29 179 11,763 2,494 9,155 2,429
% Represented 62.82 14.46 11.26 5.18 0.80 0.33 1.19 0.43 1.77 0.25 1.52 100.00 21.20 77.83 20.65
New Hires 167 43 27 20 3 2 5 4 4 105 380 65 206 69
% Represented 43.95 11.32 7.11 5.26 0.79 0.53 1.32 1.05 1.05 27.63 100.00 17.11 54.21 18.16
Skilled Craft
Service and Maintenance
Overall Totals
Officials and Administrators
Professional
Technician
Protective Services
Administrative Support
Paraprofessional

31
Promotions NCDOT had a total of 538 promotions during the State FY ending June 30, 2013. Of that total, 114 were minorities, representing 21.2%. Minorities make up 21.2% of NDCOT’s workforce and 1. % of North Carolina’s civilian labor force, so they are equally represented when comparing their promotion percentage to their NCDOT workforce percentage but underrepresented when comparing it to their civilian labor force percentage. There were 184 females promoted, representing 34.2%. Females make up 2 . % of NCDOT’s workforce and . % of North Carolina’s civilian labor force, so they are overrepresented when comparing their promotion percentage to their NCDOT workforce percentage but underrepresented when comparing it to their civilian labor force percentage. A closer look at the classes representing 2% or more of North Carolina’s civilian workforce indicates that: White males represent 36.3% of North Carolina’s civilian labor force and 62.8% of NCDOT’s workforce. They represented 310 (57.6%) of all the promotions, so they were overrepresented as compared to their North Carolina civilian labor force percentage and underrepresented compared to their NCDOT workforce percentage. Black males represent 9.3% of North Carolina’s civilian labor force and 11.3% of NCDOT’s workforce. They represented 28 (5.2%) of all the promotions, so they were underrepresented as compared to both their North Carolina civilian labor force percentage and to their NCDOT workforce percentage. Hispanic males represent 4.8% of North Carolina’s civilian labor force and . % of NCDOT’s workforce. They represented 4 (0.7%) of all the promotions, so they were underrepresented as compared to their North Carolina civilian labor force percentage and slightly underrepresented compared to their NCDOT workforce percentage. White females represent 32.7% of North Carolina’s civilian labor force and 14.5% of NCDOT’s workforce. They represented 111 (20.6%) of all the promotions, so they were underrepresented as compared to their North Carolina civilian labor force percentage and overrepresented as compared to their NCDOT workforce percentage. Black females represent 11.2% of North Carolina’s civilian labor force and 5.2% of NCDOT’s workforce. They represented 65 (12.1%) of all the promotions, so they were overrepresented as compared to both their North Carolina civilian labor force percentage and to their NCDOT workforce percentage. Hispanic females represent 2.6% of North Carolina’s civilian labor force and . % of NCDOT’s workforce. They represented 3 (0.6%) of all the promotions, so they were underrepresented as compared to their North Carolina civilian labor force percentage and slightly overrepresented compared to their NCDOT workforce percentage.

32
Table 3.6 Promotions Agency-Wide Analysis for Period July 2012 through June 2013
Source: BEACON Report B0031
White
Male
White
Female
Black
Male
Black
Female
Hisp
Male
Hisp
Female
Asian
Male
Asian
Female
AIAN
Male
AIAN
Female
Ethn
UnkTOT
TOT
MNRT
TOT
MALE
TOT
FEM
Employees 47 17 8 9 2 1 4 88 20 58 26
% Represented 53.41 19.32 9.09 10.23 2.27 1.14 4.55 100.00 22.73 65.91 29.55
Promotions 5 3 1 9 4 6 3
% Represented 55.56 33.33 11.11 100.00 44.44 66.67 33.33
Employees 1,690 719 252 307 24 23 112 41 19 5 46 3,238 783 2,097 1,095
% Represented 52.19 22.21 7.78 9.48 0.74 0.71 3.46 1.27 0.59 0.15 1.42 100.00 24.18 64.76 33.82
Promotions 128 53 13 38 1 3 4 4 2 1 247 66 148 99
% Represented 51.82 21.46 5.26 15.38 0.40 1.21 1.62 1.62 0.81 0.40 100.00 26.72 59.92 40.08
Employees 1,263 155 112 30 11 2 18 4 30 3 12 1,640 210 1,434 194
% Represented 77.01 9.45 6.83 1.83 0.67 0.12 1.10 0.24 1.83 0.18 0.73 100.00 12.80 87.44 11.83
Promotions 92 12 4 9 2 1 120 15 98 21
% Represented 76.67 10.00 3.33 7.50 1.67 0.83 100.00 12.50 81.67 17.50
Employees 145 21 9 4 5 2 10 196 20 161 25
% Represented 73.98 10.71 4.59 2.04 2.55 1.02 5.10 100.00 10.20 82.14 12.76
Promotions 9 9 9
% Represented 100.00 100.00 100.00
Employees 1 1 1
% Represented 100.00 100.00 100.00
Promotions
% Represented
Employees 125 688 50 236 1 11 1 6 4 14 49 1,185 323 181 955
% Represented 10.55 58.06 4.22 19.92 0.08 0.93 0.08 0.51 0.34 1.18 4.14 100.00 27.26 15.27 80.59
Promotions 3 44 2 15 2 66 17 5 59
% Represented 4.55 66.67 3.03 22.73 3.03 100.00 25.76 7.58 89.39
Employees 4,100 98 884 19 51 3 6 155 7 54 5,377 1,125 5,196 127
% Represented 76.25 1.82 16.44 0.35 0.95 0.06 0.11 2.88 0.13 1.00 100.00 20.92 96.63 2.36
Promotions 73 2 9 3 87 12 85 2
% Represented 83.91 2.30 10.34 3.45 100.00 13.79 97.70 2.30
Employees 18.00 3 9 4 4 38 13 27 7
% Represented 47.37 7.89 23.68 10.53 10.53 100.00 34.21 71.05 18.42
Promotions 0
% Represented 0.00
Employees 7,389 1,701 1,324 609 94 39 140 51 208 29 179 11,763 2,494 9,155 2,429
% Represented 62.82 14.46 11.26 5.18 0.80 0.33 1.19 0.43 1.77 0.25 1.52 100.00 21.20 77.83 20.65
Promotions 310 111 28 65 4 3 4 4 5 1 3 538 114 351 184
% Represented 57.62 20.63 5.20 12.08 0.74 0.56 0.74 0.74 0.93 0.19 0.56 100.00 21.19 65.24 34.20
Skilled Craft
Service and Maintenance
Overall Results
Officials and Administrators
Professional
Technician
Protective Services
Administrative Support
Paraprofessional

33
Terminations NCDOT terminated a total of 78 employees during the State FY ending June 30, 2013. Of that total, 25 were minorities, representing 32.1%. Minorities make up 21.2% of NDCOT’s workforce and 1. % of North Carolina’s civilian labor force, so they are overrepresented when comparing their termination percentage to both their NCDOT workforce percentage and their civilian labor force percentage. There were 7 females terminated, representing . %. Females make up 2 . % of NCDOT’s workforce and 48.0% of North Carolina’s civilian labor force, so they are underrepresented when comparing their termination percentage to both their NCDOT workforce percentage and their civilian labor force percentage. A closer look at the classes representing 2% or more of North Carolina’s civilian workforce indicates that: White males represent 36.3% of North Carolina’s civilian labor force and 62.8% of NCDOT’s workforce. They represented 47 (60.3%) of all the terminations, so they were overrepresented as compared to their North Carolina civilian labor force percentage and slightly underrepresented compared to their NCDOT workforce percentage. Black males represent 9.3% of North Carolina’s civilian labor force and 11.3% of NCDOT’s workforce. They represented 24 (30.8%) of all the terminations, so they were overrepresented as compared to both their North Carolina civilian labor force percentage and to their NCDOT workforce percentage. Hispanic males represent 4.8% of North Carolina’s civilian labor force and . % of NCDOT’s workforce. They represented 0 (0.00%) of all the terminations, so they were underrepresented as compared to both their North Carolina civilian labor force percentage and their NCDOT workforce percentage. White females represent 32.7% of North Carolina’s civilian labor force and 14.5% of NCDOT’s workforce. They represented 6 (7.7%) of all the terminations, so they were underrepresented as compared to both their North Carolina civilian labor force percentage and their NCDOT workforce percentage. Black females represent 11.2% of North Carolina’s civilian labor force and 5.2% of NCDOT’s workforce. They represented 1 (1.3%) of all the terminations, so they were underrepresented as compared to both their North Carolina civilian labor force percentage and to their NCDOT workforce percentage. Hispanic females represent 2.6% of North Carolina’s civilian labor force and . % of NCDOT’s workforce. They represented 0 (0.00%) of all the terminations, so they were underrepresented as compared to both their North Carolina civilian labor force percentage and their NCDOT workforce percentage.

34
Table 3.7: Terminations Agency-Wide Analysis for Period July 2012 through June 2013
Source: BEACON Report 0006 (Included Involuntary Separations and Dismissals for gross inefficiency, unsatisfactory job performance, and conduct.)
White
Male
White
Female
Black
Male
Black
Female
Hisp
Male
Hisp
Female
Asian
Male
Asian
Female
AIAN
Male
AIAN
Female
Ethn
UnkTOT
TOT
MNRT
TOT
MALE
TOT
FEM
Actions 0 0 0 0
% Represented 0.00 0.00 0.00
Actions 1 1 3 1 6 4 4 2
% Represented 16.67 16.67 50.00 16.67 0.00 0.00 0.00 0.00 0.00 0.00 0.00 100.00 66.67 66.67 33.33
Actions 4 1 5 1 5 0
% Represented 80.00 0.00 20.00 0.00 0.00 0.00 0.00 0.00 0.00 0.00 0.00 100.00 20.00 100.00 0.00
Actions 1 1 2 1 1 1
% Represented 0.00 50.00 50.00 0.00 0.00 0.00 0.00 0.00 0.00 0.00 0.00 100.00 50.00 50.00 50.00
Actions 0 0 0 0
% Represented 0.00 0.00 0.00
Actions 2 3 0 5 0 2 3
% Represented 40.00 60.00 0.00 0.00 0.00 0.00 0.00 0.00 0.00 0.00 0.00 100.00 0.00 40.00 60.00
Actions 36 19 55 19 55 0
% Represented 65.45 0.00 34.55 0.00 0.00 0.00 0.00 0.00 0.00 0.00 0.00 100.00 34.55 100.00 0.00
Actions 4 1 5 0 4 1
% Represented 80.00 20.00 0.00 0.00 0.00 0.00 0.00 0.00 0.00 0.00 0.00 100.00 0.00 80.00 20.00
Actions 47 6 24 1 0 0 0 0 0 0 0 78 25 71 7
% Represented 60.26 7.69 30.77 1.28 0.00 0.00 0.00 0.00 0.00 0.00 0.00 100.00 32.05 91.03 8.97
Skilled Craft
Service and Maintenance
Overall Results
Officials and Administrators
Professional
Technician
Protective Services
Administrative Support
Paraprofessional

35
Demotions NCDOT demoted a total of 3 employees during the State FY ending June 30, 2013. Of that total, none were minorities. There was 1 White female demoted, representing 33.33% and 2 White males, representing 66.67%. Since the numbers are not statistically significant, no further analysis was conducted. Table 3.8 Demotions Agency-Wide Analysis for Period July 2012 through June 2013
Source: BEACON Report B0006
White
Male
White
Female
Black
Male
Black
Female
Hisp
Male
Hisp
Female
Asian
Male
Asian
Female
AIAN
Male
AIAN
Female
Ethn
UnkTOT
TOT
MNRT
TOT
MALE
TOT
FEM
Demotions 0 0 0 0
% Represented 0.00 0.00 0.00
Demotions 1 1 0 1 0
% Represented 100.00 100.00 0.00 100.00 0.00
Demotions 0 0 0 0
% Represented 0.00 0.00 0.00
Demotions 1 1 0 0 1
% Represented 100.00 100.00 0.00 0.00 100.00
Demotions 0 0 0 0
% Represented 0.00 0.00 0.00
Demotions 0 0 0 0
% Represented 0.00 0.00 0.00 0.00
Demotions 0 0 0 0
% Represented 0.00 0.00 0.00 0.00
Demotions 1 1 0 1 0
% Represented 100.00 100.00 0.00 100.00 0.00
Demotions 2 1 0 0 0 0 0 0 0 0 0 3 0 2 1
% Represented 66.67 33.33 0.00 0.00 0.00 0.00 0.00 0.00 0.00 0.00 0.00 100.00 0.00 66.67 33.33
Skilled Craft
Service and Maintenance
Overall Results
Officials and Administrators
Professional
Technician
Protective Services
Administrative Support
Paraprofessional
36
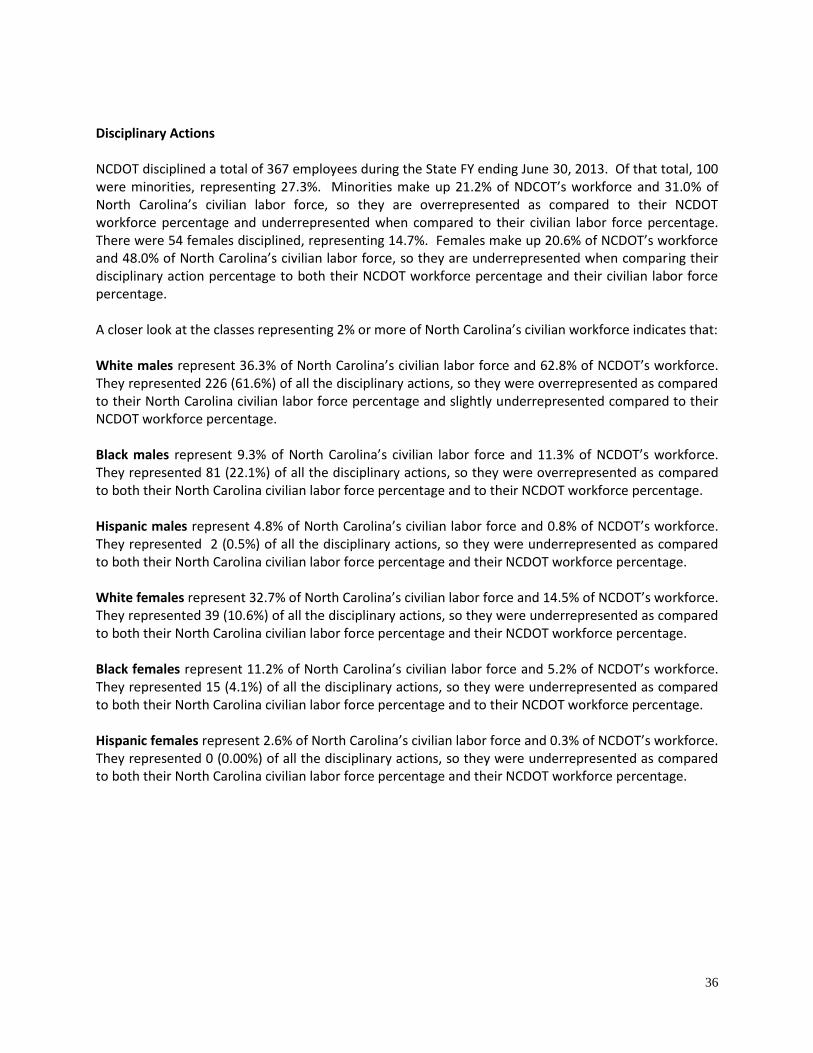
Disciplinary Actions NCDOT disciplined a total of 367 employees during the State FY ending June 30, 2013. Of that total, 100 were minorities, representing 27. %. Minorities make up 21.2% of NDCOT’s workforce and 1. % of North Carolina’s civilian labor force, so they are overrepresented as compared to their NCDOT workforce percentage and underrepresented when compared to their civilian labor force percentage. There were 54 females disciplined, representing 1 . %. Females make up 2 . % of NCDOT’s workforce and 48.0% of North Carolina’s civilian labor force, so they are underrepresented when comparing their disciplinary action percentage to both their NCDOT workforce percentage and their civilian labor force percentage. A closer look at the classes representing 2% or more of North Carolina’s civilian workforce indicates that: White males represent 36.3% of North Carolina’s civilian labor force and 62.8% of NCDOT’s workforce. They represented 226 (61.6%) of all the disciplinary actions, so they were overrepresented as compared to their North Carolina civilian labor force percentage and slightly underrepresented compared to their NCDOT workforce percentage. Black males represent 9.3% of North Carolina’s civilian labor force and 11.3% of NCDOT’s workforce. They represented 81 (22.1%) of all the disciplinary actions, so they were overrepresented as compared to both their North Carolina civilian labor force percentage and to their NCDOT workforce percentage. Hispanic males represent 4.8% of North Carolina’s civilian labor force and . % of NCDOT’s workforce. They represented 2 (0.5%) of all the disciplinary actions, so they were underrepresented as compared to both their North Carolina civilian labor force percentage and their NCDOT workforce percentage. White females represent 32.7% of North Carolina’s civilian labor force and 14.5% of NCDOT’s workforce. They represented 39 (10.6%) of all the disciplinary actions, so they were underrepresented as compared to both their North Carolina civilian labor force percentage and their NCDOT workforce percentage. Black females represent 11.2% of North Carolina’s civilian labor force and 5.2% of NCDOT’s workforce. They represented 15 (4.1%) of all the disciplinary actions, so they were underrepresented as compared to both their North Carolina civilian labor force percentage and to their NCDOT workforce percentage. Hispanic females represent 2.6% of North Carolina’s civilian labor force and . % of NCDOT’s workforce. They represented 0 (0.00%) of all the disciplinary actions, so they were underrepresented as compared to both their North Carolina civilian labor force percentage and their NCDOT workforce percentage.

37
Table 3.9 Disciplinary Actions Agency-Wide Analysis for Period July 1, 2012 through June 30, 2013
Source: BEACON Report B0051
White
Male
White
Female
Black
Male
Black
Female
Hisp
Male
Hisp
Female
Asian
Male
Asian
Female
AIAN
Male
AIAN
Female
Ethn
UnkTOT
TOT
MNRT
TOT
MALE
TOT
FEM
Actions 0 0 0 0
% Represented 0.00 0.00 0.00
Actions 21 8 5 9 43 14 26 17
% Represented 48.84 18.60 11.63 20.93 0.00 0.00 0.00 0.00 0.00 0.00 0.00 100.00 32.56 60.47 39.53
Actions 38 5 3 1 1 48 5 42 6
% Represented 79.17 10.42 6.25 2.08 0.00 0.00 0.00 0.00 2.08 0.00 0.00 100.00 10.42 87.50 12.50
Actions 3 2 3 2 10 5 6 4
% Represented 30.00 20.00 30.00 20.00 0.00 0.00 0.00 0.00 0.00 0.00 0.00 100.00 50.00 60.00 40.00
Actions 0 0 0 0
% Represented 0.00 0.00 0.00
Actions 6 15 1 2 1 25 3 7 17
% Represented 24.00 60.00 4.00 8.00 0.00 0.00 0.00 0.00 0.00 0.00 4.00 100.00 12.00 28.00 68.00
Actions 155 8 67 1 2 1 1 235 71 225 9
% Represented 65.96 3.40 28.51 0.43 0.85 0.00 0.00 0.00 0.43 0.00 0.43 100.00 30.21 95.74 3.83
Actions 3 1 2 6 2 5 1
% Represented 50.00 16.67 33.33 0.00 0.00 0.00 0.00 0.00 0.00 0.00 0.00 100.00 33.33 83.33 16.67
Actions 226 39 81 15 2 0 0 0 2 0 2 367 100 311 54
% Represented 61.58 10.63 22.07 4.09 0.54 0.00 0.00 0.00 0.54 0.00 0.54 100.00 27.25 84.74 14.71
Skilled Craft
Service and Maintenance
Overall Results
Officials and Administrators
Professional
Technician
Protective Services
Administrative Support
Paraprofessional

38
NCDOT NET CHANGES IN EMPLOYMENT AGENCY-WIDE ANALYSIS
July 2012 – June 2013 Table .1 represents the net changes in NCDOT’s workforce from FY 2 12 to FY 2 1 . Total employment decreased by 125 from 11,888 employees in 2012 to 11,763 employees in 2013 or by <1.05%>. Minority employment decreased by 43 from 2,537 to 2,494 or by <1.69%>. Female employment decreased by 54 from 2,483 to 2,429 or by <2.17%>. A closer look at the classes representing 2% or more of North Carolina’s civilian workforce indicates that: White males increased their representation in the Officials and Administrators, Protective Services and Services and Maintenance categories. They remained unchanged in the Paraprofessional category. They showed a decrease in all other categories, representing an overall decrease of 1.64%. Black males increased their representation in the Officials and Administrators and Administrative Support categories and remained unchanged in the Paraprofessional and Service and Maintenance categories. They showed a decrease in all other categories, representing an overall decrease of 3.57%. Hispanic males increased their representation in the Officials and Administrators and Protective Services and remained unchanged in the Technician, Paraprofessional, Skilled Craft, and Service and Maintenance categories. They showed a decrease in the Professional and Administrative Support categories, representing a zero net change overall. White females increased their representation in the Officials and Administrators and Protective Services categories and remained unchanged in the Paraprofessional and Service and Maintenance categories. They showed a decrease in all other categories, representing an overall decrease of 3.57%. Black females increased their representation in the Officials and Administrators, Professional, and Skilled Craft categories and remained unchanged in the Protective Services, Paraprofessional, and Service and Maintenance categories. They showed a decrease in the Technician and Administrative Support categories. Black females did, however, show an overall increase in percentage employed of 1.67%. Hispanic females increased their representation in the Professional category and remained unchanged in the Officials and Administrators, Technician, Protective Services, Paraprofessional, and Service and Maintenance categories. They showed a decrease in the Administrative Support and Skilled Craft categories, representing an overall decrease of 9.30%.

39
Table 3.10 NCDOT Net Changes in Employment for Periods Ending June 2012 and June 2013
Source: BEACON Report B0031 for Employees 2012 and Employees 2013
White
Male
White
Female
Black
Male
Black
Female
Hisp
Male
Hisp
Female
Asian
Male
Asian
Female
AIAN
Male
AIAN
Female
Ethn
UnkTOT
TOT
MNRT
TOT
MALES
TOT
FEM
Employees 2012 27 14 5 6 1 0 0 0 0 0 1 54 12 33 20
Employees 2013 47 17 8 9 2 0 1 0 0 0 4 88 20 58 26
Net Difference 20 3 3 3 1 0 1 0 0 0 3 34 8 25 6
% Difference 74.07 21.43 60.00 50.00 100.00 0.00 100.00 0.00 0.00 0.00 300.00 62.96 66.67 75.76 30.00
Employees 2012 1,708 738 255 283 25 22 109 39 20 5 10 3,214 758 2,117 1,087
Employees 2013 1,690 719 252 307 24 23 112 41 19 5 46 3,238 783 2,097 1,095
Net Difference -18 -19 -3 24 -1 1 3 2 -1 0 36 24 25 -20 8
% Difference -1.05 -2.57 -1.18 8.48 -4.00 4.55 2.75 5.13 -5.00 0.00 360.00 0.75 3.30 -0.94 0.74
Employees 2012 1,299 157 119 33 11 2 18 4 33 3 7 1,686 223 1,480 199
Employees 2013 1,263 155 112 30 11 2 18 4 30 3 12 1,640 210 1,434 194
Net Difference -36 -2 -7 -3 0 0 0 0 -3 0 5 -46 -13 -46 -5
% Difference -2.77 -1.27 -5.88 -9.09 0.00 0.00 0.00 0.00 -9.09 0.00 71.43 -2.73 -5.83 -3.11 -2.51
Employees 2012 143 13 11 4 4 2 7 184 21 160 17
Employees 2013 145 21 9 4 5 2 10 196 20 161 25
Net Difference 2 8 -2 0 1 0 0 0 0 0 3 12 -1 1 8
% Difference 1.40 61.54 -18.18 0.00 25.00 0.00 0.00 0.00 0.00 0.00 42.86 6.52 -4.76 0.63 47.06
Employees 2012 1 1 0 1 0
Employees 2013 1 1 0 1 0
Net Difference 0 0 0 0 0 0 0 0 0 0 0 0 0 0 0
% Difference 0.00 0.00 0.00 0.00 0.00 0.00 0.00 0.00 0.00 0.00 0.00 0.00 0.00 0.00 0.00
Employees 2012 127 732 44 252 2 15 1 5 4 13 4 1,199 336 178 1,017
Employees 2013 125 688 50 236 1 11 1 6 4 14 49 1,185 323 181 955
Net Difference -2 -44 6 -16 -1 -4 0 1 0 1 45 -14 -13 3 -62
% Difference -1.57 -6.01 13.64 -6.35 -50.00 -26.67 0.00 20.00 0.00 7.69 1125.00 -1.17 -3.87 1.69 -6.10
Employees 2012 4,190 107 930 17 51 4 6 158 8 43 5,514 1,174 5,335 136
Employees 2013 4,100 98 884 19 51 3 6 155 7 54 5,377 1,125 5,196 127
Net Difference -90 -9 -46 2 0 -1 0 0 -3 -1 11 -137 -49 -139 -9
% Difference -2.15 -8.41 -4.95 11.76 0.00 -25.00 0.00 0.00 -1.90 -12.50 25.58 -2.48 -4.17 -2.61 -6.62
Employees 2012 17 3 9 4 3 36 13 26 7
Employees 2013 18 3 9 4 4 38 13 27 7
Net Difference 1 0 0 0 0 0 0 0 0 0 1 2 0 1 0
% Difference 5.88 0.00 0.00 0.00 0.00 0.00 0.00 0.00 0.00 0.00 33.33 5.56 0.00 3.85 0.00
Employees 2012 7,512 1,764 1,373 599 94 43 136 48 215 29 75 11,888 2,537 9,330 2,483
Employees 2013 7,389 1,701 1,324 609 94 39 140 51 208 29 179 11,763 2,494 9,155 2,429
Net Difference -123 -63 -49 10 0 -4 4 3 -7 0 104 -125 -43 -175 -54
% Difference -1.64 -3.57 -3.57 1.67 0.00 -9.30 2.94 6.25 -3.26 0.00 138.67 -1.05 -1.69 -1.88 -2.17
Administrative Support
Skilled Craft
Service and Maintenance
Overall Result
Officials and Administrators
Professional
Technician
Protective Services
Paraprofessional

40
SECTION III, EXHIBIT 1: NCDOT Job Titles by EEO Category
NCDOT's FTE Positions
Officials and Administrators
Accounting Manager
Agency General Counsel II
Agency/University HR Director III
Assistant Commissioner
Assistant Director Ferry Operations
Assistant Director Maintenance & Materials
Attorney Supervisor II
Audit Manager
Chief Deputy II
Chief Deputy IV
Chief Operating Officer
Commissioner of Motor Vehicles
Community Development Planner III
Community Liaison-DOT Planning & Program
Community Planner Team Leader
Departmental Purchasing & Services Off
Departmental Services Director
Deputy Secretary of Transit
Director Ferry Division
Director of Administrative Analysis
DMV Assistant Director
DMV Director
DOT Archaeologist Supervisor
DOT Civil Rights Director
DOT Coordinator of Strategic Initiatives
Dot Historic Architect Supervisor
DOT Logistics Director
DOT Right Of Way Branch Manager
DOT-Director of Safety & Loss Control
Driver License Regional Chief Examiner
Engineering Director
Environmental Manager II
Environmental Supervisor IV
Equipment Plant and Maintenance Manager
Executive Director NC Turnpike Authority
Fiscal Executive
GTP-Executive Director / CFO
Highway Safety Program Coordinator
Marine Field Maintenance Superintendent
Marine Shipyard Superintendent
NCSPA-Chief Commercial Officer
NCSPA-Chief Executive Officer
NCSPA-Chief Financial Officer
NCSPA-Deputy Executive Director
NCSPA-Dir. Community Econ Develop
NCSPA-Director, Engineering & Maintenance
NCSPA-Director, Finance
NCSPA-Director, Info. Technology
NCSPA-Director, Liner Sales
NCSPA-VP, Liner Sales
Personnel Director II
Personnel Supervisor II
Secretary Of Transportation
State Equipment Superintendent
Toll Revenue Manager, NCTA
Transportation Program Director
Transportation Program Manager
Transportation Program Section Chief
Triangle Exp Roadway Operations Manager
Professional
Accountant
Accounting Director
Accounting Technician
Administrative Assistant II
Administrative Assistant II - TL
Administrative Assistant III
Administrative Officer I
Administrative Officer I TL
Administrative Officer II
Administrative Officer III
Agency Safety Program Director III
Application Solutions Architect
Archaeologist II
Architect Supervisor

41
Artist Illustrator II
Artist Illustrator III
Assistant Attorney General
Assistant Director of Traffic Records
Assistant R/W Unit Supervisor
Attorney I
Attorney II
Attorney III
Attorney IV
Audit Manager
Auditor
Aviation Safety Specialist I
Bus Off/Director CSC and Fin Control
Business Systems Analyst
Business & Technology Application Analyst
Business & Technology Application Specialist
Business And Technology Application Tech
Business Officer
Business Services Coordinator
Business Systems Analyst
Chemist I
Chemist II
Chief Financial Officer NCTPA
Community Development Specialist I
Community Development Specialist II
Community Planner I
Community Planner II
Community Planner III
CSC Liaison Specialist, NCTA
Data Processing Operations Assistant
Database Analyst
Departmental Purchasing Agent I
Departmental Purchasing Agent II
Departmental Purchasing Agent III
Departmental Purchasing Officer III
Departmental Purchasing Officer IV
Deputy Director Public Affairs
Dir. of Outreach and Community Affairs
Director Of Operations NCTPA
Director of Public Affairs III
Division Bridge Mgr. Engineer
DMV Enforcement Hearings Officer
DOT Assistant Right Of Way Unit Supervisor
DOT Assistant Right Of Way Branch Manager
DOT Permits Director
DOT Right of Way Appraiser Unit Supervisor
DOT Right of Way Unit Supervisor II
DOT/Commerce Liaison
Driver Education Field Supervisor
Driver Education Program Specialist
Driver Education Specialist
Driver License District Supervisor
Driver License Examiner
Driver License Senior Examiner
Economist IV
Engineer
Engineer (Advanced)
Engineering Manager
Engineering Supervisor
Engineering/Architectural Supervisor
Environmental Program Consultant
Environmental Program Supervisor II
Environmental Program Supervisor III
Environmental Senior Specialist
Environmental Senior Technician
Environmental Specialist
Environmental Supervisor
Environmental Supervisor III
EO Compliance Specialist
Executive Air Operations Supervisor II
Executive Pilot II
Federal Legislative Programs Coordinator
GTP-Accounting Technician (Temp)
GTP-Airport Director
GTP-Controller
GTP-Information Technology/Facility Dir.
GTP-Marketing & Communications Manager
Historic Preservation/Restoration Spec II
Industrial Hygienist
Information & Communication Specialist I

42
Information & Communications Spec II
Information & Communications Spec III
Information Technology Director
Information Technology Executive
Information Technology Manager
Information Technology Manager B/T
Interoperability Manager, NCTA
Inventory Systems Analyst
IT Compliance Officer
IT Director
IT Manager B&T Applications
IT Manager Networking
IT Manager Systems
IT Manager Tech Support
IT Manager-General
Legislative Affairs Program Manager
Librarian II
Management Engineer I
Management Engineer II
Management Engineer III
Manager Liability Insurance
Marine Quality Assurance Specialist
MB/WB Development Specialist
Motor Vehicle Field Supervisor
Motor Vehicle Registration Field Supervisor
NCSPA -IT Specialist
NCSPA- Sr. Director External Affairs
NCSPA Server Administrator
NCSPA -Technology Manager
NCSPA-Account Executive
NCSPA-Accounting Supervisor
NCSPA-Applications Dev. Manager
NCSPA-Asst. Facilities Manager
NCSPA-Buyer
NCSPA-Com & PC Spt Manager
NCSPA-Container Terminal Manager
NCSPA-Controller
NCSPA-Crane Dept. Supervisor
NCSPA-Customer Service Manager
NCSPA-Director Port Ops & Bus Dev MHC
NCSPA-Dir. Break-Bulk & Bulk Marketing
NCSPA-Dir., Planning & Development
NCSPA-Director, Communications
NCSPA-Director, Materials Management
NCSPA-Director, Real Estate
NCSPA-Environmental Supervisor
NCSPA-Financial Analyst
NCSPA-Human Resources Generalist
NCSPA-HUMAN RESOURCES MANAGER
NCSPA-Inv. Supply Supervisor
NCSPA-IT Systems Analyst
NCSPA-Manager CIT
NCSPA-Market Specialist
NCSPA-Mgr, Equip & Fac. Maintenance - SPA
NCSPA-Mgr, General Cargo Operations
NCSPA-Mgr, Cranes & Equip Maintenance
NCSPA-Network Engineer
NCSPA-Payroll Systems Manager
NCSPA-Safety Officer
NCSPA-Security Technology Specialist
NCSPA-Senior Mgr, Port Operations
NCSPA-Senior Project Manager –Engineer
NCSPA-Senior Project Manager-IT
NCSPA-Senior Purchasing Agent
NCSPA-System Administrator
NCSPA-VP, Administration
Networking Analyst
Networking Specialist
Nurse Consultant
Operations and Systems Analyst
Operations and Systems Specialist
Personnel Analyst I
Personnel Analyst II
Personnel Analyst III
Personnel Officer II
Personnel Supervisor I
Personnel Technician II
Personnel Technician III
Photographer II
Pilot
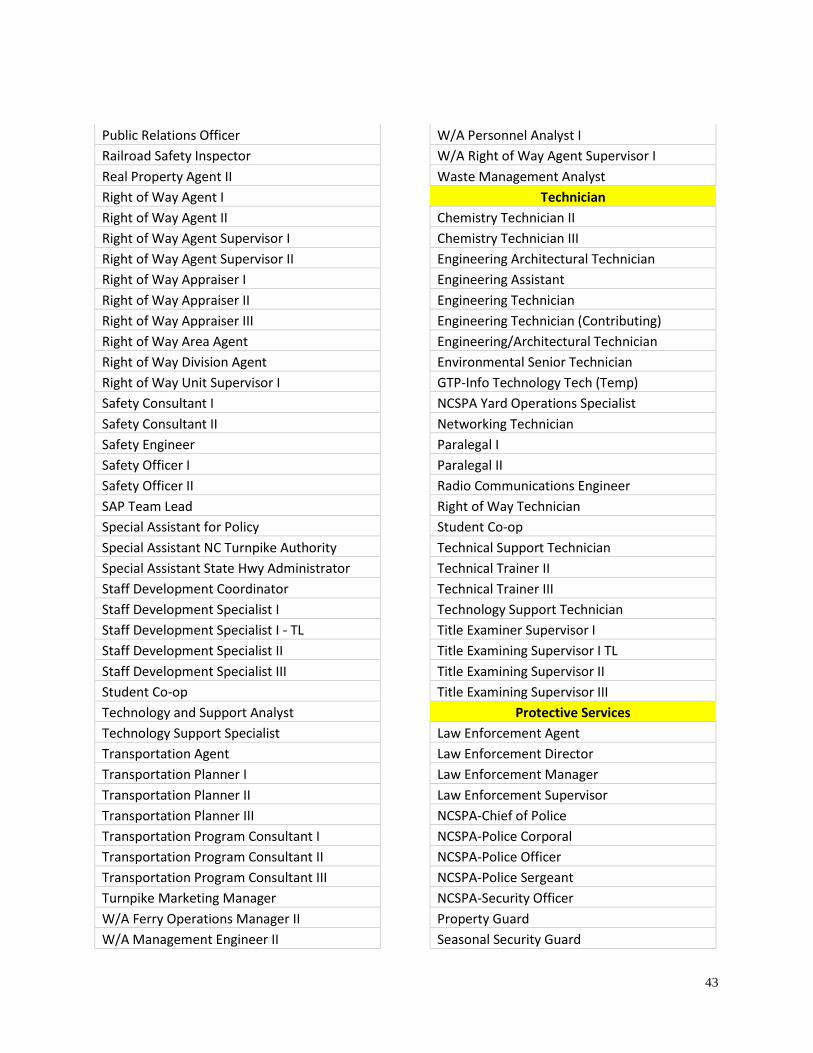
43
Public Relations Officer
Railroad Safety Inspector
Real Property Agent II
Right of Way Agent I
Right of Way Agent II
Right of Way Agent Supervisor I
Right of Way Agent Supervisor II
Right of Way Appraiser I
Right of Way Appraiser II
Right of Way Appraiser III
Right of Way Area Agent
Right of Way Division Agent
Right of Way Unit Supervisor I
Safety Consultant I
Safety Consultant II
Safety Engineer
Safety Officer I
Safety Officer II
SAP Team Lead
Special Assistant for Policy
Special Assistant NC Turnpike Authority
Special Assistant State Hwy Administrator
Staff Development Coordinator
Staff Development Specialist I
Staff Development Specialist I - TL
Staff Development Specialist II
Staff Development Specialist III
Student Co-op
Technology and Support Analyst
Technology Support Specialist
Transportation Agent
Transportation Planner I
Transportation Planner II
Transportation Planner III
Transportation Program Consultant I
Transportation Program Consultant II
Transportation Program Consultant III
Turnpike Marketing Manager
W/A Ferry Operations Manager II
W/A Management Engineer II
W/A Personnel Analyst I
W/A Right of Way Agent Supervisor I
Waste Management Analyst
Technician
Chemistry Technician II
Chemistry Technician III
Engineering Architectural Technician
Engineering Assistant
Engineering Technician
Engineering Technician (Contributing)
Engineering/Architectural Technician
Environmental Senior Technician
GTP-Info Technology Tech (Temp)
NCSPA Yard Operations Specialist
Networking Technician
Paralegal I
Paralegal II
Radio Communications Engineer
Right of Way Technician
Student Co-op
Technical Support Technician
Technical Trainer II
Technical Trainer III
Technology Support Technician
Title Examiner Supervisor I
Title Examining Supervisor I TL
Title Examining Supervisor II
Title Examining Supervisor III
Protective Services
Law Enforcement Agent
Law Enforcement Director
Law Enforcement Manager
Law Enforcement Supervisor
NCSPA-Chief of Police
NCSPA-Police Corporal
NCSPA-Police Officer
NCSPA-Police Sergeant
NCSPA-Security Officer
Property Guard
Seasonal Security Guard

44
Security Guard
Paraprofessional
Multimedia Designer
Administrative Support
Accounting Clerk V
Administrative Assistant I
Administrative Officer I
Administrative Secretary II
Administrative Secretary III
Administrative Services Assistant V
Executive Assistant I
GTP-Administrative Assistant
GTP-Administrative Assistant (Temp)
GTP-Receptionist / Secretary
Highway Equipment Office Manager
Information Processing Assistant II
Information Processing Technician
Information Processing Technician I TL
Lead Worker III
Lead Worker V
Mail Center Supervisor II
Mail Clerk II
NCSPA-Accounting Clerk
NCSPA-Administrative Assistant I
NCSPA-Administrative Assistant II
NCSPA-Cargo Coordinator
NCSPA-Checker
NCSPA-Chief Clerk
NCSPA-Container Yard Specialist
NCSPA-Editorial Assistant
NCSPA-Engineering Services Assistant
NCSPA-Executive Admin. Assistant
NCSPA-Finance & Accounting Asst.
NCSPA-Gate Coordinator
NCSPA-Human Resource Coordinator
NCSPA-Intern
NCSPA-Inventory Control Coordinator
NCSPA-Lead Billing Clerk
NCSPA-Office Services Clerk
NCSPA-Service Coordinator
NCSPA-Yard Inventory Specialist
NCSPA-Yard Operations Technician
Office Aide
Office Assistant II
Office Assistant III
Office Assistant IV
Office Manager NCTPA
Office Services Supervisor I
Personnel Assistant III
Personnel Assistant V
Personnel Technician I
Processing Assistant
Processing Assistant II
Processing Assistant III
Processing Assistant III TL
Processing Assistant IV
Processing Assistant IV - TL
Processing Assistant V
Processing Unit Supervisor IV
Processing Unit Supervisor V
Program Assistant IV
Program Assistant V
Right of Way Aide
Seasonal Processing Assistant III
Stock Clerk I
Stock Clerk II
Warehouse Manager I
Word Processing Center Supervisor V
Word Processor IV
Skilled Craft
Aircraft Maintenance Supervisor
Aircraft Mechanic
Area Equipment Superintendent
Auto Body Mechanic
Auto Painter
Bridge Operator
Carpenter II
Carpenter Supervisor II
Dredge Deckhand
Dredge Engineer

45
Dredge Lever Operator
Dredge Superintendent
Electronics Technician
Electronics Technician I
Electronics Technician II
Electronics Technician III
Equipment Superintendent
Explosives Specialist
Facility Maintenance Supervisor III
Facility Maintenance Supervisor IV
Ferry Chief Engineer
Ferry Crew Member I
Ferry Crew Member II
Ferry Master
Ferry Oiler
Ferry Operations Manager II
Ferry Superintendent
Fleet Support Specialist
General Utility Worker
GTP-Airport Maintenance Supervisor
GTP-Airport Ops Maintenance Technician
HVAC Mechanic
Long Distance Truck Driver
Machine Operator V
Machinist
Machinist Supervisor
Maintenance Mechanic I
Maintenance Mechanic II
Maintenance Mechanic III
Maintenance Mechanic IV
Maintenance Mechanic V
Marine Dock Master
Marine Electrician
Marine Hull Supervisor
Marine Machinist
Marine Mechanic
Marine Mechanic Supervisor I
Marine Mechanic Supervisor II
Marine Painter
Marine Painter Supervisor
Marine Pipefitter
Marine Sandblaster Chipper
Marine Ship fitter
Marine Welder
Mechanic
NCSPA - Facilities Welder
NCSPA Crane Electrical Supervisor
NCSPA- Crane Operator
NCSPA Electrician
NCSPA- Engineering Design Tech
NCSPA Equipment Operator I
NCSPA- Equipment Operator II
NCSPA Maintenance Mechanic
NCSPA-Bulk Handling Supervisor
NCSPA-Cargo Control Supervisor
NCSPA-Cargo Handling Supervisor
NCSPA-Cargo Specialist
NCSPA-Chief, Ship Loader Operator
NCSPA-construction Inspector
NCSPA-Container Interchange Sup
NCSPA-Crane Electrician
NCSPA-Crane Foreman
NCSPA-Crane Maintenance Mechanic III
NCSPA-Crane Maintenance Supervisor
NCSPA-Crane Operator
NCSPA-Crane Supervisor
NCSPA-Electrician
NCSPA-Equipment Maintenance Supervisor
NCSPA-Equipment Operator I
NCSPA-Equipment Operator II
NCSPA-Equipment Operator III
NCSPA-Equipment Operator IV
NCSPA-Equipment Operator/Clerk
NCSPA-Equipment Operator/Mechanic
NCSPA-Facilities Maintenance Supervisor
NCSPA-Facilities Maintenance Welder
NCSPA-Facilities Mechanic
NCSPA-General Services Team Leader
NCSPA-Lumber Products Supervisor
NCSPA-Maintenance Mechanic

46
NCSPA-Operations Team Leader
NCSPA-Shed Supervisor
NCSPA-Steel Yard Supervisor
NCSPA-Utilities Management Specialist
NCSPA-Utility Worker
NCSPS-Electrician
Plant Maintenance Supervisor I
Plant Maintenance Supervisor III
Printing Unit Supervisor II
Radio Engineer I
Radio Engineer II
Railroad Safety Supervisor
Seasonal Ferry Chief Engineer
Seasonal Ferry Crew Member I
Seasonal Ferry Crew Member II
Seasonal Ferry Master
Seasonal Ferry Oiler
Seasonal Maintenance Mechanic IV
Seasonal Marine Electrician
Seasonal Marine Mechanic
Seasonal Marine Painter
Seasonal Marine Sand Blaster Chipper
Seasonal Trades Worker II
Trades Worker I
Trades Worker II
Trades Worker Supervisor II
Transportation Equipment Tech Co-op
Transportation Supervisor
Transportation Worker
Transportation Worker I
Transportation Worker/IMAP
Vehicle Body Shop Supervisor
Vehicle Equipment Repair Tech Supervisor
Vehicle Equipment Repair Technician
Vehicle Equipment Repair Technician Co-O
Vehicle Operator II
Vehicle Operator III
Vehicle/equipment Repair Technician
Welder II
Service and Maintenance
Ferry Mate
General Utility Worker
GTP-Custodian
Marine Planning & Scheduling Supervisor
Seasonal General Utility Worker Source: BEACON Report B0149 (All FTE positions by title and EEO Category)

47
SECTION III, EXHIBIT 2: Workforce Analyses of 14 Highway Divisions

48
Exhibit 2.1 NCDOT Highway Division 1 Workforce Analysis
Snapshot of Division 1 Females EEO Category % Females Available
(2010 Census) # and % Females
Division 1 # and % Females
NCDOT Underrepresented
Based on 2010 Census Availability
Off/Adm 38.5 0 0.00 26 29.5 Yes
Professionals 57.3 11 25.58 1,095 33.8 Yes
Technicians 66.3 4 7.14 194 11.8 Yes
Adm Support 74.5 31 91.18 955 80.6 No
Skilled Craft 16.5 7 1.76 127 2.4 Yes
Svc/Main 62.0 0 0.00 7 18.4 Yes
Overall 48.0 53 9.91 2,429 20.6 Yes
Snapshot of Division 1 Minorities
EEO Category % Minorities Available (2010 Census)
# and % Minorities Division 1
# and % Minorities NCDOT
Underrepresented Based on 2010
Census Availability
Off/Adm 17.6 0 0.00 20 22.7 Yes
Professionals 23.0 3 6.98 783 24.3 Yes
Technicians 26.7 4 7.14 210 12.8 Yes
Adm Support 28.9 4 11.76 323 27.3 Yes
Skilled Craft 39.1 149 37.53 1,125 20.9 Yes
Svc/Main 44.0 2 50.00 13 34.2 No
Overall 31.0 162 30.28 2,494 21.2 Yes (slightly)
Division 1 Workforce Analysis as of June 2013
Source: BEACON Report B0031
White
Male
White
Female
Black
Male
Black
Female
Hisp
Male
Hisp
Female
Asian
Male
Asian
Female
AIAN
Male
AIAN
Feamle
Ethn
UnkTOT
TOT
MNRT
TOT
FEM
Employees 1 1
% Represented 100.00 100.00
Employees 30 10 1 1 1 43 3 11
% Represented 69.77 23.26 2.33 2.33 2.33 100.00 6.98 25.58
Employees 49 3 3 1 56 4 4
% Represented 87.50 5.36 5.36 1.79 100.00 7.14 7.14
Employees 3 27 4 34 4 31
% Represented 8.82 79.41 11.76 100.00 11.76 91.18
Employees 241 5 143 2 2 2 2 397 149 7
% Represented 60.71 1.26 36.02 0.50 0.50 0.50 0.50 100.00 37.53 1.76
Employees 2 2 4 2
% Represented 50.00 50.00 100.00 50.00
Employees 326 45 149 8 3 2 2 535 162 53
% Represented 60.93 8.41 27.85 1.50 0.56 0.37 0.37 100.00 30.28 9.91
Service and Maintenance
Overall Results
Officials and Administrators
Professional
Technicians
Administrative Support
Skilled Craft

49
Exhibit 2.2 NCDOT Highway Division 2 Workforce Analysis
Snapshot of Division 2 Females EEO Category % Females Available
(2010 Census) # and % Females
Division 2 # and % Females
NCDOT Underrepresented
Based on 2010 Census Availability
Off/Adm 38.5 0 0.00 26 29.5 Yes
Professionals 57.3 8 17.78 1,095 33.8 Yes
Technicians 66.3 6 10.17 194 11.8 Yes
Adm Support 74.5 27 81.82 955 80.6 No
Skilled Craft 16.5 9 2.62 127 2.4 Yes
Svc/Main 62.0 0 0.00 7 18.4 Yes
Overall 48.0 50 10.35 2,429 20.6 Yes
Snapshot of Division 2 Minorities
EEO Category % Minorities Available (2010 Census)
# and % Minorities Division 2
# and % Minorities NCDOT
Underrepresented Based on 2010
Census Availability
Off/Adm 17.6 0 0.00 20 22.7 Yes
Professionals 23.0 5 11.11 783 24.3 Yes
Technicians 26.7 8 13.56 210 12.8 Yes
Adm Support 28.9 6 18.18 323 27.3 Yes
Skilled Craft 39.1 111 32.36 1,125 20.9 Yes
Svc/Main 44.0 1 50.00 13 34.2 No
Overall 31.0 131 27.12 2,494 21.2 Yes
Division 2 Workforce Analysis as of June 2013
Source: BEACON Report B0031
White
Male
White
Female
Black
Male
Black
Female
Hisp
Male
Hisp
Female
Asian
Male
Asian
Female
AIAN
Male
AIAN
Feamle
Ethn
UnkTOT
TOT
MNRT
TOT
FEM
Employees 1 1
% Represented 100.00 100.00
Employees 33 7 2 1 2 45 5 8
% Represented 73.33 15.56 4.44 2.22 4.44 100.00 11.11 17.78
Employees 45 6 8 59 8 6
% Represented 76.27 10.17 13.56 100.00 13.56 10.17
Employees 3 23 2 3 1 1 33 6 27
% Represented 9.09 69.70 6.06 9.09 3.03 3.03 100.00 18.18 81.82
Employees 221 7 105 2 3 1 4 343 111 9
% Represented 64.43 2.04 30.61 0.58 0.87 0.29 1.17 100.00 32.36 2.62
Employees 1 1 2 1
% Represented 50.00 50.00 100.00 50.00
Employees 303 43 118 6 3 1 2 1 6 483 131 50
% Represented 62.73 8.90 24.43 1.24 0.62 0.21 0.41 0.21 1.24 100.00 27.12 10.35
Overall Results
Officials and Administrators
Professional
Technicians
Administrative Support
Skilled Craft
Service and Maintenance

50
Exhibit 2.3 NCDOT Highway Division 3 Workforce Analysis
Snapshot of Division 3 Females EEO Category % Females Available
(2010 Census) # and % Females
Division 3 # and % Females
NCDOT Underrepresented
Based on 2010 Census Availability
Off/Adm 38.5 1 100.00 26 29.5 No
Professionals 57.3 16 32.65 1,095 33.8 Yes
Technicians 66.3 11 12.64 194 11.8 Yes
Adm Support 74.5 31 88.57 955 80.6 No
Skilled Craft 16.5 14 4.56 127 2.4 Yes
Svc/Main 62.0 1 100.00 7 18.4 No
Overall 48.0 74 15.42 2,429 20.6 Yes
Snapshot of Division 3 Minorities
EEO Category % Minorities Available (2010 Census)
# and % Minorities Division 3
# and % Minorities NCDOT
Underrepresented Based on 2010
Census Availability
Off/Adm 17.6 0 0.00 20 22.7 Yes
Professionals 23.0 5 10.20 783 24.3 Yes
Technicians 26.7 9 10.34 210 12.8 Yes
Adm Support 28.9 2 5.71 323 27.3 Yes
Skilled Craft 39.1 89 28.99 1,125 20.9 Yes
Svc/Main 44.0 0 0.00 13 34.2 Yes
Overall 31.0 105 21.88 2,494 21.2 Yes
Division 3 Workforce Analysis as of June 2013
Source: BEACON Report B0031
White
Male
White
Female
Black
Male
Black
Female
Hisp
Male
Hisp
Female
Asian
Male
Asian
Female
AIAN
Male
AIAN
Feamle
Ethn
UnkTOT
TOT
MNRT
TOT
FEM
Employees 1 1 1
% Represented 100.00 100.00 100.00
Employees 30 14 1 2 2 49 5 16
% Represented 61.22 28.57 2.04 4.08 4.08 100.00 10.20 32.65
Employees 67 11 3 3 3 87 9 11
% Represented 77.01 12.64 3.45 3.45 3.45 100.00 10.34 12.64
Employees 3 30 1 1 35 2 31
% Represented 8.57 85.71 2.86 2.86 100.00 5.71 88.57
Employees 204 11 64 1 3 1 19 1 3 307 89 14
% Represented 66.45 3.58 20.85 0.33 0.98 0.33 6.19 0.33 0.98 100.00 28.99 4.56
Employees 1 1 1
% Represented 100.00 100.00 100.00
Employees 304 68 69 3 6 1 2 22 2 3 480 105 74
% Represented 63.33 14.17 14.38 0.63 1.25 0.21 0.42 4.58 0.42 0.63 100.00 21.88 15.42
Service and Maintenance
Overall Results
Officials and Administrators
Professional
Technicians
Administrative Support
Skilled Craft

51
Exhibit 2.4 NCDOT Highway Division 4 Workforce Analysis
Snapshot of Division 4 Females EEO Category % Females Available
(2010 Census) # and % Females
Division 4 # and % Females
NCDOT Underrepresented
Based on 2010 Census Availability
Off/Adm 38.5 0 0.00 26 29.5 Yes
Professionals 57.3 11 22.92 1,095 33.8 Yes
Technicians 66.3 8 10.0 194 11.8 Yes
Adm Support 74.5 26 89.66 955 80.6 No
Skilled Craft 16.5 5 1.37 127 2.4 Yes
Svc/Main 62.0 4 44.44 7 18.4 Yes
Overall 48.0 54 10.17 2,429 20.6 Yes
Snapshot of Division 4 Minorities EEO Category % Minorities Available
(2010 Census) # and % Minorities
Division 4 # and % Minorities
NCDOT Underrepresented
Based on 2010 Census Availability
Off/Adm 17.6 0 0.00 20 22.7 Yes
Professionals 23.0 5 10.42 783 24.3 Yes
Technicians 26.7 11 13.75 210 12.8 Yes
Adm Support 28.9 2 6.90 323 27.3 Yes
Skilled Craft 39.1 113 31.04 1,125 20.9 Yes
Svc/Main 44.0 5 55.56 13 34.2 No
Overall 31.0 136 25.61 2,494 21.2 Yes
Division 4 Workforce Analysis as of June 2013
Source: BEACON Report B0031
White
Male
White
Female
Black
Male
Black
Female
Hisp
Male
Hisp
Female
Asian
Male
Asian
Female
AIAN
Male
AIAN
Female
Ethn
UnkTOT
TOT
MNRT
TOT
FEM
Employees 1 1
% Represented 100.00 100.00
Employees 35 8 2 3 48 5 11
% Represented 72.92 16.67 4.17 6.25 100.00 10.42 22.92
Employees 61 8 9 2 80 11 8
% Represented 76.25 10.00 11.25 2.50 100.00 13.75 10.00
Employees 2 25 1 1 29 2 26
% Represented 6.90 86.21 3.45 3.45 100.00 6.90 89.66
Employees 242 3 100 1 2 1 9 6 364 113 5
% Represented 66.48 0.82 27.47 0.27 0.55 0.27 2.47 1.65 100.00 31.04 1.37
Employees 4 1 4 9 5 4
% Represented 44.44 11.11 44.44 100.00 55.56 44.44
Employees 345 44 112 8 2 1 12 1 6 531 136 54
% Represented 64.97 8.29 21.09 1.51 0.38 0.19 2.26 0.19 1.13 100.00 25.61 10.17
Service and Maintenance
Overall Results
Officials and Administrators
Professional
Technicians
Administrative Support
Skilled Craft

52
Exhibit 2.5 NCDOT Highway Division 5 Workforce Analysis
Snapshot of Division 5 Females EEO Category % Females Available
(2010 Census) # and % Females
Division 5 # and % Females
NCDOT Underrepresented
Based on 2010 Census Availability
Off/Adm 38.5 0 0.00 26 29.5 Yes
Professionals 57.3 11 17.74 1,095 33.8 Yes
Technicians 66.3 4 4.12 194 11.8 Yes
Adm Support 74.5 35 85.37 955 80.6 No
Skilled Craft 16.5 4 1.00 127 2.4 Yes
Overall 48.0 54 8.97 2,429 20.6 Yes
Snapshot of Division 5 Minorities EEO Category % Minorities Available
(2010 Census) # and % Minorities
Division 5 # and % Minorities
NCDOT Underrepresented
Based on 2010 Census Availability
Off/Adm 17.6 0 0.00 20 22.7 Yes
Professionals 23.0 15 24.19 783 24.3 No
Technicians 26.7 13 13.40 210 12.8 Yes
Adm Support 28.9 7 17.07 323 27.3 Yes
Skilled Craft 39.1 126 31.42 1,125 20.9 Yes
Overall 31.0 161 26.74 2,494 21.2 Yes
Division 5 Workforce Analysis as of June 2013
Source: BEACON Report B0031
White
Male
White
Female
Black
Male
Black
Female
Hisp
Male
Hisp
Female
Asian
Male
Asian
Female
AIAN
Male
AIAN
Feamle
Ethn
UnkTOT
TOT
MNRT
TOT
FEM
Employees 1 1
% Represented 100.00 100.00
Employees 40 7 7 4 4 62 15 11
% Represented 64.52 11.29 11.29 6.45 6.45 100.00 24.19 17.74
Employees 81 3 8 1 3 1 97 13 4
% Represented 83.51 3.09 8.25 1.03 3.09 1.03 100.00 13.40 4.12
Employees 5 28 5 2 1 41 7 35
% Represented 12.20 68.29 12.20 4.88 2.44 100.00 17.07 85.37
Employees 270 2 112 2 10 2 3 401 126 4
% Represented 67.33 0.50 27.93 0.50 2.49 0.50 0.75 100.00 31.42 1.00
Employees 397 40 127 12 10 7 3 2 4 602 161 54
% Represented 65.95 6.64 21.10 1.99 1.66 1.16 0.50 0.33 0.66 100.00 26.74 8.97
Overall Results
Officials and Administrators
Professional
Technicians
Administrative Support
Skilled Craft

53
Exhibit 2.6 NCDOT Highway Division 6 Workforce Analysis
Snapshot of Division 6 Females EEO Category % Females Available
(2010 Census) # and % Females
Division 6 # and % Females
NCDOT Underrepresented
Based on 2010 Census Availability
Off/Adm 38.5 0 0.00 26 29.5 Yes
Professionals 57.3 4 9.09 1,095 33.8 Yes
Technicians 66.3 8 10.96 194 11.8 Yes
Adm Support 74.5 28 90.32 955 80.6 No
Skilled Craft 16.5 5 1.43 127 2.4 Yes
Overall 48.0 45 9.02 2,429 20.6 Yes
Snapshot of Division 6 Minorities EEO Category % Minorities Available
(2010 Census) # and % Minorities
Division 6 # and % Minorities
NCDOT Underrepresented
Based on 2010 Census Availability
Off/Adm 17.6 0 0.00 20 22.7 Yes
Professionals 23.0 5 11.36 783 24.3 Yes
Technicians 26.7 13 17.81 210 12.8 Yes
Adm Support 28.9 3 9.68 323 27.3 Yes
Skilled Craft 39.1 119 34.00 1,125 20.9 Yes
Overall 31.0 140 28.06 2,494 21.2 Yes
Division 6 Workforce Analysis as of June 2013
Source: BEACON Report B0031
White
Male
White
Female
Black
Male
Black
Female
Hisp
Male
Hisp
Female
Asian
Male
Asian
Female
AIAN
Male
AIAN
Female
Ethn
UnkTOT
TOT
MNRT
TOT
FEM
Employees 1 1
% Represented 100.00 100.00
Employees 35 4 2 3 44 5 4
% Represented 79.55 9.09 4.55 6.82 100.00 11.36 9.09
Employees 54 6 5 2 1 5 73 13 8
% Represented 73.97 8.22 6.85 2.74 1.37 6.85 100.00 17.81 10.96
Employees 3 25 2 1 31 3 28
% Represented 9.68 80.65 6.45 3.23 100.00 9.68 90.32
Employees 231 72 2 5 1 1 36 2 350 119 5
% Represented 66.00 20.57 0.57 1.43 0.29 0.29 10.29 0.57 100.00 34.00 1.43
Employees 324 35 79 6 5 1 2 44 3 499 140 45
% Represented 64.93 7.01 15.83 1.20 1.00 0.20 0.40 8.82 0.60 100.00 28.06 9.02
Overall Results
Officials and Administrators
Professional
Technicians
Administrative Support
Skilled Craft

54
Exhibit 2.7 NCDOT Highway Division 7 Workforce Analysis
Snapshot of Division 7 Females EEO Category % Females Available
(2010 Census) # and % Females
Division 7 # and % Females
NCDOT Underrepresented
Based on 2010 Census Availability
Off/Adm 38.5 0 0.00 26 29.5 Yes
Professionals 57.3 14 23.33 1,095 33.8 Yes
Technicians 66.3 2 2.04 194 11.8 Yes
Adm Support 74.5 35 94.59 955 80.6 No
Skilled Craft 16.5 0 0.00 127 2.4 Yes
Overall 48.0 51 10.20 2,429 20.6 Yes
Snapshot of Division 7 Minorities EEO Category % Minorities Available
(2010 Census) # and % Minorities
Division 7 # and % Minorities
NCDOT Underrepresented
Based on 2010 Census Availability
Off/Adm 17.6 0 0.00 20 22.7 Yes
Professionals 23.0 13 21.67 783 24.3 Yes (slightly)
Technicians 26.7 9 9.18 210 12.8 Yes
Adm Support 28.9 9 24.32 323 27.3 Yes
Skilled Craft 39.1 75 24.67 1,125 20.9 Yes
Overall 31.0 106 21.20 2,494 21.2 Yes
Division 7 Workforce Analysis as of June 2013
Source: BEACON Report B0031
White
Male
White
Female
Black
Male
Black
Female
Hisp
Male
Hisp
Female
Asian
Male
Asian
Female
AIAN
Male
AIAN
Female
Ethn
UnkTOT
TOT
MNRT
TOT
FEM
Employees 1 1
% Represented 100.00 100.00
Employees 36 11 8 3 2 60 13 14
% Represented 60.00 18.33 13.33 5.00 3.33 100.00 21.67 23.33
Employees 86 2 6 1 2 1 98 9 2
% Represented 87.76 2.04 6.12 1.02 2.04 1.02 100.00 9.18 2.04
Employees 1 27 7 1 1 37 9 35
% Represented 2.70 72.97 18.92 2.70 2.70 100.00 24.32 94.59
Employees 229 58 17 304 75
% Represented 75.33 19.08 5.59 100.00 24.67
Employees 353 40 72 10 1 22 1 1 500 106 51
% Represented 70.60 8.00 14.40 2.00 0.20 4.40 0.20 0.20 100.00 21.20 10.20
Overall Results
Officials and Administrators
Professional
Technicians
Administrative Support
Skilled Craft

55
Exhibit 2.8 NCDOT Highway Division 8 Workforce Analysis
Snapshot of Division 8 Females EEO Category % Females Available
(2010 Census) # and % Females
Division 8 # and % Females
NCDOT Underrepresented
Based on 2010 Census Availability
Off/Adm 38.5 0 0.00 26 29.5 Yes
Professionals 57.3 7 13.46 1,095 33.8 Yes
Technicians 66.3 2 3.03 194 11.8 Yes
Adm Support 74.5 27 84.38 955 80.6 No
Skilled Craft 16.5 8 2.12 127 2.4 Yes
Svc/Main 62.0 1 100.00 7 18.4 No
Overall 48.0 45 8.51 2,429 20.6 Yes
Snapshot of Division 8 Minorities EEO Category % Minorities Available
(2010 Census) # and % Minorities
Division 8 # and % Minorities
NCDOT Underrepresented
Based on 2010 Census Availability
Off/Adm 17.6 0 0.00 20 22.7 Yes
Professionals 23.0 6 11.54 783 24.3 Yes
Technicians 26.7 7 10.61 210 12.8 Yes
Adm Support 28.9 2 6.25 323 27.3 Yes
Skilled Craft 39.1 99 26.26 1,125 20.9 Yes
Svc/Main 44.0 0 0.00 13 34.2 Yes
Overall 31.0 114 21.55 2,494 21.2 Yes
Division 8 Workforce Analysis as of June 2013
Source: BEACON Report B0031
White
Male
White
Female
Black
Male
Black
Female
Hisp
Male
Hisp
Female
Asian
Male
Asian
Female
AIAN
Male
AIAN
Female
Ethn
UnkTOT
TOT
MNRT
TOT
FEM
Employees 1 1
% Represented 100.00 100.00
Employees 38 7 5 1 1 52 6 7
% Represented 73.08 13.46 9.62 1.92 1.92 100.00 11.54 13.46
Employees 57 1 5 1 1 1 66 7 2
% Represented 86.36 1.52 7.58 1.52 1.52 1.52 100.00 10.61 3.03
Employees 5 25 2 32 2 27
% Represented 15.63 78.13 6.25 100.00 6.25 84.38
Employees 270 6 68 2 6 1 22 2 377 99 8
% Represented 71.62 1.59 18.04 0.53 1.59 0.27 5.84 0.53 100.00 26.26 2.12
Employees 1 1 1
% Represented 100.00 100.00 100.00
Employees 371 40 78 5 7 1 23 4 529 114 45
% Represented 70.13 7.56 14.74 0.95 1.32 0.19 4.35 0.76 100.00 21.55 8.51
Service and Maintenance
Overall Results
Officials and Administrators
Professional
Technicians
Administrative Support
Skilled Craft

56
Exhibit 2.9 NCDOT Highway Division 9 Workforce Analysis
Snapshot of Division 9 Females EEO Category % Females Available
(2010 Census) # and % Females
Division 9 # and % Females
NCDOT Underrepresented
Based on 2010 Census Availability
Off/Adm 38.5 0 0.00 26 29.5 Yes
Professionals 57.3 8 16.00 1,095 33.8 Yes
Technicians 66.3 7 8.64 194 11.8 Yes
Adm Support 74.5 31 86.11 955 80.6 No
Skilled Craft 16.5 16 5.42 127 2.4 Yes
Overall 48.0 62 13.39 2,429 20.6 Yes
Snapshot of Division 9 Minorities EEO Category % Minorities Available
(2010 Census) # and % Minorities
Division 9 # and % Minorities
NCDOT Underrepresented
Based on 2010 Census Availability
Off/Adm 17.6 0 0.00 20 22.7 Yes
Professionals 23.0 7 14.00 783 24.3 Yes
Technicians 26.7 11 13.58 210 12.8 Yes
Adm Support 28.9 2 5.56 323 27.3 Yes
Skilled Craft 39.1 39 13.22 1,125 20.9 Yes
Overall 31.0 59 12.74 2,494 21.2 Yes
Division 9 Workforce Analysis as of June 2013
Source: BEACON Report B0031
White
Male
White
Female
Black
Male
Black
Female
Hisp
Male
Hisp
Female
Asian
Male
Asian
Female
AIAN
Male
AIAN
Female
Ethn
UnkTOT
TOT
MNRT
TOT
FEM
Employees 1 1
% Represented 100.00 100.00
Employees 38 5 3 3 1 50 7 8
% Represented 76.00 10.00 6.00 6.00 2.00 100.00 14.00 16.00
Employees 64 6 7 2 1 1 81 11 7
% Represented 79.01 7.41 8.64 2.47 1.23 1.23 100.00 13.58 8.64
Employees 5 29 2 36 2 31
% Represented 13.89 80.56 5.56 100.00 5.56 86.11
Employees 237 14 26 1 7 4 1 5 295 39 16
% Represented 80.34 4.75 8.81 0.34 2.37 1.36 0.34 1.69 100.00 13.22 5.42
Employees 345 54 36 6 9 2 4 2 5 463 59 62
% Represented 74.51 11.66 7.78 1.30 1.94 0.43 0.86 0.43 1.08 100.00 12.74 13.39
Overall Results
Officials and Administrators
Professional
Technicians
Administrative Support
Skilled Craft

57
Exhibit 2.10 NCDOT Highway Division 10 Workforce Analysis
Snapshot of Division 10 Females EEO Category % Females Available
(2010 Census) # and % Females
Division 10 # and % Females
NCDOT Underrepresented
Based on 2010 Census Availability
Off/Adm 38.5 0 0.00 26 29.5 Yes
Professionals 57.3 12 17.91 1,095 33.8 Yes
Technicians 66.3 9 8.82 194 11.8 Yes
Adm Support 74.5 34 91.89 955 80.6 No
Skilled Craft 16.5 8 2.54 127 2.4 Yes
Svc/Main 62.0 0 0.00 7 18.4 Yes
Overall 48.0 63 12.05 2,429 20.6 Yes
Snapshot of Division 10 Minorities EEO Category % Minorities Available
(2010 Census) # and % Minorities
Division 10 # and % Minorities
NCDOT Underrepresented
Based on 2010 Census Availability
Off/Adm 17.6 1 100.00 20 22.7 No
Professionals 23.0 9 13.43 783 24.3 Yes
Technicians 26.7 14 13.73 210 12.8 Yes
Adm Support 28.9 6 16.22 323 27.3 Yes
Skilled Craft 39.1 60 19.05 1,125 20.9 Yes
Svc/Main 44.0 1 100.00 13 34.2 No
Overall 31.0 91 17.40 2,494 21.2 Yes
Division 10 Workforce Analysis as of June 2013
Source: BEACON Report B0031
White
Male
White
Female
Black
Male
Black
Female
Hisp
Male
Hisp
Female
Asian
Male
Asian
Female
AIAN
Male
AIAN
Female
Ethn
UnkTOT
TOT
MNRT
TOT
FEM
Employees 1 1 1
% Represented 100.00 100.00 100.00
Employees 50 8 4 3 1 1 67 9 12
% Represented 74.63 11.94 5.97 4.48 1.49 1.49 100.00 13.43 17.91
Employees 80 7 10 2 2 1 102 14 9
% Represented 78.43 6.86 9.80 1.96 1.96 0.98 100.00 13.73 8.82
Employees 3 28 6 37 6 34
% Represented 8.11 75.68 16.22 100.00 16.22 91.89
Employees 247 5 51 2 4 2 1 3 315 60 8
% Represented 78.41 1.59 16.19 0.63 1.27 0.63 0.32 0.95 100.00 19.05 2.54
Employees 1 1 1
% Represented 100.00 100.00 100.00
Employees 380 48 67 13 5 1 4 1 4 523 91 63
% Represented 72.66 9.18 12.81 2.49 0.96 0.19 0.76 0.19 0.76 100.00 17.40 12.05
Service and Maintenance
Overall Results
Officials and Administrators
Professional
Technicians
Administrative Support
Skilled Craft

58
Exhibit 2.11 NCDOT Highway Division 11 Workforce Analysis
Snapshot of Division 11 Females EEO Category % Females Available
(2010 Census) # and % Females
Division 11 # and % Females
NCDOT Underrepresented
Based on 2010 Census Availability
Off/Adm 38.5 0 0.00 26 29.5 Yes
Professionals 57.3 8 17.78 1,095 33.8 Yes
Technicians 66.3 7 10.61 194 11.8 Yes
Adm Support 74.5 29 80.56 955 80.6 No
Skilled Craft 16.5 12 3.07 127 2.4 Yes
Svc/Main 62.0 0 0.00 7 18.4 Yes
Overall 48.0 56 10.37 2,429 20.6 Yes
Snapshot of Division 11 Minorities EEO Category % Minorities Available
(2010 Census) # and % Minorities
Division 11 # and % Minorities
NCDOT Underrepresented
Based on 2010 Census Availability
Off/Adm 17.6 0 0.00 20 22.7 Yes
Professionals 23.0 1 2.22 783 24.3 Yes
Technicians 26.7 1 1.52 210 12.8 Yes
Adm Support 28.9 0 0.00 323 27.3 Yes
Skilled Craft 39.1 22 5.63 1,125 20.9 Yes
Svc/Main 44.0 0 0.00 13 34.2 Yes
Overall 31.0 24 4.44 2,494 21.2 Yes
Division 11 Workforce Analysis as of June 2013
Source: BEACON Report B0031
White
Male
White
Female
Black
Male
Black
Female
Hisp
Male
Hisp
Female
Asian
Male
Asian
Female
AIAN
Male
AIAN
Female
Ethn
UnkTOT
TOT
MNRT
TOT
FEM
Employees 1 1
% Represented 100.00 100.00
Employees 37 7 1 45 1 8
% Represented 82.22 15.56 2.22 100.00 2.22 17.78
Employees 58 7 1 66 1 7
% Represented 87.88 10.61 1.52 100.00 1.52 10.61
Employees 7 29 36 29
% Represented 19.44 80.56 100.00 80.56
Employees 351 10 12 2 3 5 8 391 22 12
% Represented 89.77 2.56 3.07 0.51 0.77 1.28 2.05 100.00 5.63 3.07
Employees 1 1
% Represented 100.00 100.00
Employees 455 53 12 3 3 6 8 540 24 56
% Represented 84.26 9.81 2.22 0.56 0.56 1.11 1.48 100.00 4.44 10.37
Service and Maintenance
Overall Results
Officials and Administrators
Professional
Technicians
Administrative Support
Skilled Craft

59
Exhibit 2.12 NCDOT Highway Division 12 Workforce Analysis
Snapshot of Division 12 Females EEO Category % Females Available
(2010 Census) # and % Females
Division 12 # and % Females
NCDOT Underrepresented
Based on 2010 Census Availability
Off/Adm 38.5 0 0.00 26 29.5 Yes
Professionals 57.3 9 18.37 1,095 33.8 Yes
Technicians 66.3 4 6.25 194 11.8 Yes
Adm Support 74.5 25 86.21 955 80.6 No
Skilled Craft 16.5 4 1.38 127 2.4 Yes
Svc/Main 62.0 0 0.00 7 18.4 Yes
Overall 48.0 42 9.68 2,429 20.6 Yes
Snapshot of Division 12 Minorities EEO Category % Minorities Available
(2010 Census) # and % Minorities
Division 12 # and % Minorities
NCDOT Underrepresented
Based on 2010 Census Availability
Off/Adm 17.6 0 0.00 20 22.7 Yes
Professionals 23.0 4 8.16 783 24.3 Yes
Technicians 26.7 4 6.25 210 12.8 Yes
Adm Support 28.9 2 6.90 323 27.3 Yes
Skilled Craft 39.1 28 9.66 1,125 20.9 Yes
Svc/Main 44.0 1 100.00 13 34.2 No
Overall 31.0 39 8.99 2,494 21.2 Yes
Division 12 Workforce Analysis as of June 2013
Source: BEACON Report B0031
White
Male
White
Female
Black
Male
Black
Female
Hisp
Male
Hisp
Female
Asian
Male
Asian
Female
AIAN
Male
AIAN
Female
Ethn
UnkTOT
TOT
MNRT
TOT
FEM
Employees 1 1
% Represented 100.00 100.00
Employees 36 9 2 2 49 4 9
% Represented 73.47 18.37 4.08 4.08 100.00 8.16 18.37
Employees 56 4 3 1 64 4 4
% Represented 87.50 6.25 4.69 1.56 100.00 6.25 6.25
Employees 4 23 1 1 29 2 25
% Represented 13.79 79.31 3.45 3.45 100.00 6.90 86.21
Employees 255 4 20 2 6 3 290 28 4
% Represented 87.93 1.38 6.90 0.69 2.07 1.03 100.00 9.66 1.38
Employees 1 1 1
% Represented 100.00 100.00 100.00
Employees 352 40 26 1 2 9 1 3 434 39 42
% Represented 81.11 9.22 5.99 0.23 0.46 2.07 0.23 0.69 100.00 8.99 9.68
Service and Maintenance
Overall Results
Officials and Administrators
Professional
Technicians
Administrative Support
Skilled Craft

60
Exhibit 2.13 NCDOT Highway Division 13 Workforce Analysis
Snapshot of Division 13 Females EEO Category % Females Available
(2010 Census) # and % Females
Division 13 # and % Females
NCDOT Underrepresented
Based on 2010 Census Availability
Off/Adm 38.5 0 0.00 26 29.5 Yes
Professionals 57.3 6 13.95 1,095 33.8 Yes
Technicians 66.3 7 8.54 194 11.8 Yes
Adm Support 74.5 20 76.92 955 80.6 No
Skilled Craft 16.5 8 2.12 127 2.4 Yes
Overall 48.0 41 7.74 2,429 20.6 Yes
Snapshot of Division 13 Minorities EEO Category % Minorities Available
(2010 Census) # and % Minorities
Division 13 # and % Minorities
NCDOT Underrepresented
Based on 2010 Census Availability
Off/Adm 17.6 0 0.00 20 22.7 Yes
Professionals 23.0 1 2.33 783 24.3 Yes
Technicians 26.7 3 3.66 210 12.8 Yes
Adm Support 28.9 4 15.38 323 27.3 Yes
Skilled Craft 39.1 26 6.88 1,125 20.9 Yes
Overall 31.0 34 6.42 2,494 21.2 Yes
Division 13 Workforce Analysis as of June 2013
Source: BEACON Report B0031
White
Male
White
Female
Black
Male
Black
Female
Hisp
Male
Hisp
Female
Asian
Male
Asian
Female
AIAN
Male
AIAN
Female
Ethn
UnkTOT
TOT
MNRT
TOT
FEM
Employees 1 1
% Represented 100.00 100.00
Employees 36 6 1 43 1 6
% Represented 83.72 13.95 2.33 100.00 2.33 13.95
Employees 72 7 2 1 82 3 7
% Represented 87.80 8.54 2.44 1.22 100.00 3.66 8.54
Employees 6 16 2 2 26 4 20
% Represented 23.08 61.54 7.69 7.69 100.00 15.38 76.92
Employees 344 6 10 2 14 2 378 26 8
% Represented 91.01 1.59 2.65 0.53 3.70 0.53 100.00 6.88 2.12
Employees 459 35 13 4 15 2 2 530 34 41
% Represented 86.60 6.60 2.45 0.75 2.83 0.38 0.38 100.00 6.42 7.74
Overall Results
Officials and Administrators
Professional
Technicians
Administrative Support
Skilled Craft

61
Exhibit 2.14 NCDOT Highway Division 14 Workforce Analysis
Snapshot of Division 14 Females EEO Category % Females Available
(2010 Census) # and % Females
Division 14 # and % Females
NCDOT Underrepresented
Based on 2010 Census Availability
Off/Adm 38.5 0 0.00 26 29.5 Yes
Professionals 57.3 5 10.20 1,095 33.8 Yes
Technicians 66.3 6 6.98 194 11.8 Yes
Adm Support 74.5 28 71.79 955 80.6 Yes
Skilled Craft 16.5 4 0.99 127 2.4 Yes
Svc/Main 62.0 0 0.00 7 18.4 Yes
Overall 48.0 43 7.33 2,429 20.6 Yes
Snapshot of Division 14 Minorities EEO Category % Minorities Available
(2010 Census) # and % Minorities
Division 14 # and % Minorities
NCDOT Underrepresented
Based on 2010 Census Availability
Off/Adm 17.6 0 0.00 20 22.7 Yes
Professionals 23.0 1 2.04 783 24.3 Yes
Technicians 26.7 7 8.14 210 12.8 Yes
Adm Support 28.9 0 0.00 323 27.3 Yes
Skilled Craft 39.1 29 7.14 1,125 20.9 Yes
Svc/Main 44.0 0 0.00 13 34.2 Yes
Overall 31.0 37 6.30 2,494 21.2 Yes
Division 14 Workforce Analysis as of June 2013
Source: BEACON Report B0031
White
Male
White
Female
Black
Male
Black
Female
Hisp
Male
Hisp
Female
Asian
Male
Asian
Female
AIAN
Male
AIAN
Female
Ethn
UnkTOT
TOT
MNRT
TOT
FEM
Employees 1 1
% Represented 100.00 100.00
Employees 43 5 1 49 1 5
% Represented 87.76 10.20 2.04 100.00 2.04 10.20
Employees 73 4 1 4 2 2 86 7 6
% Represented 84.88 4.65 1.16 4.65 2.33 2.33 100.00 8.14 6.98
Employees 11 28 39 28
% Represented 28.21 71.79 100.00 71.79
Employees 367 2 10 1 1 15 2 8 406 29 4
% Represented 90.39 0.49 2.46 0.25 0.25 3.69 0.49 1.97 100.00 7.14 0.99
Employees 3 3 6
% Represented 50.00 50.00 100.00
Employees 498 39 10 1 2 20 4 13 587 37 43
% Represented 84.84 6.64 1.70 0.17 0.34 3.41 0.68 2.21 100.00 6.30 7.33
Service and Maintenance
Overall Results
Officials and Administrators
Professional
Technicians
Administrative Support
Skilled Craft

62
SECTION IV
Applicant Flow Adverse Impact Analyses

63
APPLICANT FLOW
The following Tables 4.1, 4.2 and 4.3 reflecting Applicant Flow and Temporary Staff were produced in the NEOGOV and BEACON systems. NCDOT uses NEOGOV, an applicant tracking system, to track the employee recruitment and selection phases only and uses BEACON, a human resources information system, to track human resource activities and employment actions post hire. NEOGOV allows managers to post job opportunities, the public and NCDOT employees to then apply for jobs, and NCDOT’s Human Resources department to screen the applicants for eligibility and determine which applicants are “minimally qualified” and “most qualified” for the positions. When HR completes the screening process, the “minimally qualified” or simply “qualified” applications are screened out and only the applications of the “most qualified” applicants are sent to the hiring manager with race and gender information omitted for the scheduling of interviews.5 The hiring managers then interview selected candidates and select a hire from that group. With the approval of Human Resources, the most qualified applicant is offered the position. The job posting, applicant and hire information is tracked throughout the process in NEOGOV. Table 4.1 produced in NEOGOV, titled NCDOT Applicant Flow by Step for 7/1/2012 – 6/30/2013, reflects applicant flow by race, gender and hiring process steps for the period shown and indicates the percentages of female and minority applicants at each step of the process.
5 Effective October 1, 2 15 HR no longer performs the second level of screening to determine the “most qualified”
applicants pursuant to N.C.G.S. §126-1 .2. HR sends all “qualified” applicants to the hiring manager.
Table 4.1
W B H A AI Total W B H A AI Total U TOTAL
% of Non-
Min
Females Total Min % of Min
Applications Received 34736 51202 2982 1344 988 91269 45790 22187 2348 2743 1113 74181 69 165519 0.210 84907 0.513
Screened Out 24013 37287 2222 924 709 65172 31672 16639 1797 2050 788 52946 0 118923 0.202 62416 0.525
Eligible* 10723 13915 760 420 279 26097 14118 5548 551 693 325 21235 0 46596 0.230 22491 0.483
Not Referred 3864 4880 265 164 101 9274 5909 2072 205 255 97 8538 0 17076 0.226 8039 0.471
Referred 6859 9035 495 256 178 16823 8209 3476 346 438 228 12697 0 29520 0.232 14452 0.490
Hired NEOGOV 207 122 12 7 4 352 595 105 12 8 13 733 0 1085 0.191 283 0.261
Hired - BEACON 43 20 2 4 0 69 167 27 3 5 4 206 105 380 0.113 65 1.512
Sources: NEOGOV and BEACON
*Includes duplicate applications
Legend:
B=Black
H=Hispanic
W=White
AI=American Indian
A=Asian
U=Unknown
NCDOT APPLICANT FLOW by STEP for 7/1/12 - 6/30/13
Female Male

64
Table 4.2 produced in BEACON (Report #B0086), titled Temporary Staff Report for 6/30/2013, reflects temporary employees currently employed at 702. NCDOT information systems produce two different hiring numbers – one from the NEOGOV system of 1085 and one from the BEACON system of 380. The difference between these two numbers is 705 and becomes relevant here due to the definitions of “hire” in the two systems. NEOGOV defines a hire as an applicant accepting a position based on a job posting and includes all new hires including hires from other State agencies, temporary, seasonal, part-time and student co-op employees. The definition of hire in the BEACON system, however, includes only those hires new to the BEACON system. Applicants who are hired as temporary, seasonal, student co-ops or part-time hires or those hired into DOT from another State agency are not included in the BEACON definition of hires.

65
Table 4.3 produced in NEOGOV, titled NCDOT Applicant Flow by EEO Category for 7/1/2012-6/30/2013 reflects numbers of applicants by gender, race and EEO category and that 99.80% of applications were received online with the remaining .20% received in written form.

66
ADVERSE IMPACT ANALYSES
While the race/gender composition of the Department is one indicator of whether barriers exist to equal opportunity, it is not the only identifier. Another method commonly used in evaluating affirmative action programs is the Adverse Impact Analysis. Adverse Impact Analysis is a method used to evaluate the rates at which employment actions affect females and minorities. In the employment actions of hiring and promotions the analysis is made to determine if females and minorities are being selected for employment opportunities at rates significantly less than their non-minority counterparts. In the employment actions of disciplinary actions, demotions, and terminations the analysis is made to determine whether those decisions impact females and minorities at rates significantly more than their non-minority counterparts. If the analyses indicate adverse impact, the applicable processes must be further examined to determine why the adverse impact exists and then either change the processes, validate the processes or use different processes.
A selection rate for any race, sex, or ethnic group which is less than four-fifths (4/5) (or 80 percent) of the highest selection rate of any race, sex, or ethnic group will generally be regarded by the Federal enforcement agencies as evidence of adverse impact, while a selection rate greater than four-fifths the highest selection rate will generally not be regarded as evidence of adverse impact.6 For example, if there are 45,790 white male applicants for engineering positions and out of those, 167 are hired, the selection rate for white males is 0.36% (167/45790). If this is the highest selection rate for any group, then any group with a selection rate of less than four/fifths of 0.36% (0.288%) will be generally regarded as being adversely impacted (see table 4.4). Thus, since the selection rate for Asian males is 0.18% of Asian male applicants and the rate for black males is 0.12% of black male applicants, then both Asian and black males would be regarded as adversely impacted because their selection rates are less than 0.288% (80% of the highest selection rate). The Department’s Internal Equal Employment Opportunity Office (EEO) annually conducts an Adverse Impact Analysis as part of normal reporting to the FHWA. This analysis is compiled in the annual Equal Employment Opportunity Report provided to the FHWA. The Adverse Impact analyses, conducted by NCDOT’s Internal EEO department, indicate which groups have been adversely impacted by employment actions on the following tables, 4.4, 4.5, 4.6, 4.7 and 4.8. The groups that comprise less than 2% of the applicants for employment or the Department’s workforce are highlighted in gray because NCDOT is not required to conduct the Adverse Impact analysis of employment actions of these groups; however, the Internal EEO department chose to include them for awareness purposes. The groups who are adversely impacted by employment actions are indicated by a “Y” in the Adverse Impact column of each table. Further examination of the processes used in each employment action where adverse impact is indicated will be conducted. The observations and findings will be included in the regularly scheduled Annual Update Reports to FHWA. The data in BEACON is not a part of or derived from the NEOGOV system. The data is BEACON is created from NCDOT’s payroll system, human resources tracking systems, the North Carolina census information and is manipulated into reporting structures for use by all North Carolina State agencies. The NEOGOV system is separate and includes only data resulting from job postings, applications, and resulting new
6 Uniform Guidelines on Employee Selection Procedures, Section 4D

67
hires. Both systems do provide reporting by race and gender; therefore, they are useful tools in the analysis of hiring and employment activities for affirmative action purposes.
Table 4.4
Race Category
Total
Applicants Applicant % Total Hires
Selection
Rate
Ratio to
Highest
Rate
4/5 Rule
Applied
Adverse
Impact
White Males 45790 28% 167 0.36% 1.0% 1.04>.80 N
Black Males 22187 13% 27 0.12% 33% .33<.80 Y
Hispanic Males 2348 1% 3 0.13% 35% .35<.80 Y
Asian/Pacific Males 2743 2% 5 0.18% 50% .50<.80 Y
American Indian Males 1113 1% 4 0.36% 99% .99>.80 N
White Females 34736 21% 43 0.12% 34% .34<.80 Y
Black Females 51202 31% 20 0.04% 11% .11<.80 Y
Hispanic Females 2982 2% 2 0.07% 18% .18<.80 Y
Asian/Pacific Females 1344 1% 4 0.30% 82% .82>.80 N
American Indian Females 988 1% 0 0.00% 0% 0.00% Y
Total Minorities 84907 51% 65 0.08% 21% .21<.80 Y
Total Females 91269 55% 69 0.08% 21% .21<.80 Y
Total Applicants 165433 380
Source: NEOGOV Applicant Summary (includes temps, seasonal, part-time) and Beacon Report B0031 includes permanent and only new to Beacon employees.)
Table 4.5
Race Category
Total
Workforce
Workforce
Representation
Total
Promotions
Promotion
Rate %
Ratio to
Highest
Rate
4/5 Rule
Applied
Adverse
Impact
White Males 7389 63% 310 4.2% 39% .39<.80 Y
Black Males 1324 11% 28 2.1% 20% .20<.80 Y
Hispanic Males 94 1% 4 4.3% 40% .40<.80 Y
Asian/Pacific Males 140 1% 4 2.9% 27% .27<.80 Y
American Indian Males 208 2% 5 2.4% 23% .23<.80 Y
White Females 1701 14% 111 6.5% 61% .61<.80 Y
Black Females 609 5% 65 10.7% 100% 1.0>80 N
Hispanic Females 39 0% 3 7.7% 72% .72<.80 Y
Asian/Pacific Females 51 0% 4 7.8% 73% .73<.80 Y
American Indian Females 29 0% 0 0.0% 0% N/A Y
Total Minorities 4195 36% 114 2.7% 0.25 .25<.80 Y
Total Females 2429 21% 184 7.6% 0.71 .71<.80 Y
Totals 11763 298
Source: Beacon Report B0031
ADVERSE IMPACT ANALYSIS FOR AAP 2015-2019
7/1/2012 - 6/30/2013
7/1/2012 - 6/30/2013
7/1/2012 - 6/30/2013
PROMOTIONS
NEW HIRES

68
Table 4.6
Race Category
Total
Workforce*
Total
Terminations
Number
Retained
Retention
Rate
Ratio to
Highest
Rate 4/5 Rule
Adverse
Impact
White Males 7512 47 7465 99.4% 0.994 .994>.80 N
Black Males 1373 24 1349 98.3% 0.983 .983>.80 N
Hispanic Males 94 0 94 100.0% 1.000 1>.80 N
Asian/Pacific Males 136 0 136 100.0% 1.000 1>.80 N
American Indian Males 215 0 215 100.0% 1.000 1>.80 N
White Females 1765 6 1759 99.7% 0.997 .997>.80 N
Black Females 599 1 598 99.8% 0.998 .998>.80 N
Hispanic Females 43 0 43 100.0% 1.000 1>.80 N
Asian/Pacific Females 48 0 48 100.0% 1.000 1>.80 N
American Indian Females 29 0 29 100.0% 1.000 1>.80 N
Total Minorities 2537 25 2512 99.0% 0.990 .99>.80 N
Total Females 2484 6 2478 99.8% 0.998 .998>.80 N
Totals 11889
Source: Beacon Report B0006 (Included Involuntary Separations and Dismissals for gross inefficiency, unsatisfactory job performance and conduct.)
Note: Total Workforce Employed on 6/30/2012
Table 4.7
Race Category
Total
Workforce Total Actions
Number
Retained
Retention
Rate
Adverse
Impact
% of
Workforce
% of
Disciplinary
Actions Unequal
White Males 7389 229 7160 97% N 63% 61% N
Black Males 1324 81 1243 94% N 11% 21% Y
Hispanic Males 94 2 92 98% N 1% 1% N
Asian/Pacific Males 140 0 140 100% N 1% 0% N
American Indian Males 208 2 206 99% N 2% 1% N
White Females 1701 41 1660 98% N 14% 11% N
Black Females 609 21 588 97% N 5% 6% Y
Hispanic Females 39 0 39 100% N 0% 0% N
Asian/Pacific Females 51 0 51 100% N 0% 0% N
American Indian Females 29 0 29 100% N 0% 0% N
Total Minorities 2494 106 2388 96% N 21% 28% Y
Total Females 2429 62 2367 97% N 21% 16% N
Totals 11763 378
Source: Beacon Report B0051
TERMINATIONS
7/1/2012 - 6/30/2013
DISCIPLINARY ACTIONS
7/1/2012 - 6/30/2013

69
Table 4.8
Race Category Worforce Total Demotions
Number
Retained
Retention
Rate
Ratio to
Highest
Rate 4/5 Rule
Adverse
Impact
White Males 7389 2 7387 0.9997293 0.9997293 .999>.80 N
Black Males 1324 0 1324 1 1 1>.80 N
Hispanic Males 94 0 94 1 1 1>.80 N
Asian/Pacific Males 140 0 140 1 1 1>.80 N
American Indian Males 208 0 208 1 1 1>.80 N
White Females 1701 1 1700 0.9994121 0.9994121 .999>.80 N
Black Females 609 0 609 1 1 1>.80 N
Hispanic Females 39 0 39 1 1 1>.80 N
Asian/Pacific Females 51 0 51 1 1 1>.80 N
American Indian Females 29 0 29 1 1 1>.80 N
Total Minorities 2494 0 2494 1 1 1>.80 N
Total Females 2429 1 2428 0.9995883 0.9995883 .999>.80 N
11763 3 11760
Source: Beacon Report PA0002
DEMOTIONS
7/1/2012 - 6/30/2013

70
SECTION V
Representation Analysis, Goals and Timetables
Exhibit 1: Job Placement Goals-Full Calculations

71
REPRESENTATION ANALYSIS, GOALS and TIMETABLES
The Section III Workforce Analysis identifies underrepresentation in the Department by race and gender
per EEO category. The next step in the analysis is to compare the Department’s workforce to the civilian
labor force availability. The tables in this section specify for each job group the total incumbents; total
female; total minority; and total White, Black, Hispanic, Asian American, and American Indian/Alaska
Native at the start of the plan year, July 1, 2014. In addition, the tables contain the participation
percentage rate and the availability percentage rate in each job group. Finally, where the percentage
availability rate is greater than the participation rate, the number needed to reach parity is calculated as
follows:
Percentage in Category minus Percentage of Availability = Over/Under Representation x Current
Number in Workforce = Number Needed for Parity7
NCDOT uses information from the BEACON database system, which incorporates U.S. Census Bureau data, to identify the available civilian labor force in North Carolina and subsequently to analyze NCDOT’s workforce to determine whether its composition reflects the proportion of women and minorities in the State’s civilian labor force with the relevant qualifications. The workforce data provided in the tables below are composite data for the entire State of North Carolina which may not necessarily accurately reflect the composite labor force data for a particular Division within the State. County data is not readily available. In addition, the Governor’s Census Data iaison informed EEO staff that survey data was not available for counties with fewer than 50,000 residents. In each job category where underrepresentation exists, specific, measurable, attainable goals are set to enable NCDOT to remedy the underrepresentation of women and minorities in our workforce.
This analysis serves as the basis for setting minimum hiring goals to reduce underrepresentation in
each job group as well as to establish timetables to achieve the goals. The tool the Department uses
to monitor progress in reducing underrepresentation in the workforce is BEACON Report B0178-F. This
report reflects any progress made in hiring or promoting individuals into job groups identified as
having underrepresentation by comparing it with previous reports and with AAP job placement goals.
Although there is significant underrepresentation of females in the Skilled Craft category, especially
within the 14 Highway Divisions, it should be noted that finding qualified female applicants has
historically proved challenging. During the last State FY ending June 30, 2013, the Department posted
job vacancy announcements for 565 positions. Only 1,901 of the 23,378 applicants (8.13%) for these
positions were female applicants.8
Managers filling vacancies in any EEO job category where underrepresentation has been determined should make a good faith effort to ensure that effective recruitment and advertisement strategies have been used to attract female and minority applicants. The Department's Human Resources Office
7 U.S. Department of Transportation Federal Highway Administration State Internal Equal Employment Opportunity Program Desk
Reference, p. 3-95 8 Source: NEOGOV EEO Summary Report for records between 7/1/2012 – 6/30/2013

72
should closely monitor vacancies in EEO job categories to ensure positions are advertised in publications or in such a way as to maximize the vacancy announcement to potential female and/or minority applicants. Methodology for Establishing Goals and Timetables
For FFY 2015, EEO staff met with NCDOT’s Fiscal Division staff to discuss and determine a reasonable job vacancy rate for the department as a whole. Vacancy rates for full-time equivalent (FTE) employees were reviewed for the past six years. The vacancy rate averaged 11.55% over the six-year period. The average vacancy rate over the past three years was 10.04%. EEO staff learned from fiscal staff that the General Assembly has asked for an additional 2.5% reduction in staff for SFY2015. The vacancy rate for developing department-wide and department-wide excluding the Highway Divisions (hereafter DOT Other) was set at 10%. In addition, EEO staff consulted with each of the 14 Highway Divisions. The anticipated vacancy rates for 2014 for the divisions varied widely, so individual vacancy rates were used to establish job placement goals for the divisions. For FFY 2016, EEO staff provided NCDOT HR, DMV, and the 14 Highway Divisions with their average openings per classification and EEO category over a three year period.9 The business units were asked to provide estimated openings for the current fiscal year based on historical data as well as changing trends for the job classifications, budget availability, anticipated separations, etc. EEO staff then calculated the number of anticipated vacancies by dividing the total number of estimated opening in an EEO category by the total number employed in the category as of September 30, 2015. Each EEO category within each business unit had its unique vacancy rate percentage from which goals were ultimately derived. FHWA provides instructions and a formula for establishing job placement goals and timetables. Job placement goals were established using the following steps and formulas:
Determine the total number of employees in each of the eight EEO job groups for the department, DOT Other, and for the 14 Highway Divisions.
Multiply the total number of employees in each of the job groups by the percentage of anticipated vacancies. For example, the NCDOT has a total of 88 Officials and Administrators so
x 1 % = . rounded to . The calculation provides the “Number Anticipated Vacancies.” Determine the number of years planned to reach the goal. In most cases, this is 5 years as the
AAP is a 5-year rolling plan. However, where underrepresentation is small, the goal can be attained in fewer years.
Multiply the “Number Anticipated Vacancies” by the “Number Years to Reach Goal” and then divide that calculation into the “Number Needed to Reach Parity.” This calculation becomes the “Annual Placement Rate.”
Multiply the “Annual Placement Rate” by the “Number Anticipated Vacancies” to determine the annual placement goal.
Annual Placement Rate = Number Needed to Reach Parity Number Anticipated Vacancies x Number Years to Reach Goal
9 For FFY 2015, DMV was included with DOT Other. For FFY 2016 and forward, DMV was treated as a separate business unit like the 14
Highway Divisions; however, the original Affirmative Action Plan has not been edited throughout to reflect this change.

73
Annual Placement Goal = Annual Placement Rate x Number Anticipated Vacancies10 Where the number of anticipated vacancies is zero, the Annual Percentage Rate cannot be calculated, so annual placement goals are set manually. After calculating the Annual Placement Goal (APG) for the Department, DOT Other, and the 14 Highway Divisions, the APG seemed unreasonable and unattainable in many cases. EEO staff then reviewed historical data. Female workforce representation from 1990-2 1 increased as a percentage of NCDOT’s total workforce by 2.3% with an average annual increase of 0.11%. The highest annual increase for females during that 20-year period was 0.7% in 2003. Minority workforce representation from 1990-2 1 increased as a percentage of NCDOT’s total workforce by . % with an average annual increase of 0.17%. The highest annual increase for minorities during that 20-year period was 1.8% in 1993.11 To establish more reasonable, attainable goals, the APG was decreased by 80%, which is, however, significantly higher than the historic average annual increases for females and minorities. Table 5.1b below shows the Department-wide job placement goals with the reductions. Table 5.1c below shows the Department-wide job placement goals without the reductions. Focusing just on White female placement goals in the Professional, Technician, and Skilled Craft categories, the chart below shows the effect of the decrease in APG by 80%. For example, without the 80% reduction, NCDOT would be setting of goal to hire 131 females in the professional category in a year whereas only 14 were hired during SFY 2013. The job placement goal of 26 for the Professional category is aggressive as well as more reasonable and attainable.
EEO Category Job Placement Goals With 80% Reduction
Job Placement Goals Without 80% Reduction
Hired SFY 2013
Professional 26 131 14
Technician 25 124 3
Skilled Craft 14 70 0
For protected classes representing 2% or more of the available labor force and/or 2% of NCDOT’s workforce where underrepresentation exists, a goal of not less than one has been established. FHWA requires a goal to be set regardless of whether there is an opportunity. Goals have been established for White, Black, and Hispanic females and for Black and Hispanic males in various job categories. Job placement goals are not required to be established for Asian American/Pacific Islander and American Indian/Alaska Native males and females; however, in recognizing the value of a diverse and inclusive workforce, the Department and its hiring managers should note the number of positions these protected classes need in the EEO job categories in order to reach parity. Representation Analyses and Job Placement Goals
10
Source: U.S. Department of Transportation Federal Highway Administration Equal Employment Opportunity Program Desk Reference, pp.
3-105 through 3-106. 11
Sources: Data compiled by EEO staff in 2010 using BEACON Report B0035: EEO General Demographic and employee statistics available at
the time from the OSP (now OSHR) website and also using the PMXHTOT function in PMIS.

74
A representation analysis was conducted for NCDOT department-wide, DOT Other, DMV, and for all 14 NCDOT Highway Divisions. The results of the representation analyses are contained in Tables 5.1a through 5.17a. After identifying underrepresented groups, job placement goals were established for the Department, DOT Other, DMV, and for all 14 Highway Divisions. Job placement goals are contained in Tables 5.1b through 5.17b. (Full calculations are contained in Section V, Exhibit I.)
The Department, Highway Divisions, DMV, and their managers should closely monitor all positions
filled. Special attention should be focused on vacancies in the following EEO job categories with the
identified underrepresented groups:
Department-Wide
1) Officials and Administrators category for White and Hispanic females,
2) Professional category for White, Black and Hispanic females and Hispanic males,
3) Technician category for White, Black and Hispanic females,
4) Protective Services category for White, Black and Hispanic females and Black males,
5) Administrative Support category for Hispanic females and Black and Hispanic males,
6) Skilled Craft category for White, Black and Hispanic females and Hispanic males, and
7) Service and Maintenance category for White, Black and Hispanic females and Hispanic males
Department-Wide Excluding the 14 Highway Divisions
1) Officials and Administrators category for White and Hispanic females,
2) Professional category for White and Hispanic females and Hispanic males,
3) Technician category for White, Black and Hispanic females,
4) Protective Services category for White, Black and Hispanic females and Black males,
5) Administrative Support category for White and Hispanic females and Black and Hispanic males,
6) Skilled Craft category for White, Black and Hispanic females and Black and Hispanic males, and
7) Service and Maintenance category for White, Black and Hispanic females and Hispanic males
Division 1
1) Professional category for White, Black, and Hispanic females and Black males,
2) Technician category for White, Black and Hispanic females,
3) Administrative Support category for Black and Hispanic females and Black males,
4) Skilled Craft category for White, Black and Hispanic females and Hispanic males, and
5) Service and Maintenance category for White and Black females
Division 2
1) Professional category for White, Black and Hispanic females and Hispanic males,
2) Technician category for White, Black and Hispanic females,
3) Administrative Support category for Black females,
4) Skilled Craft category for White, Black and Hispanic females and Hispanic males, and
5) Service and Maintenance category for White females
Division 3
1) Professional category for White, Black and Hispanic females and Black and Hispanic males,
2) Technician category for White, Black and Hispanic females and Black males

75
3) Administrative Support category for Black and Hispanic females and Black males, and
4) Skilled Craft category for White, Black and Hispanic females and Hispanic males
Division 4
1) Professional category for White, Black and Hispanic females and Hispanic males,
2) Technician category for White, Black and Hispanic females and Hispanic males,
3) Administrative Support category for Black and Hispanic females and Black males,
4) Skilled Craft category for White, Black and Hispanic females and Hispanic males, and
5) Service and Maintenance category for White females
Division 5
1) Professional category for White, Black and Hispanic females and Hispanic males,
2) Technician category for White, Black and Hispanic females and Hispanic males,
3) Administrative Support category for Black and Hispanic females and Black males,
4) Skilled Craft category for White, Black and Hispanic females and Hispanic males
Division 6
1) Professional category for White, Black and Hispanic females and Hispanic males,
2) Technician category for White, Black and Hispanic females and Hispanic males,
3) Administrative Support category for Black and Hispanic females and Black males,
4) Skilled Craft category for White, Black and Hispanic females and Hispanic males
Division 7
1) Professional category for White, Black and Hispanic females and Hispanic males,
2) Technician category for White, Black and Hispanic females,
3) Administrative Support category for Hispanic females and Black males, and
4) Skilled Craft category for White, Black and Hispanic females and Hispanic males
Division 8
1) Professional category for White, Black and Hispanic females,
2) Technician category for White, Black and Hispanic females,
3) Administrative Support category for Black and Hispanic females and Black males, and
4) Skilled Craft category for White, Black and Hispanic females and Hispanic males
Division 9
1) Professional category for White, Black and Hispanic females and Hispanic males,
2) Technician category for White, Black and Hispanic females,
3) Administrative Support category for Black and Hispanic females and Black males, and
4) Skilled Craft category for White, Black and Hispanic females and Black and Hispanic males
Division 10
1) Professional category for White, Black and Hispanic females,
2) Technician category for White, Black and Hispanic females and Hispanic males,
3) Administrative Support category for Hispanic females and Black males, and
4) Skilled Craft category for White, Black and Hispanic females and Black and Hispanic males

76
Division 11
1) Professional category for White, Black and Hispanic females and Black and Hispanic males
2) Technician category for White, Black and Hispanic females and Black males,
3) Administrative Support category for Black and Hispanic females and Black males, and
4) Skilled Craft category for White, Black and Hispanic females and Black and Hispanic males
Division 12
1) Professional category for White, Black and Hispanic females and Hispanic males
2) Technician category for White, Black and Hispanic females and Black males,
3) Administrative Support category for Black and Hispanic females and Black males, and
4) Skilled Craft category for White, Black and Hispanic females and Black and Hispanic males
Division 13
1) Professional category for White, Black and Hispanic females and Black and Hispanic males
2) Technician category for White, Black and Hispanic females and Black and Hispanic males,
3) Administrative Support category for Black and Hispanic females and Black males, and
4) Skilled Craft category for White, Black and Hispanic females and Black and Hispanic males
Division 14
1) Professional category for White, Black and Hispanic females and Black and Hispanic males
2) Technician category for White, Black and Hispanic females and Black and Hispanic males,
3) Administrative Support category for Black and Hispanic females and Black males,
4) Skilled Craft category for White, Black and Hispanic females and Black and Hispanic males, and
5) Service and Maintenance category for White and Black females and Black males

77
Table 5.1a: Representation Analysis Department-Wide as of September 2016
Source: BEACON Report 0178-F
NCDOTWhite
Male
White
Female
Black
Male
Black
Female
Hisp
Male
Hisp
Female
Asian
Male
Asian
Female
AIAN
Male
AIAN
Female
Ethn
Unk
Total
Mnrt
Total
FemTotal
Current Number Workforce 48 16 4 5 1 4 10 21 78
Percentage in Category 61.5 20.5 5.1 6.4 0.0 0.0 1.3 0.0 0.0 0.0 5.1 12.8 26.9 100.0
Percentage of Availability 52.5 30.0 5.4 6.3 2.0 1.1 1.3 0.8 0.4 0.3 17.6 38.5
Over/Under Representation 9.0 -9.5 -0.3 0.1 -2.0 -1.1 0.0 -0.8 -0.4 -0.3 0.0 -4.8 -11.6
Number Needed to Reach Parity 0 7 0 0 2 1 0 1 0 0 0 4 9
Current Number Workforce 1,429 635 216 322 20 27 93 37 15 4 201 734 1,025 2,999
Percentage in Category 47.6 21.2 7.2 10.7 0.7 0.9 3.1 1.2 0.5 0.1 6.7 24.5 34.2 100.0
Percentage of Availability 34.5 42.5 5.1 11.1 1.3 1.9 1.6 1.3 0.2 0.5 23.0 57.3
Over/Under Representation 13.1 -21.3 2.1 -0.4 -0.6 -1.0 1.5 -0.1 0.3 -0.4 6.7 1.5 -23.1
Number Needed to Reach Parity 0 640 0 11 19 30 0 2 0 11 0 0 693
Current Number Workforce 953 118 87 28 9 1 10 3 23 2 17 163 152 1,251
Percentage in Category 76.2 9.4 7.0 2.2 0.7 0.1 0.8 0.2 1.8 0.2 1.4 13.0 12.2 100.0
Percentage of Availability 25.8 47.3 5.8 15.3 0.7 1.7 1 1.2 0.2 0.8 26.7 66.3
Over/Under Representation 50.4 -37.9 1.2 -13.1 0.0 -1.6 -0.2 -1.0 1.6 -0.6 1.4 -13.7 -54.1
Number Needed to Reach Parity 0 474 0 163 0 20 3 12 0 8 0 171 677
Current Number Workforce 141 26 12 5 3 2 8 22 31 197
Percentage in Category 71.6 13.2 6.1 2.5 1.5 0.0 1.0 0.0 0.0 0.0 4.1 11.2 15.7 100.0
Percentage of Availability 57.2 12.7 16.2 9.8 2.0 0.8 0.4 0.1 0.6 0.2 30.1 23.6
Over/Under Representation 14.4 0.5 -10.1 -7.3 -0.5 -0.8 0.6 -0.1 -0.6 -0.2 4.1 -18.9 -7.9
Number Needed to Reach Parity 0 0 20 14 1 2 0 0 1 0 0 37 15
Current Number Workforce 103 570 45 234 3 12 5 1 8 63 308 829 1,044
Percentage in Category 9.9 54.6 4.3 22.4 0.3 1.1 0.0 0.5 0.1 0.8 6.0 29.5 79.4 100.0
Percentage of Availability 16.9 54.3 6.8 16.1 1.2 2.6 0.5 1.0 0.2 0.5 28.9 74.5
Over/Under Representation -7.0 0.3 -2.5 6.3 -0.9 -1.5 -0.5 -0.5 -0.1 0.3 6.0 0.6 4.9
Number Needed to Reach Parity 73 0 26 0 10 15 5 5 1 0 0 0 0
Current Number Workforce 3,454 75 655 12 43 3 5 121 4 127 843 94 4,499
Percentage in Category 76.8 1.7 14.6 0.3 1.0 0.1 0.1 0.0 2.7 0.1 2.8 18.7 2.1 100.0
Percentage of Availability 52.7 8.3 15.9 4.9 13.0 2.6 0.9 0.5 1.1 0.2 39.1 16.5
Over/Under Representation 24.1 -6.6 -1.3 -4.6 -12.0 -2.5 -0.8 -0.5 1.6 -0.1 2.8 -20.4 -14.4
Number Needed to Reach Parity 0 298 60 208 542 114 35 22 0 5 0 916 648
Current Number Workforce 16 2 8 2 8 2 28
Percentage in Category 57.1 7.1 28.6 0.0 0.0 0.0 0.0 0.0 0.0 0.0 7.1 28.6 7.1 100.0
Percentage of Availability 20.5 35.4 10.7 19.1 5.4 5.3 1.0 1.3 0.3 0.9 44.0 62.0
Over/Under Representation 36.6 -28.3 17.9 -19.1 -5.4 -5.3 -1.0 -1.3 -0.3 -0.9 7.1 -15.4 -54.9
Number Needed to Reach Parity 0 8 0 5 2 1 0 0 0 0 0 4 15
Administrative Support
Skilled Craft
Service and Maintenance
Officials and Administrators
Professional
Technician
Protective Services

78
Table 5.1b: Department-Wide Job Placement Goals
NCDOTWhite
Male
White
Female
Black
Male
Black
Female
Hisp
Male
Hisp
Female
Asian
Male
Asian
Female
AIAN
Male
AIAN
Female
Ethn
Unk
Total
Mnrt
Total
FemTotal
Vacancy
%
Current Number Workforce 48 16 4 5 1 4 10 21 78 0.0256
Percentage in Category 61.5 20.5 5.1 6.4 0.0 0.0 1.3 0.0 0.0 0.0 5.1 12.8 26.9 100.0
Percentage of Availability 52.5 30.0 5.4 6.3 2.0 1.1 1.3 0.8 0.4 0.3 17.6 38.5
Over/Under Representation 9.0 -9.5 -0.3 0.1 -2.0 -1.1 0.0 -0.8 -0.4 -0.3 0.0 -4.8 -11.6
Number Needed to Reach Parity 0 7 0 0 2 1 0 1 0 0 0 4 9
Number Anticipated Vacancies 2
Number Years to Reach Goal 5
Annual Placement Rate 0.70 0.00 0.00 0.20 0.10 0.00 0.10 0.00 0.00 0.00 0.40 0.90
2017 Placement Goal 1 0 0 1 1 0 0 0 0 0
2018 Placement Goal 1 0 0 1 0 0 0 0 0 0
2019 Placement Goal 1 0 0 0 0 0 0 0 0 0
2020 Placement Goal 1 0 0 0 0 0 0 0 0 0
2021 Placement Goal 1 0 0 0 0 0 0 0 0 0
Current Number Workforce 1,429 635 216 322 20 27 93 37 15 4 201 734 1,025 2,999 0.0967
Percentage in Category 47.6 21.2 7.2 10.7 0.7 0.9 3.1 1.2 0.5 0.1 6.7 24.5 34.2 100.0
Percentage of Availability 34.5 42.5 5.1 11.1 1.3 1.9 1.6 1.3 0.2 0.5 23.0 57.3
Over/Under Representation 13.1 -21.3 2.1 -0.4 -0.6 -1.0 1.5 -0.1 0.3 -0.4 6.7 1.5 -23.1
Number Needed to Reach Parity 0 640 0 11 19 30 0 2 0 11 0 0 693
Number Anticipated Vacancies 290
Number Years to Reach Goal 5
Annual Placement Rate 0.44 0.00 0.01 0.01 0.02 0.00 0.00 0.00 0.01 0.00 0.00 0.48
2017 Placement Goal 26 0 1 1 1 0 0 0 0 0
2018 Placement Goal 26 0 1 1 1 0 0 0 0 0
2019 Placement Goal 26 0 1 1 1 0 0 0 0 0
2020 Placement Goal 26 0 1 1 1 0 0 0 0 0
2021 Placement Goal 26 0 1 1 2 0 0 0 0 0
Current Number Workforce 953 118 87 28 9 1 10 3 23 2 17 163 152 1,251 0.1095
Percentage in Category 76.2 9.4 7.0 2.2 0.7 0.1 0.8 0.2 1.8 0.2 1.4 13.0 12.2 100.0
Percentage of Availability 25.8 47.3 5.8 15.3 0.7 1.7 1 1.2 0.2 0.8 26.7 66.3
Over/Under Representation 50.4 -37.9 1.2 -13.1 0.0 -1.6 -0.2 -1.0 1.6 -0.6 1.4 -13.7 -54.1
Number Needed to Reach Parity 0 474 0 163 0 20 3 12 0 8 0 171 677
Number Anticipated Vacancies 137
Number Years to Reach Goal 5
Annual Placement Rate 0.69 0.00 0.24 0.00 0.03 0.00 0.02 0.00 0.01 0.00 0.25 0.99
2017 Placement Goal 19 0 7 0 1 0 0 0 0 0
2018 Placement Goal 19 0 7 0 1 0 0 0 0 0
2019 Placement Goal 19 0 7 0 1 0 0 0 0 0
2020 Placement Goal 19 0 6 0 1 0 0 0 0 0
2021 Placement Goal 19 0 6 0 1 0 0 0 0 0
Current Number Workforce 141 26 12 5 3 2 8 22 31 197 0.0812
Percentage in Category 71.6 13.2 6.1 2.5 1.5 0.0 1.0 0.0 0.0 0.0 4.1 11.2 15.7 100.0
Percentage of Availability 57.2 12.7 16.2 9.8 2.0 0.8 0.4 0.1 0.6 0.2 30.1 23.6
Over/Under Representation 14.4 0.5 -10.1 -7.3 -0.5 -0.8 0.6 -0.1 -0.6 -0.2 4.1 -18.9 -7.9
Number Needed to Reach Parity 0 0 20 14 1 2 0 0 1 0 0 37 15
Number Anticipated Vacancies 16
Number Years to Reach Goal 5
Annual Placement Rate 0.00 0.25 0.18 0.01 0.03 0.00 0.00 0.01 0.00 0.00 0.46 0.19
2017 Placement Goal 0 1 1 1 1 0 0 0 0 0
2018 Placement Goal 0 1 1 0 1 0 0 0 0 0
2019 Placement Goal 0 1 1 0 0 0 0 0 0 0
2020 Placement Goal 0 1 1 0 0 0 0 0 0 0
2021 Placement Goal 0 1 1 0 0 0 0 0 0 0
Officials and Administrators
Professional
Technician
Protective Services

79
Table 5.1b: Department-Wide Job Placement Goals (continued)
NCDOTWhite
Male
White
Female
Black
Male
Black
Female
Hisp
Male
Hisp
Female
Asian
Male
Asian
Female
AIAN
Male
AIAN
Female
Ethn
Unk
Total
Mnrt
Total
FemTotal
Vacancy
%
Current Number Workforce 103 570 45 234 3 12 5 1 8 63 308 829 1,044 0.1130
Percentage in Category 9.9 54.6 4.3 22.4 0.3 1.1 0.0 0.5 0.1 0.8 6.0 29.5 79.4 100.0
Percentage of Availability 16.9 54.3 6.8 16.1 1.2 2.6 0.5 1.0 0.2 0.5 28.9 74.5
Over/Under Representation -7.0 0.3 -2.5 6.3 -0.9 -1.5 -0.5 -0.5 -0.1 0.3 6.0 0.6 4.9
Number Needed to Reach Parity 73 0 26 0 10 15 5 5 1 0 0 0 0
Number Anticipated Vacancies 118
Number Years to Reach Goal 5
Annual Placement Rate 0.00 0.04 0.00 0.02 0.03 0.01 0.01 0.00 0.00 0.00 0.00 0.00
2017 Placement Goal 0 1 0 1 1 0 0 0 0 0
2018 Placement Goal 0 1 0 1 1 0 0 0 0 0
2019 Placement Goal 0 1 0 1 1 0 0 0 0 0
2020 Placement Goal 0 1 0 1 1 0 0 0 0 0
2021 Placement Goal 0 1 0 1 1 0 0 0 0 0
Current Number Workforce 3,454 75 655 12 43 3 5 121 4 127 843 94 4,499 0.0949
Percentage in Category 76.8 1.7 14.6 0.3 1.0 0.1 0.1 0.0 2.7 0.1 2.8 18.7 2.1 100.0
Percentage of Availability 52.7 8.3 15.9 4.9 13.0 2.6 0.9 0.5 1.1 0.2 39.1 16.5
Over/Under Representation 24.1 -6.6 -1.3 -4.6 -12.0 -2.5 -0.8 -0.5 1.6 -0.1 2.8 -20.4 -14.4
Number Needed to Reach Parity 0 298 60 208 542 114 35 22 0 5 0 916 648
Number Anticipated Vacancies 427
Number Years to Reach Goal 5
Annual Placement Rate 0.14 0.03 0.10 0.25 0.05 0.02 0.01 0.00 0.00 0.00 0.43 0.30
2017 Placement Goal 12 2 8 22 5 0 0 0 0 0
2018 Placement Goal 12 2 8 22 5 0 0 0 0 0
2019 Placement Goal 12 2 8 22 5 0 0 0 0 0
2020 Placement Goal 12 3 8 22 4 0 0 0 0 0
2021 Placement Goal 12 3 9 22 4 0 0 0 0 0
Current Number Workforce 16 2 8 2 8 2 28 0.1071
Percentage in Category 57.1 7.1 28.6 0.0 0.0 0.0 0.0 0.0 0.0 0.0 7.1 28.6 7.1 100.0
Percentage of Availability 20.5 35.4 10.7 19.1 5.4 5.3 1.0 1.3 0.3 0.9 44.0 62.0
Over/Under Representation 36.6 -28.3 17.9 -19.1 -5.4 -5.3 -1.0 -1.3 -0.3 -0.9 7.1 -15.4 -54.9
Number Needed to Reach Parity 0 8 0 5 2 1 0 0 0 0 0 4 15
Number Anticipated Vacancies 3
Number Years to Reach Goal 5
Annual Placement Rate 0.53 0.00 0.33 0.13 0.07 0.00 0.00 0.00 0.00 0.00 0.27 1.00
2017 Placement Goal 1 0 1 1 1 0 0 0 0 0
2018 Placement Goal 1 0 1 1 0 0 0 0 0 0
2019 Placement Goal 1 0 1 0 0 0 0 0 0 0
2020 Placement Goal 1 0 1 0 0 0 0 0 0 0
2021 Placement Goal 1 0 1 0 0 0 0 0 0 0
Administrative Support
Skilled Craft
Service and Maintenance

80
Table 5.1c Department-Wide Job Placement Goals Without Reductions
NCDOTWhite
Male
White
Female
Black
Male
Black
Female
Hisp
Male
Hisp
Female
Asian
Male
Asian
Female
AIAN
Male
AIAN
Female
Ethn
Unk
Total
Mnrt
Total
FemTotal
Vacancy
%
Current Number Workforce 48 16 4 5 1 4 10 21 78 0.0256
Percentage in Category 61.5 20.5 5.1 6.4 0.0 0.0 1.3 0.0 0.0 0.0 5.1 12.8 26.9 100.0
Percentage of Availability 52.5 30.0 5.4 6.3 2.0 1.1 1.3 0.8 0.4 0.3 17.6 38.5
Over/Under Representation 9.0 -9.5 -0.3 0.1 -2.0 -1.1 0.0 -0.8 -0.4 -0.3 0.0 -4.8 -11.6
Number Needed to Reach Parity 0 7 0 0 2 1 0 1 0 0 0 4 9
Number Anticipated Vacancies 2
Number Years to Reach Goal 5
Annual Placement Rate 0.70 0.00 0.00 0.20 0.10 0.00 0.10 0.00 0.00 0.00 0.40 0.90
2017 Placement Goal 1 0 0 0 0 0 0 0 0 0
2018 Placement Goal 1 0 0 0 0 0 0 0 0 0
2019 Placement Goal 1 0 0 0 0 0 0 0 0 0
2020 Placement Goal 1 0 0 0 0 0 0 0 0 0
2021 Placement Goal 1 0 0 0 0 0 0 0 0 0
Current Number Workforce 1,429 635 216 322 20 27 93 37 15 4 201 734 1,025 2,999 0.0967
Percentage in Category 47.6 21.2 7.2 10.7 0.7 0.9 3.1 1.2 0.5 0.1 6.7 24.5 34.2 100.0
Percentage of Availability 34.5 42.5 5.1 11.1 1.3 1.9 1.6 1.3 0.2 0.5 23.0 57.3
Over/Under Representation 13.1 -21.3 2.1 -0.4 -0.6 -1.0 1.5 -0.1 0.3 -0.4 6.7 1.5 -23.1
Number Needed to Reach Parity 0 640 0 11 19 30 0 2 0 11 0 0 693
Number Anticipated Vacancies 290
Number Years to Reach Goal 5
Annual Placement Rate 0.44 0.00 0.01 0.01 0.02 0.00 0.00 0.00 0.01 0.00 0.00 0.48
2017 Placement Goal 128 0 2 4 6 0 0 0 2 0
2018 Placement Goal 128 0 2 4 6 0 0 0 2 0
2019 Placement Goal 128 0 2 4 6 0 0 0 2 0
2020 Placement Goal 128 0 2 4 6 0 0 0 2 0
2021 Placement Goal 128 0 2 4 6 0 0 0 2 0
Current Number Workforce 953 118 87 28 9 1 10 3 23 2 17 163 152 1,251 0.1095
Percentage in Category 76.2 9.4 7.0 2.2 0.7 0.1 0.8 0.2 1.8 0.2 1.4 13.0 12.2 100.0
Percentage of Availability 25.8 47.3 5.8 15.3 0.7 1.7 1 1.2 0.2 0.8 26.7 66.3
Over/Under Representation 50.4 -37.9 1.2 -13.1 0.0 -1.6 -0.2 -1.0 1.6 -0.6 1.4 -13.7 -54.1
Number Needed to Reach Parity 0 474 0 163 0 20 3 12 0 8 0 171 677
Number Anticipated Vacancies 137
Number Years to Reach Goal 5
Annual Placement Rate 0.69 0.00 0.24 0.00 0.03 0.00 0.02 0.00 0.01 0.00 0.25 0.99
2017 Placement Goal 95 0 33 0 4 1 2 0 2 0
2018 Placement Goal 95 0 33 0 4 1 2 0 2 0
2019 Placement Goal 95 0 33 0 4 1 2 0 2 0
2020 Placement Goal 95 0 33 0 4 0 2 0 2 0
2021 Placement Goal 95 0 33 0 4 0 2 0 0 0
Current Number Workforce 141 26 12 5 3 2 8 22 31 197 0.0812
Percentage in Category 71.6 13.2 6.1 2.5 1.5 0.0 1.0 0.0 0.0 0.0 4.1 11.2 15.7 100.0
Percentage of Availability 57.2 12.7 16.2 9.8 2.0 0.8 0.4 0.1 0.6 0.2 30.1 23.6
Over/Under Representation 14.4 0.5 -10.1 -7.3 -0.5 -0.8 0.6 -0.1 -0.6 -0.2 4.1 -18.9 -7.9
Number Needed to Reach Parity 0 0 20 14 1 2 0 0 1 0 0 37 15
Number Anticipated Vacancies 16
Number Years to Reach Goal 5
Annual Placement Rate 0.00 0.25 0.18 0.01 0.03 0.00 0.00 0.01 0.00 0.00 0.46 0.19
2017 Placement Goal 0 4 3 0 0 0 0 0 0 0
2018 Placement Goal 0 4 3 0 0 0 0 0 0 0
2019 Placement Goal 0 4 3 0 0 0 0 0 0 0
2020 Placement Goal 0 4 3 0 0 0 0 0 0 0
2021 Placement Goal 0 4 3 0 0 0 0 0 0 0
Officials and Administrators
Professional
Technician
Protective Services

81
Table 5.1c Department-Wide Job Placement Goals Without Reductions (continued)
NCDOTWhite
Male
White
Female
Black
Male
Black
Female
Hisp
Male
Hisp
Female
Asian
Male
Asian
Female
AIAN
Male
AIAN
Female
Ethn
Unk
Total
Mnrt
Total
FemTotal
Vacancy
%
Current Number Workforce 103 570 45 234 3 12 5 1 8 63 308 829 1,044 0.1130
Percentage in Category 9.9 54.6 4.3 22.4 0.3 1.1 0.0 0.5 0.1 0.8 6.0 29.5 79.4 100.0
Percentage of Availability 16.9 54.3 6.8 16.1 1.2 2.6 0.5 1.0 0.2 0.5 28.9 74.5
Over/Under Representation -7.0 0.3 -2.5 6.3 -0.9 -1.5 -0.5 -0.5 -0.1 0.3 6.0 0.6 4.9
Number Needed to Reach Parity 73 0 26 0 10 15 5 5 1 0 0 0 0
Number Anticipated Vacancies 118
Number Years to Reach Goal 5
Annual Placement Rate 0.00 0.04 0.00 0.02 0.03 0.01 0.01 0.00 0.00 0.00 0.00 0.00
2017 Placement Goal 0 5 0 2 3 1 1 0 0 0
2018 Placement Goal 0 5 0 2 3 1 1 0 0 0
2019 Placement Goal 0 5 0 2 3 1 1 0 0 0
2020 Placement Goal 0 5 0 2 3 1 1 0 0 0
2021 Placement Goal 0 5 0 2 3 1 1 0 0 0
Current Number Workforce 3,454 75 655 12 43 3 5 121 4 127 843 94 4,499 0.0949
Percentage in Category 76.8 1.7 14.6 0.3 1.0 0.1 0.1 0.0 2.7 0.1 2.8 18.7 2.1 100.0
Percentage of Availability 52.7 8.3 15.9 4.9 13.0 2.6 0.9 0.5 1.1 0.2 39.1 16.5
Over/Under Representation 24.1 -6.6 -1.3 -4.6 -12.0 -2.5 -0.8 -0.5 1.6 -0.1 2.8 -20.4 -14.4
Number Needed to Reach Parity 0 298 60 208 542 114 35 22 0 5 0 916 648
Number Anticipated Vacancies 427
Number Years to Reach Goal 5
Annual Placement Rate 0.14 0.03 0.10 0.25 0.05 0.02 0.01 0.00 0.00 0.00 0.43 0.30
2017 Placement Goal 60 12 42 108 23 7 4 0 1 0
2018 Placement Goal 60 12 42 108 23 7 4 0 1 0
2019 Placement Goal 60 12 42 108 23 7 4 0 1 0
2020 Placement Goal 60 12 42 108 23 7 4 0 1 0
2021 Placement Goal 60 12 42 108 23 7 4 0 1 0
Current Number Workforce 16 2 8 2 8 2 28 0.1071
Percentage in Category 57.1 7.1 28.6 0.0 0.0 0.0 0.0 0.0 0.0 0.0 7.1 28.6 7.1 100.0
Percentage of Availability 20.5 35.4 10.7 19.1 5.4 5.3 1.0 1.3 0.3 0.9 44.0 62.0
Over/Under Representation 36.6 -28.3 17.9 -19.1 -5.4 -5.3 -1.0 -1.3 -0.3 -0.9 7.1 -15.4 -54.9
Number Needed to Reach Parity 0 8 0 5 2 1 0 0 0 0 0 4 15
Number Anticipated Vacancies 3
Number Years to Reach Goal 5
Annual Placement Rate 0.53 0.00 0.33 0.13 0.07 0.00 0.00 0.00 0.00 0.00 0.27 1.00
2017 Placement Goal 2 0 1 0 0 0 0 0 0 0
2018 Placement Goal 2 0 1 0 0 0 0 0 0 0
2019 Placement Goal 2 0 1 0 0 0 0 0 0 0
2020 Placement Goal 2 0 1 0 0 0 0 0 0 0
2021 Placement Goal 0 0 1 0 0 0 0 0 0 0
Administrative Support
Skilled Craft
Service and Maintenance

82
Table 5.2a: Representation Analysis of DOT Other as of September 2016
Source: BEACON Report 0178-F
DOT OtherWhite
Male
White
Female
Black
Male
Black
Female
Hisp
Male
Hisp
Female
Asian
Male
Asian
Female
AIAN
Male
AIAN
Female
Ethn
Unk
Total
Mnrt
Total
FemTotal
Current Number Workforce 33 12 4 4 1 8 16 54
Percentage in Category 61.1 22.2 7.4 7.4 0.0 0.0 0.0 0.0 0.0 0.0 1.9 14.8 29.6 100.0
Percentage of Availability 52.5 30.0 5.4 6.3 2.0 1.1 1.3 0.8 0.4 0.3 17.6 38.5
Over/Under Representation 8.6 -7.8 2.0 1.1 -2.0 -1.1 -1.3 -0.8 -0.4 -0.3 0.0 -2.8 -8.9
Number Needed to Reach Parity 0 4 0 0 1 1 1 0 0 0 0 2 5
Current Number Workforce 790 320 122 122 10 11 82 33 8 1 47 389 487 1,546
Percentage in Category 51.1 20.7 7.9 7.9 0.6 0.7 5.3 2.1 0.5 0.1 3.0 25.2 31.5 100.0
Percentage of Availability 34.5 42.5 5.1 11.1 1.3 1.9 1.6 1.3 0.2 0.5 23 57.3
Over/Under Representation 16.6 -21.8 2.8 -3.2 -0.7 -1.2 3.7 0.8 0.3 -0.4 0.0 2.2 -25.8
Number Needed to Reach Parity 0 337 0 50 10 18 0 0 0 7 0 0 399
Current Number Workforce 279 45 34 7 6 1 5 3 5 1 3 62 57 389
Percentage in Category 71.7 11.6 8.7 1.8 1.5 0.3 1.3 0.8 1.3 0.3 0.8 15.9 14.7 100.0
Percentage of Availability 25.8 47.3 5.8 15.3 0.7 1.7 1 1.2 0.2 0.8 26.7 66.3
Over/Under Representation 45.9 -35.7 2.9 -13.5 0.8 -1.4 0.3 -0.4 1.1 -0.5 0.0 -10.8 -51.6
Number Needed to Reach Parity 0 139 0 53 0 6 0 2 0 2 0 42 201
Current Number Workforce 9 3 0 3 12
Percentage in Category 75.0 25.0 0.0 0.0 0.0 0.0 0.0 0.0 0.0 0.0 0.0 0.0 25.0 100.0
Percentage of Availability 57.2 12.7 16.2 9.8 2.0 0.8 0.4 0.1 0.6 0.2 30.1 23.6
Over/Under Representation 17.8 12.3 -16.2 -9.8 -2.0 -0.8 -0.4 -0.1 -0.6 -0.2 0.0 -30.1 1.4
Number Needed to Reach Parity 0 0 2 1 0 0 0 0 0 0 0 4 0
Current Number Workforce 28 120 15 51 1 1 2 8 70 174 226
Percentage in Category 12.4 53.1 6.6 22.6 0.4 0.0 0.0 0.4 0.0 0.9 3.5 31.0 77.0 100.0
Percentage of Availability 16.9 54.3 6.8 16.1 1.2 2.6 0.5 1 0.2 0.5 28.9 74.5
Over/Under Representation -4.5 -1.2 -0.2 6.5 -0.8 -2.6 -0.5 -0.6 -0.2 0.4 0.0 2.1 2.5
Number Needed to Reach Parity -10 3 0 0 2 6 1 1 0 0 0 0 0
Current Number Workforce 365 18 36 3 3 1 6 43 18 432
Percentage in Category 84.5 4.2 8.3 0.0 0.7 0.0 0.7 0.0 0.2 0.0 1.4 10.0 4.2 100.0
Percentage of Availability 52.7 8.3 15.9 4.9 13 2.6 0.9 0.5 1.1 0.2 39.1 16.5
Over/Under Representation 31.8 -4.1 -7.6 -4.9 -12.3 -2.6 -0.2 -0.5 -0.9 -0.2 0.0 -29.1 -12.3
Number Needed to Reach Parity 0 18 33 21 53 11 1 2 4 1 0 126 53
Current Number Workforce 8 1 2 2 1 11
Percentage in Category 72.7 9.1 18.2 0.0 0.0 0.0 0.0 0.0 0.0 0.0 0.0 18.2 9.1 100.0
Percentage of Availability 20.5 35.4 10.7 19.1 5.4 5.3 1 1.3 0.3 0.9 44.0 62.0
Over/Under Representation 52.2 -26.3 7.5 -19.1 -5.4 -5.3 -1.0 -1.3 -0.3 -0.9 0.0 -25.8 -52.9
Number Needed to Reach Parity 0 3 0 2 1 1 0 0 0 0 0 3 6
Administrative Support
Skilled Craft
Service and Maintenance
Officials and Administrators
Professional
Technician
Protective Services

83
Table 5.2b: DOT Other Job Placement Goals
DOT OtherWhite
Male
White
Female
Black
Male
Black
Female
Hisp
Male
Hisp
Female
Asian
Male
Asian
Female
AIAN
Male
AIAN
Female
2017 Placement Goal 1 0 1 1 0 0 0 0 0
2018 Placement Goal 1 0 0 0 0 0 0 0 0
2019 Placement Goal 1 0 0 0 0 0 0 0 0
2020 Placement Goal 1 0 0 0 0 0 0 0 0
2021 Placement Goal 0 0 0 0 0 0 0 0 0
2017 Placement Goal 13 0 2 1 1 0 0 0 0
2018 Placement Goal 13 0 2 1 1 0 0 0 0
2019 Placement Goal 13 0 2 1 1 0 0 0 0
2020 Placement Goal 14 0 2 1 1 0 0 0 0
2021 Placement Goal 14 0 2 1 1 0 0 0 0
2017 Placement Goal 6 0 2 0 1 0 0 0 0
2018 Placement Goal 6 0 2 0 1 0 0 0 0
2019 Placement Goal 6 0 2 0 1 0 0 0 0
2020 Placement Goal 5 0 2 0 1 0 0 0 0
2021 Placement Goal 5 0 3 0 1 0 0 0 0
2017 Placement Goal 0 1 1 0 0 0 0 0 0
2018 Placement Goal 0 1 0 0 0 0 0 0 0
2019 Placement Goal 0 0 0 0 0 0 0 0 0
2020 Placement Goal 0 0 0 0 0 0 0 0 0
2021 Placement Goal 0 0 0 0 0 0 0 0 0
2017 Placement Goal 1 0 0 1 1 0 0 0 0
2018 Placement Goal 1 0 0 1 1 0 0 0 0
2019 Placement Goal 1 0 0 0 1 0 0 0 0
2020 Placement Goal 0 0 0 0 1 0 0 0 0
2021 Placement Goal 0 0 0 0 1 0 0 0 0
2017 Placement Goal 1 1 1 2 1 0 0 0 0
2018 Placement Goal 1 1 1 2 1 0 0 0 0
2019 Placement Goal 1 1 1 2 1 0 0 0 0
2020 Placement Goal 1 2 1 2 1 0 0 0 0
2021 Placement Goal 1 2 1 3 1 0 0 0 0
2017 Placement Goal 1 0 1 1 1 0 0 0 0
2018 Placement Goal 1 0 1 0 0 0 0 0 0
2019 Placement Goal 1 0 0 0 0 0 0 0 0
2020 Placement Goal 0 0 0 0 0 0 0 0 0
2021 Placement Goal 0 0 0 0 0 0 0 0 0
Administrative Support
Skilled Craft
Service and Maintenance
Officials and Administrators
Professional
Technician
Protective Services

84
Table 5.3a: Representation Analysis Division 1 as of September 2016
Source: BEACON Report 0178-F
Division 1White
Male
White
Female
Black
Male
Black
Female
Hisp
Male
Hisp
Female
Asian
Male
Asian
Fem
AIAN
Male
AIAN
Female
Ethn
Unk
Total
Mnrt
Total
FemTotal
Current Number Workforce 1 0 0 1
Percentage in Category 100.0 0.0 0.0 0.0 0.0 0.0 0.0 0.0 0.0 0.0 0.0 0.0 0.0 100.0
Percentage of Availability 52.5 30 5.4 6.3 2 1.1 1.3 0.8 0.4 0.3 17.6 38.5
Over/Under Representation 47.5 -30.0 -5.4 -6.3 -2.0 -1.1 -1.3 -0.8 -0.4 -0.3 0.0 -17.6 -38.5
Number Needed to Reach Parity 0 0 0 0 0 0 0 0 0 0 0 0 0
Current Number Workforce 32 10 1 1 1 3 11 45
Percentage in Category 71.1 22.2 2.2 2.2 2.2 0.0 0.0 0.0 0.0 0.0 0.0 6.7 24.4 100.0
Percentage of Availability 34.5 42.5 5.1 11.1 1.3 1.9 1.6 1.3 0.2 0.5 23 57.3
Over/Under Representation 36.6 -20.3 -2.9 -8.9 0.9 -1.9 -1.6 -1.3 -0.2 -0.5 0.0 -16.3 -32.9
Number Needed to Reach Parity 0 9 1 4 0 1 1 1 0 0 0 7 15
Current Number Workforce 46 2 2 2 2 50
Percentage in Category 92.0 4.0 4.0 0.0 0.0 0.0 0.0 0.0 0.0 0.0 0.0 4.0 4.0 100.0
Percentage of Availability 25.8 47.3 5.8 15.3 0.7 1.7 1 1.2 0.2 0.8 26.7 66.3
Over/Under Representation 66.2 -43.3 -1.8 -15.3 -0.7 -1.7 -1.0 -1.2 -0.2 -0.8 0.0 -22.7 -62.3
Number Needed to Reach Parity 0 22 1 8 0 1 1 1 0 0 0 11 31
Current Number Workforce 4 22 3 3 25 29
Percentage in Category 13.8 75.9 0.0 10.3 0.0 0.0 0.0 0.0 0.0 0.0 0.0 10.3 86.2 100.0
Percentage of Availability 16.9 54.3 6.8 16.1 1.2 2.6 0.5 1 0.2 0.5 28.9 74.5
Over/Under Representation -3.1 21.6 -6.8 -5.8 -1.2 -2.6 -0.5 -1.0 -0.2 -0.5 0.0 -18.6 11.7
Number Needed to Reach Parity 1 0 2 2 0 1 0 0 0 0 0 5 0
Current Number Workforce 199 2 115 2 2 2 5 121 4 327
Percentage in Category 60.9 0.6 35.2 0.6 0.6 0.0 0.0 0.0 0.6 0.0 1.5 37.0 1.2 100.0
Percentage of Availability 52.7 8.3 15.9 4.9 13 2.6 0.9 0.5 1.1 0.2 39.1 16.5
Over/Under Representation 8.2 -7.7 19.3 -4.3 -12.4 -2.6 -0.9 -0.5 -0.5 -0.2 1.5 -2.1 -15.3
Number Needed to Reach Parity 0 25 0 14 41 9 3 2 2 1 0 7 50
Current Number Workforce 2 2 2 0 4
Percentage in Category 50.0 0.0 50.0 0.0 0.0 0.0 0.0 0.0 0.0 0.0 0.0 50.0 0.0 100.0
Percentage of Availability 20.5 35.4 10.7 19.1 5.4 5.3 1 1.3 0.3 0.9 44 62
Over/Under Representation 29.5 -35.4 39.3 -19.1 -5.4 -5.3 -1.0 -1.3 -0.3 -0.9 0.0 6.0 -62.0
Number Needed to Reach Parity 0 1 0 1 0 0 0 0 0 0 0 0 2
Service and Maintenance
Officials and Administrators
Professional
Technician
Administrative Support
Skilled Craft

85
Table 5.3b: Division 1 Job Placement Goals
Division 1White
Male
White
Female
Black
Male
Black
Female
Hisp
Male
Hisp
Female
Asian
Male
Asian
Fem
AIAN
Male
AIAN
Female
2017 Placement Goal 0 0 0 0 0 0 0 0 0
2018 Placement Goal 0 0 0 0 0 0 0 0 0
2019 Placement Goal 0 0 0 0 0 0 0 0 0
2020 Placement Goal 0 0 0 0 0 0 0 0 0
2021 Placement Goal 0 0 0 0 0 0 0 0 0
2017 Placement Goal 1 1 1 0 1 0 0 0 0
2018 Placement Goal 1 0 1 0 0 0 0 0 0
2019 Placement Goal 1 0 1 0 0 0 0 0 0
2020 Placement Goal 1 0 1 0 0 0 0 0 0
2021 Placement Goal 1 0 0 0 0 0 0 0 0
2017 Placement Goal 1 1 1 0 1 0 0 0 0
2018 Placement Goal 1 0 1 0 0 0 0 0 0
2019 Placement Goal 1 0 1 0 0 0 0 0 0
2020 Placement Goal 1 0 1 0 0 0 0 0 0
2021 Placement Goal 1 0 1 0 0 0 0 0 0
2017 Placement Goal 0 1 1 0 1 0 0 0 0
2018 Placement Goal 0 1 1 0 0 0 0 0 0
2019 Placement Goal 0 0 0 0 0 0 0 0 0
2020 Placement Goal 0 0 0 0 0 0 0 0 0
2021 Placement Goal 0 0 0 0 0 0 0 0 0
2017 Placement Goal 1 0 1 2 1 0 0 0 0
2018 Placement Goal 1 0 1 2 1 0 0 0 0
2019 Placement Goal 1 0 1 2 1 0 0 0 0
2020 Placement Goal 1 0 1 2 1 0 0 0 0
2021 Placement Goal 1 0 1 2 1 0 0 0 0
2017 Placement Goal 1 0 1 0 0 0 0 0 0
2018 Placement Goal 0 0 0 0 0 0 0 0 0
2019 Placement Goal 0 0 0 0 0 0 0 0 0
2020 Placement Goal 0 0 0 0 0 0 0 0 0
2021 Placement Goal 0 0 0 0 0 0 0 0 0
Service and Maintenance
Officials and Administrators
Professional
Technician
Administrative Support
Skilled Craft

86
Table 5.4a: Representation Analysis Division 2 as of September 2016
Source: BEACON Report 0178-F
Division 2White
Male
White
Female
Black
Male
Black
Female
Hisp
Male
Hisp
Female
Asian
Male
Asian
Fem
AIAN
Male
AIAN
Female
Ethn
Unk
Total
Mnrt
Total
FemTotal
Current Number Workforce 1 0 0 1
Percentage in Category 100.0 0.0 0.0 0.0 0.0 0.0 0.0 0.0 0.0 0.0 0.0 0.0 0.0 100.0
Percentage of Availability 52.5 30 5.4 6.3 2 1.1 1.3 0.8 0.4 0.3 17.6 38.5
Over/Under Representation 47.5 -30.0 -5.4 -6.3 -2.0 -1.1 -1.3 -0.8 -0.4 -0.3 0.0 -17.6 -38.5
Number Needed to Reach Parity 0 0 0 0 0 0 0 0 0 0 0 0 0
Current Number Workforce 31 8 2 1 3 9 42
Percentage in Category 73.8 19.0 4.8 2.4 0.0 0.0 0.0 0.0 0.0 0.0 0.0 7.1 21.4 100.0
Percentage of Availability 34.5 42.5 5.1 11.1 1.3 1.9 1.6 1.3 0.2 0.5 23 57.3
Over/Under Representation 39.3 -23.5 -0.3 -8.7 -1.3 -1.9 -1.6 -1.3 -0.2 -0.5 0.0 -15.9 -35.9
Number Needed to Reach Parity 0 10 0 4 1 1 1 1 0 0 0 7 15
Current Number Workforce 37 4 6 6 4 47
Percentage in Category 78.7 8.5 12.8 0.0 0.0 0.0 0.0 0.0 0.0 0.0 0.0 12.8 8.5 100.0
Percentage of Availability 25.8 47.3 5.8 15.3 0.7 1.7 1 1.2 0.2 0.8 26.7 66.3
Over/Under Representation 52.9 -38.8 7.0 -15.3 -0.7 -1.7 -1.0 -1.2 -0.2 -0.8 0.0 -13.9 -57.8
Number Needed to Reach Parity 0 18 0 7 0 1 0 1 0 0 0 7 27
Current Number Workforce 2 22 2 3 2 5 25 31
Percentage in Category 6.5 71.0 6.5 9.7 0.0 0.0 0.0 0.0 0.0 0.0 6.5 16.1 80.6 100.0
Percentage of Availability 16.9 54.3 6.8 16.1 1.2 2.6 0.5 1 0.2 0.5 28.9 74.5
Over/Under Representation1 -10.4 16.7 -0.3 -6.4 -1.2 -2.6 -0.5 -1.0 -0.2 -0.5 0.0 -12.8 6.1
Number Needed to Reach Parity 3 0 0 2 0 1 0 0 0 0 0 4 0
Current Number Workforce 163 4 81 1 3 2 6 87 5 260
Percentage in Category 62.7 1.5 31.2 0.4 1.2 0.0 0.0 0.0 0.8 0.0 2.3 33.5 1.9 100.0
Percentage of Availability 52.7 8.3 15.9 4.9 13 2.6 0.9 0.5 1.1 0.2 39.1 16.5
Over/Under Representation 10.0 -6.8 15.3 -4.5 -11.8 -2.6 -0.9 -0.5 -0.3 -0.2 0.0 -5.6 -14.6
Number Needed to Reach Parity 0 18 0 12 31 7 2 1 1 1 0 15 38
Current Number Workforce 1 0 1 0 1
Percentage in Category 0.0 0.0 100.0 0.0 0.0 0.0 0.0 0.0 0.0 0.0 0.0 100.0 0.0 100.0
Percentage of Availability 20.5 35.4 10.7 19.1 5.4 5.3 1 1.3 0.3 0.9 44 62
Over/Under Representation -20.5 -35.4 89.3 -19.1 -5.4 -5.3 -1.0 -1.3 -0.3 -0.9 0.0 56.0 -62.0
Number Needed to Reach Parity 0 0 0 0 0 0 0 0 0 0 0 0 1
Service and Maintenance
Officials and Administrators
Professional
Technician
Administrative Support
Skilled Craft

87
Table 5.4b: Division 2 Job Placement Goals
Division 2White
Male
White
Female
Black
Male
Black
Female
Hisp
Male
Hisp
Female
Asian
Male
Asian
Fem
AIAN
Male
AIAN
Female
2017 Placement Goal 0 0 0 0 0 0 0 0 0
2018 Placement Goal 0 0 0 0 0 0 0 0 0
2019 Placement Goal 0 0 0 0 0 0 0 0 0
2020 Placement Goal 0 0 0 0 0 0 0 0 0
2021 Placement Goal 0 0 0 0 0 0 0 0 0
2017 Placement Goal 1 0 1 1 1 0 0 0 0
2018 Placement Goal 1 0 1 0 0 0 0 0 0
2019 Placement Goal 1 0 1 0 0 0 0 0 0
2020 Placement Goal 1 0 1 0 0 0 0 0 0
2021 Placement Goal 1 0 0 0 0 0 0 0 0
2017 Placement Goal 1 0 1 0 1 0 0 0 0
2018 Placement Goal 1 0 1 0 0 0 0 0 0
2019 Placement Goal 1 0 1 0 0 0 0 0 0
2020 Placement Goal 1 0 1 0 0 0 0 0 0
2021 Placement Goal 1 0 1 0 0 0 0 0 0
2017 Placement Goal 0 0 1 0 1 0 0 0 0
2018 Placement Goal 0 0 1 0 0 0 0 0 0
2019 Placement Goal 0 0 0 0 0 0 0 0 0
2020 Placement Goal 0 0 0 0 0 0 0 0 0
2021 Placement Goal 0 0 0 0 0 0 0 0 0
2017 Placement Goal 1 0 1 1 1 0 0 0 0
2018 Placement Goal 1 0 1 1 1 0 0 0 0
2019 Placement Goal 1 0 1 1 1 0 0 0 0
2020 Placement Goal 1 0 1 1 1 0 0 0 0
2021 Placement Goal 1 0 1 2 1 0 0 0 0
2017 Placement Goal 0 0 0 0 0 0 0 0 0
2018 Placement Goal 0 0 0 0 0 0 0 0 0
2019 Placement Goal 0 0 0 0 0 0 0 0 0
2020 Placement Goal 0 0 0 0 0 0 0 0 0
2021 Placement Goal 0 0 0 0 0 0 0 0 0
Service and Maintenance
Officials and Administrators
Professional
Technician
Administrative Support
Skilled Craft

88
Table 5.5a: Representation Analysis Division 3 as of September 2016
Source: BEACON Report 0178-F
Division 3White
Male
White
Female
Black
Male
Black
Female
Hisp
Male
Hisp
Female
Asian
Male
Asian
Fem
AIAN
Male
AIAN
Female
Ethn
Unk
Total
Mnrt
Total
FemTotal
Current Number Workforce 1 0 1 1
Percentage in Category 0.0 100.0 0.0 0.0 0.0 0.0 0.0 0.0 0.0 0.0 0.0 0.0 100.0 100.0
Percentage of Availability 52.5 30 5.4 6.3 2 1.1 1.3 0.8 0.4 0.3 17.6 38.5
Over/Under Representation -52.5 70.0 -5.4 -6.3 -2.0 -1.1 -1.3 -0.8 -0.4 -0.3 0.0 -17.6 61.5
Number Needed to Reach Parity 1 0 0 0 0 0 0 0 0 0 0 0 0
Current Number Workforce 30 9 2 2 1 5 11 44
Percentage in Category 68.2 20.5 0.0 4.5 0.0 0.0 4.5 0.0 2.3 0.0 0.0 11.4 25.0 100.0
Percentage of Availability 34.5 42.5 5.1 11.1 1.3 1.9 1.6 1.3 0.2 0.5 23 57.3
Over/Under Representation 33.7 -22.0 -5.1 -6.6 -1.3 -1.9 2.9 -1.3 2.1 -0.5 0.0 -11.6 -32.3
Number Needed to Reach Parity 0 10 2 3 1 1 0 1 0 0 0 5 14
Current Number Workforce 45 9 4 2 3 9 9 63
Percentage in Category 71.4 14.3 6.3 0.0 3.2 0.0 0.0 0.0 4.8 0.0 0.0 14.3 14.3 100.0
Percentage of Availability 25.8 47.3 5.8 15.3 0.7 1.7 1 1.2 0.2 0.8 26.7 66.3
Over/Under Representation 45.6 -33.0 0.5 -15.3 2.5 -1.7 -1.0 -1.2 4.6 -0.8 0.0 -12.4 -52.0
Number Needed to Reach Parity 0 21 0 10 0 1 1 1 0 1 0 8 33
Current Number Workforce 5 27 1 1 2 28 34
Percentage in Category 14.7 79.4 2.9 0.0 0.0 2.9 0.0 0.0 0.0 0.0 0.0 5.9 82.4 100.0
Percentage of Availability 16.9 54.3 6.8 16.1 1.2 2.6 0.5 1 0.2 0.5 28.9 74.5
Over/Under Representation -2.2 25.1 -3.9 -16.1 -1.2 0.3 -0.5 -1.0 -0.2 -0.5 0.0 -23.0 7.9
Number Needed to Reach Parity 1 0 1 5 0 0 0 0 0 0 0 8 0
Current Number Workforce 166 9 43 2 1 12 1 1 59 11 235
Percentage in Category 70.6 3.8 18.3 0.0 0.9 0.4 0.0 0.0 5.1 0.4 0.4 25.1 4.7 100.0
Percentage of Availability 52.7 8.3 15.9 4.9 13 2.6 0.9 0.5 1.1 0.2 39.1 16.5
Over/Under Representation 17.9 -4.5 2.4 -4.9 -12.1 -2.2 -0.9 -0.5 4.0 0.2 0.0 -14.0 -11.8
Number Needed to Reach Parity 11 0 12 29 5 2 1 0 0 0 33 28
Officials and Administrators
Professional
Technician
Administrative Support
Skilled Craft

89
Table 5.5b: Division 3 Job Placement Goals
Division 3White
Male
White
Female
Black
Male
Black
Female
Hisp
Male
Hisp
Female
Asian
Male
Asian
Fem
AIAN
Male
AIAN
Female
2017 Placement Goal 0 0 0 0 0 0 0 0 0
2018 Placement Goal 0 0 0 0 0 0 0 0 0
2019 Placement Goal 0 0 0 0 0 0 0 0 0
2020 Placement Goal 0 0 0 0 0 0 0 0 0
2021 Placement Goal 0 0 0 0 0 0 0 0 0
2017 Placement Goal 1 1 1 1 1 0 0 0 0
2018 Placement Goal 1 1 1 0 0 0 0 0 0
2019 Placement Goal 1 0 1 0 0 0 0 0 0
2020 Placement Goal 1 0 0 0 0 0 0 0 0
2021 Placement Goal 1 0 0 0 0 0 0 0 0
2017 Placement Goal 1 0 1 0 1 0 0 0 0
2018 Placement Goal 1 0 1 0 0 0 0 0 0
2019 Placement Goal 1 0 1 0 0 0 0 0 0
2020 Placement Goal 1 0 1 0 0 0 0 0 0
2021 Placement Goal 1 0 1 0 0 0 0 0 0
2017 Placement Goal 0 1 1 0 0 0 0 0 0
2018 Placement Goal 0 0 1 0 0 0 0 0 0
2019 Placement Goal 0 0 1 0 0 0 0 0 0
2020 Placement Goal 0 0 1 0 0 0 0 0 0
2021 Placement Goal 0 0 1 0 0 0 0 0 0
2017 Placement Goal 1 0 1 1 1 0 0 0 0
2018 Placement Goal 1 0 1 1 1 0 0 0 0
2019 Placement Goal 1 0 1 1 1 0 0 0 0
2020 Placement Goal 1 0 1 1 1 0 0 0 0
2021 Placement Goal 1 0 1 2 1 0 0 0 0
Officials and Administrators
Professional
Technician
Administrative Support
Skilled Craft

90
Table 5.6a: Representation Analysis Division 4 as of September 2016
Source: BEACON Report 0178-F
Division 4White
Male
White
Female
Black
Male
Black
Female
Hisp
Male
Hisp
Female
Asian
Male
Asian
Fem
AIAN
Male
AIAN
Female
Ethn
Unk
Total
Mnrt
Total
FemTotal
Current Number Workforce 1 0 0 1
Percentage in Category 100.0 0.0 0.0 0.0 0.0 0.0 0.0 0.0 0.0 0.0 0.0 0.0 0.0 100.0
Percentage of Availability 52.5 30 5.4 6.3 2 1.1 1.3 0.8 0.4 0.3 17.6 38.5
Over/Under Representation 47.5 -30.0 -5.4 -6.3 -2.0 -1.1 -1.3 -0.8 -0.4 -0.3 0.0 -17.6 -38.5
Number Needed to Reach Parity 0 0 0 0 0 0 0 0 0 0 0 0 0
Current Number Workforce 33 8 1 1 2 9 43
Percentage in Category 76.7 18.6 2.3 2.3 0.0 0.0 0.0 0.0 0.0 0.0 0.0 4.7 20.9 100.0
Percentage of Availability 34.5 42.5 5.1 11.1 1.3 1.9 1.6 1.3 0.2 0.5 23 57.3
Over/Under Representation 42.2 -23.9 -2.8 -8.8 -1.3 -1.9 -1.6 -1.3 -0.2 -0.5 0.0 -18.3 -36.4
Number Needed to Reach Parity 0 10 1 4 1 1 1 1 0 0 0 8 16
Current Number Workforce 41 5 7 1 8 5 54
Percentage in Category 75.9 9.3 13.0 0.0 0.0 0.0 0.0 0.0 1.9 0.0 0.0 14.8 9.3 100.0
Percentage of Availability 25.8 47.3 5.8 15.3 0.7 1.7 1 1.2 0.2 0.8 26.7 66.3
Over/Under Representation 50.1 -38.0 7.2 -15.3 -0.7 -1.7 -1.0 -1.2 1.7 -0.8 0.0 -11.9 -57.0
Number Needed to Reach Parity 0 21 0 8 0 1 1 1 0 0 0 6 31
Current Number Workforce 2 19 0 19 21
Percentage in Category 9.5 90.5 0.0 0.0 0.0 0.0 0.0 0.0 0.0 0.0 0.0 0.0 90.5 100.0
Percentage of Availability 16.9 54.3 6.8 16.1 1.2 2.6 0.5 1 0.2 0.5 28.9 74.5
Over/Under Representation -7.4 36.2 -6.8 -16.1 -1.2 -2.6 -0.5 -1.0 -0.2 -0.5 0.0 -28.9 16.0
Number Needed to Reach Parity 2 0 1 3 0 1 0 0 0 0 0 6 0
Current Number Workforce 212 4 80 1 2 1 6 5 90 6 311
Percentage in Category 68.2 1.3 25.7 0.3 0.6 0.3 0.0 0.0 1.9 0.0 1.6 28.9 1.9 100.0
Percentage of Availability 52.7 8.3 15.9 4.9 13 2.6 0.9 0.5 1.1 0.2 39.1 16.5
Over/Under Representation 15.5 -7.0 9.8 -4.6 -12.4 -2.3 -0.9 -0.5 0.8 -0.2 0.0 -10.2 -14.6
Number Needed to Reach Parity 0 22 0 14 38 7 3 2 0 1 0 32 45
Current Number Workforce 3 0 0 3
Percentage in Category 100.0 0.0 0.0 0.0 0.0 0.0 0.0 0.0 0.0 0.0 0.0 0.0 0.0 100.0
Percentage of Availability 20.5 35.4 10.7 19.1 5.4 5.3 1 1.3 0.3 0.9 44 62
Over/Under Representation 79.5 -35.4 -10.7 -19.1 -5.4 -5.3 -1.0 -1.3 -0.3 -0.9 0.0 -44.0 -62.0
Number Needed to Reach Parity 0 1 0 1 0 0 0 0 0 0 0 1 2
Service and Maintenance
Officials and Administrators
Professional
Technician
Administrative Support
Skilled Craft

91
Table 5.6b: Division 4 Job Placement Goals
Division 4White
Male
White
Female
Black
Male
Black
Female
Hisp
Male
Hisp
Female
Asian
Male
Asian
Fem
AIAN
Male
AIAN
Female
2017 Placement Goal 0 0 0 0 0 0 0 0 0
2018 Placement Goal 0 0 0 0 0 0 0 0 0
2019 Placement Goal 0 0 0 0 0 0 0 0 0
2020 Placement Goal 0 0 0 0 0 0 0 0 0
2021 Placement Goal 0 0 0 0 0 0 0 0 0
2017 Placement Goal 1 1 1 1 1 0 0 0 0
2018 Placement Goal 1 0 1 0 0 0 0 0 0
2019 Placement Goal 1 0 1 0 0 0 0 0 0
2020 Placement Goal 1 0 1 0 0 0 0 0 0
2021 Placement Goal 1 0 0 0 0 0 0 0 0
2017 Placement Goal 1 0 1 0 1 0 0 0 0
2018 Placement Goal 1 0 1 0 0 0 0 0 0
2019 Placement Goal 1 0 1 0 0 0 0 0 0
2020 Placement Goal 1 0 1 0 0 0 0 0 0
2021 Placement Goal 1 0 1 0 0 0 0 0 0
2017 Placement Goal 0 1 1 0 1 0 0 0 0
2018 Placement Goal 0 0 1 0 0 0 0 0 0
2019 Placement Goal 0 0 1 0 0 0 0 0 0
2020 Placement Goal 0 0 0 0 0 0 0 0 0
2021 Placement Goal 0 0 0 0 0 0 0 0 0
2017 Placement Goal 1 0 1 2 1 0 0 0 0
2018 Placement Goal 1 0 1 2 1 0 0 0 0
2019 Placement Goal 1 0 1 2 1 0 0 0 0
2020 Placement Goal 1 0 1 2 1 0 0 0 0
2021 Placement Goal 1 0 1 2 1 0 0 0 0
2017 Placement Goal 1 0 1 0 0 0 0 0 0
2018 Placement Goal 0 0 0 0 0 0 0 0 0
2019 Placement Goal 0 0 0 0 0 0 0 0 0
2020 Placement Goal 0 0 0 0 0 0 0 0 0
2021 Placement Goal 0 0 0 0 0 0 0 0 0
Service and Maintenance
Officials and Administrators
Professional
Technician
Administrative Support
Skilled Craft

92
Table 5.7a: Representation Analysis Division 5 as of September 2016
Source: BEACON Report 0178-F
Division 5White
Male
White
Female
Black
Male
Black
Female
Hisp
Male
Hisp
Female
Asian
Male
Asian
Fem
AIAN
Male
AIAN
Female
Ethn
Unk
Total
Mnrt
Total
FemTotal
Current Number Workforce 1 0 0 1
Percentage in Category 100.0 0.0 0.0 0.0 0.0 0.0 0.0 0.0 0.0 0.0 0.0 0.0 0.0 100.0
Percentage of Availability 52.5 30 5.4 6.3 2 1.1 1.3 0.8 0.4 0.3 17.6 38.5
Over/Under Representation 47.5 -30.0 -5.4 -6.3 -2.0 -1.1 -1.3 -0.8 -0.4 -0.3 0.0 -17.6 -38.5
Number Needed to Reach Parity 0 0 0 0 0 0 0 0 0 0 0 0 0
Current Number Workforce 46 7 3 1 1 1 3 9 9 62
Percentage in Category 74.2 11.3 4.8 1.6 1.6 1.6 4.8 0.0 0.0 0.0 0.0 14.5 14.5 100.0
Percentage of Availability 34.5 42.5 5.1 11.1 1.3 1.9 1.6 1.3 0.2 0.5 23 57.3
Over/Under Representation 39.7 -31.2 -0.3 -9.5 0.3 -0.3 3.2 -1.3 -0.2 -0.5 0.0 -8.5 -42.8
Number Needed to Reach Parity 0 19 0 6 0 0 0 1 0 0 0 5 27
Current Number Workforce 47 5 4 2 3 1 3 10 7 65
Percentage in Category 72.3 7.7 6.2 3.1 0.0 0.0 4.6 0.0 1.5 0.0 4.6 15.4 10.8 100.0
Percentage of Availability 25.8 47.3 5.8 15.3 0.7 1.7 1 1.2 0.2 0.8 26.7 66.3
Over/Under Representation 46.5 -39.6 0.4 -12.2 -0.7 -1.7 3.6 -1.2 1.3 -0.8 4.6 -11.3 -55.5
Number Needed to Reach Parity 0 26 0 8 0 1 0 1 0 1 0 7 36
Current Number Workforce 1 23 6 2 1 8 31 33
Percentage in Category 3.0 69.7 0.0 18.2 0.0 0.0 0.0 0.0 0.0 6.1 3.0 24.2 93.9 100.0
Percentage of Availability 16.9 54.3 6.8 16.1 1.2 2.6 0.5 1 0.2 0.5 28.9 74.5
Over/Under Representation -13.9 15.4 -6.8 2.1 -1.2 -2.6 -0.5 -1.0 -0.2 5.6 0.0 -4.7 19.4
Number Needed to Reach Parity 5 0 2 0 0 1 0 0 0 0 0 2 0
Current Number Workforce 212 1 83 8 2 9 93 1 315
Percentage in Category 67.3 0.3 26.3 0.0 2.5 0.0 0.0 0.0 0.6 0.0 2.9 29.5 0.3 100.0
Percentage of Availability 52.7 8.3 15.9 4.9 13 2.6 0.9 0.5 1.1 0.2 39.1 16.5
Over/Under Representation 14.6 -8.0 10.4 -4.9 -10.5 -2.6 -0.9 -0.5 -0.5 -0.2 0.0 -9.6 -16.2
Number Needed to Reach Parity 0 25 0 15 33 8 3 2 1 1 0 30 51
Skilled Craft
Officials and Administrators
Professional
Technician
Administrative Support

93
Table 5.7b: Division 5 Job Placement Goals
Division 5White
Male
White
Female
Black
Male
Black
Female
Hisp
Male
Hisp
Female
Asian
Male
Asian
Fem
AIAN
Male
AIAN
Female
2017 Placement Goal 0 0 0 0 0 0 0 0 0
2018 Placement Goal 0 0 0 0 0 0 0 0 0
2019 Placement Goal 0 0 0 0 0 0 0 0 0
2020 Placement Goal 0 0 0 0 0 0 0 0 0
2021 Placement Goal 0 0 0 0 0 0 0 0 0
2017 Placement Goal 1 0 1 0 0 0 0 0 0
2018 Placement Goal 1 0 1 0 0 0 0 0 0
2019 Placement Goal 1 0 1 0 0 0 0 0 0
2020 Placement Goal 1 0 1 0 0 0 0 0 0
2021 Placement Goal 1 0 1 0 0 0 0 0 0
2017 Placement Goal 1 0 1 0 1 0 0 0 0
2018 Placement Goal 1 0 1 0 0 0 0 0 0
2019 Placement Goal 1 0 1 0 0 0 0 0 0
2020 Placement Goal 1 0 1 0 0 0 0 0 0
2021 Placement Goal 1 0 1 0 0 0 0 0 0
2017 Placement Goal 0 1 0 0 1 0 0 0 0
2018 Placement Goal 0 1 0 0 0 0 0 0 0
2019 Placement Goal 0 0 0 0 0 0 0 0 0
2020 Placement Goal 0 0 0 0 0 0 0 0 0
2021 Placement Goal 0 0 0 0 0 0 0 0 0
2017 Placement Goal 1 0 1 1 1 0 0 0 0
2018 Placement Goal 1 0 1 1 1 0 0 0 0
2019 Placement Goal 1 0 1 1 1 0 0 0 0
2020 Placement Goal 1 0 1 2 1 0 0 0 0
2021 Placement Goal 1 0 1 2 1 0 0 0 0
Skilled Craft
Officials and Administrators
Professional
Technician
Administrative Support

94
Table 5.8a: Representation Analysis Division 6 as of September 2016
Source: BEACON Report 0178-F
Division 6White
Male
White
Female
Black
Male
Black
Female
Hisp
Male
Hisp
Female
Asian
Male
Asian
Fem
AIAN
Male
AIAN
Female
Ethn
Unk
Total
Mnrt
Total
FemTotal
Current Number Workforce 1 0 0 1
Percentage in Category 100.0 0.0 0.0 0.0 0.0 0.0 0.0 0.0 0.0 0.0 0.0 0.0 0.0 100.0
Percentage of Availability 52.5 30 5.4 6.3 2 1.1 1.3 0.8 0.4 0.3 17.6 38.5
Over/Under Representation 47.5 -30.0 -5.4 -6.3 -2.0 -1.1 -1.3 -0.8 -0.4 -0.3 0.0 -17.6 -38.5
Number Needed to Reach Parity 0 0 0 0 0 0 0 0 0 0 0 0 0
Current Number Workforce 36 4 5 1 2 8 5 48
Percentage in Category 75.0 8.3 10.4 2.1 0.0 0.0 0.0 0.0 4.2 0.0 0.0 16.7 10.4 100.0
Percentage of Availability 34.5 42.5 5.1 11.1 1.3 1.9 1.6 1.3 0.2 0.5 23 57.3
Over/Under Representation 40.5 -34.2 5.3 -9.0 -1.3 -1.9 -1.6 -1.3 4.0 -0.5 0.0 -6.3 -46.9
Number Needed to Reach Parity 0 16 0 4 1 1 1 1 0 0 0 3 23
Current Number Workforce 34 5 6 1 1 3 11 6 50
Percentage in Category 68.0 10.0 12.0 2.0 0.0 0.0 2.0 0.0 6.0 0.0 0.0 22.0 12.0 100.0
Percentage of Availability 25.8 47.3 5.8 15.3 0.7 1.7 1 1.2 0.2 0.8 26.7 66.3
Over/Under Representation 42.2 -37.3 6.2 -13.3 -0.7 -1.7 1.0 -1.2 5.8 -0.8 0.0 -4.7 -54.3
Number Needed to Reach Parity 0 19 0 7 0 1 0 1 0 0 0 2 27
Current Number Workforce 2 19 2 1 1 3 22 25
Percentage in Category 8.0 76.0 0.0 8.0 0.0 0.0 0.0 0.0 0.0 4.0 4.0 12.0 88.0 100.0
Percentage of Availability 16.9 54.3 6.8 16.1 1.2 2.6 0.5 1 0.2 0.5 28.9 74.5
Over/Under Representation -8.9 21.7 -6.8 -8.1 -1.2 -2.6 -0.5 -1.0 -0.2 3.5 4.0 -16.9 13.5
Number Needed to Reach Parity 2 0 2 2 0 1 0 0 0 0 0 4 0
Current Number Workforce 189 49 2 4 1 1 25 1 3 83 4 275
Percentage in Category 68.7 0.0 17.8 0.7 1.5 0.4 0.4 0.0 9.1 0.4 1.1 30.2 1.5 100.0
Percentage of Availability 52.7 8.3 15.9 4.9 13.0 2.6 0.9 0.5 1.1 0.2 39.1 16.5
Over/Under Representation 16.0 -8.3 1.9 -4.2 -11.5 -2.2 -0.5 -0.5 8.0 0.2 1.1 -8.9 -15.0
Number Needed to Reach Parity 0 23 0 11 32 6 1 1 0 0 0 25 41
Skilled Craft
Officials and Administrators
Professional
Technician
Administrative Support

95
Table 5.8b: Division 6 Job Placement Goals
Division 6White
Male
White
Female
Black
Male
Black
Female
Hisp
Male
Hisp
Female
Asian
Male
Asian
Fem
AIAN
Male
AIAN
Female
2017 Placement Goal 0 0 0 0 0 0 0 0 0
2018 Placement Goal 0 0 0 0 0 0 0 0 0
2019 Placement Goal 0 0 0 0 0 0 0 0 0
2020 Placement Goal 0 0 0 0 0 0 0 0 0
2021 Placement Goal 0 0 0 0 0 0 0 0 0
2017 Placement Goal 1 0 1 1 1 0 0 0 0
2018 Placement Goal 1 0 1 0 0 0 0 0 0
2019 Placement Goal 1 0 1 0 0 0 0 0 0
2020 Placement Goal 1 0 1 0 0 0 0 0 0
2021 Placement Goal 1 0 0 0 0 0 0 0 0
2017 Placement Goal 1 0 1 0 1 0 0 0 0
2018 Placement Goal 1 0 1 0 0 0 0 0 0
2019 Placement Goal 1 0 1 0 0 0 0 0 0
2020 Placement Goal 1 0 1 0 0 0 0 0 0
2021 Placement Goal 1 0 1 0 0 0 0 0 0
2017 Placement Goal 0 1 1 0 1 0 0 0 0
2018 Placement Goal 0 1 1 0 0 0 0 0 0
2019 Placement Goal 0 0 0 0 0 0 0 0 0
2020 Placement Goal 0 0 0 0 0 0 0 0 0
2021 Placement Goal 0 0 0 0 0 0 0 0 0
2017 Placement Goal 1 0 1 1 1 0 0 0 0
2018 Placement Goal 1 0 1 1 1 0 0 0 0
2019 Placement Goal 1 0 1 1 1 0 0 0 0
2020 Placement Goal 1 0 1 1 1 0 0 0 0
2021 Placement Goal 1 0 1 2 1 0 0 0 0
Skilled Craft
Officials and Administrators
Professional
Technician
Administrative Support

96
Table 5.9a: Representation Analysis Division 7 as of September 2016
Source: BEACON Report 0178-F
Division 7White
Male
White
Female
Black
Male
Black
Female
Hisp
Male
Hisp
Female
Asian
Male
Asian
Fem
AIAN
Male
AIAN
Female
Ethn
Unk
Total
Mnrt
Total
FemTotal
Current Number Workforce 1 0 0 1
Percentage in Category 100.0 0.0 0.0 0.0 0.0 0.0 0.0 0.0 0.0 0.0 0.0 0.0 0.0 100.0
Percentage of Availability 52.5 30 5.4 6.3 2 1.1 1.3 0.8 0.4 0.3 17.6 38.5
Over/Under Representation 47.5 -30.0 -5.4 -6.3 -2.0 -1.1 -1.3 -0.8 -0.4 -0.3 0.0 -17.6 -38.5
Number Needed to Reach Parity 0 0 0 0 0 0 0 0 0 0 0 0 0
Current Number Workforce 28 10 8 4 1 13 14 51
Percentage in Category 54.9 19.6 15.7 7.8 0.0 0.0 0.0 0.0 2.0 0.0 0.0 25.5 27.5 100.0
Percentage of Availability 34.5 42.5 5.1 11.1 1.3 1.9 1.6 1.3 0.2 0.5 23 57.3
Over/Under Representation 20.4 -22.9 10.6 -3.3 -1.3 -1.9 -1.6 -1.3 1.8 -0.5 0.0 2.5 -29.8
Number Needed to Reach Parity 0 12 0 2 1 1 1 1 0 0 0 0 15
Current Number Workforce 69 2 3 2 1 5 2 77
Percentage in Category 89.6 2.6 3.9 0.0 0.0 0.0 0.0 0.0 2.6 0.0 1.3 6.5 2.6 100.0
Percentage of Availability 25.8 47.3 5.8 15.3 0.7 1.7 1 1.2 0.2 0.8 26.7 66.3
Over/Under Representation 63.8 -44.7 -1.9 -15.3 -0.7 -1.7 -1.0 -1.2 2.4 -0.8 0.0 -20.2 -63.7
Number Needed to Reach Parity 0 34 1 12 1 1 1 1 0 1 0 16 49
Current Number Workforce 1 25 3 1 4 28 30
Percentage in Category 3.3 83.3 0.0 10.0 0.0 0.0 0.0 0.0 3.3 0.0 0.0 13.3 93.3 100.0
Percentage of Availability 16.9 54.3 6.8 16.1 1.2 2.6 0.5 1 0.2 0.5 28.9 74.5
Over/Under Representation -13.6 29.0 -6.8 -6.1 -1.2 -2.6 -0.5 -1.0 3.1 -0.5 0.0 -15.6 18.8
Number Needed to Reach Parity 5 0 2 2 0 1 0 0 0 0 0 5 0
Current Number Workforce 181 44 13 2 57 0 240
Percentage in Category 75.4 0.0 18.3 0.0 0.0 0.0 0.0 0.0 5.4 0.0 0.8 23.8 0.0 100.0
Percentage of Availability 52.7 8.3 15.9 4.9 13 2.6 0.9 0.5 1.1 0.2 39.1 16.5
Over/Under Representation 22.7 -8.3 2.4 -4.9 -13.0 -2.6 -0.9 -0.5 4.3 -0.2 0.8 -15.4 -16.5
Number Needed to Reach Parity 0 20 0 12 31 6 2 1 0 0 0 37 40
Skilled Craft
Officials and Administrators
Professional
Technician
Administrative Support

97
Table 5.9b: Division 7 Job Placement Goals
Division 7White
Male
White
Female
Black
Male
Black
Female
Hisp
Male
Hisp
Female
Asian
Male
Asian
Fem
AIAN
Male
AIAN
Female
2017 Placement Goal 0 0 0 0 0 0 0 0 0
2018 Placement Goal 0 0 0 0 0 0 0 0 0
2019 Placement Goal 0 0 0 0 0 0 0 0 0
2020 Placement Goal 0 0 0 0 0 0 0 0 0
2021 Placement Goal 0 0 0 0 0 0 0 0 0
2017 Placement Goal 1 0 1 1 1 0 0 0 0
2018 Placement Goal 1 0 1 0 0 0 0 0 0
2019 Placement Goal 1 0 0 0 0 0 0 0 0
2020 Placement Goal 1 0 0 0 0 0 0 0 0
2021 Placement Goal 1 0 0 0 0 0 0 0 0
2017 Placement Goal 1 1 1 1 1 0 0 0 0
2018 Placement Goal 1 0 1 0 0 0 0 0 0
2019 Placement Goal 1 0 1 0 0 0 0 0 0
2020 Placement Goal 2 0 1 0 0 0 0 0 0
2021 Placement Goal 2 0 1 0 0 0 0 0 0
2017 Placement Goal 0 1 1 0 1 0 0 0 0
2018 Placement Goal 0 1 1 0 0 0 0 0 0
2019 Placement Goal 0 0 0 0 0 0 0 0 0
2020 Placement Goal 0 0 0 0 0 0 0 0 0
2021 Placement Goal 0 0 0 0 0 0 0 0 0
2017 Placement Goal 1 0 1 1 1 0 0 0 0
2018 Placement Goal 1 0 1 1 1 0 0 0 0
2019 Placement Goal 1 0 1 1 1 0 0 0 0
2020 Placement Goal 1 0 1 1 1 0 0 0 0
2021 Placement Goal 1 0 1 2 1 0 0 0 0
Skilled Craft
Officials and Administrators
Professional
Technician
Administrative Support

98
Table 5.10a: Representation Analysis Division 8 as of September 2016
Source: BEACON Report 0178-F
Division 8White
Male
White
Female
Black
Male
Black
Female
Hisp
Male
Hisp
Female
Asian
Male
Asian
Fem
AIAN
Male
AIAN
Female
Ethn
Unk
Total
Mnrt
Total
FemTotal
Current Number Workforce 37 5 3 1 1 1 5 6 48
Percentage in Category 77.1 10.4 6.3 0.0 2.1 2.1 0.0 0.0 0.0 0.0 2.1 10.4 12.5 100.0
Percentage of Availability 34.5 42.5 5.1 11.1 1.3 1.9 1.6 1.3 0.2 0.5 23 57.3
Over/Under Representation 42.6 -32.1 1.2 -11.1 0.8 0.2 -1.6 -1.3 -0.2 -0.5 0.0 -12.6 -44.8
Number Needed to Reach Parity 0 15 0 5 0 0 1 1 0 0 0 6 22
Current Number Workforce 48 1 4 1 5 2 54
Percentage in Category 88.9 1.9 7.4 1.9 0.0 0.0 0.0 0.0 0.0 0.0 0.0 9.3 3.7 100.0
Percentage of Availability 25.8 47.3 5.8 15.3 0.7 1.7 1 1.2 0.2 0.8 26.7 66.3
Over/Under Representation 63.1 -45.4 1.6 -13.4 -0.7 -1.7 -1.0 -1.2 -0.2 -0.8 0.0 -17.4 -62.6
Number Needed to Reach Parity 0 25 0 7 0 1 1 1 0 0 0 9 34
Current Number Workforce 5 23 0 23 28
Percentage in Category 17.9 82.1 0.0 0.0 0.0 0.0 0.0 0.0 0.0 0.0 0.0 0.0 82.1 100.0
Percentage of Availability 16.9 54.3 6.8 16.1 1.2 2.6 0.5 1 0.2 0.5 28.9 74.5
Over/Under Representation 1.0 27.8 -6.8 -16.1 -1.2 -2.6 -0.5 -1.0 -0.2 -0.5 0.0 -28.9 7.6
Number Needed to Reach Parity 0 0 2 5 0 1 0 0 0 0 0 8 0
Current Number Workforce 229 4 48 1 5 22 2 76 5 311
Percentage in Category 73.6 1.3 15.4 0.3 1.6 0.0 0.0 0.0 7.1 0.0 0.6 24.4 1.6 100.0
Percentage of Availability 52.7 8.3 15.9 4.9 13 2.6 0.9 0.5 1.1 0.2 39.1 16.5
Over/Under Representation 20.9 -7.0 -0.5 -4.6 -11.4 -2.6 -0.9 -0.5 6.0 -0.2 0.0 -14.7 -14.9
Number Needed to Reach Parity 0 22 1 14 35 8 3 2 0 1 0 46 46
Current Number Workforce 1 0 1 1
Percentage in Category 0.0 100.0 0.0 0.0 0.0 0.0 0.0 0.0 0.0 0.0 0.0 0.0 100.0 100.0
Percentage of Availability 20.5 35.4 10.7 19.1 5.4 5.3 1 1.3 0.3 0.9 44 62
Over/Under Representation -20.5 64.6 -10.7 -19.1 -5.4 -5.3 -1.0 -1.3 -0.3 -0.9 0.0 -44.0 38.0
Number Needed to Reach Parity 0 0 0 0 0 0 0 0 0 0 0 0 0
Service and Maintenance
Professional
Technician
Administrative Support
Skilled Craft

99
Table 5.10b: Division 8 Job Placement Goals
Division 8White
Male
White
Female
Black
Male
Black
Female
Hisp
Male
Hisp
Female
Asian
Male
Asian
Fem
AIAN
Male
AIAN
Female
2017 Placement Goal 1 0 1 0 0 0 0 0 0
2018 Placement Goal 1 0 1 0 0 0 0 0 0
2019 Placement Goal 1 0 1 0 0 0 0 0 0
2020 Placement Goal 1 0 1 0 0 0 0 0 0
2021 Placement Goal 1 0 1 0 0 0 0 0 0
2017 Placement Goal 1 0 1 0 1 0 0 0 0
2018 Placement Goal 1 0 1 0 0 0 0 0 0
2019 Placement Goal 1 0 1 0 0 0 0 0 0
2020 Placement Goal 1 0 1 0 0 0 0 0 0
2021 Placement Goal 1 0 1 0 0 0 0 0 0
2017 Placement Goal 0 1 1 0 1 0 0 0 0
2018 Placement Goal 0 1 1 0 0 0 0 0 0
2019 Placement Goal 0 0 1 0 0 0 0 0 0
2020 Placement Goal 0 0 1 0 0 0 0 0 0
2021 Placement Goal 0 0 1 0 0 0 0 0 0
2017 Placement Goal 1 1 1 1 1 0 0 0 0
2018 Placement Goal 1 0 1 1 1 0 0 0 0
2019 Placement Goal 1 0 1 1 1 0 0 0 0
2020 Placement Goal 1 0 1 2 1 0 0 0 0
2021 Placement Goal 1 0 1 2 1 0 0 0 0
2017 Placement Goal 0 0 0 0 0 0 0 0 0
2018 Placement Goal 0 0 0 0 0 0 0 0 0
2019 Placement Goal 0 0 0 0 0 0 0 0 0
2020 Placement Goal 0 0 0 0 0 0 0 0 0
2021 Placement Goal 0 0 0 0 0 0 0 0 0
Service and Maintenance
Professional
Technician
Administrative Support
Skilled Craft

100
Table 5.11a: Representation Analysis Division 9 as of September 2016
Source: BEACON Report 0178-F
Division 9White
Male
White
Female
Black
Male
Black
Female
Hisp
Male
Hisp
Female
Asian
Male
Asian
Female
AIAN
Male
AIAN
Female
Ethn
Unk
Total
Mnrt
Total
FemaleTotal
Current Number Workforce 1 0 0 1
Percentage in Category 100.0 0.0 0.0 0.0 0.0 0.0 0.0 0.0 0.0 0.0 0.0 0.0 0.0 100.0
Percentage of Availability 52.5 30 5.4 6.3 2 1.1 1.3 0.8 0.4 0.3 17.6 38.5
Over/Under Representation 47.5 -30.0 -5.4 -6.3 -2.0 -1.1 -1.3 -0.8 -0.4 -0.3 0.0 -17.6 -38.5
Number Needed to Reach Parity 0 0 0 0 0 0 0 0 0 0 0 0 0
Current Number Workforce 36 6 2 4 1 2 1 10 11 52
Percentage in Category 69.2 11.5 3.8 7.7 0.0 1.9 3.8 0.0 1.9 0.0 0.0 19.2 21.2 100.0
Percentage of Availability 34.5 42.5 5.1 11.1 1.3 1.9 1.6 1.3 0.2 0.5 23 57.3
Over/Under Representation 34.7 -31.0 -1.3 -3.4 -1.3 0.0 2.2 -1.3 1.7 -0.5 0.0 -3.8 -36.1
Number Needed to Reach Parity 0 16 1 2 1 0 0 1 0 0 0 2 19
Current Number Workforce 54 4 6 1 1 7 4 66
Percentage in Category 81.8 6.1 9.1 0.0 1.5 0.0 0.0 0.0 0.0 0.0 1.5 10.6 6.1 100.0
Percentage of Availability 25.8 47.3 5.8 15.3 0.7 1.7 1 1.2 0.2 0.8 26.7 66.3
Over/Under Representation 56.0 -41.2 3.3 -15.3 0.8 -1.7 -1.0 -1.2 -0.2 -0.8 1.5 -16.1 -60.2
Number Needed to Reach Parity 0 27 0 10 0 1 1 1 0 1 0 11 40
Current Number Workforce 5 26 3 1 3 29 35
Percentage in Category 14.3 74.3 0.0 8.6 0.0 0.0 0.0 0.0 0.0 0.0 2.9 8.6 82.9 100.0
Percentage of Availability 16.9 54.3 6.8 16.1 1.2 2.6 0.5 1 0.2 0.5 28.9 74.5
Over/Under Representation -2.6 20.0 -6.8 -7.5 -1.2 -2.6 -0.5 -1.0 -0.2 -0.5 2.9 -20.3 8.4
Number Needed to Reach Parity 1 0 2 3 0 1 0 0 0 0 0 7 0
Current Number Workforce 197 9 20 1 7 3 14 31 10 251
Percentage in Category 78.5 3.6 8.0 0.4 2.8 0.0 0.0 0.0 1.2 0.0 5.6 12.4 4.0 100.0
Percentage of Availability 52.7 8.3 15.9 4.9 13 2.6 0.9 0.5 1.1 0.2 39.1 16.5
Over/Under Representation 25.8 -4.7 -7.9 -4.5 -10.2 -2.6 -0.9 -0.5 0.1 -0.2 5.6 -26.7 -12.5
Number Needed to Reach Parity 0 12 20 11 26 7 2 1 0 1 0 67 31
Current Number Workforce 1 1 1 1 0 3
Percentage in Category 33.3 0.0 33.3 0.0 0.0 0.0 0.0 0.0 0.0 0.0 33.3 33.3 0.0 100.0
Percentage of Availability 20.5 35.4 10.7 19.1 5.4 5.3 1 1.3 0.3 0.9 44 62
Over/Under Representation 12.8 -35.4 22.6 -19.1 -5.4 -5.3 -1.0 -1.3 -0.3 -0.9 33.3 -10.7 -62.0
Number Needed to Reach Parity 0 1 0 1 0 0 0 0 0 0 0 0 2
Service and Maintenance
Officials and Administrators
Professional
Technician
Administrative Support
Skilled Craft

101
Table 5.11b: Division 9 Job Placement Goals
Division 9White
Male
White
Female
Black
Male
Black
Female
Hisp
Male
Hisp
Female
Asian
Male
Asian
Female
AIAN
Male
AIAN
Female
2017 Placement Goal 0 0 0 0 0 0 0 0 0
2018 Placement Goal 0 0 0 0 0 0 0 0 0
2019 Placement Goal 0 0 0 0 0 0 0 0 0
2020 Placement Goal 0 0 0 0 0 0 0 0 0
2021 Placement Goal 0 0 0 0 0 0 0 0 0
2017 Placement Goal 1 1 1 1 0 0 0 0 0
2018 Placement Goal 1 0 1 0 0 0 0 0 0
2019 Placement Goal 1 0 0 0 0 0 0 0 0
2020 Placement Goal 1 0 0 0 0 0 0 0 0
2021 Placement Goal 1 0 0 0 0 0 0 0 0
2017 Placement Goal 1 0 1 0 1 0 0 0 0
2018 Placement Goal 1 0 1 0 0 0 0 0 0
2019 Placement Goal 1 0 1 0 0 0 0 0 0
2020 Placement Goal 1 0 1 0 0 0 0 0 0
2021 Placement Goal 2 0 1 0 0 0 0 0 0
2017 Placement Goal 0 1 1 0 1 0 0 0 0
2018 Placement Goal 0 1 1 0 0 0 0 0 0
2019 Placement Goal 0 0 1 0 0 0 0 0 0
2020 Placement Goal 0 0 0 0 0 0 0 0 0
2021 Placement Goal 0 0 0 0 0 0 0 0 0
2017 Placement Goal 1 1 1 1 1 0 0 0 0
2018 Placement Goal 1 1 1 1 1 0 0 0 0
2019 Placement Goal 1 1 1 1 1 0 0 0 0
2020 Placement Goal 1 1 1 1 1 0 0 0 0
2021 Placement Goal 1 1 1 1 1 0 0 0 0
2017 Placement Goal 1 0 1 0 0 0 0 0 0
2018 Placement Goal 0 0 0 0 0 0 0 0 0
2019 Placement Goal 0 0 0 0 0 0 0 0 0
2020 Placement Goal 0 0 0 0 0 0 0 0 0
2021 Placement Goal 0 0 0 0 0 0 0 0 0
Service and Maintenance
Officials and Administrators
Professional
Technician
Administrative Support
Skilled Craft

102
Table 5.12a: Representation Analysis Division 10 as of September 2016
Source: BEACON Report 0178-F
Division 10White
Male
White
Female
Black
Male
Black
Female
Hisp
Male
Hisp
Female
Asian
Male
Asian
Female
AIAN
Male
AIAN
Female
Ethn
Unk
Total
Mnrt
Total
FemaleTotal
Current Number Workforce 1 0 0 1
Percentage in Category 0.0 0.0 0.0 0.0 0.0 0.0 0.0 0.0 0.0 0.0 100.0 0.0 0.0 100.0
Percentage of Availability 52.5 30 5.4 6.3 2 1.1 1.3 0.8 0.4 0.3 17.6 38.5
Over/Under Representation -52.5 -30.0 -5.4 -6.3 -2.0 -1.1 -1.3 -0.8 -0.4 -0.3 100.0 -17.6 -38.5
Number Needed to Reach Parity 1 0 0 0 0 0 0 0 0 0 0 0 0
Current Number Workforce 39 6 6 4 1 3 8 14 13 67
Percentage in Category 58.2 9.0 9.0 6.0 1.5 0.0 0.0 4.5 0.0 0.0 11.9 20.9 19.4 100.0
Percentage of Availability 34.5 42.5 5.1 11.1 1.3 1.9 1.6 1.3 0.2 0.5 23 57.3
Over/Under Representation 23.7 -33.5 3.9 -5.1 0.2 -1.9 -1.6 3.2 -0.2 -0.5 11.9 -2.1 -37.9
Number Needed to Reach Parity 0 22 0 3 0 1 1 0 0 0 0 1 25
Current Number Workforce 52 5 8 2 2 6 12 7 75
Percentage in Category 69.3 6.7 10.7 2.7 0.0 0.0 0.0 0.0 2.7 0.0 8.0 16.0 9.3 100.0
Percentage of Availability 25.8 47.3 5.8 15.3 0.7 1.7 1 1.2 0.2 0.8 26.7 66.3
Over/Under Representation 43.5 -40.6 4.9 -12.6 -0.7 -1.7 -1.0 -1.2 2.5 -0.8 8.0 -10.7 -57.0
Number Needed to Reach Parity 0 30 0 9 1 1 1 1 0 1 0 8 43
Current Number Workforce 2 25 5 2 1 7 32 35
Percentage in Category 5.7 71.4 0.0 14.3 0.0 5.7 0.0 0.0 0.0 0.0 2.9 20.0 91.4 100.0
Percentage of Availability 16.9 54.3 6.8 16.1 1.2 2.6 0.5 1 0.2 0.5 28.9 74.5
Over/Under Representation -11.2 17.1 -6.8 -1.8 -1.2 3.1 -0.5 -1.0 -0.2 -0.5 2.9 -8.9 16.9
Number Needed to Reach Parity 4 0 2 1 0 0 0 0 0 0 0 3 0
Current Number Workforce 195 3 26 1 3 1 1 29 32 5 259
Percentage in Category 75.3 1.2 10.0 0.4 1.2 0.0 0.0 0.0 0.4 0.4 11.2 12.4 1.9 100.0
Percentage of Availability 52.7 8.3 15.9 4.9 13 2.6 0.9 0.5 1.1 0.2 39.1 16.5
Over/Under Representation 22.6 -7.1 -5.9 -4.5 -11.8 -2.6 -0.9 -0.5 -0.7 0.2 11.2 -26.7 -14.6
Number Needed to Reach Parity 0 18 15 12 31 7 2 1 2 0 0 69 38
Current Number Workforce 1 1 0 1
Percentage in Category 0.0 0.0 100.0 0.0 0.0 0.0 0.0 0.0 0.0 0.0 0.0 100.0 0.0 100.0
Percentage of Availability 20.5 35.4 10.7 19.1 5.4 5.3 1 1.3 0.3 0.9 44 62
Over/Under Representation -20.5 -35.4 89.3 -19.1 -5.4 -5.3 -1.0 -1.3 -0.3 -0.9 0.0 56.0 -62.0
Number Needed to Reach Parity 0 0 0 0 0 0 0 0 0 0 0 0 1
Service and Maintenance
Officials and Administrators
Professional
Technician
Administrative Support
Skilled Craft

103
Table 5.12b: Division 10 Job Placement Goals
Division 10White
Male
White
Female
Black
Male
Black
Female
Hisp
Male
Hisp
Female
Asian
Male
Asian
Female
AIAN
Male
AIAN
Female
2017 Placement Goal 0 0 0 0 0 0 0 0 0
2018 Placement Goal 0 0 0 0 0 0 0 0 0
2019 Placement Goal 0 0 0 0 0 0 0 0 0
2020 Placement Goal 0 0 0 0 0 0 0 0 0
2021 Placement Goal 0 0 0 0 0 0 0 0 0
2017 Placement Goal 1 0 1 0 1 0 0 0 0
2018 Placement Goal 1 0 1 0 0 0 0 0 0
2019 Placement Goal 1 0 1 0 0 0 0 0 0
2020 Placement Goal 1 0 0 0 0 0 0 0 0
2021 Placement Goal 1 0 0 0 0 0 0 0 0
2017 Placement Goal 1 0 1 1 1 0 0 0 0
2018 Placement Goal 1 0 1 0 0 0 0 0 0
2019 Placement Goal 1 0 1 0 0 0 0 0 0
2020 Placement Goal 1 0 1 0 0 0 0 0 0
2021 Placement Goal 2 0 1 0 0 0 0 0 0
2017 Placement Goal 0 1 1 0 0 0 0 0 0
2018 Placement Goal 0 1 0 0 0 0 0 0 0
2019 Placement Goal 0 0 0 0 0 0 0 0 0
2020 Placement Goal 0 0 0 0 0 0 0 0 0
2021 Placement Goal 0 0 0 0 0 0 0 0 0
2017 Placement Goal 1 1 1 1 1 0 0 0 0
2018 Placement Goal 1 1 1 1 1 0 0 0 0
2019 Placement Goal 1 1 1 1 1 0 0 0 0
2020 Placement Goal 1 1 1 1 1 0 0 0 0
2021 Placement Goal 1 1 1 2 1 0 0 0 0
2017 Placement Goal 0 0 0 0 0 0 0 0 0
2018 Placement Goal 0 0 0 0 0 0 0 0 0
2019 Placement Goal 0 0 0 0 0 0 0 0 0
2020 Placement Goal 0 0 0 0 0 0 0 0 0
2021 Placement Goal 0 0 0 0 0 0 0 0 0
Service and Maintenance
Officials and Administrators
Professional
Technician
Administrative Support
Skilled Craft

104
Table 5.13a: Representation Analysis Division 11 as of September 2016
Source: BEACON Report 0178-F
Division 11White
Male
White
Female
Black
Male
Black
Female
Hisp
Male
Hisp
Female
Asian
Male
Asian
Female
AIAN
Male
AIAN
Female
Ethn
Unk
Total
Mnrt
Total
FemaleTotal
Current Number Workforce 1 0 0 1
Percentage in Category 100.0 0.0 0.0 0.0 0.0 0.0 0.0 0.0 0.0 0.0 0.0 0.0 0.0 100.0
Percentage of Availability 52.5 30 5.4 6.3 2 1.1 1.3 0.8 0.4 0.3 17.6 38.5
Over/Under Representation 47.5 -30.0 -5.4 -6.3 -2.0 -1.1 -1.3 -0.8 -0.4 -0.3 0.0 -17.6 -38.5
Number Needed to Reach Parity 0 0 0 0 0 0 0 0 0 0 0 0 0
Current Number Workforce 33 6 1 1 7 40
Percentage in Category 82.5 15.0 0.0 2.5 0.0 0.0 0.0 0.0 0.0 0.0 0.0 2.5 17.5 100.0
Percentage of Availability 34.5 42.5 5.1 11.1 1.3 1.9 1.6 1.3 0.2 0.5 23 57.3
Over/Under Representation 48.0 -27.5 -5.1 -8.6 -1.3 -1.9 -1.6 -1.3 -0.2 -0.5 0.0 -20.5 -39.8
Number Needed to Reach Parity 0 11 2 3 1 1 1 1 0 0 0 8 16
Current Number Workforce 47 6 1 1 1 6 55
Percentage in Category 85.5 10.9 0.0 0.0 0.0 0.0 0.0 0.0 1.8 0.0 1.8 1.8 10.9 100.0
Percentage of Availability 25.8 47.3 5.8 15.3 0.7 1.7 1 1.2 0.2 0.8 26.7 66.3
Over/Under Representation 59.7 -36.4 -5.8 -15.3 -0.7 -1.7 -1.0 -1.2 1.6 -0.8 1.8 -24.9 -55.4
Number Needed to Reach Parity 0 20 3 8 0 1 1 1 0 0 0 14 30
Current Number Workforce 5 19 0 19 24
Percentage in Category 20.8 79.2 0.0 0.0 0.0 0.0 0.0 0.0 0.0 0.0 0.0 0.0 79.2 100.0
Percentage of Availability 16.9 54.3 6.8 16.1 1.2 2.6 0.5 1 0.2 0.5 28.9 74.5
Over/Under Representation 3.9 24.9 -6.8 -16.1 -1.2 -2.6 -0.5 -1.0 -0.2 -0.5 0.0 -28.9 4.7
Number Needed to Reach Parity 0 0 2 4 0 1 0 0 0 0 0 7 0
Current Number Workforce 301 8 6 1 1 2 23 10 9 342
Percentage in Category 88.0 2.3 1.8 0.3 0.3 0.0 0.0 0.0 0.6 0.0 6.7 2.9 2.6 100.0
Percentage of Availability 52.7 8.3 15.9 4.9 13 2.6 0.9 0.5 1.1 0.2 39.1 16.5
Over/Under Representation 35.3 -6.0 -14.1 -4.6 -12.7 -2.6 -0.9 -0.5 -0.5 -0.2 6.7 -36.2 -13.9
Number Needed to Reach Parity 0 20 48 16 43 9 3 2 2 1 0 124 47
Officials and Administrators
Professional
Technician
Administrative Support
Skilled Craft

105
Table 5.13b: Division 11 Job Placement Goals
Division 11White
Male
White
Female
Black
Male
Black
Female
Hisp
Male
Hisp
Female
Asian
Male
Asian
Female
AIAN
Male
AIAN
Female
2017 Placement Goal 0 0 0 0 0 0 0 0 0
2018 Placement Goal 0 0 0 0 0 0 0 0 0
2019 Placement Goal 0 0 0 0 0 0 0 0 0
2020 Placement Goal 0 0 0 0 0 0 0 0 0
2021 Placement Goal 0 0 0 0 0 0 0 0 0
2017 Placement Goal 1 1 1 1 1 0 0 0 0
2018 Placement Goal 1 1 1 0 0 0 0 0 0
2019 Placement Goal 1 0 1 0 0 0 0 0 0
2020 Placement Goal 1 0 0 0 0 0 0 0 0
2021 Placement Goal 1 0 0 0 0 0 0 0 0
2017 Placement Goal 1 1 1 0 1 0 0 0 0
2018 Placement Goal 1 1 1 0 0 0 0 0 0
2019 Placement Goal 1 1 1 0 0 0 0 0 0
2020 Placement Goal 1 0 1 0 0 0 0 0 0
2021 Placement Goal 1 0 1 0 0 0 0 0 0
2017 Placement Goal 0 1 1 0 1 0 0 0 0
2018 Placement Goal 0 1 1 0 0 0 0 0 0
2019 Placement Goal 0 0 1 0 0 0 0 0 0
2020 Placement Goal 0 0 1 0 0 0 0 0 0
2021 Placement Goal 0 0 0 0 0 0 0 0 0
2017 Placement Goal 1 2 1 2 1 0 0 0 0
2018 Placement Goal 1 2 1 2 1 0 0 0 0
2019 Placement Goal 1 2 1 2 1 0 0 0 0
2020 Placement Goal 1 2 1 2 1 0 0 0 0
2021 Placement Goal 1 2 1 1 1 0 0 0 0
Officials and Administrators
Professional
Technician
Administrative Support
Skilled Craft

106
Table 5.14a: Representation Analysis Division 12 as of September 2016
Source: BEACON Report 0178-F
Division 12White
Male
White
Female
Black
Male
Black
Female
Hisp
Male
Hisp
Female
Asian
Male
Asian
Female
AIAN
Male
AIAN
Fem
Ethn
Unk
Total
Mnrt
Total
FemaleTotal
Current Number Workforce 1 0 0 1
Percentage in Category 100.0 0.0 0.0 0.0 0.0 0.0 0.0 0.0 0.0 0.0 0.0 0.0 0.0 100.0
Percentage of Availability 52.5 30 5.4 6.3 2 1.1 1.3 0.8 0.4 0.3 17.6 38.5
Over/Under Representation 47.5 -30.0 -5.4 -6.3 -2.0 -1.1 -1.3 -0.8 -0.4 -0.3 0.0 -17.6 -38.5
Number Needed to Reach Parity 0 0 0 0 0 0 0 0 0 0 0 0 0
Current Number Workforce 36 8 2 1 1 4 8 48
Percentage in Category 75.0 16.7 4.2 0.0 0.0 0.0 2.1 0.0 2.1 0.0 0.0 8.3 16.7 100.0
Percentage of Availability 34.5 42.5 5.1 11.1 1.3 1.9 1.6 1.3 0.2 0.5 23 57.3
Over/Under Representation 40.5 -25.8 -0.9 -11.1 -1.3 -1.9 0.5 -1.3 1.9 -0.5 0.0 -14.7 -40.6
Number Needed to Reach Parity 0 12 0 5 1 1 0 1 0 0 0 7 20
Current Number Workforce 45 2 2 1 1 3 2 51
Percentage in Category 88.2 3.9 3.9 0.0 0.0 0.0 0.0 0.0 2.0 0.0 2.0 5.9 3.9 100.0
Percentage of Availability 25.8 47.3 5.8 15.3 0.7 1.7 1 1.2 0.2 0.8 26.7 66.3
Over/Under Representation 62.4 -43.4 -1.9 -15.3 -0.7 -1.7 -1.0 -1.2 1.8 -0.8 2.0 -20.8 -62.4
Number Needed to Reach Parity 0 22 1 8 0 1 1 1 0 0 0 11 32
Current Number Workforce 4 22 1 1 2 24 28
Percentage in Category 14.3 78.6 0.0 3.6 0.0 0.0 0.0 0.0 0.0 3.6 0.0 7.1 85.7 100.0
Percentage of Availability 16.9 54.3 6.8 16.1 1.2 2.6 0.5 1 0.2 0.5 28.9 74.5
Over/Under Representation -2.6 24.3 -6.8 -12.5 -1.2 -2.6 -0.5 -1.0 -0.2 3.1 0.0 -21.8 11.2
Number Needed to Reach Parity 1 0 2 4 0 1 0 0 0 0 0 6 0
Current Number Workforce 233 5 8 1 7 6 16 5 260
Percentage in Category 89.6 1.9 3.1 0.0 0.4 0.0 0.0 0.0 2.7 0.0 2.3 6.2 1.9 100.0
Percentage of Availability 52.7 8.3 15.9 4.9 13 2.6 0.9 0.5 1.1 0.2 39.1 16.5
Over/Under Representation 36.9 -6.4 -12.8 -4.9 -12.6 -2.6 -0.9 -0.5 1.6 -0.2 2.3 -32.9 -14.6
Number Needed to Reach Parity 0 17 33 13 33 7 2 1 0 1 0 86 38
Current Number Workforce 1 1 0 1
Percentage in Category 0.0 0.0 100.0 0.0 0.0 0.0 0.0 0.0 0.0 0.0 0.0 100.0 0.0 100.0
Percentage of Availability 20.5 35.4 10.7 19.1 5.4 5.3 1 1.3 0.3 0.9 44 62
Over/Under Representation -20.5 -35.4 89.3 -19.1 -5.4 -5.3 -1.0 -1.3 -0.3 -0.9 0.0 56.0 -62.0
Number Needed to Reach Parity 0 0 0 0 0 0 0 0 0 0 0 0 1
Service and Maintenance
Officials and Administrators
Professional
Technician
Administrative Support
Skilled Craft

107
Table 5.14b: Division 12 Job Placement Goals
Division 12White
Male
White
Female
Black
Male
Black
Female
Hisp
Male
Hisp
Female
Asian
Male
Asian
Female
AIAN
Male
AIAN
Fem
2017 Placement Goal 0 0 0 0 0 0 0 0 0
2018 Placement Goal 0 0 0 0 0 0 0 0 0
2019 Placement Goal 0 0 0 0 0 0 0 0 0
2020 Placement Goal 0 0 0 0 0 0 0 0 0
2021 Placement Goal 0 0 0 0 0 0 0 0 0
2017 Placement Goal 1 0 1 1 1 0 0 0 0
2018 Placement Goal 1 0 1 0 0 0 0 0 0
2019 Placement Goal 1 0 1 0 0 0 0 0 0
2020 Placement Goal 1 0 1 0 0 0 0 0 0
2021 Placement Goal 1 0 1 0 0 0 0 0 0
2017 Placement Goal 1 1 1 0 1 0 0 0 0
2018 Placement Goal 1 0 1 0 0 0 0 0 0
2019 Placement Goal 1 0 1 0 0 0 0 0 0
2020 Placement Goal 1 0 1 0 0 0 0 0 0
2021 Placement Goal 2 0 1 0 0 0 0 0 0
2017 Placement Goal 0 1 1 0 1 0 0 0 0
2018 Placement Goal 0 1 1 0 0 0 0 0 0
2019 Placement Goal 0 0 1 0 0 0 0 0 0
2020 Placement Goal 0 0 1 0 0 0 0 0 0
2021 Placement Goal 0 0 0 0 0 0 0 0 0
2017 Placement Goal 1 1 1 1 1 0 0 0 0
2018 Placement Goal 1 1 1 1 1 0 0 0 0
2019 Placement Goal 1 1 1 1 1 0 0 0 0
2020 Placement Goal 1 2 1 2 1 0 0 0 0
2021 Placement Goal 1 2 1 2 1 0 0 0 0
2017 Placement Goal 0 0 0 0 0 0 0 0 0
2018 Placement Goal 0 0 0 0 0 0 0 0 0
2019 Placement Goal 0 0 0 0 0 0 0 0 0
2020 Placement Goal 0 0 0 0 0 0 0 0 0
2021 Placement Goal 0 0 0 0 0 0 0 0 0
Service and Maintenance
Officials and Administrators
Professional
Technician
Administrative Support
Skilled Craft

108
Table 5.15a: Representation Analysis Division 13 as of September 2016
Source: BEACON Report 0178-F
Division 13White
Male
White
Female
Black
Male
Black
Female
Hisp
Male
Hisp
Fem
Asian
Male
Asian
Female
AIAN
Male
AIAN
Female
Ethn
Unk
Total
Mnrt
Total
FemTotal
Current Number Workforce 1 0 0 1
Percentage in Category 100.0 0.0 0.0 0.0 0.0 0.0 0.0 0.0 0.0 0.0 0.0 0.0 0.0 100.0
Percentage of Availability 52.5 30 5.4 6.3 2 1.1 1.3 0.8 0.4 0.3 17.6 38.5
Over/Under Representation 47.5 -30.0 -5.4 -6.3 -2.0 -1.1 -1.3 -0.8 -0.4 -0.3 0.0 -17.6 -38.5
Number Needed to Reach Parity 0 0 0 0 0 0 0 0 0 0 0 0 0
Current Number Workforce 32 4 2 2 4 38
Percentage in Category 84.2 10.5 5.3 0.0 0.0 0.0 0.0 0.0 0.0 0.0 0.0 5.3 10.5 100.0
Percentage of Availability 34.5 42.5 5.1 11.1 1.3 1.9 1.6 1.3 0.2 0.5 23 57.3
Over/Under Representation 49.7 -32.0 0.2 -11.1 -1.3 -1.9 -1.6 -1.3 -0.2 -0.5 0.0 -17.7 -46.8
Number Needed to Reach Parity 0 12 0 4 0 1 1 0 0 0 0 7 18
Current Number Workforce 52 4 1 1 4 57
Percentage in Category 91.2 7.0 0.0 0.0 0.0 0.0 0.0 0.0 1.8 0.0 0.0 1.8 7.0 100.0
Percentage of Availability 25.8 47.3 5.8 15.3 0.7 1.7 1 1.2 0.2 0.8 26.7 66.3
Over/Under Representation 65.4 -40.3 -5.8 -15.3 -0.7 -1.7 -1.0 -1.2 1.6 -0.8 0.0 -24.9 -59.3
Number Needed to Reach Parity 0 23 3 9 0 1 1 1 0 0 0 14 34
Current Number Workforce 6 17 2 2 19 25
Percentage in Category 24.0 68.0 0.0 8.0 0.0 0.0 0.0 0.0 0.0 0.0 0.0 8.0 76.0 100.0
Percentage of Availability 16.9 54.3 6.8 16.1 1.2 2.6 0.5 1 0.2 0.5 28.9 74.5
Over/Under Representation 7.1 13.7 -6.8 -8.1 -1.2 -2.6 -0.5 -1.0 -0.2 -0.5 0.0 -20.9 1.5
Number Needed to Reach Parity 0 0 2 2 0 1 0 0 0 0 0 5 0
Current Number Workforce 304 7 8 2 1 9 2 20 9 333
Percentage in Category 91.3 2.1 2.4 0.6 0.3 0.0 0.0 0.0 2.7 0.0 0.6 6.0 2.7 100.0
Percentage of Availability 52.7 8.3 15.9 4.9 13 2.6 0.9 0.5 1.1 0.2 39.1 16.5
Over/Under Representation 38.6 -6.2 -13.5 -4.3 -12.7 -2.6 -0.9 -0.5 1.6 -0.2 0.6 -33.1 -13.8
Number Needed to Reach Parity 0 21 45 14 42 9 3 2 0 1 0 110 46
Skilled Craft
Officials and Administrators
Professional
Technician
Administrative Support

109
Table 5.15b: Division 13 Job Placement Goals
Division 13White
Male
White
Female
Black
Male
Black
Female
Hisp
Male
Hisp
Fem
Asian
Male
Asian
Female
AIAN
Male
AIAN
Female
2017 Placement Goal 0 0 0 0 0 0 0 0 0
2018 Placement Goal 0 0 0 0 0 0 0 0 0
2019 Placement Goal 0 0 0 0 0 0 0 0 0
2020 Placement Goal 0 0 0 0 0 0 0 0 0
2021 Placement Goal 0 0 0 0 0 0 0 0 0
2017 Placement Goal 1 0 1 0 1 0 0 0 0
2018 Placement Goal 1 0 1 0 0 0 0 0 0
2019 Placement Goal 1 0 1 0 0 0 0 0 0
2020 Placement Goal 1 0 1 0 0 0 0 0 0
2021 Placement Goal 1 0 0 0 0 0 0 0 0
2017 Placement Goal 1 1 1 0 1 0 0 0 0
2018 Placement Goal 1 1 1 0 0 0 0 0 0
2019 Placement Goal 1 1 1 0 0 0 0 0 0
2020 Placement Goal 1 0 1 0 0 0 0 0 0
2021 Placement Goal 1 0 1 0 0 0 0 0 0
2017 Placement Goal 0 1 1 0 1 0 0 0 0
2018 Placement Goal 0 1 1 0 0 0 0 0 0
2019 Placement Goal 0 0 0 0 0 0 0 0 0
2020 Placement Goal 0 0 0 0 0 0 0 0 0
2021 Placement Goal 0 0 0 0 0 0 0 0 0
2017 Placement Goal 1 2 1 2 1 0 0 0 0
2018 Placement Goal 1 2 1 2 1 0 0 0 0
2019 Placement Goal 1 2 1 2 1 0 0 0 0
2020 Placement Goal 1 2 1 2 1 0 0 0 0
2021 Placement Goal 1 1 1 1 1 0 0 0 0
Skilled Craft
Officials and Administrators
Professional
Technician
Administrative Support

110
Table 5.16a: Representation Analysis Division 14 as of September 2016
Source: BEACON Report 0178-F
Division 14White
Male
White
Female
Black
Male
Black
Female
Hisp
Male
Hisp
Female
Asian
Male
Asian
Female
AIAN
Male
AIAN
Female
Ethn
Unk
Total
Mnrt
Total
FemaleTotal
Current Number Workforce 1 0 0 1
Percentage in Category 100.0 0.0 0.0 0.0 0.0 0.0 0.0 0.0 0.0 0.0 0.0 0.0 0.0 100.0
Percentage of Availability 52.5 30 5.4 6.3 2 1.1 1.3 0.8 0.4 0.3 17.6 38.5
Over/Under Representation 47.5 -30.0 -5.4 -6.3 -2.0 -1.1 -1.3 -0.8 -0.4 -0.3 0.0 -17.6 -38.5
Number Needed to Reach Parity 0 0 0 0 0 0 0 0 0 0 0 0 0
Current Number Workforce 36 5 1 0 5 42
Percentage in Category 85.7 11.9 0.0 0.0 0.0 0.0 0.0 0.0 0.0 0.0 2.4 0.0 11.9 100.0
Percentage of Availability 34.5 42.5 5.1 11.1 1.3 1.9 1.6 1.3 0.2 0.5 23 57.3
Over/Under Representation 51.2 -30.6 -5.1 -11.1 -1.3 -1.9 -1.6 -1.3 -0.2 -0.5 2.4 -23.0 -45.4
Number Needed to Reach Parity 0 13 2 5 1 1 1 1 0 0 0 10 19
Current Number Workforce 56 1 1 1 3 1 1 6 2 64
Percentage in Category 87.5 1.6 1.6 0.0 0.0 0.0 1.6 0.0 4.7 1.6 1.6 9.4 3.1 100.0
Percentage of Availability 25.8 47.3 5.8 15.3 0.7 1.7 1 1.2 0.2 0.8 26.7 66.3
Over/Under Representation 61.7 -45.7 -4.2 -15.3 -0.7 -1.7 0.6 -1.2 4.5 0.8 1.6 -17.3 -63.2
Number Needed to Reach Parity 0 29 3 10 0 1 0 1 0 0 0 11 40
Current Number Workforce 7 23 0 23 30
Percentage in Category 23.3 76.7 0.0 0.0 0.0 0.0 0.0 0.0 0.0 0.0 0.0 0.0 76.7 100.0
Percentage of Availability 16.9 54.3 6.8 16.1 1.2 2.6 0.5 1 0.2 0.5 28.9 74.5
Over/Under Representation 6.4 22.4 -6.8 -16.1 -1.2 -2.6 -0.5 -1.0 -0.2 -0.5 0.0 -28.9 2.2
Number Needed to Reach Parity 0 0 2 5 0 1 0 0 0 0 0 9 0
Current Number Workforce 306 1 6 1 1 14 1 11 23 2 341
Percentage in Category 89.7 0.3 1.8 0.0 0.3 0.0 0.3 0.0 4.1 0.3 3.2 6.7 0.6 100.0
Percentage of Availability 52.7 8.3 15.9 4.9 13 2.6 0.9 0.5 1.1 0.2 39.1 16.5
Over/Under Representation 37.0 -8.0 -14.1 -4.9 -12.7 -2.6 -0.6 -0.5 3.0 0.1 3.2 -32.4 -15.9
Number Needed to Reach Parity 0 27 48 17 43 9 2 2 0 0 0 110 54
Current Number Workforce 2 1 0 0 3
Percentage in Category 66.7 0.0 0.0 0.0 0.0 0.0 0.0 0.0 0.0 0.0 33.3 0.0 0.0 100.0
Percentage of Availability 20.5 35.4 10.7 19.1 5.4 5.3 1 1.3 0.3 0.9 44 62
Over/Under Representation 46.2 -35.4 -10.7 -19.1 -5.4 -5.3 -1.0 -1.3 -0.3 -0.9 33.3 -44.0 -62.0
Number Needed to Reach Parity 0 1 0 1 0 0 0 0 0 0 0 1 2
Service and Maintenance
Officials and Administrators
Professional
Technician
Administrative Support
Skilled Craft

111
Table 5.16b: Division 14 Job Placement Goals
Division 14White
Male
White
Female
Black
Male
Black
Female
Hisp
Male
Hisp
Female
Asian
Male
Asian
Female
AIAN
Male
AIAN
Female
2017 Placement Goal 0 0 0 0 0 0 0 0 0
2018 Placement Goal 0 0 0 0 0 0 0 0 0
2019 Placement Goal 0 0 0 0 0 0 0 0 0
2020 Placement Goal 0 0 0 0 0 0 0 0 0
2021 Placement Goal 0 0 0 0 0 0 0 0 0
2017 Placement Goal 1 1 1 1 1 0 0 0 0
2018 Placement Goal 1 1 1 0 0 0 0 0 0
2019 Placement Goal 1 0 1 0 0 0 0 0 0
2020 Placement Goal 1 0 1 0 0 0 0 0 0
2021 Placement Goal 1 0 1 0 0 0 0 0 0
2017 Placement Goal 1 1 1 0 1 0 0 0 0
2018 Placement Goal 1 1 1 0 0 0 0 0 0
2019 Placement Goal 1 1 1 0 0 0 0 0 0
2020 Placement Goal 1 0 1 0 0 0 0 0 0
2021 Placement Goal 2 0 1 0 0 0 0 0 0
2017 Placement Goal 0 1 1 0 1 0 0 0 0
2018 Placement Goal 0 1 1 0 0 0 0 0 0
2019 Placement Goal 0 0 1 0 0 0 0 0 0
2020 Placement Goal 0 0 1 0 0 0 0 0 0
2021 Placement Goal 0 0 1 0 0 0 0 0 0
2017 Placement Goal 1 2 1 2 1 0 0 0 0
2018 Placement Goal 1 2 1 2 1 0 0 0 0
2019 Placement Goal 1 2 1 2 1 0 0 0 0
2020 Placement Goal 1 2 1 2 1 0 0 0 0
2021 Placement Goal 2 2 1 1 1 0 0 0 0
2017 Placement Goal 1 0 1 0 0 0 0 0 0
2018 Placement Goal 0 0 0 0 0 0 0 0 0
2019 Placement Goal 0 0 0 0 0 0 0 0 0
2020 Placement Goal 0 0 0 0 0 0 0 0 0
2021 Placement Goal 0 0 0 0 0 0 0 0 0
Service and Maintenance
Officials and Administrators
Professional
Technician
Administrative Support
Skilled Craft

112
Table 5.17a: Representation Analysis DMV as of September 2016
Source: BEACON Report 0178-F
DMVWhite
Male
White
Female
Black
Male
Black
Female
Hisp
Male
Hisp
Female
Asian
Male
Asian
Fem
AIAN
Male
AIAN
Female
Ethn
Unk
Total
Mnrt
Total
FemaleTotal
Current Number Workforce 4 3 1 1 2 2 4 11
Percentage in Category 36.4 27.3 0.0 9.1 0.0 0.0 9.1 0.0 0.0 0.0 18.2 18.2 36.4 100.0
Percentage of Availability 52.5 30.0 5.4 6.3 2.0 1.1 1.3 0.8 0.4 0.3 17.6 38.5
Over/Under Representation -16.1 -2.7 -5.4 2.8 -2.0 -1.1 7.8 -0.8 -0.4 -0.3 18.2 0.6 -2.1
Number Needed to Reach Parity 0 0 1 0 0 0 0 0 0 0 0 0 0
Current Number Workforce 154 219 59 180 6 13 3 1 1 3 144 266 416 783
Percentage in Category 19.7 28.0 7.5 23.0 0.8 1.7 0.4 0.1 0.1 0.4 18.4 34.0 53.1 100.0
Percentage of Availability 34.5 42.5 5.1 11.1 1.3 1.9 1.6 1.3 0.2 0.5 23.0 57.3
Over/Under Representation -14.8 -14.5 2.4 11.9 -0.5 -0.2 -1.2 -1.2 -0.1 -0.1 18.4 11.0 -4.2
Number Needed to Reach Parity 0 114 0 0 4 2 10 9 1 1 0 0 33
Current Number Workforce 1 18 15 1 15 33 35
Percentage in Category 2.9 51.4 0.0 42.9 0.0 0.0 0.0 0.0 0.0 0.0 2.9 42.9 94.3 100.0
Percentage of Availability 25.8 47.3 5.8 15.3 0.7 1.7 1 1.2 0.2 0.8 26.7 66.3
Over/Under Representation -22.9 4.1 -5.8 27.6 -0.7 -1.7 -1.0 -1.2 -0.2 -0.8 2.9 16.2 28.0
Number Needed to Reach Parity 0 0 2 0 0 1 0 0 0 0 0 0 0
Current Number Workforce 132 23 12 5 3 2 8 22 28 185
Percentage in Category 71.4 12.4 6.5 2.7 1.6 0.0 1.1 0.0 0.0 0.0 4.3 11.9 15.1 100.0
Percentage of Availability 57.2 12.7 16.2 9.8 2.0 0.8 0.4 0.1 0.6 0.2 30.1 23.6
Over/Under Representation 14.2 -0.3 -9.7 -7.1 -0.4 -0.8 0.7 -0.1 -0.6 -0.2 4.3 -18.2 -8.5
Number Needed to Reach Parity 0 0 18 13 1 1 0 0 1 0 0 34 16
Current Number Workforce 24 138 27 155 2 9 4 2 49 199 308 410
Percentage in Category 5.9 33.7 6.6 37.8 0.5 2.2 0.0 1.0 0.0 0.5 12.0 48.5 75.1 100.0
Percentage of Availability 16.9 54.3 6.8 16.1 1.2 2.6 0.5 1 0.2 0.5 28.9 74.5
Over/Under Representation -11.0 -20.6 -0.2 21.7 -0.7 -0.4 -0.5 0.0 -0.2 0.0 12.0 19.6 0.6
Number Needed to Reach Parity 45 85 1 0 3 2 2 0 1 0 0 0 0
Current Number Workforce 2 2 1 2 0 5
Percentage in Category 40.0 0.0 40.0 0.0 0.0 0.0 0.0 0.0 0.0 0.0 20.0 40.0 0.0 100.0
Percentage of Availability 52.7 8.3 15.9 4.9 13 2.6 0.9 0.5 1.1 0.2 39.1 16.5
Over/Under Representation -12.7 -8.3 24.1 -4.9 -13.0 -2.6 -0.9 -0.5 -1.1 -0.2 20.0 0.9 -16.5
Number Needed to Reach Parity 0 0 0 0 1 0 0 0 0 0 0 0 1
Skilled Craft
Officials and Administrators
Professional
Technician
Protective Services
Administrative Support

113
Table 5.17b: DMV Job Placement Goals
DMVWhite
Male
White
Female
Black
Male
Black
Female
Hisp
Male
Hisp
Female
Asian
Male
Asian
Fem
AIAN
Male
AIAN
Female
2017 Placement Goal 0 1 0 0 0 0 0 0 0
2018 Placement Goal 0 0 0 0 0 0 0 0 0
2019 Placement Goal 0 0 0 0 0 0 0 0 0
2020 Placement Goal 0 0 0 0 0 0 0 0 0
2021 Placement Goal 0 0 0 0 0 0 0 0 0
2017 Placement Goal 5 0 0 1 1 0 0 0 0
2018 Placement Goal 5 0 0 1 1 0 0 0 0
2019 Placement Goal 5 0 0 1 0 0 0 0 0
2020 Placement Goal 4 0 0 1 0 0 0 0 0
2021 Placement Goal 4 0 0 0 0 0 0 0 0
2017 Placement Goal 0 1 0 0 1 0 0 0 0
2018 Placement Goal 0 1 0 0 0 0 0 0 0
2019 Placement Goal 0 0 0 0 0 0 0 0 0
2020 Placement Goal 0 0 0 0 0 0 0 0 0
2021 Placement Goal 0 0 0 0 0 0 0 0 0
2017 Placement Goal 0 1 1 1 1 0 0 0 0
2018 Placement Goal 0 1 1 0 0 0 0 0 0
2019 Placement Goal 0 1 1 0 0 0 0 0 0
2020 Placement Goal 0 1 1 0 0 0 0 0 0
2021 Placement Goal 0 1 1 0 0 0 0 0 0
2017 Placement Goal 3 1 0 1 1 0 0 0 0
2018 Placement Goal 3 0 0 1 1 0 0 0 0
2019 Placement Goal 3 0 0 1 0 0 0 0 0
2020 Placement Goal 4 0 0 0 0 0 0 0 0
2021 Placement Goal 4 0 0 0 0 0 0 0 0
2017 Placement Goal 0 0 0 1 0 0 0 0 0
2018 Placement Goal 0 0 0 0 0 0 0 0 0
2019 Placement Goal 0 0 0 0 0 0 0 0 0
2020 Placement Goal 0 0 0 0 0 0 0 0 0
2021 Placement Goal 0 0 0 0 0 0 0 0 0
Skilled Craft
Officials and Administrators
Professional
Technician
Protective Services
Administrative Support

114
SECTION V, EXHIBIT 1: Job Placement Goals –Full Calculations

115
Table 5.2b DOT Other Job Placement Goals
DOT OtherWhite
Male
White
Female
Black
Male
Black
Female
Hisp
Male
Hisp
Female
Asian
Male
Asian
Female
AIAN
Male
AIAN
Female
Ethn
Unk
Total
Mnrt
Total
FemTotal
Vacancy
%
Current Number Workforce 33 12 4 4 1 8 16 54 0.0000
Percentage in Category 61.1 22.2 7.4 7.4 0.0 0.0 0.0 0.0 0.0 0.0 1.9 14.8 29.6 100.0
Percentage of Availability 52.5 30.0 5.4 6.3 2.0 1.1 1.3 0.8 0.4 0.3 17.6 38.5
Over/Under Representation 8.6 -7.8 2.0 1.1 -2.0 -1.1 -1.3 -0.8 -0.4 -0.3 0.0 -2.8 -8.9
Number Needed to Reach Parity 0 4 0 0 1 1 1 0 0 0 0 2 5
Number Anticipated Vacancies 0
Number Years to Reach Goal 5
Annual Placement Rate 0.00 0.00 0.00 0.00 0.00 0.00 0.00 0.00 0.00 0.00 0.00 0.00
2017 Placement Goal 1 0 1 1 0 0 0 0 0 0
2018 Placement Goal 1 0 0 0 0 0 0 0 0 0
2019 Placement Goal 1 0 0 0 0 0 0 0 0 0
2020 Placement Goal 1 0 0 0 0 0 0 0 0 0
2021 Placement Goal 0 0 0 0 0 0 0 0 0 0
Current Number Workforce 790 320 122 122 10 11 82 33 8 1 47 389 487 1,546 0.0589
Percentage in Category 51.1 20.7 7.9 7.9 0.6 0.7 5.3 2.1 0.5 0.1 3.0 25.2 31.5 100.0
Percentage of Availability 34.5 42.5 5.1 11.1 1.3 1.9 1.6 1.3 0.2 0.5 23 57.3
Over/Under Representation 16.6 -21.8 2.8 -3.2 -0.7 -1.2 3.7 0.8 0.3 -0.4 0.0 2.2 -25.8
Number Needed to Reach Parity 0 337 0 50 10 18 0 0 0 7 0 0 399
Number Anticipated Vacancies 91
Number Years to Reach Goal 5
Annual Placement Rate 0.74 0.00 0.11 0.02 0.04 0.00 0.00 0.00 0.02 0.00 0.00 0.88
2017 Placement Goal 13 0 2 1 1 0 0 0 0 0
2018 Placement Goal 13 0 2 1 1 0 0 0 0 0
2019 Placement Goal 13 0 2 1 1 0 0 0 0 0
2020 Placement Goal 14 0 2 1 1 0 0 0 0 0
2021 Placement Goal 14 0 2 1 1 0 0 0 0 0
Current Number Workforce 279 45 34 7 6 1 5 3 5 1 3 62 57 389 0.0257
Percentage in Category 71.7 11.6 8.7 1.8 1.5 0.3 1.3 0.8 1.3 0.3 0.8 15.9 14.7 100.0
Percentage of Availability 25.8 47.3 5.8 15.3 0.7 1.7 1 1.2 0.2 0.8 26.7 66.3
Over/Under Representation 45.9 -35.7 2.9 -13.5 0.8 -1.4 0.3 -0.4 1.1 -0.5 0.0 -10.8 -51.6
Number Needed to Reach Parity 0 139 0 53 0 6 0 2 0 2 0 42 201
Number Anticipated Vacancies 10
Number Years to Reach Goal 5
Annual Placement Rate 2.78 0.00 1.06 0.00 0.12 0.00 0.04 0.00 0.04 0.00 0.84 4.02
2017 Placement Goal 6 0 2 0 1 0 0 0 0 0
2018 Placement Goal 6 0 2 0 1 0 0 0 0 0
2019 Placement Goal 6 0 2 0 1 0 0 0 0 0
2020 Placement Goal 5 0 2 0 1 0 0 0 0 0
2021 Placement Goal 5 0 3 0 1 0 0 0 0 0
Current Number Workforce 9 3 0 3 12 0.0833
Percentage in Category 75.0 25.0 0.0 0.0 0.0 0.0 0.0 0.0 0.0 0.0 0.0 0.0 25.0 100.0
Percentage of Availability 57.2 12.7 16.2 9.8 2.0 0.8 0.4 0.1 0.6 0.2 30.1 23.6
Over/Under Representation 17.8 12.3 -16.2 -9.8 -2.0 -0.8 -0.4 -0.1 -0.6 -0.2 0.0 -30.1 1.4
Number Needed to Reach Parity 0 0 2 1 0 0 0 0 0 0 0 4 0
Number Anticipated Vacancies 1
Number Years to Reach Goal 5
Annual Placement Rate 0.00 0.40 0.20 0.00 0.00 0.00 0.00 0.00 0.00 0.00 0.80 0.00
2017 Placement Goal 0 1 1 0 0 0 0 0 0 0
2018 Placement Goal 0 1 0 0 0 0 0 0 0 0
2019 Placement Goal 0 0 0 0 0 0 0 0 0 0
2020 Placement Goal 0 0 0 0 0 0 0 0 0 0
2021 Placement Goal 0 0 0 0 0 0 0 0 0 0
Officials and Administrators
Professional
Technician
Protective Services

116
Table 5.2b DOT Other Job Placement Goals (continued)
DOT OtherWhite
Male
White
Female
Black
Male
Black
Female
Hisp
Male
Hisp
Female
Asian
Male
Asian
Female
AIAN
Male
AIAN
Female
Ethn
Unk
Total
Mnrt
Total
FemTotal
Vacancy
%
Current Number Workforce 28 120 15 51 1 1 2 8 70 174 226 0.0885
Percentage in Category 12.4 53.1 6.6 22.6 0.4 0.0 0.0 0.4 0.0 0.9 3.5 31.0 77.0 100.0
Percentage of Availability 16.9 54.3 6.8 16.1 1.2 2.6 0.5 1 0.2 0.5 28.9 74.5
Over/Under Representation -4.5 -1.2 -0.2 6.5 -0.8 -2.6 -0.5 -0.6 -0.2 0.4 0.0 2.1 2.5
Number Needed to Reach Parity -10 3 0 0 2 6 1 1 0 0 0 0 0
Number Anticipated Vacancies 20
Number Years to Reach Goal 5
Annual Placement Rate 0.03 0.00 0.00 0.02 0.06 0.01 0.01 0.00 0.00 0.00 0.00 0.00
2017 Placement Goal 1 0 0 1 1 0 0 0 0 0
2018 Placement Goal 1 0 0 1 1 0 0 0 0 0
2019 Placement Goal 1 0 0 0 1 0 0 0 0 0
2020 Placement Goal 0 0 0 0 1 0 0 0 0 0
2021 Placement Goal 0 0 0 0 1 0 0 0 0 0
Current Number Workforce 365 18 36 3 3 1 6 43 18 432 0.0995
Percentage in Category 84.5 4.2 8.3 0.0 0.7 0.0 0.7 0.0 0.2 0.0 1.4 10.0 4.2 100.0
Percentage of Availability 52.7 8.3 15.9 4.9 13 2.6 0.9 0.5 1.1 0.2 39.1 16.5
Over/Under Representation 31.8 -4.1 -7.6 -4.9 -12.3 -2.6 -0.2 -0.5 -0.9 -0.2 0.0 -29.1 -12.3
Number Needed to Reach Parity 0 18 33 21 53 11 1 2 4 1 0 126 53
Number Anticipated Vacancies 43
Number Years to Reach Goal 5
Annual Placement Rate 0.08 0.15 0.10 0.25 0.05 0.00 0.01 0.02 0.00 0.00 0.59 0.25
2017 Placement Goal 1 1 1 2 1 0 0 0 0 0
2018 Placement Goal 1 1 1 2 1 0 0 0 0 0
2019 Placement Goal 1 1 1 2 1 0 0 0 0 0
2020 Placement Goal 1 2 1 2 1 0 0 0 0 0
2021 Placement Goal 1 2 1 3 1 0 0 0 0 0
Current Number Workforce 8 1 2 2 1 11 0.0000
Percentage in Category 72.7 9.1 18.2 0.0 0.0 0.0 0.0 0.0 0.0 0.0 0.0 18.2 9.1 100.0
Percentage of Availability 20.5 35.4 10.7 19.1 5.4 5.3 1 1.3 0.3 0.9 44.0 62.0
Over/Under Representation 52.2 -26.3 7.5 -19.1 -5.4 -5.3 -1.0 -1.3 -0.3 -0.9 0.0 -25.8 -52.9
Number Needed to Reach Parity 0 3 0 2 1 1 0 0 0 0 0 3 6
Number Anticipated Vacancies 1
Number Years to Reach Goal 3
Annual Placement Rate 1.00 0.00 0.67 0.33 0.33 0.00 0.00 0.00 0.00 0.00 1.00 2.00
2017 Placement Goal 1 0 1 1 1 0 0 0 0 0
2018 Placement Goal 1 0 1 0 0 0 0 0 0 0
2019 Placement Goal 1 0 0 0 0 0 0 0 0 0
2020 Placement Goal 0 0 0 0 0 0 0 0 0 0
2021 Placement Goal 0 0 0 0 0 0 0 0 0 0
Administrative Support
Skilled Craft
Service and Maintenance

117
Table 5.3b Division 1 Job Placement Goals
Division 1White
Male
White
Female
Black
Male
Black
Female
Hisp
Male
Hisp
Female
Asian
Male
Asian
Fem
AIAN
Male
AIAN
Female
Ethn
Unk
Total
Mnrt
Total
FemTotal
Vacancy
%
Current Number Workforce 1 0 0 1 0.00
Percentage in Category 100.0 0.0 0.0 0.0 0.0 0.0 0.0 0.0 0.0 0.0 0.0 0.0 0.0 100.0
Percentage of Availability 52.5 30 5.4 6.3 2 1.1 1.3 0.8 0.4 0.3 17.6 38.5
Over/Under Representation 47.5 -30.0 -5.4 -6.3 -2.0 -1.1 -1.3 -0.8 -0.4 -0.3 0.0 -17.6 -38.5
Number Needed to Reach Parity 0 0 0 0 0 0 0 0 0 0 0 0 0
Number Anticipated Vacancies 0
Number Years to Reach Goal 0
Annual Placement Rate 0.00 0.00 0.00 0.00 0.00 0.00 0.00 0.00 0.00 0.00 0.00 0.00
2017 Placement Goal 0 0 0 0 0 0 0 0 0 0
2018 Placement Goal 0 0 0 0 0 0 0 0 0 0
2019 Placement Goal 0 0 0 0 0 0 0 0 0 0
2020 Placement Goal 0 0 0 0 0 0 0 0 0 0
2021 Placement Goal 0 0 0 0 0 0 0 0 0 0
Current Number Workforce 32 10 1 1 1 3 11 45 0.00
Percentage in Category 71.1 22.2 2.2 2.2 2.2 0.0 0.0 0.0 0.0 0.0 0.0 6.7 24.4 100.0
Percentage of Availability 34.5 42.5 5.1 11.1 1.3 1.9 1.6 1.3 0.2 0.5 23 57.3
Over/Under Representation 36.6 -20.3 -2.9 -8.9 0.9 -1.9 -1.6 -1.3 -0.2 -0.5 0.0 -16.3 -32.9
Number Needed to Reach Parity 0 9 1 4 0 1 1 1 0 0 0 7 15
Number Anticipated Vacancies 0
Number Years to Reach Goal 5
Annual Placement Rate 0.00 0.00 0.00 0.00 0.00 0.00 0.00 0.00 0.00 0.00 0.00 0.00
2017 Placement Goal 1 1 1 0 1 0 0 0 0 0
2018 Placement Goal 1 0 1 0 0 0 0 0 0 0
2019 Placement Goal 1 0 1 0 0 0 0 0 0 0
2020 Placement Goal 1 0 1 0 0 0 0 0 0 0
2021 Placement Goal 1 0 0 0 0 0 0 0 0 0
Current Number Workforce 46 2 2 2 2 50 0.1
Percentage in Category 92.0 4.0 4.0 0.0 0.0 0.0 0.0 0.0 0.0 0.0 0.0 4.0 4.0 100.0
Percentage of Availability 25.8 47.3 5.8 15.3 0.7 1.7 1 1.2 0.2 0.8 26.7 66.3
Over/Under Representation 66.2 -43.3 -1.8 -15.3 -0.7 -1.7 -1.0 -1.2 -0.2 -0.8 0.0 -22.7 -62.3
Number Needed to Reach Parity 0 22 1 8 0 1 1 1 0 0 0 11 31
Number Anticipated Vacancies 5
Number Years to Reach Goal 5
Annual Placement Rate 0.88 0.04 0.32 0.00 0.04 0.04 0.04 0.00 0.00 0.00 0.44 1.24
2017 Placement Goal 1 1 1 0 1 0 0 0 0 0
2018 Placement Goal 1 0 1 0 0 0 0 0 0 0
2019 Placement Goal 1 0 1 0 0 0 0 0 0 0
2020 Placement Goal 1 0 1 0 0 0 0 0 0 0
2021 Placement Goal 1 0 1 0 0 0 0 0 0 0
Current Number Workforce 4 22 3 3 25 29 0.0345
Percentage in Category 13.8 75.9 0.0 10.3 0.0 0.0 0.0 0.0 0.0 0.0 0.0 10.3 86.2 100.0
Percentage of Availability 16.9 54.3 6.8 16.1 1.2 2.6 0.5 1 0.2 0.5 28.9 74.5
Over/Under Representation -3.1 21.6 -6.8 -5.8 -1.2 -2.6 -0.5 -1.0 -0.2 -0.5 0.0 -18.6 11.7
Number Needed to Reach Parity 1 0 2 2 0 1 0 0 0 0 0 5 0
Number Anticipated Vacancies 1
Number Years to Reach Goal 5
Annual Placement Rate 0.00 0.40 0.40 0.00 0.20 0.00 0.00 0.00 0.00 0.00 1.00 0.00
2017 Placement Goal 0 1 1 0 1 0 0 0 0 0
2018 Placement Goal 0 1 1 0 0 0 0 0 0 0
2019 Placement Goal 0 0 0 0 0 0 0 0 0 0
2020 Placement Goal 0 0 0 0 0 0 0 0 0 0
2021 Placement Goal 0 0 0 0 0 0 0 0 0 0
Officials and Administrators
Professional
Technician
Administrative Support

118
Table 5.3b Division 1 Job Placement Goals (continued)
Division 1White
Male
White
Female
Black
Male
Black
Female
Hisp
Male
Hisp
Female
Asian
Male
Asian
Fem
AIAN
Male
AIAN
Female
Ethn
Unk
Total
Mnrt
Total
FemTotal
Vacancy
%
Current Number Workforce 199 2 115 2 2 2 5 121 4 327 0.0948
Percentage in Category 60.9 0.6 35.2 0.6 0.6 0.0 0.0 0.0 0.6 0.0 1.5 37.0 1.2 100.0
Percentage of Availability 52.7 8.3 15.9 4.9 13 2.6 0.9 0.5 1.1 0.2 39.1 16.5
Over/Under Representation 8.2 -7.7 19.3 -4.3 -12.4 -2.6 -0.9 -0.5 -0.5 -0.2 1.5 -2.1 -15.3
Number Needed to Reach Parity 0 25 0 14 41 9 3 2 2 1 0 7 50
Number Anticipated Vacancies 31
Number Years to Reach Goal 5
Annual Placement Rate 0.16 0.00 0.09 0.26 0.06 0.02 0.01 0.01 0.01 0.00 0.05 0.32
2017 Placement Goal 1 0 1 2 1 0 0 0 0 0
2018 Placement Goal 1 0 1 2 1 0 0 0 0 0
2019 Placement Goal 1 0 1 2 1 0 0 0 0 0
2020 Placement Goal 1 0 1 2 1 0 0 0 0 0
2021 Placement Goal 1 0 1 2 1 0 0 0 0 0
Current Number Workforce 2 2 2 0 4 0.2500
Percentage in Category 50.0 0.0 50.0 0.0 0.0 0.0 0.0 0.0 0.0 0.0 0.0 50.0 0.0 100.0
Percentage of Availability 20.5 35.4 10.7 19.1 5.4 5.3 1 1.3 0.3 0.9 44 62
Over/Under Representation 29.5 -35.4 39.3 -19.1 -5.4 -5.3 -1.0 -1.3 -0.3 -0.9 0.0 6.0 -62.0
Number Needed to Reach Parity 0 1 0 1 0 0 0 0 0 0 0 0 2
Number Anticipated Vacancies 1
Number Years to Reach Goal 5
Annual Placement Rate 0.20 0.00 0.20 0.00 0.00 0.00 0.00 0.00 0.00 0.00 0.00 0.40
2017 Placement Goal 1 0 1 0 0 0 0 0 0 0
2018 Placement Goal 0 0 0 0 0 0 0 0 0 0
2019 Placement Goal 0 0 0 0 0 0 0 0 0 0
2020 Placement Goal 0 0 0 0 0 0 0 0 0 0
2021 Placement Goal 0 0 0 0 0 0 0 0 0 0
Service and Maintenance
Skilled Craft

119
Table 5.4b Division 2 Job Placement Goals
Division 2White
Male
White
Female
Black
Male
Black
Female
Hisp
Male
Hisp
Female
Asian
Male
Asian
Fem
AIAN
Male
AIAN
Female
Ethn
Unk
Total
Mnrt
Total
FemTotal
Vacancy
%
Current Number Workforce 1 0 0 1 0
Percentage in Category 100.0 0.0 0.0 0.0 0.0 0.0 0.0 0.0 0.0 0.0 0.0 0.0 0.0 100.0
Percentage of Availability 52.5 30 5.4 6.3 2 1.1 1.3 0.8 0.4 0.3 17.6 38.5
Over/Under Representation 47.5 -30.0 -5.4 -6.3 -2.0 -1.1 -1.3 -0.8 -0.4 -0.3 0.0 -17.6 -38.5
Number Needed to Reach Parity 0 0 0 0 0 0 0 0 0 0 0 0 0
Number Anticipated Vacancies 0
Number Years to Reach Goal 0
Annual Placement Rate 0.00 0.00 0.00 0.00 0.00 0.00 0.00 0.00 0.00 0.00
2017 Placement Goal 0 0 0 0 0 0 0 0 0 0
2018 Placement Goal 0 0 0 0 0 0 0 0 0 0
2019 Placement Goal 0 0 0 0 0 0 0 0 0 0
2020 Placement Goal 0 0 0 0 0 0 0 0 0 0
2021 Placement Goal 0 0 0 0 0 0 0 0 0 0
Current Number Workforce 31 8 2 1 3 9 42 0.0238
Percentage in Category 73.8 19.0 4.8 2.4 0.0 0.0 0.0 0.0 0.0 0.0 0.0 7.1 21.4 100.0
Percentage of Availability 34.5 42.5 5.1 11.1 1.3 1.9 1.6 1.3 0.2 0.5 23 57.3
Over/Under Representation 39.3 -23.5 -0.3 -8.7 -1.3 -1.9 -1.6 -1.3 -0.2 -0.5 0.0 -15.9 -35.9
Number Needed to Reach Parity 0 10 0 4 1 1 1 1 0 0 0 7 15
Number Anticipated Vacancies 1
Number Years to Reach Goal 5
Annual Placement Rate 2.00 0.00 0.80 0.20 0.20 0.20 0.20 0.00 0.00 0.00 1.40 3.00
2017 Placement Goal 1 0 1 1 1 0 0 0 0 0
2018 Placement Goal 1 0 1 0 0 0 0 0 0 0
2019 Placement Goal 1 0 1 0 0 0 0 0 0 0
2020 Placement Goal 1 0 1 0 0 0 0 0 0 0
2021 Placement Goal 1 0 0 0 0 0 0 0 0 0
Current Number Workforce 37 4 6 6 4 47 0.1064
Percentage in Category 78.7 8.5 12.8 0.0 0.0 0.0 0.0 0.0 0.0 0.0 0.0 12.8 8.5 100.0
Percentage of Availability 25.8 47.3 5.8 15.3 0.7 1.7 1 1.2 0.2 0.8 26.7 66.3
Over/Under Representation 52.9 -38.8 7.0 -15.3 -0.7 -1.7 -1.0 -1.2 -0.2 -0.8 0.0 -13.9 -57.8
Number Needed to Reach Parity 0 18 0 7 0 1 0 1 0 0 0 7 27
Number Anticipated Vacancies 5
Number Years to Reach Goal 5
Annual Placement Rate 0.72 0.00 0.28 0.00 0.04 0.00 0.04 0.00 0.00 0.00 0.28 1.08
2017 Placement Goal 1 0 1 0 1 0 0 0 0 0
2018 Placement Goal 1 0 1 0 0 0 0 0 0 0
2019 Placement Goal 1 0 1 0 0 0 0 0 0 0
2020 Placement Goal 1 0 1 0 0 0 0 0 0 0
2021 Placement Goal 1 0 1 0 0 0 0 0 0 0
Current Number Workforce 2 22 2 3 2 5 25 31 0.0323
Percentage in Category 6.5 71.0 6.5 9.7 0.0 0.0 0.0 0.0 0.0 0.0 6.5 16.1 80.6 100.0
Percentage of Availability 16.9 54.3 6.8 16.1 1.2 2.6 0.5 1 0.2 0.5 28.9 74.5
Over/Under Representation1 -10.4 16.7 -0.3 -6.4 -1.2 -2.6 -0.5 -1.0 -0.2 -0.5 0.0 -12.8 6.1
Number Needed to Reach Parity 3 0 0 2 0 1 0 0 0 0 0 4 0
Number Anticipated Vacancies 1
Number Years to Reach Goal 5
Annual Placement Rate 0.00 0.00 0.40 0.00 0.20 0.00 0.00 0.00 0.00 0.00
2017 Placement Goal 0 0 1 0 1 0 0 0 0 0
2018 Placement Goal 0 0 1 0 0 0 0 0 0 0
2019 Placement Goal 0 0 0 0 0 0 0 0 0 0
2020 Placement Goal 0 0 0 0 0 0 0 0 0 0
2021 Placement Goal 0 0 0 0 0 0 0 0 0 0
Officials and Administrators
Professional
Technician
Administrative Support

120
Table 5.4b Division 2 Job Placement Goals (continued)
Division 2White
Male
White
Female
Black
Male
Black
Female
Hisp
Male
Hisp
Female
Asian
Male
Asian
Fem
AIAN
Male
AIAN
Female
Ethn
Unk
Total
Mnrt
Total
FemTotal
Vacancy
%
Current Number Workforce 163 4 81 1 3 2 6 87 5 260 0.0192
Percentage in Category 62.7 1.5 31.2 0.4 1.2 0.0 0.0 0.0 0.8 0.0 2.3 33.5 1.9 100.0
Percentage of Availability 52.7 8.3 15.9 4.9 13 2.6 0.9 0.5 1.1 0.2 39.1 16.5
Over/Under Representation 10.0 -6.8 15.3 -4.5 -11.8 -2.6 -0.9 -0.5 -0.3 -0.2 0.0 -5.6 -14.6
Number Needed to Reach Parity 0 18 0 12 31 7 2 1 1 1 0 15 38
Number Anticipated Vacancies 5
Number Years to Reach Goal 5
Annual Placement Rate 0.72 0.00 0.48 1.24 0.28 0.08 0.04 0.04 0.04 0.00 0.60 1.52
2017 Placement Goal 1 0 1 1 1 0 0 0 0 0
2018 Placement Goal 1 0 1 1 1 0 0 0 0 0
2019 Placement Goal 1 0 1 1 1 0 0 0 0 0
2020 Placement Goal 1 0 1 1 1 0 0 0 0 0
2021 Placement Goal 1 0 1 2 1 0 0 0 0 0
Current Number Workforce 1 0 1 0 1 0.0000
Percentage in Category 0.0 0.0 100.0 0.0 0.0 0.0 0.0 0.0 0.0 0.0 0.0 100.0 0.0 100.0
Percentage of Availability 20.5 35.4 10.7 19.1 5.4 5.3 1 1.3 0.3 0.9 44 62
Over/Under Representation -20.5 -35.4 89.3 -19.1 -5.4 -5.3 -1.0 -1.3 -0.3 -0.9 0.0 56.0 -62.0
Number Needed to Reach Parity 0 0 0 0 0 0 0 0 0 0 0 0 1
Number Anticipated Vacancies 0
Number Years to Reach Goal 0
Annual Placement Rate 0.00 0.00 0.00 0.00 0.00 0.00 0.00 0.00 0.00 0.00
2017 Placement Goal 0 0 0 0 0 0 0 0 0 0
2018 Placement Goal 0 0 0 0 0 0 0 0 0 0
2019 Placement Goal 0 0 0 0 0 0 0 0 0 0
2020 Placement Goal 0 0 0 0 0 0 0 0 0 0
2021 Placement Goal 0 0 0 0 0 0 0 0 0 0
Service and Maintenance
Skilled Craft

121
Table 5.5b Division 3 Job Placement Goals
Division 3White
Male
White
Female
Black
Male
Black
Female
Hisp
Male
Hisp
Female
Asian
Male
Asian
Fem
AIAN
Male
AIAN
Female
Ethn
Unk
Total
Mnrt
Total
FemTotal
Vacancy
%
Current Number Workforce 1 0 1 1 0.0000
Percentage in Category 0.0 100.0 0.0 0.0 0.0 0.0 0.0 0.0 0.0 0.0 0.0 0.0 100.0 100.0
Percentage of Availability 52.5 30 5.4 6.3 2 1.1 1.3 0.8 0.4 0.3 17.6 38.5
Over/Under Representation -52.5 70.0 -5.4 -6.3 -2.0 -1.1 -1.3 -0.8 -0.4 -0.3 0.0 -17.6 61.5
Number Needed to Reach Parity 1 0 0 0 0 0 0 0 0 0 0 0 0
Number Anticipated Vacancies 0
Number Years to Reach Goal 0
Annual Placement Rate 0.00 0.00 0.00 0.00 0.00 0.00 0.00 0.00 0.00 0.00
2017 Placement Goal 0 0 0 0 0 0 0 0 0 0
2018 Placement Goal 0 0 0 0 0 0 0 0 0 0
2019 Placement Goal 0 0 0 0 0 0 0 0 0 0
2020 Placement Goal 0 0 0 0 0 0 0 0 0 0
2021 Placement Goal 0 0 0 0 0 0 0 0 0 0
Current Number Workforce 30 9 2 2 1 5 11 44 0.1591
Percentage in Category 68.2 20.5 0.0 4.5 0.0 0.0 4.5 0.0 2.3 0.0 0.0 11.4 25.0 100.0
Percentage of Availability 34.5 42.5 5.1 11.1 1.3 1.9 1.6 1.3 0.2 0.5 23 57.3
Over/Under Representation 33.7 -22.0 -5.1 -6.6 -1.3 -1.9 2.9 -1.3 2.1 -0.5 0.0 -11.6 -32.3
Number Needed to Reach Parity 0 10 2 3 1 1 0 1 0 0 0 5 14
Number Anticipated Vacancies 7
Number Years to Reach Goal 5
Annual Placement Rate 0.29 0.06 0.09 0.03 0.03 0.00 0.03 0.00 0.00 0.00 0.14 0.40
2017 Placement Goal 1 1 1 1 1 0 0 0 0 0
2018 Placement Goal 1 1 1 0 0 0 0 0 0 0
2019 Placement Goal 1 0 1 0 0 0 0 0 0 0
2020 Placement Goal 1 0 0 0 0 0 0 0 0 0
2021 Placement Goal 1 0 0 0 0 0 0 0 0 0
Current Number Workforce 45 9 4 2 3 9 9 63 0.0952
Percentage in Category 71.4 14.3 6.3 0.0 3.2 0.0 0.0 0.0 4.8 0.0 0.0 14.3 14.3 100.0
Percentage of Availability 25.8 47.3 5.8 15.3 0.7 1.7 1 1.2 0.2 0.8 26.7 66.3
Over/Under Representation 45.6 -33.0 0.5 -15.3 2.5 -1.7 -1.0 -1.2 4.6 -0.8 0.0 -12.4 -52.0
Number Needed to Reach Parity 0 21 0 10 0 1 1 1 0 1 0 8 33
Number Anticipated Vacancies 6
Number Years to Reach Goal 5
Annual Placement Rate 0.70 0.00 0.33 0.00 0.03 0.03 0.03 0.00 0.03 0.00 0.27 1.10
2017 Placement Goal 1 0 1 0 1 0 0 0 0 0
2018 Placement Goal 1 0 1 0 0 0 0 0 0 0
2019 Placement Goal 1 0 1 0 0 0 0 0 0 0
2020 Placement Goal 1 0 1 0 0 0 0 0 0 0
2021 Placement Goal 1 0 1 0 0 0 0 0 0 0
Current Number Workforce 5 27 1 1 2 28 34 0.0588
Percentage in Category 14.7 79.4 2.9 0.0 0.0 2.9 0.0 0.0 0.0 0.0 0.0 5.9 82.4 100.0
Percentage of Availability 16.9 54.3 6.8 16.1 1.2 2.6 0.5 1 0.2 0.5 28.9 74.5
Over/Under Representation -2.2 25.1 -3.9 -16.1 -1.2 0.3 -0.5 -1.0 -0.2 -0.5 0.0 -23.0 7.9
Number Needed to Reach Parity 1 0 1 5 0 0 0 0 0 0 0 8 0
Number Anticipated Vacancies 2
Number Years to Reach Goal 5
Annual Placement Rate 0.00 0.10 0.50 0.00 0.00 0.00 0.00 0.00 0.00 0.00 0.80 0.00
2017 Placement Goal 0 1 1 0 0 0 0 0 0 0
2018 Placement Goal 0 0 1 0 0 0 0 0 0 0
2019 Placement Goal 0 0 1 0 0 0 0 0 0 0
2020 Placement Goal 0 0 1 0 0 0 0 0 0 0
2021 Placement Goal 0 0 1 0 0 0 0 0 0 0
Officials and Administrators
Professional
Technician
Administrative Support

122
Table 5.5b Division 3 Job Placement Goals (continued)
Division 3White
Male
White
Female
Black
Male
Black
Female
Hisp
Male
Hisp
Female
Asian
Male
Asian
Fem
AIAN
Male
AIAN
Female
Ethn
Unk
Total
Mnrt
Total
FemTotal
Vacancy
%
Current Number Workforce 166 9 43 2 1 12 1 1 59 11 235 0.0426
Percentage in Category 70.6 3.8 18.3 0.0 0.9 0.4 0.0 0.0 5.1 0.4 0.4 25.1 4.7 100.0
Percentage of Availability 52.7 8.3 15.9 4.9 13 2.6 0.9 0.5 1.1 0.2 39.1 16.5
Over/Under Representation 17.9 -4.5 2.4 -4.9 -12.1 -2.2 -0.9 -0.5 4.0 0.2 0.0 -14.0 -11.8
Number Needed to Reach Parity 11 0 12 29 5 2 1 0 0 0 33 28
Number Anticipated Vacancies 10
Number Years to Reach Goal 5
Annual Placement Rate 0.22 0.00 0.24 0.58 0.10 0.04 0.02 0.00 0.00 0.00 0.66 0.56
2017 Placement Goal 1 0 1 1 1 0 0 0 0 0
2018 Placement Goal 1 0 1 1 1 0 0 0 0 0
2019 Placement Goal 1 0 1 1 1 0 0 0 0 0
2020 Placement Goal 1 0 1 1 1 0 0 0 0 0
2021 Placement Goal 1 0 1 2 1 0 0 0 0 0
Skilled Craft

123
Table 5.6b Division 4 Job Placement Goals
Division 4White
Male
White
Female
Black
Male
Black
Female
Hisp
Male
Hisp
Female
Asian
Male
Asian
Fem
AIAN
Male
AIAN
Female
Ethn
Unk
Total
Mnrt
Total
FemTotal
Vacancy
%
Current Number Workforce 1 0 0 1 0
Percentage in Category 100.0 0.0 0.0 0.0 0.0 0.0 0.0 0.0 0.0 0.0 0.0 0.0 0.0 100.0
Percentage of Availability 52.5 30 5.4 6.3 2 1.1 1.3 0.8 0.4 0.3 17.6 38.5
Over/Under Representation 47.5 -30.0 -5.4 -6.3 -2.0 -1.1 -1.3 -0.8 -0.4 -0.3 0.0 -17.6 -38.5
Number Needed to Reach Parity 0 0 0 0 0 0 0 0 0 0 0 0 0
Number Anticipated Vacancies 0
Number Years to Reach Goal 0
Annual Placement Rate 0.00 0.00 0.00 0.00 0.00 0.00 0.00 0.00 0.00 0.00
2017 Placement Goal 0 0 0 0 0 0 0 0 0 0
2018 Placement Goal 0 0 0 0 0 0 0 0 0 0
2019 Placement Goal 0 0 0 0 0 0 0 0 0 0
2020 Placement Goal 0 0 0 0 0 0 0 0 0 0
2021 Placement Goal 0 0 0 0 0 0 0 0 0 0
Current Number Workforce 33 8 1 1 2 9 43 0.1628
Percentage in Category 76.7 18.6 2.3 2.3 0.0 0.0 0.0 0.0 0.0 0.0 0.0 4.7 20.9 100.0
Percentage of Availability 34.5 42.5 5.1 11.1 1.3 1.9 1.6 1.3 0.2 0.5 23 57.3
Over/Under Representation 42.2 -23.9 -2.8 -8.8 -1.3 -1.9 -1.6 -1.3 -0.2 -0.5 0.0 -18.3 -36.4
Number Needed to Reach Parity 0 10 1 4 1 1 1 1 0 0 0 8 16
Number Anticipated Vacancies 7
Number Years to Reach Goal 5
Annual Placement Rate 0.29 0.03 0.11 0.03 0.03 0.03 0.03 0.00 0.00 0.00 0.23 0.46
2017 Placement Goal 1 1 1 1 1 0 0 0 0 0
2018 Placement Goal 1 0 1 0 0 0 0 0 0 0
2019 Placement Goal 1 0 1 0 0 0 0 0 0 0
2020 Placement Goal 1 0 1 0 0 0 0 0 0 0
2021 Placement Goal 1 0 0 0 0 0 0 0 0 0
Current Number Workforce 41 5 7 1 8 5 54 0.0370
Percentage in Category 75.9 9.3 13.0 0.0 0.0 0.0 0.0 0.0 1.9 0.0 0.0 14.8 9.3 100.0
Percentage of Availability 25.8 47.3 5.8 15.3 0.7 1.7 1 1.2 0.2 0.8 26.7 66.3
Over/Under Representation 50.1 -38.0 7.2 -15.3 -0.7 -1.7 -1.0 -1.2 1.7 -0.8 0.0 -11.9 -57.0
Number Needed to Reach Parity 0 21 0 8 0 1 1 1 0 0 0 6 31
Number Anticipated Vacancies 2
Number Years to Reach Goal 5
Annual Placement Rate 2.10 0.00 0.80 0.00 0.10 0.10 0.10 0.00 0.00 0.00 0.60 3.10
2017 Placement Goal 1 0 1 0 1 0 0 0 0 0
2018 Placement Goal 1 0 1 0 0 0 0 0 0 0
2019 Placement Goal 1 0 1 0 0 0 0 0 0 0
2020 Placement Goal 1 0 1 0 0 0 0 0 0 0
2021 Placement Goal 1 0 1 0 0 0 0 0 0 0
Current Number Workforce 2 19 0 19 21 0.0952
Percentage in Category 9.5 90.5 0.0 0.0 0.0 0.0 0.0 0.0 0.0 0.0 0.0 0.0 90.5 100.0
Percentage of Availability 16.9 54.3 6.8 16.1 1.2 2.6 0.5 1 0.2 0.5 28.9 74.5
Over/Under Representation -7.4 36.2 -6.8 -16.1 -1.2 -2.6 -0.5 -1.0 -0.2 -0.5 0.0 -28.9 16.0
Number Needed to Reach Parity 2 0 1 3 0 1 0 0 0 0 0 6 0
Number Anticipated Vacancies 2
Number Years to Reach Goal 5
Annual Placement Rate 0.00 0.10 0.30 0.00 0.10 0.00 0.00 0.00 0.00 0.00 0.60 0.00
2017 Placement Goal 0 1 1 0 1 0 0 0 0 0
2018 Placement Goal 0 0 1 0 0 0 0 0 0 0
2019 Placement Goal 0 0 1 0 0 0 0 0 0 0
2020 Placement Goal 0 0 0 0 0 0 0 0 0 0
2021 Placement Goal 0 0 0 0 0 0 0 0 0 0
Officials and Administrators
Professional
Technician
Administrative Support

124
Table 5.6b Division 4 Job Placement Goals (continued)
Division 4White
Male
White
Female
Black
Male
Black
Female
Hisp
Male
Hisp
Female
Asian
Male
Asian
Fem
AIAN
Male
AIAN
Female
Ethn
Unk
Total
Mnrt
Total
FemTotal
Vacancy
%
Current Number Workforce 212 4 80 1 2 1 6 5 90 6 311 0.0611
Percentage in Category 68.2 1.3 25.7 0.3 0.6 0.3 0.0 0.0 1.9 0.0 1.6 28.9 1.9 100.0
Percentage of Availability 52.7 8.3 15.9 4.9 13 2.6 0.9 0.5 1.1 0.2 39.1 16.5
Over/Under Representation 15.5 -7.0 9.8 -4.6 -12.4 -2.3 -0.9 -0.5 0.8 -0.2 0.0 -10.2 -14.6
Number Needed to Reach Parity 0 22 0 14 38 7 3 2 0 1 0 32 45
Number Anticipated Vacancies 19
Number Years to Reach Goal 5
Annual Placement Rate 0.23 0.00 0.15 0.40 0.07 0.03 0.02 0.00 0.01 0.00 0.34 0.47
2017 Placement Goal 1 0 1 2 1 0 0 0 0 0
2018 Placement Goal 1 0 1 2 1 0 0 0 0 0
2019 Placement Goal 1 0 1 2 1 0 0 0 0 0
2020 Placement Goal 1 0 1 2 1 0 0 0 0 0
2021 Placement Goal 1 0 1 2 1 0 0 0 0 0
Current Number Workforce 3 0 0 3 0.3333
Percentage in Category 100.0 0.0 0.0 0.0 0.0 0.0 0.0 0.0 0.0 0.0 0.0 0.0 0.0 100.0
Percentage of Availability 20.5 35.4 10.7 19.1 5.4 5.3 1 1.3 0.3 0.9 44 62
Over/Under Representation 79.5 -35.4 -10.7 -19.1 -5.4 -5.3 -1.0 -1.3 -0.3 -0.9 0.0 -44.0 -62.0
Number Needed to Reach Parity 0 1 0 1 0 0 0 0 0 0 0 1 2
Number Anticipated Vacancies 1
Number Years to Reach Goal 5
Annual Placement Rate 0.20 0.00 0.20 0.00 0.00 0.00 0.00 0.00 0.00 0.00 0.20 0.40
2017 Placement Goal 1 0 1 0 0 0 0 0 0 0
2018 Placement Goal 0 0 0 0 0 0 0 0 0 0
2019 Placement Goal 0 0 0 0 0 0 0 0 0 0
2020 Placement Goal 0 0 0 0 0 0 0 0 0 0
2021 Placement Goal 0 0 0 0 0 0 0 0 0 0
Service and Maintenance
Skilled Craft

125
Table 5.7b Division 5 Job Placement Goals
Division 5White
Male
White
Female
Black
Male
Black
Female
Hisp
Male
Hisp
Female
Asian
Male
Asian
Fem
AIAN
Male
AIAN
Female
Ethn
Unk
Total
Mnrt
Total
FemTotal
Vacancy
%
Current Number Workforce 1 0 0 1 0
Percentage in Category 100.0 0.0 0.0 0.0 0.0 0.0 0.0 0.0 0.0 0.0 0.0 0.0 0.0 100.0
Percentage of Availability 52.5 30 5.4 6.3 2 1.1 1.3 0.8 0.4 0.3 17.6 38.5
Over/Under Representation 47.5 -30.0 -5.4 -6.3 -2.0 -1.1 -1.3 -0.8 -0.4 -0.3 0.0 -17.6 -38.5
Number Needed to Reach Parity 0 0 0 0 0 0 0 0 0 0 0 0 0
Number Anticipated Vacancies 0
Number Years to Reach Goal 0
Annual Placement Rate 0.00 0.00 0.00 0.00 0.00 0.00 0.00 0.00 0.00 0.00
2017 Placement Goal 0 0 0 0 0 0 0 0 0 0
2018 Placement Goal 0 0 0 0 0 0 0 0 0 0
2019 Placement Goal 0 0 0 0 0 0 0 0 0 0
2020 Placement Goal 0 0 0 0 0 0 0 0 0 0
2021 Placement Goal 0 0 0 0 0 0 0 0 0 0
Current Number Workforce 46 7 3 1 1 1 3 9 9 62 0.1774
Percentage in Category 74.2 11.3 4.8 1.6 1.6 1.6 4.8 0.0 0.0 0.0 0.0 14.5 14.5 100.0
Percentage of Availability 34.5 42.5 5.1 11.1 1.3 1.9 1.6 1.3 0.2 0.5 23 57.3
Over/Under Representation 39.7 -31.2 -0.3 -9.5 0.3 -0.3 3.2 -1.3 -0.2 -0.5 0.0 -8.5 -42.8
Number Needed to Reach Parity 0 19 0 6 0 0 0 1 0 0 0 5 27
Number Anticipated Vacancies 11
Number Years to Reach Goal 5
Annual Placement Rate 0.35 0.00 0.11 0.00 0.00 0.00 0.02 0.00 0.00 0.00 0.09 0.49
2017 Placement Goal 1 0 1 0 0 0 0 0 0 0
2018 Placement Goal 1 0 1 0 0 0 0 0 0 0
2019 Placement Goal 1 0 1 0 0 0 0 0 0 0
2020 Placement Goal 1 0 1 0 0 0 0 0 0 0
2021 Placement Goal 1 0 1 0 0 0 0 0 0 0
Current Number Workforce 47 5 4 2 3 1 3 10 7 65 0.1385
Percentage in Category 72.3 7.7 6.2 3.1 0.0 0.0 4.6 0.0 1.5 0.0 4.6 15.4 10.8 100.0
Percentage of Availability 25.8 47.3 5.8 15.3 0.7 1.7 1 1.2 0.2 0.8 26.7 66.3
Over/Under Representation 46.5 -39.6 0.4 -12.2 -0.7 -1.7 3.6 -1.2 1.3 -0.8 4.6 -11.3 -55.5
Number Needed to Reach Parity 0 26 0 8 0 1 0 1 0 1 0 7 36
Number Anticipated Vacancies 9
Number Years to Reach Goal 5
Annual Placement Rate 0.58 0.00 0.18 0.00 0.02 0.00 0.02 0.00 0.02 0.00 0.16 0.80
2017 Placement Goal 1 0 1 0 1 0 0 0 0 0
2018 Placement Goal 1 0 1 0 0 0 0 0 0 0
2019 Placement Goal 1 0 1 0 0 0 0 0 0 0
2020 Placement Goal 1 0 1 0 0 0 0 0 0 0
2021 Placement Goal 1 0 1 0 0 0 0 0 0 0
Current Number Workforce 1 23 6 2 1 8 31 33 0.0303
Percentage in Category 3.0 69.7 0.0 18.2 0.0 0.0 0.0 0.0 0.0 6.1 3.0 24.2 93.9 100.0
Percentage of Availability 16.9 54.3 6.8 16.1 1.2 2.6 0.5 1 0.2 0.5 28.9 74.5
Over/Under Representation -13.9 15.4 -6.8 2.1 -1.2 -2.6 -0.5 -1.0 -0.2 5.6 0.0 -4.7 19.4
Number Needed to Reach Parity 5 0 2 0 0 1 0 0 0 0 0 2 0
Number Anticipated Vacancies 1
Number Years to Reach Goal 5
Annual Placement Rate 0.00 0.40 0.00 0.00 0.20 0.00 0.00 0.00 0.00 0.00 0.40 0.00
2017 Placement Goal 0 1 0 0 1 0 0 0 0 0
2018 Placement Goal 0 1 0 0 0 0 0 0 0 0
2019 Placement Goal 0 0 0 0 0 0 0 0 0 0
2020 Placement Goal 0 0 0 0 0 0 0 0 0 0
2021 Placement Goal 0 0 0 0 0 0 0 0 0 0
Officials and Administrators
Professional
Technician
Administrative Support

126
Table 5.7b Division 5 Job Placement Goals (continued)
Division 5White
Male
White
Female
Black
Male
Black
Female
Hisp
Male
Hisp
Female
Asian
Male
Asian
Fem
AIAN
Male
AIAN
Female
Ethn
Unk
Total
Mnrt
Total
FemTotal
Vacancy
%
Current Number Workforce 212 1 83 8 2 9 93 1 315 0.0635
Percentage in Category 67.3 0.3 26.3 0.0 2.5 0.0 0.0 0.0 0.6 0.0 2.9 29.5 0.3 100.0
Percentage of Availability 52.7 8.3 15.9 4.9 13 2.6 0.9 0.5 1.1 0.2 39.1 16.5
Over/Under Representation 14.6 -8.0 10.4 -4.9 -10.5 -2.6 -0.9 -0.5 -0.5 -0.2 0.0 -9.6 -16.2
Number Needed to Reach Parity 0 25 0 15 33 8 3 2 1 1 0 30 51
Number Anticipated Vacancies 20
Number Years to Reach Goal 5
Annual Placement Rate 0.25 0.00 0.15 0.33 0.08 0.03 0.02 0.01 0.01 0.00 0.30 0.51
2017 Placement Goal 1 0 1 1 1 0 0 0 0 0
2018 Placement Goal 1 0 1 1 1 0 0 0 0 0
2019 Placement Goal 1 0 1 1 1 0 0 0 0 0
2020 Placement Goal 1 0 1 2 1 0 0 0 0 0
2021 Placement Goal 1 0 1 2 1 0 0 0 0 0
Skilled Craft

127
Table 5.8b Division 6 Job Placement Goals
Division 6White
Male
White
Female
Black
Male
Black
Female
Hisp
Male
Hisp
Female
Asian
Male
Asian
Fem
AIAN
Male
AIAN
Female
Ethn
Unk
Total
Mnrt
Total
FemTotal
Vacancy
%
Current Number Workforce 1 0 0 1 0
Percentage in Category 100.0 0.0 0.0 0.0 0.0 0.0 0.0 0.0 0.0 0.0 0.0 0.0 0.0 100.0
Percentage of Availability 52.5 30 5.4 6.3 2 1.1 1.3 0.8 0.4 0.3 17.6 38.5
Over/Under Representation 47.5 -30.0 -5.4 -6.3 -2.0 -1.1 -1.3 -0.8 -0.4 -0.3 0.0 -17.6 -38.5
Number Needed to Reach Parity 0 0 0 0 0 0 0 0 0 0 0 0 0
Number Anticipated Vacancies 0
Number Years to Reach Goal 0
Annual Placement Rate 0.00 0.00 0.00 0.00 0.00 0.00 0.00 0.00 0.00 0.00
2017 Placement Goal 0 0 0 0 0 0 0 0 0 0
2018 Placement Goal 0 0 0 0 0 0 0 0 0 0
2019 Placement Goal 0 0 0 0 0 0 0 0 0 0
2020 Placement Goal 0 0 0 0 0 0 0 0 0 0
2021 Placement Goal 0 0 0 0 0 0 0 0 0 0
Current Number Workforce 36 4 5 1 2 8 5 48 0.3542
Percentage in Category 75.0 8.3 10.4 2.1 0.0 0.0 0.0 0.0 4.2 0.0 0.0 16.7 10.4 100.0
Percentage of Availability 34.5 42.5 5.1 11.1 1.3 1.9 1.6 1.3 0.2 0.5 23 57.3
Over/Under Representation 40.5 -34.2 5.3 -9.0 -1.3 -1.9 -1.6 -1.3 4.0 -0.5 0.0 -6.3 -46.9
Number Needed to Reach Parity 0 16 0 4 1 1 1 1 0 0 0 3 23
Number Anticipated Vacancies 17
Number Years to Reach Goal 5
Annual Placement Rate 0.19 0.00 0.05 0.01 0.01 0.01 0.01 0.00 0.00 0.00 0.04 0.27
2017 Placement Goal 1 0 1 1 1 0 0 0 0 0
2018 Placement Goal 1 0 1 0 0 0 0 0 0 0
2019 Placement Goal 1 0 1 0 0 0 0 0 0 0
2020 Placement Goal 1 0 1 0 0 0 0 0 0 0
2021 Placement Goal 1 0 0 0 0 0 0 0 0 0
Current Number Workforce 34 5 6 1 1 3 11 6 50 0.4000
Percentage in Category 68.0 10.0 12.0 2.0 0.0 0.0 2.0 0.0 6.0 0.0 0.0 22.0 12.0 100.0
Percentage of Availability 25.8 47.3 5.8 15.3 0.7 1.7 1 1.2 0.2 0.8 26.7 66.3
Over/Under Representation 42.2 -37.3 6.2 -13.3 -0.7 -1.7 1.0 -1.2 5.8 -0.8 0.0 -4.7 -54.3
Number Needed to Reach Parity 0 19 0 7 0 1 0 1 0 0 0 2 27
Number Anticipated Vacancies 20
Number Years to Reach Goal 5
Annual Placement Rate 0.19 0.00 0.07 0.00 0.01 0.00 0.01 0.00 0.00 0.00 0.02 0.27
2017 Placement Goal 1 0 1 0 1 0 0 0 0 0
2018 Placement Goal 1 0 1 0 0 0 0 0 0 0
2019 Placement Goal 1 0 1 0 0 0 0 0 0 0
2020 Placement Goal 1 0 1 0 0 0 0 0 0 0
2021 Placement Goal 1 0 1 0 0 0 0 0 0 0
Current Number Workforce 2 19 2 1 1 3 22 25 0.3600
Percentage in Category 8.0 76.0 0.0 8.0 0.0 0.0 0.0 0.0 0.0 4.0 4.0 12.0 88.0 100.0
Percentage of Availability 16.9 54.3 6.8 16.1 1.2 2.6 0.5 1 0.2 0.5 28.9 74.5
Over/Under Representation -8.9 21.7 -6.8 -8.1 -1.2 -2.6 -0.5 -1.0 -0.2 3.5 4.0 -16.9 13.5
Number Needed to Reach Parity 2 0 2 2 0 1 0 0 0 0 0 4 0
Number Anticipated Vacancies 9
Number Years to Reach Goal 5
Annual Placement Rate 0.00 0.04 0.04 0.00 0.02 0.00 0.00 0.00 0.00 0.00 0.09 0.00
2017 Placement Goal 0 1 1 0 1 0 0 0 0 0
2018 Placement Goal 0 1 1 0 0 0 0 0 0 0
2019 Placement Goal 0 0 0 0 0 0 0 0 0 0
2020 Placement Goal 0 0 0 0 0 0 0 0 0 0
2021 Placement Goal 0 0 0 0 0 0 0 0 0 0
Officials and Administrators
Professional
Technician
Administrative Support

128
Table 5.8b Division 6 Job Placement Goals (continued)
Division 6White
Male
White
Female
Black
Male
Black
Female
Hisp
Male
Hisp
Female
Asian
Male
Asian
Fem
AIAN
Male
AIAN
Female
Ethn
Unk
Total
Mnrt
Total
FemTotal
Vacancy
%
Current Number Workforce 189 49 2 4 1 1 25 1 3 83 4 275 0.1600
Percentage in Category 68.7 0.0 17.8 0.7 1.5 0.4 0.4 0.0 9.1 0.4 1.1 30.2 1.5 100.0
Percentage of Availability 52.7 8.3 15.9 4.9 13.0 2.6 0.9 0.5 1.1 0.2 39.1 16.5
Over/Under Representation 16.0 -8.3 1.9 -4.2 -11.5 -2.2 -0.5 -0.5 8.0 0.2 1.1 -8.9 -15.0
Number Needed to Reach Parity 0 23 0 11 32 6 1 1 0 0 0 25 41
Number Anticipated Vacancies 44
Number Years to Reach Goal 5
Annual Placement Rate 0.10 0.00 0.05 0.15 0.03 0.00 0.00 0.00 0.00 0.00 0.11 0.19
2017 Placement Goal 1 0 1 1 1 0 0 0 0 0
2018 Placement Goal 1 0 1 1 1 0 0 0 0 0
2019 Placement Goal 1 0 1 1 1 0 0 0 0 0
2020 Placement Goal 1 0 1 1 1 0 0 0 0 0
2021 Placement Goal 1 0 1 2 1 0 0 0 0 0
Skilled Craft

129
Table 5.9b Division 7 Job Placement Goals
Division 7White
Male
White
Female
Black
Male
Black
Female
Hisp
Male
Hisp
Female
Asian
Male
Asian
Fem
AIAN
Male
AIAN
Female
Ethn
Unk
Total
Mnrt
Total
FemTotal
Vacancy
%
Current Number Workforce 1 0 0 1 0
Percentage in Category 100.0 0.0 0.0 0.0 0.0 0.0 0.0 0.0 0.0 0.0 0.0 0.0 0.0 100.0
Percentage of Availability 52.5 30 5.4 6.3 2 1.1 1.3 0.8 0.4 0.3 17.6 38.5
Over/Under Representation 47.5 -30.0 -5.4 -6.3 -2.0 -1.1 -1.3 -0.8 -0.4 -0.3 0.0 -17.6 -38.5
Number Needed to Reach Parity 0 0 0 0 0 0 0 0 0 0 0 0 0
Number Anticipated Vacancies 0
Number Years to Reach Goal 0
Annual Placement Rate 0.00 0.00 0.00 0.00 0.00 0.00 0.00 0.00 0.00 0.00
2017 Placement Goal 0 0 0 0 0 0 0 0 0 0
2018 Placement Goal 0 0 0 0 0 0 0 0 0 0
2019 Placement Goal 0 0 0 0 0 0 0 0 0 0
2020 Placement Goal 0 0 0 0 0 0 0 0 0 0
2021 Placement Goal 0 0 0 0 0 0 0 0 0 0
Current Number Workforce 28 10 8 4 1 13 14 51 0.2941
Percentage in Category 54.9 19.6 15.7 7.8 0.0 0.0 0.0 0.0 2.0 0.0 0.0 25.5 27.5 100.0
Percentage of Availability 34.5 42.5 5.1 11.1 1.3 1.9 1.6 1.3 0.2 0.5 23 57.3
Over/Under Representation 20.4 -22.9 10.6 -3.3 -1.3 -1.9 -1.6 -1.3 1.8 -0.5 0.0 2.5 -29.8
Number Needed to Reach Parity 0 12 0 2 1 1 1 1 0 0 0 0 15
Number Anticipated Vacancies 15
Number Years to Reach Goal 5
Annual Placement Rate 0.16 0.00 0.03 0.01 0.01 0.01 0.01 0.00 0.00 0.00
2017 Placement Goal 1 0 1 1 1 0 0 0 0 0
2018 Placement Goal 1 0 1 0 0 0 0 0 0 0
2019 Placement Goal 1 0 0 0 0 0 0 0 0 0
2020 Placement Goal 1 0 0 0 0 0 0 0 0 0
2021 Placement Goal 1 0 0 0 0 0 0 0 0 0
Current Number Workforce 69 2 3 2 1 5 2 77 0.2987
Percentage in Category 89.6 2.6 3.9 0.0 0.0 0.0 0.0 0.0 2.6 0.0 1.3 6.5 2.6 100.0
Percentage of Availability 25.8 47.3 5.8 15.3 0.7 1.7 1 1.2 0.2 0.8 26.7 66.3
Over/Under Representation 63.8 -44.7 -1.9 -15.3 -0.7 -1.7 -1.0 -1.2 2.4 -0.8 0.0 -20.2 -63.7
Number Needed to Reach Parity 0 34 1 12 1 1 1 1 0 1 0 16 49
Number Anticipated Vacancies 23
Number Years to Reach Goal 5
Annual Placement Rate 0.30 0.01 0.10 0.01 0.01 0.01 0.01 0.00 0.01 0.00 0.14 0.43
2017 Placement Goal 1 1 1 1 1 0 0 0 0 0
2018 Placement Goal 1 0 1 0 0 0 0 0 0 0
2019 Placement Goal 1 0 1 0 0 0 0 0 0 0
2020 Placement Goal 2 0 1 0 0 0 0 0 0 0
2021 Placement Goal 2 0 1 0 0 0 0 0 0 0
Current Number Workforce 1 25 3 1 4 28 30 0.2000
Percentage in Category 3.3 83.3 0.0 10.0 0.0 0.0 0.0 0.0 3.3 0.0 0.0 13.3 93.3 100.0
Percentage of Availability 16.9 54.3 6.8 16.1 1.2 2.6 0.5 1 0.2 0.5 28.9 74.5
Over/Under Representation -13.6 29.0 -6.8 -6.1 -1.2 -2.6 -0.5 -1.0 3.1 -0.5 0.0 -15.6 18.8
Number Needed to Reach Parity 5 0 2 2 0 1 0 0 0 0 0 5 0
Number Anticipated Vacancies 6
Number Years to Reach Goal 5
Annual Placement Rate 0.00 0.07 0.07 0.00 0.03 0.00 0.00 0.00 0.00 0.00 0.17 0.00
2017 Placement Goal 0 1 1 0 1 0 0 0 0 0
2018 Placement Goal 0 1 1 0 0 0 0 0 0 0
2019 Placement Goal 0 0 0 0 0 0 0 0 0 0
2020 Placement Goal 0 0 0 0 0 0 0 0 0 0
2021 Placement Goal 0 0 0 0 0 0 0 0 0 0
Officials and Administrators
Professional
Technician
Administrative Support

130
Table 5.9b Division 7 Job Placement Goals (continued)
Division 7White
Male
White
Female
Black
Male
Black
Female
Hisp
Male
Hisp
Female
Asian
Male
Asian
Fem
AIAN
Male
AIAN
Female
Ethn
Unk
Total
Mnrt
Total
FemTotal
Vacancy
%
Current Number Workforce 181 44 13 2 57 0 240 0.3167
Percentage in Category 75.4 0.0 18.3 0.0 0.0 0.0 0.0 0.0 5.4 0.0 0.8 23.8 0.0 100.0
Percentage of Availability 52.7 8.3 15.9 4.9 13 2.6 0.9 0.5 1.1 0.2 39.1 16.5
Over/Under Representation 22.7 -8.3 2.4 -4.9 -13.0 -2.6 -0.9 -0.5 4.3 -0.2 0.8 -15.4 -16.5
Number Needed to Reach Parity 0 20 0 12 31 6 2 1 0 0 0 37 40
Number Anticipated Vacancies 76
Number Years to Reach Goal 5
Annual Placement Rate 0.05 0.00 0.03 0.08 0.02 0.01 0.00 0.00 0.00 0.00 0.10 0.11
2017 Placement Goal 1 0 1 1 1 0 0 0 0 0
2018 Placement Goal 1 0 1 1 1 0 0 0 0 0
2019 Placement Goal 1 0 1 1 1 0 0 0 0 0
2020 Placement Goal 1 0 1 1 1 0 0 0 0 0
2021 Placement Goal 1 0 1 2 1 0 0 0 0 0
Skilled Craft

131
Table 5.10b Division 8 Job Placement Goals
Division 8White
Male
White
Female
Black
Male
Black
Female
Hisp
Male
Hisp
Female
Asian
Male
Asian
Fem
AIAN
Male
AIAN
Female
Ethn
Unk
Total
Mnrt
Total
FemTotal
Vacancy
%
Current Number Workforce 37 5 3 1 1 1 5 6 48 0.2083
Percentage in Category 77.1 10.4 6.3 0.0 2.1 2.1 0.0 0.0 0.0 0.0 2.1 10.4 12.5 100.0
Percentage of Availability 34.5 42.5 5.1 11.1 1.3 1.9 1.6 1.3 0.2 0.5 23 57.3
Over/Under Representation 42.6 -32.1 1.2 -11.1 0.8 0.2 -1.6 -1.3 -0.2 -0.5 0.0 -12.6 -44.8
Number Needed to Reach Parity 0 15 0 5 0 0 1 1 0 0 0 6 22
Number Anticipated Vacancies 10
Number Years to Reach Goal 5
Annual Placement Rate 0.30 0.00 0.10 0.00 0.00 0.02 0.02 0.00 0.00 0.00 0.12 0.44
2017 Placement Goal 1 0 1 0 0 0 0 0 0 0
2018 Placement Goal 1 0 1 0 0 0 0 0 0 0
2019 Placement Goal 1 0 1 0 0 0 0 0 0 0
2020 Placement Goal 1 0 1 0 0 0 0 0 0 0
2021 Placement Goal 1 0 1 0 0 0 0 0 0 0
Current Number Workforce 48 1 4 1 5 2 54 0.3704
Percentage in Category 88.9 1.9 7.4 1.9 0.0 0.0 0.0 0.0 0.0 0.0 0.0 9.3 3.7 100.0
Percentage of Availability 25.8 47.3 5.8 15.3 0.7 1.7 1 1.2 0.2 0.8 26.7 66.3
Over/Under Representation 63.1 -45.4 1.6 -13.4 -0.7 -1.7 -1.0 -1.2 -0.2 -0.8 0.0 -17.4 -62.6
Number Needed to Reach Parity 0 25 0 7 0 1 1 1 0 0 0 9 34
Number Anticipated Vacancies 20
Number Years to Reach Goal 5
Annual Placement Rate 0.25 0.00 0.07 0.00 0.01 0.01 0.01 0.00 0.00 0.00 0.09 0.34
2017 Placement Goal 1 0 1 0 1 0 0 0 0 0
2018 Placement Goal 1 0 1 0 0 0 0 0 0 0
2019 Placement Goal 1 0 1 0 0 0 0 0 0 0
2020 Placement Goal 1 0 1 0 0 0 0 0 0 0
2021 Placement Goal 1 0 1 0 0 0 0 0 0 0
Current Number Workforce 5 23 0 23 28 0.0714
Percentage in Category 17.9 82.1 0.0 0.0 0.0 0.0 0.0 0.0 0.0 0.0 0.0 0.0 82.1 100.0
Percentage of Availability 16.9 54.3 6.8 16.1 1.2 2.6 0.5 1 0.2 0.5 28.9 74.5
Over/Under Representation 1.0 27.8 -6.8 -16.1 -1.2 -2.6 -0.5 -1.0 -0.2 -0.5 0.0 -28.9 7.6
Number Needed to Reach Parity 0 0 2 5 0 1 0 0 0 0 0 8 0
Number Anticipated Vacancies 2
Number Years to Reach Goal 5
Annual Placement Rate 0.00 0.20 0.50 0.00 0.10 0.00 0.00 0.00 0.00 0.00 0.80 0.00
2017 Placement Goal 0 1 1 0 1 0 0 0 0 0
2018 Placement Goal 0 1 1 0 0 0 0 0 0 0
2019 Placement Goal 0 0 1 0 0 0 0 0 0 0
2020 Placement Goal 0 0 1 0 0 0 0 0 0 0
2021 Placement Goal 0 0 1 0 0 0 0 0 0 0
Current Number Workforce 229 4 48 1 5 22 2 76 5 311 0.1511
Percentage in Category 73.6 1.3 15.4 0.3 1.6 0.0 0.0 0.0 7.1 0.0 0.6 24.4 1.6 100.0
Percentage of Availability 52.7 8.3 15.9 4.9 13 2.6 0.9 0.5 1.1 0.2 39.1 16.5
Over/Under Representation 20.9 -7.0 -0.5 -4.6 -11.4 -2.6 -0.9 -0.5 6.0 -0.2 0.0 -14.7 -14.9
Number Needed to Reach Parity 0 22 1 14 35 8 3 2 0 1 0 46 46
Number Anticipated Vacancies 47
Number Years to Reach Goal 5
Annual Placement Rate 0.09 0.00 0.06 0.15 0.03 0.01 0.01 0.00 0.00 0.00 0.20 0.20
2017 Placement Goal 1 1 1 1 1 0 0 0 0 0
2018 Placement Goal 1 0 1 1 1 0 0 0 0 0
2019 Placement Goal 1 0 1 1 1 0 0 0 0 0
2020 Placement Goal 1 0 1 2 1 0 0 0 0 0
2021 Placement Goal 1 0 1 2 1 0 0 0 0 0
Professional
Technician
Administrative Support
Skilled Craft

132
Table 5.10b Division 8 Job Placement Goals (continued)
Division 8White
Male
White
Female
Black
Male
Black
Female
Hisp
Male
Hisp
Female
Asian
Male
Asian
Fem
AIAN
Male
AIAN
Female
Ethn
Unk
Total
Mnrt
Total
FemTotal
Vacancy
%
Current Number Workforce 1 0 1 1 0.0000
Percentage in Category 0.0 100.0 0.0 0.0 0.0 0.0 0.0 0.0 0.0 0.0 0.0 0.0 100.0 100.0
Percentage of Availability 20.5 35.4 10.7 19.1 5.4 5.3 1 1.3 0.3 0.9 44 62
Over/Under Representation -20.5 64.6 -10.7 -19.1 -5.4 -5.3 -1.0 -1.3 -0.3 -0.9 0.0 -44.0 38.0
Number Needed to Reach Parity 0 0 0 0 0 0 0 0 0 0 0 0 0
Number Anticipated Vacancies 0
Number Years to Reach Goal 0
Annual Placement Rate 0.00 0.00 0.00 0.00 0.00 0.00 0.00 0.00 0.00 0.00
2017 Placement Goal 0 0 0 0 0 0 0 0 0 0
2018 Placement Goal 0 0 0 0 0 0 0 0 0 0
2019 Placement Goal 0 0 0 0 0 0 0 0 0 0
2020 Placement Goal 0 0 0 0 0 0 0 0 0 0
2021 Placement Goal 0 0 0 0 0 0 0 0 0 0
Service and Maintenance

133
Table 5.11b Division 9 Job Placement Goals
Division 9White
Male
White
Female
Black
Male
Black
Female
Hisp
Male
Hisp
Female
Asian
Male
Asian
Female
AIAN
Male
AIAN
Female
Ethn
Unk
Total
Mnrt
Total
FemaleTotal
Vacancy
%
Current Number Workforce 1 0 0 1 0
Percentage in Category 100.0 0.0 0.0 0.0 0.0 0.0 0.0 0.0 0.0 0.0 0.0 0.0 0.0 100.0
Percentage of Availability 52.5 30 5.4 6.3 2 1.1 1.3 0.8 0.4 0.3 17.6 38.5
Over/Under Representation 47.5 -30.0 -5.4 -6.3 -2.0 -1.1 -1.3 -0.8 -0.4 -0.3 0.0 -17.6 -38.5
Number Needed to Reach Parity 0 0 0 0 0 0 0 0 0 0 0 0 0
Number Anticipated Vacancies 0
Number Years to Reach Goal 0
Annual Placement Rate 0.00 0.00 0.00 0.00 0.00 0.00 0.00 0.00 0.00 0.00
2017 Placement Goal 0 0 0 0 0 0 0 0 0 0
2018 Placement Goal 0 0 0 0 0 0 0 0 0 0
2019 Placement Goal 0 0 0 0 0 0 0 0 0 0
2020 Placement Goal 0 0 0 0 0 0 0 0 0 0
2021 Placement Goal 0 0 0 0 0 0 0 0 0 0
Current Number Workforce 36 6 2 4 1 2 1 10 11 52 0.1154
Percentage in Category 69.2 11.5 3.8 7.7 0.0 1.9 3.8 0.0 1.9 0.0 0.0 19.2 21.2 100.0
Percentage of Availability 34.5 42.5 5.1 11.1 1.3 1.9 1.6 1.3 0.2 0.5 23 57.3
Over/Under Representation 34.7 -31.0 -1.3 -3.4 -1.3 0.0 2.2 -1.3 1.7 -0.5 0.0 -3.8 -36.1
Number Needed to Reach Parity 0 16 1 2 1 0 0 1 0 0 0 2 19
Number Anticipated Vacancies 6
Number Years to Reach Goal 5
Annual Placement Rate 0.53 0.03 0.07 0.03 0.00 0.00 0.03 0.00 0.00 0.00 0.07 0.63
2017 Placement Goal 1 1 1 1 0 0 0 0 0 0
2018 Placement Goal 1 0 1 0 0 0 0 0 0 0
2019 Placement Goal 1 0 0 0 0 0 0 0 0 0
2020 Placement Goal 1 0 0 0 0 0 0 0 0 0
2021 Placement Goal 1 0 0 0 0 0 0 0 0 0
Current Number Workforce 54 4 6 1 1 7 4 66 0.0152
Percentage in Category 81.8 6.1 9.1 0.0 1.5 0.0 0.0 0.0 0.0 0.0 1.5 10.6 6.1 100.0
Percentage of Availability 25.8 47.3 5.8 15.3 0.7 1.7 1 1.2 0.2 0.8 26.7 66.3
Over/Under Representation 56.0 -41.2 3.3 -15.3 0.8 -1.7 -1.0 -1.2 -0.2 -0.8 1.5 -16.1 -60.2
Number Needed to Reach Parity 0 27 0 10 0 1 1 1 0 1 0 11 40
Number Anticipated Vacancies 1
Number Years to Reach Goal 5
Annual Placement Rate 5.40 0.00 2.00 0.00 0.20 0.20 0.20 0.00 0.20 0.00 2.20 8.00
2017 Placement Goal 1 0 1 0 1 0 0 0 0 0
2018 Placement Goal 1 0 1 0 0 0 0 0 0 0
2019 Placement Goal 1 0 1 0 0 0 0 0 0 0
2020 Placement Goal 1 0 1 0 0 0 0 0 0 0
2021 Placement Goal 2 0 1 0 0 0 0 0 0 0
Current Number Workforce 5 26 3 1 3 29 35 0.0000
Percentage in Category 14.3 74.3 0.0 8.6 0.0 0.0 0.0 0.0 0.0 0.0 2.9 8.6 82.9 100.0
Percentage of Availability 16.9 54.3 6.8 16.1 1.2 2.6 0.5 1 0.2 0.5 28.9 74.5
Over/Under Representation -2.6 20.0 -6.8 -7.5 -1.2 -2.6 -0.5 -1.0 -0.2 -0.5 2.9 -20.3 8.4
Number Needed to Reach Parity 1 0 2 3 0 1 0 0 0 0 0 7 0
Number Anticipated Vacancies 0
Number Years to Reach Goal 5
Annual Placement Rate 0.00 0.00 0.00 0.00 0.00 0.00 0.00 0.00 0.00 0.00
2017 Placement Goal 0 1 1 0 1 0 0 0 0 0
2018 Placement Goal 0 1 1 0 0 0 0 0 0 0
2019 Placement Goal 0 0 1 0 0 0 0 0 0 0
2020 Placement Goal 0 0 0 0 0 0 0 0 0 0
2021 Placement Goal 0 0 0 0 0 0 0 0 0 0
Officials and Administrators
Professional
Technician
Administrative Support

134
Table 5.11b Division 9 Job Placement Goals (continued)
Division 9White
Male
White
Female
Black
Male
Black
Female
Hisp
Male
Hisp
Female
Asian
Male
Asian
Female
AIAN
Male
AIAN
Female
Ethn
Unk
Total
Mnrt
Total
FemaleTotal
Vacancy
%
Current Number Workforce 197 9 20 1 7 3 14 31 10 251 0.0478
Percentage in Category 78.5 3.6 8.0 0.4 2.8 0.0 0.0 0.0 1.2 0.0 5.6 12.4 4.0 100.0
Percentage of Availability 52.7 8.3 15.9 4.9 13 2.6 0.9 0.5 1.1 0.2 39.1 16.5
Over/Under Representation 25.8 -4.7 -7.9 -4.5 -10.2 -2.6 -0.9 -0.5 0.1 -0.2 5.6 -26.7 -12.5
Number Needed to Reach Parity 0 12 20 11 26 7 2 1 0 1 0 67 31
Number Anticipated Vacancies 12
Number Years to Reach Goal 5
Annual Placement Rate 0.20 0.33 0.18 0.43 0.12 0.03 0.02 0.00 0.02 0.00 1.12 0.52
2017 Placement Goal 1 1 1 1 1 0 0 0 0 0
2018 Placement Goal 1 1 1 1 1 0 0 0 0 0
2019 Placement Goal 1 1 1 1 1 0 0 0 0 0
2020 Placement Goal 1 1 1 1 1 0 0 0 0 0
2021 Placement Goal 1 1 1 1 1 0 0 0 0 0
Current Number Workforce 1 1 1 1 0 3 0.0000
Percentage in Category 33.3 0.0 33.3 0.0 0.0 0.0 0.0 0.0 0.0 0.0 33.3 33.3 0.0 100.0
Percentage of Availability 20.5 35.4 10.7 19.1 5.4 5.3 1 1.3 0.3 0.9 44 62
Over/Under Representation 12.8 -35.4 22.6 -19.1 -5.4 -5.3 -1.0 -1.3 -0.3 -0.9 33.3 -10.7 -62.0
Number Needed to Reach Parity 0 1 0 1 0 0 0 0 0 0 0 0 2
Number Anticipated Vacancies 0
Number Years to Reach Goal 5
Annual Placement Rate 0.00 0.00 0.00 0.00 0.00 0.00 0.00 0.00 0.00 0.00 0.00 0.00
2017 Placement Goal 1 0 1 0 0 0 0 0 0 0
2018 Placement Goal 0 0 0 0 0 0 0 0 0 0
2019 Placement Goal 0 0 0 0 0 0 0 0 0 0
2020 Placement Goal 0 0 0 0 0 0 0 0 0 0
2021 Placement Goal 0 0 0 0 0 0 0 0 0 0
Service and Maintenance
Skilled Craft

135
Table 5.12b Division 10 Job Placement Goals
Division 10White
Male
White
Female
Black
Male
Black
Female
Hisp
Male
Hisp
Female
Asian
Male
Asian
Female
AIAN
Male
AIAN
Female
Ethn
Unk
Total
Mnrt
Total
FemaleTotal
Vacancy
%
Current Number Workforce 1 0 0 1 0
Percentage in Category 0.0 0.0 0.0 0.0 0.0 0.0 0.0 0.0 0.0 0.0 100.0 0.0 0.0 100.0
Percentage of Availability 52.5 30 5.4 6.3 2 1.1 1.3 0.8 0.4 0.3 17.6 38.5
Over/Under Representation -52.5 -30.0 -5.4 -6.3 -2.0 -1.1 -1.3 -0.8 -0.4 -0.3 100.0 -17.6 -38.5
Number Needed to Reach Parity 1 0 0 0 0 0 0 0 0 0 0 0 0
Number Anticipated Vacancies 0
Number Years to Reach Goal 0
Annual Placement Rate 0.00 0.00 0.00 0.00 0.00 0.00 0.00 0.00 0.00 0.00
2017 Placement Goal 0 0 0 0 0 0 0 0 0 0
2018 Placement Goal 0 0 0 0 0 0 0 0 0 0
2019 Placement Goal 0 0 0 0 0 0 0 0 0 0
2020 Placement Goal 0 0 0 0 0 0 0 0 0 0
2021 Placement Goal 0 0 0 0 0 0 0 0 0 0
Current Number Workforce 39 6 6 4 1 3 8 14 13 67 0.1940
Percentage in Category 58.2 9.0 9.0 6.0 1.5 0.0 0.0 4.5 0.0 0.0 11.9 20.9 19.4 100.0
Percentage of Availability 34.5 42.5 5.1 11.1 1.3 1.9 1.6 1.3 0.2 0.5 23 57.3
Over/Under Representation 23.7 -33.5 3.9 -5.1 0.2 -1.9 -1.6 3.2 -0.2 -0.5 11.9 -2.1 -37.9
Number Needed to Reach Parity 0 22 0 3 0 1 1 0 0 0 0 1 25
Number Anticipated Vacancies 13
Number Years to Reach Goal 5
Annual Placement Rate 0.34 0.00 0.05 0.00 0.02 0.02 0.00 0.00 0.00 0.00 0.02 0.38
2017 Placement Goal 1 0 1 0 1 0 0 0 0 0
2018 Placement Goal 1 0 1 0 0 0 0 0 0 0
2019 Placement Goal 1 0 1 0 0 0 0 0 0 0
2020 Placement Goal 1 0 0 0 0 0 0 0 0 0
2021 Placement Goal 1 0 0 0 0 0 0 0 0 0
Current Number Workforce 52 5 8 2 2 6 12 7 75 0.1867
Percentage in Category 69.3 6.7 10.7 2.7 0.0 0.0 0.0 0.0 2.7 0.0 8.0 16.0 9.3 100.0
Percentage of Availability 25.8 47.3 5.8 15.3 0.7 1.7 1 1.2 0.2 0.8 26.7 66.3
Over/Under Representation 43.5 -40.6 4.9 -12.6 -0.7 -1.7 -1.0 -1.2 2.5 -0.8 8.0 -10.7 -57.0
Number Needed to Reach Parity 0 30 0 9 1 1 1 1 0 1 0 8 43
Number Anticipated Vacancies 14
Number Years to Reach Goal 5
Annual Placement Rate 0.43 0.00 0.13 0.01 0.01 0.01 0.01 0.00 0.01 0.00 0.11 0.61
2017 Placement Goal 1 0 1 1 1 0 0 0 0 0
2018 Placement Goal 1 0 1 0 0 0 0 0 0 0
2019 Placement Goal 1 0 1 0 0 0 0 0 0 0
2020 Placement Goal 1 0 1 0 0 0 0 0 0 0
2021 Placement Goal 2 0 1 0 0 0 0 0 0 0
Current Number Workforce 2 25 5 2 1 7 32 35 0.0857
Percentage in Category 5.7 71.4 0.0 14.3 0.0 5.7 0.0 0.0 0.0 0.0 2.9 20.0 91.4 100.0
Percentage of Availability 16.9 54.3 6.8 16.1 1.2 2.6 0.5 1 0.2 0.5 28.9 74.5
Over/Under Representation -11.2 17.1 -6.8 -1.8 -1.2 3.1 -0.5 -1.0 -0.2 -0.5 2.9 -8.9 16.9
Number Needed to Reach Parity 4 0 2 1 0 0 0 0 0 0 0 3 0
Number Anticipated Vacancies 3
Number Years to Reach Goal 5
Annual Placement Rate 0.00 0.13 0.07 0.00 0.00 0.00 0.00 0.00 0.00 0.00 0.20 0.00
2017 Placement Goal 0 1 1 0 0 0 0 0 0 0
2018 Placement Goal 0 1 0 0 0 0 0 0 0 0
2019 Placement Goal 0 0 0 0 0 0 0 0 0 0
2020 Placement Goal 0 0 0 0 0 0 0 0 0 0
2021 Placement Goal 0 0 0 0 0 0 0 0 0 0
Officials and Administrators
Professional
Technician
Administrative Support

136
Table 5.12b Division 10 Job Placement Goals (continued)
Division 10White
Male
White
Female
Black
Male
Black
Female
Hisp
Male
Hisp
Female
Asian
Male
Asian
Female
AIAN
Male
AIAN
Female
Ethn
Unk
Total
Mnrt
Total
FemaleTotal
Vacancy
%
Current Number Workforce 195 3 26 1 3 1 1 29 32 5 259 0.0656
Percentage in Category 75.3 1.2 10.0 0.4 1.2 0.0 0.0 0.0 0.4 0.4 11.2 12.4 1.9 100.0
Percentage of Availability 52.7 8.3 15.9 4.9 13 2.6 0.9 0.5 1.1 0.2 39.1 16.5
Over/Under Representation 22.6 -7.1 -5.9 -4.5 -11.8 -2.6 -0.9 -0.5 -0.7 0.2 11.2 -26.7 -14.6
Number Needed to Reach Parity 0 18 15 12 31 7 2 1 2 0 0 69 38
Number Anticipated Vacancies 17
Number Years to Reach Goal 5
Annual Placement Rate 0.21 0.18 0.14 0.36 0.08 0.02 0.01 0.02 0.00 0.00 0.81 0.45
2017 Placement Goal 1 1 1 1 1 0 0 0 0 0
2018 Placement Goal 1 1 1 1 1 0 0 0 0 0
2019 Placement Goal 1 1 1 1 1 0 0 0 0 0
2020 Placement Goal 1 1 1 1 1 0 0 0 0 0
2021 Placement Goal 1 1 1 2 1 0 0 0 0 0
Current Number Workforce 1 1 0 1 0.0000
Percentage in Category 0.0 0.0 100.0 0.0 0.0 0.0 0.0 0.0 0.0 0.0 0.0 100.0 0.0 100.0
Percentage of Availability 20.5 35.4 10.7 19.1 5.4 5.3 1 1.3 0.3 0.9 44 62
Over/Under Representation -20.5 -35.4 89.3 -19.1 -5.4 -5.3 -1.0 -1.3 -0.3 -0.9 0.0 56.0 -62.0
Number Needed to Reach Parity 0 0 0 0 0 0 0 0 0 0 0 0 1
Number Anticipated Vacancies 0
Number Years to Reach Goal 0
Annual Placement Rate 0.00 0.00 0.00 0.00 0.00 0.00 0.00 0.00 0.00 0.00
2017 Placement Goal 0 0 0 0 0 0 0 0 0 0
2018 Placement Goal 0 0 0 0 0 0 0 0 0 0
2019 Placement Goal 0 0 0 0 0 0 0 0 0 0
2020 Placement Goal 0 0 0 0 0 0 0 0 0 0
2021 Placement Goal 0 0 0 0 0 0 0 0 0 0
Service and Maintenance
Skilled Craft

137
Table 5.13b Division 11 Job Placement Goals
Division 11White
Male
White
Female
Black
Male
Black
Female
Hisp
Male
Hisp
Female
Asian
Male
Asian
Female
AIAN
Male
AIAN
Female
Ethn
Unk
Total
Mnrt
Total
FemaleTotal
Vacancy
%
Current Number Workforce 1 0 0 1 0
Percentage in Category 100.0 0.0 0.0 0.0 0.0 0.0 0.0 0.0 0.0 0.0 0.0 0.0 0.0 100.0
Percentage of Availability 52.5 30 5.4 6.3 2 1.1 1.3 0.8 0.4 0.3 17.6 38.5
Over/Under Representation 47.5 -30.0 -5.4 -6.3 -2.0 -1.1 -1.3 -0.8 -0.4 -0.3 0.0 -17.6 -38.5
Number Needed to Reach Parity 0 0 0 0 0 0 0 0 0 0 0 0 0
Number Anticipated Vacancies 0
Number Years to Reach Goal 0
Annual Placement Rate 0.00 0.00 0.00 0.00 0.00 0.00 0.00 0.00 0.00 0.00
2017 Placement Goal 0 0 0 0 0 0 0 0 0 0
2018 Placement Goal 0 0 0 0 0 0 0 0 0 0
2019 Placement Goal 0 0 0 0 0 0 0 0 0 0
2020 Placement Goal 0 0 0 0 0 0 0 0 0 0
2021 Placement Goal 0 0 0 0 0 0 0 0 0 0
Current Number Workforce 33 6 1 1 7 40 0.125
Percentage in Category 82.5 15.0 0.0 2.5 0.0 0.0 0.0 0.0 0.0 0.0 0.0 2.5 17.5 100.0
Percentage of Availability 34.5 42.5 5.1 11.1 1.3 1.9 1.6 1.3 0.2 0.5 23 57.3
Over/Under Representation 48.0 -27.5 -5.1 -8.6 -1.3 -1.9 -1.6 -1.3 -0.2 -0.5 0.0 -20.5 -39.8
Number Needed to Reach Parity 0 11 2 3 1 1 1 1 0 0 0 8 16
Number Anticipated Vacancies 5
Number Years to Reach Goal 5
Annual Placement Rate 0.44 0.08 0.12 0.04 0.04 0.04 0.04 0.00 0.00 0.00 0.32 0.64
2017 Placement Goal 1 1 1 1 1 0 0 0 0 0
2018 Placement Goal 1 1 1 0 0 0 0 0 0 0
2019 Placement Goal 1 0 1 0 0 0 0 0 0 0
2020 Placement Goal 1 0 0 0 0 0 0 0 0 0
2021 Placement Goal 1 0 0 0 0 0 0 0 0 0
Current Number Workforce 47 6 1 1 1 6 55 0.1091
Percentage in Category 85.5 10.9 0.0 0.0 0.0 0.0 0.0 0.0 1.8 0.0 1.8 1.8 10.9 100.0
Percentage of Availability 25.8 47.3 5.8 15.3 0.7 1.7 1 1.2 0.2 0.8 26.7 66.3
Over/Under Representation 59.7 -36.4 -5.8 -15.3 -0.7 -1.7 -1.0 -1.2 1.6 -0.8 1.8 -24.9 -55.4
Number Needed to Reach Parity 0 20 3 8 0 1 1 1 0 0 0 14 30
Number Anticipated Vacancies 6
Number Years to Reach Goal 5
Annual Placement Rate 0.67 0.10 0.27 0.00 0.03 0.03 0.03 0.00 0.00 0.00 0.47 1.00
2017 Placement Goal 1 1 1 0 1 0 0 0 0 0
2018 Placement Goal 1 1 1 0 0 0 0 0 0 0
2019 Placement Goal 1 1 1 0 0 0 0 0 0 0
2020 Placement Goal 1 0 1 0 0 0 0 0 0 0
2021 Placement Goal 1 0 1 0 0 0 0 0 0 0
Current Number Workforce 5 19 0 19 24 0.1250
Percentage in Category 20.8 79.2 0.0 0.0 0.0 0.0 0.0 0.0 0.0 0.0 0.0 0.0 79.2 100.0
Percentage of Availability 16.9 54.3 6.8 16.1 1.2 2.6 0.5 1 0.2 0.5 28.9 74.5
Over/Under Representation 3.9 24.9 -6.8 -16.1 -1.2 -2.6 -0.5 -1.0 -0.2 -0.5 0.0 -28.9 4.7
Number Needed to Reach Parity 0 0 2 4 0 1 0 0 0 0 0 7 0
Number Anticipated Vacancies 3
Number Years to Reach Goal 5
Annual Placement Rate 0.00 0.13 0.27 0.00 0.07 0.00 0.00 0.00 0.00 0.00 0.47 0.00
2017 Placement Goal 0 1 1 0 1 0 0 0 0 0
2018 Placement Goal 0 1 1 0 0 0 0 0 0 0
2019 Placement Goal 0 0 1 0 0 0 0 0 0 0
2020 Placement Goal 0 0 1 0 0 0 0 0 0 0
2021 Placement Goal 0 0 0 0 0 0 0 0 0 0
Officials and Administrators
Professional
Technician
Administrative Support

138
Table 5.13b Division 11 Job Placement Goals (continued)
Division 11White
Male
White
Female
Black
Male
Black
Female
Hisp
Male
Hisp
Female
Asian
Male
Asian
Female
AIAN
Male
AIAN
Female
Ethn
Unk
Total
Mnrt
Total
FemaleTotal
Vacancy
%
Current Number Workforce 301 8 6 1 1 2 23 10 9 342 0.1345
Percentage in Category 88.0 2.3 1.8 0.3 0.3 0.0 0.0 0.0 0.6 0.0 6.7 2.9 2.6 100.0
Percentage of Availability 52.7 8.3 15.9 4.9 13 2.6 0.9 0.5 1.1 0.2 39.1 16.5
Over/Under Representation 35.3 -6.0 -14.1 -4.6 -12.7 -2.6 -0.9 -0.5 -0.5 -0.2 6.7 -36.2 -13.9
Number Needed to Reach Parity 0 20 48 16 43 9 3 2 2 1 0 124 47
Number Anticipated Vacancies 46
Number Years to Reach Goal 5
Annual Placement Rate 0.09 0.21 0.07 0.19 0.04 0.01 0.01 0.01 0.00 0.00 0.54 0.20
2017 Placement Goal 1 2 1 2 1 0 0 0 0 0
2018 Placement Goal 1 2 1 2 1 0 0 0 0 0
2019 Placement Goal 1 2 1 2 1 0 0 0 0 0
2020 Placement Goal 1 2 1 2 1 0 0 0 0 0
2021 Placement Goal 1 2 1 1 1 0 0 0 0 0
Skilled Craft

139
Table 5.14b Division 12 Job Placement Goals
Division 12White
Male
White
Female
Black
Male
Black
Female
Hisp
Male
Hisp
Female
Asian
Male
Asian
Female
AIAN
Male
AIAN
Fem
Ethn
Unk
Total
Mnrt
Total
FemaleTotal
Vacancy
%
Current Number Workforce 1 0 0 1 0
Percentage in Category 100.0 0.0 0.0 0.0 0.0 0.0 0.0 0.0 0.0 0.0 0.0 0.0 0.0 100.0
Percentage of Availability 52.5 30 5.4 6.3 2 1.1 1.3 0.8 0.4 0.3 17.6 38.5
Over/Under Representation 47.5 -30.0 -5.4 -6.3 -2.0 -1.1 -1.3 -0.8 -0.4 -0.3 0.0 -17.6 -38.5
Number Needed to Reach Parity 0 0 0 0 0 0 0 0 0 0 0 0 0
Number Anticipated Vacancies 0
Number Years to Reach Goal 0
Annual Placement Rate 0.00 0.00 0.00 0.00 0.00 0.00 0.00 0.00 0.00 0.00
2017 Placement Goal 0 0 0 0 0 0 0 0 0 0
2018 Placement Goal 0 0 0 0 0 0 0 0 0 0
2019 Placement Goal 0 0 0 0 0 0 0 0 0 0
2020 Placement Goal 0 0 0 0 0 0 0 0 0 0
2021 Placement Goal 0 0 0 0 0 0 0 0 0 0
Current Number Workforce 36 8 2 1 1 4 8 48 0.0833
Percentage in Category 75.0 16.7 4.2 0.0 0.0 0.0 2.1 0.0 2.1 0.0 0.0 8.3 16.7 100.0
Percentage of Availability 34.5 42.5 5.1 11.1 1.3 1.9 1.6 1.3 0.2 0.5 23 57.3
Over/Under Representation 40.5 -25.8 -0.9 -11.1 -1.3 -1.9 0.5 -1.3 1.9 -0.5 0.0 -14.7 -40.6
Number Needed to Reach Parity 0 12 0 5 1 1 0 1 0 0 0 7 20
Number Anticipated Vacancies 4
Number Years to Reach Goal 5
Annual Placement Rate 0.60 0.00 0.25 0.05 0.05 0.00 0.05 0.00 0.00 0.00 0.35 1.00
2017 Placement Goal 1 0 1 1 1 0 0 0 0 0
2018 Placement Goal 1 0 1 0 0 0 0 0 0 0
2019 Placement Goal 1 0 1 0 0 0 0 0 0 0
2020 Placement Goal 1 0 1 0 0 0 0 0 0 0
2021 Placement Goal 1 0 1 0 0 0 0 0 0 0
Current Number Workforce 45 2 2 1 1 3 2 51 0.1373
Percentage in Category 88.2 3.9 3.9 0.0 0.0 0.0 0.0 0.0 2.0 0.0 2.0 5.9 3.9 100.0
Percentage of Availability 25.8 47.3 5.8 15.3 0.7 1.7 1 1.2 0.2 0.8 26.7 66.3
Over/Under Representation 62.4 -43.4 -1.9 -15.3 -0.7 -1.7 -1.0 -1.2 1.8 -0.8 2.0 -20.8 -62.4
Number Needed to Reach Parity 0 22 1 8 0 1 1 1 0 0 0 11 32
Number Anticipated Vacancies 7
Number Years to Reach Goal 5
Annual Placement Rate 0.63 0.03 0.23 0.00 0.03 0.03 0.03 0.00 0.00 0.00 0.31 0.91
2017 Placement Goal 1 1 1 0 1 0 0 0 0 0
2018 Placement Goal 1 0 1 0 0 0 0 0 0 0
2019 Placement Goal 1 0 1 0 0 0 0 0 0 0
2020 Placement Goal 1 0 1 0 0 0 0 0 0 0
2021 Placement Goal 2 0 1 0 0 0 0 0 0 0
Current Number Workforce 4 22 1 1 2 24 28 0.1071
Percentage in Category 14.3 78.6 0.0 3.6 0.0 0.0 0.0 0.0 0.0 3.6 0.0 7.1 85.7 100.0
Percentage of Availability 16.9 54.3 6.8 16.1 1.2 2.6 0.5 1 0.2 0.5 28.9 74.5
Over/Under Representation -2.6 24.3 -6.8 -12.5 -1.2 -2.6 -0.5 -1.0 -0.2 3.1 0.0 -21.8 11.2
Number Needed to Reach Parity 1 0 2 4 0 1 0 0 0 0 0 6 0
Number Anticipated Vacancies 3
Number Years to Reach Goal 5
Annual Placement Rate 0.00 0.13 0.27 0.00 0.07 0.00 0.00 0.00 0.00 0.00 0.40 0.00
2017 Placement Goal 0 1 1 0 1 0 0 0 0 0
2018 Placement Goal 0 1 1 0 0 0 0 0 0 0
2019 Placement Goal 0 0 1 0 0 0 0 0 0 0
2020 Placement Goal 0 0 1 0 0 0 0 0 0 0
2021 Placement Goal 0 0 0 0 0 0 0 0 0 0
Officials and Administrators
Professional
Technician
Administrative Support

140
Table 5.14b Division 12 Job Placement Goals (continued)
Division 12White
Male
White
Female
Black
Male
Black
Female
Hisp
Male
Hisp
Female
Asian
Male
Asian
Female
AIAN
Male
AIAN
Fem
Ethn
Unk
Total
Mnrt
Total
FemaleTotal
Vacancy
%
Current Number Workforce 233 5 8 1 7 6 16 5 260 0.0923
Percentage in Category 89.6 1.9 3.1 0.0 0.4 0.0 0.0 0.0 2.7 0.0 2.3 6.2 1.9 100.0
Percentage of Availability 52.7 8.3 15.9 4.9 13 2.6 0.9 0.5 1.1 0.2 39.1 16.5
Over/Under Representation 36.9 -6.4 -12.8 -4.9 -12.6 -2.6 -0.9 -0.5 1.6 -0.2 2.3 -32.9 -14.6
Number Needed to Reach Parity 0 17 33 13 33 7 2 1 0 1 0 86 38
Number Anticipated Vacancies 24
Number Years to Reach Goal 5
Annual Placement Rate 0.14 0.28 0.11 0.28 0.06 0.02 0.01 0.00 0.01 0.00 0.72 0.32
2017 Placement Goal 1 1 1 1 1 0 0 0 0 0
2018 Placement Goal 1 1 1 1 1 0 0 0 0 0
2019 Placement Goal 1 1 1 1 1 0 0 0 0 0
2020 Placement Goal 1 2 1 2 1 0 0 0 0 0
2021 Placement Goal 1 2 1 2 1 0 0 0 0 0
Current Number Workforce 1 1 0 1 0.0000
Percentage in Category 0.0 0.0 100.0 0.0 0.0 0.0 0.0 0.0 0.0 0.0 0.0 100.0 0.0 100.0
Percentage of Availability 20.5 35.4 10.7 19.1 5.4 5.3 1 1.3 0.3 0.9 44 62
Over/Under Representation -20.5 -35.4 89.3 -19.1 -5.4 -5.3 -1.0 -1.3 -0.3 -0.9 0.0 56.0 -62.0
Number Needed to Reach Parity 0 0 0 0 0 0 0 0 0 0 0 0 1
Number Anticipated Vacancies 0
Number Years to Reach Goal 0
Annual Placement Rate 0.00 0.00 0.00 0.00 0.00 0.00 0.00 0.00 0.00 0.00 0.00 0.00
2017 Placement Goal 0 0 0 0 0 0 0 0 0 0 0 0
2018 Placement Goal 0 0 0 0 0 0 0 0 0 0 0 0
2019 Placement Goal 0 0 0 0 0 0 0 0 0 0 0 0
2020 Placement Goal 0 0 0 0 0 0 0 0 0 0 0 0
2021 Placement Goal 0 0 0 0 0 0 0 0 0 0 0 0
Service and Maintenance
Skilled Craft

141
Table 5.15b Division 13 Job Placement Goals
Division 13White
Male
White
Female
Black
Male
Black
Female
Hisp
Male
Hisp
Fem
Asian
Male
Asian
Female
AIAN
Male
AIAN
Female
Ethn
Unk
Total
Mnrt
Total
FemTotal
Vacancy
%
Current Number Workforce 1 0 0 1 0
Percentage in Category 100.0 0.0 0.0 0.0 0.0 0.0 0.0 0.0 0.0 0.0 0.0 0.0 0.0 100.0
Percentage of Availability 52.5 30 5.4 6.3 2 1.1 1.3 0.8 0.4 0.3 17.6 38.5
Over/Under Representation 47.5 -30.0 -5.4 -6.3 -2.0 -1.1 -1.3 -0.8 -0.4 -0.3 0.0 -17.6 -38.5
Number Needed to Reach Parity 0 0 0 0 0 0 0 0 0 0 0 0 0
Number Anticipated Vacancies 0
Number Years to Reach Goal 0
Annual Placement Rate 0.00 0.00 0.00 0.00 0.00 0.00 0.00 0.00 0.00 0.00
2017 Placement Goal 0 0 0 0 0 0 0 0 0 0
2018 Placement Goal 0 0 0 0 0 0 0 0 0 0
2019 Placement Goal 0 0 0 0 0 0 0 0 0 0
2020 Placement Goal 0 0 0 0 0 0 0 0 0 0
2021 Placement Goal 0 0 0 0 0 0 0 0 0 0
Current Number Workforce 32 4 2 2 4 38 0.1316
Percentage in Category 84.2 10.5 5.3 0.0 0.0 0.0 0.0 0.0 0.0 0.0 0.0 5.3 10.5 100.0
Percentage of Availability 34.5 42.5 5.1 11.1 1.3 1.9 1.6 1.3 0.2 0.5 23 57.3
Over/Under Representation 49.7 -32.0 0.2 -11.1 -1.3 -1.9 -1.6 -1.3 -0.2 -0.5 0.0 -17.7 -46.8
Number Needed to Reach Parity 0 12 0 4 0 1 1 0 0 0 0 7 18
Number Anticipated Vacancies 5
Number Years to Reach Goal 5
Annual Placement Rate 0.48 0.00 0.16 0.00 0.04 0.04 0.00 0.00 0.00 0.00 0.28 0.72
2017 Placement Goal 1 0 1 0 1 0 0 0 0 0
2018 Placement Goal 1 0 1 0 0 0 0 0 0 0
2019 Placement Goal 1 0 1 0 0 0 0 0 0 0
2020 Placement Goal 1 0 1 0 0 0 0 0 0 0
2021 Placement Goal 1 0 0 0 0 0 0 0 0 0
Current Number Workforce 52 4 1 1 4 57 0.0702
Percentage in Category 91.2 7.0 0.0 0.0 0.0 0.0 0.0 0.0 1.8 0.0 0.0 1.8 7.0 100.0
Percentage of Availability 25.8 47.3 5.8 15.3 0.7 1.7 1 1.2 0.2 0.8 26.7 66.3
Over/Under Representation 65.4 -40.3 -5.8 -15.3 -0.7 -1.7 -1.0 -1.2 1.6 -0.8 0.0 -24.9 -59.3
Number Needed to Reach Parity 0 23 3 9 0 1 1 1 0 0 0 14 34
Number Anticipated Vacancies 4
Number Years to Reach Goal 5
Annual Placement Rate 1.15 0.15 0.45 0.00 0.05 0.05 0.05 0.00 0.00 0.00 0.70 1.70
2017 Placement Goal 1 1 1 0 1 0 0 0 0 0
2018 Placement Goal 1 1 1 0 0 0 0 0 0 0
2019 Placement Goal 1 1 1 0 0 0 0 0 0 0
2020 Placement Goal 1 0 1 0 0 0 0 0 0 0
2021 Placement Goal 1 0 1 0 0 0 0 0 0 0
Current Number Workforce 6 17 2 2 19 25 0.0400
Percentage in Category 24.0 68.0 0.0 8.0 0.0 0.0 0.0 0.0 0.0 0.0 0.0 8.0 76.0 100.0
Percentage of Availability 16.9 54.3 6.8 16.1 1.2 2.6 0.5 1 0.2 0.5 28.9 74.5
Over/Under Representation 7.1 13.7 -6.8 -8.1 -1.2 -2.6 -0.5 -1.0 -0.2 -0.5 0.0 -20.9 1.5
Number Needed to Reach Parity 0 0 2 2 0 1 0 0 0 0 0 5 0
Number Anticipated Vacancies 1
Number Years to Reach Goal 5
Annual Placement Rate 0.00 0.40 0.40 0.00 0.20 0.00 0.00 0.00 0.00 0.00 1.00 0.00
2017 Placement Goal 0 1 1 0 1 0 0 0 0 0
2018 Placement Goal 0 1 1 0 0 0 0 0 0 0
2019 Placement Goal 0 0 0 0 0 0 0 0 0 0
2020 Placement Goal 0 0 0 0 0 0 0 0 0 0
2021 Placement Goal 0 0 0 0 0 0 0 0 0 0
Officials and Administrators
Professional
Technician
Administrative Support

142
Table 5.15b Division 13 Job Placement Goals (continued)
Division 13White
Male
White
Female
Black
Male
Black
Female
Hisp
Male
Hisp
Fem
Asian
Male
Asian
Female
AIAN
Male
AIAN
Female
Ethn
Unk
Total
Mnrt
Total
FemTotal
Vacancy
%
Current Number Workforce 304 7 8 2 1 9 2 20 9 333 0.0450
Percentage in Category 91.3 2.1 2.4 0.6 0.3 0.0 0.0 0.0 2.7 0.0 0.6 6.0 2.7 100.0
Percentage of Availability 52.7 8.3 15.9 4.9 13 2.6 0.9 0.5 1.1 0.2 39.1 16.5
Over/Under Representation 38.6 -6.2 -13.5 -4.3 -12.7 -2.6 -0.9 -0.5 1.6 -0.2 0.6 -33.1 -13.8
Number Needed to Reach Parity 0 21 45 14 42 9 3 2 0 1 0 110 46
Number Anticipated Vacancies 15
Number Years to Reach Goal 5
Annual Placement Rate 0.28 0.60 0.19 0.56 0.12 0.04 0.03 0.00 0.01 0.00 1.47 0.61
2017 Placement Goal 1 2 1 2 1 0 0 0 0 0
2018 Placement Goal 1 2 1 2 1 0 0 0 0 0
2019 Placement Goal 1 2 1 2 1 0 0 0 0 0
2020 Placement Goal 1 2 1 2 1 0 0 0 0 0
2021 Placement Goal 1 1 1 1 1 0 0 0 0 0
Skilled Craft

143
Table 5.16b Division 14 Job Placement Goals
Division 14White
Male
White
Female
Black
Male
Black
Female
Hisp
Male
Hisp
Female
Asian
Male
Asian
Female
AIAN
Male
AIAN
Female
Ethn
Unk
Total
Mnrt
Total
FemaleTotal
Vacancy
%
Current Number Workforce 1 0 0 1 1
Percentage in Category 100.0 0.0 0.0 0.0 0.0 0.0 0.0 0.0 0.0 0.0 0.0 0.0 0.0 100.0
Percentage of Availability 52.5 30 5.4 6.3 2 1.1 1.3 0.8 0.4 0.3 17.6 38.5
Over/Under Representation 47.5 -30.0 -5.4 -6.3 -2.0 -1.1 -1.3 -0.8 -0.4 -0.3 0.0 -17.6 -38.5
Number Needed to Reach Parity 0 0 0 0 0 0 0 0 0 0 0 0 0
Number Anticipated Vacancies 1
Number Years to Reach Goal 1
Annual Placement Rate 0.00 0.00 0.00 0.00 0.00 0.00 0.00 0.00 0.00 0.00
2017 Placement Goal 0 0 0 0 0 0 0 0 0 0
2018 Placement Goal 0 0 0 0 0 0 0 0 0 0
2019 Placement Goal 0 0 0 0 0 0 0 0 0 0
2020 Placement Goal 0 0 0 0 0 0 0 0 0 0
2021 Placement Goal 0 0 0 0 0 0 0 0 0 0
Current Number Workforce 36 5 1 0 5 42 0.2381
Percentage in Category 85.7 11.9 0.0 0.0 0.0 0.0 0.0 0.0 0.0 0.0 2.4 0.0 11.9 100.0
Percentage of Availability 34.5 42.5 5.1 11.1 1.3 1.9 1.6 1.3 0.2 0.5 23 57.3
Over/Under Representation 51.2 -30.6 -5.1 -11.1 -1.3 -1.9 -1.6 -1.3 -0.2 -0.5 2.4 -23.0 -45.4
Number Needed to Reach Parity 0 13 2 5 1 1 1 1 0 0 0 10 19
Number Anticipated Vacancies 10
Number Years to Reach Goal 5
Annual Placement Rate 0.26 0.04 0.10 0.02 0.02 0.02 0.02 0.00 0.00 0.00 0.20 0.38
2017 Placement Goal 1 1 1 1 1 0 0 0 0 0
2018 Placement Goal 1 1 1 0 0 0 0 0 0 0
2019 Placement Goal 1 0 1 0 0 0 0 0 0 0
2020 Placement Goal 1 0 1 0 0 0 0 0 0 0
2021 Placement Goal 1 0 1 0 0 0 0 0 0 0
Current Number Workforce 56 1 1 1 3 1 1 6 2 64 0.0625
Percentage in Category 87.5 1.6 1.6 0.0 0.0 0.0 1.6 0.0 4.7 1.6 1.6 9.4 3.1 100.0
Percentage of Availability 25.8 47.3 5.8 15.3 0.7 1.7 1 1.2 0.2 0.8 26.7 66.3
Over/Under Representation 61.7 -45.7 -4.2 -15.3 -0.7 -1.7 0.6 -1.2 4.5 0.8 1.6 -17.3 -63.2
Number Needed to Reach Parity 0 29 3 10 0 1 0 1 0 0 0 11 40
Number Anticipated Vacancies 4
Number Years to Reach Goal 5
Annual Placement Rate 1.45 0.15 0.50 0.00 0.05 0.00 0.05 0.00 0.00 0.00 0.55 2.00
2017 Placement Goal 1 1 1 0 1 0 0 0 0 0
2018 Placement Goal 1 1 1 0 0 0 0 0 0 0
2019 Placement Goal 1 1 1 0 0 0 0 0 0 0
2020 Placement Goal 1 0 1 0 0 0 0 0 0 0
2021 Placement Goal 2 0 1 0 0 0 0 0 0 0
Current Number Workforce 7 23 0 23 30 0.1000
Percentage in Category 23.3 76.7 0.0 0.0 0.0 0.0 0.0 0.0 0.0 0.0 0.0 0.0 76.7 100.0
Percentage of Availability 16.9 54.3 6.8 16.1 1.2 2.6 0.5 1 0.2 0.5 28.9 74.5
Over/Under Representation 6.4 22.4 -6.8 -16.1 -1.2 -2.6 -0.5 -1.0 -0.2 -0.5 0.0 -28.9 2.2
Number Needed to Reach Parity 0 0 2 5 0 1 0 0 0 0 0 9 0
Number Anticipated Vacancies 3
Number Years to Reach Goal 5
Annual Placement Rate 0.00 0.13 0.33 0.00 0.07 0.00 0.00 0.00 0.00 0.00 0.60 0.00
2017 Placement Goal 0 1 1 0 1 0 0 0 0 0
2018 Placement Goal 0 1 1 0 0 0 0 0 0 0
2019 Placement Goal 0 0 1 0 0 0 0 0 0 0
2020 Placement Goal 0 0 1 0 0 0 0 0 0 0
2021 Placement Goal 0 0 1 0 0 0 0 0 0 0
Officials and Administrators
Professional
Technician
Administrative Support

144
Table 5.16b Division 14 Job Placement Goals (continued)
Division 14White
Male
White
Female
Black
Male
Black
Female
Hisp
Male
Hisp
Female
Asian
Male
Asian
Female
AIAN
Male
AIAN
Female
Ethn
Unk
Total
Mnrt
Total
FemaleTotal
Vacancy
%
Current Number Workforce 306 1 6 1 1 14 1 11 23 2 341 0.1026
Percentage in Category 89.7 0.3 1.8 0.0 0.3 0.0 0.3 0.0 4.1 0.3 3.2 6.7 0.6 100.0
Percentage of Availability 52.7 8.3 15.9 4.9 13 2.6 0.9 0.5 1.1 0.2 39.1 16.5
Over/Under Representation 37.0 -8.0 -14.1 -4.9 -12.7 -2.6 -0.6 -0.5 3.0 0.1 3.2 -32.4 -15.9
Number Needed to Reach Parity 0 27 48 17 43 9 2 2 0 0 0 110 54
Number Anticipated Vacancies 35
Number Years to Reach Goal 5
Annual Placement Rate 0.15 0.27 0.10 0.25 0.05 0.01 0.01 0.00 0.00 0.00 0.63 0.31
2017 Placement Goal 1 2 1 2 1 0 0 0 0 0
2018 Placement Goal 1 2 1 2 1 0 0 0 0 0
2019 Placement Goal 1 2 1 2 1 0 0 0 0 0
2020 Placement Goal 1 2 1 2 1 0 0 0 0 0
2021 Placement Goal 2 2 1 1 1 0 0 0 0 0
Current Number Workforce 2 1 0 0 3 0.3333
Percentage in Category 66.7 0.0 0.0 0.0 0.0 0.0 0.0 0.0 0.0 0.0 33.3 0.0 0.0 100.0
Percentage of Availability 20.5 35.4 10.7 19.1 5.4 5.3 1 1.3 0.3 0.9 44 62
Over/Under Representation 46.2 -35.4 -10.7 -19.1 -5.4 -5.3 -1.0 -1.3 -0.3 -0.9 33.3 -44.0 -62.0
Number Needed to Reach Parity 0 1 0 1 0 0 0 0 0 0 0 1 2
Number Anticipated Vacancies 1
Number Years to Reach Goal 5
Annual Placement Rate 0.20 0.00 0.20 0.00 0.00 0.00 0.00 0.00 0.00 0.00
2017 Placement Goal 1 0 1 0 0 0 0 0 0 0
2018 Placement Goal 0 0 0 0 0 0 0 0 0 0
2019 Placement Goal 0 0 0 0 0 0 0 0 0 0
2020 Placement Goal 0 0 0 0 0 0 0 0 0 0
2021 Placement Goal 0 0 0 0 0 0 0 0 0 0
Service and Maintenance
Skilled Craft

145
Table 17a: DMV Job Placement Goals
DMVWhite
Male
White
Female
Black
Male
Black
Female
Hisp
Male
Hisp
Female
Asian
Male
Asian
Fem
AIAN
Male
AIAN
Female
Ethn
Unk
Total
Mnrt
Total
FemaleTotal
Vacancy
%
Current Number Workforce 4 3 1 1 2 2 4 11 0.0909
Percentage in Category 36.4 27.3 0.0 9.1 0.0 0.0 9.1 0.0 0.0 0.0 18.2 18.2 36.4 100.0
Percentage of Availability 52.5 30.0 5.4 6.3 2.0 1.1 1.3 0.8 0.4 0.3 17.6 38.5
Over/Under Representation -16.1 -2.7 -5.4 2.8 -2.0 -1.1 7.8 -0.8 -0.4 -0.3 18.2 0.6 -2.1
Number Needed to Reach Parity 0 0 1 0 0 0 0 0 0 0 0 0 0
Number Anticipated Vacancies 1
Number Years to Reach Goal 5
Annual Placement Rate 0.00 0.20 0.00 0.00 0.00 0.00 0.00 0.00 0.00 0.00 0.00 0.00
2017 Placement Goal 0 1 0 0 0 0 0 0 0 0
2018 Placement Goal 0 0 0 0 0 0 0 0 0 0
2019 Placement Goal 0 0 0 0 0 0 0 0 0 0
2020 Placement Goal 0 0 0 0 0 0 0 0 0 0
2021 Placement Goal 0 0 0 0 0 0 0 0 0 0
Current Number Workforce 154 219 59 180 6 13 3 1 1 3 144 266 416 783 0.1124
Percentage in Category 19.7 28.0 7.5 23.0 0.8 1.7 0.4 0.1 0.1 0.4 18.4 34.0 53.1 100.0
Percentage of Availability 34.5 42.5 5.1 11.1 1.3 1.9 1.6 1.3 0.2 0.5 23.0 57.3
Over/Under Representation -14.8 -14.5 2.4 11.9 -0.5 -0.2 -1.2 -1.2 -0.1 -0.1 18.4 11.0 -4.2
Number Needed to Reach Parity 0 114 0 0 4 2 10 9 1 1 0 0 33
Number Anticipated Vacancies 88
Number Years to Reach Goal 5
Annual Placement Rate 0.26 0.00 0.00 0.01 0.00 0.02 0.02 0.00 0.00 0.00 0.00 0.08
2017 Placement Goal 5 0 0 1 1 0 0 0 0 0
2018 Placement Goal 5 0 0 1 1 0 0 0 0 0
2019 Placement Goal 5 0 0 1 0 0 0 0 0 0
2020 Placement Goal 4 0 0 1 0 0 0 0 0 0
2021 Placement Goal 4 0 0 0 0 0 0 0 0 0
Current Number Workforce 1 18 15 1 15 33 35 0.0286
Percentage in Category 2.9 51.4 0.0 42.9 0.0 0.0 0.0 0.0 0.0 0.0 2.9 42.9 94.3 100.0
Percentage of Availability 25.8 47.3 5.8 15.3 0.7 1.7 1 1.2 0.2 0.8 26.7 66.3
Over/Under Representation -22.9 4.1 -5.8 27.6 -0.7 -1.7 -1.0 -1.2 -0.2 -0.8 2.9 16.2 28.0
Number Needed to Reach Parity 0 0 2 0 0 1 0 0 0 0 0 0 0
Number Anticipated Vacancies 1
Number Years to Reach Goal 5
Annual Placement Rate 0.00 0.40 0.00 0.00 0.20 0.00 0.00 0.00 0.00 0.00 0.00 0.00
2017 Placement Goal 0 1 0 0 1 0 0 0 0 0
2018 Placement Goal 0 1 0 0 0 0 0 0 0 0
2019 Placement Goal 0 0 0 0 0 0 0 0 0 0
2020 Placement Goal 0 0 0 0 0 0 0 0 0 0
2021 Placement Goal 0 0 0 0 0 0 0 0 0 0
Current Number Workforce 132 23 12 5 3 2 8 22 28 185 0.0811
Percentage in Category 71.4 12.4 6.5 2.7 1.6 0.0 1.1 0.0 0.0 0.0 4.3 11.9 15.1 100.0
Percentage of Availability 57.2 12.7 16.2 9.8 2.0 0.8 0.4 0.1 0.6 0.2 30.1 23.6
Over/Under Representation 14.2 -0.3 -9.7 -7.1 -0.4 -0.8 0.7 -0.1 -0.6 -0.2 4.3 -18.2 -8.5
Number Needed to Reach Parity 0 0 18 13 1 1 0 0 1 0 0 34 16
Number Anticipated Vacancies 15
Number Years to Reach Goal 5
Annual Placement Rate 0.00 0.24 0.17 0.01 0.01 0.00 0.00 0.01 0.00 0.00 0.45 0.21
2017 Placement Goal 0 1 1 1 1 0 0 0 0 0
2018 Placement Goal 0 1 1 0 0 0 0 0 0 0
2019 Placement Goal 0 1 1 0 0 0 0 0 0 0
2020 Placement Goal 0 1 1 0 0 0 0 0 0 0
2021 Placement Goal 0 1 1 0 0 0 0 0 0 0
Officials and Administrators
Professional
Technician
Protective Services

146
Table 5.17b: DMV Job Placement Goals (continued)
DMVWhite
Male
White
Female
Black
Male
Black
Female
Hisp
Male
Hisp
Female
Asian
Male
Asian
Fem
AIAN
Male
AIAN
Female
Ethn
Unk
Total
Mnrt
Total
FemaleTotal
Vacancy
%
Current Number Workforce 24 138 27 155 2 9 4 2 49 199 308 410 0.1488
Percentage in Category 5.9 33.7 6.6 37.8 0.5 2.2 0.0 1.0 0.0 0.5 12.0 48.5 75.1 100.0
Percentage of Availability 16.9 54.3 6.8 16.1 1.2 2.6 0.5 1 0.2 0.5 28.9 74.5
Over/Under Representation -11.0 -20.6 -0.2 21.7 -0.7 -0.4 -0.5 0.0 -0.2 0.0 12.0 19.6 0.6
Number Needed to Reach Parity 45 85 1 0 3 2 2 0 1 0 0 0 0
Number Anticipated Vacancies 61
Number Years to Reach Goal 5
Annual Placement Rate 0.28 0.00 0.00 0.01 0.01 0.01 0.00 0.00 0.00 0.00 0.00 0.00
2017 Placement Goal 3 1 0 1 1 0 0 0 0 0
2018 Placement Goal 3 0 0 1 1 0 0 0 0 0
2019 Placement Goal 3 0 0 1 0 0 0 0 0 0
2020 Placement Goal 4 0 0 0 0 0 0 0 0 0
2021 Placement Goal 4 0 0 0 0 0 0 0 0 0
Current Number Workforce 2 2 1 2 0 5 0.2000
Percentage in Category 40.0 0.0 40.0 0.0 0.0 0.0 0.0 0.0 0.0 0.0 20.0 40.0 0.0 100.0
Percentage of Availability 52.7 8.3 15.9 4.9 13 2.6 0.9 0.5 1.1 0.2 39.1 16.5
Over/Under Representation -12.7 -8.3 24.1 -4.9 -13.0 -2.6 -0.9 -0.5 -1.1 -0.2 20.0 0.9 -16.5
Number Needed to Reach Parity 0 0 0 0 1 0 0 0 0 0 0 0 1
Number Anticipated Vacancies 1
Number Years to Reach Goal 5
Annual Placement Rate 0.00 0.00 0.00 0.20 0.00 0.00 0.00 0.00 0.00 0.00 0.00 0.20
2017 Placement Goal 0 0 0 1 0 0 0 0 0 0
2018 Placement Goal 0 0 0 0 0 0 0 0 0 0
2019 Placement Goal 0 0 0 0 0 0 0 0 0 0
2020 Placement Goal 0 0 0 0 0 0 0 0 0 0
2021 Placement Goal 0 0 0 0 0 0 0 0 0 0
Skilled Craft
Administrative Support

147
SECTION VI
Monitoring Procedures Good Faith Efforts
Program Activities to Address Concerns

148
MONITORING PROCEDURES Internal Monitoring
An internal monitoring and evaluation system to audit personnel policy, practices, and decisions is essential to ensure non-discrimination and the achievement of objectives and timetables. Additionally, an evaluation of progress is essential for assessing the overall effectiveness of the Department’s AAP and providing data upon which to base recommendations for future actions. To carry out these objectives, the Department’s monitoring and evaluation procedures include the following:
A quarterly review and evaluation of the Department’s AAP and all EEO/AA program activities by the Internal EEO Unit with an annual summary to FHWA.
Quarterly analysis of trends in workforce, hiring, promotions, and disciplinary actions with a quarterly report to the Chief Deputy Secretary.
Quarterly meetings with the Secretary of Transportation on progress and recommendations for problem areas.
Quarterly attendance of Executive Leadership Team Meetings on progress and recommendations for problem areas.
Annual assistance to management in establishing goals and objectives for the coming review cycle.
On-Site Evaluations EEO staff has begun routinely conducting on-site evaluations of the Department’s business units. Prior to an on-site evaluation, EEO staff runs reports (B0178-F: Over/Under Representation, B0031: New Hire and Promotions, B0161: Employee Head Count Over Time, and B0051: Disciplinary Actions) and then analyzes report data (new hire, promotions, separations, and disciplinary actions) for the business units that report directly to the Secretary, the units that report directly to the Chief Deputy, and each highway division.
Staff then analyzes the data from these reports to determine 1) organizational units with disproportionately higher disciplinary actions issued to minorities and females compared to their workforce representation; 2) organizational units with substantially lower minority and female representation compared to the number and percent expected based on the labor force; and 3) other anomalies adversely impacting any other term or condition of employment.
After performing the analyses to determine which units to conduct on-site evaluations on, staff:
1. Sets up and conducts outreach calls to the unit heads to preview the contents of the formal notification letters;
2. Sends follow-up emails with the points made on the calls and requests dates to conduct the on-site evaluations; and
3. Sends the formal notification letters.
During the opening conference of an on-site visit, EEO staff provides an overview of the on-site evaluation process, reviews the selection criteria, reviews report data, provides internal EEO program updates and reminders, provides the EEO Policy Statement and FAQ handouts, and provides an overview of next steps with upper management and any other employees management invites to

149
attend the opening conference. (Future on-site evaluations will also include a discussion of the AAP once it is approved by FHWA.) As part of the EEO program updates, EEO staff iterates FHWA’s concern that disciplinary actions be issued fairly and consistently. After the opening conferences, the EEO Specialists spend the remainder of the day interviewing both management and randomly-selected employees, using a standard set of questions for management and a slightly different standard set of questions for non-supervisory employees. The answers provided by each are analyzed, and redacted, sanitized versions (to disguise identities) are included in the respective on-site evaluation final reports.
EEO staff reviews and analyzes data collected onsite and then prepares draft On-Site Evaluation Final Reports for each business unit evaluated. The draft reports consist of five parts:
1. Introduction, which describes the purpose of the on-site evaluation, identifies the selection criteria, explains that findings and conclusions are based on research and analysis, and identifies the opening conference attendees.
2. Findings, which summarizes management and non-supervisory employee interviews, provides overviews of the business unit’s workforce representation (including over/under representation), new hires, promotions, and disciplinary actions, including trends.
3. Conclusions, which describe areas that need work. 4. Recommendations, which include a description of actions that can be taken to improve the EEO
posture. 5. Exhibits, which include summaries of the management and non-supervisory employee
interviews, over/under representation reports for the FFY, new hire and promotions reports for the FFY, disciplinary actions issued during the FFY, and the attendance records.
Business unit heads review the draft final reports. Afterwards, EEO staff conducts a close-out conference call with the unit heads and anyone else management invites to attend. Once the business unit heads and EEO staff discuss and agree with the findings, conclusions, and recommendations of the reports, the business unit heads sign and return commitments to work on specific areas.
EEO staff communicates with the business units quarterly, providing reports showing over/under representation and reporting on the ethnicity, gender, and types of disciplinary actions being issued. EEO staff requests that the workforce representation reports appear on meeting agendas quarterly. The disciplinary action reports are to be shared with management as appropriate. Business units are also asked to consult with EEO staff to find ways to increase minorities and females in their applicant pools. In addition, EEO staff schedules conference calls biannually to discuss any other relevant information or concerns with the business units.
The onsite evaluations yield information to address areas of disproportionate workforce representation of minorities and females and the disproportionate disciplinary actions administered to minorities, especially black males. Some of the corrective actions that EEO staff routinely recommends to management to address these issues consist of the following:

150
1. Work with an EEO Specialist in NCDOT’s OCR to review disciplinary actions quarterly. 2. Work with NCDOT’s Human Resources, Talent Management, Engineering Associate Program,
and Historically Black Colleges and Universities/Minority Institutions of Higher Education (HBCU/MIHE) internship program to attract minority and female applicants for vacant positions.
3. Notify minority- and female-based organizations of temporary position opportunities in an effort to increase the number of minority and female temporary employees.
4. Hiring managers ask for referrals from their current employees for open positions.
5. Hiring managers provide career development counseling to employees with outcomes documented in the training plan, which is usually completed during the completion of the VIP performance planning stage. The expected result is a pool of career applicants that can be considered for promotion. (This recommendation is with the understanding that career development is an individual responsibility.)
6. OCR provides training for supervisors and managers on the Affirmative Action Program, EEO-related policies, discrimination complaint filing procedures, and EEO contact information.
7. Management include the over/under representation reports on its meeting agendas quarterly. The opening conferences with management and other invited employees serve as an excellent platform to promote EEO awareness, its program, its staff, and its programmatic functions. The meetings represent an opportunity to establish positive working relationships with management and the business unit employees. This relationship-building should foster collaborative efforts in the future. Overall, on-site evaluation meetings appear to be well received by management and most employees.
External Monitoring
An external monitoring system is essential to ensure fulfillment of NCDOT’s responsibilities with respect to Federal regulations (Title 23 CFR Part 230, Part II). The FHWA Division Office monitors NCDOT’s Internal EEO/AA Program to ensure program compliance and achievement of objectives and timetables. Additionally, FHWA’s evaluation of progress is crucial for assessing the overall effectiveness of the Department’s EEO/AA Program and providing data upon which to base recommendations for future actions. FHWA Annual Review Process After the end of each Federal fiscal year (October 1 – September 30), NCDOT must submit an annual report of the status of its Internal EEO program to the North Carolina FHWA Division Office. The annual report provides FHWA with an overview of the current status of the program including accomplishments, observations, challenges, adverse impact analysis of employment actions and a work plan for the upcoming year.

151
After review of the annual report, FHWA conducts an on-site meeting with the Internal EEO Unit and then prepares a report that outlines program observations, deficiencies, and recommendations for improvement/compliance. FHWA submits the report to the NCDOT Secretary of Transportation for his review and response. Based upon a favorable response from the Secretary, FHWA will then approve NCDOT’s EEO program for another year.
GOOD FAITH EFFORTS Affirmative Action Program Accomplishments
NCDOT strives to ensure that we have a workforce that reflects the diversity of our state. To achieve that goal, we make a continuous effort to improve our Affirmative Action Program. In addition to our recruitment and outreach activities and making plans for continuous improvement, we have engaged in other activities that enable us to build a better program. In compliance with regulatory requirements, NCDOT monitors our Affirmative Action/Equal Employment Opportunity programs to acknowledge our achievements, identify our challenges, and devise recommendations and action plans for continual improvement to ensure program success.
The Internal EEO Unit is directed by an EEO Manager/Affirmative Action Officer and divided into three sections: the Affirmative Action section, the EEO Investigations section, and the Americans with Disabilities Act (ADA) section. Each section employs two full time EEO/ADA Specialists and additional positions have been requested in order to fulfill our EEO/AAP/ADA requirements and move our programs in a positive direction.
Accountability Each manager and supervisor is assigned the “EEO Compliance” goal in the Department’s on-line Valuing Individual Performance (VIP) performance management system annually. This performance measure applies to all managers and supervisors who are responsible for hiring, training, assignment, layoff, termination, or other employment decisions. Managers and supervisors are required to distribute and review all EEO- related policies with staff in a meeting, post the current EEO policies in the workplace, and complete the task within the performance cycle. After the EEO policy meeting, participants complete the EEO Compliance curriculum in the on-line NC Learning Center. The compliance of managers and supervisors is evaluated in the VIP system. Evaluating supervisors can verify performance through the NC Learning Center by determining the percentage of a manager’s subordinates who completed the EEO compliance curriculum. Recruitment, Selection and Hiring It is the policy of the North Carolina Department of Transportation to maintain a selection system that will give equal employment opportunity to all applicants without regard to race, religion, color, national origin, sex, age, disability, or political affiliation/influence and will be based solely on job-related criteria. The recruitment and selection process will comply with all Federal and State laws, regulations, and policies.

152
The Department’s recruitment procedures are designed to attract a diverse pool of applicants to all occupational categories. For example, the Transportation Engineering Associate (TEA) Program serves as a recruitment tool for minority and female engineers. NCDOT also has hiring procedures to ensure that employment conditions and information are presented consistently along with selection procedures to ensure that all of the steps are nondiscriminatory and job related. NCDOT shall meet its workforce needs through a systematic recruitment and selection process designed to identify, attract, select, and retain the most qualified applicants. A selection decision shall not be made that constitutes unlawful discrimination or retaliation in violation of Federal or State laws. Vacant positions are posted on the Department’s and/or Office of State Human Resources’ website to ensure open and fair competition for all interested employees and applicants. The recruitment and selection process is consistently applied, non-discriminatory, promotes open and fair competition, and results in the creation of a diverse workforce. A vacancy posting is an announcement that includes (1) classification title, (2) salary grade and range, (3) essential functions of the position, (4) knowledge, skills, and abilities, in addition to the minimum training and education position requirements, (5) application period, and (6) appropriate contact information. An employee or applicant must possess at least the minimum qualifications to be deemed qualified for the position. Additional minimum qualifications, if any, must also be met. Unless otherwise approved by the Secretary, the minimum vacancy posting period is ten (10) work days. Upon approval to post, the hiring manager is provided written notification of the demographic groups that are underrepresented, along with options for targeted recruitment. Applications for all postings are submitted to the Qualifications, Salary, & Policy Review section of the Human Resources Division. This section, after the closing date of the vacancy announcement, reviews the credentials of each applicant against the training, education, knowledge, skills, and abilities required by the posted position. From those applicants who meet the minimum qualifications, a second screening is conducted to determine the most qualified candidates. (See footnote 5.) The individual selected for the vacant position is chosen from the qualified applicants. Interviewers are required to successfully complete the Department’s Merit Based Hiring policy and procedures training before engaging in the interview process. Interviewers are also trained to use the same set of objective questions for females, minorities, and the disabled that they use for all others. Records consisting of the interview questions asked and corresponding responses are to be maintained by the hiring authority. The Human Resources Division uses an applicant tracking system referred to as NEOGOV to identify the race and gender of each applicant, as well as whether the applicant is unqualified, qualified, or most qualified. The applicant tracking system is instrumental in identifying the classification title of the vacant position, number of applicants interviewed, and number or non-existence of underrepresented women, minorities, and disabled applicants. This data is essential in isolating job categories and titles of which women, minorities, and disabled applicants are underrepresented. The hiring entity completes the EEO Notification Form that identifies the underrepresentation of protected groups for the posted vacancy. New hire and promotion selection rates are determined and analyzed by both total new hires and promotions. In cases of underrepresentation, if a member of a protected group is not hired or promoted, a reason by the hiring entity is documented and made a part of the hiring package.

153
The NCDOT recruitment activity ensures good faith with the spirit of affirmative action and equal employment opportunity and includes the following recruitment processes:
Review and monitor recruitment procedures to abolish any discriminatory practice which may exist.
Review all recruitment literature to ensure that it includes and is relevant to all employees.
Institute measures that will improve NCDOT’s recruitment process as it relates to the establishment of program objectives.
Specify measures for initiating and maintaining contact with recruitment resources and informing these resources of employment opportunities, particularly in management, professional and technical level positions. These recruitment resources should include professional minority and female organizations, colleges and universities, churches, and professional minority and female media outlets and publications.
Posted vacancies are listed on the NCDOT and OSHR websites. Studies have shown that discriminatory practices occur more often in the selection process than in any other area of employment practices. The NCDOT’s Merit Based Hiring Policy includes procedures to review and evaluate each step of the selection process to assure job requirements, selection procedures, hiring standards, and placement processes contribute to the achievement of program objectives and does not discriminate on the basis of race, color, national origin, political affiliation, religion, sex, age, and disability. These selection and hiring processes ensure the following:
A job analysis is conducted to establish job-related qualifications statements, selection criteria, and training needs.
Cooperation is maintained with the Office of State Human Resources or other trained resources regarding the review and validation of written tests, interviews, or other selection devices.
All employees who interview applicants for employment are trained in proper interviewing techniques.
The State’s Merit Based Hiring policy, which is available under the “Policies” tab on OSHR’s website at: http://oshr.nc.gov/, sets forth our commitment to EEO for all qualified persons and states that positive efforts will be made to recruit qualified individuals including minorities, women, and persons with disabilities for applicant pools. Hiring managers do not receive the race and gender information of applicants due to our Merit Based Hiring Policy; however, the AAP section of the Internal EEO Unit can determine if the vacant position is an underrepresented classification and work with the hiring manager and HR to increase the success rate for the Department’s EEO/AA goals and objectives. Additionally, AAP staff communicates quarterly with organizational units to make the hiring managers aware of underrepresentation. Hiring managers are advised to increase their applicant pool by focusing recruitment efforts on minorities and women and are directed to select the most qualified candidate.
Human Resources, with the assistance of the Affirmative Action Officer, must always make a good faith effort to attain a diverse applicant pool for each posted position. To ensure that a diverse applicant pool is attained, HR can focus recruitment on underrepresented groups. HR consistently maintains connections with the following minority and female organizations for recruitment purposes:
154
Women’s Transportation Seminar (WTS)
https://www.wtsinternational.org/professional-development/career-center/
National Society of Black Engineers
https://www.nsbe.org/
Society of Women Engineers
http://societyofwomenengineers.swe.org/
Women in Engineering (NC State)
https://www.engr.ncsu.edu/womeninengineering/
HBCU Connect
http://hbcuconnect.com/
National Associate of Black Accountants (NABA)
http://www.nabainc.org/
National Forum for Black Public Administrators
http://www.nfbpa.org/i4a/pages/index.cfm?pageID=3916
National Association of Asian American Professionals
http://www.naaap.org/
Association of Latino Professionals in Finance & Accounting
http://www.alpfa.org/
Diversity Inc.
http://www.diversityinc.com/
Recruit Military
http://recruitmilitary.com/
The Conference of Minority Transportation Officials
http://www.comto.org/
Mosaic Metier (Diversity Recruitment Site)
http://www.mosaicmetier.com/

155
Hire Heroes
http://jobs.hireheroesusa.org/
Once positions are filled, applicant EEO data is tracked so that it can be analyzed for the purpose of assessing our programs toward meeting our affirmative action goals and setting new goals. An applicant flow analysis is performed and used to identify positions that have the greatest difficulty in attracting minority and female candidates. The AAP section of the Internal EEO Unit plans to then evaluate recruitment strategies and selection procedures and collaborate with HR to ensure necessary changes made to meet our Job Placement Goals
Promotions
Promotional priority is given to all current State employees who have achieved career status. Promotional priority consideration shall be provided if it is determined that an eligible employee and an outside applicant have substantially equal qualifications. If so, the eligible employee is offered the job over an outside applicant.
Training
Employee Development Training: The Department’s training courses are designed to accomplish career development objectives for all of its employees in an effort to bolster advancement opportunities. The Office of Civil Rights and the Human Resources Division provide in-service training to all Department employees. OCR in collaboration with the Human Resources shall ensure all employees attend diversity training. The Department’s training policies and procedures are designed to enhance employee development and advancement opportunities. This EEO/AAP program provides the basis for the following monitoring activities:
The representation of minorities and females in training is periodically reviewed by OCR. The goal of the Department is that training be at least equal to their representation in the workforce.
Supervisors and managers who have input into the selection process have attended Equal Opportunity/Affirmative Action training. OCR conducts Equal Opportunity/Affirmative Action training.
NCDOT shall enroll each newly appointed supervisor or manager within one year of appointment in the Equal Employment Opportunity training offered or approved by the Office of State Human Resources pursuant to N.C.G.S. §126-16.1.
Supervisory personnel counsel and provide career guidance to employees through explanations of classifications requirements and through discussion of how an employee may meet the minimum position qualifications to help facilitate the upward mobility of minorities and females.
Internal Training: The Office of State Human Resources has developed and implemented a mandatory EEO training program for managers and supervisors. The training course, EEOI (Equal Employment

156
Opportunity Institute), covers lessons on the EEO and Affirmative Action programs, applying affirmative action in hiring, civil rights laws, enforcement agencies, and how the complaint and accommodation request processes work. The program also covers the value of diversity, skills for tolerance, perceptions, primary and secondary dimensions of diversity, workplace harassment laws and forms of harassment. N.C.G.S. §126.16.1 requires newly appointed supervisors or managers to enroll in EEO training offered or approved by OSHR within one year.
The Internal EEO Unit also provides training upon request. Completion of the online training class, Diversity for Today’s Employee, is mandatory for all NCDOT employees.
All NCDOT employees have access to their training history and the ability to request training online through the Department’s earning Management System (LMS). Employees discuss and plan developmental opportunities in their Employee Training and Development Plan with supervisors. Employees are encouraged to use this opportunity to put their career paths in action by formally requesting the training and career development opportunities needed to accomplish their career objectives. Table 6.1 below illustrates the number of classes taken by employees by race and gender for the State FY 2013.
External Training: Many employees require external training to remain certified or competent in their areas of expertise. These employees are encouraged to use the LMS system to request external learning opportunities. All six EEO/ADA Specialists in Internal EEO attend training annually to increase knowledge, skills and ability in their respective areas of EEO expertise.
Upward Mobility Programs
Summer Engineering Assistants Program: The Summer Engineering Assistants Program offers civil, environmental or biological engineering students in good academic standing the opportunity to work one summer or consecutive summers as interns in the engineering field. Students learn about the work performed at NCDOT and gain valuable experience that counts toward eligibility for permanent

157
employment. Based on need, there may be internship positions available for other majors as well. Positions are located statewide. Job locations depend on the availability and location of current construction projects, job requirements, and the students’ needs and interests. These are paid internships. Transportation Engineering Associates (TEA) Program: This 18-24 month training and career development program was designed to accomplish three major goals for entry-level civil, environmental or biological engineers:
Orient the newly graduated engineer on the major functions and organization of the various highway units.
Provide a career development plan and training program that gives the associate a broad background and practical application of highway engineering.
Provide the NCDOT with a reservoir of professionally trained and experienced engineers who can assume management responsibilities with confidence.
The TEA Program training schedule starts in January and June of each year. The associate's major area of interest is determined through counseling, and the department's major needs are examined before a tentative training schedule is arranged. A training schedule can consist of the following units and/or divisions:
Nine months field operations: statewide assignments in Maintenance and Construction Nine months of Pre-Construction assignments in Raleigh (associate must select four):
Roadway Design Hydraulics Traffic Mobility and Safety Environment - Planning Transportation Planning Structure Design Materials and Test Pavement Management Photogrammetry Rail Division Aviation Division Location and Surveys (Raleigh & Statewide)
Cooperative Education Program: The Cooperative Education Program at NCDOT is a career-oriented, professional-level program for short-term training in civil engineering. The primary purpose of the program is to integrate classroom and practical experience and is not merely financially oriented. Co-op is an ongoing program normally beginning after the freshman year of college that encompasses a substantial portion of a student's college career. The Co-op Program at NCDOT functions under the alternate plan, requiring the student to work every other semester. The assignment is usually shared by a pair of students; while one student is working on the job, the other is attending classes. Interested civil engineering students must first register with the Cooperative Education Office at their college or university and follow the requirements set up through the school.

158
HBCU Internship Program: The North Carolina Department of Transportation Historically Black College & University (HBCU) and Minority Institutions of Higher Education (MIHE) Internship Program is a ten week summer program for students attending North Carolina HBCU/MIHE colleges and universities. Students are jointly selected through an extensive interview process administered by their respective universities and the NCDOT HBCU/MIHE Office. The program begins in early June and concludes during the first week of August. Students are assigned throughout the department and select transportation partners across the state. Interns are assigned to such program areas as: communications, information technology, accounting, business administration, public transportation, environmental science, planning, and aviation. The internship program is part of the department’s efforts to develop interest and attract and recruit minorities to work in the transportation industry, including the NCDOT. As an internship sponsor, the NCDOT encourages transportation curriculums within HBCU/MIHE academic programs in hopes of bridging the gap between these higher education institutions and the transportation industry.
Student Volunteer Program: The NCDOT offers volunteer opportunities for students interested in exploring their career development goals. Student volunteers can work a flexible schedule to accommodate their needs as well as the needs of NCDOT. There is no requirement on a minimum number of hours for this program and participants can arrange to work around classroom or other obligations. Students can choose to work in fields they are interested in and gain exposure to new environments. All assignments are contingent upon the availability of opportunity.
NCDOT Mentoring Program: The NCDOT recognizes mentoring as one of the best, most cost effective ways to develop employees through transfer of experiences, knowledge and skills. Mentoring facilitates knowledge transfer and is an efficient method to retain critical knowledge and skills within an organization. Participation in our mentoring program encourages employees to take personal responsibility for growth and development. It encourages leadership development and is helpful in supporting recruitment of new employees and the retention of current employees. Mentoring is an opportunity to grow. Through mentoring an employee can gain advice and perspective from a trusted, impartial advisor. A committed protégé is able to expand professional networks, learn about other areas of NCDOT and increase self-confidence. Participation is available through a recruitment and application process which occurs several months prior to the beginning of each session. The NCDOT Mentoring Program is aimed at employees with less than five years of NCDOT experience; however, all employees are eligible to apply. It is a structured 12 month program where protégés are matched with NCDOT mentors. The mentors have more than five years of experience with NCDOT. Participation in the NCDOT Mentoring Program is completely voluntary. A copy of the Mentoring Policy and Procedures is available on the employee portal in the HR Documents Library. Career Paths: Every employee is now empowered to take responsibility for his or her development with the Learning Management System. Managers are able to proactively provide development guidance and work with each employee to build capacity for both current and future opportunities. A “career path” is the process used by an employee to chart a course within NCDOT for their career development.

159
Developing a career path plan involves understanding what knowledge, skills, and abilities are required for an employee to advance their career, either laterally through strategic reassignments or transfers, or upward through promotions. A well-developed personal career path requires an employee to take an honest look at his or her career goals, skills, needed knowledge, experience, and personal characteristics. After this honest assessment, career paths require the employee to proactively plan to obtain what is necessary in each of these areas to carry out his or her career path. The career path encompasses the employee's desired destination and the steps, experience, and development he or she will need to make progress on the journey. A career path gives the employee a sense of direction, a way to assess career progress, career goals and milestones. Attaining the desired goal will also require the employee to develop skills, pursue employee development opportunities, and obtain certain experiences as he/she progresses along the career path through the organization. Options include considering a cross-training assignment, supervisory coaching and mentoring assistance from a more experienced employee, probably an employee with a position higher on the organizational chart will help. The DOT training page on the employee portal is a starting point for both internal and external training and development opportunities. Employees can develop a career path by taking a look at the desired job(s) at NCDOT, and then charting a course through jobs and departments to a likely career path that will let the employee achieve his/her goal. With a written career path plan, the employee can approach his/her supervisor for support and assistance in implementing their career path plan. HR Career Services is also available for career path consultation. Successful careers are employee driven. Employees own their career path plan and need to decide on their career goals and desired jobs. Employees are responsible for seeking a mentor, applying for internal job openings, and developing the skills and experience necessary to achieve desired goals. While coaching and mentoring may help an employee arrive at several possible career options, a complete career exploration is the employee’s task.
COMPLAINTS OF DISCRIMINATION Policy and Procedures Effective December 1, 2013, the Department implemented a new Employee Grievance Policy pursuant to N.C.G.S. Chapter 126 to handle complaints of discrimination. (A copy of the policy is available on the OSHR website under the “Policies” tab at: http://oshr.nc.gov/ ). The Employee Grievance policy provides procedural consistency, allows grievances to be processed at the lowest level, and utilizes mediation as the first step in the formal process. The provisions make the policy clearer, more understandable, and allow employee grievances to be addressed much more quickly. Unlawful Discrimination, Harassment or Retaliation Complaints

160
The EEO Informal Inquiry with NCDOT’s Equal Employment Opportunity/Affirmative Action Officer is the first step for complainants alleging unlawful discrimination, harassment, or retaliation. As required by Federal regulations (23 CFR 230), the EEO Informal Inquiry is a procedure whereby employees and applicants may process allegations of discrimination to an impartial body without fear of reprisal. This process is not to be confused with the Formal Internal Grievance Process which is designed for grievances other than unlawful discrimination, harassment or retaliation.
Complainants file first with the NCDOT’s Equal Employment Opportunity/Affirmative Action Officer within 15 days of the alleged discriminatory or retaliatory act that forms the basis of the complaint.
The Internal EEO Investigations unit then investigates the complaint, determines whether or not there is reasonable cause to believe that the alleged act rises to the level of unlawful discrimination, harassment or retaliation, and then is required to respond to the complainant within 45 calendar days.
A 15 day extension is allowed if mutually agreed upon by the agency and the complainant. NCDOT then communicates the outcome to the complainant in writing.
If reasonable cause exists, management takes action to resolve the matter.
If successfully resolved, the complainant and management sign an agreement detailing the terms of the resolution.
If the matter is not successfully resolved, the complainant may file a formal grievance within 15 calendar days of the written response from the EEO Informal Inquiry.
Discrimination Complaint Tracking Complainants alleging unlawful discrimination, harassment, or retaliation may complain to the Equal Employment Opportunity Commission (EEOC) at any time and until December 1, 2013 to the Office of Administrative Hearings (OAH) at any time. Prior to Q2 of FFY 2013, discrimination charges were tracked in an Excel spreadsheet. Beginning in Q2 of FFY 2013, OCR developed an Access database to track discrimination charges and run reports. Discrimination Complaints Analysis FFY 2013 During Q3 and Q4 of FFY 2013, discrimination charges were handled by Employee Relations in the Human Resources Office as the EEO Manager position was vacant during this time period. Consequently, EEO staff used information entered into the Excel spreadsheet and Access database as well as information provided by Philip Bickham, Manager, Employee Relations, to prepare the analysis of discrimination charges for FFY 2013. Beginning with Q1 of FFY 2014, all charges started being tracked in the Access database. There were a total of 29 discrimination charges filed in FFY 2013, down from the 36 charges filed in FFY 2012. Of the 29 charges filed, there were 19 EEOC/OAH charges and 10 internal grievances. There were

161
14 charges filed by complainants alleging at least one type of discrimination; the remaining 15 charges included allegations of multiple types of discrimination. Table 6.2 below summarizes the discrimination charges filed in FFY 2013. The information contained in the table regarding types of discrimination complaints filed and the race/gender of persons who filed them exceeds the actual number of complaints filed during FFY 2013 because of the occasions when multiple types of discrimination were filed. Table 6.2 Discrimination Charges Filed FFY 2013 (October 1, 2012 – September 30, 2013)
BEACON Report B0051
Race discrimination (13) and retaliation (10) were the leading bases for discrimination charges being filed in FFY 2013 followed by sex (9), disability (8), age (6), color (1), and national origin (1). No charges were filed based on genetic information or religion. Black Females filed the largest percentage of complaints (33%) followed by White Males (23%), Black Males (21%), White Females (13%), Native American Males (6%), and Ethnicity Unknown (4%).
Race discrimination was alleged in 13 complaints (27% of all complaints): 2 by White Males, 4 by Black Males, 5 by Black Females, 1 by a Native American, and 1 Ethnicity Unknown.
Retaliation was alleged in 10 complaints (21% of all complaints): 1 by a White Male, 1 by a White Female, 4 by Black Males, 3 by Black Females, and 1 by a Native American Male.
Sex discrimination was alleged in 9 complaints (19%): 2 by White Males, 1 by a White Female, 5 by Black Females, and 1 by Ethnicity Unknown.
Disability discrimination was alleged in 8 complaints: 2 by White Males, 3 by White Females, 2 by Black Males, and 1 by a Black Female.
White
Male
White
Female
Black
Male
Black
Female
Hisp
Male
Hisp
Female
Asian
Male
Asian
Female
AINA
Male
AINA
Female
Ethn
UnkTOT
TOT
MNRT
TOT
FEM
Age 3 1 0 1 0 0 0 0 1 0 0 6 2 2
% All Complaints 6.25 2.08 0.00 2.08 0.00 0.00 0.00 0.00 2.08 0.00 0.00 12.50 4.17 4.17
Color 0 0 0 1 0 0 0 0 0 0 0 1 1 1
% All Complaints 0.00 0.00 0.00 2.08 0.00 0.00 0.00 0.00 0.00 0.00 0.00 2.08 2.08 2.08
Disability 2 3 2 1 0 0 0 0 0 0 0 8 3 4
% All Complaints 4.17 6.25 4.17 2.08 0.00 0.00 0.00 0.00 0.00 0.00 0.00 16.67 6.25 8.33
Genetic Information 0 0 0 0 0 0 0 0 0 0 0 0 0 0
% All Complaints 0.00 0.00 0.00 0.00 0.00 0.00 0.00 0.00 0.00 0.00 0.00 0.00 0.00 0.00
National Origin 1 0 0 0 0 0 0 0 0 0 0 1 0 0
% All Complaints 2.08 0.00 0.00 0.00 0.00 0.00 0.00 0.00 0.00 0.00 0.00 2.08 0.00 0.00
Race 2 0 4 5 0 0 0 0 1 0 1 13 10 5
% All Complaints 4.17 0.00 8.33 10.42 0.00 0.00 0.00 0.00 2.08 0.00 2.08 27.08 20.83 10.42
Religion 0 0 0 0 0 0 0 0 0 0 0 0 0 0
% All Complaints 0.00 0.00 0.00 0.00 0.00 0.00 0.00 0.00 0.00 0.00 0.00 0.00 0.00 0.00
Retaliation 1 1 4 3 0 0 0 0 1 0 0 10 8 4
% All Complaints 2.08 2.08 8.33 6.25 0.00 0.00 0.00 0.00 2.08 0.00 0.00 20.83 16.67 8.33
Sex 2 1 0 5 0 0 0 0 0 0 1 9 5 6
% All Complaints 4.17 2.08 0.00 10.42 0.00 0.00 0.00 0.00 0.00 0.00 2.08 18.75 10.42 12.50
TOTALS 11 6 10 16 0 0 0 0 3 0 2 48 29 22
% All Complaints 22.92 12.50 20.83 33.33 0.00 0.00 0.00 0.00 6.25 0.00 4.17 100.00 60.42 45.83
162
Age discrimination was alleged in 6 complaints: 3 by White Males, 1 by a White Female, 1 by a Black Female, and 1 by a Native American.
Color discrimination was alleged in 1 complaint by a Black Female.
National Origin discrimination was alleged in 1 complaint by a White Male.
PROGRAM ACTIVITIES TO ADDRESS CONCERNS Recruitment, Hiring and Selection Given the indicated adverse impact in hiring, the Internal EEO Unit of OCR will initiate the following after AAP approval:
Establish sign-off procedures to ensure that the selection process in underrepresented occupations reflects established program objectives and timetables.
Periodically analyze the flow of applicants through the selection and appointment process, determining reasons for the rejection of qualified applicants from underrepresented groups in areas where program objectives have been set or underrepresentation exists.
Analyze new hire selection periodically by both total new hires and new hires by occupational categories.
Maintain and analyze periodically a report of new hire and promotion data to assess whether the Department has met its goals. This report will be submitted to the Executive Leadership Team.
Review hiring and salary decisions in an effort to eliminate any artificial barriers of equal employment, as well as to ensure the Department’s selection process remains consistent and nondiscriminatory.
Job Restructuring The Internal EEO Unit must ensure that job descriptions, hiring criteria and job classification specifications do not contain factors which arbitrarily discriminate. Our goal is to establish and maintain a continuous review process. This process includes the following job evaluation, structuring and job validation procedures:
Periodic review of position descriptions and job classes by OCR and HR to correct inaccurate descriptions and ensure that jobs are allocated to the appropriate classification;
Periodic review of job qualifications by OCR and HR to ensure job-relatedness and consistency with performing the essential functions of the job; and

163
Restructure jobs by replacing higher-level vacant positions with entry level or trainee positions when possible.
Employee Training OCR in collaboration with HR shall ensure all employees attend diversity training. OCR will develop and conduct training to include The Americans with Disabilities Act, Grievance Policy Training, and other training designed to promote the Department’s AAP. The representation of women, minorities, and the disabled receiving training and other services shall be monitored and tracked by OCR. On July 1st, 2013, the Department began utilizing the NC Learning Center to search, access, register, complete, track and report on training activities. This fundamentally changes the way employees are developed while standardizing and streamlining the process. The training data will be periodically reviewed by OCR. The data review will include information on the race, gender, and disability status of the training participants and the representation of minorities, females, and disabled persons receiving training. The training goal of the Department for women, minorities, and disabled persons should equal their actual representation in the workforce. Our review activities will include the following:
The representation of minorities and females in training. The goal of the Department is that training be at least equal to their representation in the workforce.
Supervisors and managers who have input into the selection process have attended Equal Opportunity/Affirmative Action training.
New or promoted supervisors and managers attend the EEO Institute educational and diversity workshop as required by N.C. General Statute 126-16.1.
Supervisory personnel counsel and provide career guidance to employees through explanations of classifications requirements and through discussion of how an employee may meet the minimum position qualifications to help facilitate the upward mobility of minorities and females.
Promotion Procedures The Department’s promotion procedures are designed to enhance upward mobility and fully utilize the skills of its existing workforce. OCR shall review the following policies and practices to ensure compliance:
When promotional opportunities exist in underrepresented job categories, the Department considers and supports its diversity needs by setting annual goals, communicating those goals and following up with organizational units to reinforce the need to accomplish the goals.
Vacancy postings provide all qualified employees promotional opportunities.
A report of promotion data shall be developed, analyzed, maintained, and distributed quarterly for the purpose of assessing the impact on the workforce representation of women, minorities, and the disabled. This report is distributed to NCDOT management.
Monitoring of Disciplinary Actions

164
NCDOT’s OCR developed a plan to monitor disciplinary actions department-wide to ensure fairness and consistency in the issuance of disciplinary actions. The plan includes provisions for in depth investigations of disciplinary actions issued disproportionately to members of protected classes compared to their workforce representation in the department. Plan implementation will begin June 15, 2014. EEO Committees As indicated in the EEO Policy Statement signed by the Secretary, ensuring equal opportunity in employment is the responsibility of all employees and management at all levels. Therefore, the Internal EEO Unit will implement two advisory committees consisting of a broad cross section of employees to help achieve program goals:
EEO Advisory Committee - The EEO Advisory Committee will consist of a cross section of managers and executive-level members along with the Affirmative Action Officer, serving in an ex-officio capacity. The committee will report to the Secretary. The general focus of the committee will be to recommend action to the Secretary on diversity issues and on removing barriers to employment and advancement with the Department by employees and applicants from underrepresented protected classes. Responsibilities may include:
o Reviewing and evaluating the EEO plan and program o Meeting with the Secretary to discuss EEO programs and to report on the employees’
concerns o Recommending changes or additions to the EEO policy, plan, or program o Meeting as a committee at least quarterly
EEO Employee Committee - The EEO Employee Committee will consist of a diverse cross section of non-management employees. This committee will meet regularly with the Affirmative Action Officer to advise him/her on employee concerns. Responsibilities may include:
o Discussing EEO programs with the Affirmative Action Officer and reporting employees’
concerns o Recommending changes or additions to the EEO policy, plan, or program o Serving as a communication link between employees and the Affirmative Action Officer o Meeting as a committee at least quarterly