2019 compensation & benefits survey report
TRANSCRIPT

AMS Compensation & Benefits 2019 Report
1
2019 COMPENSATION & BENEFITS
SURVEY REPORT
American Montessori Society
116 E. 16th Street, New York, NY 10003 212-358-1250 • [email protected]
www.amshq.org

AMS Compensation & Benefits 2019 Report
2
Table of Contents
Page Summary of Results . . . . . . . . . . . . . . . . . . . . . . . . . . . . . . . . . . . . . . . . . . 3 Definitions . . . . . . . . . . . . . . . . . . . . . . . . . . . . . . . . . . . . . . . . . . . . . . . . . . 4 Possible Sources of Bias . . . . . . . . . . . . . . . . . . . . . . . . . . . . . . . . . . . . . . 4 Demographic Information . . . . . . . . . . . . . . . . . . . . . . . . . . . . . . . . . . . . . . 5 Salary Determination. . . . . . . . . . . . . . . . . . . . . . . . . . . . . . . . . . . . . . . . . . 7 Head of School . . . . . . . . . . . . . . . . . . . . . . . . . . . . . . . . . . . . . . . . . . . . . . 11 Other Administrative Staff . . . . . . . . . . . . . . . . . . . . . . . . . . . . . . . . . . . . . . 13 Benefits . . . . . . . . . . . . . . . . . . . . . . . . . . . . . . . . . . . . . . . . . . . . . . . . . . . . 15 Teacher Ratios. . . . . . . . . . . . . . . . . . . . . . . . . . . . . . . . . . . . . . . . . . . . . . . 19 Adult Learners . . . . . . . . . . . . . . . . . . . . . . . . . . . . . . . . . . . . . . . . . . . . . . . 22 Classroom Assistants. . . . . . . . . . . . . . . . . . . . . . . . . . . . . . . . . . . . . . . . . . 25 Music Teachers . . . . . . . . . . . . . . . . . . . . . . . . . . . . . . . . . . . . . . . . . . . . . . 28 Foreign Language Teachers . . . . . . . . . . . . . . . . . . . . . . . . . . . . . . . . . . . . 29 Physical Education Teachers . . . . . . . . . . . . . . . . . . . . . . . . . . . . . . . . . . . 30 Teacher Salaries . . . . . . . . . . . . . . . . . . . . . . . . . . . . . . . . . . . . . . . . . . . . . 31 Average Salaries per Level Based on Length of Day . . . . . . . . . . . . . . . 31 Average Salaries per Level Based on Highest Degree Earned . . . . . . . 36 Average Salaries per Level Based on Years of Experience . . . . . . . . . . 45 Montessori Credentials According to Level . . . . . . . . . . . . . . . . . . . . . . . . 54

AMS Compensation & Benefits 2019 Report
3
Summary of Results Two hundred ninety Montessori schools participated in the 2019 Compensation & Benefits Survey. The results represent a broad cross section of AMS member schools throughout the U.S. The respondents were fairly well represented from all states. The majority of respondents (58.6%) are from not-for-profit institutions. Salary Determination According to this year’s survey, the primary responsibility for setting salaries belongs to the head(s) of school(s) and administrative staff (over 51% of the responses). Most schools do not have a written salary survey, but of those that do have a written salary survey, almost 65% make this information available to teachers. The number of schools that have not given a salary increase has dropped over the years:
Year 2009 2011 2013 2015 2017 2019
No increase 32% 19% 16% 12.74% 10.55% 6%
In 65.7% of the schools, a 1 – 3% increase was given for the 2019 – 2020 school year.
Benefits Almost 80 percent (78%) of the schools offered health insurance to their full-time employees. Among those offering health insurance, schools paid an average of 70% of premiums for full-time staff members. Some schools offer cash in lieu of health insurance (results are on page 16). Most schools offered children’s tuition remission for employees (62%), and paid for professional association dues (almost 77%) and professional development fees (92%). Montessori Credential versus No Montessori Credential In general, teachers with Montessori credentials made more money than their non-credentialed counterparts. And, teachers with Full Montessori credentials made more money than teachers with Associate Montessori credentials. Take a look at page 53 for more information Brief Summary of How Some Variables Were Treated
For all questions that had numerical responses, we did not consider values of zero (0), and based our analysis only on non-zero values.
For questions that required percentages, for example, a percentage of life insurance covered, we did not consider values greater than 100% under the assumption that these values represented keying errors. For questions that required minimum wages, we ignored all hourly wages greater than $200, under the assumption that these values were erroneous.

AMS Compensation & Benefits 2019 Report
4
Definitions
Adult Learner: Student enrolled in a Montessori teacher education program.
A blank cell indicates that no responses were received, an asterisk (*) indicates not enough responses received to ensure a large enough pool of information to guarantee a statistically significant number from information that is sufficiently aggregated so as to ensure anonymity.
Mean: The sum of all the responses divided by the number of responses, also called the average.
Median: The response that is exactly in the middle when all the responses are listed in increasing order. The median is less likely to be distorted than the mean by a small number of unusually high or low responses.
N: Number of respondents.
Special/Auxiliary Teachers: Those individuals who teach music, foreign languages, and physical education.
U.S. Regions
Midwest States: Illinois, Indiana, Iowa, Michigan, Minnesota, Missouri, Ohio, and Wisconsin
Northeast States: Connecticut, Delaware, Maine, Massachusetts, New Hampshire, New Jersey, New York, New Hampshire, Pennsylvania, Rhode Island, and Vermont
Plain States: Arizona, Colorado, Kansas, Nebraska, New Mexico, North Dakota, Oklahoma, South Dakota, and Texas
Southeast States: Alabama, Arkansas, District of Columbia, Florida, Georgia, Kentucky, Louisiana, Maryland, Mississippi, North Carolina, Puerto Rico, South Carolina, Tennessee, Virginia, and West Virginia
West States: Alaska, California, Hawaii, Idaho, Northern Mariana Islands, Montana, Nevada, Oregon, Utah, Washington, and Wyoming
Possible Sources of Bias
Less than 1/5 of all eligible AMS member schools completed this survey.

AMS Compensation & Benefits 2019 Report
5
Demographic Information
Type of Community
Population N Percent
Less than 10,000 29 10
10,001 50,000 69 23.8
50,001 – 100,000 57 19.7
More than 100,000 135 46.5
Total Number of Responses 290
Geographic Location
Region N Percent
Northeast States 68 23.4
Southeast States 79 27.2
Midwest States 50 17.2
Plains States 46 15.8
West States 47 16.2
Total Number of Responses 290
Type of Educational Institution
Educational Institution N Percent
Charter 15 5.2
Not-for-Profit 170 58.6
Proprietary 96 33.1
Public/Magnet 7 2.4
Not-for Profit & Charter* 2 0.7
Total Number of Responses 290
*These schools have a not-for-profit preschool and a charter for children who are in first grade and above.

AMS Compensation & Benefits 2019 Report
6
Number of Students Enrolled
Student Enrollment Statistics Summary:
Average: 151.12 Students Median: 122 Students Range: 10 – 825 Students
Number of Students N Percent
1 – 49 50 17.2
50 – 100 67 23.1
101 – 149 56 19.3
150 – 200 45 15.5
201 – 300 46 15.9
More than 300 26 9.0
Total Number of Responses 290
Enrollment Comparison Enrollment Compared to Last Year
Comparison N Percent
Fewer Students 96 33.1
More Students 105 36.2
No Change 89 30.7
Total Number of Responses 290
AMS Compensation & Benefits 2019 Report
7
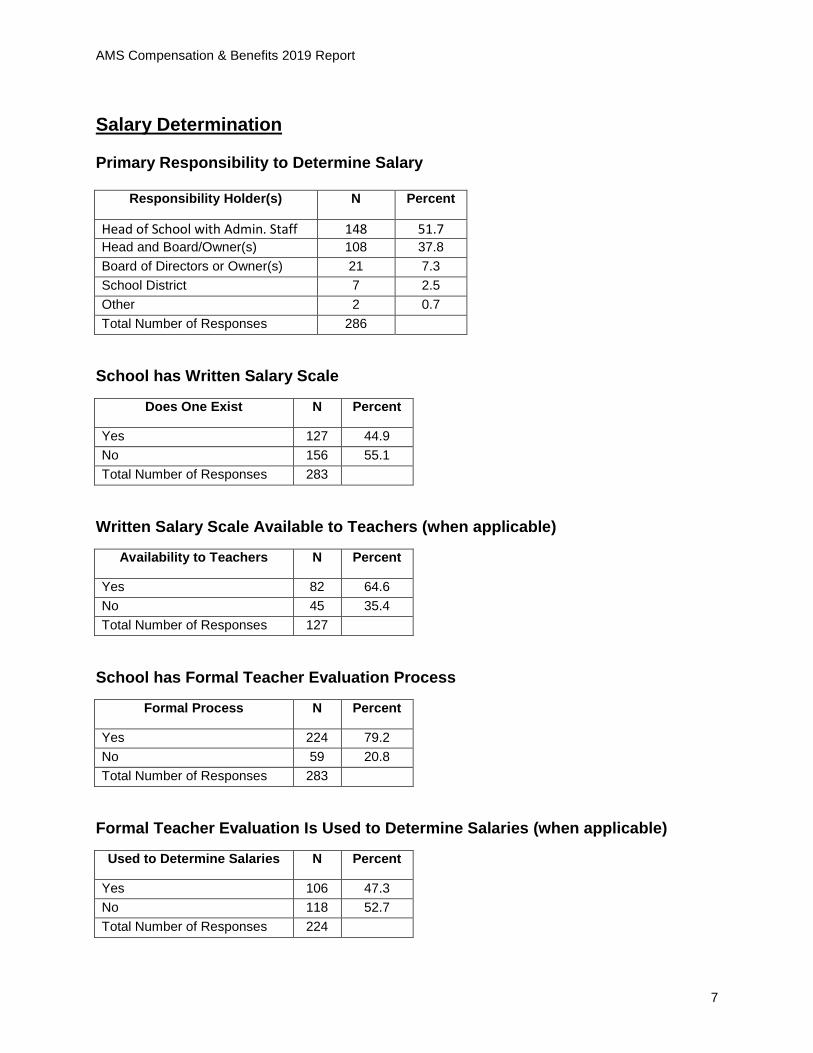
Salary Determination Primary Responsibility to Determine Salary
Responsibility Holder(s) N Percent
Head of School with Admin. Staff 148 51.7
Head and Board/Owner(s) 108 37.8
Board of Directors or Owner(s) 21 7.3
School District 7 2.5
Other 2 0.7
Total Number of Responses 286
School has Written Salary Scale
Does One Exist N Percent
Yes 127 44.9
No 156 55.1
Total Number of Responses 283
Written Salary Scale Available to Teachers (when applicable)
Availability to Teachers N Percent
Yes 82 64.6
No 45 35.4
Total Number of Responses 127
School has Formal Teacher Evaluation Process
Formal Process N Percent
Yes 224 79.2
No 59 20.8
Total Number of Responses 283
Formal Teacher Evaluation Is Used to Determine Salaries (when applicable)
Used to Determine Salaries N Percent
Yes 106 47.3
No 118 52.7
Total Number of Responses 224

AMS Compensation & Benefits 2019 Report
8
Single Most Important Factor in Setting Salaries of Newly Hired Teachers
Factor N Percent
Montessori Credential 100 37.8
Years of Teaching Experience 60 22.6
School Budget 39 14.7
Educational Background 32 12.1
Other 20 7.5
Teacher's Performance 8 3.0
Cost of Living 2 0.8
Economic Forecast 0 0
Total Number of Responses 265
Single Most Important Factor in Setting Salaries of Returning Teachers
Factor N Percent
Teacher's Performance 83 31.3
School Budget 74 27.9
Years of Teaching Experience 50 18.9
Cost of Living 19 7.2
Other 19 7.2
Montessori Credential 13 4.9
Educational Background 4 1.5
Salaries Offered by Competition 2 0.7
Economic Forecast 1 0.4
Total Number of Responses 265

AMS Compensation & Benefits 2019 Report
9
Factors Influencing Salary (Respondent Ranking by Importance)
Most Important Factors N Percent
Montessori Credentials 128 28.6
School Budget 96 21.4
Teacher’s Performance 88 19.6
Years of Teaching 57 12.7
Educational Background 41 9.2
Cost of Living 15 3.3
Economic Forecast 14 3.1
Salaries Offered by Competition 9 2.0
Total Number of Responses 448
Very Important Factors N Percent
Educational Background 141 19
Years of Teaching 126 17
Montessori Credentials 112 15.1
Teacher's Performance 102 13.7
School Budget 100 13.5
Salaries Offered by Competition 63 8.5
Cost of Living 54 7.3
Economic Forecast 45 6.1
Total Number of Responses 743
Important Factors N Percent
Cost of Living 138 22.0
Economic Forecast 117 18.7
Salaries Offered by Competition 108 17.3
Educational Background 68 10.9
Years of Teaching 67 10.7
School Budget 59 9.4
Teacher’s Performance 51 8.1
Montessori Credentials 18 2.9
Total Number of Responses 626
AMS Compensation & Benefits 2019 Report
10
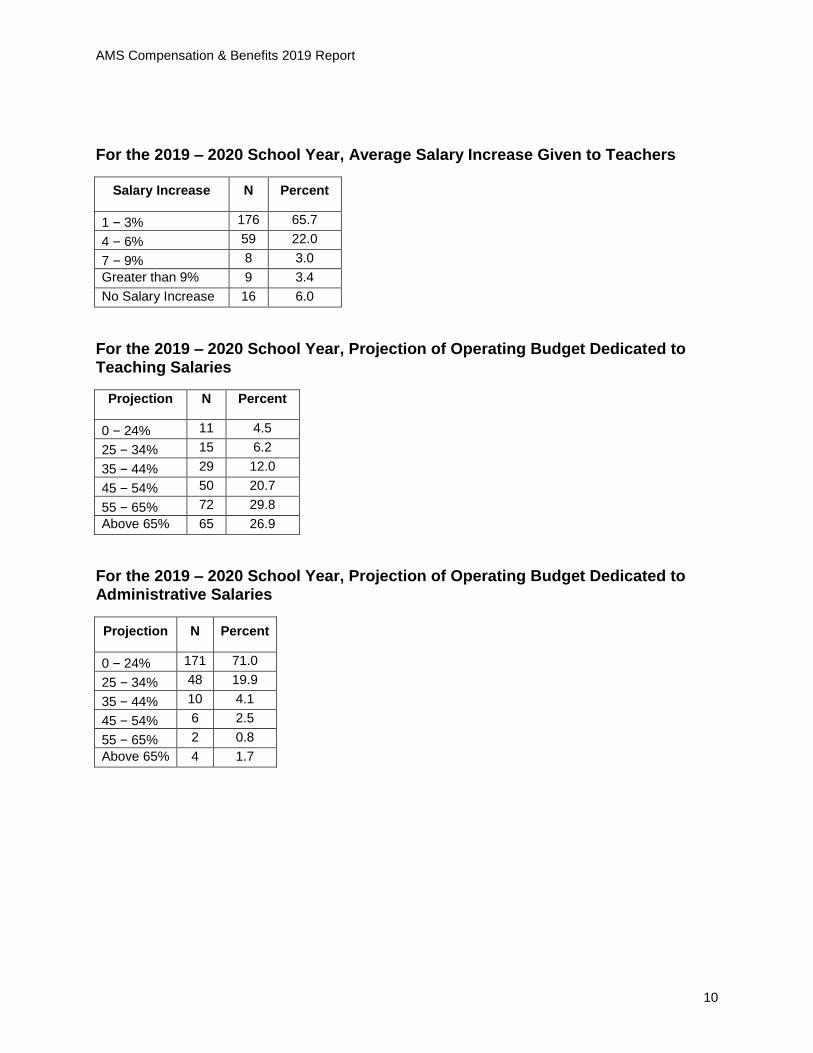
For the 2019 – 2020 School Year, Average Salary Increase Given to Teachers
Salary Increase N Percent
1 – 3% 176 65.7
4 – 6% 59 22.0
7 – 9% 8 3.0
Greater than 9% 9 3.4
No Salary Increase 16 6.0
For the 2019 – 2020 School Year, Projection of Operating Budget Dedicated to Teaching Salaries
Projection N Percent
0 – 24% 11 4.5
25 – 34% 15 6.2
35 – 44% 29 12.0
45 – 54% 50 20.7
55 – 65% 72 29.8
Above 65% 65 26.9
For the 2019 – 2020 School Year, Projection of Operating Budget Dedicated to Administrative Salaries
Projection N Percent
0 – 24% 171 71.0
25 – 34% 48 19.9
35 – 44% 10 4.1
45 – 54% 6 2.5
55 – 65% 2 0.8
Above 65% 4 1.7

AMS Compensation & Benefits 2019 Report
11
Head of School
Average Annual Salary if Head also Teaches in Classroom
Average: $60,480 Median: $55,000
Range: $22,000 – $135,000 Total Responses: 47
Average Annual Salary if Head Does Not Teach in Classroom
Average: $95,519 Median: $87,850 Range: $25,000 – $295,000 Total Responses: 181
Annual Salary for All Heads (Teaching and Not Teaching), Based on Student Enrollment
Number of Students Average Salary N
1 – 49 $51,539 36
50 – 100 $67,702 57
101 – 149 $82,632 46
150 – 200 $94,261 34
201 – 300 $116,942 37
More than 300 $167,744 19
Annual Salary for All Heads (Teaching and Not Teaching), Based on Geographic Location
Region Average Salary N
Northeast States $97,650 58
Southeast States $81,937 63
Midwest States $79,274 38
Plain States $89,418 32
West States $93,021 38

AMS Compensation & Benefits 2019 Report
12
Annual Salary for All Heads (Teaching and Not Teaching), Based on Population
Population Average Salary N
Less than 10,000 $82,480 26
10,001 – 50,000 $77,857 55
50,001 – 100,000 $82,991 43
More than 100,000 $97,515 105
Heads with or without an AMS Montessori Administrator’s Credential
Montessori Credential N Percent
Yes 108 45.6
No 131 54.4
Total Number of Responses 239
Heads with at Least a Bachelor’s Degree
At Least a Bachelor’s Degree N Percent
Yes 223 92.9
No 17 7.1
Total Number of Responses 240 N/A

AMS Compensation & Benefits 2019 Report
13
Other Administrative Staff
Number of Full-time Administrators (Other Than Head of School) Based on Enrollment
Number of Students Average number of Full-time Admin N
1 – 49 0.3 12
50 – 100 1.15 61
101 – 149 2.08 48
150 – 200 3.92 36
201 – 300 5.51 38
More than 300 11.47 19
Number of Part-time Administrators (Other Than Head of School) Based on Enrollment
Number of Students Average number of Part-time Admin N
1 – 49 0.3 40
50 – 100 1 61
101 – 149 0.98 48
150 – 200 0.61 36
201 – 300 1.32 38
More than 300 0.89 17
Average Annual Earnings for Full-time Administrative Staff
Staff Role Average Annual Earnings N
Assistant Director $61,715 82
Educational Coordinator $67,343 55
Development Director $60,483 49
Financial Director/Bookkeeper $67,163 100
Admissions Director $59,689 65
Administrative Assistant/Secretary $37,119 112
Nurse $45,307 14
Custodian #1 $39,485 52
Custodian #2 $40,387 16

AMS Compensation & Benefits 2019 Report
14
Average Annual Earnings for Part-time Administrative Staff
Staff Role Average Hourly Earnings N
Assistant Director $30,25 4
Educational Coordinator $27.00 12
Development Director *** **
Financial Director/Bookkeeper $29.88 18
Admissions Director $18.33 12
Administrative Assistant/ Secretary $16.75 34
Nurse 41.08 12
Custodian #1 $15.00 9
Custodian #2 $14.28 7

AMS Compensation & Benefits 2019 Report
15
Benefits
Number of Paid Holidays during the Academic Year
Average Number of Days Median Number of Days N
Full-time 11.91 10 206
Part-time 5.37 0 188
Number of Paid Sick Days during the Academic Year
Average Number of Days Median Number of Days N
Full-time 5.79 5 205
Part-time 3.01 0.5 190
Number of Paid Sick Days for Employees Working Year-Round
Average Number of Days Median Number of Days N
Full-time 5.79 6 187
Part-time 3.05 0 172
Number of Paid Vacation Days during the Academic Year
Average Number of Days Median Number of Days N
Full-time 7.49 3 191
Part-time 3.10 0 178
Number of Paid Vacation Days for Employees Working Year-Round
Average Number of Days Median Number of Days N
Full-time 9.57 10 190
Part-time 3.72 0 167
Number of Paid Personal Days (Non-Sick and Non-Vacation Days) during Academic Year
Average Number of Days Median Number of Days N
Full-time 3.41 2 189
Part-time 1.50 0 179

AMS Compensation & Benefits 2019 Report
16
Number of Paid Personal Days (Non-Sick and Non-Vacation Days) for Employees Working Year-Round
Average Number of Days Median Number of Days N
Full-time 3.78 2 181
Part-time 1.59 0 169
Other Types of Benefits Offered
Interchangeable vacation, sick and personal days
Professional development time off
Bereavement time off
Heads of School receive additional paid days off
As the years of employment increase, number of days off increase
Paid observation days
Maternity leave
Holidays including winter and spring breaks
Academic wages spread evenly over 10- or 12-month pay periods
Jury duty time off
All staff are salaried, so holidays are not considered as paid days
Staff are paid extra hours for parent-teacher conference preparation, classroom preparation, and in-service days/workshops
Staff benefits are a percentage of the total hours worked
Part-time staff receive pay to use for snow days and 2-hour delays
Unused time off is reimbursed at the end of the school year
The Montessori Event registration
Snow days paid at 50% rate
Adult learners are given extra paid time off for seminars and observations
Benefits Offered to Full-Time Staff
Benefit
Yes
Average % Covered
No
Life Insurance 100 (46%) 78.1 119 (54%)
Health Insurance 149 (78.1%) 69.8 75 (21.9%)
Dental Insurance 122 (55.2%) 42.9 99 (44.8%)
Educators Liability Insurance 81 (37.5%) 97.7 135 (62.5%)
Benefits Offered to Part-Time Staff
Benefit
Yes
Average % Covered
No
Life Insurance 20 (9.1%) 80 200 (90.9%)
Health Insurance 26 (11.8%) 55.9 194 (88.2%)
Dental Insurance 21 (9.7%) 20.2 196 (90.3%)
Educators Liability Insurance 59 (27.6%) 99.1 155 (72.4%)
AMS Compensation & Benefits 2019 Report
17
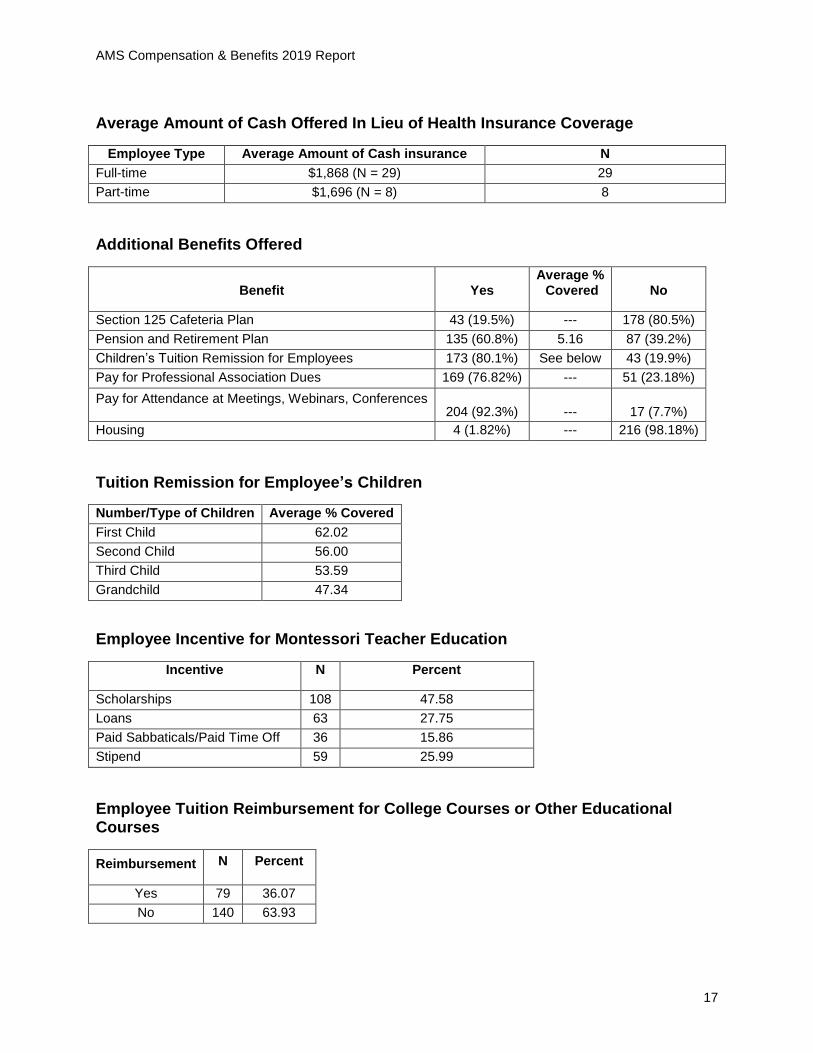
Average Amount of Cash Offered In Lieu of Health Insurance Coverage
Employee Type Average Amount of Cash insurance N
Full-time $1,868 (N = 29) 29
Part-time employees
$1,696 (N = 8) 8
Additional Benefits Offered
Benefit
Yes
Average % Covered
No
Section 125 Cafeteria Plan 43 (19.5%) --- 178 (80.5%)
Pension and Retirement Plan 135 (60.8%) 5.16 87 (39.2%)
Children’s Tuition Remission for Employees 173 (80.1%) See below 43 (19.9%)
Pay for Professional Association Dues 169 (76.82%) --- 51 (23.18%)
Pay for Attendance at Meetings, Webinars, Conferences 204 (92.3%)
---
17 (7.7%)
Housing 4 (1.82%) --- 216 (98.18%)
Tuition Remission for Employee’s Children
Number/Type of Children Average % Covered
First Child 62.02
Second Child 56.00
Third Child 53.59
Grandchild 47.34
Employee Incentive for Montessori Teacher Education
Incentive N Percent
Scholarships 108 47.58
Loans 63 27.75
Paid Sabbaticals/Paid Time Off 36 15.86
Stipend 59 25.99
Employee Tuition Reimbursement for College Courses or Other Educational Courses
Reimbursement N Percent
Yes 79 36.07
No 140 63.93

AMS Compensation & Benefits 2019 Report
18
Length of Lunch Break
Length of Lunch Break N Percent
1 Hour 41 18.98
40 – 50 Minutes 19 8.79
30 Minutes 121 56.03
15 – 20 Minutes 3 1.39
Break is Taken in the Classroom While the Students Are Eating 32 14.81
AMS Compensation & Benefits 2019 Report
19
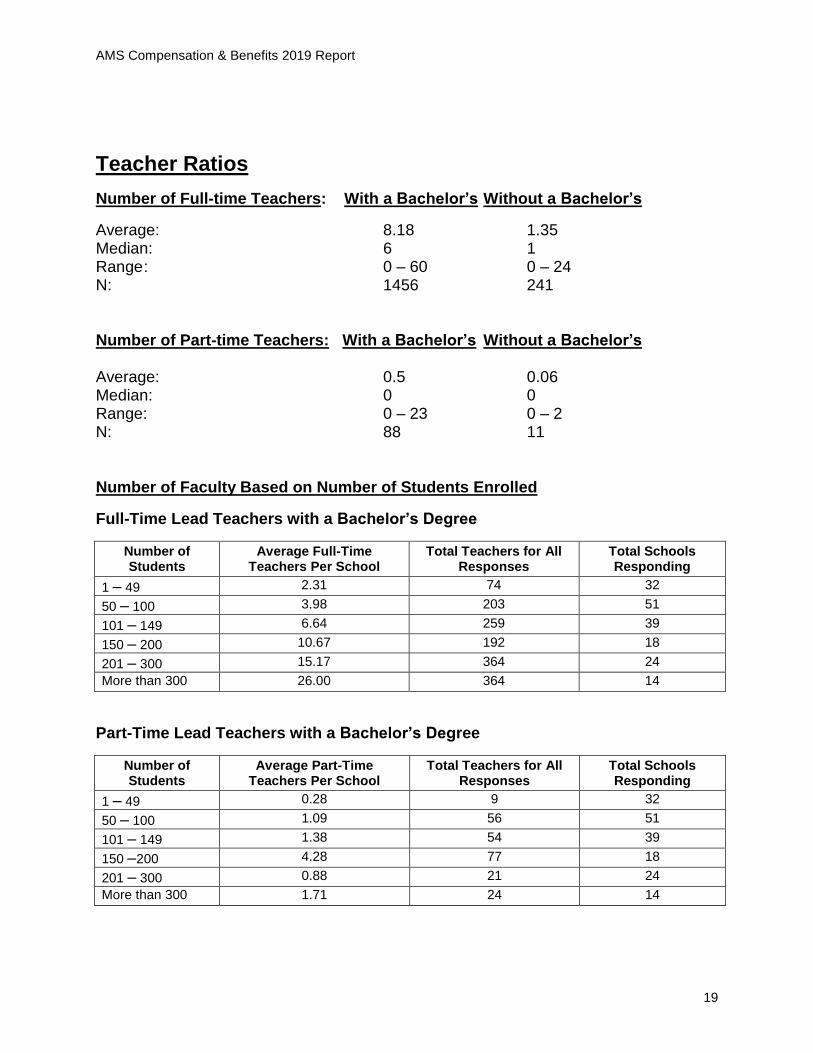
Teacher Ratios
Number of Full-time Teachers: With a Bachelor’s Without a Bachelor’s
Average: 8.18 1.35 Median: 6 1 Range : 0 – 60 0 – 24 N: 1456 241 Number of Part-time Teachers: With a Bachelor’s Without a Bachelor’s Average: 0.5 0.06 Median: 0 0 Range: 0 – 23 0 – 2 N: 88 11 Number of Faculty Based on Number of Students Enrolled
Full-Time Lead Teachers with a Bachelor’s Degree
Number of Students
Average Full-Time Teachers Per School
Total Teachers for All Responses
Total Schools Responding
1 – 49 2.31 74 32
50 – 100 3.98 203 51
101 – 149 6.64 259 39
150 – 200 10.67 192 18
201 – 300 15.17 364 24
More than 300 26.00 364 14
Part-Time Lead Teachers with a Bachelor’s Degree
Number of Students
Average Part-Time Teachers Per School
Total Teachers for All Responses
Total Schools Responding
1 – 49 0.28 9 32
50 – 100 1.09 56 51
101 – 149 1.38 54 39
150 –200 4.28 77 18
201 – 300 0.88 21 24
More than 300 1.71 24 14

AMS Compensation & Benefits 2019 Report
20
Full-Time Lead Teachers Without a Bachelor’s Degree
Number of Students
Average Full-Time Teachers Per School
Total Teachers for All Responses
Total Schools Responding
1 – 49 0.18 3 17
50 – 100 0.49 51 25
101 – 149 0.36 14 39
150 – 200 0.16 3 19
201 – 300 0.41 9 22
More than 300 2.38 31 13
Part-Time Lead Teachers Without a Bachelor’s Degree
Number of Students
Average Part-Time Teachers Per School
Total Teachers for All Responses
Total Schools Responding
1 – 49 0.12 2 17
50 – 100 0.02 1 49
101 – 149 0.77 3 39
150 – 200 0.06 1 18
201 – 300 0.05 1 22
More than 300 0.08 1 12
Classroom Assistants
Full-Time Assistants
Number of Students
Average Full-Time Assistants Per School
Total Assistants for All Responses
Total Schools Responding
1 – 49 1.9 38 20
50 – 100 4.35 222 51
101 –149 6.77 264 39
150 – 200 6.72 121 18
201 – 300 8.21 197 24
More than 300 19.86 278 14

AMS Compensation & Benefits 2019 Report
21
Part-Time Assistants
Number of Students
Average Part-Time Assistants Per School
Total Assistants for All Responses
Total Schools Responding
1 – 49 1.2 24 20
50 – 100 2.10 107 51
101 – 149 2.77 108 39
150 – 200 2.06 37 18
201 – 300 2.65 61 23
More than 300 3.42 41 12
Special/Auxiliary Teachers
Full-Time
Number of Students
Average Full-Time Auxiliary Teachers Per School
Total Auxiliary Teachers for All Responses
Total Schools Responding
1 – 49 0.35 7 20
50 – 100 0.55 28 51
101 – 149 0.54 21 39
150 – 200 1.39 25 18
201 – 300 3.6 90 25
More than 300 3.93 55 14
Part-Time
Number of Students
Average Part-Time Auxiliary Teachers Per School
Total Auxiliary Teachers for All Responses
Total Schools Responding
1 – 49 0.8 16 20
50 – 100 1.57 80 51
101 – 149 2.64 103 39
150 – 200 1.5 27 18
201 – 300 2.17 52 24
More than 300 3.38 44 13

AMS Compensation & Benefits 2019 Report
22
Adult Learners
Schools Employing Adult Learners
Adult Learners on Staff N Percent
No 67 38.07
Yes 109 61.93
According to Population
Population Adult Learner N Percent
Less than 10,000 No 6 26.1
Yes 17 73.9
10,001 – 50,000 No 23 50
Yes 23 50
50,001 – 100,000 No 14 42.4
Yes 19 57.6
More than 100,000 No 24 32.4
Yes 50 67.6
According to Geographic Location
Region Adult Learner N Percent
Northeast States No 22 47.8
Yes 24 52.2
Southeast States No 16 44
Yes 31 66
Midwest States No 16 47.1
Yes 18 52.9
Plain States No 5 30.4
Yes 16 69.6
West States No 8 28.6
Yes 20 71.4

AMS Compensation & Benefits 2019 Report
23
According to Number of Students Enrolled
Number of Students Adult Learner N Percent
1 – 49 No 20 62.5
Yes 12 37.5
50 – 100 No 20 40
Yes 30 60
101 – 149 No 13 34.2
Yes 25 65.8
150 – 200 No 5 25
Yes 15 75
201 – 300 No 6 37.5
Yes 10 62.5
More than 300 No 3 21,4
Yes 11 78.6
Annual Salary of Full-time Adult Learners
Average: $32,161 Median: $31,572 Range: $19,055 – $60,000 N: 98 According to Population
Population Average Salary N
Less than 10,000 $31,053 17
10,001 – 50,000 $33,285 19
50,001 – 100,000 $29,813 16
More than 100,000 $32,923 46
According to Geographic Location
Region Average Salary N
Northeast States $33,814 20
Southeast States $31,101 31
Midwest States $30,708 16
Plain States $32,434 16
West States $33,407 15

AMS Compensation & Benefits 2019 Report
24
According to Student Enrollment
Number of Students Average Salary N
1 – 49 $35,457 8
50 – 100 $30,896 27
101 – 149 $30,854 24
150 – 200 $29,588 12
201 – 300 $34,337 17
More than 300 $35,472 11
Annual Salary of Part-time Adult Learners
Average: $18,816 Median: $0 Range: $6,000 – $32,000 N: 24 According to Population
Population Average Salary N
Less than 10,000 $19,700 5
10,001 – 50,000 $10,692 3
50,001 – 100,000 $18,294 3
More than 100,000 $18,731 13
According to Geographic Location
Region Average Salary N
Northeast States $20,286 9
Southeast States $24,700 3
Midwest States $12,942 6
Plain States *** **
West States $15,772 6
According to Student Enrollment
Number of Students Average Salary N
1 – 49 $14,964 6
50 – 100 $19,544 4
101 – 149 $18,000 6
150 – 200 *** **
201 – 300 $22,167 3
More than 300 $16,333 3

AMS Compensation & Benefits 2019 Report
25
Classroom Assistants
Hourly Wage for Full-time Early Childhood Classroom Assistants
Average: $14.95 Median: $15.00 Range: $8.00 – $25.00 N: 119 According to Population
Population Average Wage N
Less than 10,000 $14.38 15
10,001 – 50,000 $14.60 31
50,001100,000 $14.73 25
More than 100,000 $15.48 48
According to Geographic Location
Region Average Wage N
Northeast States $16.28 28
Southeast States $14.15 36
Midwest States $14.03 24
Plain States $14.62 13
West States $15.97 18
According to Student Enrollment
Number of Students Average Wage N
1 – 49 $14.69 17
50 – 100 $14.53 32
101 – 149 $14.72 30
150 – 200 $15.62 13
201– 300 $15.01 17
More than 300 $16.50 10

AMS Compensation & Benefits 2019 Report
26
Hourly Wage for Full-time Elementary Classroom Assistants Average: $15.90 Median: $15.00 Range: $9.00 – $27.00 N: 64 According to Population
Population Average Wage N
Less than 10,000 $14.09 11
10,001 – 50,000 $16.47 15
50,001100,000 $14.60 10
More than 100,000 $16.79 28
According to Geographic Location
Region Average Wage N
Northeast States $18.56 9
Southeast States $14.50 22
Midwest States $14.17 12
Plain States $16.25 8
West States $17.85 13
According to Student Enrollment
Number of Students Average Wage N
1 – 49 $11.00 33
50 – 100 $14.83 12
101 – 149 $16.22 18
150 – 200 $17.10 10
201 – 300 $16.77 13
More than 300 $15.75 8

AMS Compensation & Benefits 2019 Report
27
Hourly Wage for Full-time Middle School Classroom Assistants Average: $15.73 Median: $14.00 Range: $12.00 – $25.00 N: 15 According to Population
Population Average Wage N
Less than 10,000 $18.33 3
10,001 – 50,000 *** **
50,001100,000 *** **
More than 100,000 $16.13 8
According to Geographic Location
Region Average Wage N
Northeast States *** **
Southeast States $13.00 5
Midwest States $16.67 3
Plain States $16.67 3
West States $17.00 3
According to Student Enrollment
Number of Students Average Wage N
1 – 49 *** **
50 – 100 *** **
101 – 149 $16.00 5
150 – 200 *** **
201 – 300 $15.67 3
More than 300 $14.67 3
Hourly Wage for Full-time Middle School Classroom Assistants Average: $14.33 Median: $15.00 Range: $12.00 – $16.00 N: 3

AMS Compensation & Benefits 2019 Report
28
Music Teachers Hourly Wage for Music Teachers during Academic Year Average: $37.01 Median: $30.00 Range: $9.00 – $100.00 N: 83 According to Population
Population Average Wage N
Less than 10,000 $35.71 14
10,001 – 50,000 $44.39 23
50,001 – 100,000 $39.04 17
More than 100,000 $30.60 29
According to Geographic Location
Region Average Wage N
Northeast States $46.53 30
Southeast States $32.29 25
Midwest States $28.91 11
Plain States $29.29 7
West States $34.60 10
According to Student Enrollment
Number of Students Average Wage N
1 – 49 $50.00 8
50 – 100 $42.20 25
101 – 149 $36.71 21
150 – 200 $29.91 11
201 – 300 $28.40 14
More than 300 $29.92 4

AMS Compensation & Benefits 2019 Report
29
Foreign Language Teachers Hourly Wage for Foreign Language Teachers during Academic Year Average: $30.33 Median: $25.00 Range: $9.00 – $80.00 N: 73 According to Population
Population Average Wage N
Less than 10,000 $30.64 11
10,001 – 50,000 $29.45 22
50,001 – 100,000 $34.59 16
More than 100,000 $28.14 24
According to Geographic Location
Region Average Wage N
Northeast States $35.35 26
Southeast States $25.88 21
Midwest States $30.18 11
Plain States $23.33 6
West States $31.03 9
According to Student Enrollment
Number of Students Average Wage N
1 – 49 $31.71 7
50 – 100 $36.14 21
101 – 149 $28.60 20
150 – 200 $27.33 12
201 – 300 $24.15 9
More than 300 $28.85 4

AMS Compensation & Benefits 2019 Report
30
Physical Education Teachers
Hourly Wage for Physical Education Teachers during Academic Year Average: $30.59 Median: $25.04 Range: $9.00 – $120.00 N: 64 According to Population
Population Average Wage N
Less than 10,000 $25.92 13
10,001 – 50,000 $37.24 17
50,001 – 100,000 $32.28 11
More than 100,000 $27.51 23
According to Geography
Region Average Wage N
Northeast States $39.56 18
Southeast States $28.90 23
Midwest States $22.00 7
Plain States $25.38 8
West States $28.00 8
According to Student Enrollment
Number of Students Average Salary N
1 – 49 $28.00 3
50100 $37.58 19
101 – 149 $28.12 17
150 – 200 $25.88 8
201 – 300 $27.96 13
More than 300 $27.84 4

AMS Compensation & Benefits 2019 Report
31
Teacher Salaries
Average Salaries per Level Based on Length of Day: Overall
Level Length of Day N Average Salary Range
Infant & Toddler Full-day 283 $37,554 $19,000 – $88,240
Half-day 28 $26,721 $11,200 – $47,000
Early Childhood Full-day 627 $42,337 $15,000 – $100,000
Half-day 37 $25,663 $12,000 – $55,000
Elementary I Full-day 226 $45,828 $17,500 – $84,200
Half-day 4 $29,700 $17,300 – $45,000
Elementary II Full-day 136 $45,660 $17,500 – $80,000
Half-day *** *** ***
Elementary I – II Full-day 37 $48,034 $35,000 – $73,437
Secondary I Full-day 59 $50,657 $30,000 – $80,600
Secondary II Full-day 14 $66,929 $56,000 – $83,000
Secondary I – II Full-day 11 $46,515 $32,000 – $57,000

AMS Compensation & Benefits 2019 Report
32
Average Salaries per Level Based on Length of Day: According to Population
Population
Level Length Less than 10,000
People N
10,001 – 50,000 People
N 50,001 – 100,000
People N
More than 100,000 People
N
Infant & Toddler Full-day $34,861 42 $34,817 55 $36,707 51 $39,827 135
Half-day $30,667 6 $21,995 13 $25,501 5 $36,842 7
Early Childhood Full-day $38,985 64 $37,916 139 $27,497 17 $45,765 315
Half-day $33,006 5 $27,489 19 $29,441 8 $26,341 20
Elementary I Full-day $41,686 28 $42,480 42 $42,353 42 $49,360 114
Half-day $28,933 3 *** *
Elementary II Full-day $42,021 19 $45,646 33 $41,716 21 $48,081 63
Elementary I – II Full-day $46,350 4 $42,991 9 $45,833 6 $51,664 18
Secondary I Full-day $46,256 10 $53,500 12 $47,493 16 $53,209 22
Secondary II Full-day *** *** $65,917 12
Secondary I – II Full-day $51,000 4 *** *** $43,733 5

AMS Compensation & Benefits 2019 Report
33
Average Salaries per Level Based on Length of Day: According to Geographic Location
Region
Level Length Northeast N Southeast N Midwest N Plains N West N
Infant & Toddler Full-day $40,966 80 $35,243 77 $38,202 39 $31,900 47 $41,189 40
Half-day $26,377 18 $26,067 6 *** *** *** *** $40,550 3
Early Childhood Full-day $45,833 157 $40,374 157 $40,187 116 $40,183 86 $44,086 111
Half-day $29,994 21 $20,600 5 $25,752 13 $32,263 6 $25,600 5
Elementary I Full-day $46,677 35 $43,536 70 $42,231 40 $44,969 40 $53,365 41
Half-day *** *** *** *** *** ***
Elementary II Full-day $48,088 24 $43,655 45 $42,503 16 $45,806 26 $48,812 25
Elementary I – II Full-day $44,154 6 $45,588 12 $46,100 5 $42,231 6 $55,675 8
Secondary I Full-day $55,333 12 $43,495 13 $43,778 9 $48,663 14 $62,187 11
Secondary II Full-day $66,929 14
Secondary I – II Full-day $46,074 9 *** *** *** ***

AMS Compensation & Benefits 2019 Report
34
Average Salaries per Level Based on Length of Day: According to Student Enrollment
Student Enrollment
Level Length 1 – 49 N 50 – 100 N 101 – 149 N 150 – 200 N 201 – 300 N >300 N
Infant & Toddler Full-day $29,836 25 $34,393 67 $33,983 65 $37,771 35 $41,756 58 $49,236 33
Half-day *** *** $21,079 13 $32,225 9 $36,514 3 $39,263 4 *** ***
Early Childhood Full-day $37,380 55 $38,258 140 $38,845 128 $42,866 85 $45,543 136 $51,816 82
Half-day $23,259 11 $27,784 20 $29,794 13 $39,711 3 *** *** $23,275 4
Elementary I Full-day $32,000 5 $39,326 26 $42,750 48 47,042 41 $43,090 59 $54,983 47
Half-day *** *** *** *** *** ***
Elementary II Full-day *** *** $39,695 19 $45,776 33 $49,625 24 $39,534 31 $53,890 27
Half-day *** ***
Elementary I – II Full-day *** ** $43,304 10 $54,362 9 $43,125 8 $50,997 10 *** ***
Secondary I Full-day *** *** $43,130 15 $51,165 15 $50,201 12 $61,676 11
Secondary II Full-day $65,917 12 *** ***
Secondary I – II Full-day *** *** *** *** *** *** $49,095 7

AMS Compensation & Benefits 2019 Report
35
Average Salaries per Level Based on the Length of Day: According to the Type of School
Type of School
Level Length Proprietary N Not-for-Profit N Charter N Public/Magnet N
Infant & Toddler Full-day $36,649 97 $38,026 186
Half-day $16,284 6 $30,306 25
Early Childhood Full-day $39,419 174 $43,246 429 $50,508 21 $19,167 3
Half-day $20,472 14 $30,607 38 *** ***
Elementary I Full-day $43,522 52 $45,932 192 $48,773 30 $18,750 4
Half-day *** ***
Elementary II Full-day $45,688 109 $43,557 87 $50,216 23 $18,750 4
*** ***
Elementary I – II Full-day $40,667 6 $49,460 31 *** ***
Secondary I Full-day *** *** $51,860 48 $46,149 10
Half-day *** ***
Secondary II Full-day *** *** $65,917 12
Secondary I – II Full-day $42,500 4 $48,809 7

AMS Compensation & Benefits 2019 Report
36
Average Salaries per Level Based on Highest Degree Earned: Overall
Level Level of Education Full-day Average Salary N Half-day Average Salary N
Infant & Toddler
High School Diploma $31,298 63 $33,424 6
2-Year College Degree $36,276 60 *** ***
4-Year College Degree $39,497 128 $25,067 20
Master’s Degree or Higher $44,497 32 $35,853 3
Early Childhood
High School Diploma $36,406 65 $15,780 5
2-Year College Degree $38,299 59 $23,227 3
4-Year College Degree $41,557 353 $27,471 33
Master’s Degree or Higher $48,332 150 $35,867 11
Elementary I
High School Diploma *** ***
2-Year College Degree $38,557 6
4-Year College Degree $44,758 148 $33,833 3
Master’s Degree or Higher $49,117 69 *** ***
Elementary II
High School Diploma *** ***
2-Year College Degree $30,333 3
4-Year College Degree $45,465 91 *** ***
Master’s Degree or Higher $47,929 40
Elementary I – II 2-Year College Degree *** ***
4-Year College Degree $47,873 22
Master’s Degree or Higher $47,076 14
Secondary I 2-Year College Degree *** ***
4-Year College Degree $48,667 29
Master’s Degree or Higher $53,223 29 *** ***
Secondary II 4-Year College Degree $61,714 7
Master’s Degree or Higher $72,143 7
Secondary I – II 4-Year College Degree *** ***
Master’s Degree or Higher $48,074 9

AMS Compensation & Benefits 2019 Report
37
Average Salaries per Level Based on Highest Degree Earned: According to Population – Full-Day
Population
Level Level of Education Less than
10,000 People N
10,001 – 50,000 People
N 50,001 – 100,000 People
N More than
100,000 People N
Infant & Toddler
High School Diploma $29,311 9 $30,358 16 $27,535 13 $34,571 25
2-Year College Degree $33,533 6 $36,489 12 $42,342 10 $34,815 32
4-Year College Degree $37,006 24 $36,529 21 $38,073 23 $42,077 60
Master’s Degree or Higher $37,000 3 $37,367 6 $43,000 5 $48,396 17
Early Childhood
High School Diploma $32,943 9 $33,249 23 $39,317 13 $39,702 20
2-Year College Degree $40,487 10 $38,767 6 $36,128 19 $38,988 24
4-Year College Degree $41,199 34 $38,159 79 $41,384 57 $43,144 183
Master’s Degree or Higher $35,718 11 $40,596 31 $40,370 20 $54,444 88
Elementary I
High School Diploma *** *** *** *** *** ***
2-Year College Degree *** *** $49,133 3
4-Year College Degree $41,041 22 $44,232 25 $39,242 20 $47,240 81
Master’s Degree or Higher $44,050 6 $42,417 14 $46,689 20 $55,075 29
Elementary II
High School Diploma *** *** *** ***
2-Year College Degree *** *** *** *** *** ***
4-Year College Degree $41,873 11 $44,459 19 $42,495 13 $47,490 48
Master’s Degree or Higher $42,225 8 $53,600 11 $40,451 8 $51,243 13
Elementary I – II
2-Year College Degree *** ***
4-Year College Degree *** *** $42,210 6 $44,590 3 $51,315 12
Master’s Degree or Higher $45,000 3 $44,554 3 $47,075 3 $49,835 5
Secondary I
2-Year College Degree *** *** *** ***
4-Year College Degree $46,600 5 $52,667 6 $45,761 11 $51,283 7
Master’s Degree or Higher $45,825 4 $54,333 6 $51,303 5 $55,753 14
Secondary II 4-Year College Degree *** *** $57,200 5
Master’s Degree or Higher $72,143 7
Secondary I – II 4-Year College Degree *** *** *** ***
Master’s Degree or Higher $52,333 3 *** *** $46,666 4

AMS Compensation & Benefits 2019 Report
38
Half-Day
Population
Level Level of Education Less than
10,000 People N
10,001 – 50,000 People
N 50,001 – 100,000
People N
More than 100,000 People
N
Infant & Toddler
High School Diploma *** *** *** *** *** *** *** ***
2-Year College Degree *** *** *** ***
4-Year College Degree $25,750 4 $22,377 11 *** *** $27,500 4
Master’s Degree or Higher *** *** $36,951 3
Early Childhood
High School Diploma $15,967 3
2-Year College Degree *** *** *** ***
4-Year College Degree $31,750 4 $28,043 13 $26,224 3 $25,872 13
Master’s Degree or Higher *** *** $36,611 3 $36,408 3 $34,362 4
Elementary I 4-Year College Degree *** *** *** ***
Master’s Degree or Higher *** ***
Elementary II 4-Year College Degree *** ***
Secondary Master’s Degree or Higher *** ***

AMS Compensation & Benefits 2019 Report
39
Average Salaries per Level Based on Highest Degree Earned: According to Geographic Location – Full-Day
Region
Level Level of Education Northeast N Southeast N Midwest N Plains N West N
Infant & Toddler
High School Diploma $27,717 5 $31,000 15 $35,555 11 $29,287 26 $35,934 6
2-Year College Degree $38,208 15 $32,186 20 $36,500 7 $32,911 10 $46,891 8
4-Year College Degree $39,770 40 $39,036 37 $40,638 17 $36,871 10 $40,036 24
Master’s Degree or Higher $48,740 20 $32,137 5 $38,113 4 *** *** *** ***
Early Childhood
High School Diploma $35,628 13 $33,849 11 $34,316 19 $39,135 16 $42,120 6
2-Year College Degree $40,170 8 $36,546 16 $42,134 11 $33,977 12 $40,195 12
4-Year College Degree $42,659 79 $39,767 93 $40,307 63 $41,128 50 $44,196 68
Master’s Degree or Higher $53,353 57 $45,493 37 $43,775 23 $45,679 8 $46,127 25
Elementary I
High School Diploma *** *** *** *** *** ***
2-Year College Degree $34,100 4 *** *** *** ***
4-Year College Degree $44,605 23 $42,564 46 $41,780 27 $44,587 28 $52,659 24
Master’s Degree or Higher $50,647 12 $48,061 19 $43,169 13 $45,329 10 $56,911 15
Elementary II
High School Diploma *** *** *** ***
2-Year College Degree *** *** *** ***
4-Year College Degree $48,228 14 $42,576 30 $39,772 13 $45,622 20 $53,953 14
Master’s Degree or Higher $47,891 10 $48,785 13 *** *** $46,621 5 $44,595 10
Elementary I – II
2-Year College Degree *** ***
4-Year College Degree *** *** $46,985 7 $45,875 4 $39,787 4 $60,080 5
Master’s Degree or Higher $45,915 4 $50,832 5 *** *** *** *** *** ***
Secondary I
2-Year College Degree *** ***
4-Year College Degree $54,250 8 $39,938 6 $40,250 4 $44,189 5 $59,296 6
Master’s Degree or Higher $57,500 4 $46,545 7 $46,660 5 $53,659 8 $65,655 5
Secondary II 4-Year College Degree $61,714 7
Master’s Degree or Higher $72,143 7
Secondary I – II 4-Year College Degree *** *** *** ***
Master’s Degree or Higher $45,111 6 *** ***
AMS Compensation & Benefits 2019 Report
40
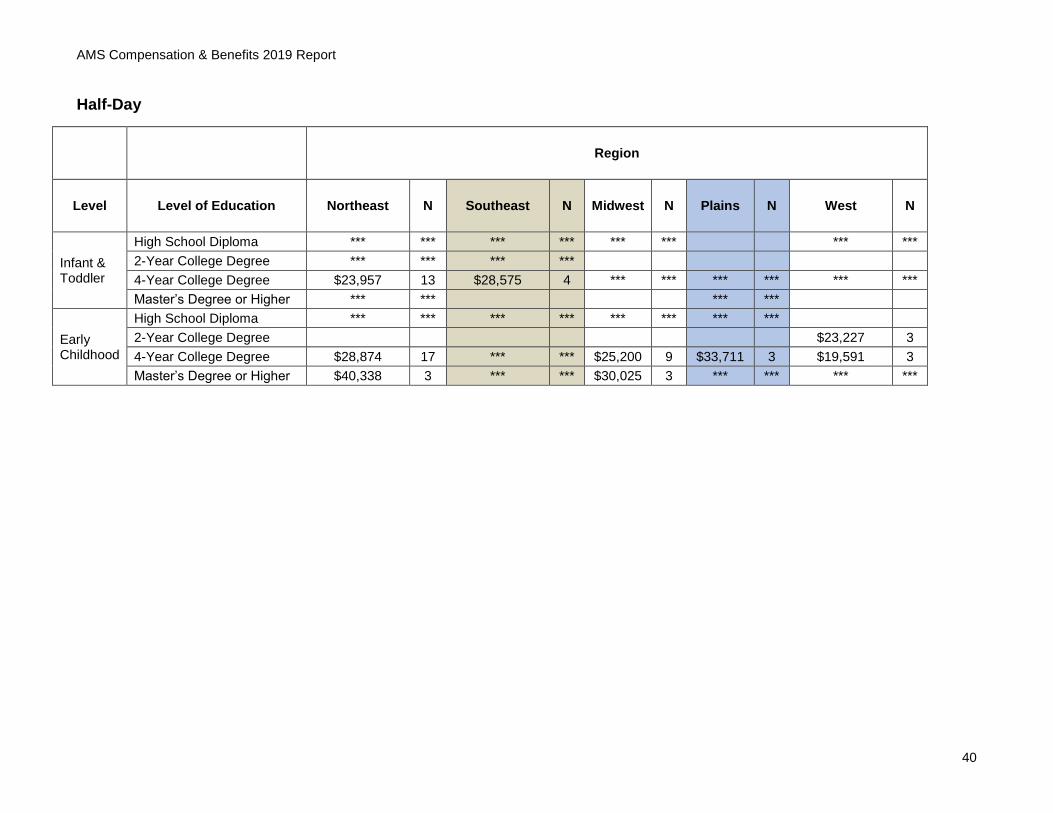
Half-Day
Region
Level Level of Education Northeast N Southeast N Midwest N Plains N West N
Infant & Toddler
High School Diploma *** *** *** *** *** *** *** ***
2-Year College Degree *** *** *** ***
4-Year College Degree $23,957 13 $28,575 4 *** *** *** *** *** ***
Master’s Degree or Higher *** *** *** ***
Early Childhood
High School Diploma *** *** *** *** *** *** *** ***
2-Year College Degree $23,227 3
4-Year College Degree $28,874 17 *** *** $25,200 9 $33,711 3 $19,591 3
Master’s Degree or Higher $40,338 3 *** *** $30,025 3 *** *** *** ***

AMS Compensation & Benefits 2019 Report
41
Average Salaries per Level Based on Highest Degree Earned: According to Student Enrollment – Full-Day
Student Enrollment
Level Level of Education 1 – 49 N 50 – 100 N 101 – 149 N 150 – 200 N 201 – 300 N >300 N
Infant & Toddler
High School Diploma $22,127 6 $34,254 19 $29,195 20 $34,868 8 $32,290 8 *** ***
2-Year College Degree $26,312 5 $32,726 14 $36,036 11 $37,131 10 $33,760 9 $46,845 11
4-Year College Degree $32,246 12 $34,025 23 $36,193 28 $39,857 16 $43,837 34 $49,633 15
Master’s Degree or Higher
$34,800 5 $41,681 8 $35,867 6 *** *** $53,048 6 $59,600 5
Early Childhood
High School Diploma $31,952 5 $33,698 21 $35,400 10 $32,079 12 $40,207 7 * *
2-Year College Degree $32,500 4 $37,884 15 *** ***
4-Year College Degree $36,006 34 $38,110 68 $39,224 72 $37,630 46 $40,709 71 $42,856 26
Master’s Degree or Higher $45,164 12 $41,353 36 $42,694 22 $42,904 12 $54,262 20 $51,116 11
Elementary I
4-Year College Degree * * $41,855 10 $38,474 34 $40,005 29 $39,678 48 $48,391 22
Master’s Degree or Higher * * $46,008 10 $42,384 7 $46,543 12 $53,521 21 $55,208 11
Elementary II
High School Diploma *** *** *** ***
2-Year College Degree *** *** *** *** *** ***
4-Year College Degree *** *** $41,989 9 $44,148 25 $49,090 19 $40,216 20 $51,951 17
Master’s Degree or Higher $41,367 9 $53,843 7 $51,659 5 $38,324 10 $58,492 9
Elementary I – II
2-Year College Degree *** ***
4-Year College Degree $42,626 7 *** *** $51,994 9 $48,723 5
Master’s Degree or Higher $44,887 3 $43,667 3 $42,350 3 $53,270 5
Secondary I
2-Year College Degree *** ***
4-Year College Degree $46,625 4 $42,664 7 $48,209 8 $43,023 4 $61,407 6
Master’s Degree or Higher *** *** $43,538 8 $58,456 6 $53,790 8 $62,000 5
Secondary II
4-Year College Degree $57,200 5 *** ***
Master’s Degree or Higher $72,143 7
Secondary I – II
4-Year College Degree *** *** *** ***
Master’s Degree or Higher *** *** *** *** $49,095 7
AMS Compensation & Benefits 2019 Report
42
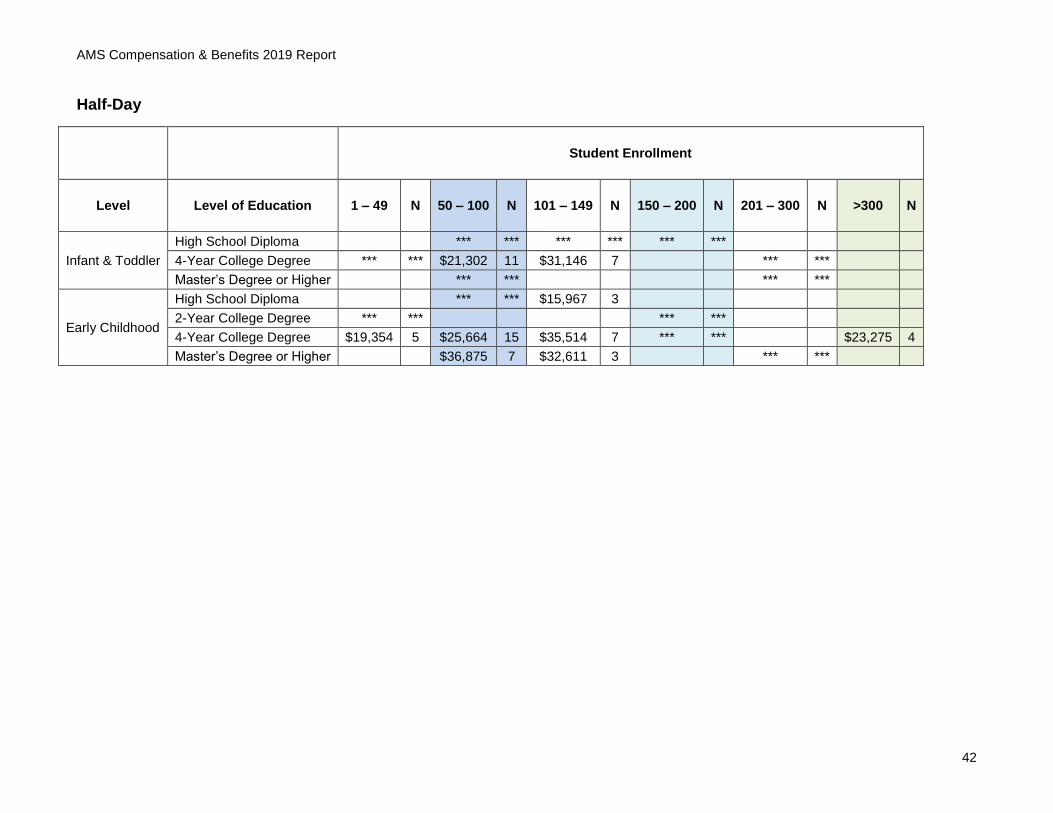
Half-Day
Student Enrollment
Level Level of Education 1 – 49 N 50 – 100 N 101 – 149 N 150 – 200 N 201 – 300 N >300 N
Infant & Toddler
High School Diploma *** *** *** *** *** ***
4-Year College Degree *** *** $21,302 11 $31,146 7 *** ***
Master’s Degree or Higher *** *** *** ***
Early Childhood
High School Diploma *** *** $15,967 3
2-Year College Degree *** *** *** ***
4-Year College Degree $19,354 5 $25,664 15 $35,514 7 *** *** $23,275 4
Master’s Degree or Higher $36,875 7 $32,611 3 *** ***
AMS Compensation & Benefits 2019 Report
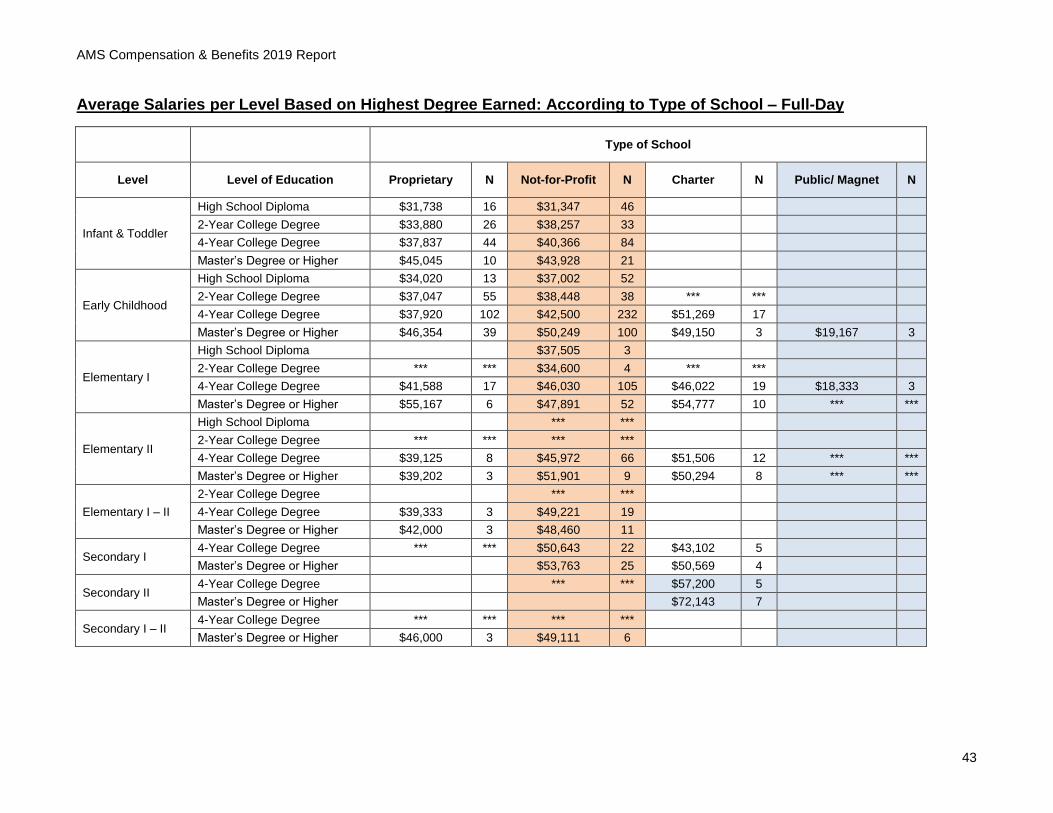
43
Average Salaries per Level Based on Highest Degree Earned: According to Type of School – Full-Day
Type of School
Level Level of Education Proprietary N Not-for-Profit N Charter N Public/ Magnet N
Infant & Toddler
High School Diploma $31,738 16 $31,347 46
2-Year College Degree $33,880 26 $38,257 33
4-Year College Degree $37,837 44 $40,366 84
Master’s Degree or Higher $45,045 10 $43,928 21
Early Childhood
High School Diploma $34,020 13 $37,002 52
2-Year College Degree $37,047 55 $38,448 38 *** ***
4-Year College Degree $37,920 102 $42,500 232 $51,269 17
Master’s Degree or Higher $46,354 39 $50,249 100 $49,150 3 $19,167 3
Elementary I
High School Diploma $37,505 3
2-Year College Degree *** *** $34,600 4 *** ***
4-Year College Degree $41,588 17 $46,030 105 $46,022 19 $18,333 3
Master’s Degree or Higher $55,167 6 $47,891 52 $54,777 10 *** ***
Elementary II
High School Diploma *** ***
2-Year College Degree *** *** *** ***
4-Year College Degree $39,125 8 $45,972 66 $51,506 12 *** ***
Master’s Degree or Higher $39,202 3 $51,901 9 $50,294 8 *** ***
Elementary I – II
2-Year College Degree *** ***
4-Year College Degree $39,333 3 $49,221 19
Master’s Degree or Higher $42,000 3 $48,460 11
Secondary I 4-Year College Degree *** *** $50,643 22 $43,102 5
Master’s Degree or Higher $53,763 25 $50,569 4
Secondary II 4-Year College Degree *** *** $57,200 5
Master’s Degree or Higher $72,143 7
Secondary I – II 4-Year College Degree *** *** *** ***
Master’s Degree or Higher $46,000 3 $49,111 6

AMS Compensation & Benefits 2019 Report
44
Half-Day
Type of School
Level Level of Education Proprietary N Not-for-Profit N Charter N Public/ Magnet N
High School Diploma *** *** $36,308 5
2-Year College Degree *** ***
Infant & Toddler 4-Year College Degree $14,499 4 $27,709 16
Master’s Degree or Higher *** *** *** ***
High School Diploma $14,333 3 *** ***
2-Year College Degree *** *** *** ***
Early Childhood 4-Year College Degree $19,745 6 $29,542 26
Master’s Degree or Higher *** *** $37,448 9

AMS Compensation & Benefits 2019 Report
45
Average Salaries per Level Based on Years of Experience: Overall
Full-Day Half-Day
Level Years of
Experience Average Salary N Average Salary N
Infant & Toddler
0 – 4 Years $32,724 91 $20,712 9
5 - 10 Years $37,975 103 $25,941 8
More than 10 Years $42,006 89 $32,958 14
Early Childhood
0 - – 4 Years $34,490 130 $17,439 9
5 – 10 Years $39,735 201 $28,478 22
More than 10 Years $47,550 296 $31,724 21
Elementary I
0 – 4 Years $40,398 58 *** ***
5 – 10 Years $44,643 65
More than 10 Years $49,807 102 $33,833 3
Elementary II
0 – 4 Years $38,081 33
5 – 10 Years $45,770 46
More than 10 Years $49,961 57 *** ***
Elementary I – II
0 – 4 Years $39,422 6
5 – 10 Years $44,993 10
More than 10 Years $51,569 19
Secondary I
0 – 4 Years $38,046 9
5 – 10 Years $52,164 22
More than 10 Years $53,528 28 *** ***
Secondary II
0 – 4 Years $57,833 6
5 – 10 Years *** ***
More than 10 Years $75,000 7
Secondary I – II
0 – 4 Years $51,436 4
5 – 10 Years $43,250 4
More than 10 Years $44,307 3

AMS Compensation & Benefits 2019 Report
46
Average Salaries per Level Based on Years of Experience: According to Population
Full-day
Population
Level Years of
Experience Less than
10,000 People N
10,001 – 50,000 People
N 50,001 –
100,000 People N
More than 100,000 People
N
Infant & Toddler
0 – 4 Years $29,753 19 $30,406 22 $31,691 16 $36,370 34
5 – 10 Years $37,439 17 $37,992 10 $36,476 12 $38,395 64
More than 10 Years $43,731 6 $37,655 23 $40,316 23 $45,482 37
Early Childhood
0 – 4 Years $34,433 13 $32,591 35 $32,294 23 $36,486 59
5 – 10 Years $38,132 27 $37,071 48 $38,242 34 $42,147 92
More than 10 Years $42,410 24 $41,969 56 $44,742 52 $51,134 164
Elementary I
0 – 4 Years $40,956 9 $33,291 7 $39,981 13 $42,127 29
5 – 10 Years $40,925 8 $42,317 19 $46,750 8 $46,548 30
More than 10 Years $42,837 11 $46,694 16 $42,654 20 $54,708 55
Elementary II
0 – 4 Years $33,150 4 $36,250 9 $37,768 6 $41,658 14
5 – 10 Years $45,529 7 $41,465 10 $43,610 4 $47,906 25
More than 10 Years $43,388 8 $54,674 14 $44,272 11 $52,011 24
Elementary I – II
0 – 4 Years *** *** $41,420 3 *** ***
5 – 10 Years *** *** $43,887 3 $44,878 6
More than 10 Years *** *** $43,6667 3 $50,181 4 $54,968 10
Secondary I
0 – 4 Years *** *** *** *** $33,975 4 *** ***
5 – 10 Years $49,575 4 $53,500 5 $47,955 6 $56,172 8
More than 10 Years $51,590 5 $54,417 6 $56,042 6 $53,143 12
Secondary II
04 Years $57,833 6
5 – 10 Years *** ***
More than 10 Years *** *** $75,800 5
Secondary I – II
0 – 4 Years *** *** *** *** *** ***
5 – 10 Years *** *** *** *** *** ***
More than 10 Years $44,307 3

AMS Compensation & Benefits 2019 Report
47
Half-Day
Population
Level Years of
Experience Less than
10,000 People N
10,001 – 50,000 People
N 50,001 –
100,000 People N
More than 100,000 People
N
Infant & Toddler
0 – 4 Years $26,000 3 $15,925 4 *** *** *** ***
5 – 10 Years *** *** $23,632 4 *** ***
More than 10 Years *** *** $25,544 5 $26,700 4 $42,974 4
Early Childhood
0 – 4 Years $19,583 3 *** *** $16,240 5
5 – 10 Years *** *** $27,384 12 $31,964 4 $27,410 5
More than 10 Years $33,008 4 $33,732 4 $30,224 3 $30,858 10
Elementary I 0 – 4 Years *** ***
More than 10 Years *** *** *** ***
Elementary II More than 10 Years *** ***
Secondary I More than 10 Years *** ***

AMS Compensation & Benefits 2019 Report
48
Average Salaries per Level Based on Years of Experience: According to Geographic Location
Full-Day
Region
Level Years of Experience Northeast N Southeast N Midwest N Plains N West N
Infant & Toddler
0 – 4 Years $33,285 29 $32,890 25 $32,673 11 $26,750 12 $36,426 14
5 – 10 Years $44,488 26 $33,378 23 $38,469 11 $32,585 26 $42,154 17
More than 10 Years $46,214 25 $38,751 29 $$61,608 17 $36,787 9 $46,775 9
Early Childhood
0 – 4 Years $36,248 27 $31,927 35 $35,122 20 $33,515 17 $35,980 31
5 – 10 Years $41,710 57 $37,335 46 $37,901 36 $39,155 28 $42,091 34
More than 10 Years $52,597 73 $46,103 76 $43,246 60 $43,650 41 $51,024 46
Elementary I
0 – 4 Years $43,220 11 $39,453 18 $33,779 11 $40,659 8 $46,064 10
5 – 10 Years $45,460 12 $39,110 19 $41,780 10 $43,860 11 $54,843 13
More than 10 Years $51,063 12 $48,821 32 $47,362 19 $47,192 21 $56,354 18
Elementary II
0 – 4 Years $37,563 8 $34,026 9 *** *** $40,270 6 $41,312 9
5 – 10 Years $53,390 8 $45,936 15 $37,680 8 $44,600 6 $46,694 9
More than 10 Years $53,310 8 $46,152 21 $48,871 7 $48,697 14 $61,179 7
Elementary I -II
0 – 4 Years *** *** *** *** *** *** *** ***
5 – 10 Years $44,554 3 *** *** $39,787 4 *** ***
More than 10 Years *** *** $52,810 7 $50,167 3 *** *** $55,480 5
Secondary I
0 – 4 Years *** *** *** *** $34,667 3 *** *** *** ***
5 – 10 Years $55,643 7 $40,946 5 *** *** $43,124 3 $65,800 5
More than 10 Years $56,625 4 $47,302 6 $48,750 4 $53,213 9 $62,908 5
Secondary II
0 – 4 Years $57,200 5
5 – 10 Years *** ***
More than 10 Years $75,000 7
Secondary I – II
0 – 4 Years $51,915 3 *** ***
5 – 10 Years $42,000 3 *** ***
More than 10 Years $44,307 3
AMS Compensation & Benefits 2019 Report
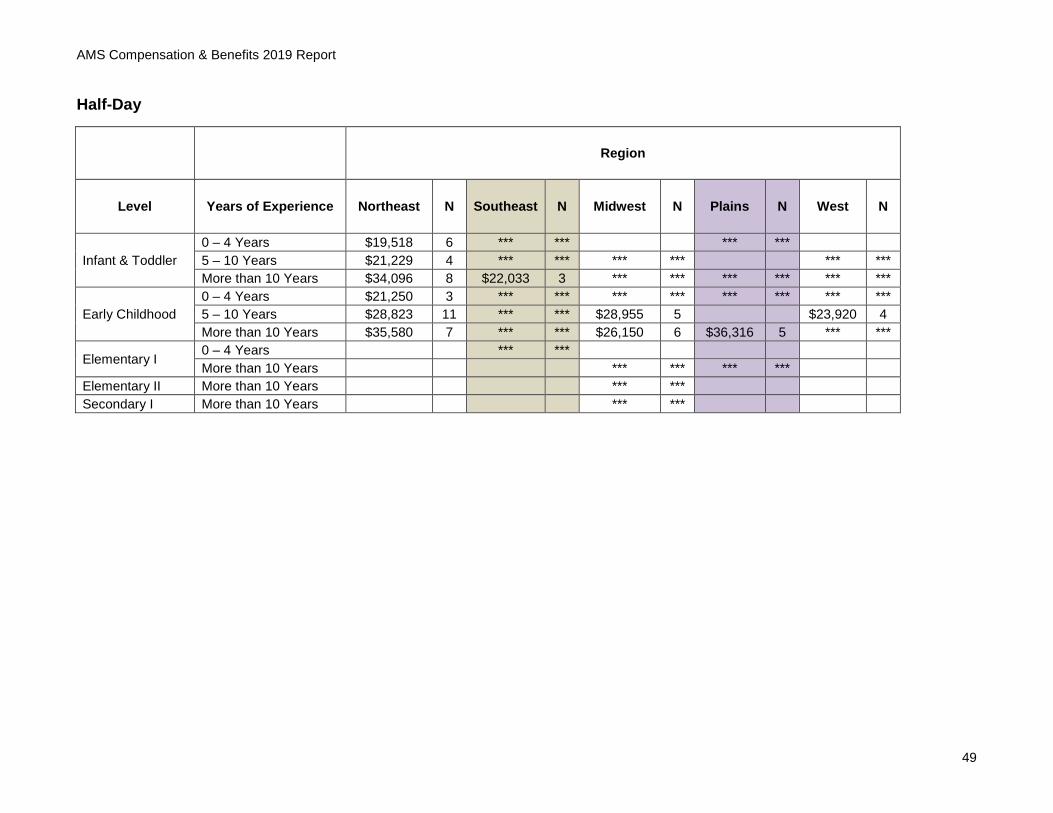
49
Half-Day
Region
Level Years of Experience Northeast N Southeast N Midwest N Plains N West N
Infant & Toddler
0 – 4 Years $19,518 6 *** *** *** ***
5 – 10 Years $21,229 4 *** *** *** *** *** ***
More than 10 Years $34,096 8 $22,033 3 *** *** *** *** *** ***
Early Childhood
0 – 4 Years $21,250 3 *** *** *** *** *** *** *** ***
5 – 10 Years $28,823 11 *** *** $28,955 5 $23,920 4
More than 10 Years $35,580 7 *** *** $26,150 6 $36,316 5 *** ***
Elementary I 0 – 4 Years *** ***
More than 10 Years *** *** *** ***
Elementary II More than 10 Years *** ***
Secondary I More than 10 Years *** ***

AMS Compensation & Benefits 2019 Report
50
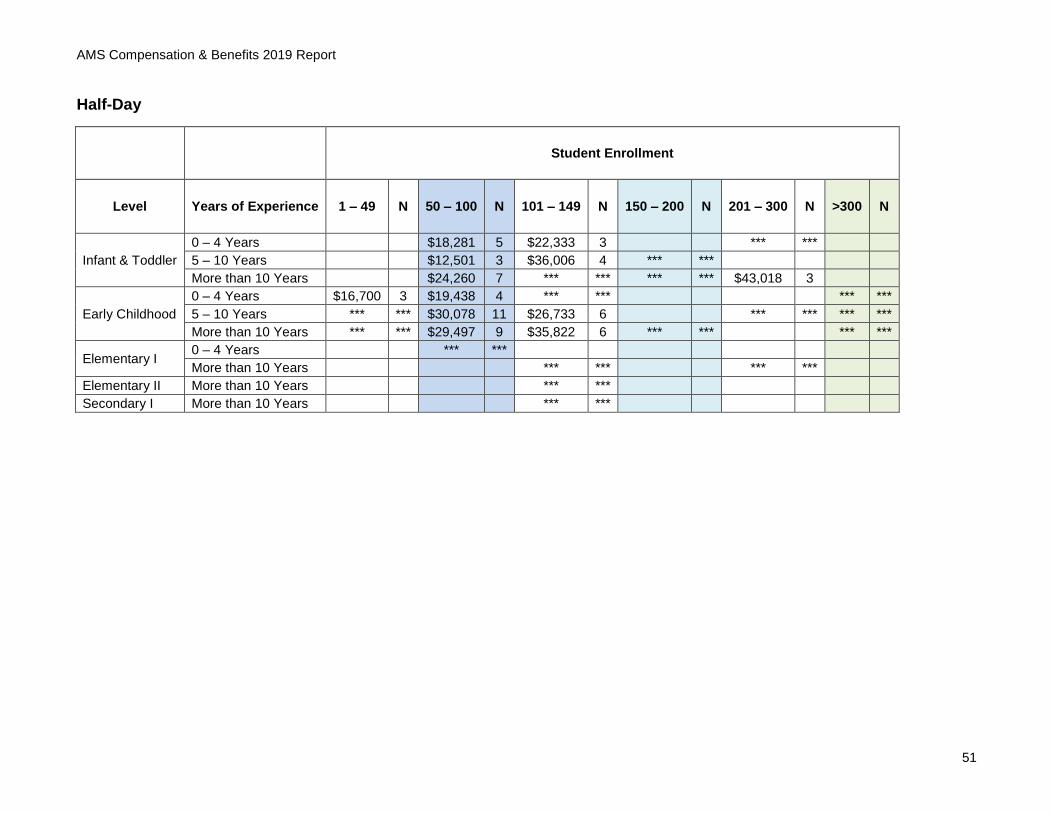
Average Salaries per Level Based on Years of Experience: According to Student Enrollment
Full-Day
Student Enrollment
Level Years of Experience 1 – 49 N 50 – 100 N 101 – 149 N 150 – 200 N 201 – 300 N >300 N
Infant & Toddler
0 – 4 Years $26,144 16 $31,889 21 $30,477 26 $36,236 11 $40,618 13 $39,400 5
5 – 10 Years $33,137 6 $34,223 22 $32,885 20 $39,946 13 $41,257 27 $44,580 15
More than 10 Years $33,470 7 $38,211 21 $39,937 19 $36,733 11 $43,327 18 $58,392 13
Early Childhood
0 – 4 Years $38,142 7 $30,431 34 $33,365 34 $36,030 14 $37,923 27 $35,951 14
5 – 10 Years $35,266 19 $36,925 44 $37,586 45 $40,756 28 $43,194 45 $45,787 20
More than 10 Years $38,582 29 $43,496 62 $43,803 49 $46,465 43 $50,409 64 $58,954 49
Elementary I
0 – 4 Years $26,333 3 $34,707 5 $39,702 11 $43,076 8 $39,629 17 $45,393 14
5 – 10 Years $40,922 12 $42,193 13 $45,440 12 $44,949 18 $50,789 10
More than 10 Years *** *** $40,734 8 $44,449 24 $49,468 21 $46,959 24 $62,644 23
Elementary II
0 – 4 Years $28,521 5 $36,525 6 $37,163 4 $36,253 9 $46,665 9
5 – 10 Years $39,943 7 $40,933 9 $50,851 7 $42,776 14 $55,846 9
More than 10 Years *** *** $46,250 8 $51,281 18 $52,799 13 $37,552 8 $59,159 9
Elementary I – II
0 – 4 Years $41,420 3 *** *** *** *** *** ***
5 – 10 Years $44,195 4 *** *** $46,763 4 *** ***
More than 10 Years $44,000 3 *** *** $53,279 7 $53,482 8
Secondary I
0 – 4 Years *** *** $32,225 4 $41,171 3
5 – 10 Years *** *** *** *** $47,460 7 *** *** $59,119 9
More than 10 Years *** *** $47,339 9 $54,407 8 $53,960 7 *** ***
Secondary II
0 – 4 Years $57,833 6
5 – 10 Years *** ***
More than 10 Years $75,000 7
Secondary I – II
0 – 4 Years *** *** $51,915 3
5 – 10 Years *** *** *** ***
More than 10 Years $44,307 3 *** ***
AMS Compensation & Benefits 2019 Report
51
Half-Day
Student Enrollment
Level Years of Experience 1 – 49 N 50 – 100 N 101 – 149 N 150 – 200 N 201 – 300 N >300 N
Infant & Toddler
0 – 4 Years $18,281 5 $22,333 3 *** ***
5 – 10 Years $12,501 3 $36,006 4 *** ***
More than 10 Years $24,260 7 *** *** *** *** $43,018 3
Early Childhood
0 – 4 Years $16,700 3 $19,438 4 *** *** *** ***
5 – 10 Years *** *** $30,078 11 $26,733 6 *** *** *** ***
More than 10 Years *** *** $29,497 9 $35,822 6 *** *** *** ***
Elementary I 0 – 4 Years *** ***
More than 10 Years *** *** *** ***
Elementary II More than 10 Years *** ***
Secondary I More than 10 Years *** ***

AMS Compensation & Benefits 2019 Report
52
Average Salaries per Level Based on Years of Experience: According to Type of School
Full-Day
Type of School
Level Years of Experience Proprietary N Not-for-Profit N Charter N Public/Magnet N
Infant & Toddler
0 – 4 Years $29,770 26 $33,906 65
5 – 10 Years $37,578 42 $38,608 59
More than 10 Years $41,469 29 $42,266 60
Early Childhood
0 – 4 Years $30,938 41 $35,593 83 $43,500 6
5 – 10 Years $37,776 56 $40,195 136 $50,756 7 *** ***
More than 10 Years $45,129 77 $48,373 208 $57,547 8 *** ***
Elementary I
0 – 4 Years $38,314 7 $40,314 37 $42,329 11
5 – 10 Years $42,625 8 $45,462 45 $48,005 10
More than 10 Years $53,978 9 $49,232 82 $57,502 9
Elementary II
0 – 4 Years $32,401 4 $38,828 20 $42,313 7 *** ***
5 – 10 Years $38,000 3 $44,994 35 $57,020 7 *** ***
More than 10 Years $42,000 5 $51,784 42 $54,183 6 *** ***
Elementary I – II
0 – 4 Years $36,333 3 $42,510 3
5 – 10 Years *** *** $44,770 9
More than 10 Years *** *** $52,100 18
Secondary I
0 – 4 Years $37,380 5 $38,878 4
5 – 10 Years *** *** $53,295 20
More than 10 Years $53,761 23 $52,455 5
Secondary II
0 – 4 Years $57,833 6
5 – 10 Years *** ***
More than 10 Years *** *** $75,800 5
Secondary I – II
0 – 4 Years $51,436 4
5 – 10 Years *** *** *** ***
More than 10 Years *** *** *** ***

AMS Compensation & Benefits 2019 Report
53
Half-Day
Type of School
Level Years of Experience Proprietary N Not-for-Profit N Charter N Public/Magnet N
Infant & Toddler
0 – 4 Years $18,002 3 $22,067 6
5 – 10 Years *** *** $28,155 7
More than 10 Years *** *** $35,680 12
Early Childhood
0 – 4 Years $15,420 5 $19,963 4
5 – 10 Years $22,766 5 $30,158 17
More than 10 Years $25,224 3 $32,807 18
Elementary I 0 – 4 Years *** ***
More than 10 Years *** *** *** ***
Elementary II More than 10 Years *** ***
Secondary I More than 10 Years *** ***

AMS Compensation & Benefits 2019 Report
54
Montessori Credential According to Level (percentage and salary) – Full-Day
Montessori Credential
Level Without Percent* Average Salary
With Full Credential
Percent* Average Salary
With Associate
Credential**
Percent*
Average Salary
Infant & Toddler 76 5.51 $29,567 167 12.10 $41,404 36 2.61 $38,146
Early Childhood 72 5.22 $31,113 507 36.74 $44,495 43 3.12 $37,199
Elementary I 24 1.74 $33,690 193 13.99 $47,557 7** 0.51 $42,746
Elementary II 20 1.45 $34,128 111 8.04 $47,928 5** 0.36 $41,468
Elementary I – II 1 0.07 *** 33 2.39 $48,944 2** 0.14 ***
Secondary I 19 1.38 $46,168 37 2.68 $52,865 2** 0.14 ***
Secondary II 8 0.58 $65,000 6 0.43 $69,500
Secondary I – II 3 0.22 $42,333 8 0.58 $48,083
Total 223 16.16 1,062 76.96 95 6.88
*Percent of total individuals.
**Special note regarding the AMS Associate Montessori credential. An AMS Associate Montessori credential is issued at the Infant & Toddler and Early Childhood levels to an adult learner who does not hold a Bachelor’s degree or equivalent. It should be noted that AMS does not offer an Associate credential at the Elementary or Secondary levels. Responses received for teachers working at the Elementary and Secondary levels would seem to indicate that the teacher is working at a level for which they do not have the appropriate Montessori credential.

AMS Compensation & Benefits 2019 Report
55
Montessori Credentials According to Level and Population – Full-Day
Population
Level Montessori Credential
Less than 10,000 People
% 10,001 – 50,000 People
% 50,001 – 100,000
People %
More than 100,000 People
%
Infant & Toddler
Without 8 20.51 17 30.36 19 37.25 34 24.46
With Full Credential 29 74.36 29 51.79 26 50.98 84 60.43
With Assoc. Credential 2 5.13 10 17.86 6 11.76 21 15.11
Early Childhood
Without 7 11.11 24 17.27 14 13.08 27 8.63
With Full Credential 48 76.19 104 74.82 83 77.57 272 86.90
With Assoc. Credential 8 12.70 11 7.91 10 9.35 14 4.47
Elementary I
Without 4 14.29 4 9.52 7 17.07 9 7.83
With Full Credential 24 85.71 36 85.71 32 78.05 103 89.57
With Assoc. Credential 15.79 2** 4.76 2** 4.88 3** 2.61
Elementary II
Without 3 15.79 5 15.15 3 14.29 9 14.29
With Full Credential 15 78.95 28 84.85 18 8.71 50 79.37
With Assoc. Credential 1** 5.26 4** 6.35
Elementary I – II
Without 1 16.67
With Full Credential 4 100 8 88.89 5 83.33 17 94.44
With Assoc. Credential 1** 11.11 1** 5.56
Secondary I
Without 4 44.44 5 45.45 5 31.25 5 21.74
With Full Credential 5 55.56 6 54.55 11 68.75 16 69.57
With Assoc. Credential 2** 8.70
Secondary II Without 8 66.67
With Full Credential 2 100 4 33/33
Secondary I – II Without 1 25 1 50 1 25
With Full Credential 3 75 1 50 3 75
**Special note regarding the AMS Associate Montessori credential. An AMS Associate Montessori credential is issued at the Infant & Toddler and Early Childhood levels to an adult learner who does not hold a Bachelor’s degree or equivalent. It should be noted that AMS does not offer an Associate credential at the Elementary or Secondary levels. Responses received for teachers working at the Elementary and Secondary levels would seem to indicate that the teacher is working at a level for which they do not have the appropriate Montessori credential.

AMS Compensation & Benefits 2019 Report
56
Montessori Credentials According to Level and Geographic Location – Full-Day
Geographic Location
Level Montessori Credential Northeast % Southeast % Midwest % Plains % West %
Infant & Toddler
Without 21 25.93 17 23.29 7 16.67 24 48.98 9 22.5
With Full Credential 53 6543 46 63.01 20 47.62 21 42.86 28 70
With Assoc. Credential 7 8.64 10 13.70 15 35.71 4 8.16 3 7.5
Early Childhood
Without 15 9.68 25 15.63 12 10.08 13 15.12 7 6.36
With Full Credential 131 84.52 129 80.63 92 77.32 63 73.26 100 90.91
With Assoc. Credential 9 5.81 6 3.75 15 12.61 10 11.63 3 2.73
Elementary I
Without 4 11.43 6 8.82 6 15.79 4 10 4 9.76
With Full Credential 31 88.57 62 91.18 30 78.95 34 85 36 87.8
With Assoc. Credential 2** 2.94 2** 5.26 2** 5 1** 2.44
Elementary II
Without 4 16.67 6 13.33 3 4.55 1 3.85 6 40
With Full Credential 19 79.17 38 84.44 13 81.25 24 92.31 17 113.33
With Assoc. Credential 1** 4.17 1** 2.22 1** 3.85 2** 13.33
Elementary I – II
Without 1 16.67
With Full Credential 6 100 9 81.82 5 83.33 6 100 8 100
With Assoc. Credential 2** 18.18
Secondary I
Without 7 58.33 3 23.08 4 50 3 21.43 2 16.67
With Full Credential 5 41.67 10 76.92 4 50 10 71.43 9 75
With Assoc. Credential 1** 7.14 1** 8.33
Secondary II Without 8 57.14
With Full Credential 6 42.86
Secondary I – II
Without 2 22.22
With Full Credential 7 77.78 3 100 1 100
With Assoc. Credential 1** 100
**Special note regarding the AMS Associate Montessori credential. An AMS Associate Montessori credential is issued at the Infant & Toddler and Early Childhood levels to an adult learner who does not hold a Bachelor’s degree or equivalent. It should be noted that AMS does not offer an Associate credential at the Elementary or Secondary levels. Responses received for teachers working at the Elementary and Secondary levels would seem to indicate that the teacher is working at a level for which they do not have the appropriate Montessori credential.

AMS Compensation & Benefits 2019 Report
57
Montessori Credentials According to Level and Student Enrollment – Full-Day
Student Enrollment
Level Montessori Credential 1 - 49 % 50 - 100 % 101 - 149 % 150 - 200 % 201 - 300 % >300 %
Infant & Toddler
Without 11 44 20 31.25 24 34.78 7 19.44 11 18.97 5 15.15
With Full Credential 13 52 33 51.56 31 44.93 24 66.67 43 74.14 24 72.73
With Assoc. Credential 1 4 11 17.19 14 20.29 5 13.89 4 6.9 4 12.12
Early Childhood
Without 5 9.26 31 21.99 16 12.03 5 5.95 10 7.46 5 6.49
With Full Credential 46 85.1
9 97 68.79 100 75.19 73 86.9 121 90.3 71 92.21
With Assoc. Credential 3 5.56 13 9.22 17 12.78 6 7.14 3 2.24 1 1.3
Elementary I
Without 2 40 5 20 2 4 3 7.32 10 16.95 3 6.38
With Full Credential 3 60 19 76 46 92 36 87.8 47 79.66 44 93.62
With Assoc. Credential 1** 4 2** 4 2** 4.88 2** 3.39
Elementary II
Without 4 20 4 12.5 3 12.5 7 22.58 2 7.41
With Full Credential 1 100 16 80 28 87.5 20 83.33 22 70.97 24 88.89
With Assoc. Credential 1** 4.17 2** 6.45 1** 3.7
Elementary I – II
Without 1 7.69
With Full Credential 8 80 4 100 12 92.31 10 100
With Assoc. Credential 2** 20 1** 100
Secondary I
Without 4 80 7 43.75 3 17.65 2 16.67 3 27.27
With Full Credential 1 20 9 56.25 10 58.82 10 83.33 8 72.73
With Assoc. Credential 2** 11.76
Secondary II Without 8 66.67
With Full Credential 4 33.33 2 100
Secondary I – II Without 2 67 1 1
With Full Credential 1 33 1 100 6 75
**Special note regarding the AMS Associate Montessori credential. An AMS Associate Montessori credential is issued at the Infant & Toddler and Early Childhood levels to an adult learner who does not hold a Bachelor’s degree or equivalent. It should be noted that AMS does not offer an Associate credential at the Elementary or Secondary levels. Responses received for teachers working at the Elementary and Secondary levels would seem to indicate that the teacher is working at a level for which they do not have the appropriate Montessori credential.

AMS Compensation & Benefits 2019 Report
58
Our next Compensation & Benefits Survey Report will be published during the 2021 – 2022 academic year. If you would like to see additional information in it, or have any other suggestions, we would like to hear from you. Please email your comments to Carla Hofland, AMS Director of Member Services: [email protected].
Thank You! AMS gratefully acknowledges those schools that completed the 2019 Compensation & Benefits Survey, without which this report would not be possible.