2019 country profile: mexico - hass avocado board...region, in the state of puebla, showed that this...
TRANSCRIPT

2019 Country Profile: Mexico
Producer country profile produced by CIRAD, The Centre De Cooperation International En Recherche Agronomique Pour Le Développement, in collaboration with HAB, The Hass Avocado Board.
www.hassavocadoboard.com

World avocado production prospects
MexicoEver more colossal

Acknowledgements This publication is the fruit of a partnership between the Hass Avocado Board and the CIRAD Market News Service. The editorial team would like to thank all the professionals who have contributed to drawing up this country profile.
Photo credits: Carolina Dawson, Eric Imbert, Guy Bréhinier Cover photo credit: APEAM
© September 2019
Exemption clause: the opinions expressed in the present document are solely those of the authors, and under no circumstances may be considered as stating the official position of CIRAD or the HAB. The contents were drawn up in all good faith. However, the authors cannot guarantee the exhaustiveness or accuracy of the information provided, nor that this information is up to date, or appropriate for specific purposes.

1World avocado production prospects – MEXICO
The historical cradle of the avocado, Mexico is favoured both by pedoclimatic conditions ideal for the crop, and the huge appetite of the neighbouring US market, which the industry has played a big part in developing. Hence Mexico reigns supreme not only in terms of world Hass production, of which it controls two thirds, but also in the international trade, where its market share is in excess of 50 %, despite some weaknesses and an often traditional production system. While it retains excellent profitability, the expansion rate of the cultivation area could be less frantic than before.
The avocado in Mexico

2 World avocado production prospects – MEXICO
History of the industry
A native fruit, but fairly recent industrial development due to the export sector
Mexico is a cradle of the avocado, with the word it-self being derived from Nahuatl, meaning “testicle”. Archaeological digs conducted in a cave in the Coxcatlán region, in the State of Puebla, showed that this fruit was already present in the region 7 000 to 8 000 years ago. The country’s central volcanic belt, which crosses Michoacán, is believed to be the natural habitat of one of the three races of Persea americana Miller, also known as the Mexican race. Nonetheless, the Mexican cultivation area has only fairly recently swelled to the immense pro-portions of more than 200 000 ha seen today. According to the country’s first agricultural statistics in the 1930s, this area covered only approximately 3 000 ha. The dis-semination of better production techniques (grafting) and improved varieties such as Fuerte sparked a growth trend over the following decades, albeit to a relatively
limited extent, since the cultivation area had yet to reach 10 000 ha by the end of the 1950s. Thereafter, the indus-try began to take off. On the one hand, the production crisis which arose in the USA in the 1960s led Californian nursery growers to find diversification markets in Mexico for their Hass plants, a variety discovered in the 1930s. This variety rapidly became the national benchmark thanks to its post-harvest resistance, its yield and its taste characteristics. On the other hand, from the early 1970s the Mexican government implemented a fruit growing development policy, especially in Michoacán, to prevent overproduction of coffee, the predominant crop in this highly fertile region. Indeed, a specific plan aimed at pro-moting the avocado was developed from 1973, conduct-ed by CONAFRUT (Comisión Nacional de Fruticultura). In particular, this envisaged granting technical assistance, enhanced credits from FIRA (Fideicomisos Instituidos en Relación con la Agricultura) and even giving away plants. The context became favourable for development of the crop, although these funds were primarily absorbed by the downstream segment through the development of packing or transport infrastructures. An increasing num-ber of smallholdings resulting from the agrarian reform of 1915 ventured into this industry. This was when the cultivation area saw rapid expansion, up to approximate-ly 50 000 ha in the mid-1970s, and then to 100 000 ha in the 1980s, with Michoacán becoming the country’s num-ber one production area.
Faced with a massive influx of production and a saturated local market, professionals sought to diversify their out-lets, by developing the export sector from the early 1980s. Great efforts were undertaken to reopen the US market, closed since 1914 for sanitary reasons (presence of pests assigned quarantine classification by the US authorities). Orchard monitoring and eradication campaigns of the insects concerned were launched, alongside lobbying of the US sanitary authorities, in a promising context of the implementation of a free trade treaty between the USA, Mexico and Canada (NAFTA). Avocados from Michoacán zones declared quarantine pest-free were authorised in the US market in a limited number of non avocado pro-ducer States from 1997, after nearly a decade of joint ef-forts by the Mexican industry. The progressive opening up of this market, complete by the end of January 2007, generated an exponential growth trend in the industry, especially with the intense promotion campaigns for this fruit launched in the USA in the early 2000s, driven by the APEAM (Asociación de productores y empacadores exportadores de aguacate de México), the MHAIA (US based Mexican Hass Avocado Importers Association) and the HAB (Hass Avocado Board).

3World avocado production prospects – MEXICO
• Population: 126 million inhabitants in 2018
• GNI/capita: 9 180 USD/year (source: World Bank - 2018)
• Agriculture: 3.3 % of GDP (Industry 31.2 %) (source: World Bank - 2018)
• Value of agricultural exports: 34 billion USD (source: SIAP - Banco de México - 2018)
Mexico in a few figures:Main export agricultural products: (source: SIAP - Banco de México - 2018)
• Avocado: 2 392 million USD
• Tomato: 2 080 million USD
• Pepper: 1 158 million USD
• Cucumber: 521 million USD
• Raspberry: 491 million USD
4 World avocado production prospects – MEXICO
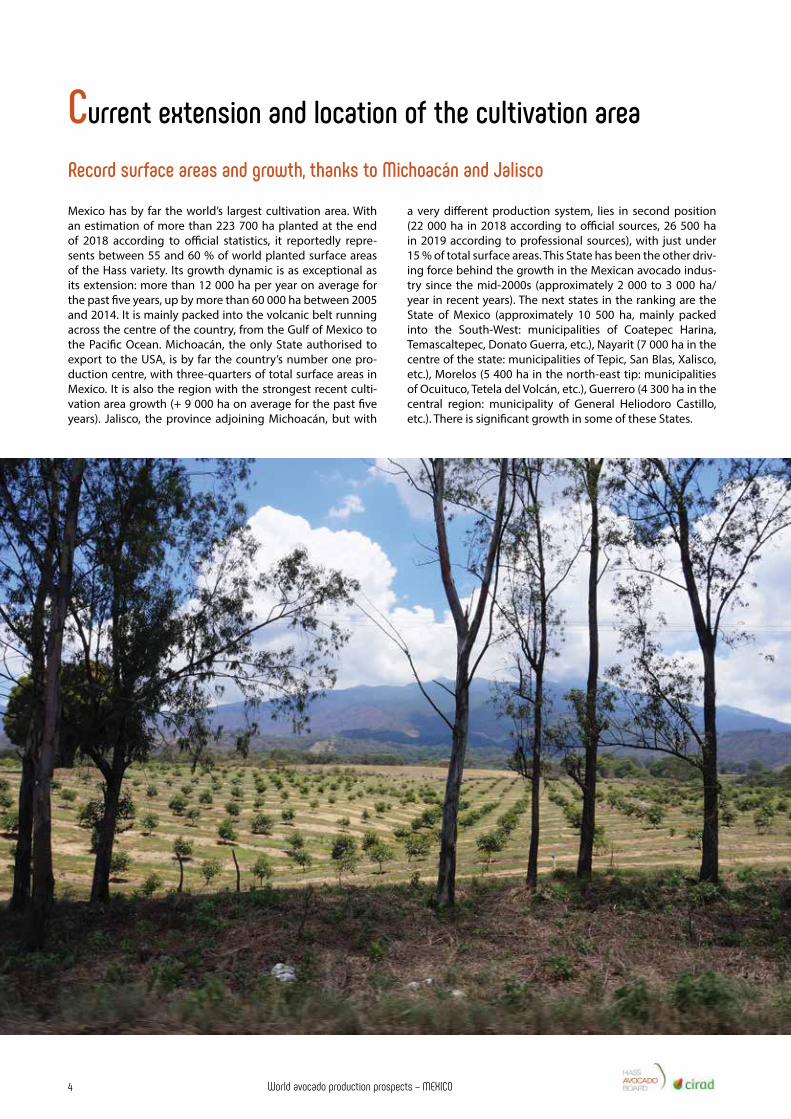
Current extension and location of the cultivation area
Mexico has by far the world’s largest cultivation area. With an estimation of more than 223 700 ha planted at the end of 2018 according to official statistics, it reportedly repre-sents between 55 and 60 % of world planted surface areas of the Hass variety. Its growth dynamic is as exceptional as its extension: more than 12 000 ha per year on average for the past five years, up by more than 60 000 ha between 2005 and 2014. It is mainly packed into the volcanic belt running across the centre of the country, from the Gulf of Mexico to the Pacific Ocean. Michoacán, the only State authorised to export to the USA, is by far the country’s number one pro-duction centre, with three-quarters of total surface areas in Mexico. It is also the region with the strongest recent culti-vation area growth (+ 9 000 ha on average for the past five years). Jalisco, the province adjoining Michoacán, but with
a very different production system, lies in second position (22 000 ha in 2018 according to official sources, 26 500 ha in 2019 according to professional sources), with just under 15 % of total surface areas. This State has been the other driv-ing force behind the growth in the Mexican avocado indus-try since the mid-2000s (approximately 2 000 to 3 000 ha/year in recent years). The next states in the ranking are the State of Mexico (approximately 10 500 ha, mainly packed into the South-West: municipalities of Coatepec Harina, Temascaltepec, Donato Guerra, etc.), Nayarit (7 000 ha in the centre of the state: municipalities of Tepic, San Blas, Xalisco, etc.), Morelos (5 400 ha in the north-east tip: municipalities of Ocuituco, Tetela del Volcán, etc.), Guerrero (4 300 ha in the central region: municipality of General Heliodoro Castillo, etc.). There is significant growth in some of these States.
Record surface areas and growth, thanks to Michoacán and Jalisco

5World avocado production prospects – MEXICO
0
50
100
150
200
250
2011
2012
2013
2014
2015
2016
2017
2018
Mexican avocadoPlanted area
(in 000 ha | sources: Sagarpa, professionals)
0
20
40
60
80
100
120
140
160
180
2011
2012
2013
2014
2015
2016
2017
2018
MichoacanOthers
Mexican avocadoMichoacan share of planted area
(in 000 ha | sources: Sagarpa, professionals)
0
5
10
15
20
25
2011
2012
2013
2014
2015
2016
2017
2018
JaliscoMexicoNayaritMorelosGuerrero
Mexican avocadoBreakdown of other planted areas
(in 000 ha | sources: Sagarpa, professionals)
Tropic of Cancer
Tropic of Cancer
BELIZEGUATEMALA
HONDURAS
O K L A H O M A
LOUISIANA
ARKANSAS
MISSISSIPPI
ALABAMA
ARIZONA
CALIFORNIA
TEXAS
Baja CaliforniaNorte
Sonora
Chihuahua
Coahuila
NuevoLeón
TamaulipasSan LuisPotosí
Zacatecas
Aguascalientes
Durango
Sinaloa
Colima
GuanajuatoQuerétaro
Tlaxcala
Puebla Veracruz
OaxacaChiapas
TabascoCampeché
QuintanaRoo
YucatánHidalgo
Baja CaliforniaSur
THE AVOCADO IN MEXICOPlanted area of 223 700 ha in 2018
Central volcanic belt
Paci�cOcean
0 km 60 120 180 km
Gulfof Mexico
UNITED STATESNEW MEXICO
NAYARIT7 100 ha
JALISCO23 700 ha
MICHOACÁN166 604 ha
GUERRERO4 299 ha
OTHERS6 000 ha
MEXICO10 500 ha
MORELOS5 433 ha
Data sources: SAGARPA, professionals

6 World avocado production prospects – MEXICO
Michoacán is unique, accommodating approximately half of world Hass production, within restricted surface areas, representing barely 10 % of the State’s total surface area. The ideal pedoclimatic conditions prevailing in this cradle of avocado cultivation, and the strength of demand from the USA, provide the host of producers in the region with a very good level of economic returns, despite an often basic production system, and highly fragmented plots. The development of this industry with its high social impact should slow down in coming years, because of the saturation of the optimal production zones.
Michoacán
Uruapan
MoreliaLos Reyes
Ario deRosales
Tacámbaro
Lázaro Cárdenas
Tancitaro
Peribán Santa Clara
Tuxpan
Production zones
The avocado in MichoacánPlanted areas of 166 600 ha in 2018
0 km 60 km 120 km
Paci�cOcean
Michoacán
Colima
Jalisco
Guerrero
Mexico
Guanajuato
Pedoclimatic characteristicsThe avocado production zone in the State of Michoacán is located on the country’s central volcanic belt (Eje Volcanico), a Quaternary vol-cano region extending from east to west over approximately 900 km along the 19th North parallel. It stands out on its own for sheer area, extending over approximately 175 000 ha in 2019 (by way of comparison, the Peruvian cul-tivation area, next in the ranking, has just un-der 32 000 ha). It extends over a length of ap-proximately 250 km, in a W-shape ranging from
Avocado – Michoacán – HectaresBreakdown by districts ha in 2018
East: District of Pátzcuaro, incl. 57 877 Ario 16 031
Salvador Escalante (Santa Clara) 16 293 Tacámbaro 17 000
Centre: District of Uruapan, incl. 60 168 Tancítaro 23 650 Uruapan 16 200
West: District of Zamora, incl. 34 372 Los Reyes 6 009
Peribán 12 560 Others 14 185
9%
17%
24%26%
13%
11%< 1600 m
1600-1800 m
1800-2000 m
2000-2200 m
2200-2300 m
2300 m and +
Avocado - Michoacan - Distributionof planted areas by altitude
(source: MHAIA)

7World avocado production prospects – MEXICO
Strengths:
• Ideal pedoclimatic conditions.
• Easy access to the huge and highly lucrative US market.
• Unique production period due to its length (all year round).
• High social externalities (small to medium orchards).
Challenges:
• Disconnection between export and production sectors.
• Heterogeneous maturity due to four flowerings.
• Low technical level of a significant proportion of producers.
• Security context.
roughly Tigüindín in the west to Tacámbaro in the east, and centred on Uruapan. This rugged region, similar to the original habitat of one of the main avocado races, brings together ideal pedoclimatic characteristics for Hass culti-vation. Firstly, andosols, highly fertile volcanic soils, deep and well-draining, cover nearly 90 % of the production re-gion (presence of acrisol or luvisol types – leaner or heavi-er – in the eastern and western edges). Secondly, the zone has a wide variety of climates (six main ones), since it ex-tends over altitudes varying from approximately 900 m to 2 600 m. The climate stages situated at between 1 800 m and 2 300 m are particularly favourable (temperate hu-mid to sub-humid zone, assumed “natural” for the avoca-do), packing in nearly 80 % of total surface areas. Rainfall is between 1 000 and 1 200 mm inclusive (except around Uruapan, where it is in excess of 1 500 mm), with precipi-tation primarily concentrated during the summer from June to October. The average temperatures fluctuate between 20 and 22°C in the hottest low-altitude zones, and between 12° and 18°C in the cooler high-altitude zones. By way of example, the mean minimum and maximum temperatures range from 6.5° to 29°C in Uruapan (1 600 m), with a rainfall level of approximately 1 600 mm. They range between 4.5° and 26.5°C in Tancítaro (2 090 m), with a rainfall level of 1 000 mm. These microclimates give Michoacán a unique set of properties: av-ocado production is present practical-ly year-round, thanks to four annual flowerings. The only two blemishes for these exceptional cultivation con-ditions are the relative acidity of the soils and the rugged terrain (45 % of orchards on slopes of more than 25 %).
In recent years, the cultivation area has ex-tended to more marginal municipalities for avocado cultivation, with the “natural” zone now saturated. These are lower-lying regions, with warmer temperatures, lower rainfall and often less rich and heavier soils; or conversely, higher-altitude regions, with lower temperatures, more frost and hail-exposed and also with less suitable soils.
PhaeozemLithosolAndosolRegosol
LuvisolCambisolAcrisolVertisol
Soil types
The avocado in MichoacánSoil types in growing areas
600 mm700 mm800 mm1000 mm1200 mm1500 mm
Rainfall
The avocado in MichoacánRainfall in
growing areas
Maps source: Agroecología de la franja aguacatera en Michoacán, México. Maribel Gutiérrez-Contreras, Ma. Blanca Nieves Lara-Chávez, Ana Tztzqui Chávez-Bárcenas, Héctor Guillén-Andrade. Sep. 2010, VOL. 35 Nº 9 - Interciencia

8 World avocado production prospects – MEXICO
Production structureMichoacán's immense cultivation area is highly fragmented, in the hands of approximately 30 000 producers. More than 60 % of total surface areas are concentrated in plantations of less than 10 ha, with 25 % in plantations of less than 3 ha. This number has increased in recent years, with smallhold-ers now able to obtain export certification to the USA. So the crop has massive socio-economic externalities. Medium-sized orchards (10 to 30 ha) represent approximately 26 % of total surface areas, while large orchards (more than 30 ha) approximately 9 %. Nearly 70 % of producers farm their own land or rent it, with the remaining 30 % enjoying access to community land (ejido). A significant proportion of produc-ers, especially the small ones, are not specialised in the crop (urban investors, employees who may or may not be part of the agricultural sector, with a dual profession).
27%
38%
26%
9% < 3 ha
3-10 ha
10-30 ha
> 30 ha
Avocado - Michoacan - Production structure(source: MHAIA)

9World avocado production prospects – MEXICO
Production practicesMichoacán’s 1.5-million tonne annual harvest is derived mainly from highly traditional, low-tech production sys-tems, which is still giving good results to this day because of the excellent pedoclimatic conditions. The plant stock is old, with an average tree age probably of between 20 and 25 years, and in certain orchards above 40 or 50 years. For the vast majority the stock is derived from nurseries providing no sanitary guarantee (no certification system in place). A single “local” Mexican race rootstock is used (“Criollo Mexicano”). The planting density is low, at gen-erally between 150 and 200 trees per hectare (the oldest orchards have a 10 m x 10 m spacing, in staggered rows).
Production practices are basic, and consist above all in applying fertilisers and lime-based soil improvers (acid-ic volcanic soils) and combating the diseases and pests which are fairly common in the zone because of the very wet climate. The main pests are certain thrips (especially Scirtothrips perseae), certain mites (Oligonychus perseae and punicae) and certain scale insects (Abgrallaspis agua-catae, Hemiberlesia lataniae). The establishment of a strict control protocol has made it possible to eradicate quar-antine pests: no interception has been recorded since the start of the export program to the USA. The main diseases are anthracnose and scab (Sphaceloma perse-ae). Conventional management is applied (no integrated pest management). Annual pruning is not generally ap-plied, with producers unwilling to be unable to harness certain flowers. The orchards are 60 % rainwater sup-plied, with the trees potentially exposed to water stress at certain key phenological stages. The water stress peri-od is tending to increase with climate change, since the absence of a short rainy season in February, highly ben-eficial for flowering, has become recurrent and the start of the main rainy season is tending to come later (June
instead of May). The absence of irrigation also limits use of fertilisation. When it is applied, irrigation is mainly via micro-sprayers (70 %). The water is generally of good quality, and mainly supplied by catchment reservoirs (“ollas”) or very deep wells (down to 500 m). The average yields are around 8.5 to 9.5 t/ha in traditional rainwa-ter-supplied orchards. This figure reaches 15 to 18 t/ha for higher-tech and irrigated orchards, better reflecting the actual production potential of this region with high pedoclimatic potential.
Orchards planted in recent years are shifting toward higher-tech production practices, in response to tight-er pedoclimatic constraints in recently developed zones. Irrigation is more widespread, annual pruning is fairly common, and planting densities are higher. Nonetheless, yields are not always better, with certain zones actually proving unsuitable for the crop.
A large part of the agricultural work is carried out by contractors. Harvesting, which is down to the purchaser of the produce, is always sub-contracted.
The main production certifications are those relating to Contamination Risk Reduction System (SRRC) and Good Practice in Pesticides (BUMP). The certifications re-quired by the major world markets outside of the USA are under-developed and on the wane (e.g. only ap-proximately 3 500 ha covered by Globalgap certification in 2019, as opposed to 9 000 ha a few years previous-ly). Approximately 10 % of production is organic certi-fied, with orchards operated under this system spread throughout the production zone. However, surface are-as are stagnant, with producers shifting toward a more productive conventional system.

10 World avocado production prospects – MEXICO
Production cost and profitabilityProduction costs are relatively low, due to the favourable pedoclimatic conditions and generally basic production practices. Direct variable costs would appear to be approx-imately 4 000 to 4 500 USD for the traditional production systems without irrigation (up to 3 000 USD if the technical process is very basic, with limited equipment), and 5 000 to 6 000 USD for higher-tech irrigated orchards (excluding harvesting). The two main cost items are fertilisation and sanitary protection. The cost of agricultural labour remains competitive, although the price per working day is two or three times the official mark (set in early 2019 at approxi-mately 103 Mexican pesos per day, i.e. 5.70 USD). Variable costs associated with irrigation are limited (electricity, used in particular for pumping water, is 80% State-subsidised, while water access is billed).
Varieties and production calendarHass is utterly dominant, representing approximately 90 % of planted surface areas. Its physiology is fairly unique in the region, due to the variety of climate stages where it is grown. In the “natural zone”, the harvest starts from early to mid-July with the “flor loca” fruit (generally fairly round in shape), which represents approximately 5 to 20 % of the to-tal harvest. It continues with the “aventajada” fruit, harvest-ed from September, and which accounts for 10 to 25 % of overall production. The harvest ends with “normal” fruit (in October, with 60 to 80 % of the harvest). The season ends with the “marceña” fruit (in March, 15 to 30 % of the har-vest). These start dates are indicative, falling earlier in the warmer low-lying zones, and later in the cooler high-alti-tude zones. The flowering harvest periods form an overlap-ping sequence, leading to heterogeneity in the maturity of the fruit marketed during certain harvest periods.
Hass Mendez represents approximately 10 % of planted surface areas. This Hass mutation has the particularity of having a very early production calendar. Its main harvest is available from July, a particularly useful period since it coincides with the production low point of regular Hass. Mendez produces a second harvest, very limited in vol-ume, later (“loca tardia”). Despite its useful harvest calen-dar, Mendez has not been much developed, due to a very marked alternate bearing phenomenon.
Avocado – Michoacán – Production calendar
Variety Harvest J A S O N D J F M A M J Harvest share
HASS Loca 5-20 %
Aventajada 10-25 %
Normal 60-80 %
Marceña 15-30 %
HASS MENDEZ Principal 90 %
Loca tardía 10 %

11World avocado production prospects – MEXICO
Upstream/downstream relationsCommercial relationships are guided by a unique balance of power for the world of agriculture. Producers hold great ne-gotiating power thanks to the incredible vitality of demand from the US market and the ability to store the fruit on trees for several weeks (even several months in the coldest are-as). Hence the production and packing/export links are dis-connected in the vast majority of cases: export production originates primarily from independent growers. Only a very small number of exporters are also producers, especially due to the agrarian reform which has greatly fragmented and split up the plots, making it hard to create the large ar-eas required for exports. The climate of insecurity has also contributed to discouraging investment.
There is also originality in the informality of the relationships between production and export: while most exporters have contractual commitments with importers/the supermar-ket sector (often for one-month periods), there is no formal
contractual commitment between the production and export links, in terms of either volumes or price. Most exporters purchase all the fruit at prices fluctuating on a daily basis (spot). Advance purchases of the harvest as a whole do happen, but they remain very much in the minority (5 %). The bulk of fruit is purchased from the orchards (fruit paid for on the tree regardless of quali-ty level or size), with picking at the exporter’s expense, and often carried out by contractors. Hence producers choose between exporters according to the purchase price offered, payment times, relationships and feed-back on quality of picking. Finally, purchases are either made directly between exporters and producers, or via intermediaries. This link, which covers between 10 and 20 % of the supply, has expanded particularly over the past four or five years, with very small producers enter-ing the US export programme. Hence intermediaries perform the function of aggregating production often located in remote zones, and representing very small volumes. However, their image is sometimes tarnished by tax evasion and producer intimidation scandals, with some locally dubbed “coyotes”.
This system, that creates high added-value, allows pro-ducers to make massive investments in promotion, re-search and information via APEAM, MHAIA (and since 2013 AFM). Between 2000 and 2018, more than 323 million USD have been invested – a unique amount in the world of fresh fruits and vegetables. This is one of the keys to both the success of the Mexican industry and the development of the US market, which has been profitable for all industry stakeholders.

12 World avocado production prospects – MEXICO
This recently developed production region has one of the world’s top three cultivation areas, thanks to its explosive growth dynamic in recent years. Pedoclimatic conditions are generally less favourable than in Michoacán, and it still has no access to the US market. However, the production system is higher-tech, and the early clone Mendez is an asset in terms of competitiveness. Just like in Michoacán, development should slow down because of saturation of the best production zones.
Jalisco
Commercial scale cultivation of Hass in Jalisco is a recent phenomenon, dating from the early 2000s, when land originally dedicated to livestock farm-ing, the staple crops (maize, sugar cane, etc.) or for-ests (pine) were converted to higher added-value production such as the avocado, or more recently berries. The avocado zone is packed into the south-east of the State, within a radius of approximately 30 km around the city of Ciudad Guzmán. Its ex-tension was evaluated at 26 500 ha in mid-2019,
L. de Chapala
Tepalcatepec
Armerí
a
Ameca
Sierra de Tapalpa
Nevado del Colima
Sierra del Tigre
Ciudad Guzmán
Sayula
Tuxpan
Manzanillo
Guadalajara
Colima
Gómez FaríasTamazula
Zapotiltic
San Gabriel
Tapalpa
Concepción de Buenos Aires
Production zones
The avocado in JaliscoPlanted area of 26 500 ha in 2019
0 km 60 km 120 km
Paci�cOcean
Michoacán
Colima
Jalisco
10.9 11.013.5
15.017.0 17.2
19.5
23.726.5
2011 2012 2013 2014 2015 2016 2017 2018 2019
Hass avocado - Jalisco - Planted area(in 000 ha | sources: SAGARPA, APEAJAL)
Pedoclimatic characteristics

13World avocado production prospects – MEXICO
Strengths:
• Decent pedoclimatic conditions in most zones.
• Early and attractive production calendar.
• Flatter topography, enabling economies of scale.
• Good technical and certification level.
Challenges:
• Water and land resources now limited.
• Security context.
• More competitive and distant outlets, due to lack of access to US market.
comprising approximately 18 500 ha of productive orchards and nearly 8 000 ha of young plantations not yet officially registered. The two main produc-tion centres are Sierra del Tigre to the north-east of Ciudad Guzmán (orchards of the municipali-ties of Gómez Farías, Concepción de Buenos Aires, Zapotiltic and north-eastern Ciudad Guzmán/Zapotlán) and the Nevado de Colima mountain range to the west of Ciudad Guzmán (orchards of the municipalities of Tuxpan, San Gabriel and south-ern Ciudad Guzmán/Zapotlán). The rest of the cul-tivation area lies mainly in Sierra de Tapalpa to the north-west of Ciudad Guzmán (Tapalpa), and near the Sayula Lagoon. The pedoclimatic conditions vary with altitude, though the constraints are tighter than in Michoacán. The climate is temperate to semi-tropi-cal, sub-humid, with rainy summers. The minimum average temperatures fluctuate between 8 and 16°C, and the maxi-mum average temperatures between 25 and 32°C. The av-erage rainfall is between 650 and 1 000 mm, and very much concentrated between June and October. The soils are high-ly variable in type and quality. There are rich, deep and well-drained volcanic soils in the high-altitude zones (andosol type, locally known as topuré), and poorly developed, sandy or sandy-clayey soils of variable depth in the plains zones (regosol, cambisol). Plantations were originally set up in the high-altitude parts (1 700 to 2 300 m), where pedoclimat-ic conditions are most favourable, and later lower-altitude zones were developed (up to 1 100-1 300 m).

14 World avocado production prospects – MEXICO
Production structureThe State had 1 400 producers in 2016. The production structure is highly diversified. According to a very rough estimate, large plantations covering several hundred hec-tares represent approximately one quarter to one third of total surface areas. These large facilities coexist with small-holdings. Approximately 60 to 70 % of land is rented, with long-term leases.
Technical processesThe production system is higher-tech than in Michoacán, in particular because of distinctly tighter pedoclimatic and commercial constraints. The plant stock is younger (eight years on average for Mendez) and use of certified plants is commonplace. The Mexican race local rootstock remains omnipresent. The planting density is considerably high-er, reaching on average 300 to 400 trees/ha (arranged in a square pattern known as ”marco real”). In some very high-tech plantations it can be as much as 550-600 trees. More than 90 % of orchards are irrigated, with fertirriga-tion also commonly employed. Water requirements are around 2 000 to 3 000 m3/ha. The water supply, increas-ingly tight, is based primarily on deep wells (80 to 600 m),
with the quality remaining good except in zones close to the Sayula Lagoon. Water catchment systems are also fre-quent (“ollas”). The most common irrigation technique is micro-spraying. The most commonly encountered sanitary problems are, for diseases, anthracnose, scab and stem-end rot, while the pests present are the same as in Michoacán. The main production centres have been certified as quar-antine pest-free by SENASICA, the sanitary branch of the Mexican Ministry of Agriculture, but not by any US agen-cy yet. Integrated pest management techniques are used on certain holdings. The plantations enjoy a high certifi-cation level (numerous international certifications such as Globalgap, etc.). Average yields are around 15 t/ha.
Production costThe average production cost in Jalisco is higher than in Michoacán, since irrigation is essential in most zones. Nonetheless, it remains competitive, at somewhere be-tween 5 000 and 6 500 USD per hectare excl. harvest. The width of the cost range is due to the differences in technical level of the production systems, and to the land situation (owned or rented).

15World avocado production prospects – MEXICO
Calendar and varietiesThe varietal range is the same as in Michoacán (Hass and Mendez clone), though in very different proportions. Mendez represents approximately 50 % of planted sur-face areas. This variety has a major asset under Jalisco’s cultivation conditions. The produce from its first flowering, which represents 90 % of the total harvest, matures very early, in May (the exact date depends on the altitude and rainfall level, which may reduce the dry matter and defer the harvest date). The season then extends until August-September. This variety also bears a second harvest at the beginning of the year (January-February), which is small-er in volume. Hass, Jalisco’s other big variety, has a differ-ent production calendar from Michoacán. It flowers only twice, with the production periods running from August-September at the beginning of the year for the main har-vest, and from May to June for the secondary harvest lim-ited in volume.
Upstream/downstream relations Unlike in Michoacán, a large proportion of exporters own their production, thanks to higher availability of surface areas for purchase or rental (land generally belonging to owners from Ciudad Guzmán, and rented out). Thanks to this, exporters can ride out periods of tension. However, the bulk of the supply consists of volumes from a host of independent producers, which just like in Michoacán, are not bound to exporters via formal contracts. Similarly, ex-porters purchase all of the fruit from the orchards (paid for on the tree regardless of quality level or size), at prices fluc-tuating on a daily basis (spot). Picking is at the exporter’s expense, and often carried out by contractors. Conversely, the intermediaries link (the coyotes) is much less devel-oped (or even non-existent) in Jalisco.
Avocado – Jalisco – Production calendar
Variety Harvest J A S O N D J F M A M J Harvest share
HASS MENDEZ Principal 90 %
Loca tardía 10 %
HASS Principal 90 %
Loca 10 %

16 World avocado production prospects – MEXICO
The Mexican avocado industry changed tack in the early 2000s. Initially, production was aimed at the local market, where the avoca-do is a staple often consumed on a daily basis in various forms (includ-ing the iconic guacamole). The industry then switched to the export sector, contributing to building demand in the USA. The export sec-tor, which is now the main outlet, has accounted for between 55 and 60 % of production in recent seasons. The local market nonetheless remains a major outlet. Despite steeply increasing prices, it remains less lucrative than the export sector, and its supply levels fluctuate greatly, apparently in long-term decline because of trade policies fa-vouring the export sector. It has been estimated at between 650 000 and 750 000 t in recent years (corresponding to a consumption of 5 to 6 kg/capita/year). The proportion of production dedicated to indus-try is limited (less than 5 %), yet volumes are substantial given the magnitude of the country’s harvest. Several large guacamole and fro-zen fruit piece production units are in operation, some of which own cutting-edge high-pressure pasteurisation equipment. There are also several oil extraction plants, including an ultra-modern one capable of producing extra-virgin oil.
The export sector remains concentrated despite the presence of numerous players. Although there are 58 packing stations operating on the export market, the top five groups control 50 to 60 % of volumes. These are mostly US companies or mixed-ownership groups.
The stations have a wide range of certifications, and are enjoying a boom phase with their facilities ex-panding and modernising; in contrast with the highly traditional nature of some of the production.
Outlets
Players
Local35%
Export60%
Industry5%
Mexican avocado - Outlets(various sources)

17World avocado production prospects – MEXICO
Exports are mainly by road-freight (to the USA and Canada): it takes just 18 hours by truck container between Uruapan and the Texan border (McAllen, Pharr and Laredo), which are redistribution hubs for the rest of the USA and Canada. It takes in total three or four days by road between Michoacán and the East Coast of the USA or Canada. The road-freight cost is low, at around 2 000 to 2 500 USD per trip for double-trail-er containers. At peak periods, such as the Superbowl, nearly 1 300 containers per week travel between the USA and Mexico, equivalent to one every six minutes. Despite the short distance, ripening is carried out at the consumption centres rather than at the point of shipment.
The US-bound fruit is packed in 11.3-kg lugs (25 pound double layer lugs), under a specific sizing system, different from the EU one. Plastic crates (folding and reusa-ble or single-use) are increasingly used. Segmentation is developing, in particular with net bags containing small and very small-sized (mini) fruit. In Europe, the pre-dominant packing system remains the 4-kg box.
Although at certain peak consumption periods, some batches can sometimes be transported by air-freight, the bulk of trade to the most distant destinations is by sea-freight. Fruit bound for the Japanese mar-ket travels by road-freight to the port of Manzanillo (Colima), situated less than 200 km away on the Pacific Coast (2-hour trip), or Lázaro Cárdenas in Michoacán. The total sea-freight transport time to Japan is 21 days, for an average transit time of 17 days, with a 4-day layover at the arrival port for additional sanitary inspections (de-manding destination, with specific MRLs). Europe is served from the Gulf of Mexico via the port of Altamira, approximately 900 km away (approximately 11-hour trip), with the crossing taking generally 20 days, although it can be as much as 25 days in case of poor sailing weather, especially during the peak production period (October/November). The sea-freight cost for these two desti-nations is around 5 500 USD/container. Transport to China takes 25 to 26 days, though it may be as many as 30 days, de-pending on the layovers. The import spec-ifications are similar to the USA, but more demanding in cosmetic terms.
Logistics
Avocado – Mexico – Sea-freight logistics
Port of departure
Port of arrivalAltamira
(Gulf of Mexico)Manzanillo
(Colima)Lazaro Cardenas
(Michoacán)EU Antwerp 19-22 days 24-25 days 22-24 days
Rotterdam 21-24 daysAlgeciras 21-25 days
Japan Yokohama 16-18 days 18 daysChina Shanghai 20-28 days 24-32 days

18 World avocado production prospects – MEXICO
With more than 1.1 million tonnes of exports in 2017-2018, Mexico, the world number one avocado exporter, accounts for nearly 60 % of world trade (1.9 million tonnes in 2018). While certain pioneering players attempted to venture into exports in the 1980s, things really got go-ing in the 1990s to accompany the growth of the young European market and the Japanese market. However, this development really exploded thanks to the opening up of the US market in 1997. The gradual lifting of the sani-tary protection measures restricting access to this market has enabled exporters from Michoacán, the only author-ised production region to date, to trade in an increasing number of States (19 States authorised in 1997, up to com-pletely open access since 2007, under the NAFTA agree-ments). Hence Mexico, which shipped less than 25 % of its supply to the USA in the early 2000s, now exports 75 % (i.e. from less than 50 000 t to 938 900 tonnes in 2018-2019). Conversely, three avocados out of every four consumed in the USA come from Mexico, and exclusively from the State of Michoacán.
On the one hand, the vitality of US demand, stimulated by the various promotions conducted under the auspices of the HAB, has driven by this success. Created in 2013, the Avocados from Mexico (AFM) association is the marketing branch derived from the two organisations representing Mexico in the USA, the Mexican Hass Avocado Importers Association (MHAIA) and the Association of Mexican av-ocado producers & packers (APEAM). AFM works to pro-mote the origin on the US market, with a very substan-tial marketing budget of around 60 million USD in 2018 funded at 67 % by MHAIA and at 33 % by a voluntary in-vestment of APEAM. On the other hand, the proximity be-
Exports
tween the production zones of Michoacán and consump-tion market gives the origin advantages on this market in terms of freshness, maturity, competitiveness (inexpensive road-freight logistics in less than 24 hours), and affords producers and exporters an opportunity for an excellent economic return. Finally, there is a high degree of vertical integration between packing and export. This sector was mainly developed by historic US market operators setting up in Mexico in order to top up the Californian supply, and develop a year-round avocado presence on the market. The Mexican supply is mainly focused on the central USA and the West Coast.
Of the other export markets, Canada, the number two destination for Mexican avocados, imports more than 80 000 t, and has made big progress in recent years. The European Union and Japan import equivalent volumes, of around 60 000 t. While Japan is very demanding in terms of phytosanitary regulations and volumes are stagnating, Mexico has tended to make a comeback in Europe in recent years. Finally, exports to China and neighbouring Central American countries are making strong progress (excepted Costa Rica because of a trade dispute). The most distant markets are supplied by a mixed supply from Michoacán and Jalisco. However, Michoacán tends to focus on the US market. The expectations of this market, less competitive and closer, are in line with the more limited international certification level and with fruits less well-suited in physi-ological terms to long-haul transport. Conversely, Jalisco, whose production is making big progress and which does not have access to the US market, is consolidating its pres-ence on these distant destinations, offering more flexible trading conditions and a high certification level.
364 463
657 633
847
1 081 966
1 134 1 134
2010
/11
2011/
12
2012
/13
2013
/14
2014
/15
2015
/16
2016
/17
2017/
18
2018
/19
Mexican avocado - Evolution of exports(in 000 t | source: Mexican Customs)

19World avocado production prospects – MEXICO
Avocado – Mexico – Exportsin tonnes 2010-11 2011-12 2012-13 2013-14 2014-15 2015-16 2016-17 2017-18 2018-19
United States 283 814 359 262 522 488 516 085 693 344 862 457 759 318 861 393 938 953
Japan 35 159 42 354 55 883 51 626 53 175 64 864 62 459 60 455 69 960
Canada 22 687 27 431 35 044 33 632 44 958 62 148 71 607 83 346 88 854
European Union 3 155 4 153 9 137 5 690 12 996 47 689 38 768 62 146 48 348
Others 19 642 29 537 34 893 26 386 42 597 44 092 33 820 66 306 51 465
Total 364 457 462 737 657 445 633 418 847 070 1 081 251 965 972 1 133 646 1 197 580 Source: Mexican Customs
0
100
200
300
400
500
600
700
800
900
1000
2010
/11
2011/
12
2012
/13
2013
/14
2014
/15
2015
/16
2016
/17
2017/
18
2018
/19
USA
Others
Mexican avocado - Exports by destination(in 000 t | source: Mexican Customs)
0102030405060708090
100
2010
/11
2011/
12
2012
/13
2013
/14
2014
/15
2015
/16
2016
/17
2017/
18
2018
/19
CanadaJapanOthersEU
Mexican avocado - ExportsBreakdown of other destinations
(in 000 t | source: Mexican Customs)
Avocado – Mexico – Production global calendar
Zone J A S O N D J F M A M J
Jalisco
Michoacán

20 World avocado production prospects – MEXICO
Our projection for Michoacán and Jalisco was put togeth-er in two steps: estimating the production from surface areas planted in late 2018, and estimating the prime pro-duction of future orchards to be planted between 2019 and 2023. A summary projection of the production of the other States is included in a third step.
We factored in structural data relating to cultivation area (surveying the surface areas of the various States), agro-nomic data (current and future productivity) and avail-ability of certain production factors. We mainly used information gathered from interviews with sector profes-sionals, and from official data banks (SAGARPA, JLSV, etc.) or professional data banks (APEAM, APEAJAL, etc.).
Certain external and contextual factors potentially play-ing a role by 2023 could not be incorporated. These were:
• Climate change. Change to rainfall patterns, in par-ticular resulting in a deferred rainy season, more in-tense spells of rain and more frequently occurring ex-treme climate phenomena (hail, violent winds, intense storms), already seems to be a reality. This dimension may occasionally adversely affect production.
Prospects
• Poor industry cohesion. The producer's great power of negotiation has very positive externalities (see page 11). However despite the work of APEAM, production is still very much disconnected from the export sector (practically no vertical integration, no contractualis-ation, prices negotiated daily). This lack of cohesion is a challenge for some stakeholders, while issues common to the industry as a whole (sanitary, trading, etc.) may emerge on an increasingly competitive world market.
• Competing origins coming to the fore, with aggres-sive trading practices (working on commission, very low production cost, etc.), highly homogeneous quality and a high level of both sanitary and trade certification. They could compete with Mexico’s positions on certain markets, especially the distant ones, especially since the origin’s reliability has been dented over the past two years by several episodes of social disruption led by a minority of producers, causing occasional but sub-stantial, supply problems, which the downstream seg-ment took a very dim view of. This aspect could have an impact on Mexico's market shares.

21World avocado production prospects – MEXICO
Step 1: Estimating the production of currently planted orchardsWe considered three different production systems, each with particular potential. For Jalisco, we applied a single high-tech sys-tem. For Michoacán, we used a traditional system, representing 60 % of planted surface areas, and a distinct high-tech system, including in particular irrigation. We assumed that the productivity of the traditional system would increase very gradually. Although the crop has an excellent profitability, structural investments in the orchards remain limited, providing no grounds to expect any very marked rise in yields, despite their rela-tively low level for the zone’s potentialities. This is borne out by analysis of their long-term evolution, with a gain of approximately 500 kg/ha between 2009 and 2018 ac-cording to SAGARPA data. Conversely, we adopted a hy-pothesis of still moderate yet more marked expansion (1 t/ha over 10 years), thanks in particular to a genera-tional change in farming. Young growers, better trained in production techniques and the rationale for invest-ment, are gradually taking over from retiring growers.
Avocado – Mexico – Yield hypotheses for mature orchardsZone Proportion of surface areas Yield (t/ha)
Michoacán Traditional system 60 % 9.25*
High-tech system 40 % 16.0Average yield 100 % 12.0
Jalisco 100 % 15.0* up from 9.0 to 9.5 t/ha between 2018 and 2023
Average plantation yield by age:
We assumed that trees started to bear significant production from 5 years in Michoacán, and from 4 years in Jalisco, with full production potential reached at 8 years and 7 years respectively. The prime production was defined by experts, and confirmed by the literature.
Avocado – Mexico – Prime production hypothesisCultivation area age 4 years 5 years 6 years 7 years 8 years
Michoacán - average yield (t/ha) (0.3) 1.3 4.2 8.4 12.0Jalisco - average yield (t/ha) 1.6 5.3 10.5 15.0 15.0
Cultivated surface areas and projected production of established orchards:
The official survey is not conducted when the trees are planted, but rather when the orchards are registered in the export pro-grammes with the local phytosanitary authorities (Junta Local de Sanidad Vegetal), generally when production is becoming significant (i.e. 5 years for Michoacán and 4 years for Jalisco). The surface areas issued every year by the Ministry of Agriculture is therefore a rough figure, as the extension of the young orchards is imprecise.
Avocado – Michoacán – Survey of cultivation area in 2018, and projected production of planted surface areasPlanted area Age, end of 2018 Age, end of 2023 Surface areas (ha) Yield in 2023 (t/ha) Production in 2023 (t)
recorded before 2015 >= 5 years >= 10 years 131 400 12.0 1 576 800 in 2015 4 years 9 years 13 500 12.0 162 000 in 2016 3 years 8 years 10 400 12.0 124 800 in 2017 2 years 7 years 7 800 8.4 65 520 in 2018 1 year 6 years 8 400 4.2 35 280
Total 171 500 1 964 400
Avocado – Jalisco – Survey of cultivation area in 2018, and projected production of planted surface areasPlanted area Age, end of 2018 Age, end of 2023 Surface areas (ha) Yield in 2023 (t/ha) Production in 2023 (t)
recorded in or before 2016 >= 4 years 9 years 23 700 15.0 355 500 in 2016 3 years 8 years 2 344 15.0 35 160 in 2017 2 years 7 years 4 163 15.0 62 445 in 2018 1 year 6 years 3 133 10.5 32 897
Total 33 340 486 002

22 World avocado production prospects – MEXICO
Step 2: Estimating the prime production of the new plantationsFor Michoacán, we selected a hypothesis based on a slowdown in the planting rate, in accordance with the trend registered in recent years in the survey data (going from approximately 10 000-13 000 ha in 2015 and 2016 to 7 500-8 500 ha in 2017 and 2018). The crop’s profitability remains excellent. However, good-quality land reserves in the “natural zone” are increasingly limited, especially since regulations for conversion of primary forests into zones for agricultural use are now better respected (stricter application of the law, even leading to some symbolic uprooting of illegal plantations). Planting is now taking place in more marginal zones for the crop, with a less fa-vourable or even borderline climate, less well of in terms of soil quality and water availability. We opted for two hy-potheses: expansion slowing down slightly to 7 000 ha/year, and a more pronounced slowdown to 5 000 ha/year.
For Jalisco, the surface areas projection is more complex. As regards production factors, the situation also points to a slowdown in the planting dynamic. Water availability is more limited, while irrigation is a must. Operating permits for new wells are no longer being granted, though rights can be purchased. Secondly, as in Michoacán, good-quality land is increasingly rare and expensive. The land still available is in more borderline zones for the crop. From the economic standpoint, the balance is positive overall, though profitability is generally not as excel-lent as in Michoacán. Production costs are higher, while due to lack of access to the USA, the harvest has to be sold on a more competitive international market. So we opted to issue two hypotheses: a short-term drop in the planting rate, followed, or not, by an upturn in expansion in surface areas at a slightly higher tempo in the medium term, with the potential opening up of the US market. Jalisco has a major asset with its early production (Mendez), highly complementary with the Michoacán harvest, and marketable in a period when this market is highly open. Some of the State’s 20 000 ha of sugar cane, situated in zones with avocado potentialities, could be converted.
In every scenario, production of the surface areas planted from 2019 has little impact on the 5-year production projection, with the trees only reaching their full potential from 7 or 8 years, according to the regions (i.e. from 2026-2027). The first significant production from these young orchards will be harvested in 2022 for Jalisco, and in 2023 for Michoacán.
Avocado – Mexico – Estimated additional production in 2023 according to two surface area expansion hypotheses in Michoacán and Jalisco
Surface area expansionAnnual expansion (ha) Additional production
in 2023 (t) Comment2019-2021 2021-2023
Hypothesis 1 Michoacán 5 000 5 000 6 500 5 000 ha 5 years oldJalisco 3 000 3 000 20 475 3 000 ha 4 years old, and 3 000 ha 5 years old
Hypothesis 2 Michoacán 7 000 7 000 9 100 7 000 ha 5 years oldJalisco 3 000 4 250 27 038 4 250 ha 4 years old, and 3 000 ha 5 years old

23World avocado production prospects – MEXICO
Step 3: Production of other StatesMexico’s other producer States represented approximately 30 000 ha in 2018. They were not subjected to precise analysis in this study. We opted to assume continuing expansion in the States of Mexico and Nayarit, at a simi-lar rate to recent years (extending the surface area curves, with a similar average yield to Michoacán due to the apparent similarities in the production systems). We assumed that the increase in surface areas would remain limited in other States such as Chiapas, Morelos, Guerrero or Sinaloa (pedoclimatic constraints, security problems detrimental to investment, etc.).
Avocado – Mexico – Estimated growth in surface areasand additional production in 2023 for the other producer States
States Surface areas in 2018 (ha)
2015-2018 expansion rate (ha/year)
Surface areas in 2023 (ha)
Production in 2023 (t)
Mexico 10 500 760 14 298 170 855 Nayarit 7 100 433 9 266 110 732 Others 4 330 0 4 330 51 744
Total 21 930 1193 27 894 333 330
SynthesisRegardless of the scenario, production should be around 2.8 million tonnes in 2023 according to our hypotheses, i.e. a rise of approximately 800 000 t since 2019. The differences between scenarios will start to significantly affect the production potential after 2023.
Avocado – Mexico – Synthesis of projected production in 2023
in tonnesHypothesis 1 Hypothesis 2
Michoacán Jalisco Michoacán Jalisco
Production of planted areas prior to 2018 1 964 400 486 002 1 964 400 486 002 Production of plantations established from 2019 6 500 20 475 9 100 27 038
Total 1 970 900 506 477 1 973 500 513 039
Total, Michoacán + Jalisco 2 477 377 2 486 539
Other States 333 330 333 330
Total, Mexico 2 810 707 2 819 869
1.3 1.31.5 1.5 1.6
1.5
2.0 1.9
2.8
2011/
12
2012
/13
2013
/14
2014
/15
2015
/16
2016
/17
2017/
18
2018
/19
2023
/24
Mexican avocado - Production projection(in million tonnes | source: CIRAD)
